
Summary · Web viewQ ip = Volumetric flow rate of species i in the permeate in m3/minρ =Density of...
38
Air Membrane Separation University of Illinois Membrane Air Separation In this lab two membranes are used to separate oxygen from nitrogen in air. The two separators are used in series and in parallel to see which set-up will result in the best separation. 1 Unit Operations ChE 382 Group 5 Spring 2011 3/5/2022 Damo, Duffy, Guerrero, Hsu, Kosak, Qamar, Tyska
Transcript of Summary · Web viewQ ip = Volumetric flow rate of species i in the permeate in m3/minρ =Density of...

Air Membrane Separation University of Illinois
Membrane Air Separation
In this lab two membranes are used to separate oxygen from nitrogen in air. The two separators are used in series and in parallel to see which set-up will
result in the best separation.
1Unit Operations ChE 382 Group 5 Spring 2011 5/7/2023Damo, Duffy, Guerrero, Hsu, Kosak, Qamar, Tyska

Air Membrane Separation University of Illinois
Final Lab Report
Unit Operations II Lab 6
May 7, 2023
Group 5
Andrew Duffy
Daniyal Qamar
Jeff Tyska
Bernard Hsu
Ryan Kosak
Tomi Damo
Alex Guerrero
2Unit Operations ChE 382 Group 5 Spring 2011 5/7/2023Damo, Duffy, Guerrero, Hsu, Kosak, Qamar, Tyska

Air Membrane Separation University of Illinois
Contents1. Summary.............................................................................................................................................4
2. Results.................................................................................................................................................5
3. Discussion..........................................................................................................................................11
4. Conclusion.........................................................................................................................................14
5. References.........................................................................................................................................14
6. Appendix I: Data Tabulation/Graphs.................................................................................................15
7. Appendix II: Error Analysis.................................................................................................................21
8. Appendix III: Sample Calculations......................................................................................................24
9. Appendix IV: Individual Team Contributions.....................................................................................27
3Unit Operations ChE 382 Group 5 Spring 2011 5/7/2023Damo, Duffy, Guerrero, Hsu, Kosak, Qamar, Tyska

Air Membrane Separation University of Illinois
1. Summary
In this lab the goal was to find the effect of pressure and different configurations of membranes on
the separation of air into its constituent components. For the configurations, two membranes were set
up in parallel and in series. The air was approximated as a mixture of only nitrogen and oxygen. From
the data in this lab, it can be concluded that increasing the pressure increases the amount of separation
in the cylinders, and that a series configuration works better than a parallel one.
For both the parallel and series trials, the concentration of oxygen in the air through the membrane
increased in each trial (as can be seen in table 1). This makes sense since there shouldn’t be a high
enough of an oxygen concentration to create a boundary layer on the membrane. Since there is no
boundary layer, the diffusion of oxygen through the layer increases when pressure is increases. This
trend occurs in both configurations because the exact configuration of the membrane does not matter;
only the concentration of oxygen at the surface does (concentration at the boundary layer).
The series configuration was found to separate the oxygen from the nitrogen better than the parallel
configuration, which also makes sense. In the parallel configuration, all of the air only sees one
membrane, and thus is only separated once. With the series configuration, the air is separated twice,
and thus there is a better separation. This can be seen in table 1, where the concentration of oxygen in
the concentrated stream is, on average 0.5% higher. Similarly, the concentration of oxygen in the
retentate stream is about 1.4% higher (on average) in the parallel configuration.
These conclusions are also backed by our other data and calculated values. The density of oxygen
and nitrogen different (oxygen is heavier), and the trends in concentration with configuration and
pressure can also be seen in the pressure data. Similarly, the flow rates of oxygen in the permeate were
4Unit Operations ChE 382 Group 5 Spring 2011 5/7/2023Damo, Duffy, Guerrero, Hsu, Kosak, Qamar, Tyska

Air Membrane Separation University of Illinois
also calculated. As expected, the flow rates of oxygen in the permeate increased when pressure was
increased, and they were higher in the series configuration than the parallel configuration.
Overall this lab went very well, and the data consistently supported the conclusion that the series
configuration separated the oxygen from the nitrogen better than the parallel configuration, and the
higher pressures resulted in higher oxygen concentrations in the permeate.
2. Results
The solubility of the particular gas being separated from air depends on its solubility in the
separating membrane. Calculations were made to determine the flux of the air through the membranes,
the diffusivity of Oxygen through the membrane, the solubility of Oxygen in the membrane, the
permeability of the membrane, the separation factors, the recoveries, and the stage cuts.
Most of these properties increase as the pressure of the incoming air increases. An increase in
pressure also dictates to an increase in the amount of oxygen and nitrogen coming through the
membranes. As pressure increases, the flux, diffusivity, permeability, and separation factors all increase
as well. The following graphs and data help visualize these properties better:
5Unit Operations ChE 382 Group 5 Spring 2011 5/7/2023Damo, Duffy, Guerrero, Hsu, Kosak, Qamar, Tyska

Air Membrane Separation University of Illinois
Flux vs Pressure
0.600
0.650
0.700
0.750
0.800
0.850
0.900
0.950
1.000
90 95 100 105 110 115 120 125
Pressure (psi)
Flux
(g/m
2-m
in)
Parallel
Series
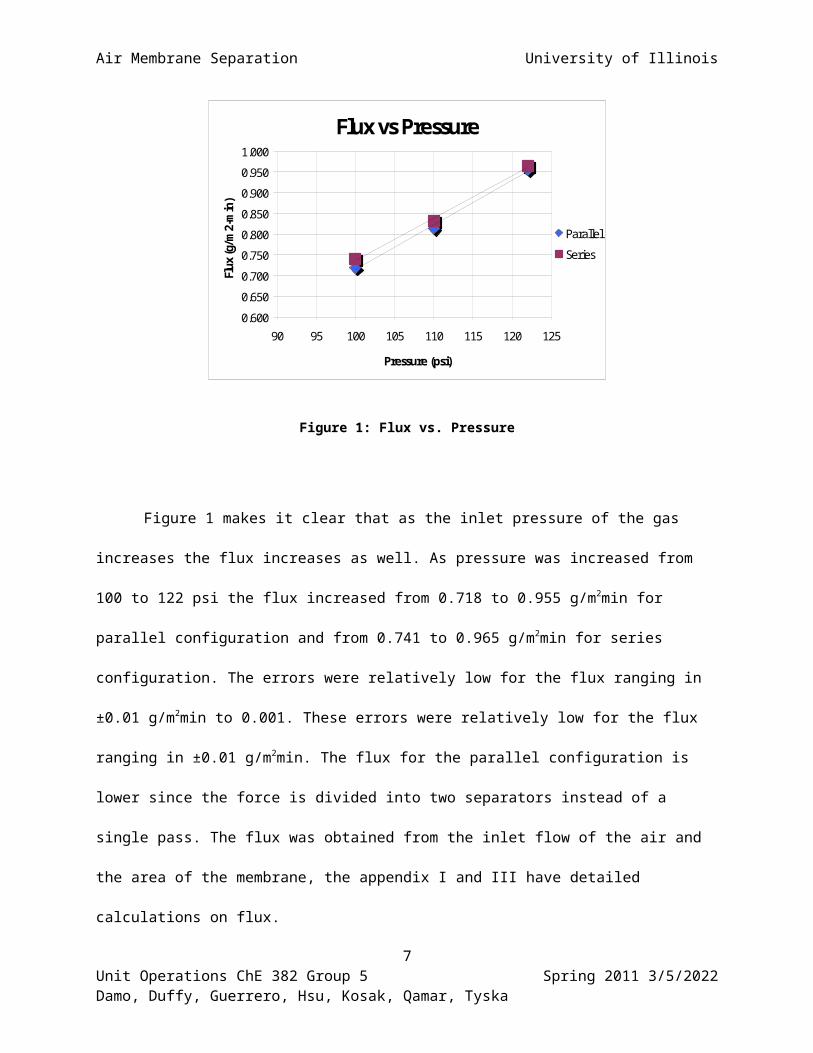
Figure 1: Flux vs. Pressure
Figure 1 makes it clear that as the inlet pressure of the gas increases the flux increases as well.
As pressure was increased from 100 to 122 psi the flux increased from 0.718 to 0.955 g/m2min for
parallel configuration and from 0.741 to 0.965 g/m2min for series configuration. The errors were
relatively low for the flux ranging in ±0.01 g/m2min to 0.001. These errors were relatively low for the flux
ranging in ±0.01 g/m2min. The flux for the parallel configuration is lower since the force is divided into
two separators instead of a single pass. The flux was obtained from the inlet flow of the air and the area
of the membrane, the appendix I and III have detailed calculations on flux.
6Unit Operations ChE 382 Group 5 Spring 2011 5/7/2023Damo, Duffy, Guerrero, Hsu, Kosak, Qamar, Tyska
Air Membrane Separation University of Illinois
Diffusivity vs Pressure
0.00150
0.00170
0.00190
0.00210
0.00230
0.00250
0.00270
0.00290
90 100 110 120 130
Pressure (psi)
Diffu
sivity
(m2/
min
)
Parallel
Series
Figure 2: Diffusivity vs. pressure
Diffusivity is the area per time the component (oxygen in this case) covers, as pressure increases
there is a bigger driving force and more area is covered in less time. Figure 2 shows the graph of
diffusivity of oxygen vs pressure. As the pressure increases the driving force of oxygen through the
membrane also increases and thus there is a higher diffusivity. Since the concentration of oxygen is
lower in the series configuration (more membrane area to go through) the diffusivity in the series
configuration is lower. The error was in the ±10-4 m2/min range which is low for the given diffusivities.
The diffusivity was obtained from the oxygen flux and concentrations from the inlet and outlet flows.
7Unit Operations ChE 382 Group 5 Spring 2011 5/7/2023Damo, Duffy, Guerrero, Hsu, Kosak, Qamar, Tyska

Air Membrane Separation University of Illinois
Solubility Constant vs Pressure
4.00E-05
4.20E-05
4.40E-05
4.60E-05
4.80E-05
5.00E-05
5.20E-05
5.40E-05
70 80 90 100 110 120 130
Pressure (psi)
Solu
bilit
y (m
ol/P
a-m
3)
Parallel
Series
Figure 3: Solubility vs. Pressure
At first glance figure 3 seems unusual since solubility of gasses increase as pressure increases
according to Henry’s law. But if the units are looked at more closely the solubility is expressed in
mol/m3Pa. As the pressure increases it has a decreasing affect on the solubility. If the same data is
expressed in mol/m3 units, then solubility decreases as the pressure increases. The parallel and series
configuration have the similar solubilities of oxygen since pressure and concentration have very little
affect on solubility. The material has a certain affinity towards oxygen and that stays constant for each
configuration. The errors were in the ranges of ±10-6 mol/Pa m3, this number seems pretty high but it is
acceptable.
8Unit Operations ChE 382 Group 5 Spring 2011 5/7/2023Damo, Duffy, Guerrero, Hsu, Kosak, Qamar, Tyska

Air Membrane Separation University of Illinois
Permeability per thickness vs Pressure
1.020E-07
1.040E-07
1.060E-07
1.080E-07
1.100E-07
1.120E-07
1.140E-07
1.160E-07
1.180E-07
95 100 105 110 115 120 125
Pressure (psi)
Perm
eabi
lity
(mol
/Pa-
min
-m4)
Parallel
Series
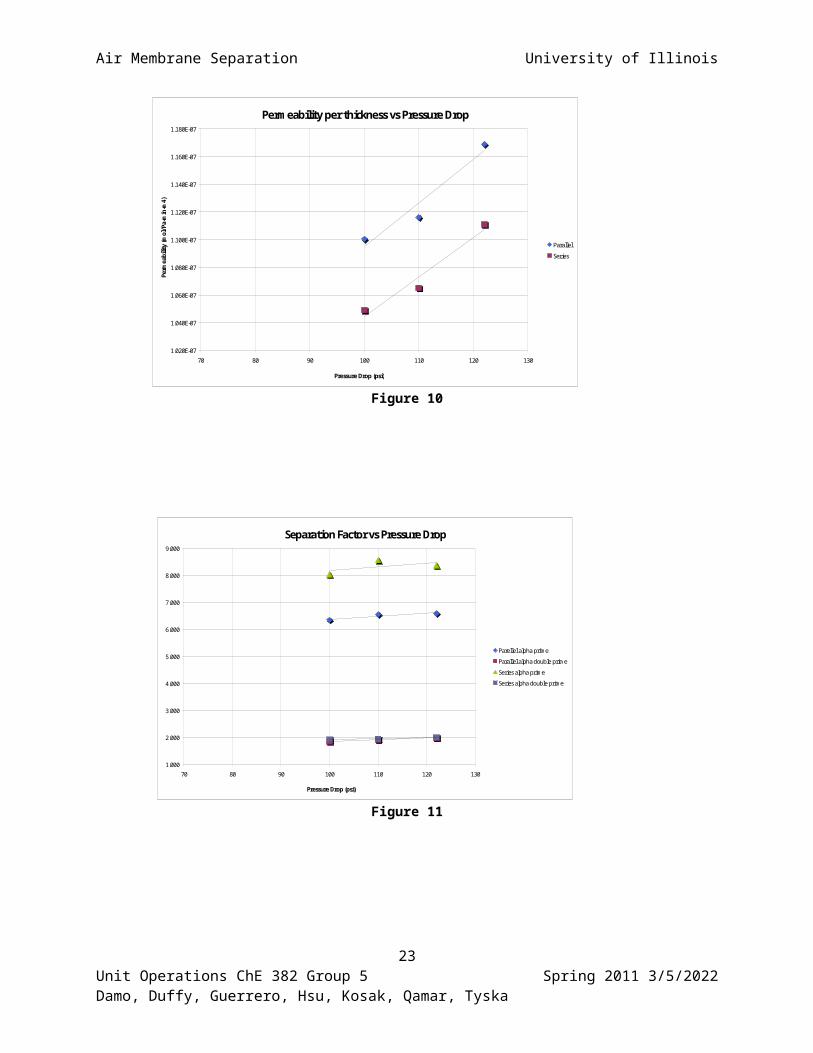
Figure 4: Permeability vs. Pressure
The permeability also increases with increasing pressure as figure 4 shows. Permeability is the
amount of gas that passes through the membrane. As the driving force (pressure) increases the
permeability increases as well since more oxygen goes through the membrane. Since Permeability =
Diffusivity X Solubility, and the solubility is inversely proportional with pressure. Since the pressure in
the parallel configuration is lower, a higher permeability is observed. The values increase from 1.101E-
07 to 1.169E-07 for the parallel configuration and from 1.049E-07 to 1.111E-07 for the series
configuration as the pressure is increased from 100 to 122 psi. The permeability was obtained from the
solubility and the diffusivity both of which were obtained using the concentrations and the flow rates of
oxygen and air. Appendices I and III provide details over these calculations
9Unit Operations ChE 382 Group 5 Spring 2011 5/7/2023Damo, Duffy, Guerrero, Hsu, Kosak, Qamar, Tyska

Air Membrane Separation University of Illinois
Separation Factor vs Pressure
1.000
2.000
3.000
4.000
5.000
6.000
7.000
8.000
9.000
95 100 105 110 115 120 125
Pressure (psi)
Parellel alpha prime
Parallel alpha double prime
Series alpha prime
Series alpha double prime
Figure 5: Separation Factors vs. Pressure
Figure 5 shows the separation factors vs. pressure, this is the ratio of the amounts of oxygen in
the permeate and the retentates. Since the final concentration of oxygen is lower in the series
configuration (double pass) the separation factors are higher (higher separations). The series prime data
is the ration of the oxygen concentrations in the permeate and feed streams. Most of the errors were in
the ±0.1 range for alpha prime and ±0.01 for alpha double prime.
10Unit Operations ChE 382 Group 5 Spring 2011 5/7/2023Damo, Duffy, Guerrero, Hsu, Kosak, Qamar, Tyska

Air Membrane Separation University of Illinois
Recovery and Stage Cut vs Pressure
0.400
0.500
0.600
0.700
0.800
0.900
1.000
70 80 90 100 110 120 130
Pressure (psi)
O2 Rec. Parallel
N2 Rec. Parallel
Stage Cut Parallel
O2 Rec. Series
N2 Rec. Series
Stage Cut Series
Figure 6: Recovery/Stage Cuts vs. Pressure
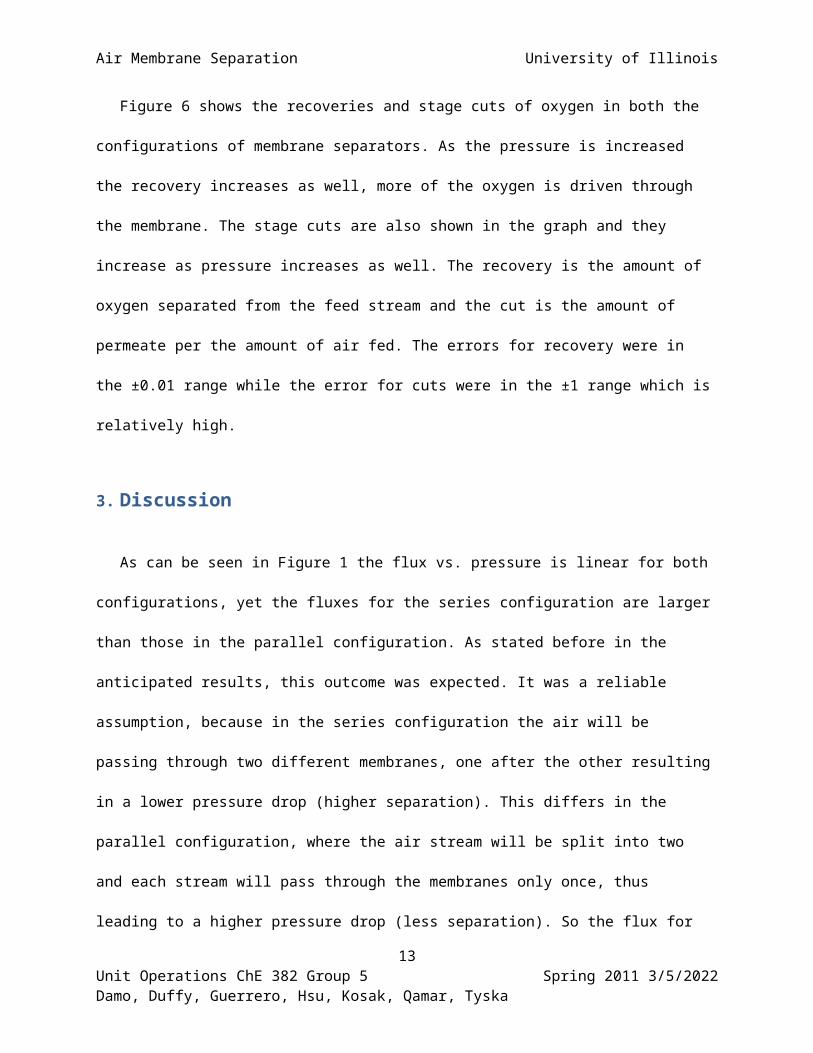
Figure 6 shows the recoveries and stage cuts of oxygen in both the configurations of membrane
separators. As the pressure is increased the recovery increases as well, more of the oxygen is driven
through the membrane. The stage cuts are also shown in the graph and they increase as pressure
increases as well. The recovery is the amount of oxygen separated from the feed stream and the cut is
the amount of permeate per the amount of air fed. The errors for recovery were in the ±0.01 range
while the error for cuts were in the ±1 range which is relatively high.
3. Discussion
As can be seen in Figure 1 the flux vs. pressure is linear for both configurations, yet the fluxes for the
series configuration are larger than those in the parallel configuration. As stated before in the
anticipated results, this outcome was expected. It was a reliable assumption, because in the series
configuration the air will be passing through two different membranes, one after the other resulting in a
lower pressure drop (higher separation). This differs in the parallel configuration, where the air stream
11Unit Operations ChE 382 Group 5 Spring 2011 5/7/2023Damo, Duffy, Guerrero, Hsu, Kosak, Qamar, Tyska

Air Membrane Separation University of Illinois
will be split into two and each stream will pass through the membranes only once, thus leading to a
higher pressure drop (less separation). So the flux for the parallel configuration is lower since the
pressure is divided into two separators instead of a single two pass.
The solubilities were also calculated for each component. With the units of solubility expressed
in mol/m3Pa it can be seen that as the pressure increases, there is a decreasing affect on the solubility.
Given the fact that the solubility constants are inversely related to the pressure drop, it was reasonably
assumed that the solubility constants for both components would be higher in the parallel configuration
compared to the series configuration. This is because as stated before, the pressure drop is higher for
the parallel configuration as opposed to the series. The parallel and series configuration have the similar
solubilities of oxygen since pressure and concentration have very little affect on solubility. *Note that
since the change in pressure was kept the same for both configurations in which Figure 3 depicts the
solubilities being the same for both configurations. Although, if the change in pressures were varied the
new figure would depict the solubility being lower for the parallel configuration than in series, for the
reasons stated above.
With this information it was reasonably assumed that the diffusivity for each component would
be higher in the parallel configuration as opposed to the series since it was confirmed the solubility is
lower for the parallel configuration. In addition, as the pressure increases the driving force of oxygen
through the membrane also increases and thus there is a higher diffusivity. Since the concentration of
oxygen is lower in the series configuration – due to more membrane area – the diffusivity in the series
configuration is lower. As can be seen in Figure 2 these reasonable assumptions were confirmed.
Lastly, the permeability of each component was calculated. Permeability is the product of
diffusivity and solubility, with the solubility being inversely proportional with pressure. As stated
previously, since the pressure in the parallel configuration is lower, a higher permeability was observed.
12Unit Operations ChE 382 Group 5 Spring 2011 5/7/2023Damo, Duffy, Guerrero, Hsu, Kosak, Qamar, Tyska
Air Membrane Separation University of Illinois
The compiled results show that permeability also increases with increasing pressure as seen in Figure 4.
Since permeability is a measurement of the amount of gas that is passed through the membrane it was a
reasonable assumption that as the pressure (driving force) increases, the permeability will increase as
well since more oxygen will permeate through the membrane.
Given the fact that the measuring devices in this lab were extremely accurate the errors in the
measured values were very minimal. The most probable source of experimental error involved the
oxygen analyzers. After calibrating the two sensors, they still differed by around 0.3 from each other
despite them measuring the same air. With this error propagating throughout the rest of the lab there
were a few areas where this experimental error affected the ability to draw conclusions. This was
notable with the solubility constant for oxygen, which had a big error (57.5%) associated with it. This can
be attributed to the fact that the solubility constant for oxygen is directly proportional to the
concentration of oxygen inside the membrane wall, which was measured with the oxygen analyzers that
were not reading the same values. Due to the differing oxygen readings, the pressure of oxygen per
thickness, α'O2, N2, and α''O2, N2 yielded high average errors. This is again because these values were
defined in terms of mole fractions – which were calculated from the oxygen analyzers that measured
concentrations in mole percent. These errors would have significantly been reduced if both oxygen
analyzers were calibrated to both read the same exact volume percent of oxygen and not starting the
lab until this occurred. This way the values measured with the oxygen analyzers would have fewer
experimental error associated it.
Definitive conclusions that could be made are that the values for flux, diffusivity, and
permeability will increase as pressure increases, and solubility constants will decrease as pressure
increases. For all these values the permeability and diffusivity for the parallel configuration should be
higher than the series configuration. This is due to the fact the solubility constant will be lower as
13Unit Operations ChE 382 Group 5 Spring 2011 5/7/2023Damo, Duffy, Guerrero, Hsu, Kosak, Qamar, Tyska

Air Membrane Separation University of Illinois
pressure increases, and also because in the series configuration the air will be passing through two
different membranes, one after the other resulting in a lower pressure drop, rather than in the parallel
configuration, where the air stream will be split into two and each stream will pass through the
membranes only once, thus leading to a higher pressure drop.
4. Conclusion
In this lab the goal was to find the effect of pressure and different configurations of membranes on
the separation of air into its constituent components. For the configurations, two membranes were set
up in parallel and in series. The air was approximated as a mixture of only nitrogen and oxygen. From
the data in this lab, it can be concluded that increasing the pressure increases the amount of separation
in the cylinders, and that a series configuration works better than a parallel one.
For both the parallel and series trials, the concentration of oxygen in the air through the membrane
increased in each trial (as can be seen in table 1). This makes sense since there shouldn’t be a high
enough of an oxygen concentration to create a boundary layer on the membrane. Since there is no
boundary layer, the diffusion of oxygen through the layer increases when pressure is increases. This
trend occurs in both configurations because the exact configuration of the membrane does not matter;
only the concentration of oxygen at the surface does (concentration at the boundary layer).
The series configuration was found to separate the oxygen from the nitrogen better than the parallel
configuration, which also makes sense. In the parallel configuration, all of the air only sees one
membrane, and thus is only separated once. With the series configuration, the air is separated twice,
and thus there is a better separation. This can be seen in table 1, where the concentration of oxygen in
14Unit Operations ChE 382 Group 5 Spring 2011 5/7/2023Damo, Duffy, Guerrero, Hsu, Kosak, Qamar, Tyska

Air Membrane Separation University of Illinois
the concentrated stream is, on average 0.5% higher. Similarly, the concentration of oxygen in the
retentate stream is about 1.4% higher (on average) in the parallel configuration.
These conclusions are also backed by our other data and calculated values. The density of oxygen
and nitrogen different (oxygen is heavier), and the trends in concentration with configuration and
pressure can also be seen in the pressure data. Similarly, the flow rates of oxygen in the permeate were
also calculated. As expected, the flow rates of oxygen in the permeate increased when pressure was
increased, and they were higher in the series configuration than the parallel configuration.
Overall this lab went very well, and the data consistently supported the conclusion that the series
configuration separated the oxygen from the nitrogen better than the parallel configuration, and the
higher pressures resulted in higher oxygen concentrations in the permeate.
5. References
W.E. McCabe, J.C. Smith, and P. Harriott 2001. Unit Operations of Chemical Engineering, McGraw Hill, New York.
15Unit Operations ChE 382 Group 5 Spring 2011 5/7/2023Damo, Duffy, Guerrero, Hsu, Kosak, Qamar, Tyska

Air Membrane Separation University of Illinois
6. Appendix I: Data Tabulation/Graphs
Membrane Separation
RunTank Outlet
(psig)Gauge Outlet
(psig)FM1
(SLPM)FM2
(SLPM)O2 Sensor
1O2 Sensor
2Run 1 || 140 122 6.13 11.4 7.4 34.5Run 2 || 140 110 5.47 9.95 7.2 33.7Run 3 || 140 100 5 8.98 7.2 33
Run 4 -- 140 122 6.06 11.41 6 34.8Run 5 -- 140 110 5.46 10.05 5.7 34.1Run 6 -- 140 100 4.95 9 6 33.9
tube side 1 = Nonpermeate
shell side 2= Permeate
|| = parallel
-- = seriesslpm=standard liters per minute
Table 1
RunΔP
(psi)Jo2 (g/m2-
min)DO2/L
(m2/min) ΔP (psi)SO2 (mol/Pa-
m3) PO2/L (mol/Pa-min-m4)Run 1 || 122 0.955 0.00265 122 4.41E-05 1.169E-07Run 2 || 110 0.814 0.00231 110 4.84E-05 1.116E-07Run 3 || 100 0.718 0.00209 100 5.26E-05 1.101E-07
Run 4 -- 122 0.965 0.00252 122 4.41E-05 1.111E-07Run 5 -- 110 0.832 0.00220 110 4.84E-05 1.065E-07Run 6 -- 100 0.741 0.00199 100 5.26E-05 1.049E-07
Table 2
16Unit Operations ChE 382 Group 5 Spring 2011 5/7/2023Damo, Duffy, Guerrero, Hsu, Kosak, Qamar, Tyska

Air Membrane Separation University of Illinois
Run α'O2,N2 α''O2,N2
ΔP (psi)
O2 Recovery
N2 Recovery
Stage cut
Run 1 || 6.591 1.981 122 1.068 0.410 0.650Run 2 || 6.551 1.912 110 1.035 0.417 0.645Run 3 || 6.348 1.853 100 1.009 0.420 0.642
Run 4 -- 8.362 2.008 122 1.082 0.413 0.653Run 5 -- 8.561 1.947 110 1.052 0.420 0.648Run 6 -- 8.035 1.929 100 1.041 0.422 0.645
Table 3
Flux vs Pressure Drop
0.600
0.650
0.700
0.750
0.800
0.850
0.900
0.950
1.000
70 80 90 100 110 120 130
Pressure Drop (psi)
Flux
(g/m
2-m
in)
Parallel
Series
Figure 7
17Unit Operations ChE 382 Group 5 Spring 2011 5/7/2023Damo, Duffy, Guerrero, Hsu, Kosak, Qamar, Tyska

Air Membrane Separation University of Illinois
Diffusivity per thickness vs Pressure Drop
0.00150
0.00170
0.00190
0.00210
0.00230
0.00250
0.00270
0.00290
70 80 90 100 110 120 130
Pressure Drop (psi)
Diffu
sivity
(m2/
min
)
Parallel
Series
Figure 8
Solubility Constant vs Pressure Drop
4.00E-05
4.20E-05
4.40E-05
4.60E-05
4.80E-05
5.00E-05
5.20E-05
5.40E-05
70 80 90 100 110 120 130
Pressure Drop (psi)
Solu
bilit
y (m
ol/P
a-m
3)
Parallel
Series
Figure 9
18Unit Operations ChE 382 Group 5 Spring 2011 5/7/2023Damo, Duffy, Guerrero, Hsu, Kosak, Qamar, Tyska

Air Membrane Separation University of Illinois
Permeability per thickness vs Pressure Drop
1.020E-07
1.040E-07
1.060E-07
1.080E-07
1.100E-07
1.120E-07
1.140E-07
1.160E-07
1.180E-07
70 80 90 100 110 120 130
Pressure Drop (psi)
Perm
eabi
lity
(mol
/Pa-
min
-m4)
Parallel
Series
Figure 10
Separation Factor vs Pressure Drop
1.000
2.000
3.000
4.000
5.000
6.000
7.000
8.000
9.000
70 80 90 100 110 120 130
Pressure Drop (psi)
Parellel alpha prime
Parallel alpha double prime
Series alpha prime
Series alpha double prime
Figure 11
19Unit Operations ChE 382 Group 5 Spring 2011 5/7/2023Damo, Duffy, Guerrero, Hsu, Kosak, Qamar, Tyska

Air Membrane Separation University of Illinois
Recovery and Stage Cut vs Pressure Drop
0.400
0.500
0.600
0.700
0.800
0.900
1.000
70 80 90 100 110 120 130
Pressure Drop (psi)
O2 Rec. Parallel
N2 Rec. Parallel
Stage Cut Parallel
O2 Rec. Series
N2 Rec. Series
Stage Cut Series
Figure 12
20Unit Operations ChE 382 Group 5 Spring 2011 5/7/2023Damo, Duffy, Guerrero, Hsu, Kosak, Qamar, Tyska

Air Membrane Separation University of Illinois
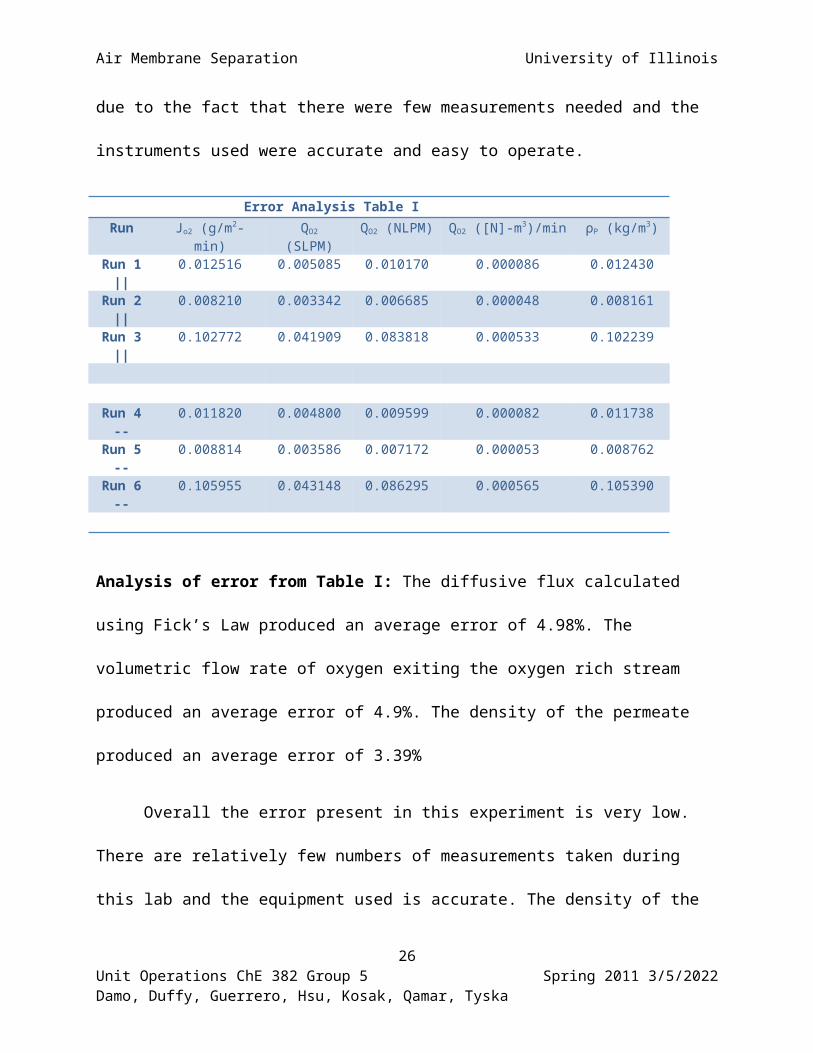
7. Appendix II: Error Analysis
Measuring Device Uncertainty in MeasurementPressure Sensor ± 1 PSIGDigital Oxygen Sensor ± 0.1 PercentFlow meter ± 0.1 SLPM
Three main sources of instrumental error were present for this experiment. The pressure
sensors, digital oxygen sensor, and flowmeters were used to measure the values needed in
determining calculations. These instruments are both accurate and easy to read. The Digital
Oxygen Sensor was calibrated before use however; there was some error present in the
calibration. After exposing the sensors to the ambient air they both read about 21% oxygen but
the two sensors differed by around 0.3 from each other despite them measuring the same air. The
pressure sensors and flow meters did not need calibration. As always there was also the
possibility of human error present caused my misreading the indicators or by calculation error.
Other than those sources of error this lab was done relatively accurately. This was mostly due to
the fact that there were few measurements needed and the instruments used were accurate and
easy to operate.
Error Analysis Table IRun Jo2 (g/m2-min) QO2 (SLPM) QO2 (NLPM) QO2 ([N]-m3)/min ρP (kg/m3)
Run 1 ||
0.012516 0.005085 0.010170 0.000086 0.012430
Run 2 ||
0.008210 0.003342 0.006685 0.000048 0.008161
Run 3 ||
0.102772 0.041909 0.083818 0.000533 0.102239
Run 4 --
0.011820 0.004800 0.009599 0.000082 0.011738
Run 5 --
0.008814 0.003586 0.007172 0.000053 0.008762
21Unit Operations ChE 382 Group 5 Spring 2011 5/7/2023Damo, Duffy, Guerrero, Hsu, Kosak, Qamar, Tyska

Air Membrane Separation University of Illinois
Run 6 --
0.105955 0.043148 0.086295 0.000565 0.105390
Analysis of error from Table I: The diffusive flux calculated using Fick’s Law produced an
average error of 4.98%. The volumetric flow rate of oxygen exiting the oxygen rich stream
produced an average error of 4.9%. The density of the permeate produced an average error of
3.39%
Overall the error present in this experiment is very low. There are relatively few numbers
of measurements taken during this lab and the equipment used is accurate. The density of the
permeate stream depends only on the measurement obtained from O2 sensor 2. This sensor was
calibrated before the lab was conducted and has an error of ± 0.1% associated with it. The
volumetric flow rate of oxygen depends on O2 Sensor 2 and Flow Rate 2. Flow Meter 2 had an
error of ± 0.1 SLPM .The diffusive flux depends on the previous two calculations and the
thickness of the membrane (provided by the manufacture) therefore the only measurable point of
error would be O2 Sensor 2.
Error Analysis Table IIRun Cin,1 (mol/m3) FM1
(NLPM)Cin,2 (mol/m3) FM2
(NLPM)DO2/L (m2/min) pO2 (Pa) SO2 (mol/Pa-
m3)Run 1
||N/A N/A N/A N/A 5.35579E-05 0.888004207 5.1047E-06
Run 2 ||
N/A N/A N/A N/A 4.0375E-05 0.72 3.8809E-06
Run 3 ||
N/A N/A N/A N/A 0.001759024 7.200473405 7.4394E-05
N/A N/A N/A N/A N/A N/A N/A N/A
Run 4 --
N/A N/A N/A N/A 4.82228E-05 0.720011675 6.2882E-06
Run 5 --
N/A N/A N/A N/A 2.1328E-05 0.570012272 2.9753E-06
Run 6 --
N/A N/A N/A N/A 0.001721844 6.000394505 7.4394E-05
22Unit Operations ChE 382 Group 5 Spring 2011 5/7/2023Damo, Duffy, Guerrero, Hsu, Kosak, Qamar, Tyska
Air Membrane Separation University of Illinois
Analysis of error for Table II: The pressure of oxygen in the nitrogen rich stream produced an
average error of only 0.005%. The Solubility Constant for oxygen had an average error 57.5%
associated with it. The Diffusivity of oxygen per thickness of the membrane yielded an error of
26.5%.
Both the pressure of oxygen in the nitrogen rich stream and the Solubility Constants of
oxygen were dependent of the measurements taken from O2 Sensor 1 and the outlet pressure
gauge. These two pieces of equipment have errors of ± 0.1% and ± 1 PSIG respectively. The
Diffusivity of oxygen per thickness of the membrane depends on O2 Sensor 1, O2 Sensor 2, and
Flow Meter 2. The error in these instruments is stated above.
Error Analysis Table IIIRun PO2/L (mol/Pa-min-
m4)α'O2,N2 α''O2,N2 O2
RecoveryCN2,r
(mol/m3)N2
RecoveryStage Cut
Run 1 ||
1.8824E-08 0.24854628 0.05193083 0.21596665 N/A 0.07749319 0.13059018
Run 2 ||
1.42401E-08 0.15265225 0.04455491 0.13290789 N/A 0.04916656 0.08172921
Run 3 ||
1.5564E-07 9.5194518 2.06543431 8.30990503 N/A 3.45872448 5.24896362
Run 4 --
1.75806E-08 0.46029265 0.04578146 0.19672683 N/A 0.06936061 0.1179853
Run 5 --
1.36579E-08 0.45490829 0.01285494 0.14820561 N/A 0.05578717 0.09119116
Run 6 --
1.48361E-07 12.0979024 2.16826296 8.58095947 N/A 3.47871539 5.27634161
Analysis of error for Table III: The error calculated from the values in Table III was much
higher than that of the previous two tables. Pressure of Oxygen per thickness, α'O2, N2, and
α''O2, N2 produced average errors of 55.7%, 51.6%, and 37.7% respectively. The other three
values in the table yielded errors of over 100%.
23Unit Operations ChE 382 Group 5 Spring 2011 5/7/2023Damo, Duffy, Guerrero, Hsu, Kosak, Qamar, Tyska

Air Membrane Separation University of Illinois
8. Appendix III: Sample Calculations
All sample calculation values are sampled from trial 1 of the parallel separation, the rest are identical.
Known Values:A 2.7 m2
ρO2 1.331 kg/m3
ρN2 1.165 kg/m3
MW-O2 32 g/molMW-N2 28 g/mol
Total Flux:
Jo2=Qo2 ρnA
Where:Qip = Volumetric flow rate of species i in the permeate in m3/minρ =Density of permeate in kg/m3
A = Area of membrane, (in this case 2.7m2 per module)n = Number of modules used, (in this case 2)
0.955 ( g/m2 min) = 0.00422 ( m3/min) * 1.22 (kg/m3) * 1000 (g/kg) / 2 * 2.7 (m2)
Diffusivity Flux:Di
L=
J i(C¿ 1−C¿ 2)
Where:Ji = Flux of component i in grams/m2 minDi = Diffusivity of component i in m2/minL = Thickness of membrane in metersCin1 = Concentration of component i inside membrane wall on feed side in mol/m3
Cin2 = Concentration of component i outside the membrane wall on permeate side in mol/m3
0.00264 ( m2/min) = 0.955 ( g/m2 min) / 32 ( g/mol) * ( 14.34 – 3.07 ) (mol/m3)
Henry’s Law:Cℑ=Si p i
Where:Cim = Concentration of component i inside the membrane wall in mol/m3 Si = Solubility constant for component i in the membrane in mol/m3Papi = Partial pressure of component i in the gas phase in Pa
24Unit Operations ChE 382 Group 5 Spring 2011 5/7/2023Damo, Duffy, Guerrero, Hsu, Kosak, Qamar, Tyska
Air Membrane Separation University of Illinois
3.07 ( mol/m3) = 4.41X10^-5 ( mol/Pa m3) * 69736.19 ( Pa)
Permeation:Pi=DiS i
Where:Pi = Component i membrane permeability in mol/m3sPaDi = Diffusivity of component i in m2/sSi = Solubility constant for component i in the membrane in mol/m3Pa
1.11X10^-7 (mol/Pa min m4) = 0.00264 ( m2/min) * 4.41X10^-5 ( mol/Pa m3)
Separation Efficiency:
α ij=PiP j
Where: αij = Separation factor Pi = Component i membrane permeability in mol/m3sPa
Based on feed composition
1.98 = ( 34.5 / 65.5 ) * ( 0.79/0.21 )
Recovery:
O2Recovery=Q pCO2 p
Qf CO2 f
Qp = Volumetric flow rate of permeate in m3/sQf = Volumetric flow rate of feed in m3/sCO2f = Molar concentration of oxygen in feed in mol/m3
CO2p = Molar concentration of oxygen in permeate in mol/m3
CN2f = Molar concentration of nitrogen in feed in mol/m3
CN2r = Molar concentration of oxygen in permeate in mol/m3
1.06 = ( 12.23 / 6.57 + 12.23) * ( 14.35 * 32 / 0.21 * 1.33 * 1000)
Stage Cut:
STAGECUT=Qp
Qp+Qf
Where: Qp = Volumetric flow rate of permeate in m3/sQf = Volumetric flow rate of feed in m3/s
25Unit Operations ChE 382 Group 5 Spring 2011 5/7/2023Damo, Duffy, Guerrero, Hsu, Kosak, Qamar, Tyska
Air Membrane Separation University of Illinois
0.65 = 12.23 / ( 6.57 + 12.23)
Error Sample:
Relationship between Z and (A,B)
Relationship between errors ΔZ and (ΔA,ΔB)
ΔZ
Z=A+BZ = A-B
(ΔZ)2 = (ΔA)2 + (ΔB)2 ∆ Z=√(ΔA )2+(ΔB)2
Z=A*BZ= A/B
(ΔZ/Z)2 = (ΔA/A)2 + (ΔB/B)2
∆ Z=(√( Δ AA )2
+( ΔBB )2)×Z
Z=An ΔZ/Z = n * ΔA/A ∆ Z=n×∆ AZ × A
Z= Ln(A) ΔZ = ΔA/A ∆ Z=∆ AA
Z= exp(A) ΔZ/Z = ΔA ∆ Z=Z×∆ A
An example of error is given using trial 1 parallel for finding the error in the oxygen flux , JO2.
E JO2 = E QO2 + E ρO2
0.012 = 0.000086 + 0.0124
26Unit Operations ChE 382 Group 5 Spring 2011 5/7/2023Damo, Duffy, Guerrero, Hsu, Kosak, Qamar, Tyska

Air Membrane Separation University of Illinois
9. Appendix IV: Individual Team Contributions
Name: Andrew DuffyTime (Hours) Description
Operator (Both Lab Days) 7 Operated lab with groupPre-Lab Editing 0Final Lab Editing 0Summary 0Introduction 1 Wrote SectionLiterature Review / Theory 0Apparatus 0Materials and Supplies 0Procedure 0Anticipated Results 0Results 0Discussion 0Conclusion 0References 0Data Tabulation / Graphs 0Error Analysis 2 Wrote SectionSample Calculations 0Job Safety Analysis 0.5 Wrote SectionPower Point Presentation 0Total 10.5
Name: Bernard HsuTime (Hours) Description
Operator (Both Lab Days) 7 Operated lab with groupPre-Lab Editing 0Final Lab Editing 0Summary 0Introduction 0Literature Review / Theory 0Apparatus 0Materials and Supplies 0Procedure 0Anticipated Results 1 Wrote SectionResults 0Discussion 0Conclusion 0References 0
27Unit Operations ChE 382 Group 5 Spring 2011 5/7/2023Damo, Duffy, Guerrero, Hsu, Kosak, Qamar, Tyska

Air Membrane Separation University of Illinois
Data Tabulation / Graphs 2.5 Compiled DataError Analysis 0Sample Calculations 0Job Safety Analysis 0Power Point Presentation 0Total 10.5
Name: Ryan KosakTime (Hours) Description
Operator (Both Lab Days) 7 Operated lab with groupPre-Lab Editing 0.5Final Lab Editing 1.5 Compiled Summary 0Introduction 0Literature Review / Theory 1.5 Wrote SectionApparatus 0Materials and Supplies 0Procedure 0Anticipated Results 0Results 0Discussion 0Conclusion 0References 0Data Tabulation / Graphs 0Error Analysis 0Sample Calculations 0Job Safety Analysis 0Power Point Presentation 0Total 10.5
Name: Daniyal QamarTime (Hours) Description
Operator (Both Lab Days) 7 Operated lab with groupPre-Lab Editing 0Final Lab Editing 0Summary 0Introduction 0Literature Review / Theory 0Apparatus 0.5 Wrote SectionMaterials and Supplies 1.5 Wrote SectionProcedure 0Anticipated Results 0Results 2
28Unit Operations ChE 382 Group 5 Spring 2011 5/7/2023Damo, Duffy, Guerrero, Hsu, Kosak, Qamar, Tyska

Air Membrane Separation University of Illinois
Discussion 0Conclusion 0References 0Data Tabulation / Graphs 0Error Analysis 0Sample Calculations 0Job Safety Analysis 0Power Point Presentation 0Total 11
Name: Tomi DamoTime (Hours) Description
Operator (Both Lab Days) 7 Operated lab with groupPre-Lab Editing 0Final Lab Editing 0Summary 0Introduction 0Literature Review / Theory 1.5 Wrote SectionApparatus 0Materials and Supplies 0Procedure 0Anticipated Results 0Results 0Discussion 0Conclusion 0References 0Data Tabulation / Graphs 0Error Analysis 0Sample Calculations 2 Wrote SectionJob Safety Analysis 0Power Point Presentation 0Total 10.5
Name: Alex GuerreroTime (Hours) Description
Operator (Both Lab Days) 7 Operated lab with groupPre-Lab Editing 0Final Lab Editing 0Summary 0Introduction 0Literature Review / Theory 0Apparatus 0Materials and Supplies 0
29Unit Operations ChE 382 Group 5 Spring 2011 5/7/2023Damo, Duffy, Guerrero, Hsu, Kosak, Qamar, Tyska

Air Membrane Separation University of Illinois
Procedure 1.5 Wrote SectionAnticipated Results 0Results 0Discussion 2 Wrote SectionConclusion 0References 0Data Tabulation / Graphs 0Error Analysis 0Sample Calculations 0Job Safety Analysis 0Power Point Presentation 0Total 10.5
Name: Jeff Tyska Time (Hours) Description
Operator (Both Lab Days) 7 Operated lab with groupPre-Lab Editing 1.5 CompiledFinal Lab Editing 0Summary 2 Wrote SectionIntroduction 0Literature Review / Theory 0Apparatus 0Materials and Supplies 0Procedure 0Anticipated Results 0Results 0Discussion 0Conclusion 0References 0Data Tabulation / Graphs 0Error Analysis 0Sample Calculations 0Job Safety Analysis 0Power Point Presentation 0Total 10.5
30Unit Operations ChE 382 Group 5 Spring 2011 5/7/2023Damo, Duffy, Guerrero, Hsu, Kosak, Qamar, Tyska


![Numerical Simulation of Direct Contact Membrane ...cd14.ijme.us/papers/144__Isam Janajreh, Dana Suwwan.pdf · permeate side, and condensation at the permeate side [4] multistage flash,](https://static.fdocuments.us/doc/165x107/5eb4b5c2006b722c2c220f91/numerical-simulation-of-direct-contact-membrane-cd14ijmeuspapers144isam.jpg)

