SUMMARY - SURVEY OF CEREAL AREAS AND … · SUMMARY - SURVEY OF CEREAL AREAS AND VOLUMES ... The...
14
1 SUMMARY - SURVEY OF CEREAL AREAS AND VOLUMES – APRIL 1, 2018 Introduction The objective of this AIMI survey of growers was to determine, as at April 1, 2018: the size of the 2018 harvest of wheat, barley and oats the sales channels, storage status and unsold amount of the 2018 harvest the tonnages of carry-over stocks on farms from the 2017 harvest the sowing intentions for the autumn/winter of 2018 The data from 114 survey farms as at April 1, 2018 were scaled up to the national level using the most recent Agricultural Production Statistics. As with all surveys, there is a margin of error which needs to be considered in relation to this report. These figures reflect the position at the 1st April 2018 and there will have been changes since this time. Key Points at 1 April 2018 (figures have been rounded to nearest 100): Milling wheat: Estimated total tonnage (82,500 t) was down 23% compared to last year’s harvest (107,500 t). Of this total, 61% has been sold (50,300 t), although most of the sold grain is still stored on farm (71%). The amount of unsold grain is 32,200 tonnes (39%). Carryover of unsold grain from the 2017 harvest was 400 t, taking the estimate of unsold grain in the market to approximately 32,600 tonnes which is similar to both 2017 and 2016 (both 33,500 t), higher than 2015 (14,300 t) and 2014 (28,800 t), but lower than 2013 (61,200 t). The 2017/18 season was regarded as poor by many growers in the survey (very wet at times, including flooding out of some crops, and too hot at other times). Average yields were down 12% (over all six crops) compared to last season. More hectares were harvested than last season (18% up), with a 3% increase in total tonnage compared to last season. The actual harvest was early and compressed into a shorter period than usual, so that the 2018 harvest of all six crops for all survey respondents was completely finished by 1 April. This was especially unusual for the two oats crops. Carry-over stocks of feed wheat and feed barley were lower than at the same time last year. Unsold stocks on hand of last year’s feed wheat and feed barley crops were 0.7% and 0.3% of the 2017 harvest tonnages respectively. Milling wheat, feed wheat and feed barley have similar stocks of unsold grain compared to this time last year (down 3%, up 4% and down 10% respectively). Autumn/winter sowings of feed wheat are predicted to be down by 3,400 hectares on predicted sowings a year ago, with feed barley up by 1,100 ha, milling wheat down by 5,700 ha, malting barley down 1,400 ha, milling oats up 500 ha, and feed oats down 500 ha. However these predictions are based mostly on intentions as very little crop had been sown by 1 April 2018.
Transcript of SUMMARY - SURVEY OF CEREAL AREAS AND … · SUMMARY - SURVEY OF CEREAL AREAS AND VOLUMES ... The...

1
SUMMARY - SURVEY OF CEREAL AREAS AND VOLUMES – APRIL 1, 2018
Introduction
The objective of this AIMI survey of growers was to determine, as at April 1, 2018:
the size of the 2018 harvest of wheat, barley and oats
the sales channels, storage status and unsold amount of the 2018 harvest
the tonnages of carry-over stocks on farms from the 2017 harvest
the sowing intentions for the autumn/winter of 2018
The data from 114 survey farms as at April 1, 2018 were scaled up to the national level using the most recent Agricultural Production Statistics. As with all surveys, there is a margin of error which needs to be considered in relation to this report. These figures reflect the position at the 1st April 2018 and there will have been changes since this time. Key Points at 1 April 2018 (figures have been rounded to nearest 100):
Milling wheat: Estimated total tonnage (82,500 t) was down 23% compared to last year’s harvest (107,500 t). Of this total, 61% has been sold (50,300 t), although most of the sold grain is still stored on farm (71%). The amount of unsold grain is 32,200 tonnes (39%). Carryover of unsold grain from the 2017 harvest was 400 t, taking the estimate of unsold grain in the market to approximately 32,600 tonnes which is similar to both 2017 and 2016 (both 33,500 t), higher than 2015 (14,300 t) and 2014 (28,800 t), but lower than 2013 (61,200 t).
The 2017/18 season was regarded as poor by many growers in the survey (very wet at times, including flooding out of some crops, and too hot at other times). Average yields were down 12% (over all six crops) compared to last season. More hectares were harvested than last season (18% up), with a 3% increase in total tonnage compared to last season.
The actual harvest was early and compressed into a shorter period than usual, so that the 2018 harvest of all six crops for all survey respondents was completely finished by 1 April. This was especially unusual for the two oats crops.
Carry-over stocks of feed wheat and feed barley were lower than at the same time last year. Unsold stocks on hand of last year’s feed wheat and feed barley crops were 0.7% and 0.3% of the 2017 harvest tonnages respectively.
Milling wheat, feed wheat and feed barley have similar stocks of unsold grain compared to this time last year (down 3%, up 4% and down 10% respectively).
Autumn/winter sowings of feed wheat are predicted to be down by 3,400 hectares on predicted sowings a year ago, with feed barley up by 1,100 ha, milling wheat down by 5,700 ha, malting barley down 1,400 ha, milling oats up 500 ha, and feed oats down 500 ha. However these predictions are based mostly on intentions as very little crop had been sown by 1 April 2018.

2
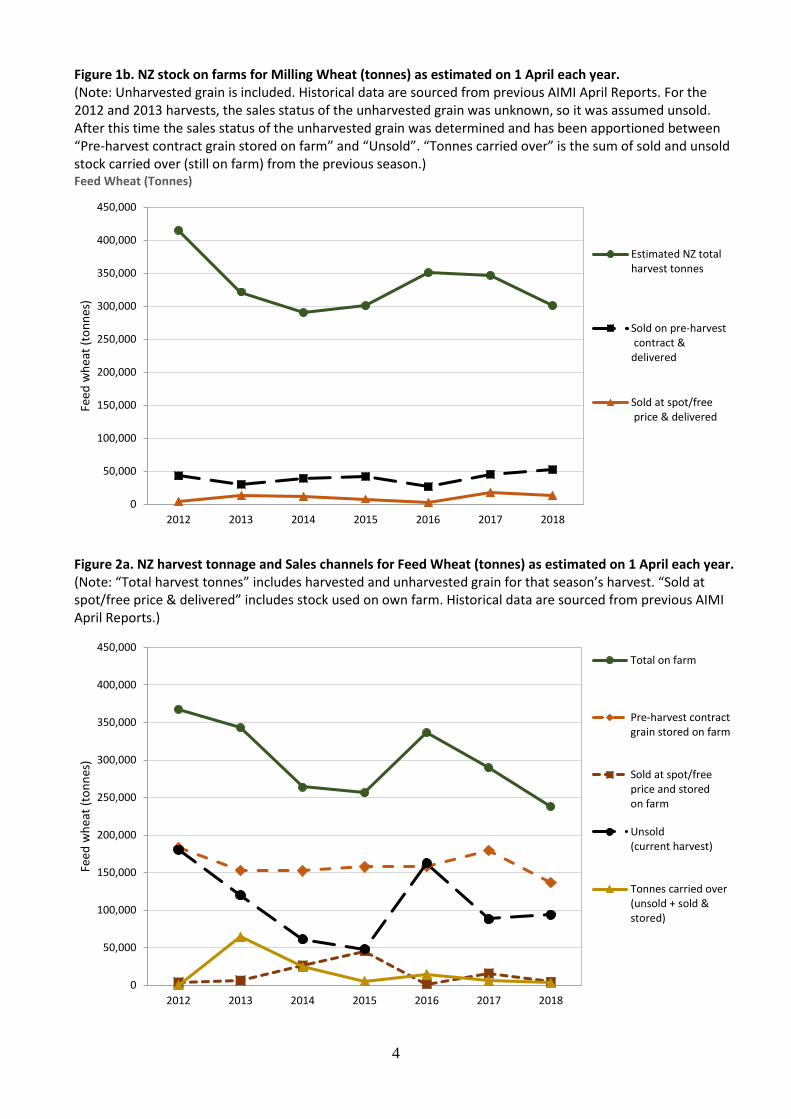
Feed wheat: Estimated total tonnage (300,700 t) was almost identical to last year’s harvest (301,600 t). Of this total, 69% has been sold (206,800 t), with 68% of the sold grain still stored on farm. The amount of unsold grain is 93,900 tonnes (31%). Unsold stock carried over from last season was 2,100 t, taking the estimate of total unsold grain in the market to 96,000 tonnes which was similar to last season (91,900 t in 2017), lower than 2016 (174,000 t), higher than 2015 (49,600 t) and 2014 (68,100 t), and lower than 2013 (138,700 t). Feed barley: Estimated total tonnage (305,600 t) was up 28% compared to last year (238,000 t). Of this total tonnage, 67% has been sold (206,100 t), with 60% of the sold grain still stored on farm. About 33% (99,500 t) remains unsold. Carryover of unsold grain was 700 t, taking the estimate of total unsold grain in the market to approximately 100,200 tonnes, which is slightly down on last season (111,600 t), lower than in 2016 (174,000 t), higher than 2015 (75,400 t) and 2014 (56,300 t), and lower than 2013 (188,800 t). For other cereals: Compared to last year, estimated total tonnages for malting barley (59,600 t) increased by 2%, milling oats (13,400 t) was down by 49%, and feed oats (3,200 t) was down by 58%. All (100%) of the three crops had been harvested by 1 April 2018, which is unusual for the two oats crops. For malting barley, 5% of the total harvest was unsold, while milling oats had 3% unsold and feed oats had 14% unsold as at 1 April, 2018. There were no unsold stocks carried over from last season for malting barley, an estimated 400 t of unsold carryover stocks for milling oats and an estimated 900 t for feed oats. Sowing intentions: Only a few autumn/winter cereal crops had been sown by 1 April 2018. For feed wheat, 18% had been sown, while for both milling wheat and feed barley, about 5% had been sown. No malting barley or milling or feed oats had been sown. The total area sown or intending to be sown in autumn/winter wheat or barley, as at 1 April 2018, was down 12% overall (or, down by 9,300 hectares) on sowings plus intentions as at 1 April 2017.
Feed wheat area sown in the autumn/winter is predicted to decrease by 8% (down 3,400 hectares) from 2017 to 2018. Autumn/winter feed barley area sown is predicted to increase by 5% (up 1,100 hectares), and milling wheat area sown is predicted to decrease by 50% (down 5,700 hectares).
Autumn/winter malting barley area sown is predicted to decrease by 32% (down 1,400 hectares) from 2017 to 2018, which cancels out the increase from 2016 to 2017. Milling oats area sown is predicted to increase by 50% (up 500 hectares) from 2017 to 2018, while feed oats area sown is predicted to decrease by 40% (down 500 hectares).

3
Milling Wheat (Tonnes)
Figure 1a. NZ harvest tonnage and Sales channels for Milling Wheat (tonnes) as estimated on 1 April each year. (Note: “Total harvest tonnes” includes harvested and unharvested grain for that season’s harvest. “Sold at spot/free price & delivered” includes grain sold for feed. Historical data are sourced from previous AIMI April Reports.)
0
50,000
100,000
150,000
200,000
2012 2013 2014 2015 2016 2017 2018
Mill
ing
wh
eat
(to
nn
es)
Estimated NZ totalharvest tonnes
Sold on pre-harvest contract & delivered
Sold at spot/free price & delivered
0
50,000
100,000
150,000
200,000
2012 2013 2014 2015 2016 2017 2018
Mill
ing
wh
eat
(to
nn
es)
Total on farm
Pre-harvest contractgrain stored on farm
Sold at spot/freeprice and storedon farm
Unsold(current harvest)
Tonnes carried over(unsold + sold &stored)
4
Figure 1b. NZ stock on farms for Milling Wheat (tonnes) as estimated on 1 April each year. (Note: Unharvested grain is included. Historical data are sourced from previous AIMI April Reports. For the 2012 and 2013 harvests, the sales status of the unharvested grain was unknown, so it was assumed unsold. After this time the sales status of the unharvested grain was determined and has been apportioned between “Pre-harvest contract grain stored on farm” and “Unsold”. “Tonnes carried over” is the sum of sold and unsold stock carried over (still on farm) from the previous season.) Feed Wheat (Tonnes)
Figure 2a. NZ harvest tonnage and Sales channels for Feed Wheat (tonnes) as estimated on 1 April each year. (Note: “Total harvest tonnes” includes harvested and unharvested grain for that season’s harvest. “Sold at spot/free price & delivered” includes stock used on own farm. Historical data are sourced from previous AIMI April Reports.)
0
50,000
100,000
150,000
200,000
250,000
300,000
350,000
400,000
450,000
2012 2013 2014 2015 2016 2017 2018
Feed
wh
eat
(to
nn
es)
Estimated NZ totalharvest tonnes
Sold on pre-harvest contract &delivered
Sold at spot/free price & delivered
0
50,000
100,000
150,000
200,000
250,000
300,000
350,000
400,000
450,000
2012 2013 2014 2015 2016 2017 2018
Feed
wh
eat
(to
nn
es)
Total on farm
Pre-harvest contractgrain stored on farm
Sold at spot/freeprice and storedon farm
Unsold(current harvest)
Tonnes carried over(unsold + sold &stored)

5
Figure 2b. NZ stock on farms for Feed Wheat (tonnes) as estimated on 1 April each year. (Note: Unharvested grain is included. Historical data are sourced from previous AIMI April Reports. For the 2012 and 2013 harvests, the sales status of the unharvested grain was unknown, so it was assumed unsold. After this time the sales status of the unharvested grain was determined and has been apportioned between “Pre-harvest contract grain stored on farm” and “Unsold”. “Tonnes carried over” is the sum of sold and unsold stock carried over (still on farm) from the previous season.) Feed Barley (Tonnes)
Figure 3a. NZ harvest tonnage and Sales channels for Feed Barley (tonnes) as estimated on 1 April each year. (Note: “Total harvest tonnes” includes harvested and unharvested grain for that season’s harvest. “Sold at spot/free price & delivered” includes stock used on own farm. Historical data are sourced from previous AIMI April Reports.)
0
50,000
100,000
150,000
200,000
250,000
300,000
350,000
400,000
450,000
2012 2013 2014 2015 2016 2017 2018
Feed
bar
ley
(to
nn
es)
Estimated NZ totalharvest tonnes
Sold on pre-harvest contract &delivered
Sold at spot/free price & delivered
0
50,000
100,000
150,000
200,000
250,000
300,000
350,000
400,000
450,000
2012 2013 2014 2015 2016 2017 2018
Feed
bar
ley
(to
nn
es)
Total on farm
Pre-harvest contractgrain stored on farm
Sold at spot/freeprice and storedon farm
Unsold(current harvest)
Tonnes carried over(unsold + sold &stored)

6
Figure 3b. NZ stock on farms for Feed Barley (tonnes) as estimated on 1 April each year. (Note: Unharvested grain is included. Historical data are sourced from previous AIMI April Reports. For the 2012 and 2013 harvests, the sales status of the unharvested grain was unknown, so it was assumed unsold. After this time the sales status of the unharvested grain was determined and has been apportioned between “Pre-harvest contract grain stored on farm” and “Unsold”. “Tonnes carried over” is the sum of sold and unsold stock carried over (still on farm) from the previous season.)
Figure 4. Estimated NZ tonnes harvested before 1 April 2018, and yet to harvest as at 1 April 2018.
3,238
13,386
305,644
59,578
300,702
82,500
0 50,000 100,000 150,000 200,000 250,000 300,000 350,000
Feed Oats
Milling oats
Feed barley
Maltingbarley
Feed wheat
Milling wheat
Tonnes of grain
Already harvested Yet to harvest
7
Autumn/winter sowings and sowing intentions as at 1 April each year
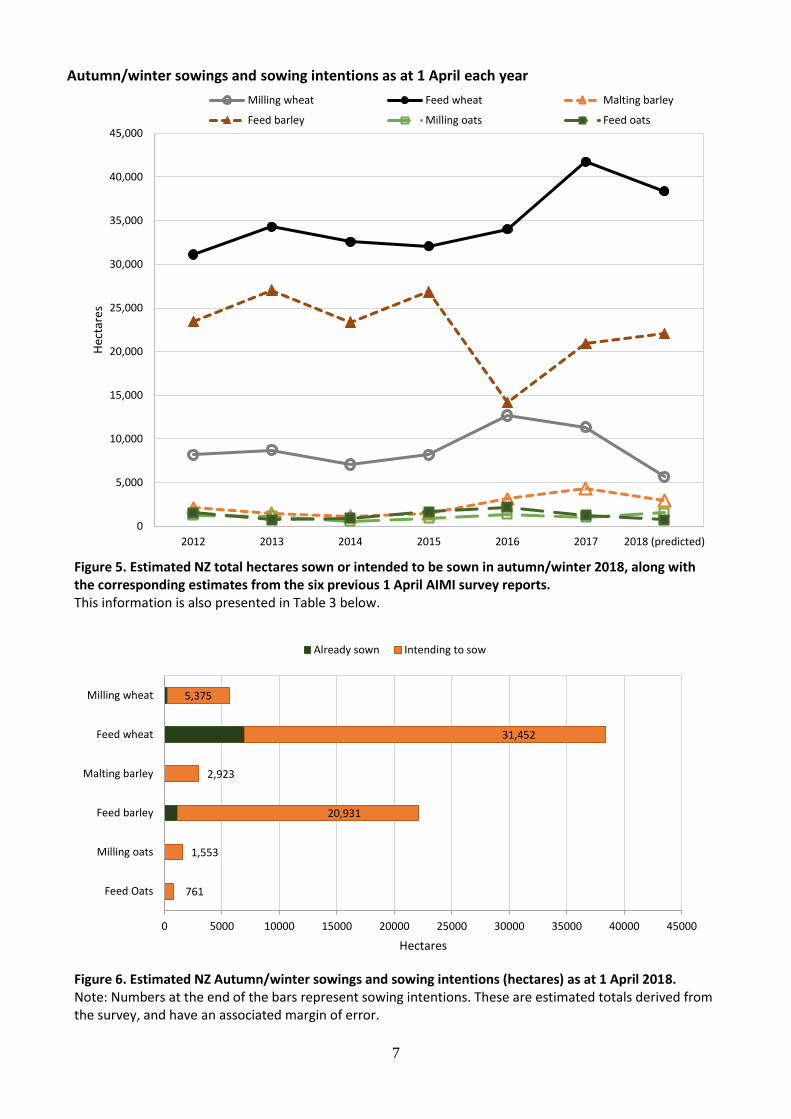
Figure 5. Estimated NZ total hectares sown or intended to be sown in autumn/winter 2018, along with the corresponding estimates from the six previous 1 April AIMI survey reports. This information is also presented in Table 3 below.
Figure 6. Estimated NZ Autumn/winter sowings and sowing intentions (hectares) as at 1 April 2018. Note: Numbers at the end of the bars represent sowing intentions. These are estimated totals derived from the survey, and have an associated margin of error.
0
5,000
10,000
15,000
20,000
25,000
30,000
35,000
40,000
45,000
2012 2013 2014 2015 2016 2017 2018 (predicted)
Hec
tare
sMilling wheat Feed wheat Malting barley
Feed barley Milling oats Feed oats
761
1,553
20,931
2,923
31,452
5,375
0 5000 10000 15000 20000 25000 30000 35000 40000 45000
Feed Oats
Milling oats
Feed barley
Malting barley
Feed wheat
Milling wheat
Hectares
Already sown Intending to sow

8
Comparison of yield (tonnes per ha) between harvests
Figure 7. Comparison of yields (T/Ha) between the 2012 to 2018 harvests for the six cereal crops. Data are from the current survey and from previous April 1 AIMI reports for 2012 to 2017. Note: Milling wheat includes biscuit and gristing varieties.
9.0 8.7 8.4 8.4 8.5
9.6
8.3
9.0 9.1 8.9 8.79.5
9.9
8.8
0
2
4
6
8
10
12
2012 2013 2014 2015 2016 2017 2018
T/h
a
Milling wheat
Feed wheat
6.6 6.8 7.1 7.3 7.27.5
6.7
6.2 6.57.0 6.7 6.6
7.2
6.3
0
2
4
6
8
10
12
2012 2013 2014 2015 2016 2017 2018
T/h
a
Malting barley
Feed barley
4.3
6.0 5.95.3
5.7 5.8
4.8
3.0
5.0 4.7 4.75.3
4.8
5.1
0
2
4
6
8
10
12
2012 2013 2014 2015 2016 2017 2018
T/h
a
Milling oats
Feed oats

9
Table 1. Detailed estimated national figures for the 2018 harvest, plus sold and delivered tonnages, for six cereal crops as at April 1, 2018.
Number of farmers in the survey who harvested or will harvest this crop in 2018 42 76 25 88 11 12
2017 harvest
Estimated NZ total hectares, 2017 harvest Ha 11,425 29,875 7,892 34,308 4,511 1,389
Estimated NZ total tonnes, 2017 harvest Tonnes 107,480 301,620 58,545 237,955 26,081 7,619
2018 harvest
Estimated NZ total hectares, 2018 harvest Ha 9,946 34,212 8,954 48,777 2,805 635
Estimated NZ total tonnes, 2018 harvest Tonnes 82,500 300,702 59,578 305,644 13,386 3,238
Estimated NZ total hectares already harvested by 1 April 2018 Ha 9,946 34,212 8,954 48,777 2,805 635
Estimated NZ total tonnes already harvested by 1 April 2018 Tonnes 82,500 300,702 59,578 305,644 13,386 3,238
Estimated NZ total hectares yet to harvest as at 1 April 2018 Ha 0 0 0 0 0 0
Estimated NZ total tonnes yet to harvest as at 1 April 2018 Tonnes 0 0 0 0 0 0
Percentage of estimated 2018 crop tonnage which had been harvested by 1 April 2018 % 100% 100% 100% 100% 100% 100%
2018 harvest so far
Sold under pre-harvest contract and delivered by 1 April 2018 Tonnes 8,774 52,325 33,759 70,218 0 906
Pre-harvest contract grain stored on farm on 1 April 2018 Tonnes 35,165 136,579 21,771 108,641 12,948 1,641
Sold at spot/free price and delivered by 1 April 2018 Tonnes 0 13,118 463 11,969 0 167
Sold at spot/free price and stored on farm on 1 April 2018 Tonnes 745 4,472 0 14,471 0 0
(For milling or malting only) Sold for feed by 1 April 2018 Tonnes 5617 - 556 - 0 -
(For feed only) Used on own farm by 1 April 2018 Tonnes - 293 - 797 - 74
Unsold stocks on hand (2018 harvest only) on 1 April 2018 Tonnes 32,199 93,914 3,029 99,548 438 449
2018 yet to harvest
Unharvested grain sold under pre-harvest contract by 1 April 2018 Tonnes 0 0 0 0 0 0
Unharvested grain unsold on 1 April 2018 Tonnes 0 0 0 0 0 0
Sales channels (2018 harvest): includes unharvested grain (though nil this year)
Sold under pre-harvest contract (total) by 1 April 2018 (includes sold, unharvested grain) Tonnes 43,939 188,904 55,529 178,859 12,948 2,547
Sold at spot/free price (total) by 1 April 2018 (includes sold for feed and used on farm) Tonnes 6,362 17,883 1,019 27,237 0 241
Delivery status of sold grain (2018 harvest): includes unharvested grain (though nil this year)
Sold and delivered (total) by 1 April 2018 (includes sold for feed and used on farm) Tonnes 14,391 65,736 34,778 82,984 0 1,147
Sold and stored on farm (total) on 1 April 2018 (includes sold, unharvested grain) Tonnes 35,910 141,051 21,771 123,112 12,948 1,641
Total sales (2018 harvest): includes unharvested grain (though nil this year)
Sold (of total crop) by 1 April 2018 (includes sold for feed, used on farm, and sold,
unharvested grain) Tonnes 50,301 206,787 56,549 206,096 12,948 2,789
Unsold (of total crop) on 1 April 2018 (includes unsold, unharvested grain) Tonnes 32,199 93,914 3,029 99,548 438 449
Comparison of hectares and tonnes between last two harvests
Estimated % change in hectares, 2017 to 2018 harvest (%) % -12.9 14.5 13.5 42.2 -37.8 -54.3
Estimated % change in tonnes, 2017 to 2018 harvest (%) % -23.2 -0.3 1.8 28.4 -48.7 -57.5
Estimated change in tonnes, 2017 to 2018 harvest (tonnes) Tonnes -24,980 -918 1,033 67,689 -12,695 -4,381
Comparison of yields (t/ha) between last two harvests
NZ-wide estimated yield, 2017 harvest T/ha 9.4 10.1 7.4 6.9 5.8 5.5
NZ-wide estimated yield, 2018 harvest T/ha 8.3 8.8 6.7 6.3 4.8 5.1
Units Milling wheat Feed wheat Malting barley Feed barley Milling oats Feed oats

10
Table 1 (continued).
In Table 1 (on the previous page), the estimated 2018 harvest tonnes of milling wheat was 23% lower than for the 2017 harvest (down 25,000 tonnes). For feed wheat, the estimated 2018 harvest tonnes was almost identical to 2017 (down 900 tonnes), and for feed barley, the estimated 2018 harvest tonnes was 28% up on 2017 (up 67,700 tonnes). Estimated 2018 harvest tonnes of malting barley was up by 2% (up 1,000 tonnes). Harvest tonnes of milling oats and feed oats were down by 49% and 58% respectively (down 12,700 and 4,400 tonnes respectively).
The last few rows of Table 1 (on this page) show the changes in on-farm storage between 1 April 2017 (of 2017 harvest grain) and 1 April 2018 (of 2018 harvest grain). Unharvested grain has been included in the estimates to take account of the differing percentages of grain harvested by 1 April between the two years. For milling wheat, feed wheat, malting barley, milling oats and feed oats there were decreases, some very large, in the tonnage of grain sold but not delivered by 1 April between the two seasons (drops of 52,500, 54,100, 22,600, 18,400 and 3,800 tonnes respectively). Feed barley was the only crop that showed a large increase in the tonnage of grain sold but not delivered by 1 April between the two seasons (an increase of 44,300 tonnes); this matches with the large increase in the feed barley harvest between the two seasons.
In terms of unsold tonnage, there were decreases in unsold tonnages as at 1 April between the two seasons for all crops except feed wheat, the largest decrease being for feed barley (a drop in unsold tonnage of 8,400 t). For feed wheat, there was an increase in unsold tonnage of 5,800 tonnes.
Comparison of on-farm storage (including unharvested grain) between last April and this April
Sold but not delivered (total) on 1 April 2017 (from 2017 harvest) (April 2017 Report) Tonnes 88,394 195,152 44,373 78,846 31,325 5,487
Sold but not delivered (total) on 1 April 2018 (from 2018 harvest) (from above) Tonnes 35,910 141,051 21,771 123,112 12,948 1,641
Unsold (from 2017 harvest) on 1 April 2017 (April 2017 AIMI Report) Tonnes 32,827 88,110 4,198 107,978 2,400 3,073
Unsold (from 2018 harvest) on 1 April 2018 (as above) Tonnes 32,199 93,914 3,029 99,548 438 449
Change in sold but not delivered (including unharvested grain) as at 1 April (for most
recent harvest) between 2017 and 2018 Tonnes -52,484 -54,101 -22,602 44,266 -18,377 -3,846
Change in unsold as at 1 April (from most recent harvest) between 2017 and 2018 Tonnes -628 5,804 -1,168 -8,429 -1,962 -2,624
Change in total grain on farm (both sold and unsold, and including unharvested grain) as
at 1 April (for most recent harvest) between 2017 and 2018 Tonnes -53,112 -48,297 -23,771 35,836 -20,339 -6,470
Note: The comparisons in the last seven rows do not include carryover stock from the previous season (as given in Table 2).
Units Milling wheat Feed wheat Malting barley Feed barley Milling oats Feed oats

11
The nett effect is that there were sizeable decreases in the tonnages of grain from the most recent harvest stored on farms between 1 April 2017 and 1 April 2018 for milling wheat, feed wheat, malting barley, milling oats and feed oats (estimated decreases of 53,100, 48,300, 23,800, 20,300 and 6,500 tonnes respectively). Feed barley was the only crop that showed an increase in total on-farm storage between 1 April 2017 and 1 April 2018 (of 35,800 tonnes). These figures do not include the grain carried over from the previous harvest (Table 2); this carry-over grain needs to be added to give the total picture.
Table 2 below shows that for the wheat and barley crops, unsold carry-over stocks on hand on 1 April 2018 from the previous (2017) harvest were at a historically low level (all four crops had less than 0.7% of the 2017 crop unsold). For the oats crops, this unsold percentage was higher (1.4% for milling oats and 11.5% for feed oats). In terms of sold carry-over grain stored on farm from the 2017 harvest, the only crop with over 1,000 tonnes sold and stored was milling oats, with 4,500 tonnes. In the last three rows, Table 2 also tracks the movement of unsold grain from the 2017 harvest between 10 October 2017 and 1 April 2018. For the wheat and barley crops, 94% to 100% of the grain that was unsold as at 10 October 2017, was sold between these two dates. For milling oats and feed oats, the corresponding percentages were much lower (77% and 24% respectively). When the tonnage of unsold carry-over grain is added to the unsold tonnage from the current harvest, the estimated tonnage of unsold grain as at 1 April, 2018 is 96,000 t for feed wheat and 100,200 t for feed barley; when summed over these two major feed crops, the total amount of unsold grain is estimated to be 196,200 t, which is only slightly lower than the amount on 1 April 2017, of 203,500 tonnes.

12
Table 2. Carry-over stock on hand from the 2017 harvest, as at April 1, 2018.
Milling wheat Feed wheat Malting barley Feed barley Milling oats Feed oats
(Tonnes) (Tonnes) (Tonnes) (Tonnes) (Tonnes) (Tonnes)
Number of survey farmers who harvested this crop in 2017 49 74 23 81 10 22
Number of survey farmers with carry-over grain from 2017 crop on 1 April 2018 3 6 1 6 8 6
Estimated NZ total sold and stored on farm (2017 crop) on 1 April 2018 319 745 139 278 4,463 705
Estimated NZ total unsold stocks on hand (2017 crop) on 1 April 2018 399 2,066 0 676 371 873
Estimated NZ Total 2017 harvest still on farms on 1 April 2018 (tonnes) 719 2,811 139 954 4,834 1,578
Estimated NZ unsold stocks on hand of 2017 harvest on 1 April 2018 as a percentage of
tonnes harvested in 2017 (%) 0.4% 0.7% 0.0% 0.3% 1.4% 11.5%
Comparative figures from last year (1 April 2017 AIMI survey)
Estimated NZ total sold and stored on farm (2016 crop) on 1 April 2017 354 2,538 0 9,851 463 819
Estimated NZ total unsold stocks on hand (2016 crop) on 1 April 2017 708 3,790 0 3,604 98 1,097
Comparative figures from year before that (1 April 2016 AIMI survey)
Estimated NZ total sold and stored on farm (2015 crop) on 1 April 2016 1,356 3,227 930 3,084 2,040 0
Estimated NZ total unsold stocks on hand (2015 crop) on 1 April 2016 3,220 11,578 2,496 30,457 0 35
Comparative figures from two years before that (1 April 2015 AIMI survey)
Estimated NZ total sold and stored on farm (2014 crop) on 1 April 2015 399 3,747 227 1,532 0 0
Estimated NZ total unsold stocks on hand (2014 crop) on 1 April 2015 68 1,685 0 660 197 395
Comparative figures from three years before (1 April 2014 AIMI survey)
Estimated NZ total sold and stored on farm (2013 crop) on 1 April 2014 5,245 17,293 0 11,656 298 0
Estimated NZ total unsold stocks on hand (2013 crop) on 1 April 2014 415 6,927 0 375 223 722
Comparative figures from four years before (1 April 2013 AIMI survey)
Estimated NZ total sold and stored on farm (bumper 2012 crop) on 1 April 2013 6,838 45,514 2,236 31,266 852 0
Estimated NZ total unsold stocks on hand (bumper 2012 crop) on 1 April 2013 9,117 18,909 0 44,372 852 501
Change in unsold 2017 harvest grain between 10 Oct 2017 and 1 April 2018 (based upon matched data)
Estimated NZ total unsold stocks on hand (2017 crop) on 10 October 2017 6,570 35,319 482 39,373 1,589 1,155
Estimated NZ total unsold stocks on hand (2017 crop) on 1 April 2018 (as above) 399 2,066 0 676 371 873
Reduction in estimated NZ total unsold stocks on hand (2017 crop) between
10 October 2017 and 1 April 2018 (tonnes) 6,170 33,253 482 38,696 1,218 282
As a percentage, reduction in estimated NZ total unsold stocks on hand (2017
crop) between 10 October 2017 and 1 April 2018 (%) 94% 94% 100% 98% 77% 24%
Note: The matched comparison in the last section was based upon scaling up data from the exact same survey farms for the last two AIMI surveys (Oct 2017 and April 2018).

13
Table 3. Autumn/winter sowings and sowing intentions as at April 1, 2018, and comparisons with previous years’ estimates.
Milling wheat
Feed wheat
Malting barley
Feed barley
Milling oats
Feed oats
(ha) (ha) (ha) (ha) (ha) (ha) Number of farmers in the survey who have sown or intend to sow this crop in the autumn or winter, as at 1 April 2018 19 75 10 52 5 8
Estimated NZ total hectares, 2017 harvest (autumn/winter plus spring sown crops, combined)
11,425 29,875 7,892 34,308 4,511 1,389
Estimated NZ total hectares, 2018 harvest (autumn/winter plus spring sown crops, combined)
9,946 34,212 8,954 48,777 2,805 635
Estimated NZ total hectares already sown, as at 1 April 2018 265 6,919 0 1,145 0 0
Estimated NZ total hectares intending to sow in autumn or winter, as at 1 April 2018 5,375 31,452 2,923 20,931 1,553 761
Estimated percentage of autumn/ winter 2018 sowings already sown by 1 April 2018 4.7% 18.0% 0.0% 5.2% 0.0% 0.0%
Estimated NZ total autumn/ winter 2018 sowings and/or sowing intentions as at April 1 2018 (hectares, for harvest in 2019)
5,640 38,371 2,923 22,076 1,553 761
Comparative figures from the same time in seven previous years (1 April AIMI surveys) Estimated NZ total autumn/ winter 2017 sowings & intentions (from the April 2017 AIMI Survey Report)
11,330 41,751 4,306 20,949 1,036 1,262
Estimated NZ total autumn/ winter 2016 sowings & intentions (from the April 2016 AIMI Survey Report)
12,688 34,048 3,133 14,167 1,369 2,159
Estimated NZ total autumn/ winter 2015 sowings & intentions (from the April 2015 AIMI Survey Report)
8,171 32,070 1,434 26,849 909 1,658
Estimated NZ total autumn/ winter 2014 sowings & intentions (from the April 2014 AIMI Survey Report)
7,078 32,607 1,148 23,380 554 926
Estimated NZ total autumn/ winter 2013 sowings & intentions (from the April 2013 AIMI Survey Report)
8,733 34,325 1,461 27,041 1,155 719
Estimated NZ total autumn/ winter 2012 sowings & intentions (from the April 2012 AIMI Survey Report)
8,173 31,136 2,101 23,485 1,286 1,540
Estimated NZ total autumn/ winter 2011 sowings & intentions (from the April 2011 AIMI Survey Report)
9,960 32,020 1,650 24,510 1,120 430
Estimated change in autumn/ winter sowings & intentions, 2016 to 2017 (hectares) -1,358 7,703 1,173 6,782 -332 -897
Estimated change in autumn/ winter sowings & intentions, 2017 to 2018 (hectares) -5,690 -3,380 -1,383 1,127 516 -501
Estimated % change in autumn/ winter sowings & intentions, 2017 to 2018 (%) -50% -8% -32% 5% 50% -40%

14
Table 3 above shows that most autumn/winter cereal crops had not been sown by 1 April 2018. For feed wheat, 18% had been sown, and for milling wheat and feed barley, 5% had been sown. No malting barley, milling oats or feed oats had been sown on the survey farms. Therefore the estimates in the table are primarily sowing intentions. For milling wheat, malting barley and feed oats, autumn/winter sowings plus sowing intentions for 2018, as at 1 April 2018, are much lower (down 50%, 32% and 40% respectively) than at the same time last year (2017), while feed wheat is down slightly (8%). Autumn/winter sowings plus sowing intentions for 2018 are up 5% for feed barley and up 50% for milling oats. When the autumn/winter sowings plus sowing intentions are summed over the four wheat and barley crops, the prediction is for a 12% decrease in autumn/winter sowings (a 9,300 hectare decrease in area sown). This predicted decrease in area sown in the autumn/winter of 2018 is unchanged when we add in the two oats crops, since the area autumn/winter sown in milling oats is predicted to go up by 500 hectares, while the feed oats area is predicted to go down by the same amount (500 hectares).
© Foundation for Arable Research (FAR) DISCLAIMER This report is intended to provide accurate and adequate information relating to the subject matter contained in it. It has been prepared and made available to all persons and entities strictly on the basis that FAR, its researchers and authors are fully excluded from any liability for damages arising out of any reliance in part or in full upon any of the information for any purpose.