Summary of the Overburden Studies of the Soil Pits OL-KK14 ... · Summary of the overburden studies...
92
POSIVA OY Olkiluoto FI-27160 EURAJOKI, FINLAND Tel +358-2-8372 31 Fax +358-2-8372 3709 Anne-Maj Lahdenperä December 2009 Working Report 2009-109 Summary of the Overburden Studies of the Soil Pits OL-KK14, OL-KK15, OL-KK16, OL-KK17, OL-KK18 and OL-KK19 at Olkiluoto, Eurajoki in 2008
Transcript of Summary of the Overburden Studies of the Soil Pits OL-KK14 ... · Summary of the overburden studies...

P O S I V A O Y
O l k i l u o t o
F I -27160 EURAJOKI , F INLAND
Te l +358-2-8372 31
Fax +358-2-8372 3709
Anne -Ma j Lahdenperä
December 2009
Work ing Repor t 2009 -109
Summary of the Overburden Studies ofthe Soil Pits OL-KK14, OL-KK15, OL-KK16,
OL-KK17, OL-KK18 and OL-KK19at Olkiluoto, Eurajoki in 2008
December 2009
Base maps: ©National Land Survey, permission 41/MML/09
Working Reports contain information on work in progress
or pending completion.
The conclusions and viewpoints presented in the report
are those of author(s) and do not necessarily
coincide with those of Posiva.
Anne -Ma j Lahdenperä
Pöyry Env i ronment Oy
Work ing Repor t 2009 -109
Summary of the Overburden Studies ofthe Soil Pits OL-KK14, OL-KK15, OL-KK16,
OL-KK17, OL-KK18 and OL-KK19at Olkiluoto, Eurajoki in 2008

Summary of the overburden studies of the soil pits OL-KK14, OL-KK15, OL-KK16, OL-KK17, OL-KK18 and OL-KK19 at Olkiluoto, Eurajoki in 2008.
ABSTRACT
The report summarises the geochemical and geotechnical properties of the soil pits
OL-KK14, OL-KK15, OL-KK16, OL-KK17, OL-KK18 and OL-KK19 investigated at
the Olkiluoto Island in 2008. The aim was to get more information on the soil
stratigraphy and geochemistry in the geosphere-biosphere interface and for the
overburden modelling purposes.
The new soil pits OL-KK14…OL-KK16 situated in central, eastern and northern parts
of the Olkiluoto. The OL-KK17…OL-KK19 situated close to each other in the
infiltration experiment site near the ONKALO underground rock characterisation
facility and the Korvensuo reservoir.
Due to the Baltic Sea stages, the soils at Olkiluoto are young, and the soil horizons are
not well developed, thus the sampling horizons were mainly selected after visual
examination. At total, 25 samples were taken from the vertical profiles of soil pits, dug
by the excavator, from the humus and from two to five different mineral horizons.
Overburden of the investigated soil pits was fine-grained and sandy till. Sand and clay
layers were common, and some soil layers were stony. pH values varied in the humus
layers from 3.3 to 5.4. In the mineral soil layers pH increased as a function of depth,
which is typical for the Finnish soil profiles. The solubility of most analysed elements
(Al, Ba, Ca, Co, Cr, Fe, K, Mg, Mn, Na, Ni, P and Zn) was significantly higher in the
humus layers than in the mineral soil layers. Calcium and magnesium were the
dominating nutrients. The cation exchange capacity was the highest in the humus
horizons of OL-KK16 and OL-KK17, OL-KK19 was the most nutrient-poor of the
studied sites.
The geochemical and geotechnical properties of investigated soils were heterogeneous,
even in the three soil profiles (OL-KK17…OL-KK19) sampled close to each other.
The humus horizon properties, the amount of the clay and fine fraction contents in
different soil pits and within the soil layers affect geochemical and hydrological
properties and thus soil pedogenic processes.
Keywords: Overburden, geochemistry, grain size distribution, cation exchange capacity, element solubility
Yhteenveto tutkimuskuoppien OL-KK14, OL-KK15, OL-KK16, OL-KK17, OL-KK18 ja OL-KK19 maaperätutkimuksista Olkiluodossa 2008.
TIIVISTELMÄ
Raporttiin on koottu yhteenveto Olkiluodossa 2008 tehtyjen tutkimuskuoppien OL-
KK-14, OL-KK15, OL-KK16, OL-KK17, OL-KK18 ja OL-KK19 maaperän
geokemiallisista ja -fysikaalisista ominaisuuksista. Tutkimus antaa lisätietoa
Olkiluodon maaperän stratigrafiasta ja geokemiallisista ominaisuuksista geosfääri-
biosfääri rajapinnassa ja tuloksia käytetään maaperämallinnuksen tarpeisiin.
Tutkimuskuopat OL-KK14…OL-KK16 sijaitsivat saaren keski-, pohjois- ja itäosissa ja
OL-KK17…OL-KK19 maanalaisen loppusijoitustilan, ONKALOn ja Korvensuon
altaan läheisyyteen perustetulla suotaumakoealueella.
Itämeren vaiheista johtuen Olkiluodon maaperän maannoshorisontit ovat nuoria ja
siten heikosti kehittyneitä, joten maaperänäytteet valittiin maaperän eri ominaisuuksien
perusteella. Näytteet otettiin kaivinkonekuopista sekä humuskerroksesta että kahdesta
viiteen mineraalimaakerroksesta. Näytteitä otettiin yhteensä 25 kappaletta.
Tutkimuskuoppien maaperä oli hienoainesmoreenia tai hiekkamoreenia. Savi- ja
hiekkakerrokset olivat yleisiä ja paikoin esiintyi kivisiä maaperäkerroksia. Humus-
kerrosten pH vaihteli 3,3-5,4. Mineraalimaakerroksissa pH kasvoi maannoshorisontin
syvyyden mukaan, mikä on tyypillistä suomalaisille maannoksille. Useimpien alku-
aineiden (Al, Ba, Ca, Co, Cr, Fe, K, Mg, Mn, Na, Ni, P ja Zn) liukoisuus oli
huomattavasti suurempi humuskerroksissa kuin mineraalimaakerroksissa. Kalsium ja
magnesium olivat pääravinteet. Tutkimuskuoppien OL-KK16 ja OL-KK17 maaperä oli
ravinnerikkainta, OL-KK19 oli ravinneköyhin. Kationinvaihtokapasiteetti ja emäs-
kylläisyysaste vaihtelivat tutkimuskuopittain ja eri maaperäkerroksittain.
Suotaumakoealueella lähekkäin sijaitsevien tutkimuskuoppien (OL-KK17…OL-
KK19) geokemialliset ominaisuudet vaihtelivat huomattavasti. Tutkimuskuoppien geo-
kemiallisten ja -fysikaalisten ominaisuuksien vaihteluun ja maannostumisprosesseihin
vaikuttavat humuskerrosten ominaisuudet, savi- ja hienoainespitoisuuden määrät.
Avainsanat: Maaperä, geokemia, raekoostumus, kationinvaihtokapasiteetti, alku-aineiden liukoisuus

1
TABLE OF CONTENTS
ABSTRACT
TIIVISTELMÄ
1 INTRODUCTION ............................................................................................. 3
1.1 Soil pits OL-KK14, OL-KK15, OL-KK16, OL-KK17, OL-KK18 and ........ 3
OL-KK19 ......................................................................................................... 3
1.2 Overburden properties at Olkiluoto ...................................................... 4
1.3 Earlier overburden studies at Olkiluoto Island ...................................... 7
2 MATERIALS AND METHODS ....................................................................... 11
2.1 Soil sampling and soil profile description ........................................... 11
2.2 Analysis of the samples ..................................................................... 22
3 RESULTS ..................................................................................................... 25
3.1 Geochemical and geotechnical analyses ........................................... 25
3.1.1 Basic properties ..................................................................... 25
3.1.2 Main exchangeable nutrients .................................................. 30
3.1.3 Easily leachable trace elements ............................................. 34
3.1.4 Main trace elements in total digestion .................................... 37
3.1.5 Easily leachable metal concentrations in partial digestion ...... 38
3.1.6 Other metal concentrations in total digestion .......................... 41
3.1.7 Iodine and selenium ............................................................... 43
3.2 Cation exchange capacity (CEC) and base saturation (BS) ............... 45
3.3 Solubility of the main elements .......................................................... 51
3.4 Grain size distribution and mineralogy ............................................... 54
4 CONCLUSIONS ............................................................................................ 55
5 SUMMARY .................................................................................................... 57
REFERENCES ......................................................................................................... 59
APPENDICES .......................................................................................................... 65

2

3
1 INTRODUCTION
Posiva Oy is responsible for implementing a final disposal repository programme for
spent nuclear fuel from Finnish nuclear power plants operated by Teollisuuden Voima
Oy and Fortum Power and Heat Oy. The spent nuclear fuel is planned to be disposed in
a KBS-3-type repository to be constructed at a depth between 400 and 600 meters in
crystalline bedrock at Olkiluoto. The suitability of Olkiluoto for the repository has
been investigated over a period of twenty years by means of different ground and
airborne methods (Posiva 2009).
Following the guidelines set forth by the Ministry of Trade and Industry (now Ministry
of Employment and Economy) Posiva Oy is preparing the next step of nuclear
licensing of the repository, which is to submit the construction license application for
spent fuel repository by the end of year 2012.
The overburden properties are of interest both for understanding of the site evolution
and for radionuclide transport analyses. The overburden changes the composition of
the infiltrating water and thus affects also the deeper groundwater. In the recent
radionuclide transport analysis (Hjerpe et al. 2009), radionuclide transport through the
geosphere-biosphere interface and further in the overburden has been explicitly
modelled (Karvonen 2009).
In the context of the transport of potential releases from the repository, the geosphere-
biosphere interface (GBI) is a zone where the changes from bedrock up to bioavailable
region takes place (without gaps in the top bedrock, overburden, and aquatic
sediments) (Lahdenperä 2006). As well, the opposite direction, infiltration from the
biosphere to the deep groundwater is important. The depth of the zone can vary greatly
depending on the media of the flow path and a wide variety of other reasons, such as
topography and contrasts in the hydraulic conductivity. The most important factor
determining the transport of radionuclides is the water balance of the system
(Haapanen et al. 2009).
1.1 Soil pits OL-KK14, OL-KK15, OL-KK16, OL-KK17, OL-KK18 and OL-KK19 The report summarises the geochemical and geotechnical properties of the soil pits
OL-KK14, OL-KK15, OL-KK16, OL-KK17, OL-KK18 and OL-KK19 investigated at
the Olkiluoto Island in 2008 (Figure 1). The aim was to get more information on the
soil stratigraphy and geochemistry in the geosphere-biosphere interface and for the
overburden modelling purposes.
The new soil pits OL-KK14, OL-KK15 and OL-KK16 situated in the different parts of
the Olkiluoto. The OL-KK14 located near the main Olkiluoto road and the shallow
groundwater tube OL-PP39 (Pitkänen et al. 2008a), close to the Liiklansuo mire. The
gravitation plate lysimeters were installed in the pit OL-KK14 by the Finnish Forest
Research Institute. The OL-KK15 situated in the north of island, near the harbor. It
situated close to birch-dominated forest soil and vegetation sampling plot and to the

4
surface field survey line 2. This surface field survey included surficial study (< 1 m
depth) of the soil type and of vegetation mapping during the summer 2008 (Haapanen
& Lahdenperä 2009). The OL-KK16 situated in the north-eastern part of the island,
beside the Rumminperäntie road, near the spruce-dominated forest soil and vegetation
sampling plot and the surface field survey line 3. The supervisor of the pits OL-
KK14...OL-KK16 was PhD, hydrogeochemist Anne-Maj Lahdenperä from Pöyry
Environment Oy.
The three soil pits OL-KK17, OL-KK18 and OL-KK19 were dug in the infiltration
experiment site (Pitkänen et al. 2008b); near the ONKALO underground rock
chracterisation facility and the Korvensuo freshwater reservoir of the power plant
(Figure 1). The supervisor of the pits OL-KK17…OL-KK19 was MSc, geologist
Susanna Lindgren from Posiva Oy. The gravitation plate lysimeters were also installed
in these pits by the Finnish Forest Research Institute. The soil water results are not
presented in this report.
1.2 Overburden properties at Olkiluoto
Due to continuous land uplift at Olkiluoto, currently at the rate of 6–6.8 mm/y (Eronen
et al. 1995, Kahma et al. 2001), about thousand years ago many of the initially small
islands were interconnected into a bigger island and the Olkiluoto Island has begun to
get its present shape (Mäkiaho 2005). The effects of the land uplift are accentuated by
a rather flat topography and anthropogenic eutrophication of the coastal Baltic Sea,
which increases primary production, and consequently accumulation of organic matter
especially in shallow bays. The development of the shoreline will induce changes in
the local biosphere conditions, such as biosphere succession, sediment redistribution
and groundwater flow. These will in turn influence soil properties and again the
positions of the groundwater recharge and discharge areas (Haapanen et al. 2007,
2009).
The bedrock of Olkiluoto mostly comprises high-grade metamorphic supracrustal
rocks. According to the mineral composition, texture and migmatite structure, the
rocks of Olkiluoto have been divided into following rock types: i) the metamorphic
rocks including various migmatitic gneisses and homogenous, banded or weakly
migmatised gneisses, such as mica gneisses, quartz gneisses, mafic gneisses and
tonalitic-granodioritic-granite gneisses and ii) the igneous rocks comprising abundant
pegmatite granites and sprodadic narrow diabase dykes (Kärki & Paulamäki 2006).
The bedrock surface is variable, but the ground surface is quite smooth, even in the
places where the bedrock topography changes abruptly. As a result of last glaciation
the bedrock depressions are filled with thicker layers of overburden, mainly sandy till
and fine-textured till (Lahdenperä et al. 2005). The other terrestrial sediment types are,
in order of abundance, fine sand, sand, silt and clay. The thickness of the overburden is
usually 2-4 meters, although even up to 12-16 meter thick layers have been observed.
Some Litorina and Ancylus clay areas exist in addition to the areas of recent mud cover
especially at the northern and southern side of island (Haapanen et al. 2009).
5
Olkiluoto Island is relatively flat, with the average elevation of Olkiluoto being about 5
m above sea level. The bedrock highpoints, which are not covered by the late glacial
deposits, protrude through the soil layers. The highest points of Olkiluoto Island are
Liiklankallio (18 m), Selkänummenharju (13 m) and Ulkopäänniemi (12 m)
(Lahdenperä et al. 2005). Most of these exposed rock surfaces are facing west, which
has been the direction of most effective wave action during the shoreline phase
(Seppälä 2005).
The predominant soil-forming process in Finland is podzolization of mineral soils,
leading to leached and acidic soils with an organic layer overlying the mineral soil;
peat soils with a peat layer of varying thickness (Histosols); very shallow soils
(Leptosols); young soils (Arenosols or Regosols) and fine-textured soils (Cambisols).
Soil classification and detailed soil reflect the development of specific soil (Lilja et al.
2006, Tamminen et al. 2007).
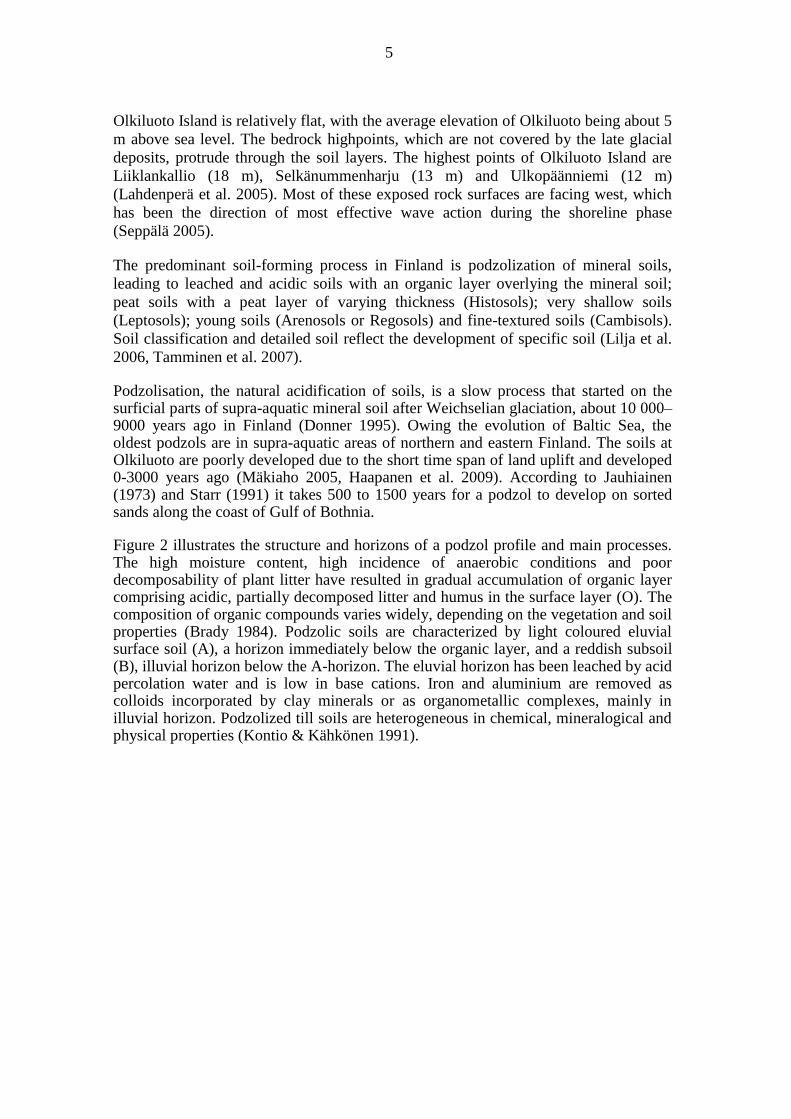
Podzolisation, the natural acidification of soils, is a slow process that started on the surficial parts of supra-aquatic mineral soil after Weichselian glaciation, about 10 000–9000 years ago in Finland (Donner 1995). Owing the evolution of Baltic Sea, the oldest podzols are in supra-aquatic areas of northern and eastern Finland. The soils at Olkiluoto are poorly developed due to the short time span of land uplift and developed 0-3000 years ago (Mäkiaho 2005, Haapanen et al. 2009). According to Jauhiainen (1973) and Starr (1991) it takes 500 to 1500 years for a podzol to develop on sorted sands along the coast of Gulf of Bothnia.
Figure 2 illustrates the structure and horizons of a podzol profile and main processes. The high moisture content, high incidence of anaerobic conditions and poor decomposability of plant litter have resulted in gradual accumulation of organic layer comprising acidic, partially decomposed litter and humus in the surface layer (O). The composition of organic compounds varies widely, depending on the vegetation and soil properties (Brady 1984). Podzolic soils are characterized by light coloured eluvial surface soil (A), a horizon immediately below the organic layer, and a reddish subsoil (B), illuvial horizon below the A-horizon. The eluvial horizon has been leached by acid percolation water and is low in base cations. Iron and aluminium are removed as colloids incorporated by clay minerals or as organometallic complexes, mainly in illuvial horizon. Podzolized till soils are heterogeneous in chemical, mineralogical and physical properties (Kontio & Kähkönen 1991).
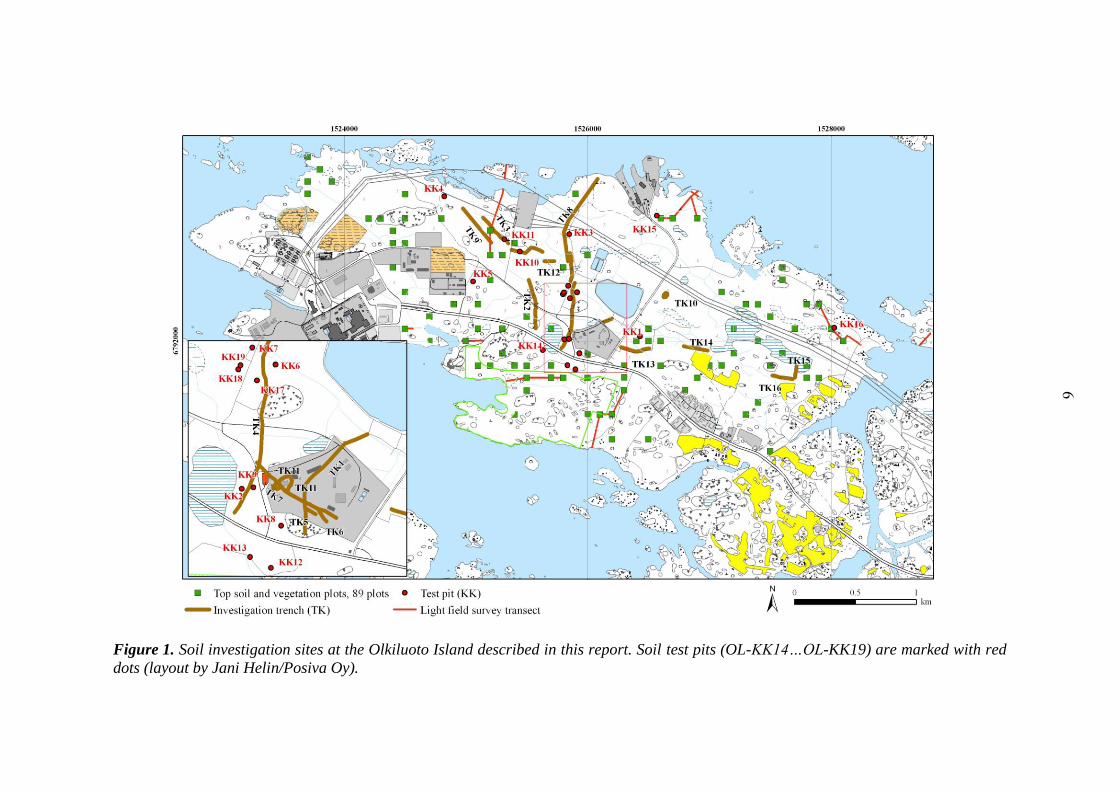
Figure 1. Soil investigation sites at the Olkiluoto Island described in this report. Soil test pits (OL-KK14…OL-KK19) are marked with red
dots (layout by Jani Helin/Posiva Oy).
6

7
Figure 2. Structure and horizons of a podzol profile: a) podzol profile and circulation of water, b) owing to electrolytes dissolved from the eluvial horizon, the pH of the runoff water increases in the illuvial horizon and transition zone, precipitating aluminium, iron and silicon compounds, c) cation exchange is most intense in the humus and eluvial horizons, and the chemical weathering of minerals in the transition zone and weakly altered parent material. Modified after Strahler (1970) and Jacks et al. (1984) by Teea Penttinen/Pöyry Environment Oy.
1.3 Earlier overburden studies at Olkiluoto Island
The current knowledge on overburden is based on several independent studies and no
systematic mapping covering the Olkiluoto area has been conducted. Direct point
observations are available from several sources, but they sites are mainly concentrated
on the central part of the island (Lintinen et al. 2003, Lintinen & Kahelin 2003, Posiva
2003, Lahdenperä et al. 2005, Huhta 2005, 2008, 2009). The following overburden
studies have been done since 1999 at Olkiluoto:
Data of overburden physical, mineralogical and chemical properties from the
deep soil pits OL-KK1…OL-KK13 (Figure 1), dug by excavator, and
investigated from different depths using standard procedures have been studied
by Hagros (1999), Lintinen et al. (2003), Lintinen & Kahelin (2003) and
summarised in Lahdenperä et al. (2005). The soils were sandy till, containing
some clay, sand, gravel and weathered layers. In some pits till was more stony
or compact, especially in deeper horizons. Two chemical digestions were used
for soil samples to evaluate different environmental conditions. In Table 1

8
some geochemical results digested by synthetic rainwater, organic matter and
water contents of the soil pits OL-KK6…OL-KK13 (Haapanen et al. 2009) are
presented. Synthetic rainwater used in Lintinen et al. (2003) and Lintinen &
Kahelin (2003) is weaker digestion than the ammonium acetate digestion used
for the analyses of OL-KK14-OL-KK19, thus the results are not fully
comparable.
Table 1. Geochemical and some geotechnical characteristics of mineral soil
samples from the surface horizons and C-horizons of the soil pits OL-KK6...OL-
KK13 extracted by synthetic rainwater at Olkiluoto. Median and in parentheses the
range of values (based on data from Lintinen et al. 2003, Lintinen & Kahelin
2003).
Variable Surface soil
horizons N C-horizon N
pH 6.5 (4.0-8.0) 19 7.5 (6.5-8.0) 8
Anions mg/kg
Cl <2-2.8 6 <2 2
F 1-2.0 6 <1-2.1 2
NO3 <2 6 <2 2
SO4 11.0 (1.7-19.0) 6 13.0-36.0 2
Cations mg/kg
Al 8.9 (0.6-24.4) 25 8.0 (0.6-15.2) 8
Ca 22.9 (6.4-79.6) 25 39.3 (18.5-118) 8
Cs <0.05 25 <0.05 8
Fe 9.0 (0.2-32.2) 25 7.2 (0.6-20.3) 8
K 10.9 (4.8-27.0) 25 22.2 (9.1-31.0) 8
Mg 4.8 (2.6-10.3) 25 5.8 (3.2-12.5) 8
Na 5.1 (2.8-14.0) 25 5.4 (4.1-9.4) 8
Sr 0.04 (0.001-1.4) 25 0.08 (0.02-0.2) 8
U 0.01 (<0.01-
0.08) 25
<0.01 (<0.01-
0.02) 8
Geotechnical
analyses
Water content
(weight-%) 9.5 (6.5-18.6) 25 10.9 (8.1-15.3) 8
Organic matter
% 1.1 (0.5-3.13) 25 1.0 (0.7-3.9) 8
The Laboratory of Radiochemistry of the University of Helsinki (HYRL)
carried out sorption studies for samples of the new soil pits OL-KK14-OL, OL-
KK15 KK16 in 2008 (Lusa et al. 2009). Supplementary samples were taken for
the separation of soil solution. The distribution coefficient, Kd, in addition of
the main elements and the main nuclides will be determined from these in situ
samples. In addition six profiles were taken for the 137
Cs determination. Also
mineralogical composition of the soil pits OL-KK14…OL-KK16 is reported in
Lusa et al. (2009).
Mainly for the bedrock charcterisation needs, the investigation trenches (OL-
TK1…OL-TK16) (Figure 1) have been mapped, but also the soil types and
groundwater level and essential overburden thickness have been studied in

9
some trenches (Huhta 2005, 2008, 2009, Lindberg & Paulamäki 2004,
Nordbäck 2007). Soil stratigraphy and soil types are investigated from the
trenches of OL-TK8, OL-TK9, OL-TK13, OL-TK14, OL-TK15 and OL-TK16.
Observations of disintegrated rock layers of rock debris between solid bedrock
and overburden were found along the investigation trenches e.g. OL-TK8, OL-
TK9 and OL-TK14. The depth of layers varied from some ten centimetres to 2-
3 meters. The layers were slightly chemically changed (so called
palarapakallio). The surface of broken bedrock was strongly weathered and
reddish brown in colour (Huhta 2005, 2008).
The comprehensive data set on estimated overburden thickness and interpreted
overburden type is collected with refraction seismic survey campaigns with
survey lines covering the whole Olkiluoto Island, and more detailed on a
central part of the island (Lehtimäki 2001, 2003).
A soil survey of 94 surface soil and vegetation plot sampling (Figure 1) was
carried out in 2005 (Tamminen et al. 2007). These plots were inventoried for
their humus, mineral soil (0–60 cm) and peat (0–30 cm) layers. According to
the survey, the most common soil types at Olkiluoto are weakly developed
(often at the beginning of podzolisation) coarse to medium coarse Arenosols or
fine-textured Regosols, shallow Leptosols and Gleysols characterised by
groundwater close to surface. Organic layer was classified in most cases as mor
or mull-like peat. In places, there was quite considerable amount of stones,
boulders, thin-covered soil with exposed bedrock.
On the basis of silvicultural inventory in 2003, the most common soil types at
the Olkiluoto Island area are fine-textured (53 %) and sandy (39 %) till. The
other types are gravelly till (4 %) and peat (3.4 %), in addition to one percent of
outcrops (Rautio et al. 2004).
In the summer 2008, a light surface field survey study (< 1 m depth) has been
carried out along five lines to verify the continuity/discontinuity between the
overburden and marine sediments at Olkiluoto (Figure 1). Each line was about
600 m in length with the soil survey being carried out every 25 m. Land
investigation included also the mapping of vegetation at the same sites.
According to the study, the soil types varied a lot; from stony shores to gyttja-
covered shores. Till was the main soil type, but in many places it was very
stony or thin. Rock outcrops were common. The results including a reed survey
at Olkiluoto inshore will be presented in Haapanen & Lahdenperä (2009).
Some Litorina and Ancylus clay areas exist in addition to the areas with mud
cover, mainly at the northern and southern side of the island (Rantataro 2001,
2002, Rantataro & Kaskela 2009). Mud/gyttja is stratified into the water and is
a mixture of decomposed plants, animals and fine-grained mineral soils. More
information on sea bed sediment distribution in the vicinity of the Olkiluoto
Island and the related sea area will be reported in (Rantataro & Kaskela 2009).
At Olkiluoto, the relative area of mires is less than the average for southwestern
Finland. The Olkiluodonjärvi mire is a typical young peatland, which is

10
initiated on an uplifted shore (current elevation is 1.5 m a.s.l, on average).
Primary mire formation was controlled by the shore displacement of the Baltic
Sea only some hundreds of years ago; the isolation occurred around 1491–1638
A.D. (Eronen et al. 1995, Vuorela et al. 2009). Geochemistry of four peat cores
has been investigated extending down to the upper part of till layer at the
Olkiluodonjärvi mire (Ikonen 2002, Lahdenperä et al. 2005). Ground-
penetrating radar probing was carried out on the Olkiluodonjärvi wetland area
in 2001 (Leino 2001). The aim was to map a thickness of peat layers and
overburden and to produce information on the degree of fracturing of the
bedrock’s surface part, if possible. However, the till was so conductive that
ground penetrating probing was not able to reach the bedrock surface.
In 2009, a project was launched to collect all available data on overburden
characteristics, especially thickness into a 3D model, and to be further interpreted
into a continuous stratigraphical volume model. The first version is planned to be
completed during the year 2009. In addition, this work will show the gaps in the
overburden data and advise the future overburden studies.

11
2 MATERIALS AND METHODS
2.1 Soil sampling and soil profile description
Altogether six soil pits were sampled in summer 2008: OL-KK14, OL-KK15, OL-
KK16, OL-KK17, OL-KK18 and OL-KK19, the three latter were located close to each
other in the infiltration experiment site (Pitkänen et al. 2008b). All the pits were dug by
excavator. The locations of the sampling sites are presented in Figure 1 and the site
descriptions are presented in Appendix 1. The coordinates of the soil pits are presented
in Table 2.
Table 2. Soil pit coordinates (in the KKJ system) sampled in 2008.
Soil pits Coordinates
Northing Easting
OL-KK14 6791912 1525631
OL-KK15 6793023 1526564
OL-KK16 6792149 1528049
OL-KK17 6792349 1525854
OL-KK18 6792383 1525796
OL-KK19 6792396 1525804
Samples were taken from vertical profiles of soil pits from humus and from two to five
different mineral horizons extending from soil surface down to bedrock, if possible.
Altogether 25 samples were analysed.
The bedrock was at the depth of 290-320 cm in OL-KK14…OL-KK16. The soil pits
(OL-KK17…OL-KK19) in the infiltration site were not dug down to bedrock. The
topography of the infiltration experiment site is very flat and only varies a few metres.
However, the topography of the bedrock surface seems to show a depression in NE-
SW direction (Pitkänen et al. 2008b). Earlier overburden surveys of the study site were
carried out in the autumn 2002 (Lintinen et al. 2003) and according to it, the
overburden thickness of the soil pits, OL-KK6 and OL-KK7, close to OL-KK17…OL-
KK19, varied from 2.0 m to 4.0 m.
The soil pit OL-KK14
The OL-KK14 situated near the Liiklansuo mire and the Olkiluoto main road. Also the
shallow groundwater drillhole (OL-PP39) (Pitkänen et al. 2008a) locates to the
northeastern side, close to pit. In the Figure 3 the soil profile of the OL-KK14 is
presented.

12
Figure 3. The soil profile of OL-KK14 (graphics Teea Penttinen/Pöyry Environment
Oy).
The soil was sandy till until 105 cm, and its bottom layer was very stony. Under these
layers was 135 cm thick homogenous, bluish clay layer. At the bottom 5-10 cm thick
weathered bedrock was found. The bedrock was pegmatitic granite. The groundwater
table was at around the depth of 240 cm and the yield of groundwater from the surface
of the bedrock was approximately 30 L/min. The gravitation plate lysimeters were
installed at the depths of 0-5 cm, 40 cm and 100 cm. The main tree species at the site
are pine, spruce and some birches and junipers. In the Figures 4 and 5 the soil profiles
of OL-KK14 are shown.

13
Figure 4. Soil profile of the excavator pit OL-KK14. Bluish homogenous clay layer is
seen at the bottom of the pit (photo by Anne-Maj Lahdenperä/Pöyry Environment Oy).
Figure 5. Excavator pit OL-KK14. The groundwater table was at the depth of 240 cm
(photo by Anne-Maj Lahdenperä/Pöyry Environment Oy).

14
The soil pit OL-KK15
The OL-KK15 situated in northern part of the island, in the end of the harbor road,
close to a birch-dominated soil and vegetation sampling plot and the light field survey
line 2 (Figure 1). In the Figure 6 the soil profile of the OL-KK15 is presented.
Figure 6. The soil profile of OL-KK15 (graphics Teea Penttinen/Pöyry Environment
Oy).
The surface layer under the humus was sand (7-50 cm). At the bottom of this layer
there were some marks of carboniferous layers. Under that was a 30 cm thick fine-
grained silty-clayish till layer. After that soil type changed to somewhat stratified fine
sand with some stones, under which a brownish and quite loose clay layer (30 cm
thick) with some sand lenses in the surface was found. At the bottom there was coarse-
grained sandy till until a depth of 300 cm. Bedrock was veined gneiss. In Figure 7 soil
profile of the excavator pit OL-KK15 is shown. Groundwater table was in the contact
of the overburden and bedrock. The main tree species in the site are young birches, but
there is also on old dense spruce forest close by.

15
Figure 7. Soil profile of the excavator pit OL-KK15 (photo by Anne-Maj Lahdenperä/
Pöyry Environment Oy).
The soil pit OL-KK16
The OL-KK16 is situated in the eastern part of the island, next to the Rumminperä
road. The site locates very close to spruce-dominated soil and vegetation sampling plot
and the light field survey line 3 (Haapanen & Lahdenperä 2009) (Figure 1). The
mineral soil surface layers until 110 cm were coarse sand, sand and fine to coarse sand.
At the bottom there was a 190 cm thick layer of sandy till with some big boulders and
stones. Also some rounded Satakunta sandstones were found. The bottom soil was
loose and moist indicating closeness of groundwater table. The bedrock (at 300 cm)
was veined gneiss/stromatic gneiss. The main tree species at the site is spruce with
some birches. In the Figures 8 and 9 the soil profile is presented.

16
Figure 8. The soil profile of OL-KK16 (graphics Teea Penttinen/Pöyry Environment
Oy).
Figure 9. Soil profile of the excavator pit OL-KK16 (photo by Anne-Maj Lahdenperä/
Pöyry Environment Oy.)

17
Soil pits OL-KK17, OL-KK18 and OL-KK19 at the infiltration experiment site
The soil pits OL-KK17, OL-KK18 and OL-KK19 were dug close to each other at the
infiltration experiment area (Pitkänen et al. 2008b), and near to the Korvensuo
freshwater reservoir, ONKALO underground rock chracterisation facility and the old
investigation trench OL-TK4 (Figure 1).
In the OL-KK17 the humus layer was thick (30 cm). The mineral surface layers were
sandy till. The sampled bottom soil layer was at the depth of 110 cm. Bedrock was not
reached. The gravitation plate lysimeters were installed into the depths of 10 cm, 40
cm and 100 cm by the Finnish Forest Research Institute. The vegetation is mixed
forest, with pine, spruce and birches. In the Figures 10 and 11 the soil profile is shown.
Figure 10. The soil profile of OL-KK17 (graphics Teea Penttinen/Pöyry Environment
Oy).

18
Figure 11. The thick (30 cm) humus horizon of the excavator pit OL-KK17 (photo by
Susanna Lindgren/Posiva Oy).
In the pit OL-KK18 the humus layer was thick (20 cm). The mineral soil down to 200
cm was clayey till with stones up to 0.5-1 m in diameter. At the depth of 200-220 cm
there was a grey and tight clay layer. The bedrock was not reached. The gravitation
plate lysimeter was installed at the depth of 200 cm. The vegetation at the site is mixed
forest. The soil profile of the excavator pit OL-KK18 is presented in Figures 12 and 13.

19
Figure 12. The soil profile of OL-KK18 (graphics Teea Penttinen/Pöyry Environment
Oy).
Figure 13. The soil profile of the excavator pit OL-KK18 and installation of lysimeters
by the Finnish Forest Research Institute (photo by Susanna Lindgren/Posiva Oy).

20
The soil pit OL-KK19 is situated about 10 m north from OL-KK18. The humus layer
was about as thick (20 cm). The mineral soil down to 200 cm was clayey till with
stones up to 0.5-1 m in diameter also here. At the depth of 200-235 cm there was grey
and tight clay layer. The gravitation plate lysimeters were installed at the depth of 220
cm. The bedrock was not reached. The soil profile of the excavator pit OL-KK19 is
presented in Figures 14 and 15. The vegetation is mixed forest.
Figure 14. The soil profile of OL-KK19 (graphics Teea Penttinen/Pöyry Environment
Oy).

21
Figure 15. The soil profile of the excavator pit OL-KK19 (top) and a part of the profile
with a big stone at the depth of 185-200 cm (bottom) (photo by Susanna
Lindgren/Posiva Oy).

22
2.2 Analysis of the samples
Chemical analysis
The main chemical analyses (Table 3) were done in the laboratory of Labtium Ltd.
Total organic carbon (TOC) analyses for the humus layers of OL-KK14, OL-KK15
and OL-KK16 were done in the Nablab laboratory. The samples were cold-dried at
<40oC and sieved to a <2 mm fraction (ISO/DIS 11464). The results of the
geochemical analyses are presented in Appendix 2, and the detection limits for
analysed elements in Appendix 3.
The pH was determined by using CaCl2 extraction. Using a dilute CaCl2 solution will
probably give more consistent results than using rainwater or diluted water. When the
soil is diluted with water, most of the H+ ions tend to remain attracted to the soil
particles and are not released into the soil solution. The addition of small amounts of
calcium chloride provides Ca2+
ions to replace some of the H+ ions on the soil particles,
forcing the hydrogen ions into the solution and making their concentration in the bulk
solution closer to that found in the field. The pH measured in CaCl2 is almost always
lower than pH of the same soil measured in water due to the higher concentration of
H+. The procedure gives a value similar to that for natural soil solution because the soil
solution also contains dissolved Ca2+
and other ions (e.g. Derome 2003).
Carbon contents were analysed by carbon analyser and nitrogen contents by carbon-
nitrogen analyser (Appendix 2). Total organic carbon (TOC) from the humus layers of
OL-KK14, OL-KK15 and OL-KK16 was analysed by TOC-analyser. The analyser
determines TOC by subtracting the measured inorganic carbon (IC) from the measured
total carbon value (TC)
The concentrations of the main elements (multi-element analysis) of the easily
leachable/bioavailble fraction of humus and mineral soil samples were measured with
partial dissolution, buffered by 1.0 M NH4Ac (NH4Ac-CH4COO; ratio of solution
1:10) digested at pH 4.5, and measured using ICP-MS/CP-OES. The cation exchange
capacity (CEC) was determined as a sum of concentrations of base cations
(Ca+Mg+Na+K), aluminium and iron. CEC is given in mmol/kg. The corresponding
buffer capacity was determined as a base saturation (BS %), i.e. the percentage of base
cations in the CEC.
The total concentrations of the humus and mineral soil layers were measured by
hydrofluoric acid-perchloric acid digestion (ratio of solution 5:1) using the ICP-
MS/ICP-OES-technique.
The analyses of Se and I were carried out by ALS Laboratory Group in Luleå, Sweden.
The samples were dried at 105 oC according to the Swedish standard SS028113.
Digestion was performed on non-dried samples in closed Teflon vessels in microwave
oven with HNO3 + H2O. Determination of iodine (I) was performed after digestion
using ICP-SFMS. Determination of selenium (Se) was performed after digestion,
reduction with HCl and hydride generation with ICP-SFMS.

23
Table 3. Analysed parameters, methods and used standards.
Parameter Unit Method Standard Number of
samples
pH CaCl2 extraction
ISO10390
SFS ISO 10390 25
Loss on ignition (LOI) mass-% Gravimetrically
at 550oC
CEN 15407 25
Moisture and dry
matter content
mass-% Gravimetrically
at 105oC
ISO 11465 25
Carbon mass-%dw Carbon analyser CEN 15104 25
Nitrogen mass-%dw Carbon-nitrogen
analyser
ISO 13878, CEN
15104
25
Total organic carbon mass-% TOC- analyser.
SFS-EN 13137 3
Iodine mg/kgdw ICP-SFMS 25
Selenium mg/kgdw ICP-SFMS 25
1) Multi-element
analysis with
ammonium acetate
(NH4 Ac) extraction,
pH 4.5)
mg/kgdw ICP-MS/ICP-
OES-technique
SFS-EN-
ISO17294-2 and
SFS-EN-ISO
11885
25
2) Multi-element
analysis with
hydrofluoric acid -
perchloric acid
extraction
mg/kgdw ICP-MS/ICP-
OES-technique
SFS-EN-ISO
17294-2 and SFS-
EN-ISO 11885
25
Grain size distribution % Dry-sieving and
sedigraph-
analysis
ISO 3310/1 19
Mineralogy X-ray diffraction
analyser
13
1) Analysed elements: Al, As, B, Ba, Ca, Cd, Co, Cr, Cu, Fe, K, Li, Mg, Mn, Mo, Na, Ni, P, Pb, S, Sb,
Sr, Ti, V, Zn
2) Analysed elements: Al, As, Ba, Be, Bi, Ca, Cd, Co, Cr, Cu, Fe, K, Li, Mg, Mn, Mo, Na, Ni, P, Pb,
Rb, S, Sb, Sr, Ti, V, Zn, Zr
Grain-size distribution and mineralogy
Grain-size analyses of >0.063 mm particles were carried out by dry sieving the
samples by mechanical sieve shaker (ISO3310/1). The sieve apertures used were 20
mm, 2 mm, 0.63 mm, 0.2 mm and 0.063 mm. Grain size analyses of <0.063-mm
particles was carried out by using Sedigraph 5100 instrument. Results of sieving and
sedigraph analyses were combined at 0.063 mm for grain-size distribution graphs. The
grain size distribution for the OL-KK14…OL-KK19 was done at the Geological
Survey of Finland and at the Labtium Ltd. laboratory.
The mineralogical composition was determined by X-ray diffraction analyser (Philips X´Pert MPD) in Labtium Ltd. laboratory. The results of soil samples OL-KK14…OL-KK16 are reported in Lusa et al. 2009. Mineralogical analyses of the soil pits OL-KK17…OL-KK19 were not available.

24
25
3 RESULTS
3.1 Geochemical and geotechnical analyses
3.1.1 Basic properties
As a result of weathering and buffering processes, the pH of the percolating water
gradually increases as it passes through deeper horizons. The greatest deviations in soil
pH are due to variation in humus and clay contents (e.g. Räisänen 1989, Kähkönen
1996). In addition, soil pH values are also affected by the organic and inorganic humic
and fulvic acids produced by biological activity (Nuotio et al. 1990, Räisänen 1989).
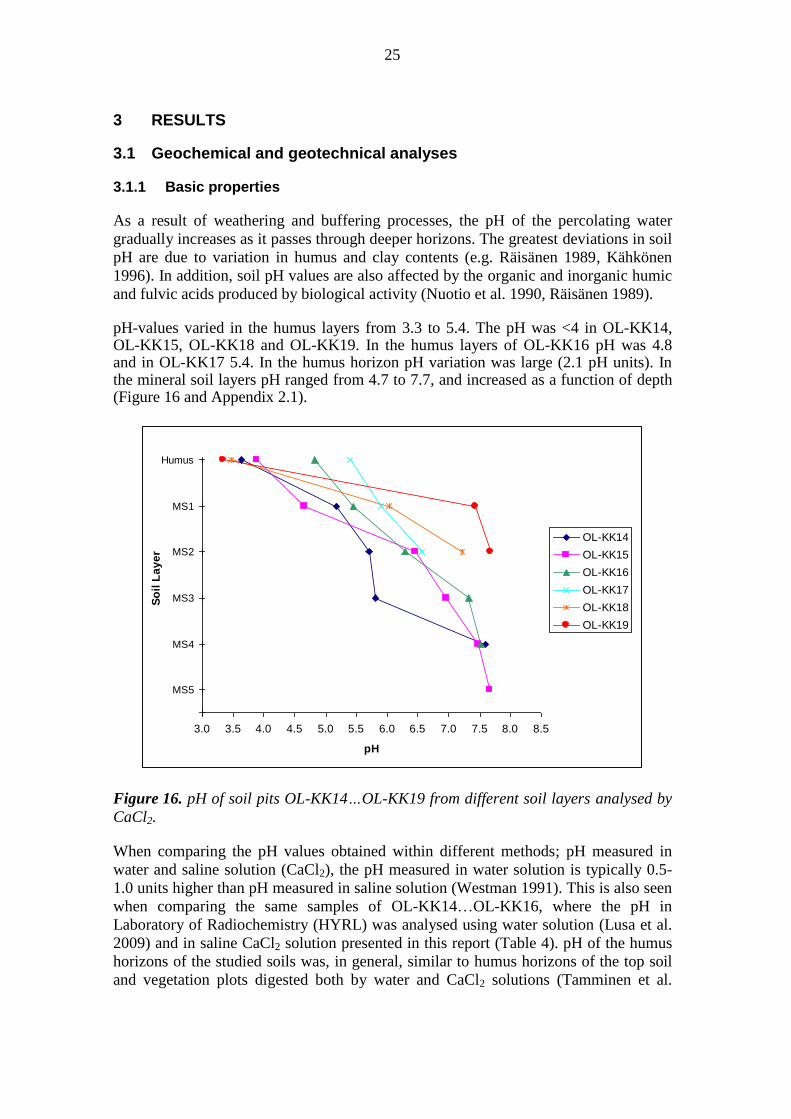
pH-values varied in the humus layers from 3.3 to 5.4. The pH was <4 in OL-KK14, OL-KK15, OL-KK18 and OL-KK19. In the humus layers of OL-KK16 pH was 4.8 and in OL-KK17 5.4. In the humus horizon pH variation was large (2.1 pH units). In the mineral soil layers pH ranged from 4.7 to 7.7, and increased as a function of depth (Figure 16 and Appendix 2.1).
Humus
MS1
MS2
MS3
MS4
MS5
3.0 3.5 4.0 4.5 5.0 5.5 6.0 6.5 7.0 7.5 8.0 8.5
pH
So
il L
ay
er
OL-KK14OL-KK15OL-KK16OL-KK17OL-KK18OL-KK19
Figure 16. pH of soil pits OL-KK14…OL-KK19 from different soil layers analysed by
CaCl2.
When comparing the pH values obtained within different methods; pH measured in
water and saline solution (CaCl2), the pH measured in water solution is typically 0.5-
1.0 units higher than pH measured in saline solution (Westman 1991). This is also seen
when comparing the same samples of OL-KK14…OL-KK16, where the pH in
Laboratory of Radiochemistry (HYRL) was analysed using water solution (Lusa et al.
2009) and in saline CaCl2 solution presented in this report (Table 4). pH of the humus
horizons of the studied soils was, in general, similar to humus horizons of the top soil
and vegetation plots digested both by water and CaCl2 solutions (Tamminen et al.

26
2007). The pH of studied mineral soil layers was not comparable because soil samples
were taken from different and deeper depths than top soil plot layers.
Table 4. pH-value comparison of the soil sample results analysed by CaCl2 reported
here and by H2O reported by Lusa et al. (2009).
Sample OL-KK14
OL-KK14
(Lusa et
al. 2009)
OL-KK15
OL-KK15
(Lusa et al.
2009)
OL-KK16
OL-KK16
(Lusa et
al. 2009)
Humus 3.6 4.4 3.9 4.2 4.8 5.0
MS1 5.2 5.2 4.7 5.9 5.4 6.5
MS2 5.7 6.5 6.4 6.5 6.3 7.1
MS3 5.8 6.7 7.0 7.7 7.3 7.7
MS4 7.6 8.1 7.5 8.0 7.5 8.6
MS5 - - 7.7 8.6 - -
- Not sampled
The dry matter content increased as a function of depth, varying in the humus horizons
from 49.8 mass-% to 69.1 mass-% and in the bottom soil layers from 88.8 mass-% to
99.6 mass-% (Figure 17). The organic matter and moisture contents decreased as a
function of depth. The organic matter, measured by loss on ignition (LOI), varied quite
a lot in the humus layers, from 15.8 mass-% (OL-KK19) to 58.5 mass-% (OL-KK16)
(Figure 18). Also the moisture content varied in the humus horizons, being lowest
(30.9 mass-%) in OL-KK19 and highest (50.2 mass-%) in OL-KK18 (Figure 19). In
the mineral soil layers LOI was mainly <1 mass-%. Total organic carbon (TOC)
concentrations of the humus horizons OL-KK14…OL-KK16 varied from 22 % to 32
%. The TOC analyses of OL-KK17…OL-KK19 were not available. The pH, dry and
organic matter, TOC, LOI and moisture content are presented in Appendix 2.1.
The carbon content in the humus layers ranged from 9.9 % (OL-KK19) to 31.9 % (OL-KK18). Although these sites situated close to each other there was a three fold difference in the carbon content. In the humus horizon of the OL-KK17, carbon content was 26.3 %. In the mineral soils layers C content was <1 % (Figure 20). The nitrogen content in the humus horizons ranged from 0.29 % (OL-KK19) to 2.02 % (OL-KK16). In the mineral soil layers nitrogen content was low or under the detection limits (Figure 21). C/N ratio in the humus horizon varied from 15.7 % (OL-KK16) to 34.1 % (OL-KK19) (Table 5). Generally the values correspond to the results reported in Tamminen et al. (2007).

27
Humus
MS1
MS2
MS3
MS4
MS5
40 45 50 55 60 65 70 75 80 85 90 95 100
Dry Matter Content %
So
il L
ayer
OL-KK14
OL-KK15
OL-KK16
OL-KK17
OL-KK18
OL-KK19
Figure 17. Dry matter content (mass-%) of soil pits OL-KK14…OL-KK19 from
different soil layers.
Humus
MS1
MS2
MS3
MS4
MS5
0 5 10 15 20 25 30 35 40 45 50 55 60
Organic Matter %
So
il L
ay
er
OL-KK14OL-KK15OL-KK16OL-KK17OL-KK18OL-KK19
Figure 18. Organic matter content (mass-%dw) of soil pits OL-KK14…OL-KK19 from
different soil layers.

28
MS5
MS4
MS3
MS2
MS1
Humus
0 5 10 15 20 25 30 35 40 45 50 55
Moisture %
So
il L
ay
er
OL-KK14OL-KK15OL-KK16OL-KK17OL-KK18OL-KK19
Figure 19. Moisture content (mass-%) of soil OL-KK14…OL-KK19 from different soil
layers.
Humus
MS1
MS2
MS3
MS4
MS5
0 5 10 15 20 25 30 35
Carbon %
So
il L
ayer
OL-KK14
OL-KK15
OL-KK16
OL-KK17
OL-KK18
OL-KK19
Figure 20. Carbon content (%dw) of soil pits OL-KK14…OL-KK19 from different soil
layers.

29
Humus
MS1
MS2
MS3
MS4
MS5
0 0.2 0.4 0.6 0.8 1 1.2 1.4 1.6 1.8 2 2.2
Nitrogen %
So
il L
ay
er
OL-KK14OL-KK15OL-KK16OL-KK17OL-KK18OL-KK19
Figure 21. Nitrogen content (-%dw) of soil pits OL-KK14…OL-KK19 from different
soil layers.
Table 5. Carbon, nitrogen and ratio of C and N in soil pits OL-KK14…OL-KK19 in
different depths.
Sample Sample
layer
Sampling
depth (cm)
Carbon
mass- %dw
Nitrogen
mass-%dw C/N
OL-KK14
Humus 0-5 30.5 1.42 21.5
MS1 5-20 0.20 <0.03 -
MS2 20-60 0.27 0.04 6.75
MS3 60-105 0.13 <0.03 -
MS4 105-240 0.18 <0.03 -
OL-KK15
Humus 0-7 21.9 1.18 18.6
MS1 7-50 0.22 0.04 5.50
MS2 50-80 0.33 0.04 8.25
MS3 80-110 0.18 <0.03 -
MS4 110-160 0.23 0.03 7.67
MS5 160-300 0.14 <0.03 -
OL-KK16
Humus 0-10 31.8 2.02 15.7
MS1 10-30 0.64 0.07 9.14
MS2 30-50 0.14 <0.03 -
MS3 50-110 0.13 <0.03 -
MS4 110-300 0.13 <0.03 -
OL-KK17
Humus 0-30 26.3 0.98 26.8
MS1 30-46 0.41 0.05 8.20
MS2 46-82 0.12 <0.03 -
OL-KK18
Humus 0-20 31.9 1.17 27.3
MS1 20-200 0.07 <0.03 -
MS2 200-220 0.18 <0.03 -
OL-KK19
Humus 0-20 9.89 0.29 34.1
MS1 20-200 0.11 <0.03 -
MS2 200-235 0.14 <0.03 -
- Not determined; nitrogen concentration under the detection limit
30
3.1.2 Main exchangeable nutrients
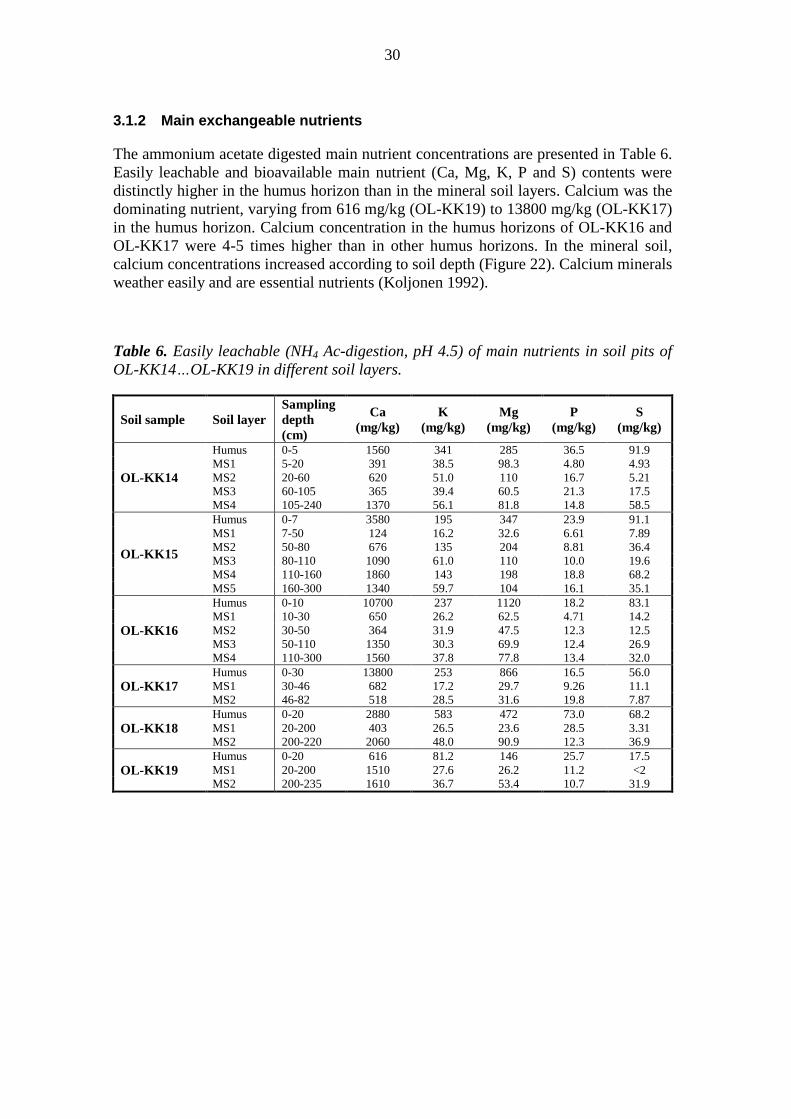
The ammonium acetate digested main nutrient concentrations are presented in Table 6.
Easily leachable and bioavailable main nutrient (Ca, Mg, K, P and S) contents were
distinctly higher in the humus horizon than in the mineral soil layers. Calcium was the
dominating nutrient, varying from 616 mg/kg (OL-KK19) to 13800 mg/kg (OL-KK17)
in the humus horizon. Calcium concentration in the humus horizons of OL-KK16 and
OL-KK17 were 4-5 times higher than in other humus horizons. In the mineral soil,
calcium concentrations increased according to soil depth (Figure 22). Calcium minerals
weather easily and are essential nutrients (Koljonen 1992).
Table 6. Easily leachable (NH4 Ac-digestion, pH 4.5) of main nutrients in soil pits of
OL-KK14…OL-KK19 in different soil layers.
Soil sample Soil layer
Sampling
depth
(cm)
Ca
(mg/kg)
K
(mg/kg)
Mg
(mg/kg)
P
(mg/kg)
S
(mg/kg)
OL-KK14
Humus 0-5 1560 341 285 36.5 91.9
MS1 5-20 391 38.5 98.3 4.80 4.93
MS2 20-60 620 51.0 110 16.7 5.21
MS3 60-105 365 39.4 60.5 21.3 17.5
MS4 105-240 1370 56.1 81.8 14.8 58.5
OL-KK15
Humus 0-7 3580 195 347 23.9 91.1
MS1 7-50 124 16.2 32.6 6.61 7.89
MS2 50-80 676 135 204 8.81 36.4
MS3 80-110 1090 61.0 110 10.0 19.6
MS4 110-160 1860 143 198 18.8 68.2
MS5 160-300 1340 59.7 104 16.1 35.1
OL-KK16
Humus 0-10 10700 237 1120 18.2 83.1
MS1 10-30 650 26.2 62.5 4.71 14.2
MS2 30-50 364 31.9 47.5 12.3 12.5
MS3 50-110 1350 30.3 69.9 12.4 26.9
MS4 110-300 1560 37.8 77.8 13.4 32.0
OL-KK17 Humus 0-30 13800 253 866 16.5 56.0
MS1 30-46 682 17.2 29.7 9.26 11.1
MS2 46-82 518 28.5 31.6 19.8 7.87
OL-KK18 Humus 0-20 2880 583 472 73.0 68.2
MS1 20-200 403 26.5 23.6 28.5 3.31
MS2 200-220 2060 48.0 90.9 12.3 36.9
OL-KK19 Humus 0-20 616 81.2 146 25.7 17.5
MS1 20-200 1510 27.6 26.2 11.2 <2
MS2 200-235 1610 36.7 53.4 10.7 31.9

31
Humus
MS1
MS2
MS3
MS4
MS5
0 2000 4000 6000 8000 10000 12000 14000 16000
Ca (mg/kg)
So
il L
ay
er
OL-KK14OL-KK15OL-KK16OL-KK17OL-KK18OL-KK19
Figure 22. Easily leachable calcium concentrations of OL-KK14…OL-KK19 in
different soil layers.
Magnesium concentrations varied from 146 mg/kg (OL-KK19) to 1120 mg/kg (OL-
KK16) in the humus horizons and in the mineral soil layers from 23.6 mg/kg to 204
mg/kg (Figure 23). The Mg concentration was highest in the humus horizons of OL-
KK16 and OL-KK17, following the pattern of calcium. Magnesium minerals weather
quite easily, with dissolved magnesium being removed from solution, mostly into clay
minerals. Potassium concentrations varied from 81.2 mg/kg (OL-KK19) to 583 mg/kg
(OL-KK18) in the humus horizons, although these soil pits situated close to each other
in the infiltration experiment site. In the mineral soil potassium concentrations varied
from 16.2 mg/kg (OL-KK15) to 143 mg/kg (OL-KK15) (Figure 24). Dissolved
potassium is adsorbed from solutions onto colloids and is enriched in clays.

32
Humus
MS1
MS2
MS3
MS4
MS5
0 100 200 300 400 500 600 700 800 900 1000 1100 1200
Mg (mg/kg)
So
il L
ay
er
OL-KK14OL-KK15OL-KK16OL-KK17OL-KK18OL-KK19
Figure 23. Easily leachable magnesium concentrations of OL-KK14…OL-KK19 in
different soil layers.
Humus
MS1
MS2
MS3
MS4
MS5
0 50 100 150 200 250 300 350 400 450 500 550 600 650
K (mg/kg)
So
il L
ay
er
OL-KK14OL-KK15OL-KK16OL-KK17OL-KK18OL-KK19
Figure 24. Easily leachable potassium concentrations of OL-KK14…OL-KK19 in
different soil layers.

33
Sulphur is a non-metalic element, which in nature occurs in oxidation states -2 (+3), +4
(+5) and +6, and thus it is distributed in a highly heterogeneous manner (Koljonen
1992). Sulphur is also an essential non-toxic nutrient, in some extent. Sulphur
concentrations are highest at the Finnish coast, where sulphide and sulphur bearing
clays are common (Erviö 1975, Ojala et al. 2007, Palko 1994).
Sulphur concentrations were enriched in the humus horizons. Concentration varied
from 17.5 mg/kg (OL-KK19) to 91.9 - 91.1 mg/kg (OL-KK15 and OL-KK14) in the
humus horizons and in the mineral soil layers from <2 mg/kg to 68.2 mg/kg (Figure
25). In OL-KK16…OL-KK19 sulphur concentrations increased according to the depth.
In OL-KK14 and OL-KK-15 sulphur was enriched in the mineral soil layers MS4,
where the heavy metal concentrations of arsenic, cobalt, copper and lead
concentrations were high. Sulphur occurs mainly as sulphides (FeS2, FeS, CuFeS2,
PbS, FeAsS). The most of the sulphides are the main sources for the sulphur in the
overburden.
Phosphorus occurs in several minerals as diluted calcium, aluminum and iron
phosphates and organic compounds. Natural phosphorus in soils only appears in small
amounts and in a diluted state they are washed away gradually from the soil (Kabata-
Pendias & Pendias 1992). Phosphorus concentrations varied from 16.5 mg/kg (OL-
KK17) to 73 mg/kg (OL-KK18) in the humus horizons, and in the mineral soil layers
from 4.7 mg/kg to 28.5 mg/kg (Figure 26). In the mineral soil layers of OL-
KK14…OL-KK16 phosphorus concentrations increased according to the depth.
Humus
MS1
MS2
MS3
MS4
MS5
0 10 20 30 40 50 60 70 80 90 100
S (mg/kg)
So
il L
ay
er
OL-KK14OL-KK15OL-KK16OL-KK17OL-KK18OL-KK19
Figure 25. Easily leachable sulphur concentrations of OL-KK14…OL-KK19 in
different soil layers.

34
Humus
MS1
MS2
MS3
MS4
MS5
0 10 20 30 40 50 60 70 80
P (mg/kg)
So
il L
ay
er
OL-KK14OL-KK15OL-KK16OL-KK17OL-KK18OL-KK19
Figure 26. Easily leachable phosphorus concentrations of OL-KK14…OL-KK19 in
different soil layers.
3.1.3 Easily leachable trace elements
The concentrations of easily leachable main trace elements are presented in Table 7. Copper (Cu) is an essential trace-element and nutrient, but toxic in excess. Copper concentrations varied from 0.37 mg/kg (OL-KK18) to 1.57 mg/kg (OL-KK15) in the humus horizons. In the mineral soil layers the variation was from 0.37 mg/kg to 2.72 mg/kg, being highest in the deepest soils layers, in general.
Molybdenum (Mo) is an essential nutrient, moderately toxic, which participates in
redox reactions. Molybdenite (MoS2) is highly resistant to weathering and is poorly
soluble in acid environment. In dissolved form it rapidly removes from solutions and is
adsorbed into clays, and especially into sediments rich in organic matter (Kabata-
Pendias & Pendias 1992). Molybdenum concentrations were in most cases under the
detection limit (<0.03 mg/kg).
The geochemistry of iron (Fe) is complex in the terrestrial system. The reactions of Fe
in processes of weathering are dependent largely on the Eh-pH system of the
environment and on the stage of oxidation of the Fe compounds involved. In oxidizing
and alkaline conditions the mobilization and fixation of Fe promote the precipitation of
Fe, whereas acid and reducing conditions promote the solution of Fe compounds. Both
mineral and organic compounds of Fe are easily transformed in soils, and organic
matter appears to have significant influence on the formation of Fe oxides. Like Mn
compounds in soils, Fe compounds are greatly involved in the behavior of some
macronutrients and many of trace elements. The degree to which Fe is responsible for
trace metal solubility and availability is strongly governed by several soil factors

35
(Kabata-Pendias & Pendias 1992). The Fe content of soils is both inherited from parent
rock material and the result of soil formation processes. Both Fe uptake and transport
between plant organs are highly affected by several environmental factors, of which
soil pH, concentration of Ca and P, and ratios of several heavy metals are most
pronounced (Kabata-Pendias & Pendias 1992). Easily leachable iron concentrations
were the highest in the humus horizons and varied from 345 mg/kg (OL-KK19) to
2230 mg/kg (OL-KK15), except in the OL-KK17 and OL-KK18, where the Fe
concentration was enriched in subsoil layers. In the mineral soil layers Fe
concentration varied from 9.4 mg/kg to 249 mg/kg. The generally highest iron
concentrations were in OL-KK14 and OL-KK15 (Figure 27).
Table 7. Easily leachable/plant available (NH4 Ac-digestion, pH 4.5) of main trace
elements in soil pits of OL-KK14…OL-KK19 in different soil depths.
Soil
sample
Soil
layer
Sampling
depth
(cm)
Cu
(mg/kg)
Mo
(mg/kg)
Fe
(mg/kg)
Mn
(mg/kg)
Na
(mg/kg)
Zn
(mg/kg)
OL-
KK14
Humus 0-5 1.04 <0.03 1030 27.4 49.0 22.6
MS1 5-20 0.64 <0.03 106 1.83 8.76 0.31
MS2 20-60 0.91 <0.03 80.0 2.12 9.25 0.30
MS3 60-105 1.18 <0.03 83.4 3.61 4.43 0.45
MS4 105-240 2.07 0.03 147 44.3 4.16 0.96
OL-
KK15
Humus 0-7 1.57 0.04 2230 7.47 32.0 2.81
MS1 7-50 0.60 0.06 90.4 2.87 3.07 0.36
MS2 50-80 2.72 <0.03 189 14.0 24.9 1.07
MS3 80-110 0.94 <0.03 128 16.9 12.3 0.53
MS4 110-160 2.33 0.07 224 62.4 19.1 1.16
MS5 160-300 1.40 0.05 85.7 29.2 9.79 0.81
OL-
KK16
Humus 0-10 1.02 <0.03 427 7.89 84.6 9.73
MS1 10-30 0.64 0.03 249 0.46 6.27 0.16
MS2 30-50 1.36 <0.03 112 2.02 3.88 0.87
MS3 50-110 1.11 <0.03 62.3 22.0 4.34 0.60
MS4 110-300 2.36 0.05 91.5 33.5 5.35 0.66
OL-
KK17
Humus 0-30 0.51 <0.03 19.7 61.6 46.6 12.2
MS1 30-46 0.37 <0.03 9.36 1.70 <3 0.13
MS2 46-82 1.16 <0.03 52.7 2.56 6.01 0.21
OL-
KK18
Humus 0-20 0.37 <0.03 18.7 153 19.1 43.0
MS1 20-200 0.53 <0.03 40.2 2.99 3.44 0.38
MS2 200-220 2.02 0.03 123 43.3 4.33 0.76
OL-
KK19
Humus 0-20 0.53 <0.03 345 7.51 10.8 8.00
MS1 20-200 0.71 <0.03 44.7 14.5 <3 0.79
MS2 200-235 1.69 0.03 52.8 23.8 <3 0.38

36
Humus
MS1
MS2
MS3
MS4
MS5
0 500 1000 1500 2000 2500
Fe (mg/kg)
S
oil L
ayer
OL-KK14OL-KK15OL-KK16OL-KK17OL-KK18OL-KK19
Figure 27. Easily leachable iron concentrations of OL-KK14…OL-KK19 in different
soil layers.
Manganese (Mn) is one of the most abundant trace elements. The highest
concentrations are associated with mafic rocks. The behavior of Mn in surfical deposits
is complex and is governed by different environmental factors, of which Eh-pH
conditions are the most important. All Mn compounds are important soil constituents
because this element is essential in plant nutrition and controls the behavior of several
other micronutrients. Mn-rich precipitates occur as crusts and layers in soils.
Manganese is a non-toxic nutrient, which participates in redox reactions in organisms
(Kabata-Pendias & Pendias 1992). Manganese concentrations are low (< 500 mg/kg) in
areas of eastern and southern Finland were granites and gneisses are predominant
(Koljonen 1992). At Olkiluoto the manganese concentrations were low. In the humus
horizons Mn concentrations varied from 7.47 mg/kg (OL-KK15) to 153 mg/kg (OL-
KK18) and in the mineral soil layers from 0.46 mg/kg to (OL-KK16) 62.4 mg/kg (OL-
KK15). Generally, manganese concentrations increased with the function of depth.
Owing to high reactivity, sodium (Na) is found in nature only as a compound and not
as a free element. With aluminum, sodium forms silicates and in bedrock it is mostly
incorporated in feldspars. Dissolved sodium remains in solution in ion form and is
removed to the seas, where it adds to the salinity. The distribution of sodium is similar
to that of calcium, showing that these elements occur together, in plagioclases
(Koljonen 1992). Na concentrations were highest in the humus horizons, varying from
10.8 mg/kg (OL-KK19) to 84.6 mg/kg (OL-KK16). The OL-KK16 located closest to
the sea in the northern part of the island. In the mineral soil layers Na concentrations
varied from <3 mg/kg to 24.9 mg/kg.

37
The solubilisation of zinc (Zn) minerals during weathering produces mobiles Zn2+
,
especially in acid, oxidizing environments. Zn is, however, also adsorbed by organic
components and thus, its accumulation in the surface horizons is observed. Soil organic
matter is known to be capable of bonding Zn into stabile forms, therefore,
accumulation of Zn in organic soil horizon and peat is usually observed. Zn is
considered to be readily soluble relative to the other heavy metals in soils. Soluble
forms of Zn are readily available to plants. The composition of the nutrient solution,
particularly the presence of Ca is a great importance (Kabata-Pendias & Pendias 1992,
Koljonen 1992). The Zn concentration was clearly higher in the humus horizons than
in mineral soil layers, and varied from 2.81 mg/kg (OL-KK15) to 43 mg/kg (OL-
KK18). In the mineral soil layers variation was from 0.13 mg/kg to 1.16 mg/kg (Figure
28).
MS5
MS4
MS3
MS2
MS1
Humus
0 10 20 30 40 50
Zn (mg/kg)
S
oil
La
ye
r
OL-KK14OL-KK15OL-KK16OL-KK17OL-KK18OL-KK19
Figure 28. Easily leachable zinc concentrations of OL-KK14…OL-KK19 in different
soil layers.
3.1.4 Main trace elements in total digestion
The main trace metal concentrations analysed after total dissolution in strong mineral
acids (hydrofluoric acid – perchloric acid digestion) are presented in Table 8. The
method digests into solution most of the elements incorporated in silicates, oxides,
carbonates, sulphates and phosphates. The copper (Cu) was enriched in humus, ranging
from 16.0 mg/kg (OL-KK19) to 71.3 mg/kg (OL-KK17). In the mineral soil layers the
Cu concentrations varied from 7.5 mg/kg to 29.8 mg/kg. Molybdenum (Mo)
concentrations were low; the highest (4.15 mg/kg) was in the humus horizon of OL-
KK15. In most cases Mo concentrations were under the detection limit.

38
The iron (Fe) concentration varied from 5970 mg/kg (OL-KK18) to 31800 mg/kg (OL-
KK14). The highest concentrations were found in the mineral soil layers of MS1 and
MS2 in all soil pits. In the soil profiles manganese (Mn) concentrations varied from 89
mg/kg to 604 mg/kg and Mn concentration pattern followed that of iron. Sodium (Na)
concentration varied from 3840 mg/kg to 15800 mg/kg, being lowest in the humus
horizons. Zinc (Zn) concentrations varied from 25.6 mg/kg to 112 mg/kg in soil layers.
In OL-KK14…OL-KK16 and OL-KK19 Zn concentrations followed the pattern of Fe
and Mn.
Table 8. Total concentrations (hydrofluoric acid-perchloric acid digestion) of main
trace elements in soil pits OL-KK14…OL-KK19 in different soil layers.
Soil
sample
Soil
layer
Sampling
depth
(cm)
Cu
(mg/kg)
Mo
(mg/kg)
Fe
(mg/kg)
Mn
(mg/kg)
Na
(mg/kg)
Zn
(mg/kg)
OL-KK14
Humus 0-5 65.0 1.2 10900 103 4730 60.9
MS1 5-20 19.2 0.72 24900 510 13900 58.7
MS2 20-60 27.4 0.95 31800 604 14700 73.9
MS3 60-105 16.7 <0.5 20000 343 12500 53.8
MS4 105-240 13.8 <0.5 18500 334 13400 48.4
OL-KK15
Humus 0-7 34.2 4.2 22300 164 6730 25.6
MS1 7-50 29.8 <0.5 11300 183 15000 32.5
MS2 50-80 25.9 1.5 30200 518 15800 82.6
MS3 80-110 19.2 0.58 20400 391 13200 56.2
MS4 110-160 17.8 0.55 22000 405 12900 55.4
MS5 160-300 14.9 <0.5 15300 271 12700 48.3
OL-KK16
Humus 0-10 52.2 2.4 16900 89.1 3840 34.4
MS1 10-30 9.02 1.4 17600 209 12400 72.8
MS2 30-50 15.3 <0.5 17500 243 12900 53.6
MS3 50-110 9.99 <0.5 13800 256 12900 39.8
MS4 110-300 11.6 <0.5 14000 268 13600 45.2
OL-KK17
Humus 0-30 71.3 0.99 12600 228 4730 79.3
MS1 30-46 7.49 <0.5 14400 191 11600 40.9
MS2 46-82 17.4 <0.5 17800 293 12700 46.7
OL-KK18
Humus 0-20 25.9 0.96 5970 421 4460 112
MS1 20-200 16.1 <0.5 17600 311 12400 50.4
MS2 200-220 11.6 <0.5 16000 315 13400 44.9
OL-KK19
Humus 0-20 16.0 0.52 12300 126 9490 43.5
MS1 20-200 15.8 1.1 16000 266 12500 47.5
MS2 200-235 11.4 <0.5 15600 275 12600 44.3
3.1.5 Easily leachable metal concentrations in partial digestion
In addition to the total digestion, metals were analysed by a partial digestion with
ammonium acetate digestion, (pH 4.5) as summarized in Table 9 and discussed below.
In general, the solubility of aluminum (Al) hydroxides is low, especially at the pH
range from 5 to 9. The total Al content of soils is inherited from parent rocks; however,
only that fraction of Al which is easily mobile and exchangeable plays an important
role in soil fertility. In acid soils with pH below 5.5, the mobility of Al increases

39
sharply and very actively competes with other cations for exchangeable sites. The
mobile Al toxicity is also frequently associated with increased levels of Fe and Mn,
and possibly other heavy metals, which are readily available in acid soils. The Ca and
Mg in soil greatly reduce Al toxicity. Al toxicity is one of the major growth limiting
factors in many acid soils (Kabata-Pendias & Pendias 1992, Koljonen 1992). Easily
leachable aluminum concentrations were highest in the humus horizons: Al varied
from 55.5 mg/kg (OL-KK18) to 740 mg/kg (OL-KK14) and in the mineral soil layers
from 11.9 mg/kg to 88.6 mg/kg. The highest concentrations were in OL-KK14 and
OL-KK15 (Figure 29).
MS5
MS4
MS3
MS2
MS1
Humus
0 200 400 600 800
Al (mg/kg)
S
oil
La
ye
r
OL-KK14OL-KK15OL-KK16OL-KK17OL-KK18OL-KK19
Figure 29. Easily leachable aluminum concentrations of OL-KK14…OL-KK19 in
different soil layers.
Although arsenic (As) minerals and compounds are readily soluble, As migration is
greatly limited due to the strong sorption by clays, hydroxides and organic matter. The
lowest As levels are found in sandy soils, in particular, in those derived from granites,
whereas higher As concentrations are related to most often to soils with rich in organic
matter. Acid sulphate clay soils are also reported to accumulate a high proportion of
As. Arsenic is a constituent of most plants, but little is known about its biochemical
role (Kabata-Pendias & Pendias 1992, Koljonen 1992). Arsenic concentrations were
low, being highest in the humus horizons (0.09-0.44 mg/kg). The highest arsenic
concentration in humus horizon was in OL-KK15.
During weathering, cadmium (Cd) goes readily into solution and, though it is known to
occur as Cd2+
, it may also form several complex ions. The most important factors
which control the Cd mobility are pH and oxidation potential. Soil microbial activity
plays a significant role in the Cd behavior in soils. Cd is most mobile in acidic soils
within the range of pH 4.5 to 5.5, whereas in alkaline soil Cd is rather immobile

40
(Kabata-Pendias & Pendias 1992, Koljonen 1992). Cadmium concentrations varied
from 0.16 mg/kg (OL-KK19) to 0.73 mg/kg (OL-KK17) in the humus horizons, in the
mineral soil layers concentrations were under the detection limit.
Soil organic matter and clay content in addition of manganese oxides and pH are most
important factors that govern the cobalt (Co) distribution and behavior. The mobility of
Co is strongly related to organic matter in soils. The cobalt concentrations were low;
the highest values were in the humus horizon (0.36-1.42 mg/kg). The highest cobalt
concentration in the humus horizon was in OL-KK14.
In surface soil horizon nickel (Ni) appears to occur mainly in organically bound forms.
Ni distribution in soil profiles is related to organic matter and clay fractions, depending
on soil type. The Ni status in soil is highly dependent on the Ni content of parent rocks.
However, the concentration of Ni in surface soils also reflects soil-forming processes
and pollution (Koljonen 1992). In the humus horizons nickel concentrations varied
from 0.97 mg/kg (OL-KK17) to 2.27 mg/kg (OL-KK14), in the mineral soil layers
concentrations were in most cases under the detection limit.
The natural lead (Pb) content of soil is inherited from parent rocks and Pb is the least
mobile among the other heavy metals. However, due to Pb pollution and radon
emanation (Pb is the last daughter in the decay chain); most soils are enriched by Pb,
especially in the topsoil. However, the characteristic localisation of Pb near the soil
surface in most soil profiles is primarily related to the surficial accumulation of organic
matter (Kabata-Pendias & Pendias 1992, Koljonen 1992). Lead concentrations were
clearly higher in the humus horizons, varying from 3.2 mg/kg (OL-KK17) to 17.5
mg/kg (OL-KK18). In the mineral soil layers lead concentrations were lower (Figure
30).
Figure 30. Easily leachable lead concentrations of OL-KK14…OL-KK19 in different
soil layers.
Humus
MS1
MS2
MS3
MS4
MS5
0 5 10 15 20
Pb (mg/kg)
S
oil
La
ye
r
OL-KK14OL-KK15OL-KK16OL-KK17OL-KK18OL-KK19

41
Vanadium-bearing mafic minerals weather easily and the dissolved element is removed
from solution mainly into sediments rich in organic matter. Vanadium (V) is a micro-
nutrient, but some of its compounds are known to be toxic. Vanadium concentrations
were low. The highest concentration was in OL-KK15 in the humus horizon.
Table 9. Easily leachable, harmful metals concentrations in partial digestion (NH4 Ac-
digestion, pH 4.5) in soil pits OL-KK14…OL-KK19 in different sampling soil layers.
Soil
sample
Soil
layer
Sampling
depth
(cm)
Al
(mg/kg)
As
(mg/kg)
Cd
(mg/kg)
Co
(mg/kg)
Ni
(mg/kg)
Pb
(mg/kg)
V
(mg/kg)
OL-
KK14
Humus 0-5 740 0.26 0.38 1.42 2.27 16.5 0.26
MS1 5-20 46.3 0.05 <0.1 <0.1 <0.5 0.44 <0.1
MS2 20-60 40.0 0.06 <0.1 <0.1 <0.5 0.36 <0.1
MS3 60-105 21.4 0.09 <0.1 <0.1 <0.5 4.87 <0.1
MS4 105-240 34.3 0.15 <0.1 0.46 0.71 0.86 0.31
OL-
KK15
Humus 0-7 369 0.44 0.24 0.85 2.02 5.49 0.74
MS1 7-50 69.1 0.06 <0.1 0.37 <0.5 0.20 0.11
MS2 50-80 88.6 0.15 <0.1 0.16 0.67 1.02 <0.1
MS3 80-110 42.4 0.10 <0.1 0.12 <0.5 0.59 <0.1
MS4 110-160 59.0 0.43 <0.1 0.71 1.27 1.97 0.66
MS5 160-300 18.5 0.12 <0.1 0.28 0.51 4.82 0.23
OL-
KK16
Humus 0-10 241 0.27 0.41 0.48 1.54 7.25 0.37
MS1 10-30 52.8 0.08 <0.1 <0.1 <0.5 0.37 0.21
MS2 30-50 35.4 0.08 <0.1 0.14 <0.5 0.39 <0.1
MS3 50-110 11.9 0.09 <0.1 0.14 <0.5 0.50 <0.1
MS4 110-300 15.3 0.09 <0.1 0.23 <0.5 0.54 0.21
OL-
KK17
Humus 0-30 108 0.09 0.73 1.07 0.97 3.20 0.10
MS1 30-46 32.2 <0.03 <0.1 <0.1 <0.5 <0.1 <0.1
MS2 46-82 20.3 0.09 <0.1 <0.1 <0.5 0.25 <0.1
OL-
KK18
Humus 0-20 55.5 0.09 0.50 0.36 1.01 17.5 0.19
MS1 20-200 19.4 0.06 <0.1 <0.1 <0.5 0.32 <0.1
MS2 200-220 31.9 0.13 <0.1 0.44 0.59 0.78 0.38
OL-
KK19
Humus 0-20 250 0.12 0.16 0.39 1.17 5.68 0.23
MS1 20-200 20.0 0.05 <0.1 0.11 <0.5 0.48 <0.1
MS2 200-235 17.3 0.03 <0.1 0.21 <0.5 0.36 0.10
3.1.6 Other metal concentrations in total digestion
Aluminum (Al) concentrations varied from 18.1 g/kg (OL-KK18) to 38.1 g/kg (OL-
KK19) in humus horizon. In mineral soil layers aluminum concentrations were highest
in OL-KK15 (62.8 g/kg) and in OL-KK14 (61.3 g/kg), indicating aluminum
enrichment (Figure 31). In well developed podzol profiles Al is precipitated in illuvial
horizons. Arsenic (As), cadmium (Cd), copper (Cu) and lead (Pb) concentrations were
highest in the humus horizons (Table 10). Cd concentrations varied from 0.17 mg/kg
(OL-KK19) to 1.58 mg/kg (OL-KK17). Cu concentrations varied from 16.0 mg/kg
(OL-KK19) to 71.3 mg/kg (OL-KK17) and Pb concentrations from 23.8 mg/kg (OL-
KK15) to 69.2 mg/kg (OL-KK18) in the humus horizons. Co and V concentrations
varied along the profile depths (Table 10). Co varied from 2.3 mg/kg to 15.7 mg/kg
and V concentration from 14.8 mg/kg to 76.6 mg/kg. Cu and Pb concentrations were
highest in the humus horizons. In general, Al, As, Co, Cu, Ni and V concentrations
were enriched in MS2 mineral soil layers, except in OL-KK17, where concentrations
were highest in the humus horizon.

42
MS5
MS4
MS3
MS2
MS1
Humus
0 10000 20000 30000 40000 50000 60000 70000
Al (mg/kg)
S
oil
La
ye
r
OL-KK14OL-KK15OL-KK16OL-KK17OL-KK18OL-KK19
Figure 31. Total aluminum concentrations of OL-KK14…OL-KK19 in different soil
layers.

43
Table 10. Metal concentrations in total digestion (hydrofluoric acid-perchloric acid
digestion) in soil pits OL-KK14…OL-KK19 in different soil layers.
Soil
sample
Soil
layer
Sampling
depth
(cm)
Al
(mg/kg)
As
(mg/kg)
Cd
(mg/kg)
Co
(mg/kg)
Cu
(mg/kg)
Ni
(mg/kg)
Pb
(mg/kg)
V
(mg/kg)
OL-
KK14
Humus 0-5 21400 2.54 0.77 5.03 65.0 16.1 52.8 14.8
MS1 5-20 52800 4.12 <0.1 10.8 19.2 25.1 16.3 57.8
MS2 20-60 61300 5.77 0.22 15.7 27.4 37.1 21.1 76.6
MS3 60-105 49500 2.18 <0.1 7.71 16.7 21.1 20.3 44.8
MS4 105-240 47600 1.82 <0.1 7.74 13.8 17.2 15.0 42.2
OL-
KK15
Humus 0-7 23300 5.57 0.38 5.14 34.2 12.9 23.8 36.8
MS1 7-50 46300 0.54 <0.1 3.88 29.8 9.17 15.9 23.7
MS2 50-80 62800 6.56 0.12 14.8 25.9 32.6 23.2 73.4
MS3 80-110 47600 3.93 0.21 10.9 19.2 24.1 20.1 47.0
MS4 110-160 49500 2.49 <0.1 9.58 17.8 20.2 15.9 51.2
MS5 160-300 43900 1.44 <0.1 5.48 14.9 13.2 16.0 33.3
OL-
KK16
Humus 0-10 20200 6.25 0.74 4.05 52.2 17.7 29.6 30.7
MS1 10-30 44100 2.90 0.21 4.18 9.02 11.2 16.6 35.4
MS2 30-50 45000 2.46 <0.1 6.76 15.3 16.6 15.7 37.9
MS3 50-110 42300 1.61 <0.1 5.36 9.99 11.2 16.1 28.3
MS4 110-300 43000 1.09 <0.1 5.71 11.6 12.6 14.5 31.8
OL-
KK17
Humus 0-30 23400 7.19 1.58 9.28 71.3 30.9 26.9 24.9
MS1 30-46 43700 <0.5 <0.1 3.80 7.49 12.5 14.3 25.0
MS2 46-82 46400 1.65 <0.1 6.60 17.4 16.5 14.9 40.6
OL-
KK18
Humus 0-20 18100 1.90 0.64 2.29 25.9 10.9 69.2 18.1
MS1 20-200 46300 1.56 <0.1 7.23 16.1 17.7 15.7 40.4
MS2 200-220 44000 1.72 <0.1 6.44 11.6 13.2 15.0 36.0
OL-
KK19
Humus 0-20 38100 1.18 0.17 3.07 16.0 10.9 25.5 25.8
MS1 20-200 44500 1.49 <0.1 6.37 15.8 14.8 16.0 33.1
MS2 200-235 44400 1.47 <0.1 6.22 11.4 13.9 15.8 33.9
3.1.7 Iodine and selenium
Geochemical and biochemical behaviour of selenium (Se) is complex. In soils, selenium can be present in a number of different forms depending upon the soil redox conditions. The chemical form will influence selenium behaviour, including partitioning between liquid and solid phases and bioavailability. Microbial activity also has an influence on the form of selenium in soils. However, microbial activity is dependent on a number of factors, including nutrient availability, thus nutrient deficient soils may have a slower rate of microbial-induced speciation than nutrient-rich soils (Kabata-Pendias & Pendias 1992).
In both clay and sand soils, the majority of selenium has been found to be associated
with organic matter, with subsequently decreasing amounts of metal selenides and
elemental selenium. The binding of selenium to organic matter renders selenium less
bioavailable than that retained in solution. In sandy soils lower concentrations of each
Se forms have been found than in clay soils. It is concluded that to understand
selenium behavior in soils, speciation of selenium needs to be understood – different
forms can be available within the same soils (Kabata-Pendias & Pendias 1992).
Selenium concentrations were 5-10 higher in the humus horizons, ranging from 0.158
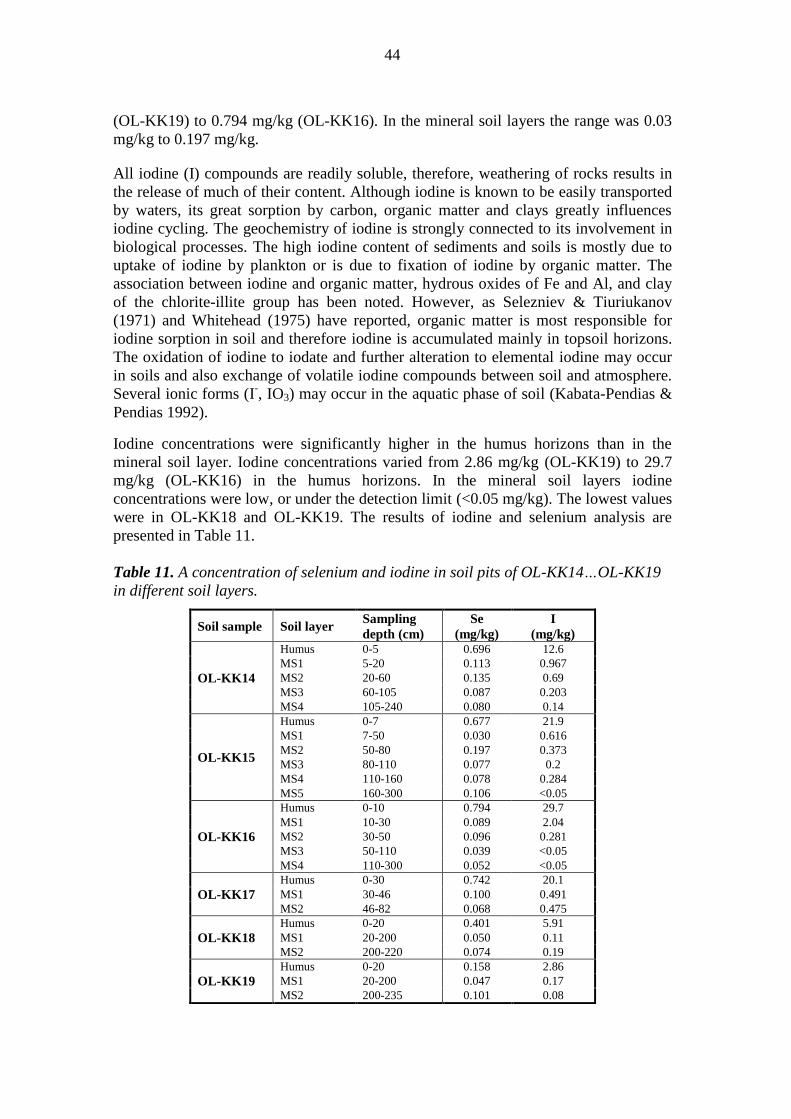
44
(OL-KK19) to 0.794 mg/kg (OL-KK16). In the mineral soil layers the range was 0.03
mg/kg to 0.197 mg/kg.
All iodine (I) compounds are readily soluble, therefore, weathering of rocks results in
the release of much of their content. Although iodine is known to be easily transported
by waters, its great sorption by carbon, organic matter and clays greatly influences
iodine cycling. The geochemistry of iodine is strongly connected to its involvement in
biological processes. The high iodine content of sediments and soils is mostly due to
uptake of iodine by plankton or is due to fixation of iodine by organic matter. The
association between iodine and organic matter, hydrous oxides of Fe and Al, and clay
of the chlorite-illite group has been noted. However, as Selezniev & Tiuriukanov
(1971) and Whitehead (1975) have reported, organic matter is most responsible for
iodine sorption in soil and therefore iodine is accumulated mainly in topsoil horizons.
The oxidation of iodine to iodate and further alteration to elemental iodine may occur
in soils and also exchange of volatile iodine compounds between soil and atmosphere.
Several ionic forms (I-, IO3) may occur in the aquatic phase of soil (Kabata-Pendias &
Pendias 1992).
Iodine concentrations were significantly higher in the humus horizons than in the
mineral soil layer. Iodine concentrations varied from 2.86 mg/kg (OL-KK19) to 29.7
mg/kg (OL-KK16) in the humus horizons. In the mineral soil layers iodine
concentrations were low, or under the detection limit (<0.05 mg/kg). The lowest values
were in OL-KK18 and OL-KK19. The results of iodine and selenium analysis are
presented in Table 11.
Table 11. A concentration of selenium and iodine in soil pits of OL-KK14…OL-KK19
in different soil layers.
Soil sample Soil layer Sampling
depth (cm)
Se
(mg/kg)
I
(mg/kg)
OL-KK14
Humus 0-5 0.696 12.6
MS1 5-20 0.113 0.967
MS2 20-60 0.135 0.69
MS3 60-105 0.087 0.203
MS4 105-240 0.080 0.14
OL-KK15
Humus 0-7 0.677 21.9
MS1 7-50 0.030 0.616
MS2 50-80 0.197 0.373
MS3 80-110 0.077 0.2
MS4 110-160 0.078 0.284
MS5 160-300 0.106 <0.05
OL-KK16
Humus 0-10 0.794 29.7
MS1 10-30 0.089 2.04
MS2 30-50 0.096 0.281
MS3 50-110 0.039 <0.05
MS4 110-300 0.052 <0.05
OL-KK17
Humus 0-30 0.742 20.1
MS1 30-46 0.100 0.491
MS2 46-82 0.068 0.475
OL-KK18
Humus 0-20 0.401 5.91
MS1 20-200 0.050 0.11
MS2 200-220 0.074 0.19
OL-KK19
Humus 0-20 0.158 2.86
MS1 20-200 0.047 0.17
MS2 200-235 0.101 0.08
45
3.2 Cation exchange capacity (CEC) and base saturation (BS)
Cations are positively charged ions such as calcium (Ca2+
), magnesium (Mg2+
),
potassium (K+), sodium (Na
+) hydrogen (H
+), aluminum (Al
3+), iron (Fe
2+), manganese
(Mn+), zinc (Zn
2+) and copper (Cu
2+). The capacity of the soil to hold on to these
cations is called the cation exchange capacity (CEC). These cations are held by the
negatively charged clay and organic matter particles in the soil through electrostatic
forces (negative soil particles attract the positive cations). Cation exchange on the
surfaces of soil particles is the most important buffering process in the humus horizons
(Evans 1980, Brady 1984). The cations on the CEC of the soil particles are easily
exchangeable with other cations and as a result, they are available to plants.
The cation exchange capacity of soil can be determined by two different methods:
potential and effective. In the potential CEC measurement the pH is adjusted to certain
value, as is used in this report (buffered (pH 4.5) ammonium acetate digestion). The
effective CEC is measured by unbuffered saline solution. The effective and potential
cation exchange can differ a lot (Westman 1991).
The cation exchange capacity was calculated by counting the alkaline and alkaline
earth metals of Ca2+
, Mg2+
, K+, Na
+ and acid ions (Al
3+, Fe
2+), and expressed in
mmol/kg. It should be noticed that the acid ions are not real acids but release hydrogen
ions from the soil solution (Westman 1991).
The cation exchange capacities of humus and mineral soil differ, depending on the
chemical and mineralogical composition of the soils, the decomposability of plant
residues in the soils, and microbiological activity. In mineral soils, cation exchange
takes place primarily in the fine fraction because of its large, negatively charged
surface area (Birkeland 1974). The clay and humus are essential cation reservoirs of
the soil and are very important because they improve the nutrient and water holding
capacity of the soil. However, CEC vary with the type of clay (Kabata-Pendias &
Pendias 1992).
The cation exchange capacity varied notably in different soil profiles (Table 12). In the
humus horizons CEC was significantly higher than in the mineral soil layers, the
variation was from 39.4 mmol/kg (OL-KK19) to 393 mmol/kg (OL-KK17). In the
mineral soil layers the CEC was highest in the parent material. The highest CEC-
values were found in the humus horizons of OL-KK16 and OL-KK17 (Figure 32). The
CEC values in OL-KK19 were notably lower (Table 12). Calcium was evidently the
predominant cation in all soil layers. In the humus horizons calcium contents varied
from 15.4 mmol/kg (OL-KK19) to 344 mmol/kg (OL-KK17).
Base saturation (BS %) refers to the fraction of the CEC that is occupied by the basic
cations (Ca2+
, Mg 2+
, K + and Na
+). Base saturation (BS) varied from 57.3 % (OL-
KK14) to 98.9 % (OL-KK17) in the humus horizons. In OL-KK14 and OL-KK15
aluminium (27.4 mmol/kg, 13.7 mmol/kg) and iron concentrations (18.5 mmol/kg,
40.0 mmol/kg) were high decreasing the amount of buffering base cations (Table 12).
In Figures 33-38 the cation exchange capacity and contribution of cations in different
soil pits are presented.

Table 12. Al, Ca, Mg, K, Na and Fe concentration (mmol/kg), cation exchange capacity (CEC mmol/kg) and base saturation (BS %) of OL-KK14…OL-KK19 in different soil layers.
Sample Sample
layer
Sampling
depth (cm)
Elements (mmol/kg) CEC
(Ca+Mg+K+Na+Al+
Fe)
(mmol/kg)
(Ca+Mg+K+Na)
(mmol/kg)
BS (%)
((Ca+Mg+K+Na)/
(Ca+Mg+K+Na+Al+
Fe))x 100 Al Ca Fe K Mg Na
OL-KK14
Humus 0-5 27.43 38.92 18.46 8.72 11.73 2.1 107.4 61.5 57.3
MS1 5-20 1.72 9.76 1.90 0.98 4.05 0.4 18.8 15.2 80.8
MS2 20-60 1.48 15.47 1.43 1.30 4.53 0.4 24.6 21.7 88.2
MS3 60-105 0.79 9.11 1.49 1.01 2.49 0.2 15.1 12.8 84.9
MS4 105-240 1.27 34.18 2.63 1.43 3.37 0.18 43.1 39.2 90.9
OL-KK15
Humus 0-7 13.68 89.32 39.96 4.99 8.66 1.39 158.0 104.4 66.1
MS1 7-50 2.56 3.09 1.62 0.41 0.81 0.13 8.6 4.4 51.5
MS2 50-80 3.28 16.87 3.39 3.45 5.09 1.08 33.2 26.5 79.9
MS3 80-110 1.57 27.20 2.29 1.56 2.74 0.54 35.9 32.0 89.2
MS4 110-160 2.19 46.41 4.01 3.66 4.94 0.83 62.0 55.8 90.0
MS5 160-300 0.69 33.43 1.54 1.53 2.59 0.43 40.2 38.0 94.5
OL-KK16
Humus 0-10 8.93 266.97 7.65 6.06 46.09 3.68 339.4 322.8 95.1
MS1 10-30 1.96 16.22 4.46 0.67 2.57 0.27 26.2 19.7 75.4
MS2 30-50 1.31 9.08 2.01 0.82 1.95 0.17 15.3 12.0 78.4
MS3 50-110 0.44 33.68 1.64 0.77 2.88 0.19 39.6 37.5 94.7
MS4 110-300 0.57 38.92 1.64 0.97 3.20 0.23 45.5 43.3 95.1
OL-KK17
Humus 0-30 4.00 344.31 0.35 6.47 35.64 2.03 392.8 388.5 98.9
MS1 30-46 1.19 17.02 0.17 0.44 1.22 - 20.0 18.7 93.2
MS2 46-82 0.75 12.92 0.94 0.73 1.30 0.26 16.9 15.2 90.0
OL-KK18
Humus 0-20 2.06 71.86 0.34 14.91 19.42 0.83 109.4 107.0 97.8
MS1 20-200 0.72 10.05 0.72 0.68 0.97 0.15 13.3 11.9 89.2
MS2 200-220 1.18 51.40 2.20 1.23 3.74 0.19 59.9 56.6 94.4
OL-KK19
Humus 0-20 9.27 15.37 6.18 2.08 6.01 0.47 39.4 23.9 60.8
MS1 20-200 0.74 37.67 0.80 0.71 1.08 - 41.0 39.5 96.2
MS2 200-235 0.64 40.17 0.95 0.94 2.20 - 44.9 43.3 96.5
- = under detection limit
46

47
Humus
MS1
MS2
MS3
MS4
MS5
0 100 200 300 400
CEC (mmol/kg)
S
oil L
ayer
OL-KK14OL-KK15OL-KK16OL-KK17OL-KK18OL-KK19
Figure 32. Cation exchange capacity (CEC) of OL-KK14…OL-KK19 in different soil
layers.
OL-KK14
0 20 40 60 80 100 120 140 160 180 200 220 240 260 280 300 320 340 360 380 400
Humus
MS1
MS2
MS3
MS4
CEC (mmol/kg)
Ca
Mg
K
Na
Al
Fe
mmol/kg
Figure 33. Cation exchange capacity (CEC) mmol/kg in the soil pit OL-KK14 in different soil layers. The proportion of Ca, Mg, K, Na, Al and Fe are expressed separately.

48
OL-KK15
0 20 40 60 80 100 120 140 160 180 200 220 240 260 280 300 320 340 360 380 400
Humus
MS1
MS2
MS3
MS4
MS5
CEC (mmol/kg)
Ca
Mg
K
Na
Al
Fe
mmol/kg
Figure 34. Cation exchange capacity (CEC) mmol/kg in the soil pit OL-KK15 in different soil layers. The proportion of Ca, Mg, K, Na, Al and Fe are expressed separately.
OL-KK16
0 20 40 60 80 100 120 140 160 180 200 220 240 260 280 300 320 340 360 380 400
Humus
MS1
MS2
MS3
MS4
CEC (mmol/kg)
Ca
Mg
K
Na
Al
Fe
mmol/kg
Figure 35. Cation exchange capacity (CEC) mmol/kg in the soil pit OL-KK16 in different soil layers. The proportion of Ca, Mg, K, Na, Al and Fe are expressed separately.

49
OL-KK17
0 20 40 60 80 100 120 140 160 180 200 220 240 260 280 300 320 340 360 380 400
Humus
MS1
MS2
CEC (mmol/kg)
Ca
Mg
K
Na
Al
Fe
mmol/kg
Figure 36. Cation exchange capacity (CEC) mmol/kg in the soil pit OL-KK17 in different soil layers. The proportion of Ca, Mg, K, Na, Al and Fe are expressed separately.
OL-KK18
0 20 40 60 80 100 120 140 160 180 200 220 240 260 280 300 320 340 360 380 400
Humus
MS1
MS2
CEC (mmol/kg)
Ca
Mg
K
Na
Al
Fe
mmol/kg
Figure 37. Cation exchange capacity (CEC) mmol/kg in the soil pit OL-KK18 in different soil layers. The proportion of Ca, Mg, K, Na, Al and Fe are expressed separately.

50
OL-KK19
0 10 20 30 40 50
Humus
MS1
MS2
CEC (mmol/kg)
Ca
Mg
K
Na
Al
Fe
mmol/kg
Figure 38. Cation exchange capacity (CEC) mmol/kg in the soil pit OL-KK19 in different soil layers. The proportion of Ca, Mg, K, Na, Al and Fe are expressed separately (note the different scale).

51
3.3 Solubility of the main elements
The migration of elements and substances in soils takes place mainly through advection, dispersion, diffusion and evaporation and can be enhanced by complexation and colloidal sorption. The most effective sorptive compounds are organic matter, the oxyhydroxides of iron, aluminium and manganese and clay minerals. Sorption also increases with an increase in the specific surface area. The retention capacity of soil is limited and can be exceeded by excessive loading and lowered due to a change in chemical conditions. The soil mechanisms are mainly governed by the water content and structure of soil, by temperature and by the amount of complexing and colloidal compounds in soil. Migration is most effective when the water content and permeability of soil are high (Heikkinen 2001).
The solubility of elements in soil has great significance in their bioavailability and migration. Knowledge of the total composition of the soil solution and easily leachable fraction is essential; the uptake of a given ion depends on not only its activity in the solution but also on upon the activities of other ions and the relation that exists between solution ions and exchangeable or solid-phase ions. Soluble major ions greatly influence the quantities of soluble trace elements. Solutions of most soils contain an excess of calcium, which in many soils constitutes more than 80-90 % of the total cation concentration. Ca is, therefore, the most important cation in governing the soluble stage of trace elements in soil (Kabata-Pendias & Pendias 1992).
Methods used for obtaining solutions from soils differ widely; therefore it is difficult to adequately determine mean concentrations of trace elements. Rainfall, evaporation and plant transpiration can change trace element concentrations in soil solution more than tenfold, whereas the observed variation for major ions (Ca, Mg, K, Na, NO3, PO4) is much less. The acidification increases the intensity by which trace metals are mobilised in soil. The anionic composition of soil solution is also of importance in controlling the trace element status (Kabata-Pendias & Pendias 1992).
The bioavailable fraction (%) of the main elements soluble on ammonium acetate and total digestions was estimated by using the ratio of these digestions and expressed as percents (Table 13). The solubility of most analysed elements (Al, Ba, Ca, Co, Cr, Fe, K, Mg, Mn, Na, Ni, P and Zn) was significantly higher in the humus than in the mineral soil layers. In the mineral soil layers, exceptions were found in the solubility of copper, manganese and sulphur; solubility was generally higher in the mineral soil layers than in the humus horizons. In the OL-KK14 Al solubility-% (3.5 %) was threefold compared to the lowest value in OL-KK18 (0.31%). Calcium solubility varied from 14.2% (OL-KK19) to 58.0% (OL-KK17) in the humus horizons, in the mineral soil layers Ca solubility increased with depth. Magnesium solubility followed the pattern of calcium. Iron solubility was the highest in the humus horizons of OL-KK14 and OL-KK15. Sulphur solubility was the highest in the mineral soil layers of MS2, in general.

52
Table 13. Bioavailable fraction (%), (ammonium acetate concentrations mg/kg / total
concentrations mg/kg) *100.
- Not determined, value < the detection limit
Soil
sample
Soil layer Sampling
depth
(cm)
Bioavailable fraction (%)
Al As Ba Ca Co Cr Cu Fe K
OL-
KK14
Humus 0-5 3.5 10.2 10.3 38.2 28.4 3.3 1.6 9.4 3.8
MS1 5-20 0.09 1.2 2.5 3.8 - 0.20 3.3 0.43 0.18
MS2 20-60 0.07 1.0 2.0 5.0 - 0.12 3.3 0.3 0.2
MS3 60-105 0.04 4.13 1.2 4.4 - - 7.1 0.42 0.17
MS4 105-240 0.07 8.2 1.4 13.0 5.9 - 15.0 0.79 0.26
OL-
KK15
Humus 0-7 1.6 7.9 2.1 41.4 16.5 4.3 4.6 10.0 2.0
MS1 7-50 0.15 11.1 0.42 1.53 9.5 1.1 2.0 0.80 0.08
MS2 50-80 0.14 2.3 2.3 5.9 1.1 0.28 10.5 0.63 0.52
MS3 80-110 0.09 2.5 1.5 10.7 1.1 0.22 4.9 0.63 0.29
MS4 110-160 0.12 17.3 2.2 17.1 7.4 0.41 13.1 1.0 0.66
MS5 160-300 0.04 8.3 1.3 13.9 5.1 9.4 0.56 0.29
OL-
KK16
Humus 0-10 1.19 4.3 3.3 54.9 11.8 1.35 1.9 2.5 3.3
MS1 10-30 0.12 2.8 0.83 8.4 - 0.88 7.1 1.4 0.13
MS2 30-50 0.08 3.2 1.2 4.3 2.1 - 8.9 0.64 0.15
MS3 50-110 0.03 5.6 0.88 14.1 2.6 - 11.1 0.45 0.15
MS4 110-300 0.04 8.3 1.1 15.3 4.0 - 20.3 0.65 0.19
OL-
KK17
Humus 0-30 0.46 1.3 3.3 58.0 11.5 0.48 0.72 0.16 2.5
MS1 30-46 0.07 - 0.48 10.8 - - 4.9 0.07 0.07
MS2 46-82 0.04 - 0.95 6.1 - - 6.7 0.30 0.13
OL-
KK18
Humus 0-20 0.31 4.7 12.5 46.2 15.7 1.2 1.4 0.31 7.0
MS1 20-200 0.04 3.9 1.1 5.0 - - 3.3 0.23 0.12
MS2 200-220 0.07 7.6 1.1 19.4 6.8 - 17.4 0.77 0.24
OL-
KK19
Humus 0-20 0.66 10.2 2.4 14.2 12.7 2.1 3.3 2.8 0.43
MS1 20-200 0.04 3.4 0.91 16.6 1.7 - 4.5 0.28 0.13
MS2 200-235 0.04 2.0 0.87 16.6 3.4 - 14.8 0.34 0.17

53
Table 13. (cont´d.) Bioavailable fraction (%), (ammonium acetate concentrations
mg/kg / total concentrations mg/kg) *100.
Soil
sample
Soil layer Sampling
depth
(cm)
Bioavailable fraction (%)
Mg Mn Na Ni P S Sr Zn
OL-
KK14
Humus 0-5 20.7 26.6 1.0 14.1 3.8 9.6 16.5 37.1
MS1 5-20 1.3 0.36 0.06 - 0.92 - 1.4 0.53
MS2 20-60 1.1 0.35 0.06 - 2.4 7.4 1.5 0.41
MS3 60-105 1.0 1.1 0.04 - 4.1 10.6 0.93 0.84
MS4 105-240 1.4 13.3 0.03 4.1 3.0 9.7 1.0 2.0
OL-
KK15
Humus 0-7 16.7 4.6 0.48 15.7 3.6 8.6 20.1 11.0
MS1 7-50 0.91 1.6 0.02 - 1.7 10.2 0.69 1.1
MS2 50-80 2.0 2.7 0.16 2.1 1.4 21.7 2.5 1.3
MS3 80-110 1.8 4.3 0.09 - 1.9 9.4 1.6 0.94
MS4 110-160 2.8 15.4 0.15 6.3 3.9 10.6 2.5 2.1
MS5 160-300 2.3 10.8 0.08 3.9 3.7 5.6 1.4 1.7
OL-
KK16
Humus 0-10 32.8 8.9 2.2 8.7 2.2 4.5 21.7 28.3
MS1 10-30 1.4 0.22 0.05 - 1.1 6.7 1.0 0.22
MS2 30-50 1.0 0.83 0.03 - 2.5 11.8 0.85 1.6
MS3 50-110 1.8 8,6 0.03 - 2.9 5.8 1.2 1.5
MS4 110-300 1.9 12.5 0.04 - 3.2 5.9 1.2 1.5
OL-
KK17
Humus 0-30 22.9 27.0 0.99 3.1 2.4 4.0 24.5 15.4
MS1 30-46 0.72 0.89 - - 1.9 7.4 0.99 0.32
MS2 46-82 0.62 0.87 0.05 - 4.1 12.5 0.78 0.45
OL-
KK18
Humus 0-20 29.0 36.3 0.43 9.3 10.1 7.2 15.7 38.4
MS1 20-200 0.47 0.96 0.03 - 6.2 5.2 0.60 0.75
MS2 200-220 2.0 13.7 0.03 4.5 2.6 5.7 1.2 1.7
OL-
KK19
Humus 0-20 5.2 6.0 0.11 10.7 6.1 7.4 3.6 18.4
MS1 20-200 0.57 5.4 - - 2.4 - 0.91 1.7
MS2 200-235 1.2 8.6 - - 2.3 6.1 1.1 0.9
- Not determined, value < the detection limit

54
3.4 Grain size distribution and mineralogy
The grain size distribution of mineral soil samples and cumulative weight percent from
OL-KK14, OL-KK15 and OL-KK16 are presented in Appendices 4.1 and 4.2 (Lusa et
al. 2009). The soils were mainly fine-textured or sandy till. The proportion of fine
fraction (Ø <0.063 mm) increased after the uppermost mineral layer (MS1) and was
highest in MS2-layers of OL-KK14 and OL-KK15, being 37 % and 38 %, respectively.
In OL-KK16 the proportion of fine fraction was highest in MS3 (28 %). The amount of
clay (Ø <0.002 mm) varied from 0 to 12 % in OL-KK14…OL-KK16. The highest clay
contents were found in OL-KK14 and OL-KK15 in MS2 layers.
The grain size distribution of mineral soil samples and cumulative weight percent from
OL-KK17, OL-KK18 and OL-KK19 are presented in Appendices 4.3 and 4.4. The soil
type of OL-KK17 was sandy till. The clay content in MS1-layer was 1.8 % and
increased in the MS2-layer to (46-82 cm) to 8.3 %. In OL-KK18 and OL-KK19 soil
type was fine-textured till. In OL-KK18 clay content in MS1-layer (20-200 cm) was
9.3 % and increased to 12.8 % in MS2-layer (200-220 cm). In OL-KK19 clay content
was in MS1 (20-200 cm) 8.8 % and in MS2-layer (200-235 cm) 8.4 %. The stone
content varied in mineral soil layers from 2.4 % to 21.6 % being highest in MS2-layers
(19.8 - 21.6 %).
The mineral soils constituted mainly of quartz, potassium feldspar and plagioclase in OL-KK14…OL-KK16. The average quartz content in the mineral layers was 66 % and varied from 55 to 70 %. The average potassium feldspar proportion was 12 % and for plagioclase 19 % for all grain sizes. The small amounts (<5 %) of mica, chlorite and amphibole were found. The results corresponded to mineralogy of OL-KK6-OL-KK11 (Lintinen et al. 2003.) In addition, in some samples minor amounts of hematite and talc were found. The detailed description of mineralogy in OL-KK14, OL-KK15 and OL-KK16 is reported in Lusa et al. (2009). Mineralogical analyses of OL-KK17, OL-KK18 and OL-KK19 were not available.

55
4 CONCLUSIONS
The soils at Olkiluoto are young, thus the soil horizons are not yet well developed. Soil type is mainly sandy till or fine-textured till, containing some clay, sand, gravel and weathered layers. There was quite a large variation in acidity and elemental solubility of the investigated soil profiles, even in the three soil profiles (OL-KK17…OL-KK19) located only about ten meters from each other.
The surface soils were acid, but pH increased to neutral or alkaline as a function of depth, which is typical for the Finnish podzolised soil profiles. The base cation concentration and cation exchange capacity of the surface overburden have been found quite high compared to soils in inlands. The solubility of most analysed elements (Al, Ba, Ca, Co, Cr, Fe, K, Mg, Mn, Na, Ni, P and Zn) correlated positively with the organic matter content. However, base cations and other elements are expected to decrease in the future due to pedogenic processes, e.g. surface soil weathering, leaching and nutrient uptake and anthropogenic factors.
The soil mechanisms are mainly governed by the water content and structure of soil, by temperature and by the amount of complexing and colloidal compounds in soil. Migration is most effective when the water content and permeability of soil are high. The main reasons for the heterogeneous geochemistry Ol-KK14…OL-KK19 were mainly quite large variation in the humus properties and in the amount of clay and fine fraction contents between the soil pits and within different soil profile layers. Humus, clay and silt layers are the most active fraction in soils, e.g. due to their large reactive surface area.
Also the thickness of the sampling layers varied in the different soil pits, thus representing larger geochemical variation in some soil layers than in others. Also some anthropogenic factors could have affected natural stage of overburden; e.g. the OL-KK17…OL-KK19 located in the central part of island, which is the most extensively investigated area in the island. The soil pits OL-KK15 and OL-KK16 were selected from more natural areas (baseline areas), in the northern and eastern parts of the island. However, it is difficult to distinguish impacts of anthropogenic and natural factors.
When comparing results to earlier overburden investigations at Olkiluoto, the main
differences have been the investigation approaches; e.g. the sampling and analysing
methods used for obtaining geochemical and physical characteristics of the overburden
have been somewhat different. Although, there are still gaps in overburden data, all
overburden and related (e.g. soil water, groundwater, geophysics) investigations
broaden the scope and understanding of the site evolution, prevailing processes,
radionuclide transport and support modellining requirements.
The new overburden investigation locations should be selected based on relevance to surface and near-surface hydrological modelling, both formation of groundwater and possible routes of releases; and for the overburden modelling purposes, e.g. spatially lack of or low density data areas. The surface environments will evolve significantly on a timescale comparable to that of variations in the radionuclide release from the geosphere, for example areas currently sea bottom sediments will develop into terrestrial and limnic areas.

56

57
5 SUMMARY
The detailed soil investigations at Olkiluoto continued in the summer 2008. The six new soil pits were dug by excavator at the different parts of the island. The pit OL-KK14 is situated near the Liiklansuo mire and the main road; OL-KK15 in the northern part of the island, near the harbor road, and OL-KK16 in the north-eastern part, beside the Rumminperäntie road. The pits OL-KK17…OL-KK19 are located at the infiltration experiment site (Pitkänen et al. 2008b); west of the ONKALO underground rock characterisation facility and the Korvensuo freshwater reservoir.
Samples were taken from the vertical overburden profiles of the humus and two to five
mineral soil layers down to bedrock, if possible. The soils at Olkiluoto are very young
and thus soil profiles and horizons are not well developed, the sampling layers were
mainly selected after visual examination, e.g. according soil stratigraphy and type,
stoniness and color. The pH, moisture, dry and organic matter contents, carbon and
nitrogen were determined in the humus and mineral soil layers. Total organic carbon
was determined from the humus horizons of OL-KK14…OL-KK16.
The concentrations of the multi-element analysis of the easily leachable fraction were
measured with the buffered (pH 4.5) ammonium acetate and the total concentrations by
hydrofluoric acid-perchloric acid digestions using ICP-MS/ICP-OES-technique by
Labtium Ltd. The total cation exchange capacity (CEC) and base saturation (BS) were
calculated by using the exchangeable cations digested by the ammonium acetate. Also
selenium and iodine were measured. The grain size distribution was analysed from the
mineral soil layers. Mineralogy of OL-KK14…OL-KK16 is reported in (Lusa et al.
2009). Mineralogical analyses of OL-KK17…OL-KK19 were not available.
Overburden in the investigated soil pits was fine-grained and sandy till. However, sand and clay layers were common in the soil profiles. The clay content (Ø <0.002 mm) varied from 0 % to 12.8 % and was highest in OL-KK14 and OL-KK15. The fine fraction content (Ø <0.063 mm) varied from 1 % to 56.5 %. Observations of slightly chemically changed disintegrated rock layer (5-10 cm) were found in the contact of overburden and bedrock of OL-KK14. In the soil pits OL-KK14…OL-KK16 bedrock was at the depth of 290-320 cm. In OL-KK17…OL-KK19 the pits were not dug down to bedrock.
pH values varied in the humus layers from 3.3 to 5.4. In the different mineral soil layers pH ranged from 4.7 to 7.7 and increased as a function of depth, which is typical for the Finnish soil profiles. The pH variation between the soil pits was large; 2.1 pH units in the humus horizons and 3.0 units in the mineral soil layers. The dry-matter content increased as a function of depth, being in the humus horizons 49.8-69.1 % and in the subsoil layers 88.8-99.6 %. The organic matter and moisture contents decreased as a function of depth. The organic matter had a large variation in the humus layers, from 15.8 % (OL-KK19) to 58.5 % (OL-KK16).
The carbon content in the humus layers ranged from 9.9% (OL-KK19) to 31.9 % (OL-KK18), although these sites situated close to each other in the infiltration site. In the mineral soils layers the carbon content was <1 %. The nitrogen content ranged in the humus horizons from 0.29 (OL-KK19) to 2.02 % (OL-KK16), and in the mineral soil layers nitrogen content was low or under the detection limit. C/N ratio in the humus horizon varied from 15.7 % (OL-KK16) to 34.1 % (OL-KK19). In general, C and N
58
concentrations were in the range of studied top soil forest sampling plots at Olkiluoto (Tamminen et al. 2007).
The most nutrient rich soils were OL-KK16 and OL-KK17, while the soil of OL-KK19 was the most nutrient-poor of the studied sites. Easily leachable main nutrient contents were highest in the humus horizons. Calcium and magnesium were the dominating nutrients. Calcium was around 20 times and magnesium around 5 times higher in OL-KK16 and OL-KK17 than in OL-KK19. Also iodine and selenium concentrations were around seven times higher in OL-KK16 and OL-KK17 than in OL-KK19.
Cation exchange capacity and base saturation values varied by different soil profiles. The CEC was highest in the humus horizon of OL-KK16 and OL-KK17, calcium and magnesium being the dominating cations indicating the good buffering capacity of these soils. In OL-KK14 and OL-KK15 aluminium and iron concentrations were higher compared to base cation concentrations than in other studied soil pits. In OL-KK19 CEC and BS were low.
Sulphur, phosphorus, iron, zinc and sodium were enriched in the humus horizons. In the mineral soil layers aluminum and iron were enriched in MS1 and MS2 (the topmost mineral soil layers). Aluminium and iron concentrations were highest in OL-KK14 and OL-KK15, where the clay content was also the highest. Phosphorus, potassium, lead and zinc concentrations were highest in OL-KK14 and OL-KK18. The total concentrations of main trace elements showed an opposite pattern compared to ammonium acetate digested concentrations; iron, manganese, sodium and zinc concentration were not highest in the humus horizon, but in the mineral soil layers, mainly in MS1 and MS2 layers. The highest values were found in OL-KK14 and OL-KK15. The easily leachable metal concentrations showed a similar patter in Al, As, Cd, Co, Ni, Pb and V, being clearly higher in the humus horizons, especially aluminium, nickel and lead concentrations. The highest contents were in OL-KK14 and OL-KK15, and also lead in OL-KK18.
The bioavailable fraction (%) of the main elements soluble on ammonium acetate and total digestions was estimated by using the ratio of these digestions and expressed as percents. The solubility of most analysed elements (Al, Ba, Ca, Co, Cr, Fe, K, Mg, Mn, Na, Ni, P and Zn) was significantly higher in the humus layers than in the mineral soil layers. The main reasons for the heterogeneous geochemistry were mainly quite large variation in the thickness and quality of the humus horizons and in the amount of the clay and fine fraction contents between the soil pits and within different soil profile layers.

59
REFERENCES
Birkeland, P.W. 1974. Pedology, weathering and geomorphological research. New
York, Oxford University Press, 285 p.
Brady, N.C. 1984. The nature and properties of soils. New York, Macmillan
Publishing Company. 750 p.
Derome, J. 2003. Kemialliset ominaisuudet. In Mälkönen, E. (ed.) Metsämaa ja sen
hoito (in Finnish). Metsäntutkimuslaitos, 63–80.
Donner, J. 1995. The Quaternary history of Scandinavia. Cambridge, Cambridge
University. 200 p.
Eronen, M. & Lehtinen, K. 1996. Description of the Quaternary geological history of
Romuvaara, Kivetty an Olkiluoto sites (in Finnish with an English abstract). Posiva
Oy, Working Report PATU-96-74, 7 p.
Eronen, M., Glückert, G., van de Plassche, O., van der Plicht, J. & Rantala P. 1995.
Land uplift in the Olkiluoto-Pyhäjärvi area, southwestern Finland, during the last 8000
years, YJT-95-17. Helsinki, Voimayhtiöiden ydinjätetoimikunta 1995. 26 p. + App.
Erviö, R. 1975. Cultivated sulphate soils in a drainage basin of river Kyrönjoki (in
Finnish with an English summary). Journal of Sci. Agr. Soc. Finland. Vol. 47, 550-
561.
Evans, L.J. 1980. Podzol development of North Lake Huron in relation to geology and
vegetation. Canadian Journal of Soil Science 60. 527-537.
Haapanen, R. Aro, L. Ilvesniemi, H. Kareinen, T. Kirkkala, T. Lahdenperä A-M.
Mykrä, S. Turkki, H. & Ikonen, A. 2007. Olkiluoto Biosphere Description 2006.
Posiva Oy, POSIVA Report 2007-02. 181 p. http://www.posiva.fi/
Haapanen, R., Aro, L., Helin, J., Hjerpe, T., Ikonen, A.T.K, Kirkkala, T., Koivunen, S.,
Lahdenperä, A-M., Puhakka, L., Rinne, M. & Salo, T. 2009. Olkiluoto Biosphere
Description 2009. Posiva Oy. POSIVA Report 2009–02. 424 p. http://www.posiva.fi/
Haapanen, R. & Lahdenperä A-M. 2009. Olkiluodon maalta merelle -linjaston
maaosuuden inventointi vuonna 2008 ja Olkiluodon ympäristön ruovikkotutkimukset
vuosina 2007–2008 (in Finnish with an English abstract). Posiva Oy, Working Report.
(in preparation).
Hagros, A. 1999. Soil properties and constructability of the Olkiluoto investigation site
(in Finnish with an English abstract). M.Sc. theses, University of Helsinki, Department
of Geology, Division of Geology and Paleontology.
Heikkinen, P. 2000. Haitta-aineiden sitoutuminen ja kulkeutuminen maaperässä.
Summary in English: Retention and migration of harmful substances in the soil. Report
of Investigations 150. Geological Survey of Finland, Espoo. 41 p.

60
Hjerpe, T., Ikonen, A.T.K. & Broed, R. 2009. Biosphere Assessment 2009. Posiva Oy,
POSIVA 2009 (in preparation).
Huhta, P. 2005. Studies of Quaternary deposits in Olkiluoto in 2004 (in Finnish with
an English abstract). Posiva Oy, Working Report 2005-20. 102 p. http://www.posiva.fi/
Huhta, P. 2008. Studies of Quaternary deposits of investigation trench OL-TK14 at the
Olkiluoto study site, Eurajoki, SW Finland. Posiva Oy, Working Report 2008-31. 37 p.
http://www.posiva.fi/
Huhta, P. 2009. Studies of Quaternary deposits in investigation trenches OL-TK15 and
OL-TK16 on the Olkiluoto study site, Eurajoki, SW Finland. Posiva Oy, Working
Report 2009-25. http://www.posiva.fi/
Ikonen, A. 2002. On migration of radionuclides in peaty environment and on
geochemistry of Olkiluodonjärvi wetland (in Finnish with an English abstract). Posiva
Oy. Working Report 2002-14. 107 p.
ISO10390. 2005. ISO Standards: Soil quality. Determination of pH.
Jacks, G., Knutsson, G., Maxe, L. & Fylkner, A. 1984. Effect of acid rain on soil and
groundwater in Sweden. In Yaron B., Bagan, G. & Goldsmid, J. (eds.) Pollutants in
Porous Media. New York, Springer Verlag, 94-114.
Jauhiainen, E. 1973. Age and degree of podzolisation of sand soils on the coastal plain
of northwest Finland. Commentationes Biologicae 68, 1–32.
Kabata-Pendias, A. & Pendias, H. 1992. Trace elements in soils and plants. 2nd
Edition. CRC Press. 365 p.
Kähkönen, A-M. 1996. The geochemistry of podzol soils and its relation to lake water
chemistry, Finnish Lapland. Geological Survey of Finland. Bulletin 385. 89 p.
Kahma, K., Johansson, M. & Boman, H. 2001. Meriveden pinnankorkeuden jakauma
Loviisan ja Olkiluodon rannikolla seuraavien 30 vuoden aikana (in Finnish: The
distribution of the sea water level at the coasts of Loviisa and Olkiluoto in the
following 30 years). Helsinki, Finland, Merentutkimuslaitos. 28 p.
Karvonen, T. 2009. Modelling of solute transport through overburden for Biosphere Assessment 2009. Posiva Oy, Working Report. In preparation.
Kärki, A. & Paulamäki, S. 2006. Petrology of Olkiluoto. Posiva Report POSIVA 2006-
02. Posiva Oy, Eurajoki. 87 p.
Koljonen, T. (ed.) 1992. The Geochemical Atlas of Finland, Part 2: Till. Geological
Survey of Finland. Espoo. 218 p.
Kontio, M. & Kähkönen, A-M. 1991. Geochemistry and variations of the sensitivity of
soils to acidification in northern Finland. In: Pulkkinen, E. (ed.) Environmental
Geochemistry in Northern Europe. Proceedings of the First Symposium on

61
Environmental Geochemistry in Northern Europe held in Rovaniemi, Finland 17-19
October 1989. Geological Survey of Finland, Special Paper 9, 53-60.
Lahdenperä, A-M., Palmén, J. & Hellä, P. 2005. Summary of overburden studies at
Olkiluoto with an emphasis on geosphere-biosphere interface. Posiva Oy, Working
Report 2005-11. 85 p. http://www.posiva.fi/
Lahdenperä, A-M. 2006. Review of geosphere-biosphere interface and their handling
in the Safety Case of Posiva. 166 p. Posiva Oy, Working Report 2006-110. 161 p.
http://www.posiva.fi/
Lehtimäki, T. 2001. Summary of hydrological observations at Olkiluoto area, Eurajoki,
in 1996-2001 (in Finnish with an English abstract). Helsinki, Finland: Posiva Oy.
Working Report 2001-31. 34 p.
Lehtimäki, T. 2003. Supplementary interpretation of seismic refraction data at
Olkiluoto. Posiva Oy. Working Report 2003-63. 42 p.
Leino, J. 2001. Ground penetrating radar probing at Olkiluodonjärvi area in Olkiluoto,
Eurajoki, year 2001 (in Finnish with an English abstract). Posiva Oy. Working Report
2001-27. 50 p.
Lilja, H., Uusitalo, R., Yli-Halla, M., Nevalainen, R., Väätänen, T. & Tamminen, P.
2006. Finnish soil database. Soil map at scale 1.250,000 and properties of soil (in
Finnish with an English abstract). MTT, Agrifood Research Finland. Vol. 114, 70 p.
http://www.mtt.fi/
Lindberg, A. & Paulamäki, S. 2004. Geological mapping of the investigation trench
OL-TK3 at the Olkiluoto Study site, Eurajoki, SW Finland. Posiva Oy. Working
Report 2003-40.
Lintinen, P., Kahelin, H., Lindqvist, K. & Kaija J. 2003. Soil sample analyses of
Olkiluoto. Olkiluoto, Posiva Oy. Working Report 2003-01. 123 p.
Lintinen, P. & Kahelin, H. 2003. Soil sample analyses of Olkiluoto 2003. Olkiluoto,
Posiva Oy. Working Report 2003-38. 29 p.
Lusa, M., Ämmälä, K., Hakanen, M., Lehto, J. & Lahdenperä, A-M. 2009. Chemical
and geotechnical analyses of soil samples from Olkiluoto for studies on sorption in
soils. Posiva Oy. Working Report 2009-33. 152 p. http://www.posiva.fi/
Mäkiaho, J-P. 2005. Development of shoreline and topography in the Olkiluoto area,
western Finland, 2000 BP – 8000 AP. Posiva Oy, Working Report 2005-70. 47 p.
http://www.posiva.fi/
Nordbäck, N. 2007. Geological mapping of investigation trench OL-TK14 at the
Olkiluoto study site, Eurajoki, SW Finland. Posiva Oy, Working Report 2007-98. 67 p.
http://www.posiva.fi/

62
Nuotio, T., Hyyppä, J. & Nylander, J. 1990. Buffering capacity of Finnish soils and its
dependence on geological factors in relation to acidification sensitivity of lakes. In:
Kauppi, P., Anttila, P. & Kenttämies, K. (eds.) Acidification in Finland. Berlin,
Springer- Verlag, 271-286.
Ojala, A.E.K., Ikävalko, J., Palmu, J-P., Vanhala, H., Valjus, T., Suppala, I., Salminen,
R., Lintinen, P. & Huotari, T. 2007. Espoon Suurpellon alueen maaperän
ominaispiirteet (in Finnish with an English abstract). Geological Survey of Finland.
P22.4/2007/39, 51 p.
Palko, J. 1994. Acid sulphate soils and their agricultural and environmental problems
in Finland. Ph.D. thesis. Acta Universitatis Ouluensis, Series C. Vol. 75, 58 p.
Pitkänen, P., Partamies, S., Lahdenperä, A-M., Lehtinen, A., Pedersen, K., Ahokas, T.,
Penttinen, T., Lamminmäki, T. & Hatanpää, E. 2008a. Results of Monitoring at
Olkiluoto in 2007. Hydrogeochemistry. Posiva Oy. Working Report 2008-24. 218 p. .
http://www.posiva.fi/
Pitkänen, P., Korkealaakso, J., Löfman, J., Keto, V., Lehtinen, A., Lindgren, S.,
Ikonen, A., Aaltonen, I., Koskinen, L., Ahokas, H., Ahokas, T. & Karvonen, T. 2008b.
Investigation Plan for Infiltration Experiment in Olkiluoto. Posiva Oy. Working Report
2008-53. 37 p. . http://www.posiva.fi/
Posiva Oy. 2003. Baseline Conditions at Olkiluoto. Eurajoki, Finland. Posiva Oy.
Posiva 2003-02. 159 p. http://www.posiva.fi/
Posiva Oy. 2009. Olkiluoto Site Description 2008. Eurajoki, Finland. Posiva Oy.
Posiva 2009-01. 714 p. http://www.posiva.fi/
Räisänen, ML. 1989. Mica and clay mineral weathering and acidification in podzolized
mineral soils. Working Report, Geological Survey of Finland. 61 p.
Rantataro, J. 2001. Acoustic-seismic research in the sea area near Olkiluoto in the year
2000 (in Finnish with an English abstract). Posiva Oy, Working Report 2001-11.
Rantataro, J. 2002. The estimation of sedimentary rock covered areas as well as
supplementary interpretation of acoustic-seismic research in Olkiluoto area (in Finnish
with an English abstract). Posiva Oy, Working Report 2002-38.
Rantataro, J. & Kaskela, A. 2009. Acoustic seismic studies in the sea area close to
Olkiluoto, 2008. Posiva Oy, Working Report 2009 (in preparation).
Rautio, P., Latvajärvi, H., Jokela, A. & Kangas-Korhonen, P. 2004. Forest resources
on Olkiluoto Island. Olkiluoto, Finland: Posiva Oy. Working Report 2004-35. 109 p.
http://www.posiva.fi/
Selezniev, Y.M. & Tiuriukanov, A.N. 1971. Trace element addition to soil by
application of NPK fertilizers. Fert. Res. 2, 289 p.
63
Seppälä, M. 2005. Glacially sculptured landform. In: Seppälä, M. (ed.). The physical
geography of Fennoscandia. USA: Oxford University Press. p. 35–37.
Starr, M.R. 1991. Soil formation and fertility along a 5000 year chronosequence. In:
Pulkkinen, E. (ed.). Environmental geochemistry in northern Europe. Geological
Survey of Finland, Special Paper. Vol. 9, p. 99–104.
Strahler, A.N. 1970. Introduction to physical geography. Second edition. New York.
John Wiley & Sons. Inc.
Tamminen, P. 2000. Soil factors. In: Mälkönen, E. (ed.) Forest condition in changing
environment – The Finnish case. Forestry Sciences. Kluwer Academic Publishes,
Dordrecht. 72-86.
Tamminen, P., Aro, L. & Salemaa, M. 2007. Forest soil survey and mapping of
vegetation nutrition on Olkiluoto Island. Results from the first inventory on FEH plots.
Posiva Oy, Working Report 2007-78. 110 p. http://www.posiva.fi/
Vaittinen, T., Ahokas, H., Heikkinen, E., Hellä, P., Nummela, J., Saksa, P., Tammisto,
E., Paulamäki, S., Paananen, M., Front, K. & Kärki, A. 2003. Bedrock Model of the
Olkiluoto Site. Posiva Oy. Working Report 2003-43.
Westman, C.J. 1991. Soil and its function as culture medium (in Finnish). University
of Helsinki Department of Sivilculture Research Notes N:o 67.
Whitehead, D.C. 1975. Uptake by perennial ryegrass of iodine, elemental iodine and
iodate added to soil as influenced by various amendments. J. Sci. Food Agric., 26, 361
p.
Vuorela, A., Penttinen, T. Lahdenperä, A-M. 2009. Review of Bothnian Sea Shore-
Level Displacement Data and Use of a GIS Tool to Estimate Isostatic Uplift. Posiva
Oy. Working Report 2009-17. 191 p. http://www.posiva.fi/

64

65
APPENDICES
APPENDIX 1. Description of soil sampling sites and layers.
APPENDIX 2. Geochemical analysis results of the soil samples OL-KK14…OL-KK19 Appendix 2.1. pH, Carbon, nitrogen, moisture, dry matter, LOI, Se and I contents
Appendix 2.2. Element concentrations analysed by ammonium acetate (pH 4.5)
digestion
Appendix 2.3. Element concentrations analysed by hydrofluoric acid – perchloric acid
digestion
APPENDIX 3. Detection limits of ammonium acetate (pH 4.5) and hydrofluoric acid -
perchloric acid digestions
APPENDIX 4. Grain size distribution of OL-KK14…OL-KK19 Appendix 4.1. Grain size distribution of OL-KK14, OL-KK15 and OL-KK16
Appendix 4.2. Cumulative weight percent of different grain sizes of OL-KK14, OL-
KK15 and OL-KK16
Appendix 4.3. Grain size distribution of OL-KK17, OL-KK18 and OL-KK19
Appendix 4.4. Cumulative weight percent of different grain sizes of OL-KK17, OL-
KK18 and OL-KK19
- Cumulative grain size distribution of OL-KK17 in the mineral soil layer (30-46
cm) by sedigraph analysis and dry sieving.
- Cumulative grain size distribution of OL-KK17 in the mineral soil layer (46-82
cm) by sedigraph analysis and dry sieving.
- Cumulative gain size distribution of OL-KK18 in the mineral soil layer 20-200
cm by sedigraph analysis and dry sieving.
- Cumulative grain size distribution of OL-KK18 in the mineral soil layer (200-
220 cm) by sedigraph analysis and dry sieving.
- Cumulative grain size distribution of OL-KK19 in the mineral soil layer (20-
200 cm) by sedigraph analysis and dry sieving.
- Cumulative grain size distribution of OL-KK19 in the mineral soil layer (200-
235 cm) by sedigraph analysis and dry sieving.

66
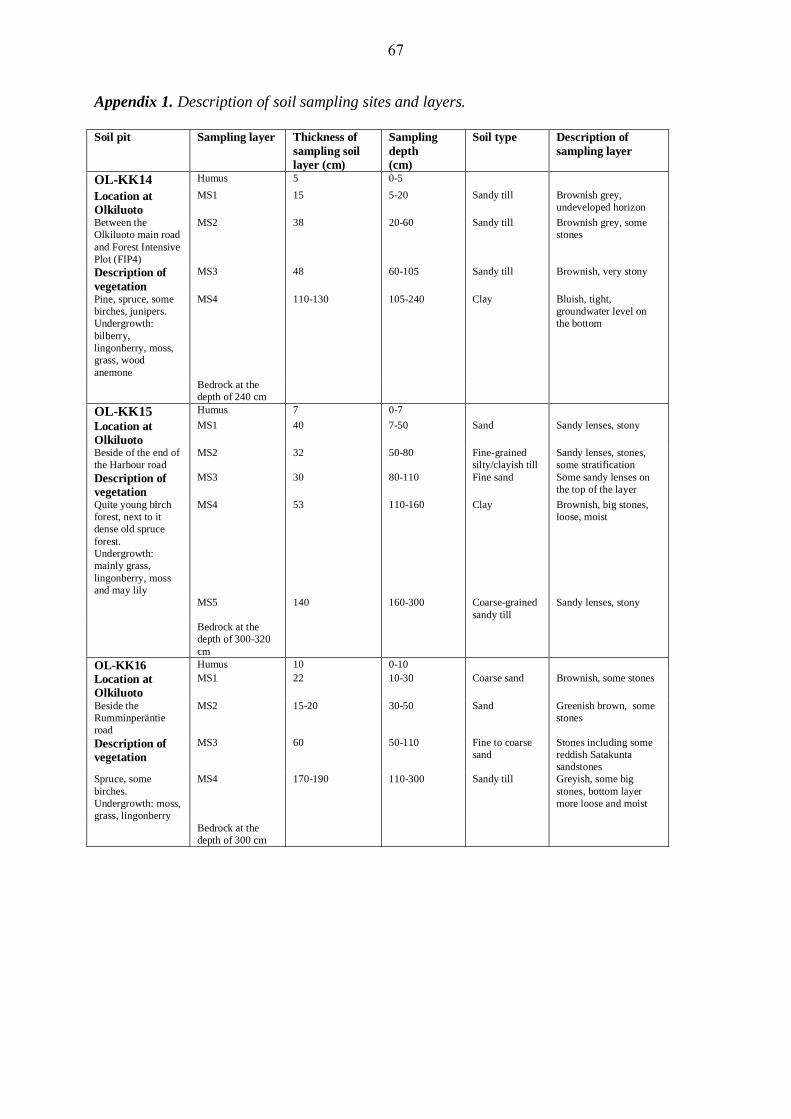
Appendix 1. Description of soil sampling sites and layers. Soil pit Sampling layer Thickness of
sampling soil layer (cm)
Sampling depth (cm)
Soil type Description of sampling layer
OL-KK14 Humus 5 0-5
Location at Olkiluoto
MS1 15 5-20 Sandy till Brownish grey, undeveloped horizon
Between the Olkiluoto main road and Forest Intensive Plot (FIP4)
MS2 38 20-60 Sandy till Brownish grey, some stones
Description of vegetation
MS3 48 60-105 Sandy till Brownish, very stony
Pine, spruce, some birches, junipers. Undergrowth: bilberry, lingonberry, moss, grass, wood anemone
MS4 110-130 105-240 Clay Bluish, tight, groundwater level on the bottom
Bedrock at the depth of 240 cm
OL-KK15 Humus 7 0-7 Location at Olkiluoto
MS1 40 7-50 Sand Sandy lenses, stony
Beside of the end of the Harbour road
MS2 32 50-80 Fine-grained silty/clayish till
Sandy lenses, stones, some stratification
Description of vegetation
MS3 30 80-110 Fine sand Some sandy lenses on the top of the layer
Quite young birch forest, next to it dense old spruce forest. Undergrowth: mainly grass, lingonberry, moss and may lily
MS4 53 110-160 Clay Brownish, big stones, loose, moist
MS5 140 160-300 Coarse-grained sandy till
Sandy lenses, stony
Bedrock at the depth of 300-320 cm
OL-KK16 Humus 10 0-10 Location at Olkiluoto
MS1 22 10-30 Coarse sand Brownish, some stones
Beside the Rumminperäntie road
MS2 15-20 30-50 Sand Greenish brown, some stones
Description of vegetation
MS3 60 50-110 Fine to coarse sand
Stones including some reddish Satakunta sandstones
Spruce, some birches. Undergrowth: moss, grass, lingonberry
MS4 170-190 110-300 Sandy till Greyish, some big stones, bottom layer more loose and moist
Bedrock at the depth of 300 cm
67

Appendix 1. (cont´d) Description of soil sampling sites and layers. Soil pit Sampling layer Thickness of
sampling soil layer (cm)
Sampling depth (cm)
Soil type Description of sampling layer
OL-KK17 Humus 30 0-30
Location at Olkiluoto
MS1 16 30-46 Sandy till No information
In the Infiltration Experiment area
MS2 36 46-82 Sandy till No information
Description of vegetation
Bedrock was not reached
Mixed forest: pine, spruce, birch
OL-KK18 Humus 20 0-20
Location at Olkiluoto
MS1 180 20-200 Fine-grained/clayey till
Stones (ø 0.5-1.0 m)
In the Infiltration Experiment area
MS2 20 200-220 Clay Grey and tight
Description of vegetation
Bedrock was not reached
Mixed forest: pine, spruce, birch
OL-KK19 Humus 20 0-20
Location at Olkiluoto
MS1 180 20-200 Fine-grained/clayey till
Stones (ø 0.5-1.0 m)
In the Infiltration Experiment area
MS2 35 200-235 Clay Grey and tight
Description of vegetation
Bedrock was not reached
Mixed forest: pine, spruce, birch
68

Appendix 2.1. pH, carbon, nitrogen, moisture, dry matter, loss on ignition (LOI, organic matter content), selenium (Se) and iodine(I) contents.
Soil sample
Soil layer
Sampling depth (cm)
pH Carbon
mass-%dw Moisture mass-%
Dry matter mass- %dw
LOI mass-%dw
Nitrogen mass-%dw
TOC %
Sedw (mg/kg)
Idw (mg/kg)
Humus 0-5 3.64 30.5 31.4 68.6 50.7 1.41 28 0.696 12.6
MS1 5-20 5.18 0.20 7.50 92.5 0.92 <0.03 - 0.113 0.967
MS2 20-60 5.70 0.27 11.2 88.8 0.16 0.04 - 0.135 0.69
MS3 60-105 5.81 0.13 5.30 94.7 0.61 <0.03 - 0.087 0.203
OL-KK14
MS4 105-240 7.59 0.18 7.30 92.7 0.55 <0.03 - 0.080 0.14
Humus 0-7 3.88 21.9 33.8 66.2 39.1 1.18 22 0.677 21.9
MS1 7-50 4.66 0.22 0.40 99.6 0.66 0.04 - 0.030 0.616
MS2 50-80 6.45 0.33 2.60 97.4 1.32 0.04 - 0.197 0.373
MS3 80-110 6.96 0.18 0.80 99.2 0.75 <0.03 - 0.077 0.2
MS4 110-160 7.48 0.23 2.00 98.0 0.76 0.03 - 0.078 0.284
OL-KK15
MS5 160-300 7.66 0.14 0.70 99.3 0.41 <0.03 - 0.106 <0.05
Humus 0-10 4.83 31.8 48.1 51.9 58.5 2.02 32 0.794 29.7
MS1 10-30 5.44 0.64 8.50 91.5 1.83 0.07 - 0.089 2.04
MS2 30-50 6.29 0.14 2.60 97.4 0.60 <0.03 - 0.096 0.281
MS3 50-110 7.32 0.13 1.30 98.7 0.36 <0.03 - 0.039 <0.05
OL-KK16
MS4 110-300 7.52 0.13 3.90 96.1 0.36 <0.03 - 0.052 <0.05
Humus 0-30 5.40 26.3 49.2 50.8 45.7 0.98 - 0.742 20.1
MS1 30-46 5.90 0.41 3.80 96.2 1.16 0.05 - 0.100 0.491
OL-KK17
MS2 46-82 6.56 0.12 5.60 94.4 0.68 <0.03 - 0.068 0.475
Humus 0-20 3.47 31.9 50.2 49.8 49.7 1.17 - 0.401 5.91
MS1 20-200 6.03 0.07 8.10 91.9 0.54 <0.03 - 0.050 0.11
OL-KK18
MS2 200-220 7.22 0.18 9.50 90.5 0.45 <0.03 - 0.074 0.19
Humus 0-20 3.33 9.89 30.9 69.1 15.8 0.29 - 0.158 2.86
MS1 20-200 7.42 0.11 7.80 92.2 0.42 <0.03 - 0.047 0.17
OL-KK19
MS2 200-235 7.67 0.14 8.40 91.6 0.43 <0.03 - 0.101 0.08
69

Appendix 2.2. Bioavailble element concentrations (dry weight) analysed by ammonium acetate (pH 4.5) digestion.
NH4Ac digestion, pH 4.5 (mg/kg) Soil sample
Soil layer
Sampling depth (cm)
Al As B Ba Ca Cd Co Cr Cu Fe K Li Mg
Humus 0-5 740 0.26 <0.5 21.3 1560 0.38 1.42 0.73 1.04 1030 341 <0.05 285
MS1 5-20 46.3 0.05 <0.5 11.5 391 <0.1 <0.1 0.11 0.64 106 38.5 0.15 98.3
MS2 20-60 40.0 0.06 <0.5 10.4 620 <0.1 <0.1 0.10 0.91 80.0 51.0 0.19 110
MS3 60-105 21.4 0.09 <0.5 5.10 365 <0.1 <0.1 <0.1 1.18 83.4 39.4 0.11 60.5
OL-KK14
MS4 105-240 34.3 0.15 <0.5 5.63 1370 <0.1 0.46 <0.1 2.07 147 56.1 0.09 81.8
Humus 0-7 369 0.44 <0.5 4.15 3580 0.24 0.85 1.08 1.57 2230 195 0.06 347
MS1 7-50 69.1 0.06 <0.5 1.73 124 <0.1 0.37 0.25 0.60 90.4 16.2 <0.05 32.6
MS2 50-80 88.6 0.15 <0.5 12.4 676 <0.1 0.16 0.19 2.72 189 135 0.22 204
MS3 80-110 42.4 0.10 <0.5 6.26 1090 <0.1 0.12 0.11 0.94 128 61.0 0.12 110
MS4 110-160 59.0 0.43 <0.5 9.61 1860 <0.1 0.71 0.19 2.33 224 143 0.22 198
OL-KK15
MS5 160-300 18.5 0.12 <0.5 4.93 1340 <0.1 0.28 <0.1 1.40 85.7 59.7 0.07 104
Humus 0-10 241 0.27 <0.5 5.05 10700 0.41 0.48 0.44 1.02 427 237 0.1 1120
MS1 10-30 52.8 0.08 <0.5 3.30 650 <0.1 <0.1 0.30 0.64 249 26.2 0.08 62.5
MS2 30-50 35.4 0.08 <0.5 4.63 364 <0.1 0.14 <0.1 1.36 112 31.9 0.11 47.5
MS3 50-110 11.9 0.09 <0.5 3.43 1350 <0.1 0.14 <0.1 1.11 62.3 30.3 <0.05 69.9
OL-KK16
MS4 110-300 15.3 0.09 <0.5 4.26 1560 <0.1 0.23 <0.1 2.36 91.5 37.8 0.05 77.8
Humus 0-30 108 0.09 0.82 5.38 13800 0.73 1.07 0.16 0.51 19.7 253 0.16 866
MS1 30-46 32.2 <0.03 <0.5 1.77 682 <0.1 <0.1 <0.1 0.37 9.36 17.2 0.10 29.7
OL-KK17
MS2 46-82 20.3 0.09 <0.5 3.79 518 <0.1 <0.1 <0.1 1.16 52.7 28.5 0.12 31.6
Humus 0-20 55.5 0.09 <0.5 23.8 2880 0.50 0.36 0.19 0.37 18.7 583 0.06 472
MS1 20-200 19.4 0.06 <0.5 4.07 403 <0.1 <0.1 <0.1 0.53 40.2 26.5 0.08 23.6
OL-KK18
MS2 200-220 31.9 0.13 <0.5 4.34 2060 <0.1 0.44 <0.1 2.02 123 48.0 0.09 90.9
Humus 0-20 250 0.12 <0.5 7.59 616 0.16 0.39 0.66 0.53 345 81.2 0.06 146
MS1 20-200 20.0 0.05 <0.5 3.46 1510 <0.1 0.11 <0.1 0.71 44.7 27.6 0.06 26.2
OL-KK19
MS2 200-235 17.3 0.03 <0.5 3.29 1610 <0.1 0.21 <0.1 1.69 52.8 36.7 0.06 53.4
70

Appendix 2.2. (cont`d) Bioavailble element concentrations (dry weight) analysed by ammonium acetate (pH 4.5) digestion.
NH4Ac digestion, pH 4.5 (mg/kg) Soil sample
Soil layer
Sampling depth (cm)
Mn Mo Na Ni P Pb S Sb Sr Ti V Zn
Humus 0-5 27.4 <0.03 49.0 2.27 36.5 16.5 91.9 0.01 9.82 2.39 0.26 22.6
MS1 5-20 1.83 <0.03 8.76 <0.5 4.80 0.44 4.93 <0.01 1.98 0.25 <0.1 0.31
MS2 20-60 2.12 <0.03 9.25 <0.5 16.7 0.36 5.21 <0.01 2.22 0.25 <0.1 0.30
MS3 60-105 3.61 <0.03 4.43 <0.5 21.3 4.87 17.5 <0.01 1.12 0.20 <0.1 0.45
OL-KK14
MS4 105-240 44.3 0.03 4.16 0.71 14.8 0.86 58.5 0.01 1.34 0.24 0.31 0.96
Humus 0-7 7.47 0.04 32.0 2.02 23.9 5.49 91.1 0.01 19.6 3.61 0.74 2.81
MS1 7-50 2.87 0.06 3.07 <0.5 6.61 0.20 7.89 <0.01 0.91 0.49 0.11 0.36
MS2 50-80 14.0 <0.03 24.9 0.67 8.81 1.02 36.4 0.01 3.57 0.24 <0.1 1.07
MS3 80-110 16.9 <0.03 12.3 <0.5 10.0 0.59 19.6 <0.01 2.12 0.20 <0.1 0.53
MS4 110-160 62.4 0.07 19.1 1.27 18.8 1.97 68.2 0.02 3.30 0.30 0.66 1.16
OL-KK15
MS5 160-300 29.2 0.05 9.79 0.51 16.1 4.82 35.1 <0.01 1.68 0.22 0.23 0.81
Humus 0-10 7.89 <0.03 84.6 1.54 18.2 7.25 83.1 0.01 15.4 0.75 0.37 9.73
MS1 10-30 0.46 0.03 6.27 <0.5 4.71 0.37 14.2 <0.01 1.24 0.46 0.21 0.16
MS2 30-50 2.02 <0.03 3.88 <0.5 12.3 0.39 12.5 <0.01 1.07 0.16 <0.1 0.87
MS3 50-110 22.0 <0.03 4.34 <0.5 12.4 0.50 26.9 <0.01 1.54 0.25 <0.1 0.60
OL-KK16
MS4 110-300 33.5 0.05 5.35 <0.5 13.4 0.54 32.0 <0.01 1.53 0.20 0.21 0.66
Humus 0-30 61.6 <0.03 46.6 0.97 16.5 3.20 56.0 0.01 20.5 <0.1 0.10 12.20
MS1 30-46 1.70 <0.03 <3 <0.5 9.26 <0.1 11.1 <0.01 1.02 0.18 <0.1 0.13
OL-KK17
MS2 46-82 2.56 <0.03 6.01 <0.5 19.8 0.25 7.87 <0.01 0.95 0.21 <0.1 0.21
Humus 0-20 153 <0.03 19.1 1.01 73.0 17.5 68.2 0.01 8.57 1.00 0.19 43.0
MS1 20-200 2.99 <0.03 3.44 <0.5 28.5 0.32 3.31 <0.01 0.71 0.24 <0.1 0.38
OL-KK18
MS2 200-220 43.3 0.03 4.33 0.59 12.3 0.78 36.9 <0.01 1.59 0.23 0.38 0.76
Humus 0-20 7.51 <0.03 10.8 1.17 25.7 5.68 17.5 <0.01 3.10 2.18 0.23 8.00
MS1 20-200 14.5 <0.03 <3 <0.5 11.2 0.48 <2 <0.01 1.09 0.31 <0.1 0.79
OL-KK19
MS2 200-235 23.8 0.03 <3 <0.5 10.7 0.36 31.9 <0.01 1.37 0.25 0.10 0.38
71

Appendix 2.3. Total element concentrations (dry weight) analysed by hydrofluoric acid-perchloric acid digestion.
Hydrofluoric acid-perchloric acid digestion (mg/kg) Soil sample
Soil layer Sampling depth (cm) Al As Ba Be Bi Ca Cd Co Cr Cu
Humus 0-5 21400 2.54 207 <0.5 0.43 4080 0.77 5.03 21.8 65.0
MS1 5-20 52800 4.12 464 1.88 0.16 10400 <0.1 10.8 53.8 19.2
MS2 20-60 61300 5.77 518 2.64 0.20 12300 0.22 15.7 84.7 27.4
MS3 60-105 49500 2.18 416 1.24 0.38 8370 <0.1 7.71 45.9 16.7
OL-KK14
MS4 105-240 47600 1.82 404 1.42 0.28 10500 <0.1 7.74 41.9 13.8
Humus 0-7 23300 5.57 198 1.08 0.43 8650 0.38 5.14 24.8 34.2
MS1 7-50 46300 0.54 416 0.57 0.15 8120 <0.1 3.88 23.7 29.8
MS2 50-80 62800 6.56 536 2.10 0.43 11500 0.12 14.8 66.9 25.9
MS3 80-110 47600 3.93 430 1.61 0.25 10200 0.21 10.9 49.0 19.2
MS4 110-160 49500 2.49 443 0.71 0.15 10900 <0.1 9.58 46.2 17.8
OL-KK15
MS5 160-300 43900 1.44 383 1.16 0.26 9670 <0.1 5.48 30.7 14.9
Humus 0-10 20200 6.25 152 <0.5 0.32 19500 0.74 4.05 32.7 52.2
MS1 10-30 44100 2.90 400 1.44 0.23 7700 0.21 4.18 34.1 9.02
MS2 30-50 45000 2.46 398 1.30 0.15 8390 <0.1 6.76 35.3 15.3
MS3 50-110 42300 1.61 391 0.60 0.13 9610 <0.1 5.36 26.0 9.99
OL-KK16
MS4 110-300 43000 1.09 397 0.65 0.13 10200 <0.1 5.71 28.0 11.6
Humus 0-30 23400 7.19 161 <0.5 0.62 23800 1.58 9.28 33.2 71.3
MS1 30-46 43700 <0.5 367 0.76 0.11 6310 <0.1 3.80 33.5 7.49
OL-KK17
MS2 46-82 46400 1.65 398 0.72 0.30 8440 <0.1 6.60 36.6 17.4
Humus 0-20 18100 1.90 191 <0.5 0.97 6230 0.64 2.29 16.1 25.9
MS1 20-200 46300 1.56 384 0.59 0.28 8050 <0.1 7.23 39.6 16.1
OL-KK18
MS2 200-220 44000 1.72 393 1.14 0.14 10600 <0.1 6.44 36.4 11.6
Humus 0-20 38100 1.18 315 0.94 0.24 4330 0.17 3.07 31.4 16.0
MS1 20-200 44500 1.49 381 1.08 0.25 9070 <0.1 6.37 34.5 15.8
OL-KK19
MS2 200-235 44400 1.47 380 0.93 0.28 9680 <0.1 6.22 33.1 11.4
72

Appendix 2.3. (cont`d) Total element concentrations (dry weight) analysed by hydrofluoric acid-perchloric acid digestion.
Hydrofluoric acid-perchloric acid digestion (mg/kg) Soil sample
Soil layer Sampling depth (cm) Fe K Li Mg Mn Mo Na Ni P Pb
Humus 0-5 10900 9040 <5 1380 103 1.22 4730 16.1 965 52.8
MS1 5-20 24900 21900 23.8 7430 510 0.72 13900 25.1 524 16.3
MS2 20-60 31800 24600 31.2 9870 604 0.95 14700 37.1 706 21.1
MS3 60-105 20000 23400 23.6 6040 343 <0.5 12500 21.1 514 20.3
OL-KK14
MS4 105-240 18500 21500 19.8 5660 334 <0.5 13400 17.2 499 15.0
Humus 0-7 22300 9680 5.83 2080 164 4.15 6730 12.9 668 23.8
MS1 7-50 11300 21600 16.7 3590 183 <0.5 15000 9.17 380 15.9
MS2 50-80 30200 26100 40.2 9980 518 1.45 15800 32.6 630 23.2
MS3 80-110 20400 21000 19.7 6050 391 0.58 13200 24.1 514 20.1
MS4 110-160 22000 21700 22.2 6940 405 0.55 12900 20.2 479 15.9
OL-KK15
MS5 160-300 15300 20800 15.4 4500 271 <0.5 12700 13.2 429 16.0
Humus 0-10 16900 7090 9.18 3410 89.1 2.36 3840 17.7 837 29.6
MS1 10-30 17600 20600 16.9 4380 209 1.42 12400 11.2 421 16.6
MS2 30-50 17500 20900 17.7 4710 243 <0.5 12900 16.6 500 15.7
MS3 50-110 13800 19700 12.7 3930 256 <0.5 12900 11.2 422 16.1
OL-KK16
MS4 110-300 14000 20100 13.8 4060 268 <0.5 13600 12.6 416 14.5
Humus 0-30 12600 10100 12.7 3780 228 0.99 4730 30.9 679 26.9
MS1 30-46 14400 23400 18.1 4130 191 <0.5 11600 12.5 489 14.3
OL-KK17
MS2 46-82 17800 21600 17.7 5120 293 <0.5 12700 16.5 482 14.9
Humus 0-20 5970 8350 5.93 1630 421 0.96 4460 10.9 724 69.2
MS1 20-200 17600 22200 17.3 5010 311 <0.5 12400 17.7 459 15.7
OL-KK18
MS2 200-220 16000 20200 13.9 4610 315 <0.5 13400 13.2 475 15.0
Humus 0-20 12300 19100 10.2 2820 126 0.52 9490 10.9 419 25.5
MS1 20-200 16000 21600 16.5 4600 266 1.07 12500 14.8 461 16.0
OL-KK19
MS2 200-235 15600 21400 18.0 4600 275 <0.5 12600 13.9 457 15.8
73

Appendix 2.3. (cont´d) Total element concentrations (dry weight) analysed by hydrofluoric acid- perchloric acid digestion.
Hydrofluoric acid-perchloric acid digestion (mg/kg) Soil sample
Soil layer Sampling depth (cm) Rb S Sb Sn Sr Ti Tl V Zn Zr
Humus 0-5 41.6 957 0.74 <2 59.5 752 0.43 14.8 60.9 47.7
MS1 5-20 106 <50 0.20 2.20 139 3250 0.69 57.8 58.7 132
MS2 20-60 138 70.2 0.45 3.07 149 4370 0.80 76.6 73.9 144
MS3 60-105 114 165 0.21 <2 121 2350 0.54 44.8 53.8 120
OL-KK14
MS4 105-240 97.2 600 0.25 <2 132 2310 0.46 42.2 48.4 127
Humus 0-7 50.2 1060 0.27 <2 97.4 1060 0.54 36.8 25.6 74.6
MS1 7-50 106 77.6 0.11 <2 131 1270 0.53 23.7 32.5 70.1
MS2 50-80 147 168 0.36 2.63 144 3160 0.78 73.4 82.6 120
MS3 80-110 116 209 0.35 2.59 131 2300 0.69 47.0 56.2 122
MS4 110-160 102 643 0.28 2.00 131 2530 0.44 51.2 55.4 110
OL-KK15
MS5 160-300 95.7 623 0.11 <2 123 1840 0.39 33.3 48.3 116
Humus 0-10 45.6 1860 0.46 <2 71.0 1170 0.52 30.7 34.4 47.3
MS1 10-30 102 212 0.14 <2 123 1760 0.48 35.4 72.8 80.7
MS2 30-50 102 106 0.21 <2 126 2030 0.57 37.9 53.6 116
MS3 50-110 86.3 460 0.14 <2 126 1800 0.35 28.3 39.8 111
OL-KK16
MS4 110-300 90.3 544 0.14 <2 132 1880 0.44 31.8 45.2 113
Humus 0-30 69.5 1400 0.71 <2 83.8 853 0.44 24.9 79.3 55.4
MS1 30-46 115 149 0.13 <2 103 1350 0.50 25.0 40.9 79.1
OL-KK17
MS2 46-82 101 63.1 <0.1 <2 122 2010 0.44 40.6 46.7 109
Humus 0-20 37.3 942 1.08 <2 54.5 901 0.19 18.1 112 43.9
MS1 20-200 107 63.4 0.15 <2 119 2060 0.57 40.4 50.4 114
OL-KK18
MS2 200-220 86.8 649 <0.1 <2 132 2150 0.37 36.0 44.9 123
Humus 0-20 99.7 237 0.17 2.07 85.3 1230 0.54 25.8 43.5 58.6
MS1 20-200 99.5 94.4 0.12 <2 120 1910 0.46 33.1 47.5 109
OL-KK19
MS2 200-235 99.7 520 0.15 2.04 122 1940 0.55 33.9 44.3 121
74

Appendix 3. Detection limits (mg/kg) of ammonium acetate (pH 4.5) and hydrofluoric acid-perchloric acid digestion.
Detection limit (mg/kg)
Element NH4Ac digestion
(bioavailble)
Hydrofluoric acid-perchloric acid
digestion (total concentration)
Al 2 100 As 0.03 0.5 B 0.5 - Ba 0.1 0.5 Be - 0.5 Bi - 0.1 Ca 5 200 Cd 0.1 0.1 Co 0.1 0.2 Cr 0.1 4 Cu 0.1 2 Fe 5 100 I 0.05 - K 10 200 Li 0.05 5 Mg 5 50 Mn 0.05 5 Mo 0.03 0.5 Na 3 200 Ni 0.5 4 P 2 100 Pb 0.1 1 Rb - 0.2 S 2 50 Sb 0.01 0.1 Se 0.01 - Sn - 2 Sr 0.05 3 Ti 0.1 10 Tl - 0.1 V 0.1 5 Zn 0.1 20 Zr - 10
- Not analysed
75

76

Appendix 4.1. The grain size distribution of OL-KK14, OL-KK15 and OL-KK16 in different mineral soil layers (Lusa et al. 2009).
Sampling site Layer <0.002 mm %
0.002-0.006 mm %
0.063-0.125 mm %
0.125-0.25 mm
%
02.5 -0.5 mm %
0.5-1.0 mm %
1.0-2.0 mm %
>2.0 mm %
OL-KK14 MS1 5-20 cm 1 4 15 15 20 14 7 24
OL-KK14 MS2 20-60 cm 11 26 7 12 16 13 9 6
OL-KK14 MS3 60-105 cm 6 20 12 12 15 12 10 13
OL-KK14 MS4 105-240 cm 5 25 15 13 13 11 11 7
OL-KK15 MS1 7-50 cm 0 1 3 9 15 10 20 42
OL-KK15 MS2 50-80 cm 12 26 2 12 15 13 11 9
OL-KK15 MS3 80-110 cm 5 22 15 14 13 12 8 11
OL-KK15 MS4 110-160 cm 8 15 11 12 19 16 13 6
OL-KK15 MS5 160-300 cm 4 15 15 15 13 9 9 20
OL-KK16 MS1 10-30 cm 2 8 8 9 13 12 20 28
OL-KK16 MS2 30-50 cm 6 19 12 11 15 11 11 15
OL-KK16 MS3 50-110 cm 5 23 17 16 14 8 6 11
OL-KK16 MS4 110-300 cm 4 23 18 16 15 6 7 11
77

Appendix 4.2. The cumulative weight percent of different grain sizes of OL-KK14, OL-KK15 and OL-KK16 in different mineral soil layer (Lusa et al. 2009).
Sampling site Layer <0.002 mm %
<0.006 mm %
<0.125 mm %
<0.25 mm %
<0.5 mm %
<1.0 mm %
<2.0 mm %
>2.0 mm %
OL-KK14 MS1 5-20 cm 1 5 20 35 55 69 76 100
OL-KK14 MS2 20-60 cm 11 37 44 56 72 85 94 100
OL-KK14 MS3 60-105 cm 6 26 38 50 65 77 87 100
OL-KK14 MS4 105-240 cm 5 30 45 58 71 82 93 100
OL-KK15 MS1 7-50 cm 0 1 4 13 28 38 58 100
OL-KK15 MS2 50-80 cm 12 38 40 52 67 80 91 100
OL-KK15 MS3 80-110 cm 5 27 42 56 69 81 89 100
OL-KK15 MS4 110-160 cm 8 23 34 46 65 81 94 100
OL-KK15 MS5 160-300 cm 4 19 34 49 62 71 80 100
OL-KK16 MS1 10-30 cm 2 10 18 27 40 52 72 100
OL-KK16 MS2 30-50 cm 6 25 37 48 63 74 85 100
OL-KK16 MS3 50-110 cm 5 28 45 61 75 83 89 100
OL-KK16 MS4 110-300 cm 4 27 45 61 76 82 89 100
78

Appendix 4.2. The cumulative weight percent of different grain sizes of OL-KK14 (above) and OL-KK15 (below) (Lusa et al. 2009).
79

Appendix 4.2. The cumulative weight percent of different grain sizes of OL-KK16 (Lusa et al. 2009).
80

Appendix 4.3. The grain size distribution of OL-KK17, OL-KK18 and OL-KK19 in different mineral soil layers and stone content.
Sampling site Layer <0.0006 mm %
0.0006- 0.001 mm
%
0.001-0.002 mm %
0.002-0.004 mm
%
0.004-0.006 mm
%
0.006-0.01 mm
%
0.01-0.016 mm
%
0.016-0.02 mm
%
0.02-0.03 mm %
OL-KK17 MS1 20-46 cm 3.9 1.4 4.0 5.4 2.9 3.7 3.9 2.2 4.6
OL-KK17 MS2 46-82 cm 1.2 0.2 0.4 0.8 0.3 0.6 0.7 0.3 0.9
OL-KK18 MS1 20-200 cm 3.7 1.8 4.0 5.0 2.8 3.6 3.8 2.1 4.3
OL-KK18 MS2 200-220 cm 6.7 1.6 4.5 7.0 4.4 6.8 7.0 3.5 6.1
OL-KK19 MS1 20-200 cm 4.1 1.3 3.4 4.8 2.8 4.1 4.3 2.3 5.2
OL-KK19 MS2 200-235 cm 3.8 1.0 3.6 4.6 2.8 4.0 4.5 2.5 5.2
Sampling site Layer 0.03-0.04 mm %
0.04-0.05 mm %
0.05-0.06 mm %
0.063-0.06 mm
%
0.06-0.02 mm %
0.02-0.63 mm %
0.63-2.0 mm %
>2.0 mm %
Stones %
OL-KK17 MS1 20-46 cm 0.7 0.4 0.2 0.2 26.3 24.5 28.4 13.9 2.44
OL-KK17 MS2 46-82 cm 3.5 2.1 0.8 0.4 21.2 19.2 12.3 8.9 21.6
OL-KK18 MS1 20-200 cm 3.2 1.9 0.8 0.5 20.5 18.4 13.2 10.4 19.9
OL-KK18 MS2 200-220 cm 4.4 2.4 0.9 1.2 21.2 13.3 5.6 3.4 2.88
OL-KK19 MS1 20-200 cm 3.7 2.0 0.8 1.0 22.2 18.6 12.0 6.4 18.9
OL-KK19 MS2 200-235 cm 3.8 2.4 0.9 0.9 24.3 19.2 11.2 5.3 7.8
81

Appendix 4.4. The cumulative weight percent of different grain sizes of OL-KK17, OL-KK18 and OL-KK19 in different mineral soil layers.
Sampling site Layer <0.0006 mm %
<0.001 mm %
<0.002 mm %
<0.004 mm %
<0.006 mm %
<0.01 mm %
<0.016 mm %
<0.02 mm %
<0.03 mm %
OL-KK17 MS1 20-46 cm 1.2 1.4 1.8 2.6 2.9 3.5 4.2 4.5 5.4
OL-KK17 MS2 46-82 cm 3.6 5.0 8.3 12.8 15.4 18.8 22.4 24.4 28.5
OL-KK18 MS1 20-200 cm 3.9 5.3 9.3 14.7 17.6 21.3 25.2 27.4 32.0
OL-KK18 MS2 200-220 cm 6.7 8.3 12.8 19.8 24.2 31.0 38.0 41.5 47.6
OL-KK19 MS1 20-200 cm 4.1 5.4 8.8 13.6 16.4 20.5 24.8 27.1 32.3
OL-KK19 MS2 200-235 cm 3.8 4.8 8.4 13 15.8 19.8 24.3 26.8 32.0
Sampling site Layer <0.04 mm %
<0.05 mm %
<0.06 mm %
<0.063mm %
<0.02 mm %
<0.63 mm %
<2.0 mm %
>6.3 mm
OL-KK17 MS1 20-46 cm 6.1 6.5 6.7 6.9 33.2 57.7 86.1 100
OL-KK17 MS2 46-82 cm 31.5 33.3 34.0 34.8 55.0 74.8 87.6 100
OL-KK18 MS1 20-200 cm 35.5 37.6 38.4 38.8 60.0 79.2 91.5 100
OL-KK18 MS2 200-220 cm 52.0 54.4 55.3 56.5 77.7 91.0 86.6 100
OL-KK19 MS1 20-200 cm 36.0 38.0 38.8 39.8 62.0 81.6 93.6 100
OL-KK19 MS2 200-235 cm 35.8 38.2 39.1 40.0 64.3 83.5 94.7 100
82

Labtium OyPL 1500Neulaniementie 570211 KUOPIOPuh: 010 653 8000Fax: 010 653 8489
Laboratorion näytetunnus : L08161711Tilausnumero : 213971Tilaajan näytetunnus : OL-KK17 30-46 cmTilaaja : Posiva Oy Susanna Lindgren
16.3.2009
________________________
Näytteestä poistettu >6 mm aines.
667C Humuspitoisuuden määritys spektrofotometrisesti (%) 0.61650G Karkean fraktion määritys ja poisto (%) 2.44651 Pesuseulonta OK
Sedigraph-analyysi (658)Kuivaseulonta seulasarjalla ISO 3310/1 (652)
2020.20.020.0020.0002 60.60.060.0060.0006
90
75
50
25
10
%GEO
RAK
Savi Siltti Hiekka Sora
Savi Hiesu Hieta Hiekka Sora Kiviä
D (mm) % D (mm) % D (mm) % D (mm) % D (mm) %20.0000 100.0 0.0630 6.9 0.0200 4.5 0.0020 1.86.3000 100.0 0.0600 6.7 0.0160 4.2 0.0010 1.42.0000 86.1 0.0500 6.5 0.0100 3.5 0.0006 1.20.6300 57.7 0.0400 6.1 0.0060 2.90.2000 33.2 0.0300 5.4 0.0040 2.6
83

Labtium OyPL 1500Neulaniementie 570211 KUOPIOPuh: 010 653 8000Fax: 010 653 8489
Laboratorion näytetunnus : L08161710Tilausnumero : 213971Tilaajan näytetunnus : OL-KK17 46-(82) cmTilaaja : Posiva Oy Susanna Lindgren
16.3.2009
________________________
Näytteestä poistettu >6 mm aines.
650G Karkean fraktion määritys ja poisto (%) 21.63651 Pesuseulonta OK
Sedigraph-analyysi (658)Kuivaseulonta seulasarjalla ISO 3310/1 (652)
2020.20.020.0020.0002 60.60.060.0060.0006
90
75
50
25
10
%GEO
RAK
Savi Siltti Hiekka Sora
Savi Hiesu Hieta Hiekka Sora Kiviä
D (mm) % D (mm) % D (mm) % D (mm) % D (mm) %20.0000 100.0 0.0630 34.8 0.0200 24.4 0.0020 8.36.3000 100.0 0.0600 34.0 0.0160 22.4 0.0010 5.02.0000 87.6 0.0500 33.3 0.0100 18.8 0.0006 3.60.6300 74.8 0.0400 31.5 0.0060 15.40.2000 55.0 0.0300 28.5 0.0040 12.8
84

Labtium OyPL 1500Neulaniementie 570211 KUOPIOPuh: 010 653 8000Fax: 010 653 8489
Laboratorion näytetunnus : L08161713Tilausnumero : 213971Tilaajan näytetunnus : OL-KK18 20-200 cmTilaaja : Posiva Oy Susanna Lindgren
16.3.2009
________________________
Näytteestä poistettu >6 mm aines.
650G Karkean fraktion määritys ja poisto (%) 19.94651 Pesuseulonta OK
Sedigraph-analyysi (658)Kuivaseulonta seulasarjalla ISO 3310/1 (652)
2020.20.020.0020.0002 60.60.060.0060.0006
90
75
50
25
10
%GEO
RAK
Savi Siltti Hiekka Sora
Savi Hiesu Hieta Hiekka Sora Kiviä
D (mm) % D (mm) % D (mm) % D (mm) % D (mm) %20.0000 100.0 0.0630 38.8 0.0200 27.4 0.0020 9.36.3000 100.0 0.0600 38.4 0.0160 25.2 0.0010 5.32.0000 91.5 0.0500 37.6 0.0100 21.3 0.0006 3.90.6300 79.2 0.0400 35.5 0.0060 17.60.2000 60.0 0.0300 32.0 0.0040 14.7
85

Labtium OyPL 1500Neulaniementie 570211 KUOPIOPuh: 010 653 8000Fax: 010 653 8489
Laboratorion näytetunnus : L08161714Tilausnumero : 213971Tilaajan näytetunnus : OL-KK18 200-220 cmTilaaja : Posiva Oy Susanna Lindgren
16.3.2009
________________________
Näytteestä poistettu >6 mm aines.
650G Karkean fraktion määritys ja poisto (%) 2.88651 Pesuseulonta OK
Sedigraph-analyysi (658)Kuivaseulonta seulasarjalla ISO 3310/1 (652)
2020.20.020.0020.0002 60.60.060.0060.0006
90
75
50
25
10
%GEO
RAK
Savi Siltti Hiekka Sora
Savi Hiesu Hieta Hiekka Sora Kiviä
D (mm) % D (mm) % D (mm) % D (mm) % D (mm) %20.0000 100.0 0.0630 56.5 0.0200 41.5 0.0020 12.86.3000 100.0 0.0600 55.3 0.0160 38.0 0.0010 8.32.0000 96.6 0.0500 54.4 0.0100 31.0 0.0006 6.70.6300 91.0 0.0400 52.0 0.0060 24.20.2000 77.7 0.0300 47.6 0.0040 19.8
86

Labtium OyPL 1500Neulaniementie 570211 KUOPIOPuh: 010 653 8000Fax: 010 653 8489
Laboratorion näytetunnus : L08161716Tilausnumero : 213971Tilaajan näytetunnus : OL-KK19 20-200 cmTilaaja : Posiva Oy Susanna Lindgren
16.3.2009
________________________
Näytteestä poistettu >6 mm aines.
650G Karkean fraktion määritys ja poisto (%) 18.91651 Pesuseulonta OK
Sedigraph-analyysi (658)Kuivaseulonta seulasarjalla ISO 3310/1 (652)
2020.20.020.0020.0002 60.60.060.0060.0006
90
75
50
25
10
%GEO
RAK
Savi Siltti Hiekka Sora
Savi Hiesu Hieta Hiekka Sora Kiviä
D (mm) % D (mm) % D (mm) % D (mm) % D (mm) %20.0000 100.0 0.0630 39.8 0.0200 27.1 0.0020 8.86.3000 100.0 0.0600 38.8 0.0160 24.8 0.0010 5.42.0000 93.6 0.0500 38.0 0.0100 20.5 0.0006 4.10.6300 81.6 0.0400 36.0 0.0060 16.40.2000 62.0 0.0300 32.3 0.0040 13.6
87

Labtium OyPL 1500Neulaniementie 570211 KUOPIOPuh: 010 653 8000Fax: 010 653 8489
Laboratorion näytetunnus : L08161717Tilausnumero : 213971Tilaajan näytetunnus : OL-KK19 200-235 cmTilaaja : Posiva Oy Susanna Lindgren
16.3.2009
________________________
Näytteestä poistettu >6 mm aines.
650G Karkean fraktion määritys ja poisto (%) 7.80651 Pesuseulonta OK
Sedigraph-analyysi (658)Kuivaseulonta seulasarjalla ISO 3310/1 (652)
2020.20.020.0020.0002 60.60.060.0060.0006
90
75
50
25
10
%GEO
RAK
Savi Siltti Hiekka Sora
Savi Hiesu Hieta Hiekka Sora Kiviä
D (mm) % D (mm) % D (mm) % D (mm) % D (mm) %20.0000 100.0 0.0630 40.0 0.0200 26.8 0.0020 8.46.3000 100.0 0.0600 39.1 0.0160 24.3 0.0010 4.82.0000 94.7 0.0500 38.2 0.0100 19.8 0.0006 3.80.6300 83.5 0.0400 35.8 0.0060 15.80.2000 64.3 0.0300 32.0 0.0040 13.0
88