
Summary of the Annual Report 2011 - Slovenske železnice · Summary of the Annual Report Key...
72
Summary of the Annual Report 2011
Transcript of Summary of the Annual Report 2011 - Slovenske železnice · Summary of the Annual Report Key...

Summary of the Annual Report 2011


TABLE OF CONTENTS
2011
Summary of the Annual Report
Key financial performance indicators 2Organisation, administration and management 3Summary analysis of the Slovenske železnice Group operation 11Operation of individual business units 16SŽ-Tovorni promet, d. o. o. 16SŽ-Potniški promet, d. o. o. 20SŽ-Infrastruktura, d. o. o. 24Operation of other subsidiaries 29SŽ-Centralne delavnice Ljubljana, d. o. o. 29The SŽ–Železniško gradbeno podjetje Group 31The SŽ-ŽIP Group 33Prometni institut Ljubljana, d. o. o. 35SŽ-Železniška tiskarna Ljubljana, d. d. 36Staff 37Investments 38Assessment of railway transport safety and quality 39Quality management system 40Consolidated financial statements of the Slovenske železnice Group with notes 40
Slovenian railways in figures
Key figures 47Revenues and costs 48Financials 49Freight transport 50Passenger transport 54Infrastructure 56Staff 58Line utilisation 59Transport services 60Traction and hauled vehicles 61Statistic about infrastructure 66European railways comparison – 2010 67Slovenian railway network 68

2011
2SUMMARY OF THE ANNUAL REPORT
Key financial performance indicators
Highlights in the income statement (EUR thousand)
The SŽ Group Core SŽ Group1)
2011 2010 Index 2011 2010 IndexOperating revenues2) 478,710 468,334 102.2 425,419 398,446 106.8Net sales2) 395,502 395,514 100.0 372,726 348,973 106.8EBIT – operating profit/loss 2,191 (7,033) (4,064) (10,905) 37.3EBITDA 42,403 31,356 135.2 32,222 23,886 134.9Total profit/loss (13,604) (18,067) 75.3 (16,794) (19,429) 86.4Net profit/loss (15,351) (19,188) 80.0 (17,153) (19,429) 88.3
Highlights in the balance sheet (EUR thousand)
31. 12. 2011
31. 12. 2010 Index
31. 12. 2011
31. 12. 2010 Index
Assets 650,437 740,752 87.8 611,842 699,708 87.4Equity 134,073 186,268 72.0 120,140 174,497 68.8Financial liabilities 394,326 404,037 97.6 377,453 389,411 96.6Liabilities portion in assets 60.6% 54.5% 111.1 61.7% 55.7% 110.8
Key indicators 2011 2010 Index 2011 2010 IndexReturn on equity - ROE (9.1%) (13.1%) 69.9 (11.0%) (14.4%) 76.2Return on assets - ROA (2.2%) (2.8%) 77.4 (2.6%) (3.1%) 85.0Return on sales - ROS (3.9%) (4.9%) 80.0 (4.6%) (5.6%) 82.7Value added per employee (EUR) 31,913 28,715 111.1 32,754 29,149 112.4
Operation volume and staff 2011 2010 Index 2011 2010 IndexGoods transported (in thousand tonnes) 17,647 17,257 102.3Net tonne-kilometres (in million NTKM) 3,869 3,617 107.0Passengers handled (in thousands) 15,743 16,220 97.1Passenger kilometres (in million PKM) 773 813 95.1
Rolling stock Locomotives 156 158 98.7Freight wagons 3,142 3,211 97.9Coaches 102 102 100.0Passenger multiple unit trains 109 109 100.0Number of employees (31 December) 8,797 8,982 97.9 6,642 6,892 96.4Average number of employees 8,886 9,694 91.7 6,723 7,466 90.0
Legend of indicators:
EBITDA = EBIT + amortisationTotal profit/loss = EBIT + Result from financing activities + Result of other flows (pre-tax)Net profit/loss = Total operating profit/loss - income tax Financial liabilities = Current and non-current financial liabilities ROE = net profit/average equityROA = net profit/average assetsROS = Net profit / net sales revenues Gross value added per employee = the sum of the differences between the operating revenues and the value of goods and services produced, the cost of raw materials and other inputs involved in the cost of production per average number of employees on the basis of hours worked
1) For the purpose of comparison with the last year statistics, the consolidated financial statements of the four new companies are presented in key business statistics of the so-called 'core SŽ Gro-up', whose structure is comparable with the structure of the company in 2010.
2) Since 1 January 2011, transport revenues at Slovenske železnice are identified and presented as gross operating results; the same method is also used to present the business results from 2010.

3
Organisation, administration and management
In 2011, significant changes have been made in the organisational structure of Slovenske železnice. Under the Slovenian Railway Company Act (ZDSŽ), which entered into force on 11 January 2011, core operations (passenger and freight transport, maintenance of public railway infrastructure, railway traffic management, traction and technical wagon activity – TVD), which were previously performed by a single company, have been transferred to three newly created subsidiaries, with the exception of traction and TVD, which have been transferred to the company SŽ-Centralne delavnice, d. o. o.
On 1 September 2011, the following companies were established in a carve-out process as laid out in Article 8 of the Slovenian Railway Company Act (ZDSŽ):• Slovenske železnice-Tovorni promet, d. o. o., which provides the carriage
of goods in domestic and international rail traffic; • Slovenske železnice-Potniški promet, d. o. o., which provides the carriage
of passengers in domestic, cross-border regional and international rail traffic;
• Slovenske železnice-Infrastruktura, d. o. o., which provides railway infra-structure maintenance, railway traffic management and other functions related to public railway infrastructure management.
On 1 September 2011, a contractual concern was also formed, which con-sists of SŽ, d. o. o., as the parent company and the following subsidiaries:• Slovenske železnice-Tovorni promet, company for the carriage of goods
in domestic and international rail traffic, d. o. o.;• Slovenske železnice-Potniški promet, company for the carriage of pas-
sengers in domestic, cross-border regional and international rail traf-fic, d. o. o.;
• Slovenske železnice-Infrastruktura, company for the management and maintenance of railway infrastructure and railway traffic manage-ment, d. o. o.;
• SŽ-Central Workshops Ljubljana, d. o. o.;• SŽ-ŽIP, services, d. o. o. (Railway Company for Disabled Persons); • Institute of Traffic and Transport Ljubljana, d. o. o.
The legal basis of the contractual concern is established in controlling con-tracts, which have already been successfully concluded and entered into the Register of Companies.

2011
4SUMMARY OF THE ANNUAL REPORT
In 2011, a total of three instruments of incorporation of Slovenske že-leznice were in force: The Memorandum of Association of Slovenske že-leznice, d. o. o., (SV 930/09) (Akt o ustanovitvi družbe Slovenske želez-nice, d. o. o., (SV 930/09)), which was in force from 21 September 2009 to 29 August 2011, the Memorandum of Association of Slovenske želez-nice, d. o. o., which was adopted by the Government on 30 August 2011 and expired on 31 August 2011, and the Memorandum of Association of Slovenske železnice, d. o. o., which has been in force since 1 September 2011.
Two-tier corporate governance system
Slovenske železnice, d. o. o., are managed by the Founder directly and thro-ugh the administrative bodies of the company, which consist of the Super-visory Board and the Management. The competences of the administrative bodies are laid out in the national Companies Act (ZGD-1) and pursuant thereto adopted Memorandum of Association, Rules of Procedure of the Supervisory Board and Rules of Procedure of the Management.
The Founder
The function of the Founder is performed by the Capital Assets Management Agency of the Republic of Slovenia. Before the formation of the Agency, the function was carried out by the Government of the Republic of Slovenia.
The Founder holds the decision-making power on key issues, specified in the national Companies Act and Memorandum of Association of Slovenske železnice, d. o. o.
In accordance with the relevant regulations and the Memorandum of Asso-ciation, the Founder makes autonomous decisions regarding the approval of Memorandum of Association and any amendments thereto along with decisions related to the strategic business plan of the concern of Slovenske železnice, endorsement of the annual report and the consolidated annual report, utilization of distributable profit and coverage of loss. Furthermore, it also discharges the Supervisory Board and the Management, passes deci-sions regarding the changes in capital assets, appoints or dismisses the Supervisory Board members, decides on the remuneration of the Supervi-sory Board and appoints the auditor.
Founder meetings take place in accordance with the Founder's internal regulations.

5
Supervisory Board
Composition
According to the Memorandum of Association of SŽ (SV 930/09) which expired on 29 August 2011 and the Memorandum of Association of SŽ which was adopted by the Government and was in force on 30 and 31 August 2011, the Supervisory Board consisted of nine members, six of whom were appointed by the Founder and three of whom were appointed by the Works Council.
Previous members of the Supervisory Board (term of office expired on 10 September 2011)
Name Term of office Office
Igor Zajec, MSc From 15. 4. 2010 to 9. 9. 2011 PresidentBranka Neffat From 2. 3. 2009 to 9. 9. 2011 Vice-PresidentBojan Brank From 5. 2. 2009 to 9. 9. 2011 MemberDr Bojan Rosi From 17. 12. 2009 to 9. 9. 2011 MemberRomana Fišer, MA From 14. 10. 2010 to 9. 9. 2011 MemberAlenka Podbevšek From 14. 10. 2010 to 9. 9. 2011 MemberSilvo Berdajs From 22. 2. 2009 to 9. 9. 2011 MemberJože Pavšek From 22. 2. 2009 to 9. 9. 2011 MemberNikola Knežević From 14. 12. 2009 to 9. 9. 2011 Member
Pursuant to the Memorandum of Association of Slovenske železnice, d. o. o., currently in force, the Supervisory Board comprises six members, four of whom are appointed by the Founder and two of whom are appointed by the Works Council.
The Founder and the Works Council have passed a decision to appoint new members of the Supervisory Board, whose term of office started on 10 September 2011.
At the end of 2011, the Supervisory Board consisted of the following mem-bers (term of office started on 10 September 2011):
Name Term of office Office
Bojan Brank From 10. 9. 2011 to 10. 9. 2015 PresidentLojze Zajc From 10. 9. 2011 to 10. 9. 2015 MemberViktor Markežič From 10. 9. 2011 to 10. 9. 2015 MemberDr Mitja Grbec From 10. 9. 2011 to 10. 9. 2015 MemberSilvo Berdajs From 10. 9. 2011 to 10. 9. 2015 Vice-PresidentNikola Knežević From 10. 9. 2011 to 10. 9. 2015 Member

2011
6SUMMARY OF THE ANNUAL REPORT
Supervisory Board operation
The legal basis for the operation of the Supervisory Board is established in the national Companies Act, the Memorandum of Association of Slovenske železnice, d. o. o., in force and the Rules of Procedure of the Supervisory Board.
The Supervisory Board carries out its functions and tasks at sessions and through its committees.
The Supervisory Board supervises the management of SŽ operation and the operation of the railway concern. It is responsible for issuing opinions on Management reports regarding key business operations of the concern and parent-subsidiary relations, appointing or dismissing the Management and regulating the conclusion of the employment contracts of the Mana-gement staff. It also monitors the procedures conducted by internal control and internal audit and appraises the effectiveness of their function, verifies annual and other company financial reports, approves the annual report and the annual business plan of SŽ as well as endorses the strategic business plan of the concern and gives decisions on other matters laid out in Article 15 of the Memorandum of Association of Slovenske železnice, d. o. o., in force.
Supervisory Board committees
At the end of 2011, the Supervisory Board formed the Audit Committee, which comprised Lojze Zajc (President), Nikola Knežević (member), Viktor Markežič (member) and Tatjana Habjan (member). The competences of Comittee are laid out in Article 280 of the national Companies Act.
In 2011, the Supervisory Board also formed the Human Resource Commit-tee, which comprised Branka Neffat (President), Silvo Berdajs (member) and Dr. Bojan Rosi (member). With the appointment of a new Supervisory Board on 10 September 2011, the Human Resource Committee was discharged.
The Management
In accordance with the Memorandum of Association of Slovenske želez-nice, d. o. o., in force, the company's business operation is managed by the Management, which consists of three members: The Director General, who acts as an independent representative of the company, and two direc-tors, who may represent the company only in conjunction with the Director General.

7
When a Worker Director is appointed pursuant to the Law on Workers' Par-ticipation in Management (ZSDU), they act as the representative of emplo-yees in human resources matters and social affairs. The Worker Director has not been appointed by Slovenske železnice, because the company has not met the conditions required for the appointment as laid out in Article 18 of ZSDU.
Composition of the Management in 2011:• Director General: Goran Brankovič, appointed on 1 October 2009, relived
of his position on 14 November 2011; • Worker Director: Albert Pavlič, relived of his position on 15 November
2011;• Director General: Igor Blejec, appointed on 15 November 2011, relived
of his position on 22 March 2012;• Member: Director Marjan Zaletelj, appointed on 15 November 2011,
relived of his position on 22 March 2012;• Member: Director Dušan Mes, appointed on 15 November 2011, relived
of his position on 22 March 2012.
On 22 March 2012, Dušan Mes was appointed Director General for a term of four years, and on 29 March 2012, Jelka Šinkovec Funduk and Milan Perović were appointed members (Directors) of the Management, also for a term of four years.
Management of the subsidiaries
The Slovenske železnice Group consists of the parent company Slovenske železnice, d. o. o., and subsidiaries (SŽ-Infrastruktura, d. o. o., SŽ-Potniški promet, d. o. o., SŽ-Tovorni promet, d. o. o., SŽ-Centralne delavnice, d. o. o., SŽ-ŽIP, storitve, d. o. o., Prometni institut, d. o. o., SŽ-Železniško gradbeno podjetje, d. d., and SŽ-Železniška tiskarna, d. d.). The company is the sole owner or holds a majority share in all subsidiaries listed above.
The said companies are responsible for the provision of core services, which include the maintenance and management of the public railway infrastruc-ture, management of railway traffic, carriage of passengers and freight on public railway infrastructure, train traction and technical vehicle manage-ment. In addition, they also perform ancillary, additional and other activities, necessary for smooth and quality performance of core railway operations.

2011
8SUMMARY OF THE ANNUAL REPORT
On 31 September 2011, SŽ, d. o. o., have removed the disclosure of long-term financial investments in the health centre SŽ-ŽZD (investment in shares) and instead temporarily disclosed the financial claims for the centre based on the required corrective measure issued by the Court of Audit for long-term investments. The financial statement of SŽ-ŽZD has therefore been excluded from consolidated financial statements of the Slovenske že-leznice Group for 2011.
Subsidiaries are normally managed by the Founder directly and through the Management. This however does not apply to the subsidiaries SŽ-Centralne delavnice, d. o. o., (Central Workshops), SŽ-Železniško gradbeno podjetje, d. d., (Railway Construction Company), and SŽ-Železniška tiskarna, d. d., (Railway Printing House), which also have their respective Supervisory Boards.
The Founder holds the function and decision-making power equal to that of a general meeting. It makes independent decisions regarding:• Changes and amendments to the Memorandum of Association;• Utilization of distributable profit and coverage of loss;• Changes in share capital;• Discharge of the Management;• Appointment and dismissal of individual members of the Management;• Appointment of the auditor;• Other matters in line with relevant regulation and the Memorandum of
Association.
Operations are led by the manager – the Director. When a Workers' Director is appointed pursuant to the relevant law, they are granted the position of a manager, but only in human resources and social affairs.
When managing the company's business operations, the Management holds the decision-making power in all matters that are outside the com-petence of the Founder in accordance with the relevant regulation and the Memorandum of Association.
The Management is appointed and discharged by the Founder. Members of the Management are appointed for a term of four years, but the Founder may at any time dismiss a member from the Management.
The Management manages the company's business operations indepen-dently and holds independent decision-making power. However, it is requi-red to consider the directions and approvals given by the parent company in accordance to the controlling contract.

9
The Structure of Slovenske železnice Group
2011
10SUMMARY OF THE ANNUAL REPORT
Controlling Contract
The controlling contract defines the terms and conditions governing the management of concern's business operations as well as other rights and obligations of SŽ, d. o. o. It gives SŽ, d. o. o. over the administration and management of the subsidiaries.
As the parent company, SŽ, d. o. o., acquired with the controlling contract the right to issue directions concerning the business conduct of the subsidi-aries and exercise direct control over them, while assuming liability to settle any potential losses of the subsidiaries.
The aim of the contracts is to establish effective decision-making process in order to deliver the best possible business results of the SŽ Group as a whole and of individual companies within the group. On that basis, the companies with mutual capital participation are unified in the contractual concern.
It is to be noted, however, that the subsidiaries remain separate legal enti-ties, which are liable for their obligations with all their assets.
In addition to the provisions laid out in memorandums of association, the mutual relations between SŽ, d. o. o., and the subsidiaries as well as between individual subsidiaries will also be defined in special agreements (SLA – Service Level Agreements).
Corporate governance statement
The Management and the Supervisory Board hereby declare that Slovenske železnice, d. o. o., in its work and operations, complies with the Corporate Governance Code for Companies with State Capital Investments, adop-ted by the Capital Assets Management Agency of the Republic of Slove-nia (AUKN) on 18 January 2011. The Code is available in English on the AUKN’s website at: http://www.auknrs.si/en/DOCUMENTS_LEGISLATION/. The Management and the Supervisory Board also explain below which indi-vidual recommendation of the AUKN the Company did not comply with, together with the associated reasons.
Recommendation 72:
An external expert was appointed member of the revision commission on 12 December 2011. Before that, the commission performed its duties without an external expert. There was also no external expert amongst the members of the Human Resource commission, which was dismissed on 10 September 2011, because the general level of expertise of individual mem-bers of the Supervisory Board members was considered sufficient.

11
Summary analysis of the Slovenske železnice Group operation
Revenue and expenditure, profit and loss
In 2011, total revenues of the Slovenske železnice Group amounted to EUR 492,449 thousand and were comprised of operating revenues (97.2%), financial revenues (1.7%) and other income (1.1%).
The Group's total expenses amounted to EUR 506,053 thousand and were comprised of operating expenses (94.2%), financial expenses (5.7%) and other expenses.
Net profit/loss in 2011 was negative and amounted to EUR 15,351 tho-usand. It is the result of positive operating result in the amount of EUR 2,191 thousand, negative difference between financial revenues and expenses, which amounted to EUR 20,201 thousand, positive difference between other income and expenses, which amounted to EUR 4,406 tho-usand, income tax amounting to EUR 1,687 thousand and deferred tax amounting to EUR 60 thousand.
Income statement (profit and loss account)
Profit and loss account (EUR thousand) 2011 2010 Index
Operating revenues 478,710 468,334 102.2Operating expenses 476,519 475,367 100.2Operating profit/loss 2,191 (7,033)
Financial revenues 8,463 14,102 60.0Financial expenses 28,664 31,838 90.0Other income 5,276 7,886 66.9Other expenses 870 1,184 73.5
Income tax 1,687 1,107 152.4Deferred tax (60) (14) 428.6Net operating profit/loss (15,351) (19,188) 80.0Net profit/loss attributable to equity holders (16,485) (20,000) 82.4Net profit/loss attributable to minority interests 1,134 812 139.7

2011
12SUMMARY OF THE ANNUAL REPORT
In 2011, the operating revenues of the Slovenske železnice Group were up 2.2% on those generated in 2010. They consist mainly of net sales revenues (82.6%), which amounted to EUR 395,502 thousand in 2011 and EUR 395,514 thousand in 2010.
Net sales revenues consist of transport revenues (49.6% of net sales reve-nues; EUR 196,107 thousand in 2011, EUR 182,110 thousand in 2010) generated on domestic and international market by Freight Transport (EUR 159,858 thousand) and Passenger Transport (EUR 36,249 thousand). In comparison to 2010, transport revenues generated by Freight Transport increased by 10.5%, while those generated by Passenger Transport decre-ased by 3.1%.
Starting with 1 January 2011, transport revenues in international freight and passenger transport along with the related foreign operator transport costs are identified and presented as gross operating results (revenues). In order for the data to be comparable, the gross method is used for the analysis of the operating results in 2011 as well as when displaying basic operating categories of the profit and loss account.
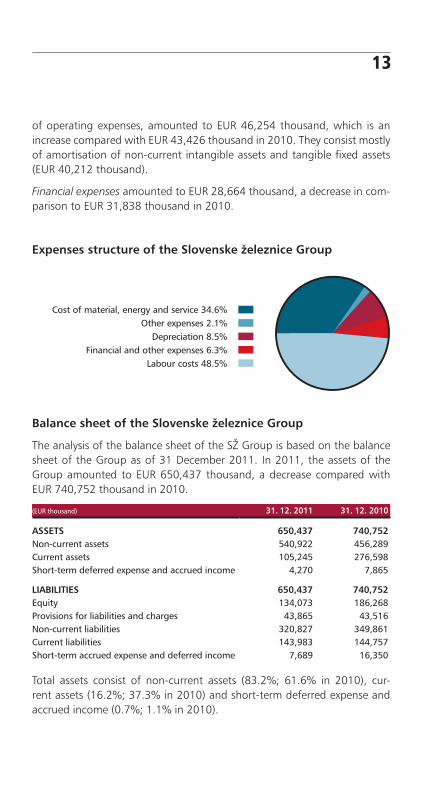
Revenues structure of the Slovenske železnice Group
In 2011, the operating expenses of the Slovenske železnice Group amounted to EUR 476,519 thousand, which is a slight increase com-pared with EUR 475,367 thousand in 2010. Staff costs accounted for the largest proportion of operating expenses (48%) and amounted to EUR 228,629 thousand, down 3.4% on 2010. Cost of goods, materials and energy, which accounted for 15.2% of operating expenses, amounted to EUR 72,825 thousand, a slight decrease compared with EUR 73,391 thou-sand in 2010. Cost of services amounted to EUR 124,929 thousand, up 5.1% on 2010, with the emphasis on the costs of foreign railway operator services, which amounted to EUR 35,324 thousand, up 10% on 2010 (the increase is consistent with the growth of transport revenues on foreign railway market). Cost of value adjustments, which accounted for 9.7%
13
of operating expenses, amounted to EUR 46,254 thousand, which is an increase compared with EUR 43,426 thousand in 2010. They consist mostly of amortisation of non-current intangible assets and tangible fixed assets (EUR 40,212 thousand).
Financial expenses amounted to EUR 28,664 thousand, a decrease in com-parison to EUR 31,838 thousand in 2010.
Expenses structure of the Slovenske železnice Group
Balance sheet of the Slovenske železnice Group
The analysis of the balance sheet of the SŽ Group is based on the balance sheet of the Group as of 31 December 2011. In 2011, the assets of the Group amounted to EUR 650,437 thousand, a decrease compared with EUR 740,752 thousand in 2010.
(EUR thousand) 31. 12. 2011 31. 12. 2010
ASSETS 650,437 740,752Non-current assets 540,922 456,289Current assets 105,245 276,598Short-term deferred expense and accrued income 4,270 7,865
LIABILITIES 650,437 740,752Equity 134,073 186,268Provisions for liabilities and charges 43,865 43,516Non-current liabilities 320,827 349,861Current liabilities 143,983 144,757Short-term accrued expense and deferred income 7,689 16,350
Total assets consist of non-current assets (83.2%; 61.6% in 2010), cur-rent assets (16.2%; 37.3% in 2010) and short-term deferred expense and accrued income (0.7%; 1.1% in 2010).

2011
14SUMMARY OF THE ANNUAL REPORT
Financial analysis
The financial analysis of the SŽ Group is based on the balance sheet of the Group as of 31 December 2011.
(EUR thousand) 31. 12. 2011 31. 12. 2010Absolute
change Index
Current receivables 85,037 263,501 (178,464) 32.3Current liabilities 151,672 161,107 (9,435) 94.1Net short-term debt 66,635 66,635Net current receivables - 102,394 (102,394)Non-current receivables 154,774 57,316 97,458 270.0Non-current liabilities 364,692 393,377 (28,685) 92.7Net long-term debt 209,918 336,061 (126,143) 62.5
Net debt 276,553 233,667 42,886 118.4Total liabilities 516,364 554,484 (38,120) 93.1Total receivables 239,811 320,817 (81,006) 74.8
Tangible assets 410,626 419,935 (9,309) 97.8Inventory 24,478 20,962 3,516 116.8Capital assets 386,148 398,973 (12,825) 96.8Equity 134,073 186,268 (52,195) 72.0
In 2011, the liabilities of the Slovenske železnice Group decreased by EUR 38,120 thousand and the receivables by EUR 81,006 thousand, which is reflected on the net debt, which is up EUR 42,886 thousand compared to 2010.
The Slovenske železnice Group is a net debtor for long-term debt (EUR 209,918 thousand) as well as short-term debt (EUR 66,635 thousand). The debt ratio, expressed as a ratio of net debt to tangible assets, amounted to 67.3% at the end of 2011, which is up 11.7% on the end of 2010.
Long-term investment financing
(EUR thousand) 31. 12. 2011 31. 12. 2010Absolute
change Index
Current assets 109,515 284,463 (174,948) 38.5Current liabilities 151,672 161,107 (9,435) 94.1Working capital (42,157) 123,356 (165,513) (34.2)Long-term investments 540,922 456,289 84,633 118.5Source of long-term financing 498,765 579,645 (80,880) 86.0
At the end of 2011, 92.2% of long-term investments were financed from sources of long-term financing, which is down 34.8% on the end of 2010 (127.0%). The ratio between current assets and current liabilities amounted
15
to 0.722 at the end of December 2011, which is a decrease compared to 1.766 at the end of December 2010. A lack of long-term financing sources is shown by the negative working capital; at the end of 2011, the lack amounted to EUR 42,157 thousand. Compared with the surplus at the end of 2010, the financial balance suffered a minus of EUR 165,513 thousand in 2011. The change in working capital was a consequence of capital assets depreciation (EUR 12,825 thousand), decrease in net long-term liabilities (EUR 126,143 thousand) and of decrease in equity (EUR 52,195 thousand).
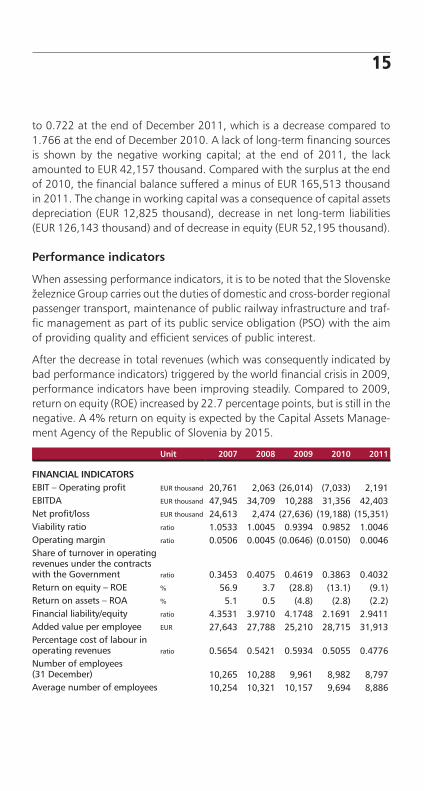
Performance indicators
When assessing performance indicators, it is to be noted that the Slovenske železnice Group carries out the duties of domestic and cross-border regional passenger transport, maintenance of public railway infrastructure and traf-fic management as part of its public service obligation (PSO) with the aim of providing quality and efficient services of public interest.
After the decrease in total revenues (which was consequently indicated by bad performance indicators) triggered by the world financial crisis in 2009, performance indicators have been improving steadily. Compared to 2009, return on equity (ROE) increased by 22.7 percentage points, but is still in the negative. A 4% return on equity is expected by the Capital Assets Manage-ment Agency of the Republic of Slovenia by 2015.
Unit 2007 2008 2009 2010 2011
FINANCIAL INDICATORSEBIT – Operating profit EUR thousand 20,761 2,063 (26,014) (7,033) 2,191EBITDA EUR thousand 47,945 34,709 10,288 31,356 42,403 Net profit/loss EUR thousand 24,613 2,474 (27,636) (19,188) (15,351)Viability ratio ratio 1.0533 1.0045 0.9394 0.9852 1.0046Operating margin ratio 0.0506 0.0045 (0.0646) (0.0150) 0.0046Share of turnover in operating revenues under the contracts with the Government ratio 0.3453 0.4075 0.4619 0.3863 0.4032Return on equity – ROE % 56.9 3.7 (28.8) (13.1) (9.1)Return on assets – ROA % 5.1 0.5 (4.8) (2.8) (2.2)Financial liability/equity ratio 4.3531 3.9710 4.1748 2.1691 2.9411Added value per employee EUR 27,643 27,788 25,210 28,715 31,913Percentage cost of labour in operating revenues ratio 0.5654 0.5421 0.5934 0.5055 0.4776Number of employees (31 December) 10,265 10,288 9,961 8,982 8,797Average number of employees 10,254 10,321 10,157 9,694 8,886

2011
16SUMMARY OF THE ANNUAL REPORT
Added value per employee
Compared to 2010, the added value per employee (average number based on hours worked) is up 11.1% as a result of an increase in freight transport revenues and a decrease in the number of employees. Consequently, the cash flow was also increased as the sum of depreciation and net profit/loss for the accounting period.
Operation of individual business units
SŽ-Tovorni promet, d. o. o.
Key business statisticsHighlights in the income statement (EUR thousand) 2011 2010 Index
Operating revenues 185,712 166,753 111.4Net sales revenues 180,625 165,101 109.4EBIT - Operating profit (5,140) (14,251) 36.1EBITDA 13,204 3,283Total profit/loss (16,349) (25,482) 64.2Net profit/loss (16,349) (25,482) 64.2
Highlights in the balance sheet (EUR thousand) 31. 12. 2011 1. 1. 2011 Index
Assets 308,355 328,394 93.9Equity 24,198 40,547 59.7Financial liabilities 252,241 254,621 99.1Percentage of financial liabilities in assets 81.8% 77.5% 105.5

17
Indicators 2011 2010 Index
Return on equity – ROE (40.3%) (122.7%) 32.9Return on assets – ROA (5.1%) (7.6%) 67.5Return on sales – ROS (9.1%) (15.4%) 58.6Added value per employee (EUR) 36,252 26,299 137.8
Operation volume and staff 2011 2010 Index
Goods transported (in thousand tonnes) 17,647 17,257 102.3Net tonne-kilometres (in millions) 3,869 3,617 107.0Number of employees (end of accounting period) 1,495 1,524 98.1Average number of employees (end of month) 1,504 1,702 88.4
• Contrary to the annual plan, EBIT was up EUR 5.4 million on 2010, but it is still in the negative. The increase is the result of greater volume of transport operations and transport revenues in the first four months; afterwards, the operating results are back in line with the plan. All this in turn increased the EBITDA, which amounted to EUR 13.2 million, and improved the negative indicators of ROA and ROS. On the other hand, ROE turned out worse than planned, because the actual equity increase did not meet the projections set out in the plan;
• Operating revenues amounted to EUR 185.7 million, up 11.4% on those achieved in 2010 and up 6.9% compared to the plans for 2011;
• In 2011, 17.6 million tonnes of goods were transported and 3,869 mil-lion net tonne-kilometres were travelled, which is up 2.3% and 7.0% on 2010 respectively. For comparison, in 2010, 17.3 million tonnes of goods were transported and 3,617 million net tonne-kilometres were travelled;
• The rapid increase in the volume of transport operations resulted from a structural change of operations in terms of transport mode – the majo-rity of transport operations were conducted in Port of Koper transit, which has typically longer transport routes. Moreover, the increase in transport operations in the Port transit also helped enhancing the role of Corridor V;
• Transport revenues amounted to EUR 161.1 million, up 10.1% on 2010 and up 3.9% on the planned target for 2011. With the exception of domestic transport and export in combined transport, revenues in 2011 increased in all transport modes;
• The increase in revenues was naturally accompanied by an increase in operating expenses due to higher RIV wagon user charges, higher char-ges for foreign railway operator services and other expenses related to the volume of transport operation;

2011
18SUMMARY OF THE ANNUAL REPORT
• Operating expenses amounted to EUR 190.9 million, up 5.4% on 2010 and up 3.0% on the planned target for 2011. This is mostly related to increased fuel costs because of larger transport operation volume and higher prices of diesel fuel, which is used in train traction. In contrast, the cost of electricity used by electrically powered rolling stock decreased because of lower electricity contract prices;
• The said fluctuations in conjunction with the impact of negative financial results and expenses, which amounted to EUR 12.7 million (and consi-sted of interests: EUR 5.9 million, negative balance of derivatives: EUR 5.8 million, and negative balance of exchange rates: EUR 1.5 million) caused a net loss of EUR 16.3 million, which is down EUR 3.6 million on the estimates, but already at the limit of capital adequacy;
• In February 2012, after the 2011 balance sheet, SŽ-Tovorni promet, d. o. o., received a capital injection of EUR 21.1 million. With the permission of AUKN and in accordance with the Companies Act (ZGD-1), the capital contribution of SŽ, d. o. o., (conversion of claims into capital) will be used to cover net losses incurred by SŽ-Tovorni promet, d. o. o., in 2011 and increase the capital surplus.
Change in %
Revenue and expenditure, profit and loss

19
Income statement – SŽ-Tovorni promet, d. o. o. (EUR thousand) 2011 2010 Index
Operating revenues 185,712 166,753 111.4Operating expenses 190,852 181,004 105.4Operating profit/loss (5,140) (14,251) 36.1
Finance income 7,253 14,207 51.1Finance cost 19,940 27,641 72.1Other revenues 2,307 3,065 75.3Other expenses 829 862 96.2
Net profit/loss (16,349) (25,482) 64.2
Competitive position of freight transport
The transport market is in general a place of dire competition between railway freight service providers and road hauliers. In addition to motori-sed haulage, SŽ-Tovorni promet also faces competition from railway freight corridors that bypass Slovenia and from other northern Adriatic and North Sea ports.
After the liberalisation of access to public railway infrastructure in 2009, foreign railway operators gained access to Slovenian railway network, intro-ducing a new type of competition for SŽ-Tovorni promet, d. o. o.
Estimates for 2011 suggest the volume of inland transport in Slovenia is down 4.5% on 2010, whilst railway transport is up 3.2%.
The role of railway freight transport in Slovenian inland transport is growing steadily. In 2011, it accounted for 19.2% of inland transport, up 1.4% on 2010. Consequently, transport volumes of SŽ-Tovorni promet in inland transport increased by 1.3%, but the company's presence in railway freight transport decreased by 1.0%.
SŽ-Tovorni promet holds a strategically important geographical position at the intersection of Corridor V and X, and transports 91.7% of goods in international traffic. Unfortunately, the situation in the Balkans caused a bulk of the goods flows on Corridor X to move eastward to Corridor IV, which offers an alternative connection between North and South Europe.
The Port of Koper is one of the key sources of goods transported in railway traffic. Tovorni promet performs over half of all freight transport operati-ons (both delivery and dispatch of goods) headed to or coming from the Port, thus contributing significantly to freight operation volume on Corri-dor V. The freight line, however, faces several issues, such as bottlenecks, that hinder an optimal organisation of freight operations; they are caused by outdated infrastructure, most notably insufficient rail capacities at the

2011
20SUMMARY OF THE ANNUAL REPORT
Port's entrance, a single track line between Koper and Divača with worn out rails and rail network, and (too) short station tracks. In order to tackle this issue, plans have been made to modernise the said corridor section, but the main solution for the lack of rail capacities remains the construction of a second rail line. Despite recent upgrades in the Port of Koper (new handling equipment and the extension of one of the docks, which enabled the doc-king of large container ships), the handling issues merely increased, because the rail capacities remained unchanged and also due to the growing pre-sence of other rail operators and road hauliers.
Poor condition of the public railway infrastructure decreases the competiti-veness and quality of freight services (in terms of reliability and effectiveness) also on other line sections. Bottlenecks caused by single track lines, restric-tions on heavy-load transport operations due to low axle loads, restrictions on train length, and a limited amount of electrified lines all cause transport delays and increase transport costs.
Due to the delays caused by slow railway travel, traffic cannot be managed optimally with the railway staff and equipment at hand. However, emplo-ying more staff or purchasing new equipment would result in additional costs for the operators.
SŽ-Potniški promet, d. o. o.
Key bu siness statistics
Highlights in the income statement (EUR thousand) 2011 2010 Index
Operating revenues 85,764 86,657 99.0Net sales revenues 40,533 41,461 97.8EBIT - Operating profit (1,404) 1,968EBITDA 10,835 13,719 79.0Total profit/loss (5,424) (433)Net profit/loss (5,424) (433)
Highlights in the balance sheet (EUR thousand) 31. 12. 2011 1. 1. 2011 Index
Assets 180,007 188,932 95.3Equity 18,582 24,006 77.4Financial liabilities 143,989 150,928 95.4Percentage of financial liabilities in assets 80.0% 79.9% 100.1
Indicators 2011 2010 Index
Return on equity – ROE (22.6%) (7.9%) 287.0Return on assets – ROA (2.9%) (0.2%)Return on sales – ROS (13.4%) (1.0%)Added value per employee (EUR) 41,597 42,766 97.3

21
Operation volume and staff 2011 2010 Index
Passengers handled (in thousand) 15,743 16,220 97.1Passenger kilometres (in millions) 773 813 95.1Number of employees (end of accounting period) 666 672 99.1Average number of employees (end of month) 670 706 94.9
• The market share of SŽ-Potniški promet on public passenger transport market dropped to 28.7% due to increased share of air transport;
• The results of various customer surveys indicate an improvement in the quality of passenger services; highest ratings were given to professio-nalism and appearance of railway staff, while the condition of station facilities received the lowest ratings;
• The number of passengers handled is down 6.1% compared to the annual plan and down 2.9% on 2010. Passenger kilometres travelled in 2011 were down 8.4% compared to the plan and down 4.9% on 2010;
• Passengers in railway transport travel relatively short distances; the ave-rage journey length amounted to 49.1 km, which is down 2% on 2010;
• EBIT amounted to EUR 1.4 million and is still in the negative; the result, however, includes the revenues/expenses connected with services perfor-med at the Italian border in the period 2000-2005. Without including the said services, the EBIT would amount to EUR 0.7 million, which is EUR 0.3 million up compared to the plan;
• Net loss amounted to EUR 5.4 million, mainly due to negative financial results and a negative revenue/expenditure balance;
• Transport revenues were down 1.7% or EUR 0.7 million on those gene-rated in 2010 and down 2.7% compared to the plans for 2011. The revenues generated by domestic traffic exceeded the financial plans by EUR 83 thousand. In contrast, international traffic, which accounted for 25.5% of all transport revenues, failed to generate the projected reve-nues (EUR 1,102 thousand), mostly due to decreased presence of foreign operators (with Slovenia as the place of destination or transit country), which was caused by negative economic trends, and also because of relatively low gains from the Rail offers sold;
• Revenues generated from the performance of public utility services in domestic and cross-border regional traffic met the amount set out in public service contracts, which was however lower than the amount pro-posed by SŽ and agreed on by the State. Due to lower state compensa-tions and hence lower prices of train km, revenues were down 1.1% or EUR 485 thousand in comparison to those achieved in 2010;
• Operating expenses are down 0.3% or EUR 235 thousand compared to the projections for 2011, but up 2.9% or EUR 2,479 thousand on 2010.
1) Net return on sales is up 7 percentage points (-6.4%), if state compensation received from public service contracts with the Government is also taken into account.

2011
22SUMMARY OF THE ANNUAL REPORT
Change in %
Revenue and expenditure, profit and loss
Basic operating categories of the income statement
Income statement – SŽ-Potniški promet, d. o. o.(EUR thousand) 2011
From thatPSO1) 2010
From thatPSO1)
Index11/10
Operating revenues 85,764 85,043 86,657 86,020 99.0Operating expenses 87,168 86,252 84,689 83,676 102.9Operating profit/loss (1,404) (1,209) 1,968 2,344
Finance income 195 194 520 205 37.5Finance cost 4,604 4,582 2,988 2,971 154.1Other revenues 473 468 111 110 426.1Other expenses 84 84 44 44 190.9
Net profit/loss (5,424) (5,213) (433) (356)
1) PSO: Public Service Obligation

23
Competitive position of passenger transport
Railway passenger services in the Republic of Slovenia are provided by SŽ-Potniški promet, d. o. o. The company faces competition from providers of public road transport services and users of private (personal) road tran-sport (domestic traffic) as well as from low-cost airlines (international traf-fic). In 2011, railway operators accounted for 28.7% of all public transport service providers on the market, which is less compared to the figures in 2010, mainly because of the growing presence of air transport. In general, the number of passengers in public rail and road transport is decreasing for reasons that range from shrinking school-age population and decentralisa-tion of schools to higher unemployment and decreased amount of leisure activities, both consequences of the financial crisis. Public transport is in decline also because of a general preference for passenger motor vehicles (cars). Reliance on cars for passenger transport seems to be particularly high in Slovenia, as shown by recent national1) and international studies2), which place the country at the very top of EU (passenger car usage accounted for 86.5% of all journeys). This trend is also reflected in the growing amount of passenger cars registered in Slovenia – in 2010, the country averaged 518 registered cars per 1000 inhabitants, which is up 20% in comparison to the figures 10 years ago.
The majority of passengers (94.3%) are handled in domestic passenger transport as part of public service obligation (PSO) set out in the PSO con-tracts with the Ministry of Infrastructure and Spatial Planning. In contrast, international transport handled only 5.7% of all passengers transported, but it generated 25.5% of all transport revenues while travelling 17.2% of all passenger-kilometres. The strategically important geographical position of Slovenia at the intersection of multiple pan-European corridors plays an important role in establishing international railway connections and is hence an important asset of Slovenia as well as for neighbouring and other countries. Moreover, strong competition from low-cost airlines is urging the railways to search for fresh market strategies to attract new passengers to railway transport.
Public railway transport in Slovenia is in decline largely due to low-quality transport services and failure to implement the national transport policy within the time periods set out in the plans. The Ministry of Infrastructure and Spatial Planning is conducting a project aiming to establish an integra-ted system of public rail and road transport, which is one of the main goals of the transport policy. Through cooperation with bus service providers and
1) Modal split in Purchasing Power Parity analysis for 2010 (Statistical office of the Republic of Slovenia – SURS)
2) Eurostat

2011
24SUMMARY OF THE ANNUAL REPORT
local communities, the project will establish integrated schedules and fares, introduce a single ticket (valid within certain zones), and improve connecti-ons between railway stations and commuter towns. But in order to imple-ment a commuter-oriented schedule and increase the passenger transport volume, proper infrastructure conditions will first need to be established along with a better supply of the rolling stock for passenger transport.
SŽ-Infrastruktura, d. o. o.
Key business statistics
Highlights in the income statement (EUR thousand) 2011 2010 Index
Operating revenues 173,063 165,817 104.4Net sales revenues 172,478 165,353 104.3EBIT - Operating profit 700 4,452 15.7EBITDA 3,604 7,376 48.9Total profit/loss 3,205 7,312 43.8Net profit/loss 2,846 7,312 38.9
Highlights in the balance sheet (EUR thousand) 31. 12. 2011 1. 1. 2011 Index
Assets 73,811 79,813 92.5Equity 20,257 17,411 116.3Financial liabilitiesPercentage of financial liabilities in assets
Indicators 2011 2010 Index
Return on equity – ROE 16.3% 25.1% 65.2Return on assets – ROA 3.7% 7.2% 51.8Return on sales – ROS 1.7% 4.4% 37.3Added value per employee (EUR) 27,243 26,701 102.0
Staff 2011 2010 Index
Number of employees (end of accounting period) 2,662 2,742 97.1Average number of employees (end of month) 2,685 2,952 91.0
• The income statement of SŽ-Infrastruktura, d. o. o., consists of the income statements of the Infrastructure Business Unit (PE Infrastruktura) and the Traffic management Business Unit (PE Vodenje prometa), which are both mainly public utilities;
• EBIT and net profit/loss were both in the positive and amounted to EUR 0.7 million and EUR 2.8 million respectively;
• The operating revenues of SŽ-Infrastruktura, d. o. o., in 2011 totalled EUR 173,063 thousand. The company's operating expenses amounted to EUR 172,363 thousand;

25
• Operating revenues amounted to EUR 185.7 million, up 4.4% on 2010 and up 1.4% compared to the plans for 2011. Assets accruing from PSO contracts with the Government of the Republic of Slovenia State accounted for 85.8% of all revenues and were used in regular (planned) and investment maintenance (renovation works) of railway infrastructure as well as for public maintenance, maintenance of passenger railway stations and in traffic management. Provision of public utility, especially the renovation of public railway infrastructure, generates higher income than other activities – projections for renovation works in 2011 amoun-ted to EUR 1,000 thousand, while the public service contract signed on 25 March 2011 provided EUR 7,500 thousand; the positive balance (EUR 6,500 thousand) was used in the replacement of the overhead contact line on Divača-Koper railway line);
• Other activities include various services provided to other companies, such as Iskra sistemi (overhaul of the railway network during Koper station reconstruction), GH Holding (works related to the modernisation of the Divača-Koper line) and ŽGP Ljubljana1) (upgrades to the Hodoš station, reconstruction of the Ptuj-Ormož line and the Ormož-Mekotnjak line);
• Other revenue-generating activities include the provision of electric energy to railway carriers (e. g. SŽ-Tovorni promet, SŽ-Potniški promet, RCA), which generated EUR 16,429 thousand in 2011, and miscellane-ous activities, such as the protection of property/assets (security guards), maintenance of computer software/hardware, maintenance of railway switches, accompaniment of the heritage (museum) train, rental of tele-communication lines, marketing of the telecommunication system, pro-vision of expert project supervision and coordination etc.;
• As mentioned above, the operating expenses amounted to EUR 172,363 thousand, up 6.8% on 2010 and up 2.4% compared to the plans for 2011;
• Costs of services related to public utility maintenance and preventive maintenance (renovation) of public railway infrastructure were relati-vely high (due to replacement of the overhead contact line on Diva-ča–Koper railway line, renovation of the Poljčane station, renovation of the Košana–Gornje Ležeče line segment, modernisation of the Gro-suplje–Kočevje line – Phase 1, the Dobrepolje-Ortnek line segment, renovation of the Koper station). Incidental costs resulting from vari-ous incidents and natural disasters were also higher than usual (the clean-up of the landslide at Majland, Zidani Most and the landslide at Prešnica–Koper line as well as costs related to the removal of damage to the Černotiče–Koper line);
1) Železniško gradbeno podjetje Ljubljana – Railway Construction Company Ljubljana

2011
26SUMMARY OF THE ANNUAL REPORT
• Costs of labour amounted to a total of EUR 69,456 thousand or 40.3% of all operating expenses in 2011, which was down 2% on 2010 and within the estimates for 2011;
• Earnings before interest and taxes (EBIT) of the Infrastruktura Business Unit were in the positive and amounted to EUR 0.8 million; the same applies to the profit/loss account (income statement), which reached EUR 2.9 million. Total profit related to PSO activities amounted to EUR 0.9 million. Profit was recorded also in other activities (EUR 2.1 million), while activities related to the maintenance of railway stations and stops resulted in a loss (EUR 158 thousand);
• The EBIT of the Traffic Management Business Unit (PE Vodenje prometa) was in the negative – the operating result amounted to EUR 0.1 million, while PSO-related activities recorded a loss of EUR 0.7 million. In con-trast, other activities recorded a profit of EUR 0.7 million.
Revenue and expenditure, profit and loss
Basic operating categories of the income statementIncome statement – SŽ-Infrastruktura, d. o. o. (EUR thousand) 2011 2010 Index
Operating revenues 173,063 165,817 104.4Operating expenses 172,363 161,365 106.8Operating profit/loss 700 4,452 15.7
Finance income 921 1,929 47.7Finance cost 276 223 123.8Other revenues 2,815 1,421 198.1Other expenses 955 267 357.7
Total profit/loss 3,205 7,312 43.8Net profit/loss 2,846 7,312 38.9

27
Operating results of individual business unitsIncome statement – Infrastructure (EUR thousand) 2011
From thatPSO 2010
From thatPSO
Index11/10
Operating revenues 136,141 110,409 127,651 95,808 106.7Operating expenses 135,386 111,991 124,568 97,867 108.7Operating profit/loss 755 (1,582) 3,083 (2,059) 24.5
Finance income 870 870 1,434 524 60.7Finance cost 260 260 214 214 121.5Other revenues 2,800 2,800 1,358 1,358 206.2Other expenses 932 932 255 255 365.5
Net profit/loss 2,874 896 5,406 (646) 53.2
Income statement – Traffic Management (EUR thousand) 2011
From thatPSO 2010
From thatPSO
Index11/10
Operating revenues 37,479 34,500 38,478 35,917 97.4Operating expenses 37,534 35,274 37,108 35,094 101.1Operating profit/loss (55) (774) 1,370 823
Finance income 58 58 496 20 11.7Finance cost 22 22 10 10 220.0Other revenues 16 16 62 5 25.8Other expenses 25 24 12 12 208.3
Net profit/loss (28) (747) 1,906 826
Competitive position of railway infrastructure
Over the years, public railway infrastructure deteriorated significantly due to a persistent lack of the funds necessary for its development, maintenance and reconstruction. Overhauls of railway lines aren’t performed within regular periods, consequently increasing the volume of maintenance work. Every year, overhaul needs to be performed on ca. 55 km of railway lines. However, only ca. 26.5 km of railway lines were overhauled yearly in the last 17 years, and the number further dropped to 16 km/year in the last 10 years, amounting to only 29% of the required amount of line overhauls. This state of affairs is further widening the gap between customer needs and requirements on one side, and the already less competitive railway services on the other.
Due to such poor state of railway infrastructure, no real interconnectivity and availability can be established, which results in low-quality public pas-senger services. Excessively slow modernisation of railway network increases the danger of transit flows moving to alternative routes in Italy, Austria, Hungary or Croatia; it could also force goods transported in the Port of Koper transit to instead move to North Sea ports. Due to low axle-loads on Slovenian network, individual wagon loads have already started moving to

2011
28SUMMARY OF THE ANNUAL REPORT
alternative routes that bypass Slovenia. Examples of inadequate axle-loads include a lack of D4 track category (an axle-load of 225 kN) on the Zidani Most-Šentilj line segment, which is part of the pan-European Lyon-Buda-pest Corridor and Salzburg/Graz-Solun Corridor. Public railway infrastruc-ture also faces line electrification issues – only 41% (503 km) of all lines are currently electrified. That these issues pose a major hindrance to transport operations is clearly attested by the fact that the Pragersko-Hodoš line is the sole line section in the whole of Corridor V which still hasn't been electrified.
Moreover, future challenges will include the drawing up of TSI implemen-tation programs and meeting the demands of EU corridor policy in order to prevent transport flows bypass Slovenia, which would have grave con-sequences on the operation in Port of Koper, Slovenske železnice and of logistics industry of Slovenia in general, and also reduce the availability of EU funding.
Account must also be taken in particular of the consequences which are likely to ensue from the construction of bypass railway lines to Budapest through Italy and Austria and certain bypass lines between the Republic of Croatia and Hungary. In its transport strategy, the Republic of Slovenia embraces the necessity to extend and update Corridor V and Corridor X, which would provide long-term competitiveness of Slovenian railway ser-vices.
To this aim, a national program for the development of public railway infrastructure needs to be adopted as soon as possible and long-term PSO contracts for the funding of PSO-related activities (which is also set out in EU regulations) need to be concluded with the state. This will establish coordination between technical and financial planning as well as improve the efficiency and rationalize the operation of public utilities.

29
Operation of other subsidiaries
SŽ-Centralne delavnice Ljubljana, d. o. o.1)
Activities:
• Maintenance of railway rolling stock; • Renovation/Refurbishment of railway rolling stock;• Participation in the construction of railway rolling stock;• Design, engineering and technical counselling.
On 1 October 2011, operations and staff of Traction and Technical wagon activity were transferred to Centralne delavnice Ljubljana, d. o. o. As the founder and the sole shareholder of Slovenske železnice, d. o. o., AUKN passed a decision on 14 February 2012, which confirmed the proposal for an increase of the capital of SŽ-Centralne delavnice Ljubljana, d. o. o., in the amount of EUR 8,443 thousand.
Revenue and expenditure, profit and loss
The profit/loss account of SŽ-Centralne delavnice Ljubljana, d. o. o., in 2011 consists of the maintenance account as well as the account of Traction and Technical wagon activity in the period X–XII/2011 (transfer of operations and staff to SŽ-Centralne delavnice on 1 October 2011).
1) Central workshops

2011
30SUMMARY OF THE ANNUAL REPORT
Basic operating categories of the income statement
Income statement – SŽ-Centralne delavnice Ljubljana, d. o. o. (EUR thousand) 2011 2010 Index
Operating revenues 62,791 44,420 141.4Operating expenses 61,972 44,054 140.7Operating profit/loss 819 366 223.8
Finance income 59 17 347.1Finance cost 370 338 109.5Other revenues 35 51 68.6Other expenses 17 52 32.7
Net profit/loss 526 45
In 2011, the company reached a positive operating result of EUR 819 tho-usand with operating revenues and operating expenses amounting to EUR 62,791 thousand and EUR 61,972 thousand, respectively. Financing recor-ded a loss of EUR 311 thousand, while other flows generated revenues of EUR 18 thousand. The net profit of the company amounted to EUR 526 thousand.
Owing to the transfer of operations and staff from Traction and Technical wagon activity to SŽ-CD Ljubljana, d. o. o., the operating revenues were up 41.4% on those achieved in 2010 and amounted to EUR 14,768 thousand. Not including the said transfer of activities, the operating revenues and net sales revenues were up 8.1% and 2.7% on 2010 respectively.
Sales of services and products on domestic railway market amounted to EUR 52,804 thousand, thus generating the largest portion (84.1%) of operating revenues. In 2011, the revenues recorded in maintenance activity amounted to EUR 45,020 thousand, which is up 3.2% or EUR 1,140 thousand on 2010.
The maintenance of railway rolling stock was provided to Slovenske želez-nice, the subsidiaries in the Slovenske železnice Group and external clients. The revenue generated from services to Slovenske železnice in 2011 amo-unted to EUR 35,457 thousand, which is up 3.1% or EUR 1,080 thousand on 2010. Services to external (non-SŽ) clients generated revenues in the amount of EUR 8,563 thousand, which equals those achieved in 2010. Revenue generated from maintenance services provided to external clients accounted for 19% of all maintenance-related revenues.
In 2011, following its vision and goals with the aim to increase the volume of services provided to regular and new clients, the company achieved important business results in virtually all service segments. Throughout the

31
year, it successfully maintained the required availability of the rolling stock to its biggest partners, SŽ-Tovorni promet and SŽ-Potniški promet. In parti-cular, it performed a revision of the entire SŽ Series 312 (electric trains) and successfully refurnished the interior of the diesel motor unit 813/814-130.
Services provided in the foreign market in 2011 included several revisions of (freight) wagons. Moreover, the segment for the maintenance and reno-vation of wheelsets achieved record results in 2011. The production capaci-ties required in wheelset renovation were successfully increased, which also attracted several external partners.
The SŽ-Železniško gradbeno podjetje Group1)
The SŽ-ŽGP Group consists of the parent company SŽ-ŽGP Ljubljana, d. d., and the following subsidiaries: Kamnolom Verd, d. o. o.2), SŽ-ŽGP, d. o. o., Beograd and SŽ-ŽGP, d. o. o., Podgorica.
Activities:
• Construction, reconstruction and maintenance of the track superstruc-ture and substructure;
• Reconstruction of industrial tracks (non-PSO use) and other railway infra-structure facilities;
• Construction of buildings.
Revenue and expenditure, profit and loss
1) The Railway Construction Company Group2) The Verd quarry

2011
32SUMMARY OF THE ANNUAL REPORT
Basic operating categories of the income statement
Income statement – The SŽ-ŽGP Group (EUR thousand) 2011 2010 Index
Operating revenues 57,192 58,802 97.3Operating expenses 50,320 53,228 94.5Operating profit/loss 6,872 5,574 123.3
Finance income 277 132 209.8Finance cost 416 366 113.7Other revenues 69 111 62.2Other expenses 77 22 350.0
Income tax 1,312 1,044 125.7Deferred tax (60) (13)Net profit/loss 5,353 4,372 122.4Net profit/loss attributable to equity holders 5,316 4,427 120.1Net profit/loss attributable to minority interests 37 (55)
Unfortunately, the operations of the SŽ-ŽGP Group did not remain unaffec-ted by the global financial crisis, which had a major impact on the construc-tion industry both home and abroad. Although the company received a sufficient amount of orders and had the necessary capacities to provide the required services, it faced a lack of construction materials (especially conc-rete and steel reinforcing bars used in reinforced concrete). The inability to provide construction materials was mainly the consequence of bankruptcy or inadequate liquidity and solvency of several construction companies.
Dire competition (both domestic and foreign) in acquiring major projects and loose legislation both contributed to long-drawn procedures at various stages of tendering, from initial project phases to the selection of contrac-tors. Examples include two railway invitations to tender, in which tenders were submitted as early as 2010, but the procedures remained ongoing. Some tendering procedures have been lasting for over two years and still haven't yielded a decision concerning the award of contracts (especially phase 1 of the ERTMS project, in which the company would provide a major portion of the services required by the project). The project 'Renovation of the Poljčane station' will be carried out in separate phases due to a lack of funding in the budget. Owing to such poor state of affairs, operating reve-nues amounted to EUR 57,192 thousand, which is down 2.7% on those achieved in 2010 and down on the projected amount for 2011.
Revenues from contracts concluded with other companies in the SŽ Group generated 70.1% of all operating revenues and amoun-ted to EUR 40,107 thousand with the largest portion generated by

33
SŽ-ŽGP, d. d. In 2011, the funds for the maintenance of public railway infrastructure (machinery used in railway maintenance) amounted to EUR 943 thousand, which is lower compared to the funds granted in 2010 (EUR 1,135 thousand).
Revenues from contracts concluded with external (non-SŽ) clients amo-unted to EUR 14,368 thousand and were predominantly generated by SŽ-ŽGP, d. d., (91.5%) from sales of services (in calls for tender or ordered by clients). The remaining proportion of revenues was generated from sales of sand and stone (2.5%), and from services related to reconstruction of level crossings in Montenegro.
The SŽ-ŽIP Group
The SŽ-ŽIP Group (the Railway Companies for Disabled Persons Group) con-sists of the parent company SŽ-ŽIP, Services, d. o. o., and the subsidiary Calidus sol, d. o. o.
Activities:
• Facility management;• Cleaning of SŽ facilities and rolling stock;• Management and maintenance of SŽ holiday facilities in Croatia;• Security;• Production, sales and various services.
Revenue and expenditure, profit and loss

2011
34SUMMARY OF THE ANNUAL REPORT
Basic operating categories of the income statement
Income statement – The SŽ-ŽIP Group (EUR thousand) 2011 2010 Index
Operating revenues 21,169 16,163 131.0Operating expenses 21,553 19,633 109.8Operating profit/loss (384) (3,470) 11.1
Finance income 6 6 100.0Finance cost 26 16 162.5Other revenues 425 3,495 12.2Other expenses 10 12 83.3
Income tax 1 2 50.0Net profit/loss 10 1Net profit/loss attributable to equity holders 10 1
In 2011, the SŽ-ŽIP Group achieved a negative operating result in the amount of EUR 384 thousand with operating revenues and operating expenses amounting to EUR 21,169 thousand and EUR 21,553 thousand, respectively. Financing recorded a loss of EUR 20 thousand, while other revenues recorded a profit of EUR 415 thousand. The net profit/loss of the Group therefore amounted to EUR 10 thousand.
Following the amendments made to legislation in 17 November 2011, assigned funds received from the national Health Insurance Institute and the national Pension and Invalidity Insurance Institute can now be used to finance ≤75% of the gross wages of employees with disabilities as well as any additional costs incurred from employment of persons with disabilities and can thus be used increase other operating revenues.
Ope rating revenues of SŽ-ŽIP, storitve, d. o. o., mainly consisted of revenues generated from production, sales and services (distribution of office mate-rial and internal company mail, fees charged for the use of water dispensers, candle manufacture, services performed in vehicle repair workshops, bus services etc.), cleaning services, facility management (maintenance of holi-day and other SŽ facilities, provision of landscape services and maintenance of single-person housing) and various security services (protection of faci-lities, parking lots etc.). Operating revenues of Calidus sol, d. o. o., mainly consisted of revenues generated from the management and maintenance of railway holiday facilities.
Net sales revenues account for 84.1% of all operating revenues. The largest portion (77.1%) of net sales revenues on domestic market was generated from sales within the Slovenske železnice Group.
35
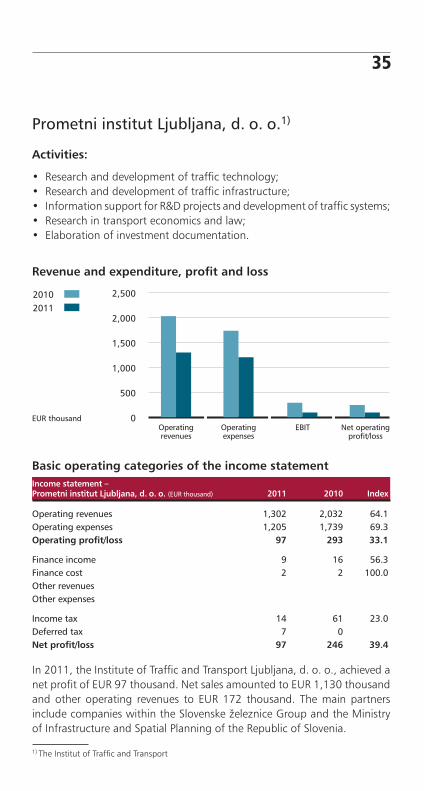
Prometni institut Ljubljana, d. o. o.1)
Activities:
• Research and development of traffic technology;• Research and development of traffic infrastructure;• Information support for R&D projects and development of traffic systems;• Research in transport economics and law;• Elaboration of investment documentation.
Revenue and expenditure, profit and loss
Basic operating categories of the income statementIncome statement – Prometni institut Ljubljana, d. o. o. (EUR thousand) 2011 2010 Index
Operating revenues 1,302 2,032 64.1Operating expenses 1,205 1,739 69.3Operating profit/loss 97 293 33.1
Finance income 9 16 56.3Finance cost 2 2 100.0Other revenuesOther expenses
Income tax 14 61 23.0Deferred tax 7 0Net profit/loss 97 246 39.4
In 2011, the Institute of Traffic and Transport Ljubljana, d. o. o., achieved a net profit of EUR 97 thousand. Net sales amounted to EUR 1,130 thousand and other operating revenues to EUR 172 thousand. The main partners include companies within the Slovenske železnice Group and the Ministry of Infrastructure and Spatial Planning of the Republic of Slovenia.
1) The Institut of Traffic and Transport

2011
36SUMMARY OF THE ANNUAL REPORT
SŽ-Železniška tiskarna Ljubljana, d. d.1)
Activities:
• Printing of railway tickets, transport timetables, various promotion/advertising material and railway trade forms;
• Other printing and bookbinding work.
Revenue and expenditure, profit and loss
Basic operating categories of the income statementIncome statement – SŽ-Železniška tiskarna Ljubljana, d. d. (EUR thousand) 2011 2010 Index
Operating revenues 586 485 120.8Operating expenses 534 527 101.3Operating profit/loss 52 (42)
Finance income 3 1 300.0Finance cost 0 1Other revenuesOther expenses
Deferred tax (7) 0Net profit/loss 48 (42)
In 2011, SŽ-Železniška tiskarna Ljubljana, d. d., achieved an operating profit of EUR 52 thousand with operating revenues and operating expenses amo-unting to EUR 586 thousand and EUR 534 thousand, respectively. Net profit/loss was also positive and amounted to EUR 48 thousand.
Net sales largely resemble those reached in 2010. In 2011, their largest por-tion consisted of sales of products and services to the Slovenske železnice Group, and amounted to EUR 438 thousand, down on sales in 2010, which amounted to EUR 455 thousand. Revaluation operating revenues amoun-ted to EUR 76 thousand and consisted entirely of investment property sales (EUR 76 thousand).
1) Railway Printing House
37
Staff
Fluctuation in Human Resources
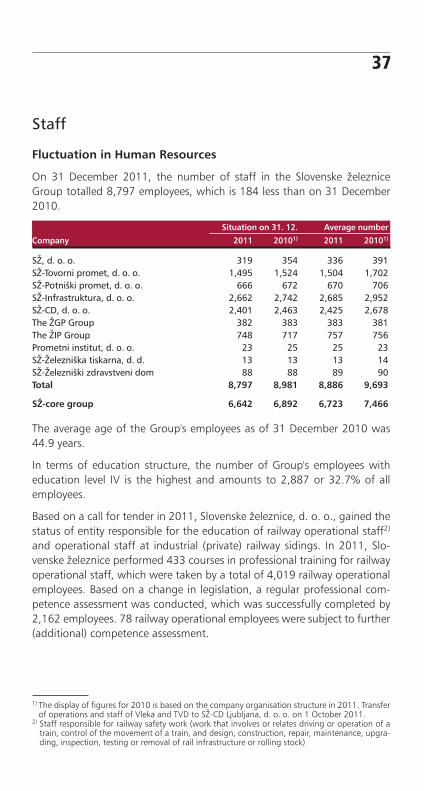
On 31 December 2011, the number of staff in the Slovenske železnice Group totalled 8,797 employees, which is 184 less than on 31 December 2010.
Company
Situation on 31. 12. Average number
2011 20101) 2011 20101)
SŽ, d. o. o. 319 354 336 391SŽ-Tovorni promet, d. o. o. 1,495 1,524 1,504 1,702SŽ-Potniški promet, d. o. o. 666 672 670 706SŽ-Infrastruktura, d. o. o. 2,662 2,742 2,685 2,952SŽ-CD, d. o. o. 2,401 2,463 2,425 2,678The ŽGP Group 382 383 383 381The ŽIP Group 748 717 757 756Prometni institut, d. o. o. 23 25 25 23SŽ-Železniška tiskarna, d. d. 13 13 13 14SŽ-Železniški zdravstveni dom 88 88 89 90Total 8,797 8,981 8,886 9,693
SŽ-core group 6,642 6,892 6,723 7,466
The average age of the Group's employees as of 31 December 2010 was 44.9 years.
In terms of education structure, the number of Group's employees with education level IV is the highest and amounts to 2,887 or 32.7% of all employees.
Based on a call for tender in 2011, Slovenske železnice, d. o. o., gained the status of entity responsible for the education of railway operational staff2) and operational staff at industrial (private) railway sidings. In 2011, Slo-venske železnice performed 433 courses in professional training for railway operational staff, which were taken by a total of 4,019 railway operational employees. Based on a change in legislation, a regular professional com-petence assessment was conducted, which was successfully completed by 2,162 employees. 78 railway operational employees were subject to further (additional) competence assessment.
1) The display of figures for 2010 is based on the company organisation structure in 2011. Transfer of operations and staff of Vleka and TVD to SŽ-CD Ljubljana, d. o. o. on 1 October 2011.
2) Staff responsible for railway safety work (work that involves or relates driving or operation of a train, control of the movement of a train, and design, construction, repair, maintenance, upgra-ding, inspection, testing or removal of rail infrastructure or rolling stock)

2011
38SUMMARY OF THE ANNUAL REPORT
At SŽ-ŽIP, storitve, d. o. o., employees took part in various in-company and external training programmes. The former focused on education and train-ing concerning safety and health at work, new technologies and new work procedures, cleaning technologies etc., and were attended by 1,304 emplo-yees. The latter, on the other hand, consisted of various courses, seminars, conferences, workshops etc., and were attended by 258 employees.
The pay policy was implemented according to the provisions of the Col-lective agreement for railway transport operation (Official Gazette of the Republic of Slovenia No. 95/07; official bulletin No 3/07), the Wage Annex to the Collective agreement (entry into force on 18 September 2007; publis-hed in Official Gazette of the Republic of Slovenia No. 95/07; official bulletin No 3/07), and the Agreement on financial stimulation for the promotion of better operating results at Slovenske železnice and on implementation of wage adjustments from 2009 and 2010.
Investments
In 2011, the Slovenske železnice Group invested EUR 26,827 thousand into capital assets, which was down 21.8% on 2010 and amounted to 66.4% of the annual investment plan.
Investments planned for 2011 consisted mostly of investments continued from 2010 and some new investments, which were necessary for normal passenger and freight operation.
(EUR thousand) 2011 2010 Index
Freight transport 14,294 9,872 144.8Passenger transport 5,567 10,216 54.5Infrastructure 1,866 1,524 122.4Traffic management 74 164 45.1Informatics 198 393 50.4Traction 487 4,153 11.7Technical wagon activity 42 2Central workshops 1,902 1,569 121.2Property 487 283 172.1Management 114 65 175.4The SŽ-ŽGP Group 1,346 4,980 27.0Traffic and transport institute 39 33 118.2Railway printing house 25 7 357.1The SŽ-ŽIP Group, Services 386 1,043 37.0
The Slovenske železnice Group 26,827 34,304 78.2

39
Investments into rolling stock (passenger, freight, and special purpose vehi-cles) amounted to 75.5% of all investments made by the Slovenske železnice Group in 2011. They are characterized by ongoing investments and typically include regular revisions and maintenance of railway vehicles after the end of their life cycle.
Assessment of railway transport safety and quality
Railway transport safety is assessed by comparing the number of exceptio-nal events and incidents in railway transport as well as their consequences with the figures from previous year. The assessment of railway transport quality, on the other hand, is based on the quality of the railway services provided, on the extent of train delays and on the condition of trains and railway stations.
In 2011, 40 exceptional events (serious accidents and accidents) occurred, which is 18 events less than in 2010. Accidents which were caused by the railway amounted to nine (9) cases, and those triggered by other parties to 31 cases.
Similarly, the number of incidents in 2011 dropped too – 659 cases were registered in total, which is 31 less than the previous year. However, unlike with accidents, the majority of incidents (361, down 3 incidents on 2010), were caused by the railway and the rest by other parties (298, down 28 inci-dents on 2010).
The condition of trains was assessed on the basis of samples taken from individual vehicles; 99.4% of the samples were in good condition, which is up 0.9% on 2010. An even greater improvement was noted in stations – 86.1% of all samples taken were in good condition, which is up 2.9% on 2010.
Due to certain changes in legislation, railway transport safety cannot be assessed over a longer span of time. A comparison with the figures from 2010, however, suggests an improvement in railway transport safety.

2011
40SUMMARY OF THE ANNUAL REPORT
Q uality management system
In 2011, Slovenske železnice implemented the quality management system in conformity with the requirements of ISO 9001:2008, the Rules of Pro-cedure and the Quality Manual. The system was subject to several inter-nal reviews and control assessments, and also evaluated in a management review. Quality policy and objectives achieved in 2011 were in line with the capacities and business progress of Slovenske železnice.
Moreover, Slovenske železnice pay attention to re-engineering and opti-misation of energy, as well as to environmental and waste management processes. Having implemented an environmental management system in conformity with ISO 14001 as early as 2002, the company made a com-mitment to exercise long-term and systematic control over any negative environmental impacts caused by its railway operations. In particular, efforts are made to maintain clean environment, use energy-efficient transport solutions, install energy-efficient equipment in railway buildings, vehicles and other machinery, promote optimal use of water and reduce the quantity of general waste.
In 2011, the subsidiaries SŽ-Infrastruktura, d. o. o., SŽ-Potniški pro-met, d. o. o., SŽ-Tovorni promet, d. o. o., and various departments of SŽ, d. o. o., obtained certification for their environmental management system in conformity with the international standard on environmental management ISO 14001. The validity period of the certificate expires on 22 January 2015.
As the Infrastructure Manager, Slovenske železnice are responsible for the implementation of the environmental protection legislation and committed to perform their regular and preventive maintenance work in accordance with the relevant environmental measures.
Consolidated financial statements of the Slovenske železnice Group with notes
Consolidated financial statements
Notes to the consolidated financial statements are considered an integral part of the said financial statements and must therefore be read in conjunc-tion with them. For ease of reference, the items below are first set out in summarised form in accordance with Article 62 of the Companies Act (ZGD), while consolidated financial statements are presented later on in the disclosure of assets and liabilities as well as revenues and expenses.
41
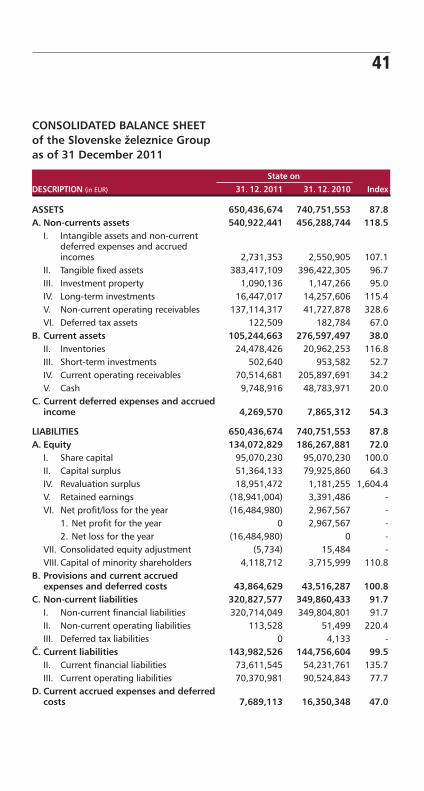
CONSOLIDATED BALANCE SHEET of the Slovenske železnice Groupas of 31 December 2011
DESCRIPTION (in EUR)
State on
Index31. 12. 2011 31. 12. 2010
ASSETS 650,436,674 740,751,553 87.8 A. Non-currents assets 540,922,441 456,288,744 118.5 I. Intangible assets and non-current
deferred expenses and accrued incomes 2,731,353 2,550,905 107.1
II. Tangible fixed assets 383,417,109 396,422,305 96.7 III. Investment property 1,090,136 1,147,266 95.0 IV. Long-term investments 16,447,017 14,257,606 115.4 V. Non-current operating receivables 137,114,317 41,727,878 328.6 VI. Deferred tax assets 122,509 182,784 67.0 B. Current assets 105,244,663 276,597,497 38.0 II. Inventories 24,478,426 20,962,253 116.8 III. Short-term investments 502,640 953,582 52.7 IV. Current operating receivables 70,514,681 205,897,691 34.2 V. Cash 9,748,916 48,783,971 20.0 C. Current deferred expenses and accrued
income 4,269,570 7,865,312 54.3
LIABILITIES 650,436,674 740,751,553 87.8 A. Equity 134,072,829 186,267,881 72.0 I. Share capital 95,070,230 95,070,230 100.0 II. Capital surplus 51,364,133 79,925,860 64.3 IV. Revaluation surplus 18,951,472 1,181,255 1,604.4 V. Retained earnings (18,941,004) 3,391,486 - VI. Net profit/loss for the year (16,484,980) 2,967,567 - 1. Net profit for the year 0 2,967,567 - 2. Net loss for the year (16,484,980) 0 - VII. Consolidated equity adjustment (5,734) 15,484 - VIII. Capital of minority shareholders 4,118,712 3,715,999 110.8 B. Provisions and current accrued
expenses and deferred costs 43,864,629 43,516,287 100.8 C. Non-current liabilities 320,827,577 349,860,433 91.7 I. Non-current financial liabilities 320,714,049 349,804,801 91.7 II. Non-current operating liabilities 113,528 51,499 220.4 III. Deferred tax liabilities 0 4,133 -Č. Current liabilities 143,982,526 144,756,604 99.5 II. Current financial liabilities 73,611,545 54,231,761 135.7 III. Current operating liabilities 70,370,981 90,524,843 77.7 D. Current accrued expenses and deferred
costs 7,689,113 16,350,348 47.0

2011
42SUMMARY OF THE ANNUAL REPORT
CONSOLIDATED INCOME STATEMENTof the Slovenske železnice Groupfor the period 1 January–31 December 2011
DESCRIPTION (in EUR) 2011 2010 Index
1. Net sales revenues 395,502,294 363,388,610 108.8 a) Revenues in the domestic market 217,689,695 233,885,529 93.1 1. Transport revenues 34,497,055 35,016,540 98.5 2. Other revenues 183,192,640 198,868,989 92.1 b) Revenues in the foreign market 177,812,599 129,503,081 137.3 1. Transport revenues 161,609,812 114,968,494 140.6 2. Other revenues 16,202,787 14,534,587 111.5 2. Change in inventories of finished goods
and work in progress 3,361,685 (583,048) -3. Capitalised own products and own services 22,253,725 23,015,625 96.7 4. Other operating revenues (including
revaluation operating revenues) 57,592,590 50,386,659 114.3 a) Other revenues from operations 52,420,583 49,330,946 106.3 b) Revaluation operating revenues 5,172,007 1,055,713 489.9 5. Costs of goods, materials and services 197,753,448 160,079,814 123.5 a) Costs of goods and materials sold and
costs of materials used 72,824,865 73,390,815 99.2 b) Costs of services 124,928,583 86,688,999 144.1 6. Labour costs 228,628,966 236,731,024 96.6 a) Costs of wages 163,568,752 165,326,630 98.9 b) Social security costs 34,206,915 34,476,161 99.2 c) Other labour costs 30,853,299 36,928,233 83.5 7. Depreciation/amortisation costs 46,254,079 43,425,973 106.5 a) Depreciation/Amortisation 40,211,873 38,389,138 104.7 b) Revaluation operating expenses for
intangible non-current assets and tangible fixed assets 717,329 583,661 122.9
c) Revaluation operating expenses for capital employed 5,324,877 4,453,174 119.6
8. Other operating expenses 3,882,646 3,004,428 129.2
Operating profit/loss (1±2+3+4–5–6–7–8) 2,191,155 (7,033,393) -
9. Financial revenues from interest 314,088 8,708,503 3.6 10. Financial revenues from loans 6,789,234 4,394,934 154.5 11. Financial revenues from operating
receivables 1,359,719 998,655 136.2 12. Financial expenses for impairment and
write-offs of investments 256,827 891,910 28.8 13. Financial expenses for financial liabilities 27,913,936 30,205,199 92.4 14. Financial expenses for operating liabilities 493,376 741,300 66.6
Operating profit/loss from ordinary activities (1±2+3+4–5–6–7–8+9+10+11–12–13–14) (18,009,943) (24,769,710) 72.7

43
DESCRIPTION (in EUR) 2011 2010 Index
15. Other revenues 5,276,205 7,886,381 66.9 16. Other expenses 870,116 1,184,065 73.5 17. Income tax 1,686,657 1,106,619 152.4 18. Deferred taxes (60,023) (13,582) 441.9
19. Net profit/loss of accounting period (1±2+3+4–5–6–7–8+9+10+11–12–13–14+15–16–17±18) (15,350,534) (19,187,595) 80.0
a) majority shareholders (16,484,980) (19,999,594) 82.4 b) minor shareholders 1,134,446 811,999 139.7
CONSOLIDATED BALANCE SHEET OF THE COMPREHENSIVE INCOME of the Slovenske železnice Groupfor the period 1 January–31 December 2011DESCRIPTION (in EUR) 2011 2010 Index
19. Net profit/loss of the accounting period (15,350,534) (19,187,595) 80.0 a) majority shareholders (16,484,980) (19,999,594) 82.4 b) minor shareholders 1,134,446 811,999 139.7 20. Surplus changes in revaluation of intangible
assets and tangible fixed assets 0 77,276 - a) majority shareholders 0 77,276 - b) minor shareholders21. Surplus changes in revaluation of financial
assets, available for sale (8,834,947) (15,486,301) 57.1 a) majority shareholders (8,827,608) (15,486,301) 57.0 b) minor shareholders (7,339) 0 -22. Gains and losses from company's foreign
operations (18) 2,549 - a) majority shareholders (18) 2,549 - b) minor shareholders23. Other components of the comprehensive
income (28,389,787) 0 - a) majority shareholders (28,389,787) 0 - b) minor shareholders24. Total comprehensive income for the
accounting period (19+20+21+22+23) (52,575,286) (34,594,071) 151.98 a) majority shareholders (53,702,393) (35,406,070) 151.68 b) minor shareholders 1,127,107 811,999 138.81

2011
44SUMMARY OF THE ANNUAL REPORT
CASH FLOW STATEMENT of the Slovenske železnice Groupfor the period 1 January–31 December 2011CASH FLOW STATEMENT (Version II.) (in EUR) 2011 2010
A. OPERATING CASH FLOWa) Profit-and-loss-account items 45,429,697 35,438,040
Operating revenues (excluding revaluation) and financial revenues from operating receivables 458,458,254 420,389,301 Operating expenses without depreciation expenses (excluding revaluation) and financial expenses from operating liabilities (411,338,019) (383,761,228)Income tax and other taxes, not included in operating expenses (1,690,538) (1,190,033)
b) Changes in net production means (and accruals, provisions, deferred receivables and tax liabilities) of balance sheet operating items (17,319,725) (50,473,197)Opening less closing operating receivables 15,860,873 (60,831,046)Opening less closing deferred expenses and accrued income 3,637,866 40,368,971 Opening less closing inventories (3,516,173) 2,120,483 Closing less opening operating debts (58,238,699) (33,000,187)Closing less opening deferred costs 24,936,408 868,582
c) Net cash from proceeds in operations or net cash of expenditure in operations (a+b) 28,109,972 (15,035,157)
B. CASH FLOWS IN INVESTING ACTIVITIESa) Proceeds from investing activities 8,969,376 29,125,297
Proceeds from received interest and profit shares, referring to investments 647,322 12,569,354 Proceeds from disposals of intangible assets 87,982 60,166 Proceeds from disposals of tangible fixed assets 1,210,584 2,775,026 Proceeds from disposals of investment properties 90,500 – Proceeds from disposals of non-current investments – 1,169,541 Proceeds from disposals of current investments 6,932,988 12,551,210
b) Expenditure on investments (29,470,735) (37,123,072)Expenditure on intangible assets purchase (873,895) (570,968)Expenditure on tangible fixed assets purchase (26,628,302) (35,504,139)Expenditure on acquiring long-term investments (1,942,492) (11,229)Expenditure on acquiring short-term investments (26,046) (1,036,736)
c) Net cash from proceeds in investments or net cash in expenditure on investments (a+b) (20,501,359) (7,997,775)
C. CASH FLOW IN FINANCING ACTIVITIESa) Proceeds in financing activities 75,841,541 124,238,437
Proceeds from increased non-current liabilities 2,927,547 53,202,494 Proceeds from increased current liabilities 72,913,994 71,035,943
b) Expenditure on financing activities (122,485,209) (114,595,131)Acquisitions for paid interest, referring to financing activities (26,490,389) (15,795,513)Acquisitions for repayment of non-current liabilities (1,077,543) (18,884,148)Acquisitions for repayment of current liabilities (94,917,277) (76,676,865)Acquisitions for dividends paid and other profit shares – (3,238,605)
c) Net cash from proceeds in financing or net cash of expenditures on financing activities (a+b) (46,643,668) 9,643,306
Č. Cash at the end of periodx) Net cash flow of period (total net Ac, Bc and Cc) (39,035,055) (13,389,626)y) Cash at the beginning of period 48,783,971 62,173,597
Cash at the end of period (x+y) 9,748,916 48,783,971

45
CONSOLIDATED STATEMENT OF CHANGES IN EQUITYof the Slovenske železnice Groupfor the period 1 January–31 December 2011
DES
CRIP
TIO
N (i
n EU
R)Sh
are
capi
tal
Capi
tal
rese
rves
Reva
luat
ion
surp
lus
Reta
ined
net
prof
it/lo
ss
Net
pro
fit/
loss
for t
he
perio
d
Cons
olid
a-tio
n ad
just
-m
ent
Min
ority
inte
rest
sTo
tal
A.1.
Bala
nce
at 3
1 D
ec 2
010
95,0
70,2
3079
,925
,860
1,18
1,25
53,
391,
486
2,96
7,56
715
,484
3,71
5,99
918
6,26
7,88
1A.
2.Ba
lanc
e at
1 Ja
n 20
1195
,070
,230
79,9
25,8
601,
181,
255
3,39
1,48
62,
967,
567
15,4
843,
715,
999
186,
267,
881
B.1.
Chan
ges
in e
quity
- tr
ansa
ctio
ns w
ith o
wne
rs0
00
2,96
8,16
90
0(7
29,9
58)
2,23
8,21
1g)
Div
iden
ds p
aid
3,39
5,87
4(8
07,9
80)
2,58
7,89
4i)
Oth
er c
hang
es in
equ
ity(4
27,7
05)
78,0
22(3
49,6
83)
B.2.
Tota
l com
preh
ensiv
e in
com
e fo
r the
per
iod
0(2
8,56
1,72
7)19
,435
,053
(28,
268,
226)
(16,
484,
980)
(21,
218)
1,13
2,67
1(5
2,76
8,42
7)a)
Ent
ry o
f net
pro
fit/lo
ss fo
r the
per
iod
(16,
484,
980)
1,13
4,44
6(1
5,35
0,53
4)c)
Ch
ange
in re
valu
atio
n re
serv
e of
tang
ible
fixe
d as
sets
(154
,453
)15
4,45
30
č)
Chan
ge in
reva
luat
ion
rese
rve
of fi
nanc
ial
inve
stm
ents
19,5
89,5
06(2
8,42
2,67
9)(1
,775
)(8
,834
,948
)d)
Oth
er c
ompo
nent
s of
com
preh
ensiv
e in
com
e fo
r th
e pe
riod
(28,
561,
727)
(28,
561,
727)
e) G
ains
and
loss
es fr
om c
ompa
ny's
fore
ign
oper
atio
ns(2
1,21
8)(2
1,21
8)B.
3.Ch
ange
s in
equ
ity0
0(1
,664
,836
)2,
967,
567
(2,9
67,5
67)
00
(1,6
64,8
36)
a) A
lloca
tion
of th
e re
mai
ning
net
pro
fit p
art f
or th
e co
mpa
ritiv
e pe
riod
to o
ther
cap
ital c
ompo
nent
s 2,
967,
567
(2,9
67,5
67)
0f)
Oth
er c
hang
es in
equ
ity(1
,664
,836
)(1
,664
,836
)C.
Bala
nce
at 3
1 D
ecem
ber 2
011
95,0
70,2
3051
,364
,133
18,9
51,4
72(1
8,94
1,00
4)(1
6,48
4,98
0)(5
,734
)4,
118,
712
134,
072,
829
BALA
NCE
SH
EET
PRO
FIT/
LOSS
(18,
941,
004)
(16,
484,
980)
(35,
425,
984)

2011
46SUMMARY OF THE ANNUAL REPORT
DES
CRIP
TIO
N (i
n EU
R)Sh
are
capi
tal
Capi
tal
rese
rves
Reva
luat
ion
surp
lus
Reta
ined
net
prof
it/lo
ss
Net
pro
fit/
loss
for t
he
perio
d
Cons
olid
a-tio
n ad
just
-m
ent
Min
ority
inte
rest
sTo
tal
A.1.
Bala
nce
at 3
1 D
ec 2
009
95,0
70,2
300
16,8
55,5
8869
8,20
7(2
8,26
9,22
7)12
,935
3,62
2,06
687
,989
,799
a) R
etro
activ
e re
calc
ulat
ion
(171
,941
)(1
71,9
41)
b) R
etro
activ
e ad
just
men
ts12
6,50
6(1
26,5
06)
0A.
2.Ba
lanc
e at
1 Ja
n 20
1095
,070
,230
016
,855
,588
652,
772
(28,
395,
733)
12,9
353,
622,
066
87,8
17,8
58B.
1.Ch
ange
s in
equ
ity –
tran
sact
ions
with
ow
ners
134,
261,
600
00
(4,0
37,4
15)
3,53
7,97
50
(718
,066
)13
3,04
4,09
4č)
En
try
of a
dditi
onal
pai
d-in
cap
ital
134,
261,
600
134,
261,
600
g) D
ivid
ends
pai
d(3
,537
,975
)3,
537,
975
(762
,245
)(7
62,2
45)
i) O
ther
cha
nges
in e
quity
(499
,440
)44
,179
(455
,261
)B.
2.To
tal c
ompr
ehen
sive
inco
me
for t
he p
erio
d0
0(1
5,67
4,33
3)26
5,30
8(1
9,99
9,59
4)2,
549
811,
999
(34,
594,
071)
a) E
ntry
of n
et p
rofit
/loss
for t
he p
erio
d(1
9,99
9,59
4)81
1,99
9(1
9,18
7,59
5)c)
Ch
ange
in re
valu
atio
n re
serv
e of
tang
ible
fixe
d as
sets
(188
,032
)26
5,30
877
,276
č)
Chan
ge in
reva
luat
ion
rese
rve
of fi
nanc
ial
inve
stm
ents
(15,
486,
301)
(15,
486,
301)
e) G
ains
and
loss
es fr
om c
ompa
ny's
fore
ign
oper
atio
ns2,
549
2,54
9B.
3.Ch
ange
s in
equ
ity(1
34,2
61,6
00)
79,9
25,8
600
6,51
0,82
147
,824
,919
00
0a)
Allo
catio
n of
the
rem
aini
ng n
et p
rofit
par
t for
the
com
parit
ive
perio
d to
oth
er c
apita
l com
pone
nts
(28,
395,
733)
28,3
95,7
330
č)
Sett
ling
loss
as
dedu
ctib
le c
apita
l ite
m(5
4,33
5,74
0)34
,906
,554
19,4
29,1
860
f) O
ther
cha
nges
in e
quity
(79,
925,
860)
79,9
25,8
600
C.Ba
lanc
e at
31
Dec
embe
r 201
095
,070
,230
79,9
25,8
601,
181,
255
3,39
1,48
62,
967,
567
15,4
843,
715,
999
186,
267,
881
BALA
NCE
SH
EET
PRO
FIT/
LOSS
3,39
1,48
62,
967,
567
6,35
9,05
3
CONSOLIDATED STATEMENT OF CHANGES IN EQUITYof the Slovenske železnice Groupfor the period 1 January–31 December 2010
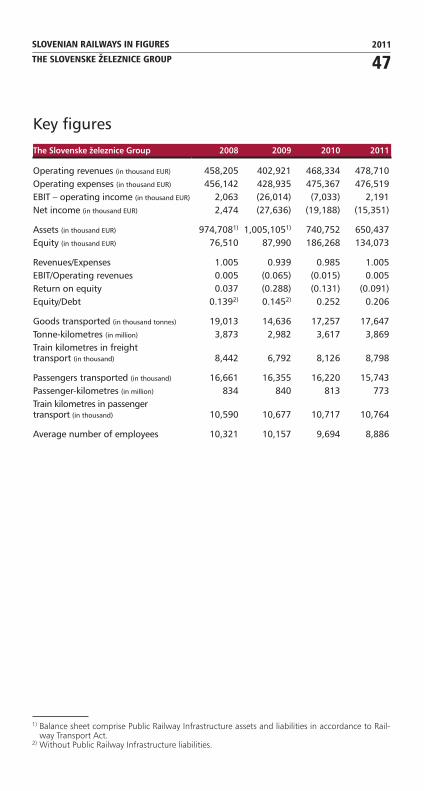
47SLOVENIAN RAILWAYS IN FIGURES 2011
THE SLOVENSKE ŽELEZNICE GROUP
Key figures
The Slovenske železnice Group 2008 2009 2010 2011
Operating revenues (in thousand EUR) 458,205 402,921 468,334 478,710Operating expenses (in thousand EUR) 456,142 428,935 475,367 476,519EBIT – operating income (in thousand EUR) 2,063 (26,014) (7,033) 2,191Net income (in thousand EUR) 2,474 (27,636) (19,188) (15,351)
Assets (in thousand EUR) 974,7081) 1,005,1051) 740,752 650,437Equity (in thousand EUR) 76,510 87,990 186,268 134,073
Revenues/Expenses 1.005 0.939 0.985 1.005EBIT/Operating revenues 0.005 (0.065) (0.015) 0.005Return on equity 0.037 (0.288) (0.131) (0.091)Equity/Debt 0.1392) 0.1452) 0.252 0.206
Goods transported (in thousand tonnes) 19,013 14,636 17,257 17,647Tonne-kilometres (in million) 3,873 2,982 3,617 3,869Train kilometres in freight transport (in thousand) 8,442 6,792 8,126 8,798
Passengers transported (in thousand) 16,661 16,355 16,220 15,743Passenger-kilometres (in million) 834 840 813 773Train kilometres in passenger transport (in thousand) 10,590 10,677 10,717 10,764
Average number of employees 10,321 10,157 9,694 8,886
1) Balance sheet comprise Public Railway Infrastructure assets and liabilities in accordance to Rail-way Transport Act.
2) Without Public Railway Infrastructure liabilities.

2011
48SLOVENIAN RAILWAYS IN FIGURES
REVENUES AND COSTS
Revenues and costs
Revenues structure
Cost structure

49SLOVENIAN RAILWAYS IN FIGURES 2011
THE SLOVENSKE ŽELEZNICE GROUP
Financials
The Slovenske železnice Group 2008 2009 2010 2011
PROFIT AND LOSS ACCOUNT (in thousand EUR)
Operating revenues 458,205 402,921 468,334 478,710Transport revenues 166,151 127,605 182,110 196,107− freight transport 132,274 93,983 144,713 159,858− passenger transport 33,877 33,622 37,397 36,249Revenues from public services 186,700 186,113 180,905 193,015− passenger transport 38,997 47,921 45,069 44,584− infrastructure 147,703 138,192 135,836 148,431Other operating revenues 105,354 89,203 105,319 89,588
Operaing expenses 456,142 428,935 475,367 476,519Costs of material and energy 75,722 68,382 73,391 72,825Costs of services 91,000 77,128 118,815 124,929Costs of labour 248,409 239,112 236,731 228,629Depreciation 32,646 36,302 38,389 40,212Other operating costs 8,365 8,011 8,041 9,924
EBIT – operating income 2,063 (26,014) (7,033) 2,191
Financial income minus financial expenses (3,943) (8,221) (17,736) (20,201)Other income minus other expenses 5,331 7,416 6,702 4,406
Income tax 263 817 1,121 1,747
Net profit/loss for the year 2,474 (27,636) (19,188) (15,351)
INVESTMENTS (in thousand EUR) 54,171 67,874 34,304 26,827
BALANCE SHEET (in thousand EUR)
Assets 974,708 1,005,105 740,752 650,437Fixed assets 803,416 818,113 456,289 540,922Current assets 160,217 138,758 276,598 105,245Other 11,075 48,234 7,865 4,270
Liabilities 974,708 1,005,105 740,752 650,437Equity 76,510 87,990 186,268 134,073Non-current liabilities 703,909 747,965 393,377 364,692Current liabilities 160,238 150,668 144,757 143,983Other 34,051 18,482 16,350 7,689

2011
50SLOVENIAN RAILWAYS IN FIGURES
FREIGHT TRANSPORT
Freight transport
Development of freight transport volume
Freight transport structure

51SLOVENIAN RAILWAYS IN FIGURES 2011
FREIGHT TRANSPORT
Structure of goods transported
Key stations

2011
52SLOVENIAN RAILWAYS IN FIGURES
FREIGHT TRANSPORT
2008 2009 2010 2011
INCOME STATEMENT1) (in thousand EUR)
Operating revenues 180,000 132,198 166,753 185,712Operating expenses 186,863 170,664 181,004 190,852EBIT – operating income (6,863) (38,466) (14,251) (5,140)Financial income minus financial expenses (6,343) (3,203) (13,434) (12,687)Other income minus other expenses (1,485) 1,501 2,203 1,478Income tax 0 0 0 0Net profit/loss for the year (14,691) (40,168) (25,482) (16,349)
GOODS TRANSPORTED (wagon consignments, in thousand tonnes) 18,977 14,607 17,224 17,616
INLAND TRANSPORT 1,880 1,631 1,830 1,441INTERNATIONAL TRANSPORT 17,097 12,976 15,394 16,175– Import 5,341 4,064 4,333 4,279– Export 2,089 1,857 1,994 1,938– Land transit 3,773 2,816 3,340 3,306– Port transit 5,894 4,239 5,727 6,652
thereof: COMBINED TRANSPORT 3,848 3,229 4,032 4,284 – Accompannied piggyback 1,485 936 1,042 1,151 – Unaccompannied piggyback 2,363 2,293 2,990 3,133
WORK PREFORMED (in million tonne-kilometres) 3,873.2 2,981.7 3,617.1 3,869.2
INLAND TRANSPORT 303.0 246.9 262.3 223.6INTERNATIONAL TRANSPORT 3,570.2 2,734.8 3,354.8 3,645.6– Import 825.6 644.8 656.5 672.8– Export 241.6 236.8 270.6 249.7– Land transit 847.2 610.9 762.4 772.2– Port transit 1,655.8 1,242.3 1,665.3 1,950.9
thereof: COMBINED TRANSPORT 687.0 678.3 874.6 973.0 – Accompannied piggyback 31.4 22.6 21.6 22.4 – Unaccompannied piggyback 655.6 655.7 853.0 950.6
AVERAGE ROUTE (km) 204.1 204.1 210.0 219.6INLAND TRANSPORT 161.2 151.4 143.2 155.2
1) Since 1 January 2011, transport revenues are accounted for in a different manner, which influenced the levels of operating revenue and expenditure.
For comparison purposes, transport revenues have been recalculated for past periods.
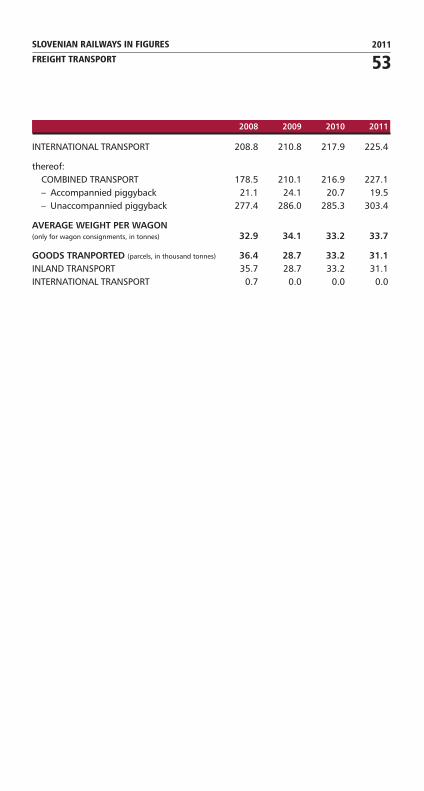
53SLOVENIAN RAILWAYS IN FIGURES 2011
FREIGHT TRANSPORT
2008 2009 2010 2011
INTERNATIONAL TRANSPORT 208.8 210.8 217.9 225.4
thereof: COMBINED TRANSPORT 178.5 210.1 216.9 227.1 – Accompannied piggyback 21.1 24.1 20.7 19.5 – Unaccompannied piggyback 277.4 286.0 285.3 303.4
AVERAGE WEIGHT PER WAGON (only for wagon consignments, in tonnes) 32.9 34.1 33.2 33.7
GOODS TRANPORTED (parcels, in thousand tonnes) 36.4 28.7 33.2 31.1INLAND TRANSPORT 35.7 28.7 33.2 31.1INTERNATIONAL TRANSPORT 0.7 0.0 0.0 0.0

2011
54SLOVENIAN RAILWAYS IN FIGURES
PASSENGER TRANSPORT
Passenger transport
Development of passenger transport volume
Passenger transport structure
Key stations

55SLOVENIAN RAILWAYS IN FIGURES 2011
PASSENGER TRANSPORT
2008 2009 20101) 20111)
INCOME STATEMENT (in thousand EUR)
Operating revenues 76,086 85,636 86,657 85,764Operating expenses 83,050 82,787 84,689 87,168EBIT – operating income (6,964) 2,849 1,968 (1,404)Financial income minus financial expenses (7,471) (4,133) (2,468) (4,409)Other income minus other expenses 307 1,284 67 389Income tax 0 0 0 0Net profit/loss for the year (14,128) 0 (433) (5,424)
PASSENGERS TRANSPORTED (in thousand) 16,661 16,355 16,220 15,743
INLAND TRANSPORT 15,753 15,434 15,294 14,838– Individual and group travels 9,105 8,809 8,720 8,601– Advance payment tickets (workers) 1,401 1,356 1,395 1,434– Advance payment tickets (students) 5,247 5,269 5,179 4,803INTERNATIONAL TRANSPORT 908 921 926 905
LUGGAGE FORWARDED (in tonnes) 175.4 231.5 222.9 264.0
ACCOMPANIED CARS 16,622 12,226 11,220 13,909
PERFORMED PASSENGER KILOMETRES(in million) 834.1 840.1 813.3 773.2INLAND TRANSPORT 712.6 717.5 679.5 641.3– Individual and group travels 509.3 519.0 483.1 453.3– Advance payment tickets (workers) 47.7 46.0 48.4 50.7– Advance payment tickets (students) 155.6 152.5 148.0 137.3INTERNATIONAL TRANSPORT 121.5 122.6 133.8 131.9
NUMBER OF SPECIAL TRAINS 429 601 399 383
AVERAGE ROUTE (km) 50.1 51.4 50.1 49.1INLAND TRANSPORT 45.2 46.5 44.4 43.2INTERNATIONAL TRANSPORT 133.8 133.1 144.5 145.7
1) Since 1 January 2011, transport revenues are accounted for in a different manner, which influenced the levels of operating revenue and expenditure.
For comparison purposes, transport revenues have also been recalculated for 2010.

2011
56SLOVENIAN RAILWAYS IN FIGURES
INFRASTRUCTURE
Infrastructure
Maintenance of public railway infrastructure
Investment maintenance of public railway infrastructure

57SLOVENIAN RAILWAYS IN FIGURES 2011
INFRASTRUCTURE
2008 2009 2010 2011
INCOME STATEMENT (in thousand EUR)
Operating revenues 159,849 164,732 165,818 173,063Operating expenses 155,983 158,934 161,365 172,363EBIT – operating income 3,866 5,798 4,453 700Financial income minus financial expenses 1,380 509 1,706 645Other income minus other expenses 1,507 1,958 1,153 1,860Income tax 0 0 0Net profit/loss for the year 6,753 8,265 7,312 3,205
MAINTENANCE OF PUBLIC RAILWAY INFRASTRUCTURE (in thousand EUR)
Maintenance of tracks 77,972 68,129 71,759 81,439Maintenance of signaling and telecommunication equipment 22,766 21,761 19,709 18,057Maintenance of electric power facilities 11,325 12,423 11,143 16,965
Total 112,063 102,313 102,611 116,461

2011
58SLOVENIAN RAILWAYS IN FIGURES
STAFF
Staff
Number of employees 2001–2011 (year end)
Age and sex structure
Employees by organisational units

59SLOVENIAN RAILWAYS IN FIGURES 2011
LINE UTILISATION
Line utilisation
Number of trains per day (passenger and freight transport)

2011
60SLOVENIAN RAILWAYS IN FIGURES
TRANSPORT SERVICES
Transport services
2008 2009 2010 2011
Trains preformance (thousand train km) 19,032 17,469 18,843 19,562Freight trains (thousand train km) 8,442 6,792 8,126 8,798Passenger trains (thousand train km) 10,590 10,677 10,717 10,764
Frequency of trains per day and route (number) 699 674 708 702Freight trains (number) 198 157 194 197Passenger trains (number) 501 517 514 505
Turnover of freight wagons (days) 4.6 5.5 4.9 5.5
Seat occupancy (%) 31.6 28.9 29.1 27.0
Average commercial speedFreight trains (km/h) 39.51 40.99 38.35 39.46Passenger trains (km/h) 53.17 53.31 53.23 53.69
DelaysFreight trains (min/100 train km) 68.6 39.6 78.8 68.0Passenger trains (min/100 train km) 3.3 2.8 2.7 1.9
Available seats in passenger trains (No. of seats/train) 205 204 201 186
Average number of passengers per train (number) 91 87 86 97
Gross tonnes per freight train (tonnes) 914.1 906.8 930.9 926.6
Transported tonnes per freight train (tonnes) 485.6 475.9 460.2 462.7
Ratio net/gross tonnes (%) 48.5 49.1 49.4 49.9
Work of traction vehiclesElectric locomotives (operation km/unit) 162,569 159,542 169,107 158,758 (thousand GHTK/unit) 108,609 100,327 112,821 119,920
Diesel locomotives (operation km/unit) 62,062 60,075 59,064 58,391 (thousand GHTK/unit) 20,433 16,372 17,696 18,122
Electric motor unit trains (operation km/unit) 166,444 167,933 174,485 179,600 (thousand GHTK/unit) 20,301 20,195 20,766 21,126
Diesel motor unit trains (operation km/unit) 103,357 103,340 108,802 106,078 (thousand GHTK/unit) 7,904 7,744 8,176 8,013
Specific power consumptionElectric power (kWh/million GHTK) 24.68 25.24 24.72 24.31Diesel fuel (kg/thousand GHTK) 8.06 9.91 9.31 9.00

61SLOVENIAN RAILWAYS IN FIGURES 2011
TRACTION AND HAULED VEHICLES
Traction and hauled vehicles
Age structure of freight wagons (as of 31. December 2011)
Age structure of convenctional coaches (as of 31. December 2011)

2011
62SLOVENIAN RAILWAYS IN FIGURES
TRACTION AND HAULED VEHICLES
Age structure of passenger motor units trains (as of 31. December 2011)
Age structure of locomotives (as of 31. December 2011)

63SLOVENIAN RAILWAYS IN FIGURES 2011
TRACTION AND HAULED VEHICLES
Gross hauled tonne-kilometres/locomotive (in million)
Tonne-kilometres/freight wagon (in thousand)
Passenger kilometres/passenger vehicle (in thousand)

2011
64SLOVENIAN RAILWAYS IN FIGURES
TRACTION AND HAULED VEHICLES
Traction vehicles inventory
(Number) 2008 2009 2010 2011
Total 271 273 271 265Electric locomotives 82 86 84 78Electric motor unit trains 39 39 39 39Diesel locomotives 76 74 74 74Diesel motor unit trains 70 70 70 70Museum steam locomotives 4 4 4 4
Freight wagons inventory
(Number) 2008 2009 2010 2011 4-axle
Average carrying capacity
of wagons (tonnes)
Total 3,921 3,905 3,211 3,142 2,798 53.6E open – ordinary 973 974 829 828 812 58.2F open – special 507 507 478 478 478 56.6G covered – ordinary 411 390 143 105 42 38.5H covered – ordinary 375 375 348 328 258 51.7K flat – ordinary 181 181 148 148 0 26.8L flat – special 65 65 64 64 25 33.6R flat – four-axle ordinary 160 160 145 145 145 55.5S flat – four-axle special 272 279 253 253 253 57.0T with sliding roof 721 721 558 549 541 53.9U special 99 96 96 96 96 57.1Z tank wagons 157 157 149 148 148 58.0
P private included in SŽ rolling stock 555 469 416 415 415 60.9

65SLOVENIAN RAILWAYS IN FIGURES 2011
TRACTION AND HAULED VEHICLES
Passenger coaches inventory
(Number)
2008
2009
2010
2011
Average numberof seats
per coach
Portion
1. cl.
2-axle coachesBaat 3 3 2 2 28.0
4-axle coaches Passenger coaches (A, AB, B) 98 93 93 93 58.0 13.9%Restaurant coaches (WR, AR, BR) 5 5 5 5 17.8 33.7%Couchettes (Ac, Bc) 2 2Sleeping cars, saloons (WI) 2 2DI 2 2 2 2
TOTAL 109 107 102 102 thereof: air-conditioned 13 13 13 13
S flat – special 7

2011
66SLOVENIAN RAILWAYS IN FIGURES
STATISTIC ABOUT INFRASTRUCTURE
Statistic about infrastructure
2011 %
SŽ – Stations (Number) 129– For freight transport 9 7.0%– For passenger transport 8 6.2%– For passenger and freight transport 111 86.0%– Shunting stations 1 0.8%
Acutal length of lines (km) 1,209.1– For freight transport 87.2 7.2%– For passenger transport 2.2 0.2%– For mixed transport 1,119.8 92.6%– Electrified lines 500.4 41.4%
Track length (km) 1,539
Tunnels and galleries (Number) 93(km) 37
Bridges (stone, concrete, reinforced concrete, steel) and viaducts (Number) 396
(km) 11
Culverts (stone, concrete, reinforced concrete, steel) (Number) 2,942
(km) 6
Superlatives
The steepest linePrvačina-Štanjel 26.7 pars promile from km 105.639 to km 105.884
The longest horizontalRuše–Fala from km 11.850 to km 18.350 over a length 6,500 m on the Maribor–Prevalje line
The longest plainPtuj–Velika Nedelja from km 19.540 to km 35.350 over a length 15,810 m on then Pragersko–Središče line
Railway station located at the highest point above sea level Postojna 582 mRailway station located at the lowest point above sea level Koper 3 m
The longest bridge575 m Novo mesto – on the industrial siding for Revoz factory – bridge across the Težka voda stream
The highest bridge 30 m Most na Soči over then Idrijca river (length 289 m)The longest tunnel Bohinj tunnel 6,327.3 mThe shortest tunnel Radovljica 25.03 mThe oldest railway line Southern State Railway – Šentilj–Celje, 2 June 1846

67SLOVENIAN RAILWAYS IN FIGURES 2011
EUROPEAN RAILWAYS COMPARISON
European railways comparison – 2010
Country Railway
Lines
Average number of employees
Length (km)
Electri-fied
(km)
Electri-fied
(%)
Germany AAE, DB AG, GVG, KEG 33,707 19,819 59 239,635Italy FS SpA, FNME, RTC 18,011 13,090 73 84,754Austria GKE, ÖBB, SLB 5,039 3,427 68 no dataSpain RENFE, FEVE, FGC, EuskoTren 15,543 9,267 60 32,300Switzerland BLS, CFF/SBB/FFS 3,573 3,573 100 30,643Belgium SNCB/NMBS 3,578 3,005 84 37,130France SNCF, RFF 29,841 15,635 52 155,210Slovenia SŽ 1,228 503 41 7,466
Average number of passengers per day per km of line – 2010
Average number of tonnes per dey per km of line – 2010

2011
68SLOVENIAN RAILWAYS IN FIGURES
SLOVENIAN RAILWAY NETWORK
Slovenian railway network


Sources:
Slovenian Railways Annual ReportInternational Railways Statistics UICSlovenian Railways Statistical and Analitical data


![Slovenske novele [ 1935 ] - cloverleaf-mall.com · SLOVENSKE NOVELE 1935 BESeDA 6 »To ni tako, drÏavljanka«, se je smejal. »Vpisani mo-rate biti v stranko. Kdor ni ãlan stranke,](https://static.fdocuments.us/doc/165x107/5e058c1b82eaa73a9b0ef2db/slovenske-novele-1935-cloverleaf-mall-slovenske-novele-1935-beseda-6-to.jpg)