Summary of Performance and Financial Information for ... · PDF fileSUMMARY OF PERFORMANCE AND...
12
SUMMARY OF PERFORMANCE AND FINANCIAL INFORMATION FISCAL YEAR 2012 SOCIAL SECURITY ADMINISTRATION
Transcript of Summary of Performance and Financial Information for ... · PDF fileSUMMARY OF PERFORMANCE AND...
Social Security Administration | SSA Publication Number 31-251 | February 2013
S U M M A R Y O F P E R F O R M A N C EA N D F I N A N C I A L I N F O R M AT I O N
F I S C A L Y E A R 2 0 1 2
S O C I A L S E C U R I T Y A D M I N I S T R A T I O N

For more information:Office of Public InquiriesWindsor Park Building6401 Security Blvd.
Baltimore, Maryland 21235-6401
Contact us via e-mail:[email protected]

SSA’S FY 2012 SUMMARY OF PERFORMANCE AND FINANCIAL INFORMATION 1
SUMMARY OF PERFORMANCE & FINANCIAL INFORMATION
FISCAL YEAR 2012
OUR MISSION
Deliver Social Security services that meet the changing needs of the public
ABOUT THIS SUMMARY
The goal of this Summary of Performance and Financial Information for Fiscal Year (FY) 2012 is to increase accountability by making our performance and financial information transparent and accessible. In this summary, we include performance and financial information to highlight our efforts identified in the full Performance and Accountability Report (PAR) for FY 2012 (www.socialsecurity.gov/finance/).
SUMMARY OF OUR PERFORMANCE
WHO WE ARE AND WHAT WE DO
Few government agencies touch the lives of as many people as we do. The programs we administer provide a financial safety net for millions of Americans. Many people consider our programs the most successful large-scale Federal programs in our Nation’s history. Initially, Social Security covered retired workers. Later, program expansions added dependent and survivor benefits, as well as the Disability Insurance program. We also administer the Supplemental Security Income (SSI) program, a Federal means-tested program, financed through general revenue funds.
HOW WE SERVED AMERICA IN FISCAL YEAR 2012
· Issued 16 million new and replacement Social Security cards;
· Performed 1.5 billion automated Social Security number verifications;
· Posted 220 million earnings items to workers’ records;
· Completed more than 56 million transactions on our National 800 Number;
· Registered 2.2 million users for MySocialSecurity, our online Social Security Statement;
· Assisted 45 million visitors;
· Received nearly 5 million retirement, survivor, and Medicare applications;
· Received about 3.2 million initial disability claims;
· Completed 443,233 full medical continuing disability reviews (CDR);
· Completed nearly 3.2 million overpayment actions; and
· Conducted 672,352 hearings.

2 SSA’S FY 2012 SUMMARY OF PERFORMANCE AND FINANCIAL INFORMATION
OUR PERFORMANCE
The President emphasizes the need for Government to work better, faster, and more efficiently to address the extraordinary challenges our country faces. We use the performance management framework detailed in our Agency Strategic Plan for FY 2013 - FY 2016 (www.socialsecurity.gov/asp/index.html) to align our Strategic Goals with underlying objectives, relevant issues, strategies, and key performance measures. Our Strategic Goals are:
· Goal 1: Deliver Quality Disability Decisions and Services; · Goal 2: Provide Quality Services to the Public; · Goal 3: Preserve the Public’s Trust in Our Programs; and · Goal 4: Strengthen Our Workforce and Infrastructure.
In support of the Government-wide initiative to deliver higher-performing government, we set the following aggressive Priority Goals that we expect to achieve within a 24-month period without new legislation or additional funding:
· Priority Goal 1: Faster hearing decisions; · Priority Goal 2: Reduce Supplemental Security Income overpayments; and · Priority Goal 3: Increase use of our online services.
In addition to our 4 Strategic Goals and 3 Priority Goals, we worked to achieve the 35 performance measures identified in our Annual Performance Plan for FY 2013 and Revised Final Performance Plan for FY 2012 (www.socialsecurity.gov/performance/). When we published the FY 2012 PAR, we had final data for 29 of our 35 performance measures and we met our target for 19 of those measures. At the time we published the FY 2012 PAR, we did not have data for 6 of the 35 performance measures, and we will report those measures in our FY 2013 Annual Performance Report. We also provide an overview of our performance in achieving our goals in our full FY 2012 PAR Fiscal Year 2012 Performance At-A-Glance section (www.socialsecurity.gov/finance/2012/Overview%20Performance.pdf), pages 11-15, and provide detailed information in the Performance Section (www.socialsecurity.gov/finance/2012/Agency%20Performance.pdf), pages 54-94.
Below, we highlight nine key FY 2012 performance measures, two of which also support our Priority Goals.
STRATEGIC GOAL 1: DELIVER QUALITY DISABILITY DECISIONS AND SERVICES
Strategic Objectives: Reduce the Wait Time for Hearing Decisions and Eliminate the Hearings Backlog; Improve Our Disability Policies, Procedures, and Tools; and Expedite Cases for the Most Severely Disabled Individuals.
1.1c: Minimize average wait time from hearing request to decision (Supports Priority Goal 1)
FY 2012 Target: 321 days (September only)
Performance: 362 days (September only) Target Met: No
We did not reach our target for average wait time for a hearing decision. We received significant increases in hearings requests in the last two years. Additionally, we were only able to hire 145 of the 219 administrative law judges (ALJ) we needed in FY 2012 to keep up with our high number of requests. Due to resource constraints, we had to cancel plans to open eight new hearing offices, resulting in less available space for ALJs. For additional information, please refer to our full FY 2012 PAR, page 58.
September 2008 2009 2010 2011 2012 Performance 509 days 472 days 390 days 345 days 362 days

SSA’S FY 2012 SUMMARY OF PERFORMANCE AND FINANCIAL INFORMATION 3
1.1d: Eliminate the oldest remained pending hearing requests FY 2012 Target: Less than 0.50% of pending hearing requests 725 days or older
Performance: 0.15% of pending hearing requests 725 days or older
Target Met: Yes
We achieved this goal. We began FY 2012 with 113,593 cases that would be 725 days or older by the end of the fiscal year. At the end of the fiscal year, only 169, or 0.15 percent, of claims remained, which was below our target. For additional information, please refer to our full FY 2012 PAR, page 59.
Fiscal Year 2007 2008 2009 2010 2011 2012
Performance
108 of 63,770 cases
remained pending
1,000 days or more (.17%)
281 of 135,160 cases
remained pending 900 days or more (.21%)
228 of 166,838 cases
remained pending 850 days or more (.14%)
47 of 139,026 cases
remained pending 825 days or more (.03%)
103 of 111,792 cases
remained pending 775 days or more (.09%)
169 of 113,593 cases
remained pending 725 days or more (.15%)
1.2a: Minimize average processing time for initial disability claims FY 2012 Target: 111 days Performance: 102 days Target Met: Yes
In FY 2012, we lowered our average processing time to 102 days, 9 days below our target. This decrease is due, in part, to the continued productivity increases in our Disability Determination Services (DDS). For additional information, please refer to our full FY 2012 PAR, page 61.
Fiscal Year 2008 2009 2010 2011 2012 Performance 106 days 101 days 111 days 109 days 102 days
1.3a: Achieve the target percentage of initial disability cases identified as Quick Disability Determinations or Compassionate Allowances
FY 2012 Target: 5.5% (September only)
Performance: 5.8% (September only) Target Met: Yes
In FY 2012, we met our goal. Quick Disability Determinations (QDD) and Compassionate Allowances (CAL) are two of our most successful initiatives designed to improve the speed of our disability process. In FY 2012, we updated our QDD predictive model, which allowed us to increase the number of applicants served through the process. We added 65 new conditions to the CAL list, which brought the total to 165 conditions. Our target was to identify 5.5 percent of the initial disability claims as QDD or CAL − we identified 5.8 percent in September 2012. For additional information, please refer to our full FY 2012 PAR, pages 19 and 71.
September 2009 2010 2011 2012 Performance 3.8% 4.6% 5.9% 5.8%

4 SSA’S FY 2012 SUMMARY OF PERFORMANCE AND FINANCIAL INFORMATION
STRATEGIC GOAL 2: PROVIDE QUALITY SERVICES TO THE PUBLIC
Strategic Objectives: Increase the Use of Our Online Services; Increase Public Satisfaction with Our Telephone Services; Expand the Use of Video Services; and Improve the Clarity of Our Notices.
2.1a: Increase the percentage of claims filed online (Supports Priority Goal 3)
FY 2012 Target: 42% (Last quarter only)
Performance: 44% (Last quarter only) Target Met: Yes
In FY 2012, we achieved our goal by concentrating our efforts on marketing our online services to more targeted audiences.
Our online benefit application, iClaim, is one of the three highest rated electronic services in Federal Government, as measured by the American Customer Satisfaction Index. The iClaim application is available in both English and Spanish and ranks higher in customer satisfaction than popular private companies like Amazon and Google. For additional information, please refer to our full FY 2012 PAR, pages 20 and 72.
Fourth Quarter FY 2010 2011 2012 Performance 35% 39% 44%
2.2c: Maintain the percent of people rating our services as “excellent,” “very good,” or “good” FY 2012 Target: 83.5% Performance: 80.9% Target Met: No
Although we did not meet our target, overall satisfaction with our services held steady in FY 2012.
These survey results allow us to identify the specific aspects of service where improvements would have the greatest effect on overall satisfaction. For additional information, please refer to our full FY 2012 PAR, pages 76 and 98.
Fiscal Year 2006 2007 2008 2009 2010 2011 2012 Performance 82% 81% 81% 81% 78.2% 81.4% 80.9%
STRATEGIC GOAL 3: PRESERVE THE PUBLIC’S TRUST IN OUR PROGRAMS
Strategic Objectives: Increase Efforts to Accurately Pay Benefits; Recover Improper Payments; Maintain Accurate Earnings Records; and Make Our Administrative Operations Even More Efficient.

SSA’S FY 2012 SUMMARY OF PERFORMANCE AND FINANCIAL INFORMATION 5
3.1a: Complete the budgeted number of Supplemental Security Income non-disability redeterminations FY 2012 Target: 2,622,000 Performance: 2,624,170 Target Met: Yes
In FY 2012, we achieved our goal and completed 2,170 more redeterminations than we planned. Redeterminations are periodic reviews of the non-medical factors of SSI recipients’ eligibility for SSI payments, such as household income. We estimate that every dollar spent on SSI redeterminations yields about $6 in lifetime program savings, including savings accrued to Medicaid. For additional information, please refer to our full FY 2012 PAR, page 79.
Fiscal Year 2007 2008 2009 2010 2011 2012 Performance 1,038,948 1,220,664 1,730,575 2,465,878 2,456,830 2,624,170
3.1b: Complete the budgeted number of full medical continuing disability reviews FY 2012 Target: 435,000 Performance: 443,233 Target Met: Yes
In FY 2012, we achieved our goal. We conducted 97,741 more full medical CDRs than in FY 2011. We perform CDRs to determine if disabled beneficiaries still meet the medical requirements for continued eligibility. We estimate, on average, each dollar spent on full medical CDRs will yield about $9 in lifetime program savings, including savings accrued to Medicare and Medicaid. For additional information, please refer to our full FY 2012 PAR, page 80.
Fiscal Year 2006 2007 2008 2009 2010 2011 2012 Performance 340,580 207,637 245,388 316,960 324,567 345,492 443,233
STRATEGIC GOAL 4: STRENGTHEN OUR WORKFORCE AND INFRASTRUCTURE
Strategic Objectives: Strengthen Our Workforce – Recruit, Train, Develop, and Retain Superior Employees; Maintain Secure and Reliable Information Technology Services; and Increase Efficiency of Our Physical Infrastructure.
4.1b: Employ individuals with targeted disabilities FY 2012 Target: 2.00% Performance: 1.99% Target Met: No
In FY 2012, we fell slightly short of our goal to employ individuals with targeted disabilities. We conducted targeted recruitment through our trained nationwide cadre of Selective Placement Coordinators who collaborated with partners from local colleges, State vocational rehabilitation agencies, Ticket to Work employment networks, advocacy groups, and other organizations to recruit qualified job candidates with disabilities. In addition, we selected candidates through the Schedule A appointing authority allowing us to hire individuals with disabilities outside of the traditional competitive hiring process. For additional information, please refer to our full FY 2012 PAR, page 91.
Fiscal Year 2008 2009 2010 2011 2012 Performance 2.03% 2.02% 1.99% 1.99% 1.99%

6 SSA’S FY 2012 SUMMARY OF PERFORMANCE AND FINANCIAL INFORMATION
OUR MANAGEMENT AND PERFORMANCE CHALLENGES
In FY 2012, the Office of the Inspector General identified eight top management and performance challenges we face. Below is a brief summary of how we addressed these challenges in FY 2012. For additional information, please refer to the full Inspector General’s Statement on SSA’s Major Management and Performance Challenges (www.socialsecurity.gov/finance/2012/OIG 2012 PAR Mgmt Challenges.pdf).
1. Reduce the Hearings Backlog and Prevent its Recurrence. We continued to adhere to our plan to eliminate the backlog. In FY 2012, we hired 147 ALJs and adjudicated approximately 37,000 cases using the senior attorney adjudication program. Additionally, we held almost 154,000 video hearings nationwide, an increase of almost 24,000 video hearings compared to FY 2011.
2. Improve the Timeliness and Quality of the Disability Process. We are developing a Disability Case Processing System (DCPS), which is a common system that will replace the 54 different existing systems that support the DDSs. A common case processing system will help us distribute policy changes more timely and process cases more consistently throughout the Nation. In FY 2012, we began testing the initial version of DCPS in the Idaho DDS.
3. Reduce Improper Payments and Increase Overpayment Recoveries. We use a variety of internal and external methods to collect overpayments. Internal debt collection methods include benefit withholding and billing with follow-up. External debt collection tools include the Treasury Offset Program, credit bureau reporting, and Federal Salary Offset. In FY 2012, we recovered about $3.3 billion in overpayments at an administrative cost of $0.07 for every dollar collected.
4. Improve Customer Service. In FY 2012, we published our Customer Service Plan (www.socialsecurity.gov/open/customerserviceplan/) which outlines our strategy to improve service delivery quality, speed, and efficiency. The plan highlights our video hearings initiative, which uses technology to minimize costs and expand customer access. Also, in FY 2012, we released an online Spanish retirement application and a new online version of the Social Security Statement to provide eligible workers access to their Social Security earnings and benefit information.
5. Invest in Information Technology Infrastructure to Support Current and Future Workloads. In FY 2012, we introduced a new Internet process to register and authenticate people who want to use our online applications. The public can use this new authentication process when logging into our MySocialSecurity Webpage (www.socialsecurity.gov/myaccount/), which allows the public to access their Social Security Statement online.
6. Strengthen the Integrity and Protection of the Social Security Number. We offer an online verification program that allows employers to verify the name and Social Security numbers of their employees. In FY 2012, approximately 40,000 registered employers submitted about 102 million verifications. In addition, over 404,000 employers enrolled to use E-Verify, which assists employers in verifying the employment eligibility of newly hired employees. These employers submitted almost 23 million queries during this period. Additionally, about 84,500 transactions processed through the E-Verify Self-Check Service, an Internet-based application, allows United States workers to check their own employment eligibility.
7. Improve Transparency and Accountability. In FY 2012, we updated our Open Government Plan (www.socialsecurity.gov/open/story-2012-04-09-open-government-plan2.html), which focuses on increasing transparency, and we updated our Open Government Website (www.socialsecurity.gov/open/index.html). We also released 41 different datasets on Data.gov (www.data.gov/) as of the end of FY 2012, which are accessible to the public. In May 2012, we released MySocialSecurity, a Webpage that allows the public to request an online version of the Social Security Statement, which provides eligible workers with secure and convenient access to their Social Security earnings and benefit information.
8. Strengthen Strategic and Tactical Planning. We produced multiple planning documents, including those required by the Government Performance and Results Act (GPRA) (www.whitehouse.gov/omb/mgmt-gpra/gplaw2m) and the GPRA Modernization Act of 2010 (www.gpo.gov/fdsys/pkg/PLAW-111publ352/pdf/PLAW-111publ352.pdf). These laws mandate that Federal agencies develop strategic and annual performance plans to help improve service delivery and to meet program objectives. In FY 2012, we published our Agency Strategic Plan for FY 2013 - FY 2016 (www.socialsecurity.gov/asp/index.html).

SSA’S FY 2012 SUMMARY OF PERFORMANCE AND FINANCIAL INFORMATION 7
SUMMARY OF OUR FINANCIAL INFORMATION
We received an unqualified audit opinion on our FY 2012 financial statements from our auditors. Our financial statements combine the results from all of the programs we administer, which include the Old-Age and Survivors Insurance (OASI), Disability Insurance (DI), and the SSI programs. OASI and DI have separate funds, which are financed by payroll taxes, interest on investments, and income taxes on benefits. In calendar years 2011 and 2012, Payroll Tax Holiday legislation provided for general revenues from the United States Treasury to make up for reduced employee and self-employment payroll taxes. General revenues from the United States Treasury finance SSI. The following table presents key amounts from our basic financial statements for FY 2010 through FY 2012. Our financial statements, notes, and additional information appear in our full FY 2012 PAR, pages 109-162.
Table of Key Measures1 (Dollars in Billions)
2012 2011 2010 Net Position
(end of fiscal year) Total Assets $2,766.5 $2,702.3 $2,635.5 Less Total Liabilities $101.5 $96.6 $95.9 Net Position (assets net of liabilities) $2,665.0 $2,605.7 $2,539.6
Change in Net Position (end of fiscal year)
Net Costs $822.9 $782.7 $752.3 Total Financing Sources2 $882.2 $848.9 $833.0 Change in Net Position $59.3 $66.1 $80.8
Statement of Social Insurance Old-Age, Survivors and Disability Insurance
(calendar year basis)
Present value of future net cashflows for current and future participants over the next 75 years (open group measure), current year valuation
-$11,278 -$9,157 -$7,947
Present value of future net cashflows for current and future participants over the next 75 years (open group measure), prior year valuation
-$9,157 -$7,947 -$7,677
Change in present value -$2,121 -$1,211 -$270
1. Totals do not necessarily equal the sum of rounded components. 2. Total Financing Sources includes both the Total Financing Sources and Total Budgetary Financing Sources lines from the Statement of Changes in Net
Position.
Assets: Of our FY 2012 total assets identified in the Table of Key Measures above, $2,750.4 billion relates to earmarked funds for the OASI and DI programs, and approximately 98.3 percent are investments. Investments increased $64.5 billion over the previous year.
Liabilities: Liabilities grew in FY 2012 by $4.9 billion, primarily because of the growth in benefits due and payable, which is attributable to the 3.6 percent Cost of Living Adjustment provided to beneficiaries as of January 1, 2012. The majority of our liabilities (85.3 percent) consist of benefits that have accrued as of the end of the fiscal year but have not been paid.
Net Position: Our net position grew $59.3 billion in FY 2012 to $2,665.0 billion, which is attributable to financing sources in excess of our net cost. At this time, tax revenues, interest earned, and transfers related to Payroll Tax Holiday legislation continue to exceed benefit payments made to OASI and DI beneficiaries, keeping our programs solvent.
8 SSA’S FY 2012 SUMMARY OF PERFORMANCE AND FINANCIAL INFORMATION
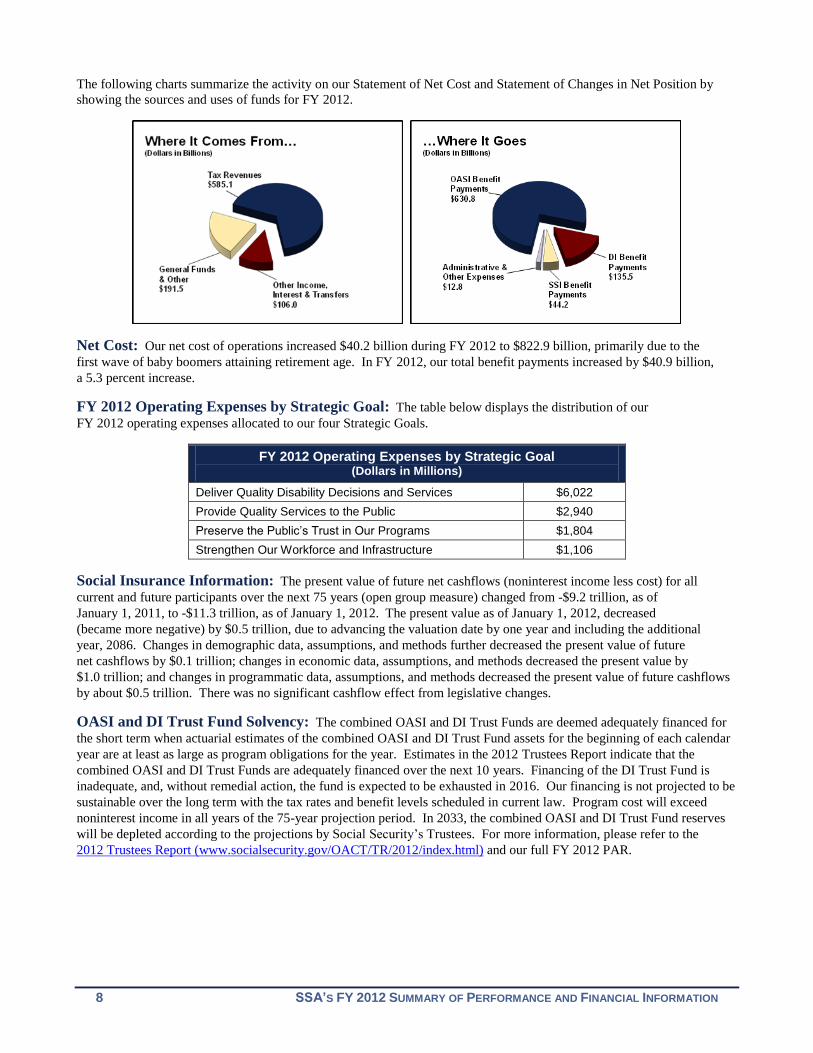
The following charts summarize the activity on our Statement of Net Cost and Statement of Changes in Net Position by showing the sources and uses of funds for FY 2012.
Net Cost: Our net cost of operations increased $40.2 billion during FY 2012 to $822.9 billion, primarily due to the first wave of baby boomers attaining retirement age. In FY 2012, our total benefit payments increased by $40.9 billion, a 5.3 percent increase.
FY 2012 Operating Expenses by Strategic Goal: The table below displays the distribution of our FY 2012 operating expenses allocated to our four Strategic Goals.
FY 2012 Operating Expenses by Strategic Goal (Dollars in Millions)
Deliver Quality Disability Decisions and Services $6,022 Provide Quality Services to the Public $2,940 Preserve the Public’s Trust in Our Programs $1,804 Strengthen Our Workforce and Infrastructure $1,106
Social Insurance Information: The present value of future net cashflows (noninterest income less cost) for all current and future participants over the next 75 years (open group measure) changed from -$9.2 trillion, as of January 1, 2011, to -$11.3 trillion, as of January 1, 2012. The present value as of January 1, 2012, decreased (became more negative) by $0.5 trillion, due to advancing the valuation date by one year and including the additional year, 2086. Changes in demographic data, assumptions, and methods further decreased the present value of future net cashflows by $0.1 trillion; changes in economic data, assumptions, and methods decreased the present value by $1.0 trillion; and changes in programmatic data, assumptions, and methods decreased the present value of future cashflows by about $0.5 trillion. There was no significant cashflow effect from legislative changes.
OASI and DI Trust Fund Solvency: The combined OASI and DI Trust Funds are deemed adequately financed for the short term when actuarial estimates of the combined OASI and DI Trust Fund assets for the beginning of each calendar year are at least as large as program obligations for the year. Estimates in the 2012 Trustees Report indicate that the combined OASI and DI Trust Funds are adequately financed over the next 10 years. Financing of the DI Trust Fund is inadequate, and, without remedial action, the fund is expected to be exhausted in 2016. Our financing is not projected to be sustainable over the long term with the tax rates and benefit levels scheduled in current law. Program cost will exceed noninterest income in all years of the 75-year projection period. In 2033, the combined OASI and DI Trust Fund reserves will be depleted according to the projections by Social Security’s Trustees. For more information, please refer to the 2012 Trustees Report (www.socialsecurity.gov/OACT/TR/2012/index.html) and our full FY 2012 PAR.

For more information:Office of Public InquiriesWindsor Park Building6401 Security Blvd.
Baltimore, Maryland 21235-6401
Contact us via e-mail:[email protected]

Social Security Administration | SSA Publication Number 31-251 | February 2013
S U M M A R Y O F P E R F O R M A N C EA N D F I N A N C I A L I N F O R M AT I O N
F I S C A L Y E A R 2 0 1 2
S O C I A L S E C U R I T Y A D M I N I S T R A T I O N