Summary of Consolidated Financial Results for the …...2018/10/30 · Summary of Consolidated...
20
Summary of Consolidated Financial Results for the Second Quarter of the Fiscal Year Ending March 31, 2019 (U.S. GAAP) October 30, 2018 OMRON Corporation (6645) Exchanges Listed: Tokyo (first section) URL: http://www.omron.com Representative: Yoshihito Yamada, President and CEO Contact: Takayoshi Oue, Executive Officer, Senior General Manager, Global Finance and Accounting HQ Telephone: +81-75-344-7070 Filing of Quarterly Securities Report (Shihanki hokokusho ) (scheduled): Start of Distribution of Dividends (scheduled): Preparation of Supplementary Materials for the Quarterly Financial Results: Holding of Presentation of Quarterly Financial Results: Note: Figures are rounded to the nearest million yen. 1. Consolidated Financial Results for the Second Quarter of the Fiscal Year Ending March 31, 2019 (April 1, 2018 – September 30, 2018) (1) Sales and Income (cumulative) (Percentages represent changes compared with the same period of the previous fiscal year.) Net sales Operating income Income before income taxes Net income attributable to shareholders Notes: 1. Comprehensive income: Six months ended September 30, 2018: JPY30,070 million ( -31.3% change); Six months ended September 30, 2017: JPY43,760 million ( ― % change) 2. Consolidated statements of operations for six months ended September 30, 2017 have been reclassified. For more, see 2. Quarterly Consolidated Financial Statements and Notes (4) Notes Regarding Consolidated Financial Statements (Changes in Accounting Policy) on P.12. (2) Consolidated Financial Position Total assets Net assets Shareholders’ equity Shareholders’ equity ratio (%) November 14, 2018 Yes Yes (for investors) Note: This document has been translated from the Japanese original as a guide to non-Japanese investors and contains forward-looking statements that are based on managements’ estimates, assumptions and projections at the time of publication. A number of factors could cause actual results to differ materially from expectations. Millions of yen - except per share data and percentages Six months ended Six months ended September 30, 2018 36,564 September 30, 2017 416,179 410,527 Change (%) 35,995 26,415 Change (%) +10.5 +1.4 Net income per share attributable to shareholders, basic (JPY) Net income per share attributable to shareholders, diluted (JPY) (16.0) (12.3) (12.8) +65.0 43,526 +91.2 141.92 — +73.6 740,484 744,952 519,385 507,386 517,387 505,530 As of September 30, 2018 As of March 31, 2018 Millions of yen - except per share data and percentages December 4, 2018 69.9 67.9 41,042 30,304 125.95 —
Transcript of Summary of Consolidated Financial Results for the …...2018/10/30 · Summary of Consolidated...

Summary of Consolidated Financial Results for the Second Quarter of the Fiscal Year Ending March 31,
2019 (U.S. GAAP)
October 30, 2018
OMRON Corporation (6645)
Exchanges Listed: Tokyo (first section)
URL: http://www.omron.com
Representative: Yoshihito Yamada, President and CEO
Contact: Takayoshi Oue, Executive Officer, Senior General Manager,
Global Finance and Accounting HQ
Telephone: +81-75-344-7070
Filing of Quarterly Securities Report (Shihanki
hokokusho ) (scheduled):
Start of Distribution of Dividends (scheduled):
Preparation of Supplementary Materials for the
Quarterly Financial Results:
Holding of Presentation of Quarterly Financial
Results:
Note: Figures are rounded to the nearest million yen.
1. Consolidated Financial Results for the Second Quarter of the Fiscal Year Ending March 31, 2019
(April 1, 2018 – September 30, 2018)
(1) Sales and Income (cumulative)
(Percentages represent changes compared with the same period of the previous fiscal year.)
Net sales
Operating income
Income before income taxes
Net income attributable to shareholders
Notes: 1. Comprehensive income: Six months ended September 30, 2018: JPY30,070 million ( -31.3% change);
Six months ended September 30, 2017: JPY43,760 million ( ― % change)
2. Consolidated statements of operations for six months ended September 30, 2017 have been reclassified. For more, see
2. Quarterly Consolidated Financial Statements and Notes (4) Notes Regarding Consolidated Financial Statements
(Changes in Accounting Policy) on P.12.
(2) Consolidated Financial Position
Total assets
Net assets
Shareholders’ equity
Shareholders’ equity ratio (%)
November 14, 2018
Yes
Yes (for investors)
Note: This document has been translated from the Japanese original as a guide to non-Japanese investors and contains forward-looking
statements that are based on managements’ estimates, assumptions and projections at the time of publication. A number of factors could cause
actual results to differ materially from expectations.
Millions of yen - except per share data and percentages
Six months ended Six months ended
September 30, 2018
36,564
September 30, 2017
416,179 410,527
Change (%)
35,995
26,415
Change (%)
+10.5+1.4
Net income per share attributable to
shareholders, basic (JPY)
Net income per share attributable to
shareholders, diluted (JPY)
(16.0)
(12.3)
(12.8)
+65.043,526
+91.2
141.92
—
+73.6
740,484 744,952
519,385 507,386
517,387 505,530
As of September 30,
2018
As of March 31,
2018
Millions of yen - except per share data
and percentages
December 4, 2018
69.9 67.9
41,042
30,304
125.95
—

2. Dividends
1st quarter dividend (JPY)
Interim dividend (JPY)
3rd quarter dividend (JPY)
Year-end dividend (JPY)
Total dividends for the year (JPY)
Notes: Revisions since the most recently announced dividend forecast: Yes
For more, see Notice Regarding Fiscal 2018 Interim Dividend, Full-Year Total Dividend Frecast and Year-End Dividend
Forecast, published on October 30, 2018.
3. Projected Results for the Fiscal Year Ending March 31, 2019 (April 1, 2018 – March 31, 2019)
(Percentages represent changes compared with the previous fiscal year.)
Net sales
Operating income
Income before income taxes
Net income attributable to shareholders
Net income per share attributable to shareholders (JPY)
Note: Revisions since the most recently announced performance forecast: Yes
For more regarding revised consolidated earnings forecasts, see Notice Regarding Revisions to Full-Year Consolidated
Performance Forecast for Fiscal 2018, published on October 30, 2018. However, operating income figures in our
consolidated earnings forecast used for comparative purposes reflects the retrospective application of new accounting
policies and associated revisions.
Notes(1) Changes in significant subsidiaries during the period (changes in specified subsidiaries due to changes in the scope
of consolidation): No
New: – companies ( – ) Excluded: – companies ( – )
(2) Application of simplified accounting methods and/or special accounting methods: No
(3) Changes in accounting policy
(a) Changes in accounting policy accompanying revision of accounting standards, etc.: Yes
(b) Changes in accounting policy other than (a) above: No
Note: For more, see 2. Quarterly Consolidated Financial Statements and Notes (4) Notes Regarding Consolidated
Financial Statements (Change in Accounting Policy) on P.12.
(4) Number of shares issued and outstanding (common stock)
(a) Number of shares at end of period (including treasury stock):
September 30, 2018: shares
March 31, 2018: shares
(b) Treasury stock at end of period:
September 30, 2018: shares
March 31, 2018: shares
(c) Average number of shares during the period (cumulative quarterly period):
Six months ended September 30, 2018: shares
Six months ended September 30, 2017: shares
Note: As of the end of the six months of the fiscal year ending March 2019, 766,683 shares of
OMRON stock held for Board Incentive Plan and Employee Stock Ownership Plan are included in
period-end treasury stock. The average number of shares during the period includes treasury shares
deducted in the calculation of net income per share attributable to shareholders.
5,074,019
3,352,916
Year ended
March 31, 2018
Year ending
March 31, 2019
Year ending
March 31, 2019
(projected)
38.00
―
83,000
79,500
209,719,547
213,525,277
84.00
(4.6)
(7.4)58,500
279.46
―
76.00
42.00
880,000
Dividends
per share
―
38.00
Full year ending
March 31, 2019
42.00
―
213,958,172
213,958,172
Millions of yen
Change
(%)
+2.3
(3.8)

*Quarterly summaries of consolidated financial results are not subject to review by certified public
accountants or audit corporations.
Commentary Regarding Appropriate Use of Projections of Results and Other Matters
1.
2.
3.
Note: The following abbreviations of business segment names are used in the attached materials.
IAB: Industrial Automation Business
EMC: Electronic and Mechanical Components Business
AEC: Automotive Electronic Components Business
SSB: Social Systems, Solutions and Service Business
HCB: Healthcare Business Other: Environmental Solutions Business, Electronic Systems & Equipment Division,
Backlight (Businesses under direct control of Headquarters)
The Company applies the single step method for presentation of its Consolidated Financial Statements based on
U.S. GAAP. However, to facilitate comparison with other companies, operating income on the Consolidated
Income Statement is presented by subtracting selling, general and administrative expenses and research and
development expenses from gross profit.
The Company plans to hold a presentation for investors on Tuesday, October 30, 2018. The Company also plans
to post an overview and the (voice) content of its explanations, together with financial materials used at the
presentation, promptly on its website.
Projections of results and future developments are based on information available to the Company at the time of
writing, as well as certain assumptions judged by the Company to be reasonable. Various risks, uncertainties and
other factors could cause actual results to differ materially from these projections. For the assumptions that form
the basis of the projected results and appropriate use, see 1. Qualitative Information on Quarterly Financial
Results (3) Description of Information on Outlook, Including Consolidated Performance Forecast on P.5.

Table of Contents
1. Qualitative Information on Quarterly Financial Results ・・・・・・・・・・・・・・・・・・・・・・・・・・・・・・・・・・・・・・・・・・・・・・・・・・・・P.2
(1) Description of Results of Operations ・・・・・・・・・・・・・・・・・・・・・・・・・・・・・・・・・・・・・・・・・・・・・・・・P.2
(2) Description of Financial Condition ・・・・・・・・・・・・・・・・・・・・・・・・・・・・・・・・・・・・・・・・・・・・・・・・P.5
(3) Description of Information on Outlook, Including Consolidated
Performance Forecast ・・・・・・・・・・・・・・・・・・・・・・・・・・・・・・・・・・・・・・・・・・・・・・・・・・・・・・・・・・・・P.5
2. Quarterly Consolidated Financial Statements and Notes ・・・・・・・・・・・・・・・・・・・・・・・・・・・・・・・・・・・・・・・・・・・・・・・・・・・・・P.7
(1) Quarterly Consolidated Balance Sheets ・・・・・・・・・・・・・・・・・・・・・・・・・・・・・・・・・・・・・・・・・・・・・・・・・・・・P.7
(2) Quarterly Consolidated Statements of Operations and Quarterly
Consolidated Statements of Comprehensive Income ・・・・・・・・・・・・・・・・・・・・・P.9
(3) Consolidated Statements of Cash Flows ・・・・・・・・・・・・・・・・・・・・・・・・・・・・・・・・・・・・・・・・・・・P.11
(4) Notes Regarding Consolidated Financial Statements ・・・・・・・・・・・・・・・・・・・・・・・・・・・・・・・・・・・・P.12
(Notes Regarding Assumptions of Going Concern) ・・・・・・・・・・・・・・・・・・・・・・・・・・・・・・・・・・・・・・・・・・P.12
(Notes in the Event of Significant Changes in Shareholders’ Equity) ・・・・・・・・・・・・・・・・・・・・・・・P.12
(Changes in Accounting Policy) ・・・・・・・・・・・・・・・・・・・・・・・・・・・・・・・・・・・・・・・・・・・・・・・・・P.12
(Segment Information) ・・・・・・・・・・・・・・・・・・・・・・・・・・・・・・・・・・・・・・・・・・・・・・・・・・・・P.13
3. Supplementary Information ・・・・・・・・・・・・・・・・・・・・・・・・・・・・・・・・・・・・・・・・・・・・・・・・・・・・・・・・・・・・・・・・・・・・・・・・・・P.14
(1) Summary of Consolidated Financial Results (U.S. GAAP)・・・・・・・・・・・・・・・・・・・・・・・・・・・・・・・・・・・・・・・・・・・・・・・・・・・・・・・・・・・・・・・P.14
(2) Consolidated Net Sales by Business Segment ・・・・・・・・・・・・・・・・・・・・・・・・・・・・・・・・・・・・・・・・・・・・・・・・・・・・・・・P.15
(3) Consolidated Operating Income (Loss) by Business Segment ・・・・・・・・・・・・・・・・・・・・・・・・・・・・・・・・・・・・・・・・・・・・・・・P.16
(4) Average Currency Exchange Rate ・・・・・・・・・・・・・・・・・・・・・・・・・・・・・・・・・・・・・・・・・・・・・・・・・・P.16
(5) Projected Consolidated Net Sales by Business Segment ・・・・・・・・・・・・・・・・・・・・・・・・・・・・・・・・・・・・・・・・・・・・・・・・・・・・・・・P.17
(6) Projected Consolidated Operating Income (Loss) by Business Segment ・・・・・・・・・・・・・・・・・・・・・・・・・・・・・・・・・・・・・・・・・・・・・・・P.17
(7) Projected Average Currency Exchange Rate ・・・・・・・・・・・・・・・・・・・・・・・・・・・・・・・・・・・・・・・・・・・・・・・・・・P.17
1
2
1. Qualitative Information on Quarterly Financial Results
(1) Description of Results of Operations
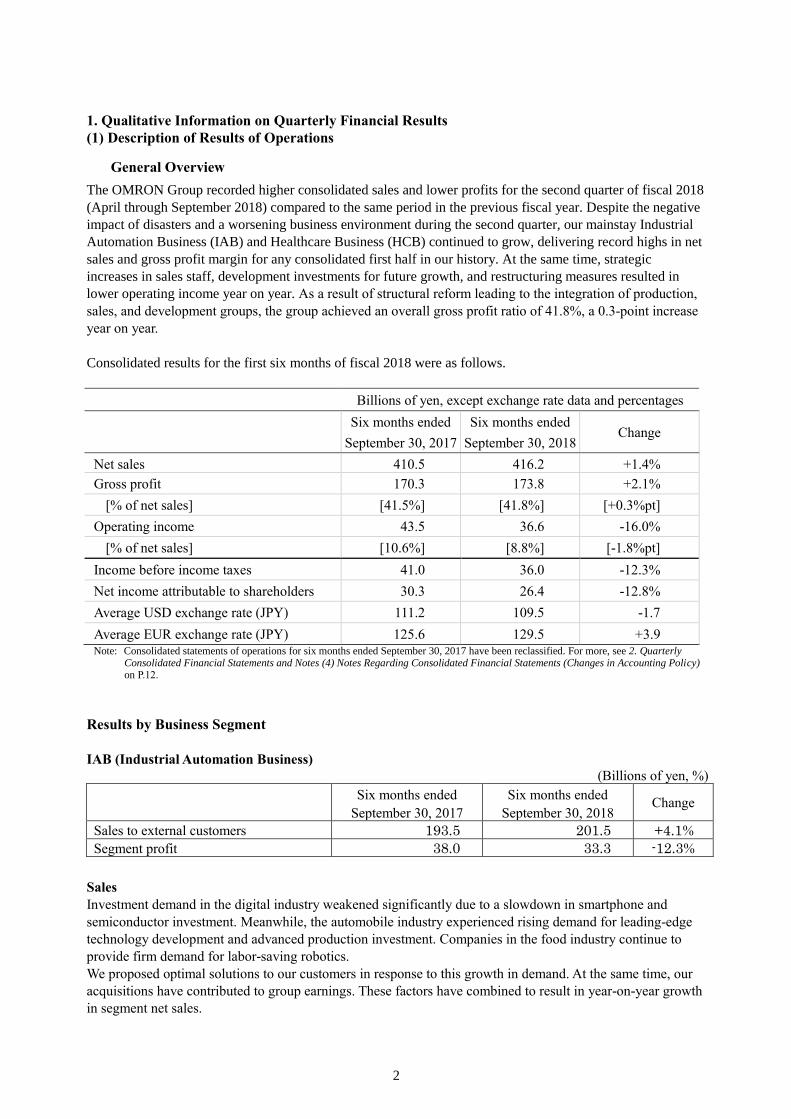
General Overview The OMRON Group recorded higher consolidated sales and lower profits for the second quarter of fiscal 2018
(April through September 2018) compared to the same period in the previous fiscal year. Despite the negative
impact of disasters and a worsening business environment during the second quarter, our mainstay Industrial
Automation Business (IAB) and Healthcare Business (HCB) continued to grow, delivering record highs in net
sales and gross profit margin for any consolidated first half in our history. At the same time, strategic
increases in sales staff, development investments for future growth, and restructuring measures resulted in
lower operating income year on year. As a result of structural reform leading to the integration of production,
sales, and development groups, the group achieved an overall gross profit ratio of 41.8%, a 0.3-point increase
year on year.
Consolidated results for the first six months of fiscal 2018 were as follows.
Billions of yen, except exchange rate data and percentages
Six months ended
September 30, 2017
Six months ended
September 30, 2018 Change
Net sales 410.5 416.2 +1.4%
Gross profit 170.3 173.8 +2.1%
[% of net sales] [41.5%] [41.8%] [+0.3%pt]
Operating income 43.5 36.6 -16.0%
[% of net sales] [10.6%] [8.8%] [-1.8%pt]
Income before income taxes 41.0 36.0 -12.3%
Net income attributable to shareholders 30.3 26.4 -12.8%
Average USD exchange rate (JPY) 111.2 109.5 -1.7
Average EUR exchange rate (JPY) 125.6 129.5 +3.9 Note: Consolidated statements of operations for six months ended September 30, 2017 have been reclassified. For more, see 2. Quarterly
Consolidated Financial Statements and Notes (4) Notes Regarding Consolidated Financial Statements (Changes in Accounting Policy) on P.12.
Results by Business Segment
IAB (Industrial Automation Business)
(Billions of yen, %)
Six months ended
September 30, 2017
Six months ended
September 30, 2018 Change
Sales to external customers 193.5 201.5 +4.1%
Segment profit 38.0 33.3 -12.3%
Sales
Investment demand in the digital industry weakened significantly due to a slowdown in smartphone and
semiconductor investment. Meanwhile, the automobile industry experienced rising demand for leading-edge
technology development and advanced production investment. Companies in the food industry continue to
provide firm demand for labor-saving robotics.
We proposed optimal solutions to our customers in response to this growth in demand. At the same time, our
acquisitions have contributed to group earnings. These factors have combined to result in year-on-year growth
in segment net sales.

3
Segment Profit
Segment profit was significantly lower year on year due to expanded investments in sales staff, research and
development, and other tactics for growth.
EMC (Electronic and Mechanical Components Business)
(Billions of yen, %)
Six months ended
September 30, 2017
Six months ended
September 30, 2018 Change
Sales to external customers 52.8 51.3 -2.8%
Segment profit 7.3 4.6 -37.9% Note: OMRON revised business classifications, reclassifying certain operations under Other Businesses to the EMC and other segments
beginning with the fiscal year ending March 31, 2019. The group reclassified results for the fiscal year ended March 2018 under this new categorization for presentation herein.
Sales
Demand was strong for consumer and commercial products in the Americas and Europe, while Japan
experienced firm demand in the automotive-related industries. However, the contraction in amusement
industry demand in Japan caused a significant decline in sales.
As a result of these changes in demand, sales were lower year on year.
Segment Profit
Segment profit was significantly lower year on year due to lower sales combined with investments in
production capacity looking ahead to future growth.
AEC (Automotive Electronic Components Business)
(Billions of yen, %)
Six months ended
September 30, 2017
Six months ended
September 30, 2018 Change
Sales to external customers 64.1 65.0 +1.3%
Segment profit 2.6 3.2 +21.6%
Sales
Changes in vehicle models carrying OMRON products and other factors resulted in weak demand in Japan,
the Americas, Europe, and China. On the other hand, demand in Asia was strong, supported by increasing
automobile production and rising needs for motorcycle-related products.
As a result of these changes in demand, sales were higher year on year.
Segment Profit
The AEC reported significantly higher profit due to sales growth and improved productivity in manufacturing
and development activities.
SSB (Social Systems, Solutions and Service Business)
(Billions of yen, %)
Six months ended
September 30, 2017
Six months ended
September 30, 2018 Change
Sales to external customers 19.5 20.6 +5.6%
Segment profit (loss) (2.8) (2.5) —
Sales
The segment experienced firm demand for upgrades in our Public Transportation Business and Road
Management Systems Business. In response, we proposed solutions tailored to the needs of our clients.
As a result of these factors and activities, sales increased year on year.
Segment Profit

4
The SSB segment reported narrower losses year on year, which was the result of higher sales and improved
productivity.
HCB (Healthcare Business)
(Billions of yen, %)
Six months ended
September 30, 2017
Six months ended
September 30, 2018 Change
Sales to external customers 51.1 55.5 +8.5%
Segment profit 6.2 7.2 +16.1%
Sales
The HCB segment experienced strong sales, mainly due to our stepped-up promotions through online channels
in China, Japan, and the Americas. These markets and others across the globe have shown firm demand for
our blood pressure monitors. The United States, in particular, showed growth in demand for blood pressure
monitors in response to last year’s revisions to hypertension treatment guidelines.
As a result of these and other factors, segment sales rose year on year.
Segment Profit
Although the segment incurred higher research and development expenses for future growth, segment profit
grew year on year, mainly due to higher sales and productivity improvements.
Other Businesses
(Billions of yen, %)
Six months ended
September 30, 2017
Six months ended
September 30, 2018 Change
Sales to external customers 26.5 20.0 -24.7%
Segment profit (loss) 0.4 (1.2) — Notes: 1. The Other segment includes new exploratory or incubation businesses as well as businesses being nurtured under the direct control
of Headquarters. 2. OMRON revised business classifications, reclassifying certain operations under the Other Businesses segment to the EMC and
other segments beginning with the fiscal year ending March 31, 2019. The group reclassified results for the fiscal year ended March 2018 under this new categorization for presentation herein.
Sales
Business partners in our Environmental Solutions Business experienced a temporary downturn in performance
due to the heavy rains in July 2018. This was a major factor behind the weak revenue performance for the
business during the period. Meanwhile, our uninterruptible power supply business and contract development
and production services for electronic devices within the Electric Systems and Equipment Business reported
sales level with same period in the prior fiscal year. The OMRON Backlights Business saw weak sales, due to
further business optimization initiatives.
As a result, Other Businesses sales fell sharply compared to the same period in the prior fiscal year.
Segment Profit
Lower sales and restructuring costs drove segment profits lower year on year.

5
(2) Description of Financial Condition
Financial Condition Under VG2.0, we intend to continue to conduct ROIC management focused on capital efficiency, while
investing actively in sustainable corporate value improvements.
Total assets as of the end of the consolidated second quarter decreased JPY4.5 billion compared with the end
of the previous fiscal year to JPY740.5 billion. This result was mainly due an increase in inventories (to secure
components and materials), a decrease in notes and accounts receivable–trade stemming collections of
accounts from the prior consolidated fiscal year, and a decrease in cash and cash equivalents. Total liabilities
decreased JPY16.5 billion compared with the end of the previous fiscal year, down to JPY221.1 billion,
mainly due to decreases in notes and accounts payable–trade and accrued expenses. Net assets increased
JPY12.0 billion compared to the end of the previous fiscal year to JPY519.4 billion, owing to increases in net
income attributable to shareholders, share buybacks, and other factors. As a result, OMRON Group
shareholders’ equity ratio was 69.9%, as compared to 67.9% at the end of the previous fiscal year. We
continue to maintain a strong financial footing capable of active investment and response to changes in our
operating environment.
Summary of Cash Flows The following summarizes cash flow activity for the cumulative consolidated second quarter.
Cash Flows from Operating Activities
Net cash provided by operating activities was JPY25.4 billion, a decrease of JPY7.1 billion in net cash
provided over the same period in the previous fiscal year. This result was mainly due to the recording of net
income and depreciation and amortization, as well as a decrease in notes and accounts receivable–trade. These
decreases were offset in part by a decrease in and notes and accounts payable–trade.
Cash Flows from Investing Activities
Net cash used in investing activities was JPY17.2 billion, representing an increase in net cash used of JPY1.1
billion compared to the same period in the previous fiscal year. This increase was mainly due to investment
outlays to expand our production capacity and to prepare for future growth.
Free cash flows (difference between cash flows from operating activities and cash flows from investing
activities) for the cumulative consolidated second quarter amounted to JPY8.2 billion.
Cash Flows from Financing Activities
Net cash used in financing activities was JPY17.5 billion, which was an increase in net cash used of JPY4.3
billion compared to the same period in the previous fiscal year. This result was mainly due to dividends paid
and stock buybacks.
As a result, the balance of cash and cash equivalents at the end of the consolidated second quarter amounted to
JPY103.4 billion, a decrease of JPY9.6 billion compared to the end of the previous consolidated fiscal year.
(3) Description of Information on Outlook, Including Consolidated Performance Forecast
We expect the business environment will continue to be uncertain throughout the third quarter and beyond due
to U.S.-China trade frictions and other factors, having a negative impact on sales performance. Accordingly,
we have made a downward revision in our fiscal 2018 earnings forecasts as outlined below. The OMRON
Group set our exchange rate assumptions for the third quarter and beyond to USD1 = JPY110 and EUR1 =
JPY127.
Performance forecasts and other forward-looking statements are based on information available at the time, as
well as on certain assumptions deemed reasonable by OMRON Group management. Actual results may vary
materially depending on a variety of factors.

6
(Billions of yen / % / JPY)
Net sales Operating
income
Income before
income taxes
Net income
attributable to
shareholders
Net income per
share attributable to
shareholders (JPY)
Previous forecast (A) 900.0 93.0 88.0 64.5 306.26
New forecast (B) 880.0 83.0 79.5 58.5 279.46
Change (B-A) (20.0) (10.0) (8.5) (6.0) -
Change (%) -2.2% -10.8% -9.7% -9.3% -
(Reference)
Actual results for the
previous fiscal year 860.0 86.3 83.4 63.2 296.85
(ended March 31, 2018)
Note: Prior-year operating income reflects the retrospective application of new accounting policies and associated revisions.
2.Quarterly Consolidated Financial Statements and Notes
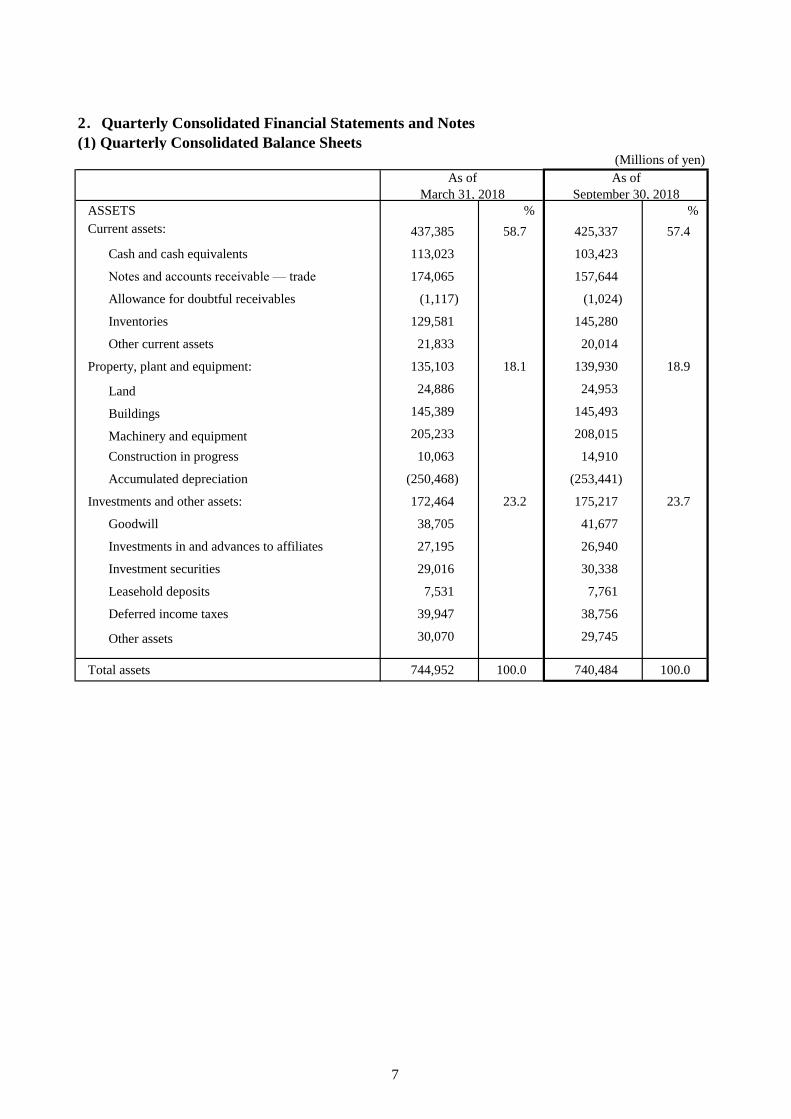
(1) Quarterly Consolidated Balance Sheets(Millions of yen)
As of As of
March 31, 2018 September 30, 2018
ASSETS % %
Current assets: 437,385 58.7 425,337 57.4
Cash and cash equivalents 113,023 103,423
Notes and accounts receivable — trade 174,065 157,644
Allowance for doubtful receivables (1,117) (1,024)
Inventories 129,581 145,280
Other current assets 21,833 20,014
Property, plant and equipment: 135,103 18.1 139,930 18.9
Land 24,886 24,953
Buildings 145,389 145,493
Machinery and equipment 205,233 208,015
Construction in progress 10,063 14,910
Accumulated depreciation (250,468) (253,441)
Investments and other assets: 172,464 23.2 175,217 23.7
Goodwill 38,705 41,677
Investments in and advances to affiliates 27,195 26,940
Investment securities 29,016 30,338
Leasehold deposits 7,531 7,761
Deferred income taxes 39,947 38,756
Other assets 30,070 29,745
Total assets 744,952 100.0 740,484 100.0
7

(Millions of yen)
As of As of
March 31, 2018 September 30, 2018
LIABILITIES % %
182,778 24.5 166,336 22.5
93,792 88,216
44,291 40,612
6,414 372
38,281 37,136
706 0.1 498 0.1
42,342 5.7 42,685 5.8
11,740 1.6 11,580 1.5
Total liabilities 237,566 31.9 221,099 29.9
NET ASSETS
505,530 67.9 517,387 69.9
64,100 8.6 64,100 8.7
99,588 13.4 99,901 13.5
19,940 2.7 20,917 2.7
390,950 52.4 415,265 56.1
Accumulated other comprehensive income (loss) (49,359) (6.6) (53,598) (7.2)
Foreign currency translation adjustments (3,176) (869)
Pension liability adjustments (53,785) (52,251)
7,426 ―
176 (478)
(19,689) (2.6) (29,198) (3.9)
1,856 0.2 1,998 0.2
Total net assets 507,386 68.1 519,385 70.1
Total liabilities and shareholders’ equity 744,952 100.0 740,484 100.0
Treasury stock
Common stock
Capital surplus
Legal reserve
Retained earnings
Shareholders’ equity
Unrealized gains (losses) on
available-for-sale securities
Net gains (losses) on derivative
instruments
Current liabilities
Income taxes payable
Noncontrolling interests
Other current liabilities
Termination and retirement benefits
Other long-term liabilities
Notes and accounts payable — trade
Accrued expenses
Deferred income taxes
8

(Quarterly Consolidated Statements of Operations)
(Six months ended September 30, 2018)
(Millions of yen)
Six months ended Six months ended
September 30, 2017 September 30, 2018
% %
Net sales 410,527 100.0 416,179 100.0
Cost of sales 240,263 58.5 242,394 58.2
Gross profit 170,264 41.5 173,785 41.8
Selling, general and administrative expenses 99,342 24.2 107,758 25.9
Research and development expenses 27,396 6.7 29,463 7.1
Operating income 43,526 10.6 36,564 8.8
Other expenses, net 2,484 0.6 569 0.2
41,042 10.0 35,995 8.6
Income taxes 11,081 2.7 9,259 2.2
Equity in loss (earnings) of affiliates (547) (0.1) (126) (0.1)
Net income 30,508 7.4 26,862 6.5
204 0.0 447 0.2
30,304 7.4 26,415 6.3
Income before income taxes and equity in loss
(earnings) of affiliates
Net income attributable to noncontrolling
interests
(2) Quarterly Consolidated Statements of Operations and Quarterly Consolidated
Statements of Comprehensive Income
Net income attributable to OMRON
shareholders
Notes: Consolidated statements of operations for the six months ended September 30, 2017 have been reclassified.
For more, see 2. Quarterly Consolidated Financial Statements and Notes (4) Notes Regarding Consolidated Financial
Statements (Changes in Accounting Policy) on P.12.
営営科営営営経特特法税持当為小科営営営経特特法税持当為小投投投- -
9

(Quarterly Consolidated Statements of Comprehensive Income)
(Six months ended September 30, 2018)(Millions of yen)
Six months ended Six months ended
September 30, 2017 September 30, 2018
30,508 26,862
Other comprehensive income (loss), net of tax
Foreign currency translation adjustments 10,434 2,328
Pension liability adjustments 1,175 1,534
1,752 ―
Net gains (losses) on derivative instruments (109) (654)
13,252 3,208
43,760 30,070
(Breakdown)
237 468
43,523 29,602
Unrealized gains (losses) on available-for-sale
securities
Comprehensive income attributable to
noncontrolling interests
Comprehensive income attributable to
OMRON shareholders
Net income
Other comprehensive income (loss)
Comprehensive income
-△
10

(3) Consolidated Statements of Cash Flows
(Millions of yen)
Six months ended Six months ended
September 30, 2017 September 30, 2018
I. Operating Activities:
1. Net income 30,508 26,862
2.
(1) Depreciation and amortization 13,786 14,689
(2) Net loss (gain) on sales and disposals of property, plant and equipment 115 (93)
(3) Impairment of long-lived assets 28 59
(4) Loss (gain) on sale of business 14 (75)
(5) Net gain on valuation of investment securities - (1,081)
(6) Termination and retirement benefits 1,663 2,630
(7) Deferred income taxes (1,670) 207
(8) Equity in loss (earnings) of affiliates (547) (126)
(9) Changes in assets and liabilities:
(i) Decrease in notes and accounts receivable — trade 12,630 18,169
(ii) Increase in inventories (15,182) (15,032)
(iii) Decrease (increase) in other assets (4,867) (593)
(iv) Decrease in notes and accounts payable — trade (920) (7,029)
(v) Decrease in income taxes payable (208) (6,068)
(vi) Decrease in accrued expenses and other current liabilities (2,059) (7,666)
(10) Other, net (770) 521
Subtotal 2,013 (1,488)
Net cash provided by operating activities 32,521 25,374
II. Investing Activities:
1. Proceeds from sale of investment securities 649 426
2. Purchase of investment securities (348) (248)
3. Capital expenditures (13,277) (18,223)
4. Net increase in leasehold deposits (291) (217)
5. Proceeds from sale of property, plant and equipment 221 1,494
6. Proceeds from sale of business, net of cash paid (427) 35
7. Acquisition of business, net of cash acquired (2,641) (863)
8. Other, net 46 408
Net cash used in investing activities (16,068) (17,188)
III. Financing Activities:
1. Net borrowings (repayments) of short-term debt 639 353
2. Dividends paid by the Company (7,269) (8,003)
3. Dividends paid to noncontrolling interests (138) (326)
4. Acquisition of treasury stock (6,530) (9,528)
5. Other, net 50 (21)
Net cash used in financing activities (13,248) (17,525)
IV. Effect of Exchange Rate Changes on Cash and Cash Equivalents 1,598 (261)
Net Increase (Decrease) in Cash and Cash Equivalents 4,803 (9,600)
Cash and Cash Equivalents at Beginning of the Period 126,026 113,023
Cash and Cash Equivalents at End of the Period 130,829 103,423
Notes to cash flows from operating activities:
1. Interest paid 57 59
2. Taxes paid 12,855 15,094
Notes to investing and financing activities not involving cash flow:
1. Debt related to capital expenditures 986 2,567
Adjustments to reconcile net income to net cash provided by operating
activities:
11

(4) Notes Regarding Consolidated Financial Statements
(Notes Regarding Assumptions of Going Concern)
該当事項はありません。None applicable
該当事項はありません。None applicable
当期より財務会計基準審議会会計基準更新第2015-17「繰延税金の貸借対照表における分類」を適用しております。
Beginning with the first quarter of the current consolidated fiscal year, OMRON has adopted FASB Accounting
Standards Update 2016-01, Financial Instruments — Recognition and Measurement of Financial Assets and
Financial Liabilities and FASB Accounting Standards Update 2018-03, Financial Instruments — Recognition and
Measurement of Financial Assets and Financial Liabilities Technical Corrections and Improvements to Financial
Instruments. This accounting standards update requires OMRON to present classifications and measurements of
equity investments, as well as changes in the fair value of certain financial liabilities measured at fair value. Further,
this accounting standards update requires OMRON to revise presentation related to the fair values of certain financial
instruments. As a result of the impact of the application of this accounting standards update on available-for-sale
securities held by OMRON and OMRON subsidiaries, we have adjusted the cumulative impact on retained earnings as
of the beginning of the period in the amount of ¥7,426 million in unrealized profits after tax-effect accounting. This
amount was reported under accumulated other comprehensive income before this adjustment. Further, OMRON has
made an adjustment of ¥224 million in cumulative impact on retained earnings for non-marketable equity securities.
(Changes in Accounting Policy)
(Notes in the Event of Significant Changes in Shareholders’ Equity)
Beginning with the first quarter of the current consolidated fiscal year, OMRON has adopted FASB Accounting
Standards Update 2014-09, Revenue from Contracts with Customers. This accounting standards update requires
OMRON to provide quantitative and qualitative disclosures for a better understanding of revenues, as well as the
nature of amount, timing, and uncertainties of cash flows, arising from contracts with customers. The cumulative
impact of the adoption of this accounting standards update on retained earnings at the beginning of the period is not
significant.
Beginning with the first quarter of the current consolidated fiscal year, OMRON has adopted FASB Accounting
Standards Update 2017-07, Compensation—Retirement Benefits: Improving the Presentation of Net Periodic Pension
Cost And Net Periodic Postretirement Benefit Cost. This accounting standards update requires OMRON to categorize
periodic pension costs and periodic postretirement benefit costs as service cost and components other than service
cost. Service cost must be reported in the same statement of operations line item as other employee compensation
costs. Components other than service cost must be categorized and presented separately from service cost. Only
service cost from periodic pension costs or periodic postretirement benefit costs may be capitalized and reported under
inventory. Under this accounting standards update, presentation of service costs and other elements must be applied on
a retrospective basis. Only costs allowed to be capitalized for the service cost component may be applied on a
prospective basis.OMRON began applying this standard in the first quarter of the current consolidated fiscal year
beginning April 1, 2018. The application of this accounting standards update classifying and presenting service cost
and other service cost components resulted in the reclassification of ¥64 million in cost of sales, ¥80 million in selling,
general and administrative expenses, and ¥29 million in research and development expenses. These amounts have been
reclassified to other expenses, net on the consolidated quarterly statements of income for the first six months of the
fiscal year ended March 2018. Gross profit and operating income for the first six months of the consolidated fiscal
year ended March 2018 increased ¥64 million and ¥173 million, respectively, when compared to amounts prior to this
reclassification. The application of rules that allow only the service cost component to be eligible for capitalization
does not have a significant impact on the operating results or financial condition of OMRON to OMRON subsidiaries.
12
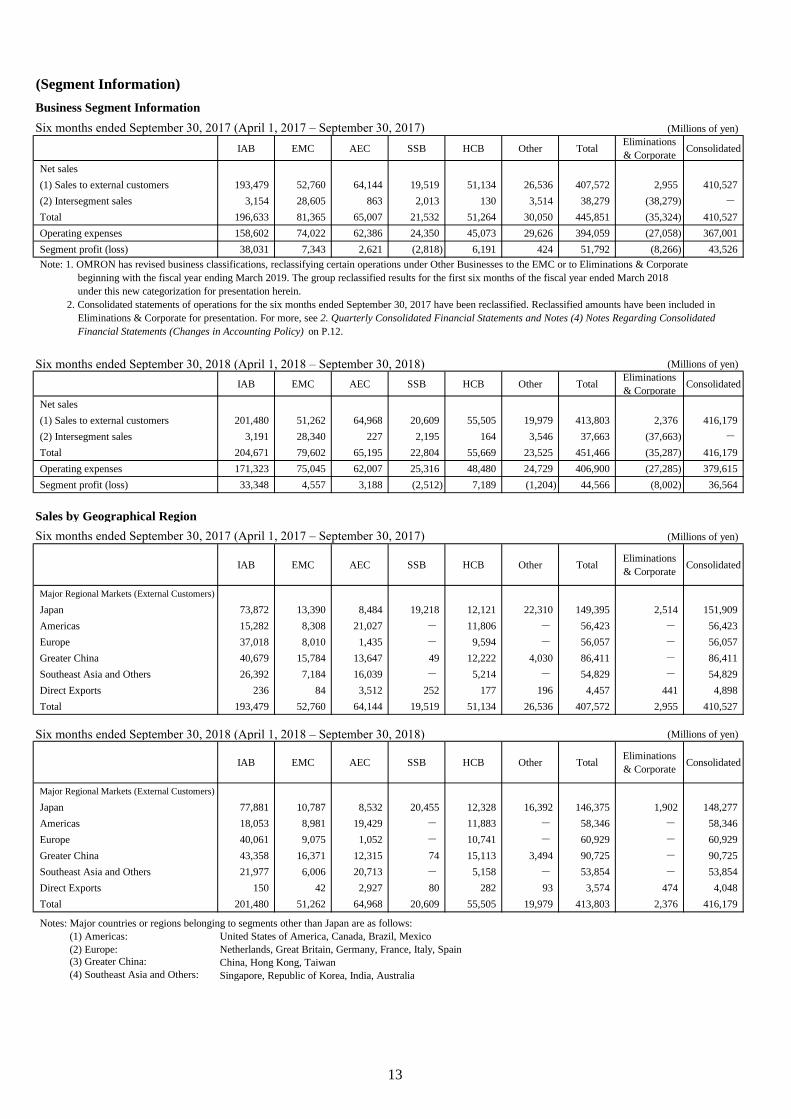
(Segment Information)
Business Segment Information
Six months ended September 30, 2017 (April 1, 2017 – September 30, 2017) (Millions of yen)
IAB EMC AEC SSB HCB Other TotalEliminations
& CorporateConsolidated
Net sales
(1) Sales to external customers 193,479 52,760 64,144 19,519 51,134 26,536 407,572 2,955 410,527
(2) Intersegment sales 3,154 28,605 863 2,013 130 3,514 38,279 (38,279) -
Total 196,633 81,365 65,007 21,532 51,264 30,050 445,851 (35,324) 410,527
Operating expenses 158,602 74,022 62,386 24,350 45,073 29,626 394,059 (27,058) 367,001
Segment profit (loss) 38,031 7,343 2,621 (2,818) 6,191 424 51,792 (8,266) 43,526
Six months ended September 30, 2018 (April 1, 2018 – September 30, 2018) (Millions of yen)
IAB EMC AEC SSB HCB Other TotalEliminations
& CorporateConsolidated
Net sales
(1) Sales to external customers 201,480 51,262 64,968 20,609 55,505 19,979 413,803 2,376 416,179
(2) Intersegment sales 3,191 28,340 227 2,195 164 3,546 37,663 (37,663) -
Total 204,671 79,602 65,195 22,804 55,669 23,525 451,466 (35,287) 416,179
Operating expenses 171,323 75,045 62,007 25,316 48,480 24,729 406,900 (27,285) 379,615
Segment profit (loss) 33,348 4,557 3,188 (2,512) 7,189 (1,204) 44,566 (8,002) 36,564
Sales by Geographical Region
Six months ended September 30, 2017 (April 1, 2017 – September 30, 2017) (Millions of yen)
IAB EMC AEC SSB HCB Other TotalEliminations
& CorporateConsolidated
Major Regional Markets (External Customers)
Japan 73,872 13,390 8,484 19,218 12,121 22,310 149,395 2,514 151,909
Americas 15,282 8,308 21,027 - 11,806 - 56,423 - 56,423
Europe 37,018 8,010 1,435 - 9,594 - 56,057 - 56,057
Greater China 40,679 15,784 13,647 49 12,222 4,030 86,411 - 86,411
Southeast Asia and Others 26,392 7,184 16,039 - 5,214 - 54,829 - 54,829
Direct Exports 236 84 3,512 252 177 196 4,457 441 4,898
Total 193,479 52,760 64,144 19,519 51,134 26,536 407,572 2,955 410,527
Six months ended September 30, 2018 (April 1, 2018 – September 30, 2018) (Millions of yen)
IAB EMC AEC SSB HCB Other TotalEliminations
& CorporateConsolidated
Major Regional Markets (External Customers)
Japan 77,881 10,787 8,532 20,455 12,328 16,392 146,375 1,902 148,277
Americas 18,053 8,981 19,429 - 11,883 - 58,346 - 58,346
Europe 40,061 9,075 1,052 - 10,741 - 60,929 - 60,929
Greater China 43,358 16,371 12,315 74 15,113 3,494 90,725 - 90,725
Southeast Asia and Others 21,977 6,006 20,713 - 5,158 - 53,854 - 53,854
Direct Exports 150 42 2,927 80 282 93 3,574 474 4,048
Total 201,480 51,262 64,968 20,609 55,505 19,979 413,803 2,376 416,179
Notes: Major countries or regions belonging to segments other than Japan are as follows:
(1) Americas: United States of America, Canada, Brazil, Mexico
(2) Europe: Netherlands, Great Britain, Germany, France, Italy, Spain
(3) Greater China: China, Hong Kong, Taiwan
(4) Southeast Asia and Others: Singapore, Republic of Korea, India, Australia
Note: 1. OMRON has revised business classifications, reclassifying certain operations under Other Businesses to the EMC or to Eliminations & Corporate
beginning with the fiscal year ending March 2019. The group reclassified results for the first six months of the fiscal year ended March 2018
under this new categorization for presentation herein.
2. Consolidated statements of operations for the six months ended September 30, 2017 have been reclassified. Reclassified amounts have been included in
Eliminations & Corporate for presentation. For more, see 2. Quarterly Consolidated Financial Statements and Notes (4) Notes Regarding Consolidated
Financial Statements (Changes in Accounting Policy) on P.12.
13

3. Supplementary Information
(1) Summary of Consolidated Financial Results (U.S. GAAP)
(Millions of yen, %)
Six months ended
September 30,
2017
Six months ended
September 30,
2018
Year-on-
year change
Year ended
March 31, 2018
Year ending
March 31, 2019
(projected)
Year-on-
year change
Net sales 410,527 416,179 +1.4% 859,982 880,000 +2.3%
Operating income 43,526 36,564 -16.0% 86,254 83,000 -3.8%
[% of net sales] [10.6%] [8.8%] [-1.8%pt] [10.0%] [9.4%] [-0.6%pt]
Income before income taxes 41,042 35,995 -12.3% 83,367 79,500 -4.6%
[% of net sales] [10.0%] [8.6%] [-1.3%pt] [9.7%] [9.0%] [-0.7%pt]
Net income attributable
to shareholders30,304 26,415 -12.8% 63,159 58,500 -7.4%
Net income per share attributable
to shareholders (basic) (¥) 141.92 125.95 -15.97 296.85 279.46 -17.39
Total assets 726,615 740,484 +1.9% 744,952
Shareholders’ equity 498,053 517,387 +3.9% 505,530
[Shareholders’ equity ratio (%)] [68.5%] [69.9%] [+1.3%pt] [67.9%]
Shareholders’ equity per share
(¥)2,342.46 2,476.91 +134.45 2,400.37
Net cash provided by operating
activities32,521 25,374 (7,147) 73,673
Net cash used in investing
activities(16,068) (17,188) (1,120) (55,842)
Net cash used in financing
activities(13,248) (17,525) (4,277) (33,082)
Cash and cash equivalents
at end of period130,829 103,423 (27,406) 113,023
Notes: 1. OMRON has 157 consolidated subsidiaries, with 17 companies accounted for by the equity method.
2. The consolidated statements of operations for the first six months and for the fiscal year ended March 2018 have been reclassified. For more,
see 2. Quarterly Consolidated Financial Statements and Notes (4) Notes Regarding Consolidated Financial Statements
(Changes in Accounting Policy) on P.12.
14

(2) Consolidated Net Sales by Business Segment
(Billions of yen)
Japan 73.9 77.9 +5.4%Americas 15.3 18.1 +18.1%Europe 37.0 40.1 +8.2%
IAB Greater China 40.7 43.4 +6.6%Southeast Asia and Others 26.4 22.0 -16.7%
Direct Exports 0.2 0.2 -36.4%Total 193.5 201.5 +4.1%Japan 13.4 10.8 -19.4%
Americas 8.3 9.0 +8.1%Europe 8.0 9.1 +13.3%
EMC Greater China 15.8 16.4 +3.7%Southeast Asia and Others 7.2 6.0 -16.4%
Direct Exports 0.1 0.0 -50.0%Total 52.8 51.3 -2.8%Japan 8.5 8.5 +0.6%
Americas 21.0 19.4 -7.6%Europe 1.4 1.1 -26.7%
AEC Greater China 13.6 12.3 -9.8%Southeast Asia and Others 16.0 20.7 +29.1%
Direct Exports 3.5 2.9 -16.7%Total 64.1 65.0 +1.3%Japan 19.2 20.5 +6.4%
Americas ― ― ―Europe ― ― ―
SSB Greater China 0.0 0.1 +51.0%Southeast Asia and Others ― ― ―
Direct Exports 0.3 0.1 -68.3%Total 19.5 20.6 +5.6%Japan 12.1 12.3 +1.7%
Americas 11.8 11.9 +0.7%Europe 9.6 10.7 +12.0%
HCB Greater China 12.2 15.1 +23.7%Southeast Asia and Others 5.2 5.2 -1.1%
Direct Exports 0.2 0.3 +59.3%Total 51.1 55.5 +8.5%Japan 22.3 16.4 -26.5%
Americas ― ― ―Europe ― ― ―
Other Greater China 4.0 3.5 -13.3%Southeast Asia and Others ― ― ―
Direct Exports 0.2 0.1 -52.6%Total 26.5 20.0 -24.7%Japan 2.5 1.9 -24.3%
Americas ― ― ―Europe ― ― ―
Greater China ― ― ―Southeast Asia and Others ― ― ―
Direct Exports 0.4 0.5 +7.5%Total 3.0 2.4 -19.6%Japan 151.9 148.3 -2.4%
Americas 56.4 58.3 +3.4%Europe 56.1 60.9 +8.7%
Greater China 86.4 90.7 +5.0%Southeast Asia and Others 54.8 53.9 -1.8%
Direct Exports 4.9 4.0 -17.4%Total 410.5 416.2 +1.4%
Six months ended
September 30, 2017
Six months ended
September 30, 2018
Year-on-year
change (%)
Note: OMRON has revised business classifications, reclassifying certain operations under Other Businesses to
the EMC or to Eliminations & Corporate beginning with the fiscal year ending March 2019. The group
reclassified results for the fiscal year ended March 2018 under this new categorization for presentation herein.
Eliminations
& Corporate
Total
15

(3) Consolidated Operating Income (Loss) by Business Segment
(Billions of yen)
38.0 33.3 -12.3%
7.3 4.6 -37.9%
2.6 3.2 +21.6%
(2.8) (2.5) ― 6.2 7.2 +16.1%
0.4 (1.2) ― (8.3) (8.0) ―
43.5 36.6 -16.0%
(4) Average Currency Exchange Rate(One unit of currency, in yen)
USD 111.2 109.5 -1.7EUR 125.6 129.5 +3.9
IAB
EMC
AEC
SSB
HCB
Other
Notes: 1. OMRON has revised business classifications, reclassifying certain operations under Other Businesses to the EMC
or to Eliminations & Corporate beginning with the fiscal year ending March 2019. The group reclassified results
for the fiscal year ended March 2018 under this new categorization for presentation herein.
2. Consolidated statements of operations for the six months ended September 30, 2017 have been reclassified. Reclassified
amounts have been included in Eliminations & Corporate for presentation. For more, see 2. Quarterly Consolidated
Financial Statements and Notes (4) Notes Regarding Consolidated Financial Statements
(Changes in Accounting Policy) on P.12.
Eliminations & Corporate
Total
Six months ended
September 30, 2017
Six months ended
September 30, 2018
Year-on-year
change
Six months ended
September 30, 2017
Six months ended
September 30, 2018
Year-on-year
change (%)
16
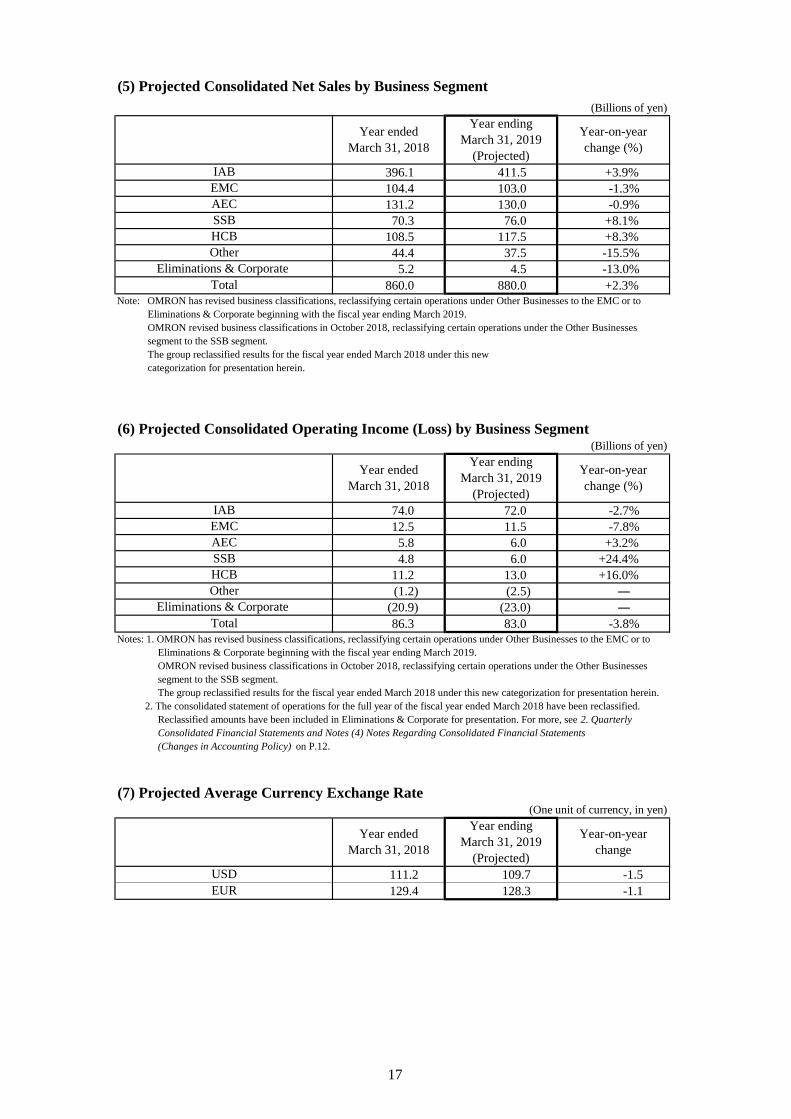
(5) Projected Consolidated Net Sales by Business Segment
(Billions of yen)
396.1 411.5 +3.9%
104.4 103.0 -1.3%
131.2 130.0 -0.9%
70.3 76.0 +8.1%
108.5 117.5 +8.3%
44.4 37.5 -15.5%
5.2 4.5 -13.0%
860.0 880.0 +2.3%
(6) Projected Consolidated Operating Income (Loss) by Business Segment(Billions of yen)
74.0 72.0 -2.7%
12.5 11.5 -7.8%
5.8 6.0 +3.2%
4.8 6.0 +24.4%
11.2 13.0 +16.0%
(1.2) (2.5) ―
(20.9) (23.0) ―
86.3 83.0 -3.8%
(7) Projected Average Currency Exchange Rate(One unit of currency, in yen)
111.2 109.7 -1.5
129.4 128.3 -1.1
USD
EUR
Note: OMRON has revised business classifications, reclassifying certain operations under Other Businesses to the EMC or to
Eliminations & Corporate beginning with the fiscal year ending March 2019.
OMRON revised business classifications in October 2018, reclassifying certain operations under the Other Businesses
segment to the SSB segment.
The group reclassified results for the fiscal year ended March 2018 under this new
categorization for presentation herein.
Year-on-year
change (%)
Year ended
March 31, 2018
Year ending
March 31, 2019
(Projected)
Year-on-year
change (%)
IAB
EMC
AEC
Year ended
March 31, 2018
Year ending
March 31, 2019
(Projected)
Year-on-year
change
Notes: 1. OMRON has revised business classifications, reclassifying certain operations under Other Businesses to the EMC or to
Eliminations & Corporate beginning with the fiscal year ending March 2019.
OMRON revised business classifications in October 2018, reclassifying certain operations under the Other Businesses
segment to the SSB segment.
The group reclassified results for the fiscal year ended March 2018 under this new categorization for presentation herein.
2. The consolidated statement of operations for the full year of the fiscal year ended March 2018 have been reclassified.
Reclassified amounts have been included in Eliminations & Corporate for presentation. For more, see 2. Quarterly
Consolidated Financial Statements and Notes (4) Notes Regarding Consolidated Financial Statements
(Changes in Accounting Policy) on P.12.
Other
Eliminations & Corporate
Total
IAB
EMC
AEC
SSB
HCB
SSB
HCB
Other
Eliminations & Corporate
Total
Year ending
March 31, 2019
(Projected)
Year ended
March 31, 2018
17