Summary Comparison 2000, 2003, 2007, 2010. Methodology Survey Year Type of Survey Number in Sample...
37
2010 ALCOHOL AND DRUG SURVEY Summary Comparison 2000, 2003, 2007, 2010
-
date post
19-Dec-2015 -
Category
Documents
-
view
214 -
download
0
Transcript of Summary Comparison 2000, 2003, 2007, 2010. Methodology Survey Year Type of Survey Number in Sample...

2010 ALCOHOL AND DRUG SURVEY
Summary Comparison 2000, 2003, 2007, 2010

MethodologySurvey Year
Type of Survey
Number in Sample
Number of Respon-dents & Response Rate - CSB
Number of Respon-dents & Response Rate - SJU
Overall Number of Respon-dents & Response Rate
2010 Web 3077 CSB 1200 SJU 1877
924 30%
471 25.1%453 37.8%
2007 Web 2800 CSB SJU
863 32.6%
337526
2003 Web 2790 CSB 982 SJU 1808
1192 43%
2000 Paper & pencil
1000 336 33.6%

DemographicsRespondent Breakdown bySurvey Year
by CSB/SJU
Primary Ethnic Origin
By Year in School
By On-Campus/Off-Campus
By Permanent Residence
2010 CSB 49%SJU 51%
White 91.8%Asia/PI 3.1%
First 23.6%Soph 27.3%Jun 23.0%Sen 26.1%
On 81.5%Off 17.7%
U.S. 96.6%Int 3.4%
2007 CSB 61%SJU 39%
White 91%Asia/PI 2.8%
First 26.5%Soph 29.9%Jun 20.4%Sen 23.2%
On 84.8%Off 15.2%
U.S. 97.1%Int 2.9%
2003 CSB 42.2%SJU 57.8%
White 93.7% First 25.8%Soph 24.7%Jun 23.0%Sen 26.3%
On 86.3%Off
U.S. 98.2%Int 1.8%
2000 CSB 56.8%SJU 43.2%
White 94.4% First 26.0%Soph 30.0%Jun 26.0%Sen 18.0%
On 82.5%Off

Alcohol Consumption Comparison
0.00%20.00%40.00%60.00%80.00%
100.00%
2000200320072010

Alcohol Use – Underage vs. Of Age
Underage - Annual
Of-Age Annual
30 days Underage Of-Age0.00%
10.00%
20.00%
30.00%
40.00%
50.00%
60.00%
70.00%
80.00%
90.00%
100.00%
2000200320072010

Alcohol Use by Gender
0%20%40%60%80%
100%
2000200320072010

By Gender cont.
0%
10%
20%
30%
40%
50%
60%
70%
80%
90%
100%
2000200320072010

Binge Drinking by Gender
Men - Reported binge drinking in last 2 weeks
Women - Reported binge drinking in last 2 weeks
0%
10%
20%
30%
40%
50%
60%
70%
80%
90%
100%
2000200320072010

Comparison in # of drinks
Avg. # of drinks per week Greatest # of drinks in last 2 weeks
0
1
2
3
4
5
6
7
8
9
10
2000200320072010
Avg. # Drinks by Gender
Men - Average # of drinks per week
Women - Average # of drinks per week
0
1
2
3
4
5
6
7
8
9
10
2000200320072010

Greatest Number of Drinks by Gender
Men - greatest number of drinks in last 2 weeks
Women - greatest number of drinks in last two weeks
0
1
2
3
4
5
6
7
8
9
10
2000200320072010

Average # of Drinks by Class
First years Sophomores Juniors Seniors0
1
2
3
4
5
6
7
8
9
10
2000200320072010

Avg. # of DrinksOf-Age vs. Under /On Campus vs. Off
Of age students
Underage Students
On-Campus Off-Campus0
2
4
6
8
10
12
14
2000200320072010

CSB/SJU vs. National - Annual Prevalence
2000 2003 2005 2006 2007 20100.00%
10.00%
20.00%
30.00%
40.00%
50.00%
60.00%
70.00%
80.00%
90.00%
100.00%
CSB/SJUNational

CSB/SJU vs. National – 30 day Prevalence
2000 2003 2005 2006 2007 20100.00%
10.00%
20.00%
30.00%
40.00%
50.00%
60.00%
70.00%
80.00%
90.00%
100.00%
CSB/SJUNational

CSB/SJU vs. National – Avg. # of Drinks per Week
2000 2003 2005 2006 2007 20100
1
2
3
4
5
6
7
8
9
10
CSB/SJUNational

2003 – CSB/SJU experienced a 2.53% increase from 2000
2003 – National data revealed an 11.1% increase
2005- National data revealed a 10.61% decrease from 2003
2006 – National data revealed a 6.71% decrease from 2005
2007 – CSB/SJU revealed a 13.48% decrease from 2003
2010 – CSB/SJU revealed a 6.87% decrease from 2007

First Years Sophomores Juniors Seniors0
1
2
3
4
5
6
7
8
9
10
2000 (CSB/SJU) 2000 National 2003 CSB/SJU 2003 National2005 National 2006 National 2007 CSB/SJU 2010 CSB/SJU

Grades and Alcohol Use
<2.0
2.0 - 2.49
2.5-2.99
3.0 - 3.49
3.5-4.41
0 2 4 6 8 10 12 14 16
2010200720032000
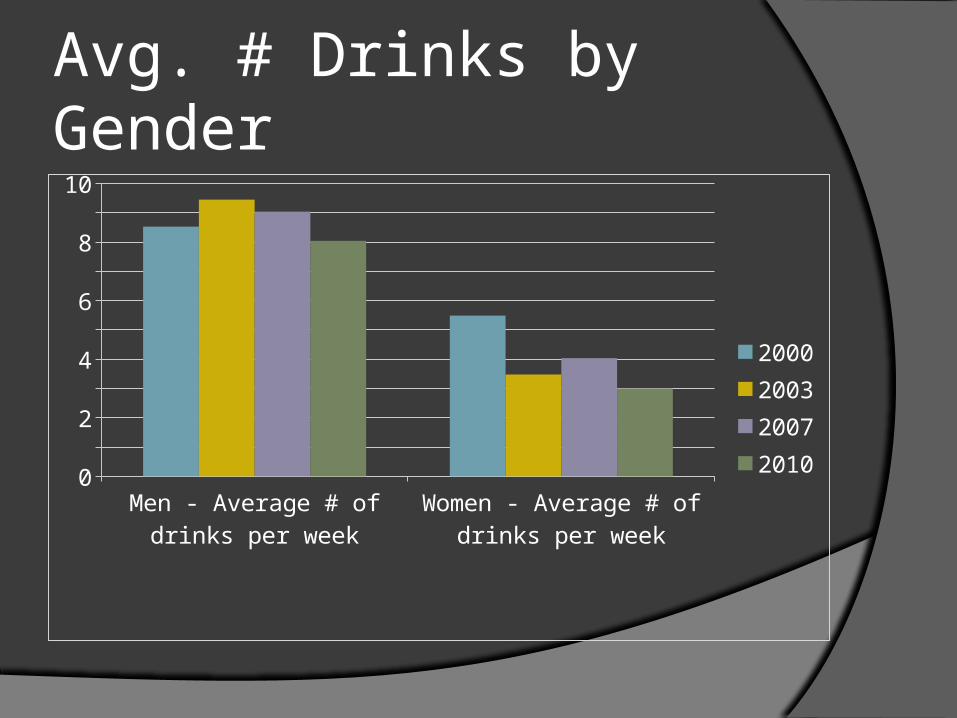
Campus Environment
0.00%20.00%40.00%60.00%80.00%
100.00%
2000200320072010

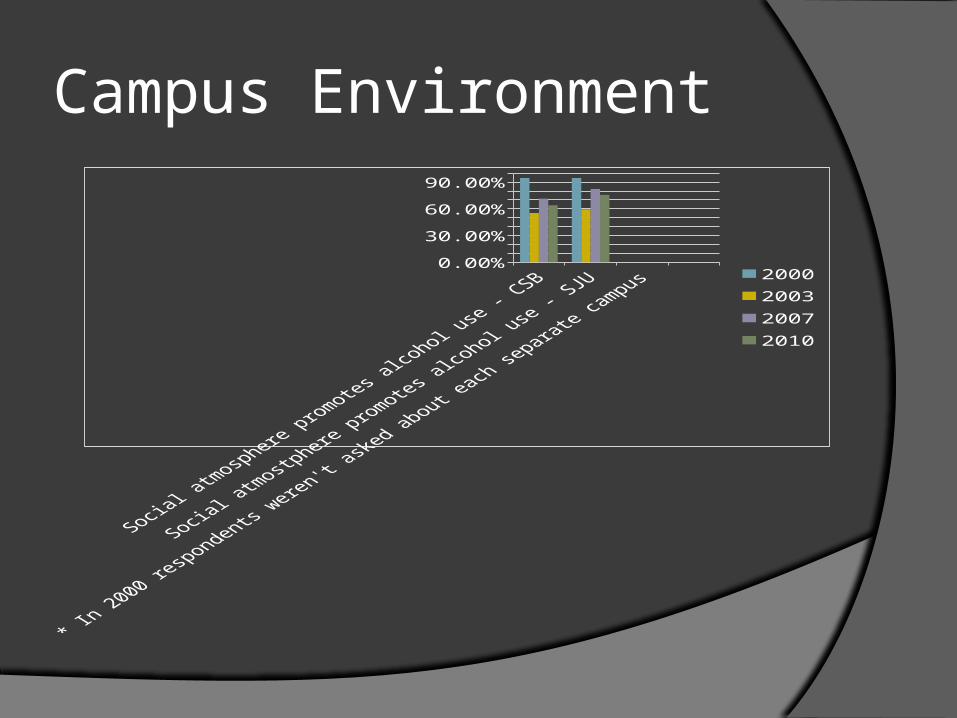
Consequences of Alcohol Use
0.00%20.00%40.00%60.00%80.00%
100.00%
2000200320072010
Consequences of Alcohol Use
0.00%20.00%40.00%60.00%80.00%
100.00%
2000200320072010
Axis Title

Negative Consequences due to Others’ Use
Cause
d m
e to
take
care
of a
frien
d
Didn't
inter
fere
with
my
life
Disrup
ted
my s
leep
mes
sed
up m
y livi
ng sp
ace
Inte
rrupt
ed S
tudy
ing
Enjoym
ent o
f eve
nts
was a
ffect
ed0.00%
20.00%40.00%60.00%80.00%
100.00%
2000200320072010
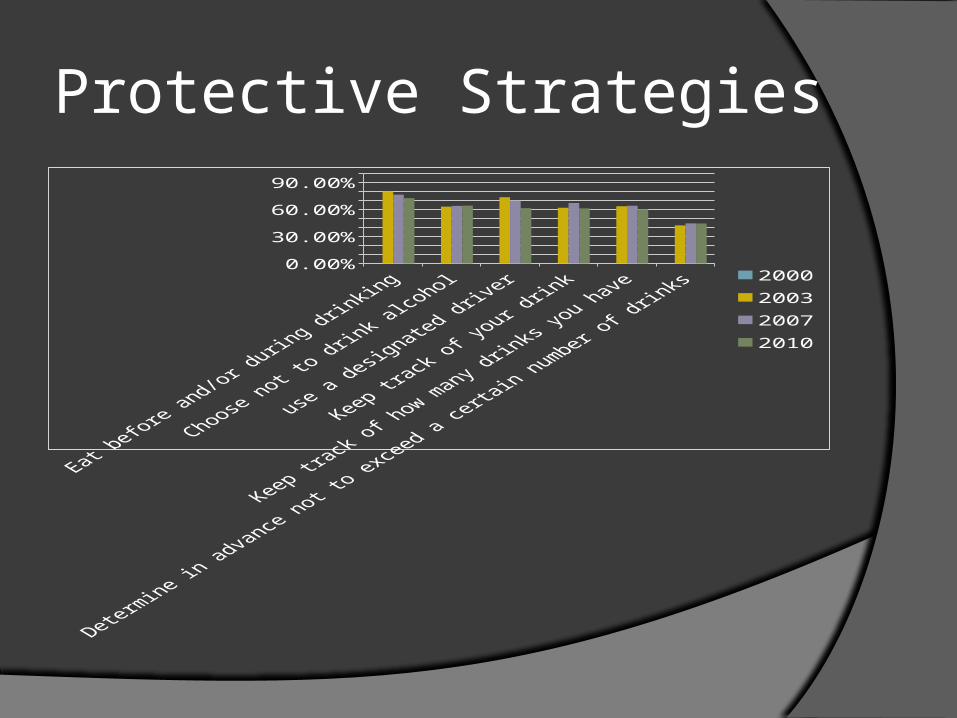
Protective Strategies
0.00%20.00%40.00%60.00%80.00%
100.00%
2000200320072010

Protective Strategies
0.00%20.00%40.00%60.00%80.00%
100.00%
2000200320072010

Consequences by Gender
0.00%20.00%40.00%60.00%80.00%
100.00%
2000200320072010

Consequences by Gender
Men
- m
issed
a cl
ass
Wom
en -
miss
ed a
clas
s
Men
- go
t in
argu
men
t or f
ight
Wom
en -
got i
n ar
gum
ent o
r figh
t0.00%
20.00%40.00%
60.00%80.00%
100.00%
2000200320072010

Consequences by Gender
0.00%20.00%40.00%60.00%80.00%
100.00%
2000200320072010

Alcohol Use Behavior
0.00%20.00%40.00%60.00%80.00%
100.00%
2000200320072010
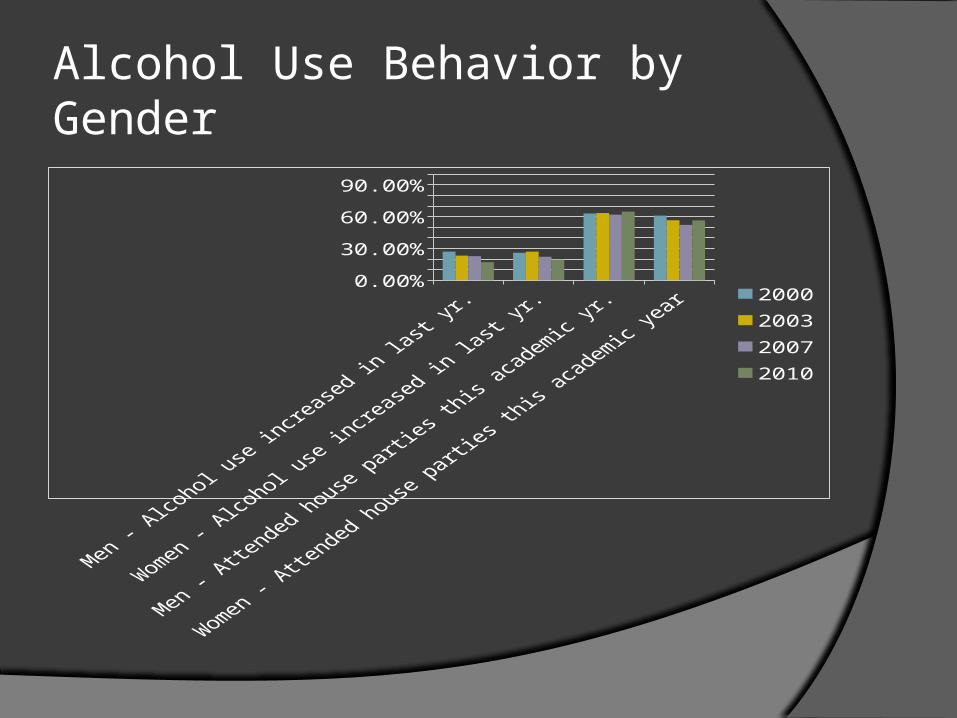
Alcohol Use Behavior by Gender
0.00%20.00%40.00%60.00%80.00%
100.00%
2000200320072010

Alcohol Use Behaviors by Gender
0.00%20.00%40.00%60.00%80.00%
100.00%
2000200320072010
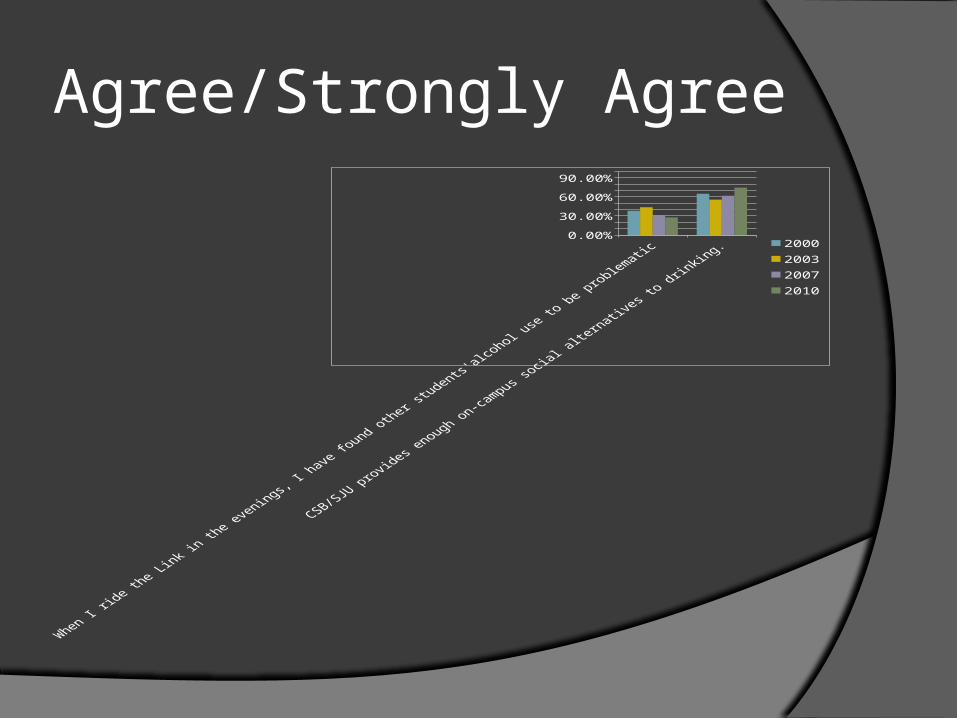
Agree/Strongly Agree
0.00%20.00%40.00%60.00%80.00%
100.00%
2000200320072010

Agree/Strongly Agree by Gender
0.00%
20.00%
40.00%
60.00%
80.00%
100.00%
2000200320072010

Marijuana Use Prevalence
0.00%20.00%40.00%60.00%80.00%
100.00%
2000200320072010

Marijuana Use Prevalence - SJU
Eve
r U
sed
Fir
st U
sed
in
Co
lleg
e/20
03
sin
ce t
uri
ng
18
Use
d i
n l
ast
year
Use
d i
n l
ast
30 d
ays0.00%
20.00%40.00%60.00%80.00%
100.00%
2000200320072010
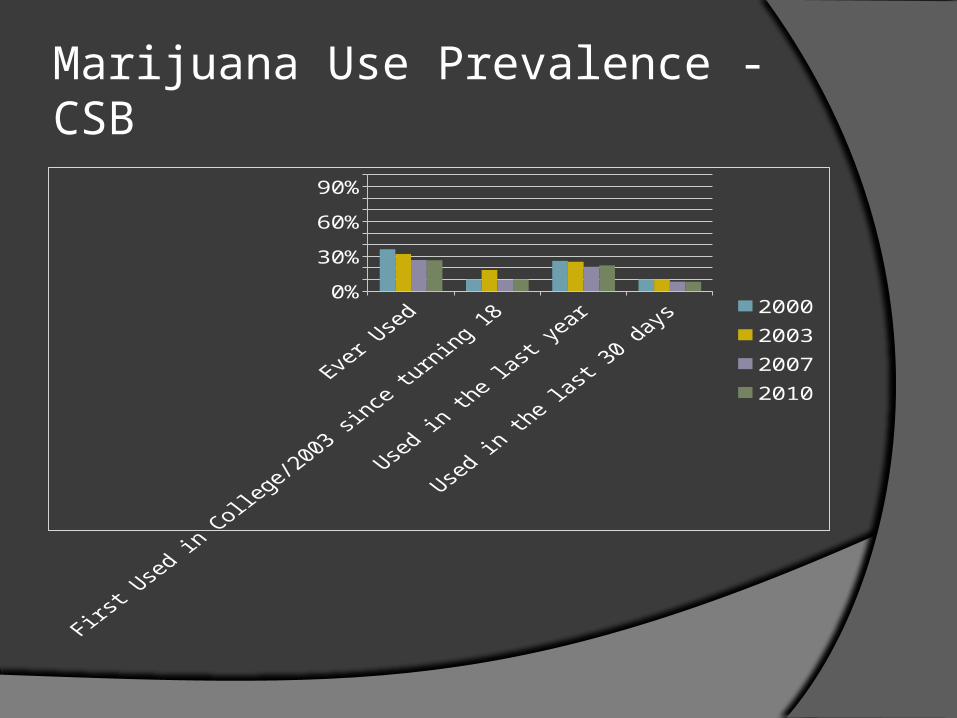
Marijuana Use Prevalence - CSB
Ever Used First Used in College/2003 since turning
18
Used in the last year
Used in the last 30 days
0%10%20%30%40%50%60%70%80%90%
100%
2000200320072010

Recreational Use of Prescription Drugs
reported recreational use of pre-scription
drugs in the past year
0.00%
20.00%
40.00%
60.00%
80.00%
100.00%
2000200320072010