SUMMARISED AUDITED RESULTS ANNOUNCEMENT AND · PDF filesummarised audited results...
36
SUMMARISED AUDITED RESULTS ANNOUNCEMENT AND DIVIDEND DECLARATION FOR THE YEAR ENDED 30 JUNE 2017
Transcript of SUMMARISED AUDITED RESULTS ANNOUNCEMENT AND · PDF filesummarised audited results...
SUMMARISED AUDITED RESULTS ANNOUNCEMENT AND
DIVIDEND DECLARATION
FOR THE YEAR ENDED 30 JUNE 2017
Value created 01About RMI 02RMI’s investments 03Performance and outlook 05
External environment 05Overview of results 05Events after the reporting period 08Update on RMI’s strategy 09Outlook and future value creation 11
Dividend declaration 13Portfolio review 16
Discovery 16MMI Holdings 17Outsurance 18Hastings 19
Financial review 20Administration ibc
cont
ents
These summarised, audited financial results for the year ended 30 June 2017 have been prepared in accordance with:
u International Financial Reporting Standards (IFRS), including IAS 34: Interim financial reporting;
u the requirements of the Companies Act, 71 of 2008, as amended;
u the SAICA Financial Reporting Guide as issued by the Accounting Practices Committee;
u the Financial Reporting Pronouncements as issued by the Financial Reporting Standards Council; and
u the Listings Requirements of the JSE Limited.
The accounting policies applied are consistent with those applied in the previous financial year, except for changes required by the mandatory adoption of new and revised IFRS. None of the new accounting standards becoming effective in the current financial year had a significant impact on the group’s results.
Schalk Human MCom(Acc) CA(SA) prepared these consolidated financial results under the supervision of Herman Bosman LLM CFA. The board of directors takes full responsibility for the preparation of this announcement and for correctly extracting the financial information for inclusion in the announcement.
The summarised annual consolidated financial statements for the year ended 30 June 2017 contained in this booklet have been audited by PricewaterhouseCoopers Inc., who expressed an unmodified opinion thereon.
The auditor also expressed an unmodified opinion on the annual consolidated financial statements from which the
summarised annual consolidated financial statements were derived. Unless the financial information is specifically stated as audited, it should be assumed that it is unaudited.
Normalised earnings presented in these summarised financial results constitute pro forma financial information. The pro forma financial information is the responsibility of RMI’s board of directors and is presented for illustrative purposes. Because of its nature, the pro forma financial information may not fairly present RMI’s financial position, changes in equity, results of operations or cash flows. An assurance report has been prepared and issued by RMI’s auditor, PricewaterhouseCoopers Inc., on the pro forma financial information included in this report and is available at the registered office of RMI.
Copies of the auditor’s reports on the annual consolidated financial statements and the summarised annual consolidated financial statements are available for inspection at RMI’s registered office, 3rd floor, 2 Merchant Place, corner Fredman Drive and Rivonia Road, Sandton, together with the annual consolidated financial statements identified in the report.
The auditor’s report does not necessarily report on all of the information contained in these summarised consolidated financial statements.
Shareholders are therefore advised that, in order to obtain a full understanding of the nature of the auditor’s engagement, they should review the auditor’s report together with the accompanying financial information from the issuer’s registered office.
The forward-looking information has not been commented or reported on by the group’s external auditor.
Basis of preparation
01
Value createdfor the year ended 30 June 2017
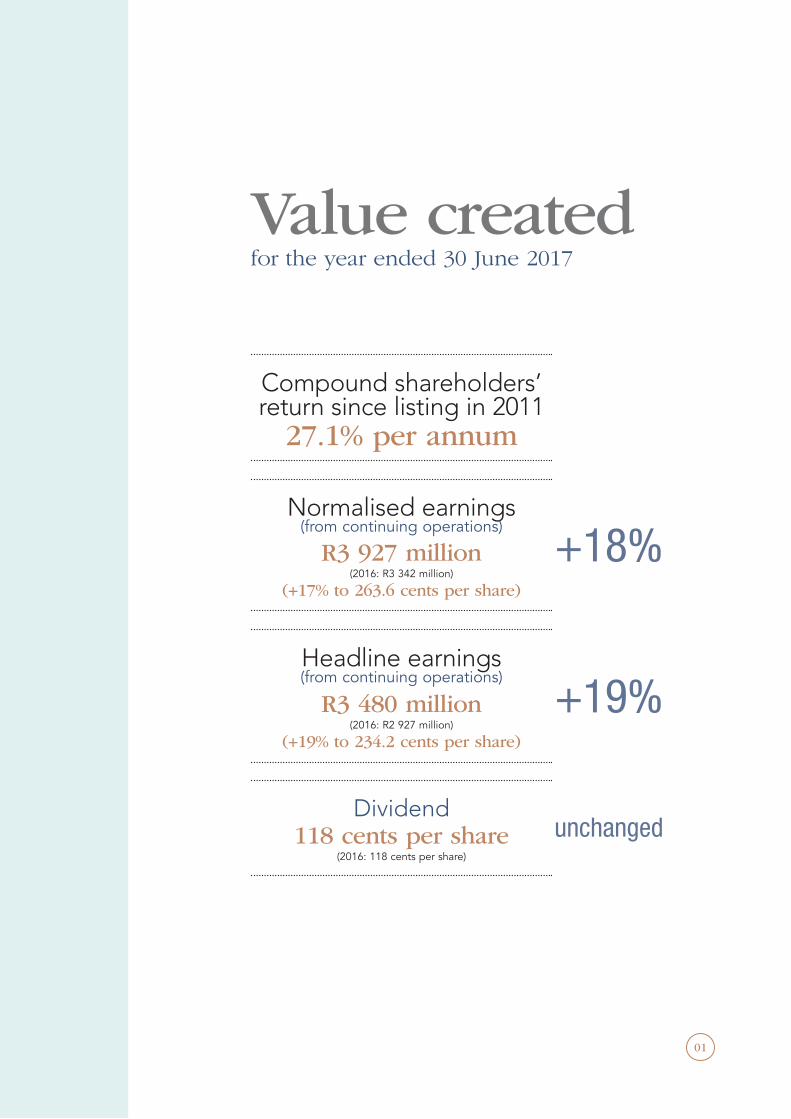
Compound shareholders’ return since listing in 2011
27.1% per annum
Normalised earnings (from continuing operations)
R3 927 million(2016: R3 342 million)
(+17% to 263.6 cents per share)
+18%
Headline earnings (from continuing operations)
R3 480 million(2016: R2 927 million)
(+19% to 234.2 cents per share)
+19%
Dividend118 cents per share
(2016: 118 cents per share)
unchanged
02
RMI
SUM
MAR
ISED
AUD
ITED
RES
ULTS
AN
NO
UNCE
MEN
T AN
D DI
VIDE
ND
DECL
ARAT
ION
FO
R TH
E YE
AR E
NDE
D 30
JUN
E 20
17
Rand Merchant Investment Holdings Limited (RMI) is a JSE-listed investment holding company with an investment team of experienced, alternative- thinking, financial services specialists who actively partner smart and industry-changing management teams by being a shareholder of influence.
VALUE CREATION
RMI’s primary objective is to create value for its shareholders by optimising, diversifying and modernising its investment portfolio.
INVESTMENT PORTFOLIO
As at 30 June 2017, RMI’s investments included Discovery Limited (Discovery), MMI Holdings Limited (MMI), OUTsurance Holdings Limited (OUTsurance), Hastings Group Holdings plc (Hastings), RMI Investment Managers Group Proprietary Limited (RMI Investment Managers), AlphaCode Proprietary Limited (AlphaCode) and its first two next-generation investments, Merchant Capital Advisory Services Proprietary Limited (Merchant Capital) and Entersekt Proprietary Limited (Entersekt). Entersekt, a mobile banking security technology company, was acquired on 30 June 2017 and therefore had no impact on the group’s results for the year under review.
The sale of RMI’s investment in RMB-SI Investments Proprietary Limited (RMB Structured Insurance) was completed in March 2017. The results of RMB Structured Insurance, excluding Truffle Capital Proprietary Limited (Truffle), are disclosed as a discontinued operation in the RMI group results for the nine months while still under RMI’s control. RMB Structured Insurance’s stake in Truffle was sold to RMI Investment Managers in February 2017.
Effective 1 March 2017, RMI acquired a 29.9% stake in UK-listed short-term insurer Hastings. RMI accounts for its stake in Hastings as an investment in associate
About RMI
from the effective date. RMI funded the acquisition through a combination of redeemable preference shares and a GBP-denominated loan in terms of its domestic medium-term note and preference share programme. The stake in Hastings was bought in a wholly-owned subsidiary of RMI, Main Street 1353 Proprietary Limited (Main Street 1353). In June 2017, RMI sold 49% of its shareholding in Main Street 1353 to OUTsurance in exchange for additional shares in OUTsurance, as well as cash.
The portfolio is intended to evolve over time to increase in size and diversity and ensure a balance between growth- and return-focused investments.
INVESTMENT POLICY
RMI’s aim is to be a value-adding, active enabler of leadership and innovation in financial services.
RMI invests in businesses that can deliver superior earnings and dividend growth over the long term. This involves the acquisition of meaningful interests in companies to have significant influence. Sound management is an important investment criterion. The group forges strategic alliances on a partnership basis and endeavour to add value, where possible. The purpose is to ensure superior returns to shareholders by way of sustainable dividends and capital growth.
The financial services landscape is a dynamic environment and whilst it is important to enhance the current market positions and business models of the underlying investments and evaluate traditional acquisition opportunities, it is equally important to be vigilant around the emergence of disruptive businesses and concepts and partner with industry-changing entrepreneurs. In line with this, RMI has a start-up business, AlphaCode, which focuses on growing next-generation businesses. On 30 June 2017, the second investment by AlphaCode was made through a 25.1% investment in Entersekt.
DIVIDEND POLICY
RMI’s dividend policy is to pay out all dividends received from underlying investments after servicing any funding commitments at holding company level and considering its debt capacity and investment pipeline. The policy seeks to achieve a sound balance between providing an attractive yield to shareholders and achieving sustained growth. Given RMI’s active investment strategy, this policy will be assessed dynamically.
About RMI
RMI’s investments
03
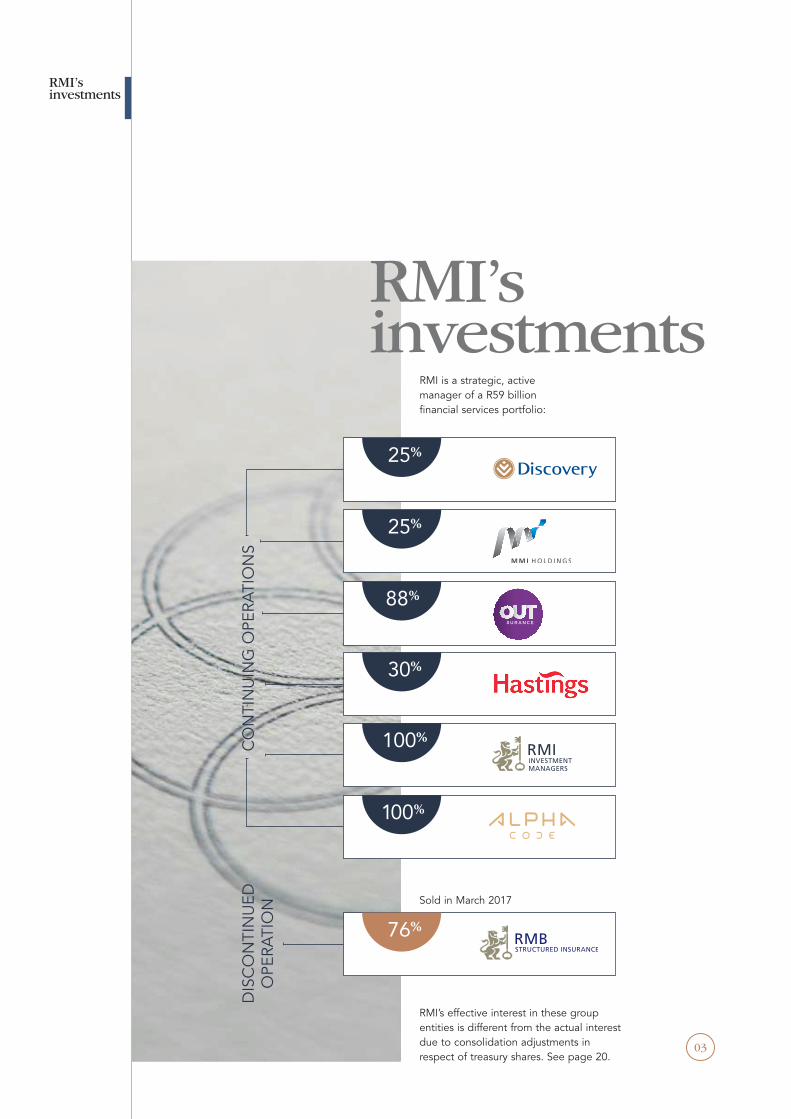
88%
25%
25%
100%
100%
CO
NTI
NU
ING
OPE
RATI
ON
S
76%
DIS
CO
NTI
NU
ED
OPE
RATI
ON
RMI’s investments
RMI is a strategic, active manager of a R59 billion financial services portfolio:
30%
RMI’s effective interest in these group entities is different from the actual interest due to consolidation adjustments in respect of treasury shares. See page 20.
Sold in March 2017
04
RMI
SUM
MAR
ISED
AUD
ITED
RES
ULTS
AN
NO
UNCE
MEN
T AN
D DI
VIDE
ND
DECL
ARAT
ION
FO
R TH
E YE
AR E
NDE
D 30
JUN
E 20
17
LISTED INVESTMENTS
DISCOVERYDiscovery is a pioneering market leader with uniquely-positioned businesses in the healthcare, long- and short-term insurance, wellness and financial services industries. Founded in 1992 as a specialist health insurer, Discovery operates in South Africa, the UK, China, Singapore, Australia, Japan, Europe and the USA through various business lines. It has an innovative business model that incentivises people to live a healthier lifestyle and offers them protection products.
MMIMMI is an insurance-based financial services group listed on the JSE Limited. Created in December 2010 from the merger of Metropolitan and Momentum, MMI conducts business in South Africa, various other African countries and selected international countries. MMI’s core businesses are short- and long-term insurance, asset management, savings, healthcare administration, health risk management, employee benefits, property management and rewards programmes.
HASTINGSHastings is a UK-listed short-term insurer. It commenced operations in 1997 and listed on the London Stock Exchange in 2015. It is a fast-growing agile digital general insurance provider operating principally in the UK motor market. It provides private car and other forms of personal insurance cover (home, van and bike). Hastings has a 7% market share of the UK private car insurance market and has 2.5 million live client policies. The group’s success in capturing market share has been combined with consistently strong underwriting performance and growing retail profitability. The group is headquartered in Bexhill-on-Sea with offices in Newmarket, Leicester and Gibraltar.
UNLISTED INVESTMENTS
OUTSURANCEOUTsurance provides short- and long-term insurance products in South Africa and short-term insurance products in Australia, New Zealand and Namibia. It has a client-centric ethos of providing value for money insurance solutions backed by awesome client service.
RMI INVESTMENT MANAGERSRMI Investment Managers’ affiliate model enables the company to access a differentiated part of the investment management industry by investing in and partnering with independent investment managers, as well as specialist investment teams. RMI Investment Managers has taken equity stakes of up to 30% in boutique investment managers and will continue to search for opportunities that will complement RMI’s existing suite of managers, as the company builds its share of the South African investment management market.
ALPHACODERMI’s next-generation business platform continues to show progress on its strategy of identifying, partnering and growing extraordinary next-generation financial services entrepreneurs. AlphaCode has members operating across the financial services spectrum, with many using leading-edge technology to transform the delivery of financial services. AlphaCode’s first investment, Merchant Capital, is a provider of alternative sources of working capital for small and medium enterprises in South Africa. Its second investment, Entersekt, has developed world-class mobile banking security technology. Post year-end, it made two additional investments in Prodigy, an international fintech platform that offers loans to postgraduate students, and Luno, a company that offers clients a wallet to buy, store and use Bitcoin and operates a Bitcoin exchange platform.
RMI’s investments
05
Performance and outlookExternal environmentRMI’s external environment during the year was characterised by the following trends:
u Low GDP growth in South Africa;
u Sharp currency fluctuations;
u Political uncertainty;
u Changing consumer behaviour and expectations; and
u Rapid technological change towards digital and smart technology.
In the year under review, the South African economy suffered its first recession since the 2008 global financial crisis. Current macroeconomic conditions suggest that there will be a continued lack of growth in the country. The ongoing political and policy uncertainty is expected to continue at least until the ANC’s December electoral conference. Inflation in South Africa is likely to remain towards the top end of the target band. The Rand is also expected to remain weak against the Dollar, especially after the sovereign downgrades and fears that the independence of the central bank could potentially be undermined by the government’s efforts to revive the ailing economy.
Overview of resultsIn this difficult economic and business environment, the RMI group delivered a pleasing 18% increase in normalised earnings from continuing operations for the year ended 30 June 2017.
Discovery’s 8% increase in normalised earnings was driven by the performance of its three established South African businesses; Discovery Health (up 11%), Discovery Life (up 10%) and Discovery Invest (up 12%), as well as VitalityHealth in the UK (up 52%). The emerging businesses made significant progress towards profitability. Discovery weathered headwinds in the UK as a result of low interest rates and unfavourable exchange rate movements. Earnings growth was also strained by increased finance charges which emanated from the funding of the new business acquisition costs incurred at VitalityLife and an increase in the utilisation of Discovery’s bank syndicated loan programme to fund new initiatives.
MMI maintained its normalised earnings of R3.2 billion from the prior year. Growth in normalised earnings was strained by the impact of weak investment market returns over the past two years on asset-based fees and the negative underwriting experience on group disability business. MMI’s expense optimisation project
targets annual expense savings of R750 million by the 2019 financial year, with actual savings to date amounting to R323 million. The embedded value amounted to R42.5 billion (or R26.51 per share) as at 30 June 2017, reflecting a 4.7% return for the year.
Normalised earnings from OUTsurance increased by 25% to R2.5 billion, mainly due to favourable claims experience across the group. The cost-to-income ratio improved from 26.2% to 25.8%, primarily attributable to the efficiency gains achieved by Youi and OUTsurance Life. There was also a significant reduction in the start-up loss at Youi New Zealand due to the improvement in the claims and cost-to-income ratios. The OUTsurance group achieved a return on equity of 33.7% and a claims ratio of 51.3%.
RMI included normalised earnings of R246 million from Hastings for the four months from 1 March 2017 to 30 June 2017. Hastings announced its interim results for the six months ended 30 June 2017 on 9 August 2017. Gross written premiums increased by 28% and normalised earnings by 22% for the six-month period. Hastings recorded a sustained increase in clients, with live client policies increasing by 15% to 2.5 million and market share growing to 7% of the UK private car insurance market. Hastings
06
RMI
SUM
MAR
ISED
AUD
ITED
RES
ULTS
AN
NO
UNCE
MEN
T AN
D DI
VIDE
ND
DECL
ARAT
ION
FO
R TH
E YE
AR E
NDE
D 30
JUN
E 20
17
declared an interim dividend of 4.1 pence per share, an increase of 24% on the interim dividend in the prior year of 3.3 pence per share.
RMI Investment Managers completed its first two years of operations with the financial performance slightly behind expectations. This was primarily due to the impact of weak markets on the profitability of its underlying affiliates. During the year under review, two new affiliates were added to the group, namely Truffle and Polar Star, together adding R26 billion of assets under management across listed equities, bonds and commodities. The total assets under management across the nine affiliates of the group totalled R75 billion as at 30 June 2017. Royal Investment Managers, established almost a year ago as a joint venture with Royal Bafokeng Holdings, acquired its first affiliate, Sesfikile Capital, a listed property asset manager with assets under management of R18.1 billion.
Merchant Capital continued its strong operational performance, as well as investing in its core operations and product development.
RMB Structured Insurance was sold in March 2017 and recorded a loss of R38 million in the nine months to March 2017.
The funding and holding company costs amounted to R389 million, compared to R195 million in the 2016 financial year. The increase is as a result of the net liabilities at holding company level increasing from R1 487 million to R9 789 million following the acquisition of the 29.9% stake in Hastings. The funding rates on the debt are as follows:
u R1 130 million preference shares (three years and one day) – 66% of prime but fixed at 7.119% for one year
u R1 130 million preference shares (five years) – 68% of prime but fixed at 7.343% for one year
u R5 650 million preference shares (three years and one day) – 66% of prime
u R1 800 million preference shares (five years) – 68% of prime
u R2 551 million GBP-denominated loan (£150 million) in Main Street 1353, the holding company of the group’s investment in Hastings – 50% is a three-year loan at LIBOR (LIBOR fixed at 0.77%) plus 1.5% and the other 50% is a five-year loan at LIBOR (LIBOR fixed at 0.98%) plus 1.95%.
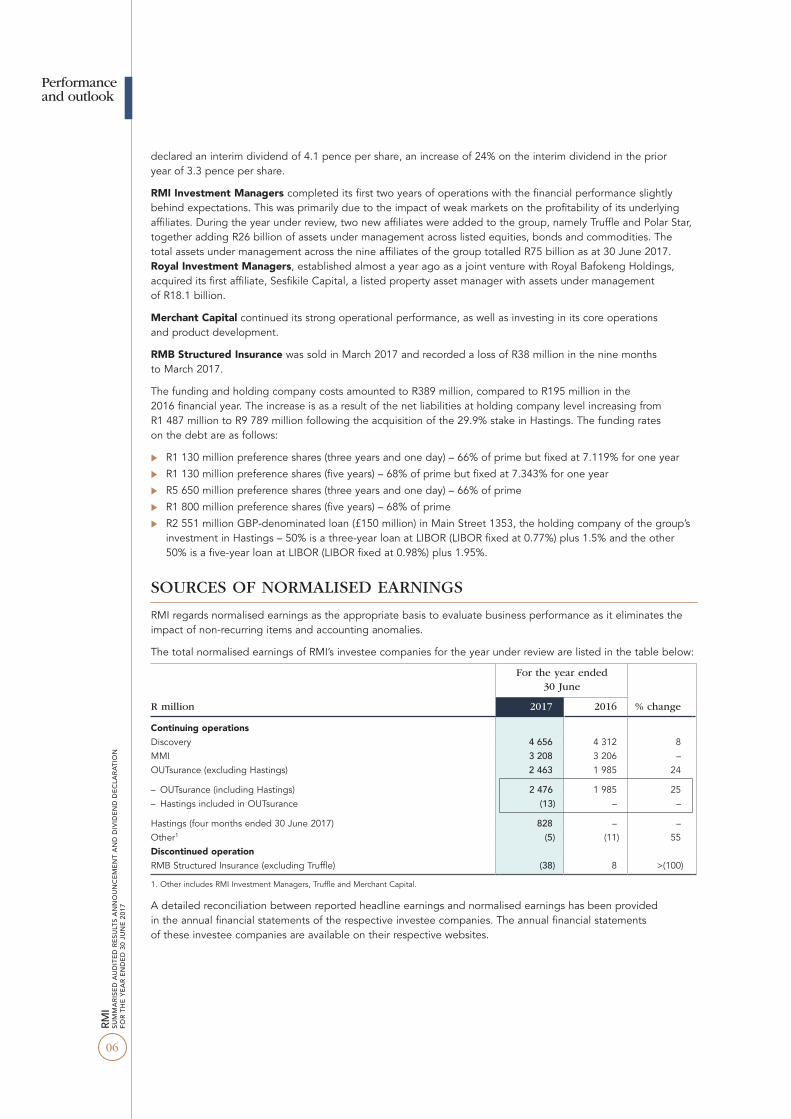
SOURCES OF NORMALISED EARNINGS
RMI regards normalised earnings as the appropriate basis to evaluate business performance as it eliminates the impact of non-recurring items and accounting anomalies.
The total normalised earnings of RMI’s investee companies for the year under review are listed in the table below:
R million
For the year ended 30 June
% change2017 2016
Continuing operationsDiscovery 4 656 4 312 8MMI 3 208 3 206 –OUTsurance (excluding Hastings) 2 463 1 985 24
– OUTsurance (including Hastings) 2 476 1 985 25– Hastings included in OUTsurance (13) – –
Hastings (four months ended 30 June 2017) 828 – –Other1 (5) (11) 55Discontinued operationRMB Structured Insurance (excluding Truffle) (38) 8 >(100)
1. Other includes RMI Investment Managers, Truffle and Merchant Capital.
A detailed reconciliation between reported headline earnings and normalised earnings has been provided in the annual financial statements of the respective investee companies. The annual financial statements of these investee companies are available on their respective websites.
Performance and outlook

07
RMI’s consolidated normalised earnings for the year under review are listed in the table below:
R million
For the year ended 30 June
% change2017 2016
Continuing operations 3 927 3 342 18
Discovery 1 167 1 079 8
MMI 816 805 1OUTsurance (excluding Hastings) 2 092 1 664 26
– OUTsurance (including Hastings) 2 103 1 664 26– Hastings included in OUTsurance (11) – –
Hastings (four months ended 30 June 2017) 246 – –Other1 (5) (11) 55Funding and holding company costs (389) (195) (100)
Discontinued operationRMB Structured Insurance (excluding Truffle) (30) 6 >(100)
Normalised earnings 3 897 3 348 16
Normalised earnings per share (cents) (continuing operations) 263.6 225.0 17Normalised earnings per share (cents) (continuing and discontinued
operations) 261.6 225.3 16
1. Other includes RMI Investment Managers, Truffle and Merchant Capital.
A reconciliation of the adjustments made to headline earnings to derive normalised earnings is presented on page 22.
MARKET VALUE OF INVESTMENTS
During the 2017 financial year, RMI’s share price decreased by 5% (2016: decreased by 3%), compared to a 2% decrease in the life insurance index and a 12% increase in the non-life insurance index. RMI has delivered a total annual compounded return to shareholders of 27.1% since its listing in March 2011.
The individual investment performances during the 2017 financial year are outlined below:
u Discovery’s share price increased by 4% (2016: decreased by 3%).
u MMI’s share price decreased by 11% (2016: decreased by 25%), with a dividend yield of 7.8% (based on the share price of R20.24 as at 30 June 2017).
u On a “look-through” basis, based on share prices as at 30 June 2017, the value attributed to RMI’s unlisted investments decreased by 12% (2016: increased by 6%) to R29.8 billion (2016: R33.8 billion). These unlisted investments include OUTsurance (excluding OUTsurance’s 49% stake in the group’s holding in Hastings) (87.7% held), RMI Investment Managers (100% held) and the AlphaCode investments.
R million 2017 2016 % change
Market value of interest in:– Discovery 20 716 19 838 4 – MMI 8 117 9 080 (11)– Hastings (RMI’s effective holding) 9 857 – –
– 29.9% holding 10 491 – – – Attributable to non-controlling interest of OUTsurance (634) – –
Market value of listed investments 38 690 28 918 34 RMI Investment Managers and AlphaCode at cost 619 103 >100 Discontinued operation (RMB Structured Insurance) – 364 (100)Implied market value of RMI’s stake in OUTsurance (excluding Hastings) 29 187 33 312 (12)
Gross market value of portfolio 68 496 62 697 9 Net liabilities of holding company (9 789) (1 487) >(100)
RMI MARKET CAPITALISATION 58 707 61 210 (4)
RMI closing share price (cents) 3 899 4 120 (5)
The movement in the net liabilities of the holding company was due to the acquisition of a 29.9% stake in Hastings in March 2017.
Performance and outlook
08
RMI
SUM
MAR
ISED
AUD
ITED
RES
ULTS
AN
NO
UNCE
MEN
T AN
D DI
VIDE
ND
DECL
ARAT
ION
FO
R TH
E YE
AR E
NDE
D 30
JUN
E 20
17
FINAL DIVIDEND FOR THE 2017 FINANCIAL YEAR
The policy of paying out all dividends received from underlying investments after servicing any funding commitments at the holding company level and considering RMI’s debt capacity and investment pipeline remains in place.
The board is of the opinion that RMI is adequately capitalised and that the company will be able to meet its obligations in the foreseeable future after payment of the final dividend declared.
The board resolved to declare a final dividend of 65.0 cents (2016: 65.0 cents) per ordinary share with an option to elect scrip in lieu of cash or to reinvest all or part of the cash dividend (net of any applicable taxes) in RMI ordinary shares. The total dividend for the year of 118.0 cents (2016: 118.0 cents) per ordinary share is covered 2.2 times (2016: 1.9 times) by the normalised earnings of 261.6 cents (2016: 225.3 cents) per share.
Since 2014, RMI has actively pursued a strategy to optimise, diversify and modernise its portfolio of financial services assets. Its ambitions to diversify geographically, add to its existing portfolio of significant stakes in financial services companies and to facilitate ongoing growth initiatives in its existing portfolio companies imply additional investment and use of financial leverage. The RMI board has decided that, in addition to the cash dividend, it would offer the scrip distribution alternative and the reinvestment option to prudently manage RMI’s capital structure. The RMI board will continuously assess RMI’s dividend policy through its investment phase and may, if appropriate, continue to utilise the scrip distribution alternative and the reinvestment option to support investment activity.
Shareholders are referred to the dividend declaration forming part of this announcement regarding the applicability of Dividend Withholding Tax to the ordinary dividend and more detail on the options available to shareholders.
Events after the reporting period
PRODIGY INVESTMENTS LIMITED
In July 2017, RMI acquired a 3.5% in Prodigy Investments Limited, an international fintech platform that offers loans to postgraduate students.
LUNO LIMITED
In August 2017, RMI invested in Luno, a company that offers clients a wallet to buy, store and use Bitcoin and operates a Bitcoin exchange platform.
ETHOS PRIVATE EQUITY PROPRIETARY LIMITED
RMI Investment Managers and Royal Investment Managers completed, subject to certain conditions, the acquisition of a combined 30% equity stake in Ethos Private Equity (Ethos), South Africa’s premier private equity asset manager of R10 billion in assets, during September 2017.
Performance and outlook
09
Update on RMI’s strategy
RMI’s aim is to be a value-adding, active enabler of leadership and innovation in financial services. Its objective is to create a portfolio of businesses which are market leaders and can deliver sustainable earnings, an attractive dividend yield and capital growth. RMI therefore pursues opportunities in the changing financial services landscape which meet its stringent criteria and strong values.
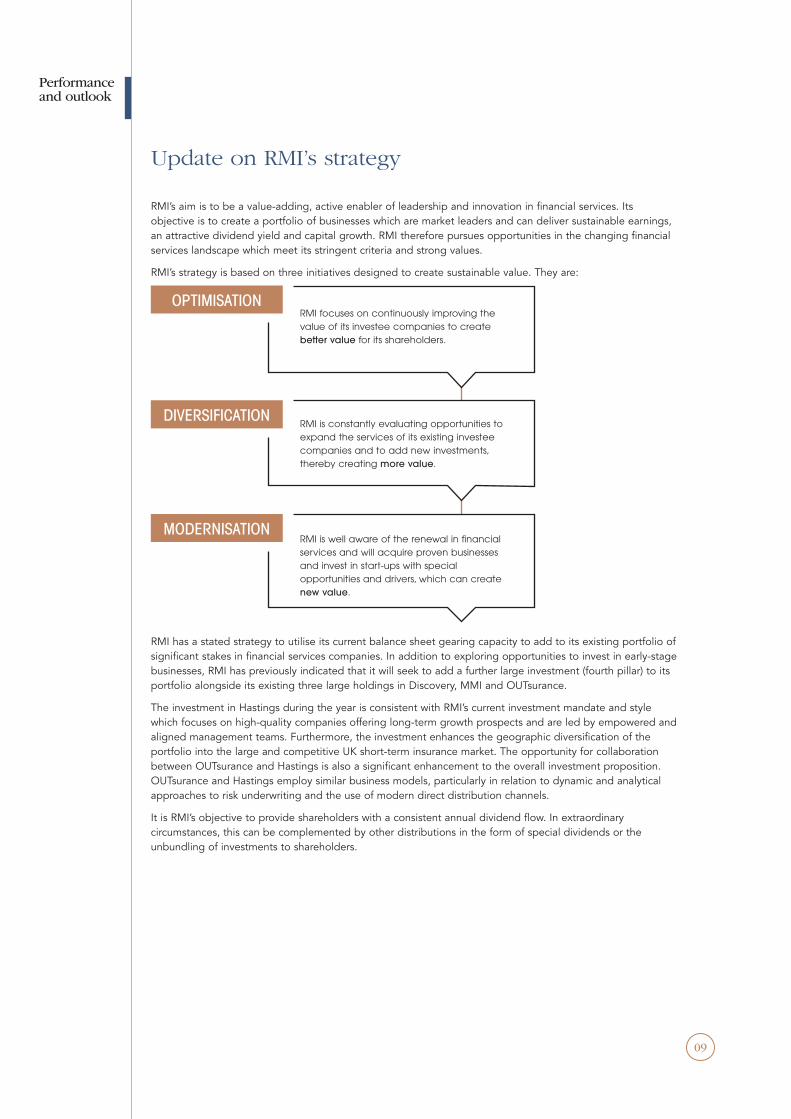
RMI’s strategy is based on three initiatives designed to create sustainable value. They are:
RMI is constantly evaluating opportunities to expand the services of its existing investee companies and to add new investments, thereby creating more value.
DIVERSIFICATION
RMI is well aware of the renewal in financial services and will acquire proven businesses and invest in start-ups with special opportunities and drivers, which can create new value.
MODERNISATION
RMI focuses on continuously improving the value of its investee companies to create better value for its shareholders.
OPTIMISATION
RMI has a stated strategy to utilise its current balance sheet gearing capacity to add to its existing portfolio of significant stakes in financial services companies. In addition to exploring opportunities to invest in early-stage businesses, RMI has previously indicated that it will seek to add a further large investment (fourth pillar) to its portfolio alongside its existing three large holdings in Discovery, MMI and OUTsurance.
The investment in Hastings during the year is consistent with RMI’s current investment mandate and style which focuses on high-quality companies offering long-term growth prospects and are led by empowered and aligned management teams. Furthermore, the investment enhances the geographic diversification of the portfolio into the large and competitive UK short-term insurance market. The opportunity for collaboration between OUTsurance and Hastings is also a significant enhancement to the overall investment proposition. OUTsurance and Hastings employ similar business models, particularly in relation to dynamic and analytical approaches to risk underwriting and the use of modern direct distribution channels.
It is RMI’s objective to provide shareholders with a consistent annual dividend flow. In extraordinary circumstances, this can be complemented by other distributions in the form of special dividends or the unbundling of investments to shareholders.
Performance and outlook
10
RMI
SUM
MAR
ISED
AUD
ITED
RES
ULTS
AN
NO
UNCE
MEN
T AN
D DI
VIDE
ND
DECL
ARAT
ION
FO
R TH
E YE
AR E
NDE
D 30
JUN
E 20
17
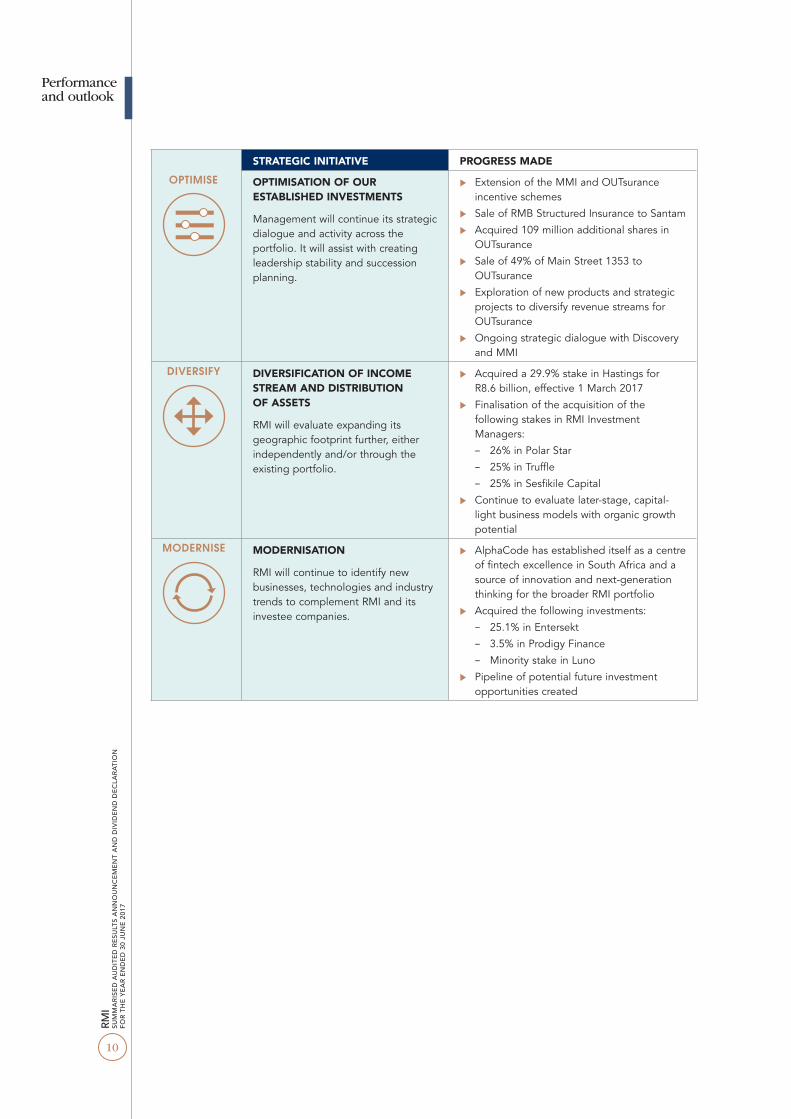
STRATEGIC INITIATIVE PROGRESS MADE
OPTIMISE OPTIMISATION OF OUR ESTABLISHED INVESTMENTS
Management will continue its strategic dialogue and activity across the portfolio. It will assist with creating leadership stability and succession planning.
u Extension of the MMI and OUTsurance incentive schemes
u Sale of RMB Structured Insurance to Santam
u Acquired 109 million additional shares in OUTsurance
u Sale of 49% of Main Street 1353 to OUTsurance
u Exploration of new products and strategic projects to diversify revenue streams for OUTsurance
u Ongoing strategic dialogue with Discovery and MMI
DIVERSIFY DIVERSIFICATION OF INCOME STREAM AND DISTRIBUTION OF ASSETS
RMI will evaluate expanding its geographic footprint further, either independently and/or through the existing portfolio.
u Acquired a 29.9% stake in Hastings for R8.6 billion, effective 1 March 2017
u Finalisation of the acquisition of the following stakes in RMI Investment Managers:
– 26% in Polar Star
– 25% in Truffle
– 25% in Sesfikile Capital
u Continue to evaluate later-stage, capital-light business models with organic growth potential
MODERNISE MODERNISATION
RMI will continue to identify new businesses, technologies and industry trends to complement RMI and its investee companies.
u AlphaCode has established itself as a centre of fintech excellence in South Africa and a source of innovation and next-generation thinking for the broader RMI portfolio
u Acquired the following investments:
– 25.1% in Entersekt
– 3.5% in Prodigy Finance
– Minority stake in Luno
u Pipeline of potential future investment opportunities created
Performance and outlook
11
Outlook and future value creation
EXISTING PORTFOLIO
The year under review saw Discovery continuing development of its operating model, with refinements in its three components, namely the Vitality shared-value insurance model, its growth engine and capital management philosophy. These together form the group’s ambition of being the best insurance organisation globally and a powerful force for social good by 2018. Discovery has set three-dimensional criteria against which to measure the group against the aims of its ambition, namely:
u Brilliant businesses: Market-leading businesses with sustainable products that meet complex consumer needs, driving significant engagement and superior loss ratios and lapse rates, supported by an exceptional service ecosystem.
u Profound impact: Incentivises millions of people around the world to live healthier and be engaged in their wellness, with a measurable positive effect on their health. A return of risk-free plus 10% on equity and capital, as well as each business meeting an internal rate of return of risk-free plus 10%, with operating profit growth of CPI + 10% and robust cash management.
u Powerful assets: A unique business model underpinned by powerful science and data assets. A fully operational global Vitality network and a distinctive global brand.
The year under review saw material progression in all three these criteria, positioning Discovery strongly to meet the goals of its ambition.
The strategic focus areas of MMI are client- centricity, growth and excellence, with client engagement solutions through Multiply identified as an area of specific strategic importance to differentiate MMI’s client value proposition. MMI continues to invest in growth initiatives with the aim of enhancing shareholder value over the longer term, with an increasing amount of the investment budget being allocated to initiatives that will broaden the South African distribution footprint. The partnership with African Bank creates the opportunity to expand MMI’s distribution network and solution set. MMI has started the rationalisation of its African portfolio, with the health insurance joint venture in India likely to be its largest ongoing investment initiative outside of South Africa in the near future.
The South African economy is expected to remain challenging for the foreseeable future, which is likely to result in below inflationary premium growth for OUTsurance’s South African operations. The Youi group is expected to achieve improved growth in the near future following the roll-out of product and service innovations coupled with entering the compulsory third party and commercial insurance markets. These strategies will take some time to contribute to premium growth. OUTsurance is excited about the strength of the client proposition of OUTvest and the positive impact this business can have on the savings and investment landscape in South Africa. The advice and administrative offering of this new venture will be expanded in the 2018 financial year. In the likely absence of strong premium growth in the next financial year, OUTsurance will retain its focus on underwriting discipline and the pursuit of operational excellence.
Hastings continues on its profitable growth trajectory. Its significant presence and strategic focus on price comparison websites, together with its straightforward insurance offering appeals to clients. It therefore continues to grow market share by both attracting new clients and maintaining strong retention levels. Hastings continues to invest in its digital and data-driven model to ensure agile and responsive pricing. This approach allows Hastings to maintain its robust underwriting discipline, resulting in loss ratios below the target range. Hastings is well on course to deliver on its ambitious 2019 targets set at the time of its listing in October 2015.
The assets under management across the affiliates of RMI Investment Managers continue to grow as clients look to independent asset managers for alternative choices to managing their assets. Industry flows, however, slowed during the year under review. This, coupled with the impact of lower asset class returns and heightened fee pressure, has resulted in a more challenging environment for the profitability of its affiliate asset managers.
Each affiliate has substantially strengthened their business during the year by diversifying their client
Performance and outlook
12
RMI
SUM
MAR
ISED
AUD
ITED
RES
ULTS
AN
NO
UNCE
MEN
T AN
D DI
VIDE
ND
DECL
ARAT
ION
FO
R TH
E YE
AR E
NDE
D 30
JUN
E 20
17
base, adding to their investment and operations teams as well as through the value that RMI Investment Managers has brought to each affiliate across strategy, distribution and operations. The team is pleased with the overall progress, especially with its growing reputation as a trusted, value-adding but non-interfering shareholder of choice for the independent asset management industry.
As mentioned in the RMI interim results announcement in March 2017, while the team is more focused on the execution of the growth initiatives at each affiliate than on further acquisitions, they continue to look for opportunities to add affiliates, particularly in the areas where the business is underexposed, notably in the managing of global assets and unlisted assets. In keeping with this, the team is very excited about Ethos becoming an affiliate, given the quality of the business as South Africa’s oldest and one of the most highly-regarded alternative asset managers as well as the constructive outlook for the alternatives landscape, given client demand and a supportive regulatory environment. The team and its joint venture partners in MMI and RBH look forward to working with Ethos as they broaden out their business into other parts of the alternatives market to create a more diversified and transformed business.
Merchant Capital’s short-term strategy entails solidifying the South African core business and operating platform. The business continues to launch new products and partnerships to further differentiate the product and grow the client base.
NEW INVESTMENTS
In addition to optimising its existing portfolio, RMI plans to diversify and modernise its investment portfolio through opportunities across a wide spectrum of scale and lifecycles of financial services businesses.
TRADITIONAL FINANCIAL SERVICES The investment team continues to investigate potential investment opportunities, both locally and globally, that conform to RMI’s investment philosophy and generate superior returns for shareholders.
NEXT-GENERATION FINANCIAL SERVICESAlphaCode’s vision is to pioneer the next stage of financial services by identifying, partnering and growing extraordinary next-generation financial services entrepreneurs. Over the last year, AlphaCode has had success with partnering these next-generation businesses with its underlying portfolio companies to drive innovation and modernisation and building an investment portfolio of superior entrepreneur-led, early-stage fintech-focused businesses that have achieved some market traction and are poised for rapid growth.
Adding to its investment in Merchant Capital, the SME working capital financier, AlphaCode acquired 25.1% of Entersekt, an innovator that has developed world-class mobile banking security technology. AlphaCode also participated in a large capital raise in Prodigy Finance, an international fintech platform that offers loans to postgraduate students accepted into business, engineering and law at the world’s top universities, alongside one of Europe’s leading venture capital fintech investors, Balderton Capital. In August 2017, RMI invested in Luno, a company that offers clients a wallet to buy, store and use Bitcoin and operates a Bitcoin exchange platform. AlphaCode has a strong pipeline of investment opportunities and will continue to invest in this space.
AlphaCode remains committed to building the broader entrepreneurial sector in South Africa by supporting high-impact black technology entrepreneurs, providing mentorship, free office space, support facilities and access to enterprise development funding through its broad-based black economic empowerment centre of excellence.
RMI remains confident that its clear strategy, in conjunction with its solid investment portfolio and underpinned by unwavering values, will allow it to continue delivering on its primary objective of creating sustainable, long-term value for shareholders.
GT Ferreira Herman BosmanChairman Chief executive
Sandton19 September 2017
Performance and outlook
13
1. INTRODUCTION
The board of directors (RMI board) of Rand Merchant Investment Holdings Limited (RMI) has declared a final gross cash dividend of 65 cents per RMI ordinary share for the year ended 30 June 2017 (cash dividend). Subject to the approval by RMI shareholders (RMI shareholders) of the resolution proposed to RMI shareholders in terms of a notice pursuant to section 60 (section 60 notice) of the Companies Act, 71 of 2008 (Companies Act), to be released on the Stock Exchange News Service (SENS) of JSE Limited (JSE) immediately subsequent to this announcement, the RMI board has resolved to make a maximum of 25 755 195 fully paid RMI ordinary shares of R0.0001 cents each (RMI shares) available to RMI shareholders as (a) capitalisation shares (having an aggregate notional issue price of up to R978 697 424.90) (capitalisation shares) and/or (b) reinvestment shares (having an aggregate notional issue price of the cash dividend reinvested (net of any applicable taxes)) (reinvestment shares).
The RMI board has resolved to:
i. Make the capitalisation shares available to shareholders, in lieu of the cash dividend (scrip distribution alternative); and
ii. Offer RMI shareholders the ability to reinvest all or part of their cash dividend (net of any applicable taxes) (subscription value) in RMI ordinary shares by RMI (a) crediting such subscription value to RMI shareholders; and (b) applying such credit on behalf of RMI shareholders to subscribe for reinvestment shares (reinvestment option),
as may be elected by RMI shareholders in respect of all or a part of their shareholding recorded in RMI’s securities register at 12:00 on the record date, being Friday, 6 October 2017 (record date).
2. RATIONALE
Since 2014, RMI has actively pursued a strategy to optimise, diversify and modernise its portfolio of financial services assets. RMI’s ambitions to diversify geographically, add to its existing portfolio of significant stakes in financial services companies and to facilitate ongoing growth initiatives in its existing portfolio companies imply additional investment and use of financial leverage. The RMI board has decided that, in addition to the cash dividend, it would offer the scrip distribution alternative and the reinvestment option to
Dividend declaration
Cash dividend or, as an alternative, an election to either (i) receive a scrip distribution; or (ii) reinvest the cash dividend.
prudently manage RMI’s capital structure. The RMI board will continuously assess RMI’s dividend policy through its investment phase and may, if appropriate, continue to utilise the scrip distribution alternative and the reinvestment option to support investment activity.
The scrip distribution alternative and reinvestment option are effective methods of managing the balance sheet post the March 2017 acquisition of a 29.9% interest in Hastings Group Holdings plc by RMI, which was debt-funded. Furthermore, the scrip distribution alternative and the reinvestment option each provide a cost-effective opportunity for shareholders to increase their shareholding in RMI.
The scrip distribution alternative and the reinvestment option are underpinned by the support of Remgro Limited (Remgro), Royal Bafokeng Proprietary Holdings Limited, LL Dippenaar and GT Ferreira (being shareholders representing in aggregate approximately 52.2% of the RMI shareholders’ voting rights). Furthermore, Remgro has undertaken to elect to receive reinvestment shares in respect of all its shareholding, as contemplated in the reinvestment option.
3. TERMS OF THE SCRIP DISTRIBUTION ALTERNATIVE AND REINVESTMENT OPTION
Each of the scrip distribution alternative and reinvestment option applies to the final gross cash dividend of 65 cents per RMI share for the year ended 30 June 2017 declared on Tuesday, 19 September 2017. This will result in the payment of a net cash dividend of 52 cents per RMI share to RMI shareholders liable for the full local 20% dividends tax and 65 cents per RMI share to RMI shareholders exempt from dividends tax. Non-resident RMI shareholders may qualify for a reduced rate of dividends tax, depending on whether or not there is an applicable agreement for the avoidance of double taxation between South Africa and the country in which a non-resident RMI shareholder is resident for tax purposes.
The scrip distribution alternative and reinvestment option will proceed pursuant to the approval of RMI shareholders in terms of the section 60 notice authorising the allotment and issue of up to a maximum of 25 755 195 RMI shares as fully paid capitalisation shares (in terms of the scrip distribution alternative) or fully paid reinvestment shares (in terms of the reinvestment option) to RMI
14
RMI
SUM
MAR
ISED
AUD
ITED
RES
ULTS
AN
NO
UNCE
MEN
T AN
D DI
VIDE
ND
DECL
ARAT
ION
FO
R TH
E YE
AR E
NDE
D 30
JUN
E 20
17
Dividend declaration
shareholders. The issue price for the capitalisation and reinvestment shares is R38.00 per RMI share, being a 3.9% discount to the closing share price of RMI shares on the JSE as at 15 September 2017.
The number of capitalisation shares which RMI shareholders may elect to receive under the scrip distribution alternative has been determined in the ratio of 1.71053 fully paid RMI shares for every 100 RMI shares held on the record date.
The reinvestment shares will be issued in consideration for the amount of the cash dividend (net of any applicable taxes) as elected to be reinvested by RMI shareholders. The number of reinvestment shares, which RMI shareholders may elect to receive under the reinvestment option, assuming RMI shareholders are liable for the full local 20% dividends tax, has been determined in the ratio of 1.36842 reinvestment shares for every 100 RMI shares held on the record date. If no dividends tax is payable, the number of reinvestment shares, which RMI shareholders may elect to receive under the reinvestment option has been determined in the ratio of 1.71053 reinvestment shares for every 100 RMI shares held on the record date.
The ratio of the scrip distribution alternative and reinvestment option has been determined with reference to such RMI shareholder’s ordinary shareholding in RMI (at 12:00 on the record date) in relation to the ratio that 65 cents or the cash dividend (net of any applicable taxes), in the scrip distribution alternative or reinvestment option, respectively, bears to the issue price being R38.00 per share, which is a 3.9% discount to the closing price on Friday, 15 September 2017 for RMI shareholders electing such option.
A circular setting out the terms of the cash dividend, scrip distribution alternative and the reinvestment option, including a form of election, will be posted to RMI shareholders on Tuesday, 19 September 2017.
The election to receive either the scrip distribution alternative or the reinvestment option is optional. RMI shareholders may elect to participate in either (i) the scrip distribution alternative; or (ii) the reinvestment option, in respect of all or part of their shareholding on the record date. RMI shareholders not electing to participate in the scrip distribution alternative or the reinvestment option in respect of all or part of their shareholding will be deemed, by default, to have elected to receive the cash dividend. RMI shareholders recorded in the securities register of RMI
at 12:00 on the record date, who have not elected to receive the capitalisation shares or the reinvestment shares, will be paid the cash dividend in respect of their entire shareholding on the record date.
To the extent that the receipt and/or exercise of the election to participate in the scrip distribution alternative or the reinvestment option and/or the receipt of capitalisation shares or the reinvestment shares pursuant to the scrip distribution alternative or the reinvestment option, respectively, in jurisdictions other than South Africa might be prohibited or otherwise restricted by legal or regulatory requirements, require RMI to take any further action, and/or the failure to comply with any of those legal or regulatory requirements might constitute a violation of the laws or regulatory requirements of such jurisdictions, RMI shareholders will not be entitled to elect to participate in and/or receive RMI shares pursuant to the scrip distribution alternative or the reinvestment option, directly or indirectly, in those jurisdictions, and shall be deemed to have elected the cash dividend, notwithstanding an election to participate in the scrip distribution alternative or the reinvestment option by such RMI shareholder.
In respect of the reinvestment option, RMI will not be seeking shareholder approval in terms of section 41 of the Companies Act. Accordingly, RMI shareholders who are (i) directors or prescribed officers of RMI; or (ii) related or inter-related (as contemplated in section 2 of the Companies Act) to RMI or to any directors or prescribed officers of RMI will not be eligible to elect the reinvestment option and shall be deemed to have elected the cash dividend, notwithstanding an election of the reinvestment option by such RMI shareholder.
Where an RMI shareholder’s entitlement to new RMI shares in respect of the scrip distribution alternative or the reinvestment option results in a fraction of a new RMI share, such fraction will be rounded down to the nearest whole number resulting in allocations of whole RMI shares to RMI shareholders and a cash payment for the fraction will be made to such RMI shareholders.
The weighted average traded price for RMI shares on Wednesday, 4 October 2017 less 10% of such weighted average traded price shall be used as the cash value for fractional entitlements to be paid to RMI shareholders in accordance with the JSE Listings Requirements. RMI will release an announcement on Thursday, 5 October 2017 in respect of the cash value determined on this basis.

15
Dividend declaration
4. CIRCULAR AND SALIENT DATES
A circular providing RMI shareholders with the full information on the cash dividend, the scrip distribution alternative and the reinvestment option, including a form of election to participate in either (i) the scrip distribution alternative or (ii) the reinvestment option, will be distributed to RMI shareholders on Tuesday, 19 September 2017.
The salient dates of events thereafter are as follows:
Event 2017
Circular and form of election posted to RMI shareholders Tuesday, 19 September
Declaration information released on SENS Tuesday, 19 September
Finalisation information, including the ratio applicable to the scrip distribution alternative/reinvestment option released on SENS Tuesday, 19 September
Last day to trade in order to be eligible to participate in the cash dividend/scrip distribution alternative/reinvestment option (cum cash dividend/scrip distribution alternative/reinvestment option) Tuesday, 3 October
RMI shares trade ex the entitlement to the cash dividend/scrip distribution alternative/reinvestment option Wednesday, 4 October
Listing of maximum possible number of new RMI shares that could be issued in terms of the scrip distribution alternative and reinvestment option Wednesday, 4 October
Cash value in respect of the RMI shares for determination of fractional entitlements to RMI shares, based on the volume weighted average price on Wednesday, 4 October 2017, discounted by 10%, released on SENS by 11:00 on Thursday, 5 October
Last day to elect (i) the scrip distribution alternative in lieu of the cash dividend; or (ii) to reinvest the cash dividend in terms of the reinvestment option. Forms of election to reach the Transfer Secretaries by 12:00 on Friday, 6 October
Record date in respect of the cash dividend/scrip distribution alternative/reinvestment option Friday, 6 October
Share certificates in respect of the scrip distribution alternative, posted and/or electronic funds transfers and CSDP/broker accounts credited/updated Monday, 9 October
Announcement regarding the results of the cash dividend/scrip distribution alternative/reinvestment option released on SENS Monday, 9 October
Share certificates in respect of the reinvestment option posted and CSDP/broker accounts credited/updated Wednesday, 11 October
Maximum number of new RMI shares listed adjusted to reflect the actual number of new RMI shares issued in respect of the scrip distribution alternative and the reinvestment option on or about Friday, 13 OctoberNotes:1. All times provided are South African standard time quoted on a 24-hour basis, unless specified otherwise. The above dates and times are
subject to change. If applicable, any changes will be released on SENS.2. Share certificates may not be dematerialised or rematerialised between Wednesday, 4 October 2017 and Friday, 6 October 2017, both
days inclusive.
By order of the RMI board.
JS HumanCompany secretary
Sandton19 September 2017
16
RMI
SUM
MAR
ISED
AUD
ITED
RES
ULTS
AN
NO
UNCE
MEN
T AN
D DI
VIDE
ND
DECL
ARAT
ION
FO
R TH
E YE
AR E
NDE
D 30
JUN
E 20
17
Portfolio review
VALUE CREATED
MARKET CAPITALISATION +4%
NORMALISED EARNINGS +8%
DIVIDENDS PAID +6%
2017: R82.7 billion2016: R79.3 billion
2017: R4 656 million2016: R4 312 million
2017: 186.0c per share2016: 175.5c per share
2017 PERFORMANCE
u Core new business increased by 16% to R17.0 billion;
u Normalised profit from operations increased by 10% to R7.0 billion;
u Normalised earnings increased by 8% to R4.7 billion;
u Gross inflows under management increased by 10% to R115.1 billion;
u Embedded value increased by 8% to R57.3 billion; and
u The total dividend for the year increased by 6% to 186.0 cents per share.
Discovery’s earnings and headline earnings increased by 21%. The main reason for the difference in the growth rate between normalised earnings and headline earnings is the non-recurring rebranding and business acquisition costs in the UK included in headline earnings in the prior year, which have reduced significantly in the current year.
RMI included R1 167 million of Discovery’s earnings in its normalised earnings (2016: R1 079 million).
For a detailed review of Discovery’s performance, RMI’s shareholders are referred to www.discovery.co.za.
17
VALUE CREATED
MARKET CAPITALISATION (11%)
NORMALISED EARNINGS –
DIVIDENDS PAID –
2017: R31.9 billion2016: R35.6 billion
2017: R3 208 million2016: R3 206 million
2017: 157c per share2016: 157c per share
2017 PERFORMANCE
u The new business present value of premiums decreased by 6% to R41.6 billion;
u The value of new business decreased by 23% to R547 million, with the new business margin reducing to 1.3%. The decrease in the value of new business is largely attributable to lower sales volumes resulting from the current economic environment;
u The embedded value amounted to R42.5 billion (2 651 cents per share), reflecting a 4.7% return on embedded value for the year;
u MMI recorded normalised earnings of R3.2 billion, in line with the normalised earnings in the prior year. Growth in normalised earnings was strained by the impact of weak investment market returns over the past two years on asset-based fees and the negative underwriting experience on group disability business;
u Earnings and headline earnings decreased by 28% and 11% respectively. Earnings include the impairment of intangible assets (software and goodwill) which is added back for headline earnings. Headline earnings include significant foreign currency and fair value losses on shareholders assets, which are added back for normalised earnings;
u MMI achieved total expense savings of R219 million in the year under review, with a reduction in annual expenses of R750 million targeted for 2019; and
u The total dividend for the year remained in line with the comparative year at 157.0 cents per share.
A capital buffer of R3.7 billion was recorded at 30 June 2017, after allowing for economic capital requirements, strategic growth initiatives and the final dividend.
RMI included R816 million of MMI’s earnings in its normalised earnings (2016: R805 million).
For a detailed review of MMI’s performance, RMI’s shareholders are referred to www.mmiholdings.co.za.
Portfolio review
18
RMI
SUM
MAR
ISED
AUD
ITED
RES
ULTS
AN
NO
UNCE
MEN
T AN
D DI
VIDE
ND
DECL
ARAT
ION
FO
R TH
E YE
AR E
NDE
D 30
JUN
E 20
17
VALUE CREATED
MARKET CAPITALISATION +68%
NORMALISED EARNINGS +25%
DIVIDENDS PAID +12%
2017: R9.7 billion2016: R5.8 billion
2017: R2 476 million2016: R1 985 million
2017: R40.2c per share2016: R36.0c per share
2017 PERFORMANCE
u Group normalised earnings increased by 25% to R2 476 million, mainly driven by a favourable claims ratio across the group;
u Net earned premiums grew by 5% to R14.1 billion, of which the Australasian operations contributed 46%;
u The claims ratio decreased from 54.4% to 51.3%;
u The cost-to-income ratio decreased from 26.2% to 25.8%; and
u The total dividend for the year increased by 12% to 40.2 cents per share.
New policy inceptions for the OUTsurance group, measured in terms of annualised premiums, decreased by 25% for the year under review. The reduction is primarily driven by price competition experienced in the Australasian business, coupled with the recessionary market conditions in South Africa. OUTsurance’s philosophy is to maintain pricing discipline throughout the economic cycle, which is evident from the claims ratios achieved.
OUTsurance’s South African short-term operations increased net earned premiums by 5%. Business OUTsurance delivered pleasing growth in line with an incremental expansion in product offering and agency distribution. Despite numerous natural catastrophe events during the year, OUTsurance achieved a favourable claims ratio of 49.2%. Reduced new business strain owing to slower growth, a generally favourable accident claims environment and positive prior year claims development contributed to the reduced claims ratio. As the claims ratio continues to track below the 55% target, significant premium reductions have been implemented, which will place pressure on premium inflation and profitability over the near term. The cost-to-income ratio increased from 18.9% to 19.1%. This increase is attributable to slower premium growth.
OUTsurance Life generated normalised earnings of R112 million, an increase of 87% compared to the prior year. Gross written premiums increased by 12% to R440 million. The strong growth in profitability was aided by enhanced economies of scale. The embedded value increased by 22% to R835 million.
Youi Australia generated normalised earnings of R686 million for the year under review, compared to R497 million in the comparative year. The claims ratio decreased from 58.9% to 55.5% due to a favourable claims environment and positive prior year claims development. The cost-to-income ratio reduced from 30.9% to 30.4%, emanating from slower relative cost growth.
Youi New Zealand’s start-up loss reduced from R107 million to R62 million, driven by a significant improvement in the claims and cost-to-income ratios.
Normalised earnings at OUTsurance Namibia increased from R30 million to R39 million, driven by an improvement in the cost-to-income ratio.
The OUTsurance group is well prepared to comply with the new prudential standards of the Solvency Assessment and Management regulatory regime, which is expected to become effective on 1 July 2018.
RMI included R2 103 million of OUTsurance’s earnings in its normalised earnings (2016: R1 664 million).
For a detailed review of OUTsurance’s performance, RMI’s shareholders are referred to www.outsurance.co.za
Portfolio review
19
Hastings has a 31 December year-end. The latest published results are for the six months ended 30 June 2017. All the numbers and commentary below relate to the six-month period ended 30 June 2017.
VALUE CREATED
MARKET CAPITALISATION +27%
NORMALISED EARNINGS +29%
DIVIDENDS PAID +24%
30 June 2017: £2 063 million31 December 2016: £1 623 million
Six months ended 30 June 2017: £66.9 millionSix months ended 30 June 2016: £51.9 million
Six months ended 30 June 2017: 4.1 pence per shareSix months ended 30 June 2016: 3.3 pence per share
2017 PERFORMANCE
u Continued growth, with gross written premiums up 28% to £462.0 million (30 June 2016: £360.6 million) and net revenue up 22% to £345.2 million (30 June 2016: £282.7 million);
u Sustained increases in clients with live client policies up by 15% to 2.5 million (30 June 2016: 2.2 million);
u Growing market share to 7.0% of UK private car insurance (30 June 2016: 6.2%);
u Loss ratio of 73.4% for the period ended 30 June 2017, below the target range of between 75% and 79% (30 June 2016: 74.0%);
u Consistent growth in profitability with normalised earnings increasing by 29% to £66.9 million (30 June 2016: £51.9 million);
u Ongoing cash generation and reduction in net debt leverage multiple, with free cash generated up 34% to £65.8 million (30 June 2016: £49.1 million) and net debt leverage multiple reduced to 1.7x (31 December 2016: 1.9x);
u Continued investment in the business, including Guidewire, the group's next-generation claims and broking platform, which will enable future growth opportunities and operational efficiencies;
u A significant improvement in solvency, with a Solvency II coverage ratio of 173% (31 December 2016: 140%), benefiting from the use of undertaking specific parameters in the calculation; and
u Interim dividend for 2017 of 4.1 pence per share (30 June 2016: 3.3 pence per share), reflecting increasing earnings and strong cash generation.
Portfolio review
20
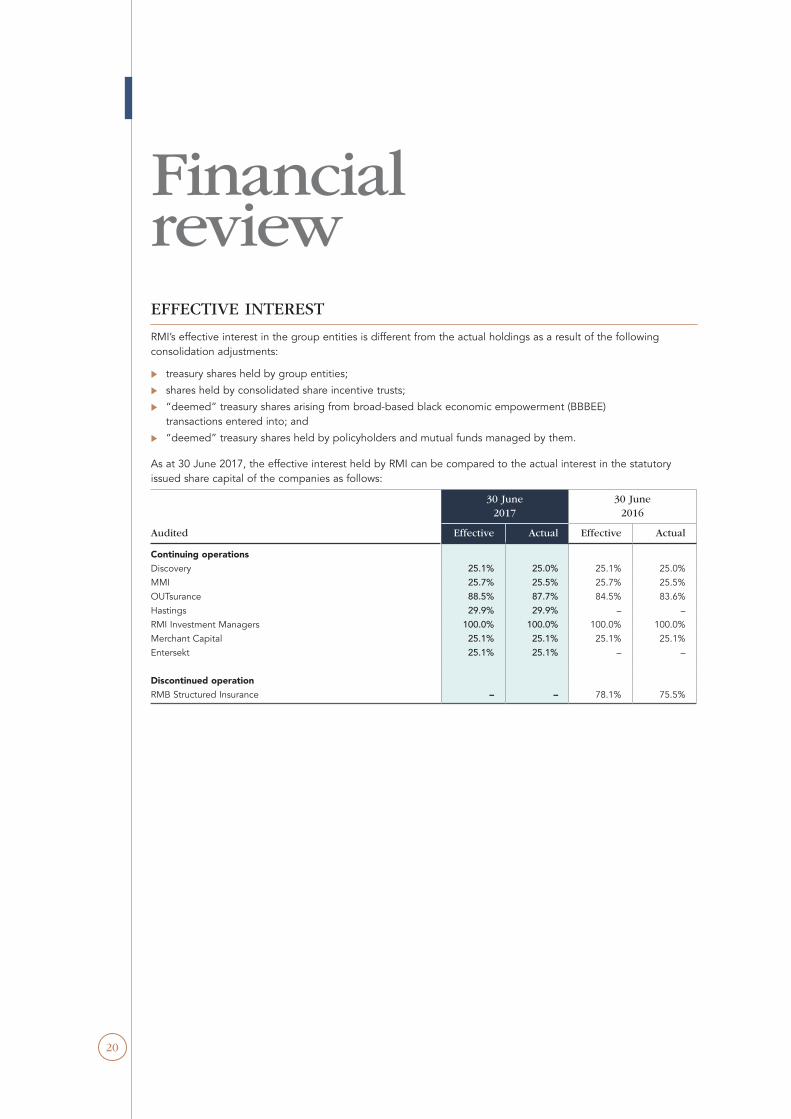
EFFECTIVE INTEREST
RMI’s effective interest in the group entities is different from the actual holdings as a result of the following consolidation adjustments:
u treasury shares held by group entities;
u shares held by consolidated share incentive trusts;
u “deemed” treasury shares arising from broad-based black economic empowerment (BBBEE) transactions entered into; and
u “deemed” treasury shares held by policyholders and mutual funds managed by them.
As at 30 June 2017, the effective interest held by RMI can be compared to the actual interest in the statutory issued share capital of the companies as follows:
Audited
30 June2017
30 June2016
Effective Actual Effective Actual
Continuing operationsDiscovery 25.1% 25.0% 25.1% 25.0%MMI 25.7% 25.5% 25.7% 25.5%OUTsurance 88.5% 87.7% 84.5% 83.6%Hastings 29.9% 29.9% – –RMI Investment Managers 100.0% 100.0% 100.0% 100.0%Merchant Capital 25.1% 25.1% 25.1% 25.1%Entersekt 25.1% 25.1% – –
Discontinued operationRMB Structured Insurance – – 78.1% 75.5%
Financial review
Financial review
21
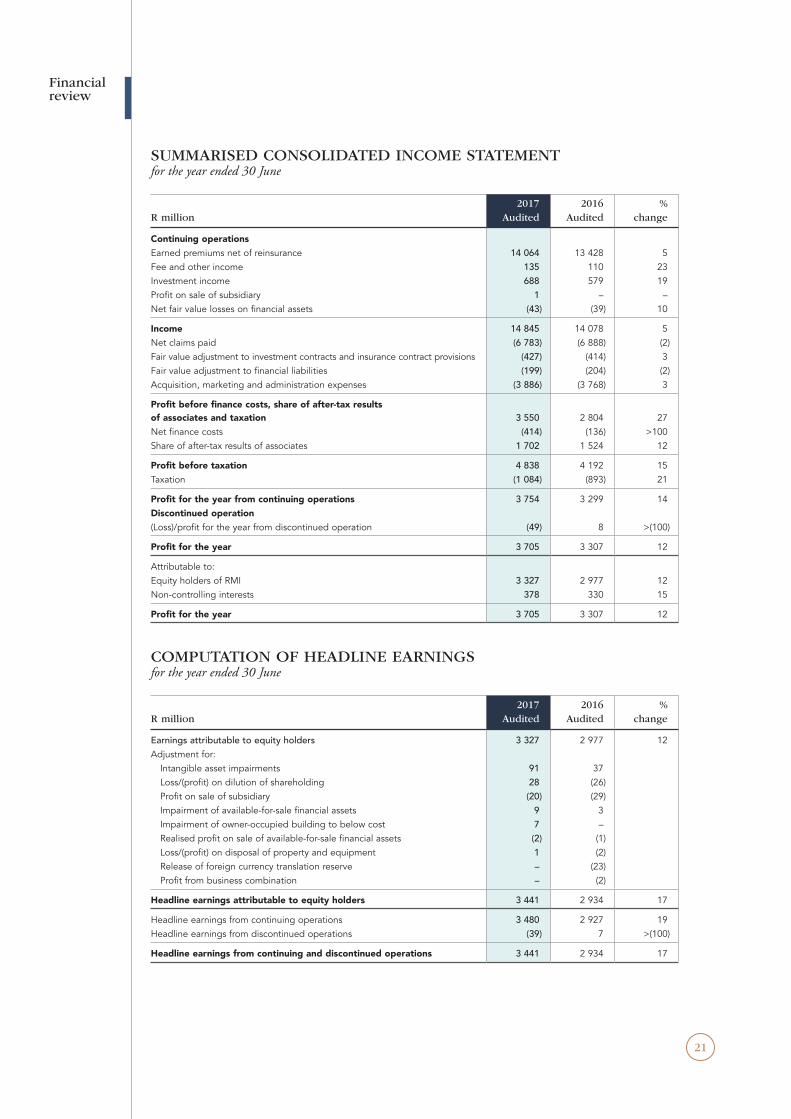
SUMMARISED CONSOLIDATED INCOME STATEMENTfor the year ended 30 June
R million2017
Audited2016
Audited%
change
Continuing operationsEarned premiums net of reinsurance 14 064 13 428 5 Fee and other income 135 110 23 Investment income 688 579 19 Profit on sale of subsidiary 1 – – Net fair value losses on financial assets (43) (39) 10
Income 14 845 14 078 5 Net claims paid (6 783) (6 888) (2)Fair value adjustment to investment contracts and insurance contract provisions (427) (414) 3 Fair value adjustment to financial liabilities (199) (204) (2)Acquisition, marketing and administration expenses (3 886) (3 768) 3
Profit before finance costs, share of after-tax results of associates and taxation 3 550 2 804 27 Net finance costs (414) (136) >100 Share of after-tax results of associates 1 702 1 524 12
Profit before taxation 4 838 4 192 15 Taxation (1 084) (893) 21
Profit for the year from continuing operations 3 754 3 299 14 Discontinued operation(Loss)/profit for the year from discontinued operation (49) 8 >(100)
Profit for the year 3 705 3 307 12
Attributable to:Equity holders of RMI 3 327 2 977 12 Non-controlling interests 378 330 15
Profit for the year 3 705 3 307 12
COMPUTATION OF HEADLINE EARNINGSfor the year ended 30 June
R million2017
Audited2016
Audited%
change
Earnings attributable to equity holders 3 327 2 977 12 Adjustment for: Intangible asset impairments 91 37 Loss/(profit) on dilution of shareholding 28 (26) Profit on sale of subsidiary (20) (29) Impairment of available-for-sale financial assets 9 3 Impairment of owner-occupied building to below cost 7 – Realised profit on sale of available-for-sale financial assets (2) (1) Loss/(profit) on disposal of property and equipment 1 (2) Release of foreign currency translation reserve – (23) Profit from business combination – (2)
Headline earnings attributable to equity holders 3 441 2 934 17
Headline earnings from continuing operations 3 480 2 927 19Headline earnings from discontinued operations (39) 7 >(100)
Headline earnings from continuing and discontinued operations 3 441 2 934 17
22
RMI
SUM
MAR
ISED
AUD
ITED
RES
ULTS
AN
NO
UNCE
MEN
T AN
D DI
VIDE
ND
DECL
ARAT
ION
FO
R TH
E YE
AR E
NDE
D 30
JUN
E 20
17
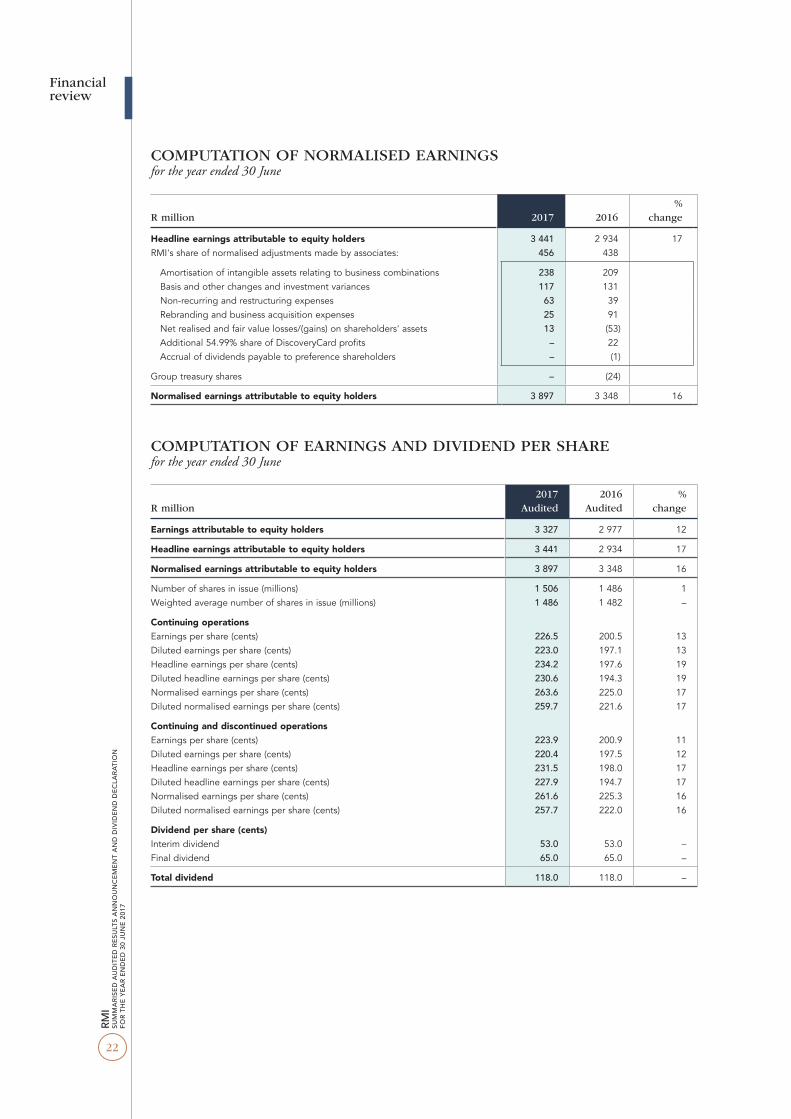
COMPUTATION OF NORMALISED EARNINGSfor the year ended 30 June
R million 2017 2016%
change
Headline earnings attributable to equity holders 3 441 2 934 17 RMI's share of normalised adjustments made by associates: 456 438
Amortisation of intangible assets relating to business combinations 238 209 Basis and other changes and investment variances 117 131 Non-recurring and restructuring expenses 63 39 Rebranding and business acquisition expenses 25 91 Net realised and fair value losses/(gains) on shareholders' assets 13 (53) Additional 54.99% share of DiscoveryCard profits – 22 Accrual of dividends payable to preference shareholders – (1)
Group treasury shares – (24)
Normalised earnings attributable to equity holders 3 897 3 348 16
COMPUTATION OF EARNINGS AND DIVIDEND PER SHAREfor the year ended 30 June
R million2017
Audited2016
Audited%
change
Earnings attributable to equity holders 3 327 2 977 12
Headline earnings attributable to equity holders 3 441 2 934 17
Normalised earnings attributable to equity holders 3 897 3 348 16
Number of shares in issue (millions) 1 506 1 486 1 Weighted average number of shares in issue (millions) 1 486 1 482 –
Continuing operationsEarnings per share (cents) 226.5 200.5 13 Diluted earnings per share (cents) 223.0 197.1 13 Headline earnings per share (cents) 234.2 197.6 19 Diluted headline earnings per share (cents) 230.6 194.3 19 Normalised earnings per share (cents) 263.6 225.0 17 Diluted normalised earnings per share (cents) 259.7 221.6 17
Continuing and discontinued operationsEarnings per share (cents) 223.9 200.9 11 Diluted earnings per share (cents) 220.4 197.5 12 Headline earnings per share (cents) 231.5 198.0 17 Diluted headline earnings per share (cents) 227.9 194.7 17 Normalised earnings per share (cents) 261.6 225.3 16 Diluted normalised earnings per share (cents) 257.7 222.0 16
Dividend per share (cents)Interim dividend 53.0 53.0 – Final dividend 65.0 65.0 –
Total dividend 118.0 118.0 –
Financial review
23
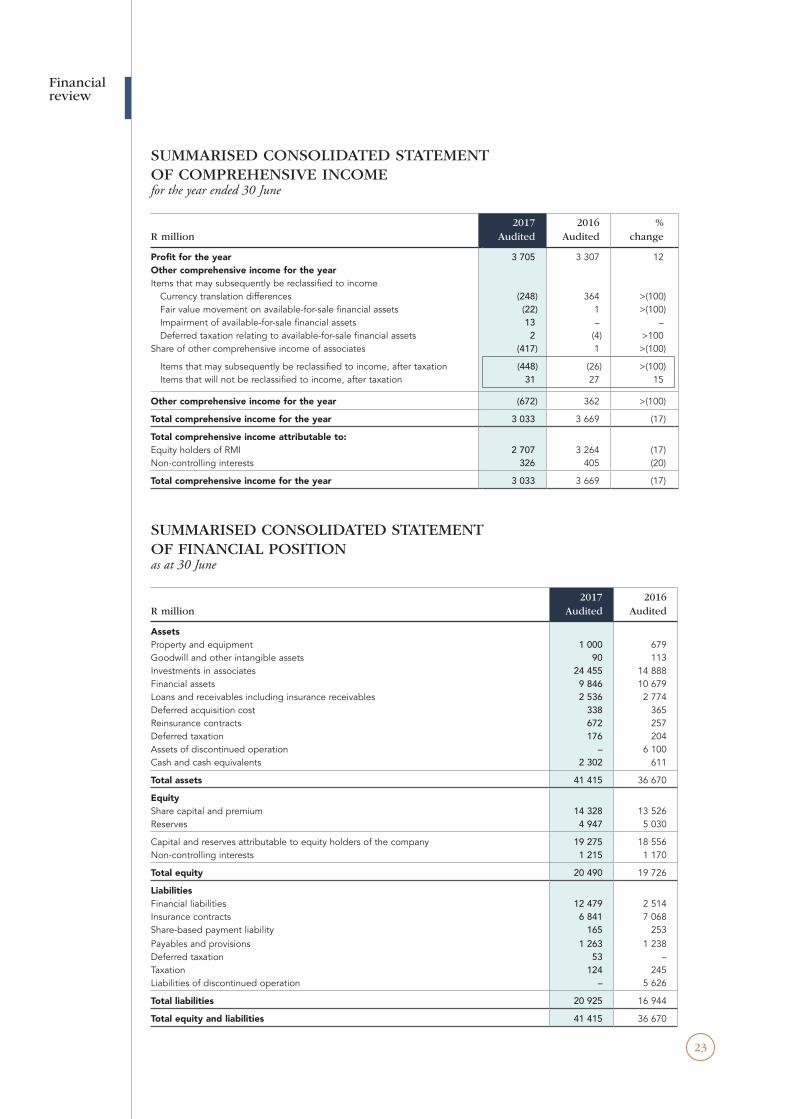
SUMMARISED CONSOLIDATED STATEMENT OF COMPREHENSIVE INCOMEfor the year ended 30 June
R million2017
Audited2016
Audited%
change
Profit for the year 3 705 3 307 12 Other comprehensive income for the yearItems that may subsequently be reclassified to income Currency translation differences (248) 364 >(100) Fair value movement on available-for-sale financial assets (22) 1 >(100) Impairment of available-for-sale financial assets 13 – – Deferred taxation relating to available-for-sale financial assets 2 (4) >100 Share of other comprehensive income of associates (417) 1 >(100)
Items that may subsequently be reclassified to income, after taxation (448) (26) >(100) Items that will not be reclassified to income, after taxation 31 27 15
Other comprehensive income for the year (672) 362 >(100)
Total comprehensive income for the year 3 033 3 669 (17)
Total comprehensive income attributable to:Equity holders of RMI 2 707 3 264 (17)Non-controlling interests 326 405 (20)
Total comprehensive income for the year 3 033 3 669 (17)
SUMMARISED CONSOLIDATED STATEMENT OF FINANCIAL POSITIONas at 30 June
R million2017
Audited2016
Audited
AssetsProperty and equipment 1 000 679 Goodwill and other intangible assets 90 113 Investments in associates 24 455 14 888 Financial assets 9 846 10 679 Loans and receivables including insurance receivables 2 536 2 774 Deferred acquisition cost 338 365 Reinsurance contracts 672 257 Deferred taxation 176 204 Assets of discontinued operation – 6 100 Cash and cash equivalents 2 302 611
Total assets 41 415 36 670
EquityShare capital and premium 14 328 13 526 Reserves 4 947 5 030
Capital and reserves attributable to equity holders of the company 19 275 18 556 Non-controlling interests 1 215 1 170
Total equity 20 490 19 726
LiabilitiesFinancial liabilities 12 479 2 514 Insurance contracts 6 841 7 068 Share-based payment liability 165 253 Payables and provisions 1 263 1 238 Deferred taxation 53 – Taxation 124 245 Liabilities of discontinued operation – 5 626
Total liabilities 20 925 16 944
Total equity and liabilities 41 415 36 670
Financial review

24
RMI
SUM
MAR
ISED
AUD
ITED
RES
ULTS
AN
NO
UNCE
MEN
T AN
D DI
VIDE
ND
DECL
ARAT
ION
FO
R TH
E YE
AR E
NDE
D 30
JUN
E 20
17
STATEMENT OF CHANGES IN EQUITY for the year ended 30 June
AuditedR million
Sharecapital and
premium
Equityaccounted
reserves
Transactions with non-
controllinginterests
Otherreserves
Retainedearnings
Non-controlling
interestsTotal
equity
Balance as at 1 July 2015 13 526 3 368 (2 017) 182 2 046 978 18 083 Profit per income statement – – – – 2 977 330 3 307 Other comprehensive income – 1 – 286 – 75 362 Dividend paid – – – – (1 738) (189) (1 927)Income of associates retained – 612 – – (612) – – BBBEE cost – 1 – – – – 1 Change in non-distributable
reserves – 1 – – – – 1 Movement in treasury shares – 11 – – – – 11 Transactions with non-controlling
interests – (55) (80) 20 25 (65) (155)Issue of share capital to non-
controlling interests by subsidiaries – – – – – 41 41
Share-based payment reserve – – – 5 (3) – 2
Balance as at 30 June 2016 13 526 3 939 (2 097) 493 2 695 1 170 19 726 Profit per income statement – – – – 3 327 378 3 705 Other comprehensive income – (417) – (203) – (52) (672)Dividend paid – – – – (1 753) (253) (2 006)Shares issued 760 – – – – – 760 Income of associates retained – 770 – – (770) – – BBBEE cost – 1 – – – – 1 Movement in treasury shares 37 6 – – 3 – 46 Transactions with non-controlling
interests – 1 (902) – 11 44 (846)Issue of share capital to non-
controlling interests by subsidiaries – – – – – 71 71
Share-based payment reserve – 3 – 5 (165) (23) (180)Sale of subsidiary 5 (3) 10 (7) (120) (115)
Balance as at 30 June 2017 14 328 4 300 (2 989) 295 3 341 1 215 20 490
Financial review
25
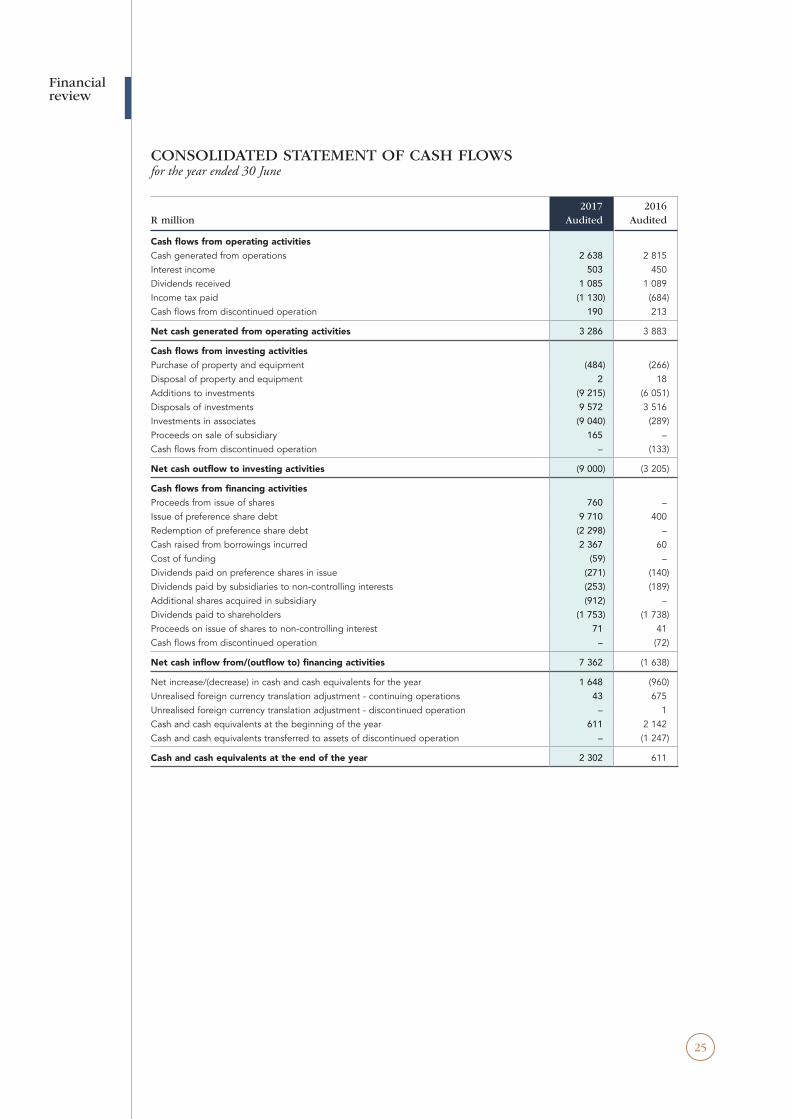
CONSOLIDATED STATEMENT OF CASH FLOWS for the year ended 30 June
R million2017
Audited2016
Audited
Cash flows from operating activitiesCash generated from operations 2 638 2 815 Interest income 503 450 Dividends received 1 085 1 089 Income tax paid (1 130) (684)Cash flows from discontinued operation 190 213
Net cash generated from operating activities 3 286 3 883
Cash flows from investing activitiesPurchase of property and equipment (484) (266)Disposal of property and equipment 2 18 Additions to investments (9 215) (6 051)Disposals of investments 9 572 3 516 Investments in associates (9 040) (289)Proceeds on sale of subsidiary 165 – Cash flows from discontinued operation – (133)
Net cash outflow to investing activities (9 000) (3 205)
Cash flows from financing activitiesProceeds from issue of shares 760 – Issue of preference share debt 9 710 400 Redemption of preference share debt (2 298) – Cash raised from borrowings incurred 2 367 60 Cost of funding (59) – Dividends paid on preference shares in issue (271) (140)Dividends paid by subsidiaries to non-controlling interests (253) (189)Additional shares acquired in subsidiary (912) – Dividends paid to shareholders (1 753) (1 738)Proceeds on issue of shares to non-controlling interest 71 41 Cash flows from discontinued operation – (72)
Net cash inflow from/(outflow to) financing activities 7 362 (1 638)
Net increase/(decrease) in cash and cash equivalents for the year 1 648 (960)Unrealised foreign currency translation adjustment - continuing operations 43 675 Unrealised foreign currency translation adjustment - discontinued operation – 1 Cash and cash equivalents at the beginning of the year 611 2 142 Cash and cash equivalents transferred to assets of discontinued operation – (1 247)
Cash and cash equivalents at the end of the year 2 302 611
Financial review
26
RMI
SUM
MAR
ISED
AUD
ITED
RES
ULTS
AN
NO
UNCE
MEN
T AN
D DI
VIDE
ND
DECL
ARAT
ION
FO
R TH
E YE
AR E
NDE
D 30
JUN
E 20
17
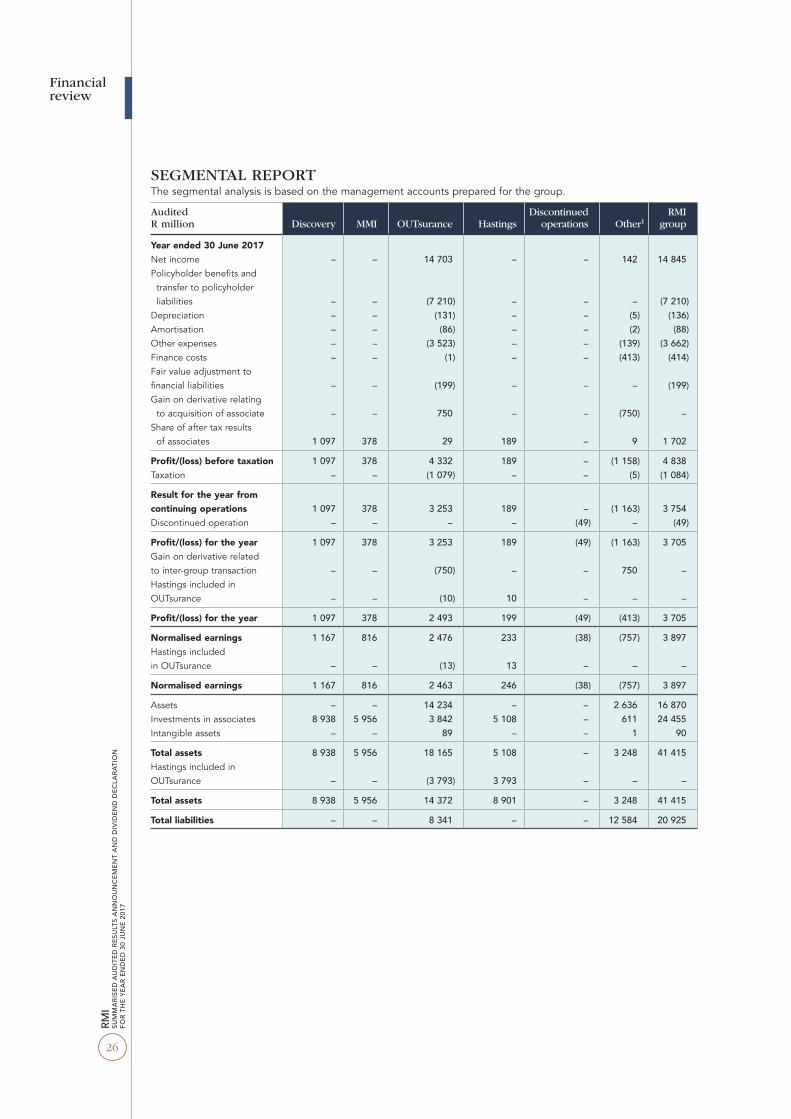
SEGMENTAL REPORTThe segmental analysis is based on the management accounts prepared for the group.
Audited R million Discovery MMI OUTsurance Hastings
Discontinued operations Other1
RMI group
Year ended 30 June 2017 Net income – – 14 703 – – 142 14 845 Policyholder benefits and
transfer to policyholder liabilities – – (7 210) – – – (7 210)
Depreciation – – (131) – – (5) (136)Amortisation – – (86) – – (2) (88)Other expenses – – (3 523) – – (139) (3 662)Finance costs – – (1) – – (413) (414)Fair value adjustment to financial liabilities – – (199) – – – (199)Gain on derivative relating
to acquisition of associate – – 750 – – (750) – Share of after tax results
of associates 1 097 378 29 189 – 9 1 702
Profit/(loss) before taxation 1 097 378 4 332 189 – (1 158) 4 838 Taxation – – (1 079) – – (5) (1 084)
Result for the year from continuing operations 1 097 378 3 253 189 – (1 163) 3 754 Discontinued operation – – – – (49) – (49)
Profit/(loss) for the year 1 097 378 3 253 189 (49) (1 163) 3 705 Gain on derivative related to inter-group transaction – – (750) – – 750 – Hastings included in OUTsurance – – (10) 10 – – –
Profit/(loss) for the year 1 097 378 2 493 199 (49) (413) 3 705
Normalised earnings 1 167 816 2 476 233 (38) (757) 3 897 Hastings included in OUTsurance – – (13) 13 – – –
Normalised earnings 1 167 816 2 463 246 (38) (757) 3 897
Assets – – 14 234 – – 2 636 16 870 Investments in associates 8 938 5 956 3 842 5 108 – 611 24 455 Intangible assets – – 89 – – 1 90
Total assets 8 938 5 956 18 165 5 108 – 3 248 41 415 Hastings included in OUTsurance – – (3 793) 3 793 – – –
Total assets 8 938 5 956 14 372 8 901 – 3 248 41 415
Total liabilities – – 8 341 – – 12 584 20 925
Financial review

27
Audited R million Discovery MMI OUTsurance
Discontinued operations Other1
RMI group
Year ended 30 June 2016 Net income – – 14 026 – 52 14 078 Policyholder benefits and
transfer to policyholder liabilities – – (7 302) – – (7 302)
Depreciation – – (118) – (4) (122)Amortisation – – (73) – – (73)Other expenses – – (3 431) – (142) (3 573)Finance costs – – – – (136) (136)Fair value adjustment to
financial liabilities – – (204) – – (204)Share of after tax results
of associates 949 555 15 – 5 1 524
Profit/(loss) before taxation 949 555 2 913 – (225) 4 192 Taxation – – (904) – 11 (893)
Result for the year from continuing operations 949 555 2 009 – (214) 3 299 Discontinued operation – – – 8 – 8
Profit/(loss) for the year 949 555 2 009 8 (214) 3 307
Normalised earnings 1 079 805 1 985 7 (528) 3 348
Assets – – 14 541 6 100 1 028 21 669 Investments in associates 8 517 6 210 39 – 122 14 888 Intangible assets – – 110 – 3 113
Total assets 8 517 6 210 14 690 6 100 1 153 36 670
Total liabilities - - 8 793 5 626 2 525 16 944
1 Other includes RMI, RMI Investment Managers, Truffle, Merchant Capital, Entersekt and consolidation entries.
Financial review
28
RMI
SUM
MAR
ISED
AUD
ITED
RES
ULTS
AN
NO
UNCE
MEN
T AN
D DI
VIDE
ND
DECL
ARAT
ION
FO
R TH
E YE
AR E
NDE
D 30
JUN
E 20
17
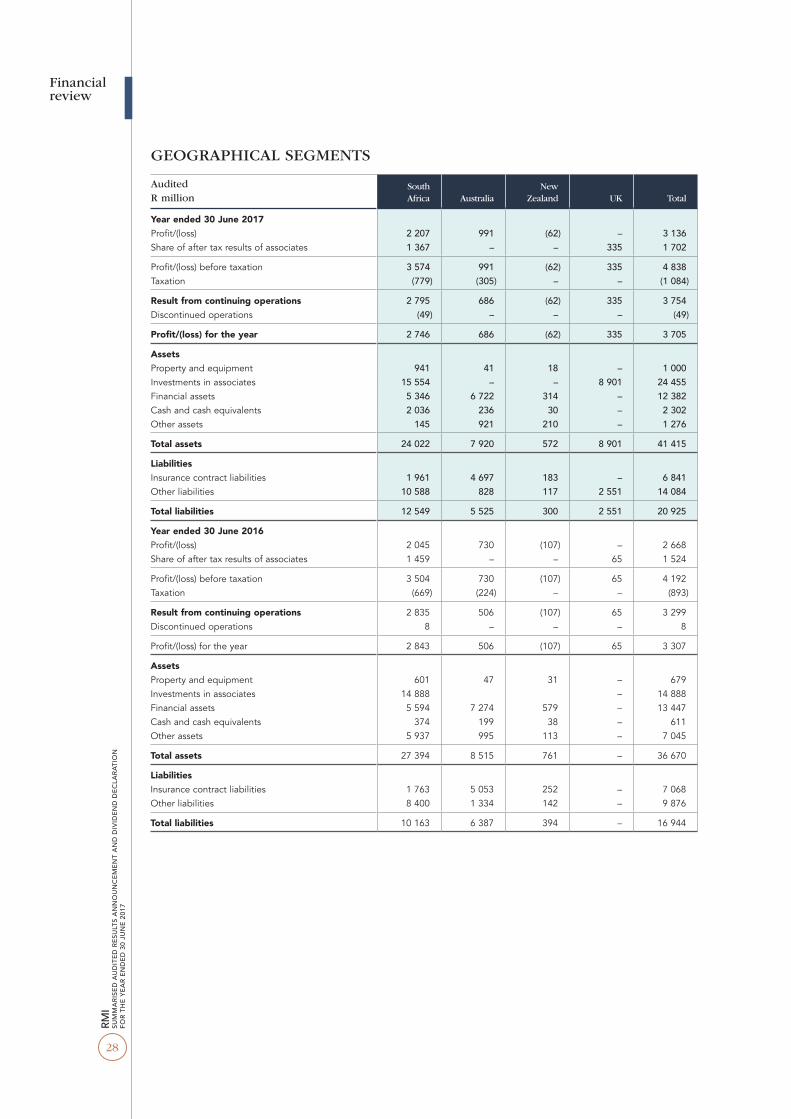
GEOGRAPHICAL SEGMENTS
AuditedR million
South Africa Australia
New Zealand UK Total
Year ended 30 June 2017 Profit/(loss) 2 207 991 (62) – 3 136 Share of after tax results of associates 1 367 – – 335 1 702
Profit/(loss) before taxation 3 574 991 (62) 335 4 838 Taxation (779) (305) – – (1 084)
Result from continuing operations 2 795 686 (62) 335 3 754 Discontinued operations (49) – – – (49)
Profit/(loss) for the year 2 746 686 (62) 335 3 705
Assets Property and equipment 941 41 18 – 1 000 Investments in associates 15 554 – – 8 901 24 455 Financial assets 5 346 6 722 314 – 12 382 Cash and cash equivalents 2 036 236 30 – 2 302 Other assets 145 921 210 – 1 276
Total assets 24 022 7 920 572 8 901 41 415
Liabilities Insurance contract liabilities 1 961 4 697 183 – 6 841 Other liabilities 10 588 828 117 2 551 14 084
Total liabilities 12 549 5 525 300 2 551 20 925
Year ended 30 June 2016 Profit/(loss) 2 045 730 (107) – 2 668 Share of after tax results of associates 1 459 – – 65 1 524
Profit/(loss) before taxation 3 504 730 (107) 65 4 192 Taxation (669) (224) – – (893)
Result from continuing operations 2 835 506 (107) 65 3 299 Discontinued operations 8 – – – 8
Profit/(loss) for the year 2 843 506 (107) 65 3 307
Assets Property and equipment 601 47 31 – 679 Investments in associates 14 888 – 14 888 Financial assets 5 594 7 274 579 – 13 447 Cash and cash equivalents 374 199 38 – 611 Other assets 5 937 995 113 – 7 045
Total assets 27 394 8 515 761 – 36 670
Liabilities Insurance contract liabilities 1 763 5 053 252 – 7 068 Other liabilities 8 400 1 334 142 – 9 876
Total liabilities 10 163 6 387 394 – 16 944
Financial review
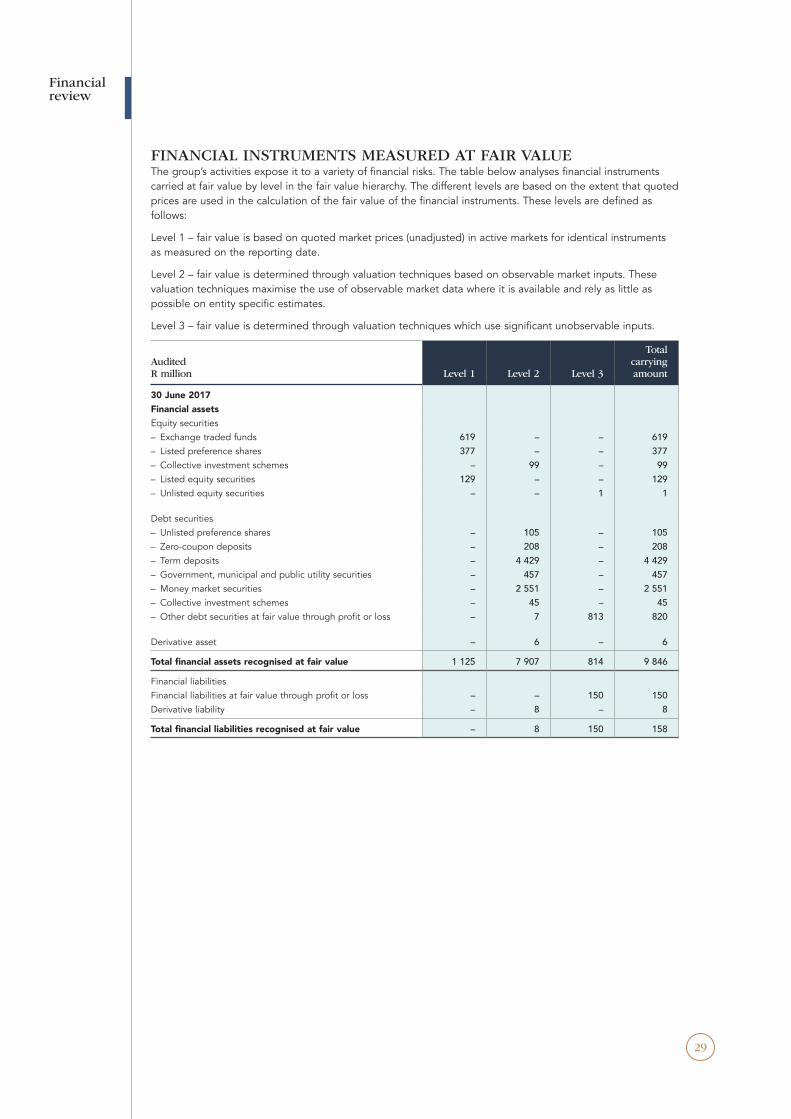
29
FINANCIAL INSTRUMENTS MEASURED AT FAIR VALUEThe group’s activities expose it to a variety of financial risks. The table below analyses financial instruments carried at fair value by level in the fair value hierarchy. The different levels are based on the extent that quoted prices are used in the calculation of the fair value of the financial instruments. These levels are defined as follows:
Level 1 – fair value is based on quoted market prices (unadjusted) in active markets for identical instruments as measured on the reporting date.
Level 2 – fair value is determined through valuation techniques based on observable market inputs. These valuation techniques maximise the use of observable market data where it is available and rely as little as possible on entity specific estimates.
Level 3 – fair value is determined through valuation techniques which use significant unobservable inputs.
Audited R million Level 1 Level 2 Level 3
Total carrying amount
30 June 2017 Financial assets Equity securities – Exchange traded funds 619 – – 619 – Listed preference shares 377 – – 377 – Collective investment schemes – 99 – 99 – Listed equity securities 129 – – 129 – Unlisted equity securities – – 1 1
Debt securities – Unlisted preference shares – 105 – 105 – Zero-coupon deposits – 208 – 208 – Term deposits – 4 429 – 4 429 – Government, municipal and public utility securities – 457 – 457 – Money market securities – 2 551 – 2 551 – Collective investment schemes – 45 – 45 – Other debt securities at fair value through profit or loss – 7 813 820
Derivative asset – 6 – 6
Total financial assets recognised at fair value 1 125 7 907 814 9 846
Financial liabilities Financial liabilities at fair value through profit or loss – – 150 150 Derivative liability – 8 – 8
Total financial liabilities recognised at fair value – 8 150 158
Financial review
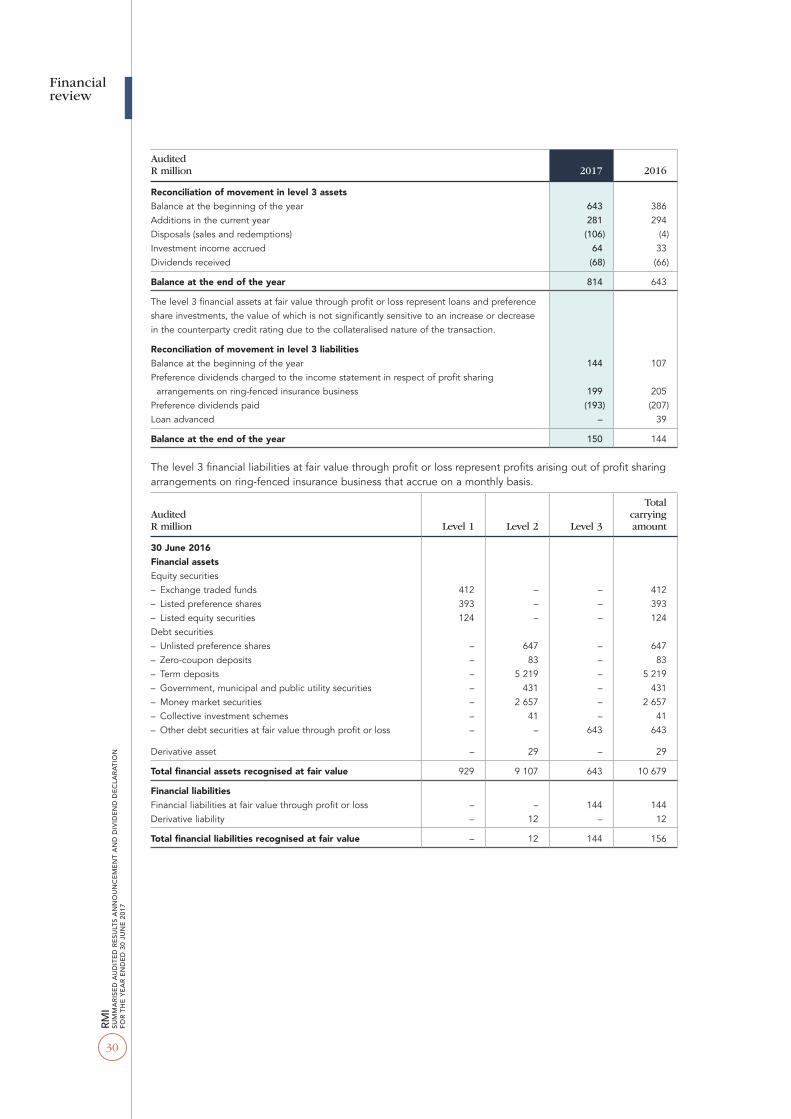
30
RMI
SUM
MAR
ISED
AUD
ITED
RES
ULTS
AN
NO
UNCE
MEN
T AN
D DI
VIDE
ND
DECL
ARAT
ION
FO
R TH
E YE
AR E
NDE
D 30
JUN
E 20
17
Financial review
Audited R million 2017 2016
Reconciliation of movement in level 3 assets Balance at the beginning of the year 643 386 Additions in the current year 281 294 Disposals (sales and redemptions) (106) (4)Investment income accrued 64 33 Dividends received (68) (66)
Balance at the end of the year 814 643
The level 3 financial assets at fair value through profit or loss represent loans and preference share investments, the value of which is not significantly sensitive to an increase or decrease in the counterparty credit rating due to the collateralised nature of the transaction.
Reconciliation of movement in level 3 liabilities Balance at the beginning of the year 144 107 Preference dividends charged to the income statement in respect of profit sharing
arrangements on ring-fenced insurance business 199 205 Preference dividends paid (193) (207)Loan advanced – 39
Balance at the end of the year 150 144
The level 3 financial liabilities at fair value through profit or loss represent profits arising out of profit sharing arrangements on ring-fenced insurance business that accrue on a monthly basis.
Audited R million Level 1 Level 2 Level 3
Total carrying amount
30 June 2016 Financial assets Equity securities – Exchange traded funds 412 – – 412 – Listed preference shares 393 – – 393 – Listed equity securities 124 – – 124 Debt securities – Unlisted preference shares – 647 – 647 – Zero-coupon deposits – 83 – 83 – Term deposits – 5 219 – 5 219 – Government, municipal and public utility securities – 431 – 431 – Money market securities – 2 657 – 2 657 – Collective investment schemes – 41 – 41 – Other debt securities at fair value through profit or loss – – 643 643
Derivative asset – 29 – 29
Total financial assets recognised at fair value 929 9 107 643 10 679
Financial liabilities Financial liabilities at fair value through profit or loss – – 144 144 Derivative liability – 12 – 12
Total financial liabilities recognised at fair value – 12 144 156
31
Financial review
The fair values of the above instruments were determined as follows:
LEVEL 1The fair value of financial instruments traded in an active market is based on quoted market prices at the statement of financial position date. A market is regarded as active if quoted prices are readily and regularly available from an exchange, dealer, broker, industry group, pricing service or regulatory agency and those prices represent actual and regularly occurring market transactions on an arm’s length basis.
The listed preference share investments comprise instruments which are listed on a securities exchange. The fair values of these investments are calculated based on the quoted closing prices of the individual investments on the reporting date. These instruments are included in Level 1 and comprise mainly equity and debt instruments classified as trading securities. The investment in the exchange traded funds track the performance of the top forty and top fifty companies listed on the JSE.
LEVEL 2The fair value of financial instruments that are not traded in an active market is determined by using valuation techniques. These valuation techniques maximise the use of observable market data where it is available and rely as little as possible on entity specific estimates. If all significant inputs required to fair value an instrument are market observable, the instrument is included in Level 2.
Level 2 instruments comprise derivative, debt and short-term money market instruments where the value is determined by using market observable input, e.g. JIBAR, prime rate, foreign currency rates, listed bond rates of similar instruments, without significant adjustments.
The unlisted preference shares are redeemable with a notice period of one year. Dividend yields are 65% of the prime overdraft rate. The fair value of the preference shares with a maturity date of longer than one year is calculated on a discounted cash flow basis with the discount rate adjusted for changes in credit risk of the ultimate counterparty. Due to the redeemable nature, the preference shares are deemed to be debt securities.
The fair value of money market instruments and government, municipal and public utility securities is determined based on observable market inputs. These instruments consist of fixed and floating rate notes held in segregated portfolios. These instruments are typically listed on the Bond Exchange of South Africa (BESA). Instruments listed on BESA are not as actively traded as Level 1 instruments. Despite this, the fair values of these instruments can be readily determined as the inputs utilised in the fair value calculation are available in the open market and on the coupon face at issue date.
Zero-coupon deposits are not traded actively during a financial reporting period and are classified as Level 2 financial instruments. Fair value is determined based on a discounted cash flow valuation.
The group uses zero-coupon deposits to offset the interest rate risk inherent in some of the life insurance products underwritten by OUTsurance Life. The counterparties to these deposits are the large South African banks. The zero-coupon deposits have been structured to allow for the payment of the notional initial deposit to be spread over the specified term to enable cash flow matching. The maturity dates of the accreting zero-coupon deposits are long-term, with maturity dates at the various trading dates not exceeding 15 years. The fair values of the accreting zero-coupon deposits are determined monthly based on observable market inputs. To determine the fair values of the accreting zero-coupon deposits, a risk-free swap yield curve produced every business day by the JSE is referenced. The instruments are designated at fair value through profit or loss, with both the interest accrual and fair value accounted for in profit or loss.
LEVEL 3If one or more of the significant inputs are not based on observable market data, the instrument is included in Level 3. The financial instruments at fair value through profit or loss represent profits arising out of the profit sharing arrangements that accrue on a monthly basis and which are distributed as preference dividends bi-annually to the FirstRand Limited Group. The only significant unobservable input in the calculation of the preference dividend is the historic profit of the profit sharing arrangements and there are no other inputs that determine the value of these instruments. Should the profit of the profit sharing arrangement increase or decrease, the preference dividend will increase or decrease in direct proportion.
A specific valuation technique is used to value this Level 3 financial instrument which represents an accrued profit related to the FirstRand Limited Homeowners profit sharing arrangement:
The fair value is determined based on valuation techniques where the input is determined by management, e.g. profits arising out of profit sharing arrangements, and is not readily available in the market or where market observable input is significantly adjusted.
Inputs are determined by the profits arising and calculations are made in accordance with the profit share percentages, stipulated within the profit sharing arrangement. No assumptions or adjustments or any other inputs are made to the profits before or after distribution. Distribution of the profits arising are made in the form of preference dividends.
32
RMI
SUM
MAR
ISED
AUD
ITED
RES
ULTS
AN
NO
UNCE
MEN
T AN
D DI
VIDE
ND
DECL
ARAT
ION
FO
R TH
E YE
AR E
NDE
D 30
JUN
E 20
17
Independent auditor’s report on the summarised consolidated financial statements To the shareholders of RMI
OPINION
The summarised consolidated financial statements of RMI, set out on pages 20 to 31, indicated as such and contained in the accompanying summarised audited results announcements, which comprise the summarised consolidated statement of financial position as at 30 June 2017, the consolidated income statement and statements of other comprehensive income, changes in equity and cash flows for the year then ended, and related notes, are derived from the audited consolidated financial statements of RMI for the year ended 30 June 2017.
In our opinion, the accompanying summarised consolidated financial statements are consistent, in all material respects, with the audited consolidated financial statements of RMI, in accordance with the requirements of the JSE Listings Requirements for the summarised financial statements, set out in the basis of presentation to the summarised consolidated financial statements, and the requirements of the Companies Act of South Africa as applicable to summarised financial statements.
SUMMARISED CONSOLIDATED FINANCIAL STATEMENTS
The summarised consolidated financial statements do not contain all the disclosures required by the International Financial Reporting Standards and the requirements of the Companies Act of South Africa as applicable to annual financial statements. Reading the summarised consolidated financial statements and the auditor’s report thereon, therefore, is not a substitute for reading the audited consolidated financial statements of RMI and the auditor’s report thereon.
THE AUDITED CONSOLIDATED FINANCIAL STATEMENTS AND OUR REPORT THEREON
We expressed an unmodified audit opinion on the audited consolidated financial statements in our report dated 19 September 2017. That report also includes the communication of other key audit matters as reported in the auditor’s report of the audited financial statements. Key audit matters are those matters that, in our professional judgement, were of most significance in our audit of the consolidated financial statements of the current period.
DIRECTORS’ RESPONSIBILITY FOR THE SUMMARISED CONSOLIDATED FINANCIAL STATEMENTS
The directors are responsible for the preparation of the summarised consolidated financial statements in accordance with the requirements of the JSE Listings Requirements for the summarised financial statements, set out in the basis of presentation to the summarised consolidated financial statements, and the requirements of the Companies Act of South Africa as applicable to summarised financial statements.
AUDITOR’S RESPONSIBILITY
Our responsibility is to express an opinion on whether the summarised consolidated financial statements are consistent, in all material respects, with the consolidated audited financial statements based on our procedures, which were conducted in accordance with International Standard on Auditing (ISA) 810 (Revised), Engagements to Report on Summary Financial Statements.
PricewaterhouseCoopers Inc.
Director: Francois PrinslooRegistered Auditor
Johannesburg19 September 2017
Financial review
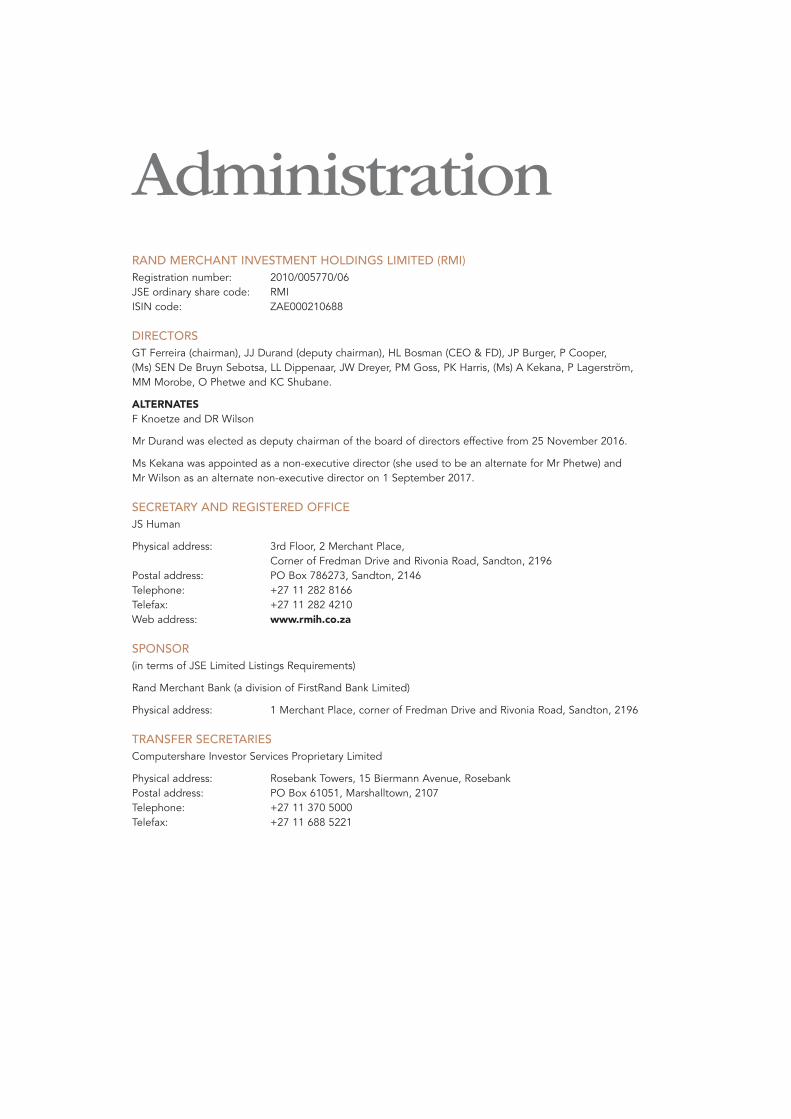
RAND MERCHANT INVESTMENT HOLDINGS LIMITED (RMI)Registration number: 2010/005770/06JSE ordinary share code: RMIISIN code: ZAE000210688
DIRECTORSGT Ferreira (chairman), JJ Durand (deputy chairman), HL Bosman (CEO & FD), JP Burger, P Cooper, (Ms) SEN De Bruyn Sebotsa, LL Dippenaar, JW Dreyer, PM Goss, PK Harris, (Ms) A Kekana, P Lagerström, MM Morobe, O Phetwe and KC Shubane.
ALTERNATESF Knoetze and DR Wilson
Mr Durand was elected as deputy chairman of the board of directors effective from 25 November 2016.
Ms Kekana was appointed as a non-executive director (she used to be an alternate for Mr Phetwe) and Mr Wilson as an alternate non-executive director on 1 September 2017.
SECRETARY AND REGISTERED OFFICEJS Human
Physical address: 3rd Floor, 2 Merchant Place, Corner of Fredman Drive and Rivonia Road, Sandton, 2196
Postal address: PO Box 786273, Sandton, 2146Telephone: +27 11 282 8166Telefax: +27 11 282 4210Web address: www.rmih.co.za
SPONSOR(in terms of JSE Limited Listings Requirements)
Rand Merchant Bank (a division of FirstRand Bank Limited)
Physical address: 1 Merchant Place, corner of Fredman Drive and Rivonia Road, Sandton, 2196
TRANSFER SECRETARIESComputershare Investor Services Proprietary Limited
Physical address: Rosebank Towers, 15 Biermann Avenue, RosebankPostal address: PO Box 61051, Marshalltown, 2107Telephone: +27 11 370 5000Telefax: +27 11 688 5221
Administration

www.rmih.co.za