Sumitomo Chemical Annual Report 2017 · 82 Annual Report 2017 ... result, the segment’s sales...
15
82 Financial Review 88 Consolidated Financial Statements 94 Corporate and Investor Information Corporate Data Besshi Copper Mine (Niihama, Ehime Prefecture) The Besshi Copper Mine, opened in 1691, supported the foundations of Sumitomo’s business. Sumitomo Chemical’s origins are also here. These heavy brick remains were once the storage facility for a tramway that transported ore as well as everyday items to the people working in the mine. 81
Transcript of Sumitomo Chemical Annual Report 2017 · 82 Annual Report 2017 ... result, the segment’s sales...

82 Financial Review
88 Consolidated Financial Statements
94 Corporate and Investor Information
Corporate Data
Besshi Copper Mine (Niihama, Ehime Prefecture)The Besshi Copper Mine, opened in 1691, supported the foundations of Sumitomo’s business. Sumitomo Chemical’s origins are also here. These heavy brick remains were once the storage facility for a tramway that transported ore as well as everyday items to the people working in the mine.
81

1 Results of Operations
(1) Net sales and operating incomeNet sales in the fiscal year ended March 31, 2017 totaled ¥1,954.3 billion (US$17,419 million), a 7.0% decrease from ¥2,101.8 billion for the previous fiscal year. Although the shipments of products increased in the IT-related Chemicals Segment and Pharmaceuticals Segment, the stronger yen had a negative effect on sales from overseas subsidiaries in yen terms and selling prices declined. Revenue from overseas operations, including both sales by overseas subsidiaries and exports from Japan, for the fiscal year ended March 31, 2017 was ¥1,186.7 billion (US$10,578 million). The ratio of revenue from overseas operations to net sales was 60.7%, compared with 61.3% for the previous fiscal year. Cost of sales was ¥1,285.8 billion (US$11,461 million), com-pared with ¥1,404.8 billion for the previous fiscal year. The gross margin ratio was 34.2%, 1.0 percentage points higher than the previous fiscal year. Selling, general and administrative expenses were ¥534.2 billion (US$4,761 million), compared with ¥532.5 billion for the previous fiscal year. Research and development expenses for the fiscal year
ended March 31, 2017 were ¥157.6 billion (US$1,405 million), 1.2% higher than the previous fiscal year’s ¥155.8 billion. Annual depreciation and amortization expenses were ¥110.3 billion (US$983 million), a decrease of 5.4% compared with the previ-ous fiscal year’s ¥116.6 billion. Consequently, operating income was ¥134.3 billion (US$1,197 million), an 18.3% decrease from ¥164.4 billion for the previous fiscal year. The ratio of operating income to net sales was 6.9%, a decline of 1.0 percentage points from the previous fiscal year.
(2) Non-operating expenses and net income Interest expenses, net of interest and dividend income, were ¥1.6 billion (US$14.6 million), a 38.1% decrease compared with ¥2.7 billion for the previous fiscal year. Equity in earnings of affiliates was ¥41.2 billion (US$367 million), a ¥21.0 billion increase from the previous fiscal year. Earnings of Petrochemical Corporation of Singapore remained strong. Earnings of Rabigh Refining and Petrochemical Company, which deteriorated in the previous fiscal year due to periodic plant maintenance, improved in the fiscal year ended March 31, 2017 due chiefly to increased shipments after
Change in Operating Income: FY2015 vs. FY2016
Net Sales Breakdown of Sales by Business Segment
2,500
1,000
500
0
1,500
2,000
’13/3 ’17/3’16/3’15/3’14/3
1,952.52,243.8
2,376.72,101.8
1,954.3
(Billions of yen)
■ Basic Chemicals ■ Petrochemicals & Plastics ■ Energy & Functional Materials ■ IT-related Chemicals ■ Health & Crop Sciences ■ Pharmaceuticals ■ Others
2,500
1,000
500
0
1,500
2,000
’13/3 ’17/3’16/3’15/3’14/3
1,952.52,243.8
2,376.72,101.8
1,954.3
(Billions of yen)
Operating Income
200
80
40
0
120
160
’13/3 ’17/3’16/3’15/3’14/3
45.0
100.8
127.3
164.4
134.3
(Billions of yen)180
120
60
0
Volumes & others+33.9
164.4
134.3
Fixed costs-13.0
Margins-51.0
(Billions of yen)
FY2016FY2015
Annual Report 201782
Financial Review

periodic plant maintenance. The Companies recorded a ¥27.3 billion (US$243 million) gain on sale of investment securities, a ¥3.4 billion (US$30 mil-lion) gain on step acquisitions, and a ¥1.0 billion (US$9 million) gain on sale of property, plant and equipment. The Companies posted a ¥34.3 billion (US$305 million) impairment loss mainly on production facilities with decreased profitability and an ¥18.9 billion (US$168 million) loss for restructuring charges mainly on improving the business structure and organization in subsidiaries. As a result, income before income taxes and non-controlling interests for the fiscal year ended March 31, 2017 was ¥145.2 billion (US$1,294 million). Income taxes for the fiscal year ended March 31, 2017 were ¥28.1 billion (US$251 million). Net income attributable to owners of the parent for the fiscal year ended March 31, 2017 was ¥85.5 billion (US$762 million), an increase of ¥4.0 billion over the ¥81.5 billion recorded in the previous fiscal year. Return on Equity (ROE) was 10.8%, up 0.3 percentage points from the previous fiscal year’s 10.5%. Net income per share, based on the weighted average num-ber of shares outstanding during the fiscal year ended March 31, 2017, was ¥52.31 (US$0.466), compared with ¥49.84 for the
previous fiscal year.
(3) DividendsThe Company paid a year-end dividend of ¥7 per share, which, when combined with the interim dividend of ¥7 per share, makes an annual dividend of ¥14 per share for the fiscal year ended March 31, 2017, unchanged from the previous fiscal year.
2 Segment Information
(1) Petrochemicals & PlasticsMarket prices of petrochemical products and synthetic resins declined because of lower feedstock prices. Shipments of petrochemical products decreased due to the restructuring of the petrochemical business at the Chiba Works. The stronger yen had a negative effect on sales from overseas subsidiaries in yen terms. As a result, the segment’s sales decreased by ¥85.1 billion (US$758 million) compared with the previous fiscal year, to ¥572.0 billion (US$5,099 million). Operating income declined by ¥2.2 billion (US$19 million), to ¥26.6 billion (US$237 million).
Results by Business Segment
Fiscal years ended March 31, 2017 and 2016(Millions of yen)
Petrochemicals & Plastics
Energy & Functional Materials
IT-related Chemicals
Health & Crop Sciences Pharmaceuticals Others
Adjustments & Elimination Consolidated
Year ended March 31, 2017Revenue from customers ¥572,017 ¥205,934 ¥358,426 ¥319,271 ¥444,189 ¥54,446 ¥ — ¥1,954,283Segment profit 26,604 7,199 10,325 46,154 55,099 5,705 (16,750) 134,336 Segment profit ratio (%) 4.7 3.5 2.9 14.5 12.4 10.5 — 6.9 Segment profit growth (%) (7.5) 156.3 (48.0) (40.5) 29.1 (27.1) — (18.3)
Year ended March 31, 2016Revenue from customers ¥657,093 ¥209,007 ¥384,532 ¥359,013 ¥435,478 ¥56,641 ¥ — ¥2,101,764Segment profit 28,767 2,809 19,874 77,518 42,686 7,830 (15,038) 164,446 Segment profit ratio (%) 4.4 1.3 5.2 21.6 9.8 13.8 — 7.8
Petrochemicals & PlasticsChange in Operating Income: FY2015 vs. FY2016
Energy & Functional MaterialsChange in Operating Income: FY2015 vs. FY2016
45
15
0
30
Volumes & others-7.2
28.8 26.6Fixed costs-4.0
Margins+9.0
(Billions of yen)
FY2016FY2015
8
2
0
4
6
Volumes & others+3.9
2.8
7.2
Fixed costs0
Margins+0.5
(Billions of yen)
FY2016FY2015
Corporate Data
Annual Report 2017 83

(2) Energy & Functional MaterialsSelling prices of aluminum declined due chiefly to the stronger yen. Shipments of resorcinol, a raw material for adhesives, and engineering plastics increased due to a rise in demand. As a result, the segment’s sales decreased by ¥3.1 billion (US$27 million) compared with the previous fiscal year, to ¥205.9 billion (US$1,836 million). Operating income increased by ¥4.4 billion (US$39 million), to ¥7.2 billion (US$64 million).
(3) IT-related ChemicalsSelling prices of polarizing film dropped. Selling prices of touchscreen panels also declined, but shipments increased due to growth in demand. The stronger yen had a negative effect on sales from overseas subsidiaries in yen terms. As a result, the segment’s sales decreased by ¥26.1 billion (US$233 million) compared with the previous fiscal year, to ¥358.4 billion (US$3,195 million). Operating income declined by ¥9.5 billion (US$85 million), to ¥10.3 billion (US$92 million).
(4) Health & Crop SciencesSales of the feed additive methionine dropped due to lower market prices. The stronger yen had a negative effect on sales.
As a result, the segment’s sales decreased by ¥39.7 billion (US$354 million) compared with the previous fiscal year, to ¥319.3 billion (US$2,846 million). Operating income declined by ¥31.4 billion (US$280 million), to ¥46.2 billion (US$411 million).
(5) PharmaceuticalsIn Japan, although sales of Aimix® (anti-hypertension drug), Trerief ® (therapeutic agent for Parkinson’s disease) and other drugs increased, overall sales declined due largely to the impacts of Japanese National Health Insurance drug price revisions and a decrease in shipments of patent-expired originator drugs. In North America, sales of Latuda® (atypical antipsychotic) and other drugs increased steadily. The stronger yen had a negative effect on sales from overseas subsidiaries in yen terms. The segment’s sales increased by ¥8.7 billion (US$78 million) compared with the previous fiscal year, to ¥444.2 billion (US$3,959 million). Operating income rose by ¥12.4 billion (US$111 million), to ¥55.1 billion (US$491 million), due to the expansion of sales in North America.
(6) OthersIn addition to the above five segments, the Sumitomo Chemical
Pharmaceuticals Change in Operating Income: FY2015 vs. FY2016
Others Change in Operating Income: FY2015 vs. FY2016
IT-related Chemicals Change in Operating Income: FY2015 vs. FY2016
Health & Crop Sciences Change in Operating Income: FY2015 vs. FY2016
60
0
40
20
Volumes & others+37.9
42.7
55.1
Fixed costs-18.5
Margins-7.0
(Billions of yen)
FY2016FY2015
10.0
5.0
2.5
0
7.5
Volumes & others-2.1
7.8
5.7
Fixed costs0
Margins0
(Billions of yen)
FY2016FY2015
20
0
-20
10
-10
Volumes & others+8.0
19.9
10.3Fixed costs
+17.5
Margins-35.0
(Billions of yen)
FY2016FY2015
80
0
40
60
20
Volumes & others-4.4
77.5
Fixed costs-8.5
Margins-18.5 46.2
(Billions of yen)
FY2016FY2015
Annual Report 201784

Group engages in supplying electrical power and steam, pro-viding services for the design, engineering, and construction management of chemical plants, providing transport and warehousing, and conducting materials and environmental analysis. The segment’s sales decreased by ¥2.2 billion (US$20 million) compared with the previous fiscal year, to ¥54.4 billion (US$485 million). Operating income declined by ¥2.1 billion (US$19 million), to ¥5.7 billion (US$51 million).
3 Financial Position
Total assets as of March 31, 2017 increased by ¥199.9 billion, to ¥2,862.1 billion (US$25,511 million) from ¥2,662.2 billion as of March 31, 2016. Current assets as of March 31, 2017 amounted to ¥1,231.1 billion (US$10,974 million), a 3.6% increase from ¥1,187.9 billion as of March 31, 2016. Non-current assets as of March 31, 2017 amounted to ¥1,630.9 billion (US$14,537 million), a 10.6% increase from ¥1,474.2 billion as of March 31, 2016, due mainly to an increase of intangible assets as a result of the acquisition of Tolero Pharmaceuticals Inc. and Cynapsus Therapeutics Inc. (the present Sunovion CNS Development Canada ULC) by Sumitomo Dainippon Pharma, a subsidiary of Sumitomo Chemical. Current liabilities as of March 31, 2017 were ¥906.7 billion (US$8,082 million), a 14.9% increase from ¥789.4 billion as of March 31, 2016. The current ratio was 135.8%, compared with 150.5% as of March 31, 2016. Long-term liabilities as of March 31, 2017 were ¥792.8 billion (US$7,067 million), a 1.4% increase from ¥781.9 billion as of March 31, 2016.
Total Current Assets
Total Assets
1,500
600
300
0
900
1,200
’13/3 ’17/3’16/3’15/3’14/3
1,108.81,242.5 1,260.9
1,187.9 1,231.1
(Billions of yen)
3,000
1,200
600
0
1,800
2,400
’13/3 ’17/3’16/3’15/3’14/3
2,472.12,788.5 2,880.4
2,662.22,862.1
(Billions of yen)
Net Assets
Interest-bearing Liabilities / D/E Ratio
1,500
600
300
0
900
1,200
1.5
0.6
0.3
0
0.9
1.2
’13/3 ’17/3’16/3’15/3’14/3
1,060.61,074.6
980.2831.5 875.3
(Times)(Billions of yen)
■ ■ Interest-bearing liabilities (left axis) D/E ratio (right axis)
1.4
1.1
0.9 0.8 0.8
1,200
600
300
0
900
’13/3 ’17/3’16/3’15/3’14/3
747.5
934.5
1,118.2 1,090.81,162.5
(Billions of yen)
Corporate Data
Annual Report 2017 85

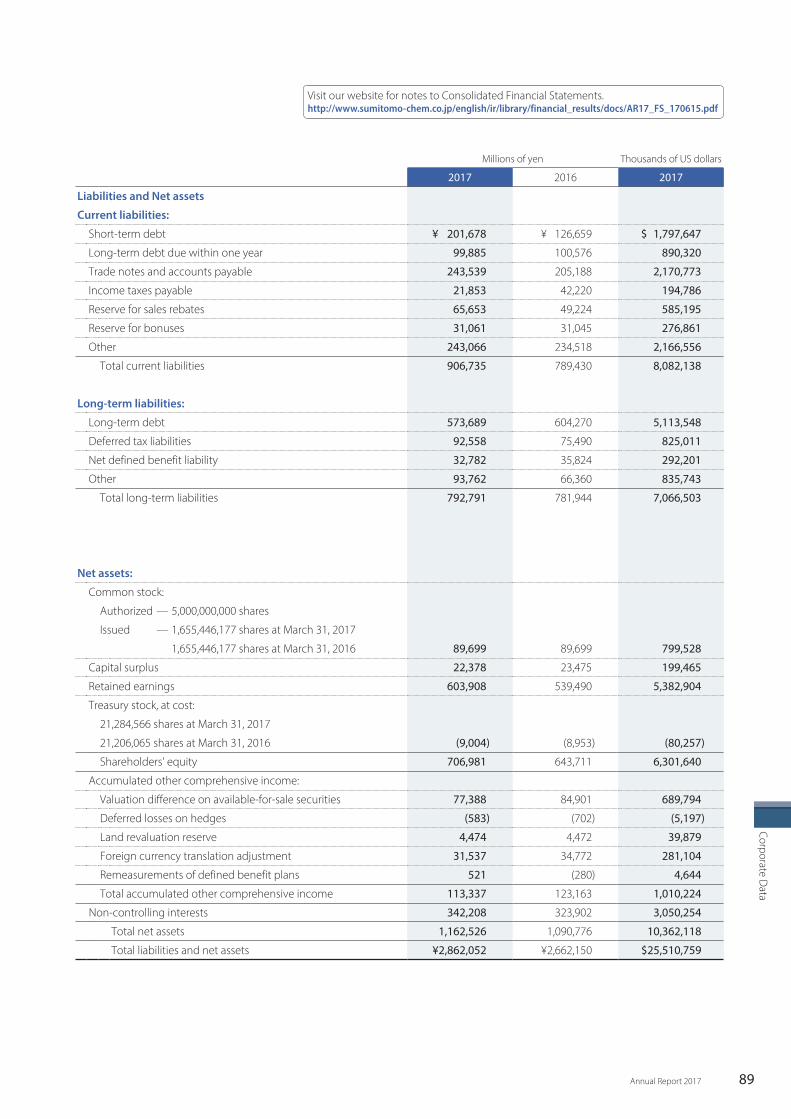
Interest-bearing liabilities (short-term and long-term bank loans, corporate bonds, and commercial paper) as of March 31, 2017 amounted to ¥875.3 billion (US$7,802 million), compared with ¥831.5 billion as of March 31, 2016. Net assets were ¥1,162.5 billion (US$10,362 million) as of March 31, 2017, a 6.6% increase from ¥1,090.8 billion as of March 31, 2016, mainly because retained earnings increased. The ratio of net worth to total assets stood at 28.7% as of March 31, 2017, compared with 28.8% as of March 31, 2016. There were 1,634,161,611 shares issued and outstanding as of March 31, 2017. Retained earnings amounted to ¥603.9 billion (US$5,383 million), an 11.9% increase from ¥539.5 billion as of March 31, 2016.
4 Cash Flows
Net cash provided by operating activities for the year ended March 31, 2017 was ¥187.4 billion (US$1,671 million), a decrease of ¥73.7 billion compared with the previous fiscal year, due chiefly to a decline in operating income and an increase in income taxes paid. Net cash used in investing activities for the year ended March 31, 2017 was ¥199.7 billion (US$1,780 million), an increase in cash outflows of ¥146.1 billion compared with the previous fiscal year, due mainly to the acquisition of Cynapsus Therapeutics Inc. (the present Sunovion CNS Development Canada ULC) and Tolero Pharmaceuticals Inc. by Sumitomo Dainippon Pharma. As a result, free cash flow, which consists of cash flows provided by operating activities and those used in investing activities, was negative ¥12.3 billion (US$110 million) for the year ended March 31, 2017, compared with positive ¥207.5 billion for the previous fiscal year. Net cash used in financing activities was ¥8.1 billion (US$72 million).
Breakdown of Capital Expenditures
(Billions of yen, %)
Years ended March 31 2012 2013 2014 2015 2016 2017New plants and expansions:
Basic Chemicals ¥ 6.9 4% ¥ 18.1 16% ¥ 4.0 3% ¥ — —% ¥ — —% ¥ — —%
Petrochemicals & Plastics 6.1 4 6.8 6 10.2 7 2.5 3 1.8 2 1.5 1
Energy & Functional Materials — — — — — — 1.1 1 10.0 10 11.8 9
IT-related Chemicals 62.2 40 15.8 14 48.1 34 12.9 15 22.1 21 29.5 23
Health & Crop Sciences 9.2 6 15.4 13 8.6 6 10.6 13 6.4 6 12.1 9
Pharmaceuticals 1.7 1 1.6 1 1.9 1 1.6 2 1.9 2 2.8 2
Others 1.0 1 2.6 2 0.6 0 0.9 1 0.7 1 1.2 1
Subtotal ¥ 87.1 56% ¥ 60.3 52% ¥ 73.4 51% ¥29.6 35% ¥ 43.0 41% ¥ 58.9 45%
Rationalization of production processes 3.9 3 3.1 3 4.8 3 4.5 5 8.3 8 3.5 3
Research and development 10.6 7 12.9 11 13.0 9 8.3 10 7.4 7 7.4 6
Maintenance and renewal 30.3 20 22.4 19 27.2 19 22.7 27 21.7 21 25.2 19
Others 23.2 15 17.4 15 25.0 17 19.1 23 23.3 22 35.0 27
Total ¥155.1 100% ¥116.1 100% ¥143.4 100% ¥84.2 100% ¥103.8 100% ¥130.1 100%
Annual Report 201786

5 Capital Expenditures
In the year ended March 31, 2017, the Companies’ capital expenditures totaled ¥130.1 billion (US$1,160 million), which includes investments for new installations and the expansion of manufacturing facilities as well as investments for streamlining existing facilities. Major facilities completed in the fiscal year ended March 31, 2017 included the manufacturing facility for lithium-ion second-ary battery separators in South Korea in the Energy & Functional Materials Segment and the expansion of the production facility for touchscreen panels for OLED display panels in South Korea in the IT-related Chemicals Segment. Major facilities under construction in the fiscal year ended March 31, 2017 included the expansion of the manufacturing facility for lithium-ion secondary battery separators in South Korea in the Energy & Functional Materials Segment, the expansion of the production facility for film-type touchscreen panels for OLED display panels in South Korea in the IT-related Chemicals Segment, the expan-sion of the production facility for methionine and the synthesis research building in the Health & Crop Sciences Segment. Broken down by segment, capital expenditures in the Petrochemicals & Plastics Segment were ¥27.7 billion (US$247 million), ¥19.1 billion (US$170 million) in the Energy & Functional
Materials Segment, ¥33.7 billion (US$300 million) in the IT-related Chemicals Segment, ¥23.9 billion (US$213 million) in the Health & Crop Sciences Segment, ¥14.9 billion (US$133 million) in the Pharmaceuticals Segment, and ¥10.8 billion (US$96 million) in the Others Segment.
6 Research and Development
The Companies’ basic R&D policy is to establish superior propri-etary technologies that will contribute to profitability and busi-ness expansion. To maximize overall efficiency, the Companies proactively promote collaborative R&D and outsourcing through closer cooperation, while each subsidiary performs its own R&D activities. In the fiscal year ended March 31, 2017, the Companies focused R&D resources on 1) Environment and Energy; 2) ICT (Information & Communication Technology); and 3) Life Science as part of the 2016-2018 Corporate Business Plan. In addition, the Companies are promoting cross-sectoral projects for the development of new businesses. R&D expenses were ¥157.6 billion (US$1,405 million), up 1.2% from the fiscal year ended March 31, 2016.
Capital Expenditures Research and Development Expenses
200
50
0
100
150
’13/3 ’17/3’16/3’15/3’14/3
116.1
143.4
84.2103.8
130.1
(Billions of yen)160
40
0
80
120
’13/3 ’17/3’16/3’15/3’14/3
125.0141.3 147.9
155.8 157.6(Billions of yen)
Corporate Data
Annual Report 2017 87

Millions of yen Thousands of US dollars
2017 2016 2017
Assets
Current assets:
Cash and cash equivalents ¥ 193,289 ¥ 215,592 $ 1,722,872
Short-term investments 1,772 2,001 15,795
Securities 1 2 9
Trade notes and accounts receivable 455,239 414,809 4,057,750
Inventories 409,380 402,255 3,648,988
Deferred tax assets 85,519 86,369 762,269
Other 87,956 68,520 783,992
Allowance for doubtful accounts (2,022) (1,619) (18,023)
Total current assets 1,231,134 1,187,929 10,973,652
Property, plant and equipment:
Land 84,764 82,982 755,540
Buildings and structures 657,385 651,675 5,859,569
Machinery and equipment 1,821,219 1,732,483 16,233,345
Construction in progress 41,713 34,263 371,807
2,605,081 2,501,403 23,220,261
Less accumulated depreciation (1,978,877) (1,859,237) (17,638,622)
Net property, plant and equipment 626,204 642,166 5,581,639
Investments and other assets:
Investment securities 446,773 469,319 3,982,289
Long-term loans 68,784 70,107 613,103
Net defined benefit asset 59,097 53,800 526,758
Deferred tax assets 14,790 13,581 131,830
Goodwill 108,256 82,647 964,934
Patents 3,070 4,511 27,364
Software 11,185 11,620 99,697
In-process research and development 193,971 60,145 1,728,951
Other 99,798 67,186 889,545
Allowance for doubtful accounts (1,010) (861) (9,003)
Total investments and other assets 1,004,714 832,055 8,955,468
Total assets ¥2,862,052 ¥2,662,150 $25,510,759
Annual Report 201788
Consolidated Financial Statements
Consolidated Balance SheetsSumitomo Chemical Company, Limited and Consolidated SubsidiariesMarch 31, 2017 and 2016
Visit our website for notes to Consolidated Financial Statements.http://www.sumitomo-chem.co.jp/english/ir/library/financial_results/docs/AR17_FS_170615.pdf
Corporate Data
Annual Report 2017 89
Millions of yen Thousands of US dollars
2017 2016 2017
Liabilities and Net assets
Current liabilities:
Short-term debt ¥ 201,678 ¥ 126,659 $ 1,797,647
Long-term debt due within one year 99,885 100,576 890,320
Trade notes and accounts payable 243,539 205,188 2,170,773
Income taxes payable 21,853 42,220 194,786
Reserve for sales rebates 65,653 49,224 585,195
Reserve for bonuses 31,061 31,045 276,861
Other 243,066 234,518 2,166,556
Total current liabilities 906,735 789,430 8,082,138
Long-term liabilities:
Long-term debt 573,689 604,270 5,113,548
Deferred tax liabilities 92,558 75,490 825,011
Net defined benefit liability 32,782 35,824 292,201
Other 93,762 66,360 835,743
Total long-term liabilities 792,791 781,944 7,066,503
Net assets:
Common stock:
Authorized — 5,000,000,000 shares
Issued — 1,655,446,177 shares at March 31, 2017
1,655,446,177 shares at March 31, 2016 89,699 89,699 799,528
Capital surplus 22,378 23,475 199,465
Retained earnings 603,908 539,490 5,382,904
Treasury stock, at cost:
21,284,566 shares at March 31, 2017
21,206,065 shares at March 31, 2016 (9,004) (8,953) (80,257)
Shareholders’ equity 706,981 643,711 6,301,640
Accumulated other comprehensive income:
Valuation difference on available-for-sale securities 77,388 84,901 689,794
Deferred losses on hedges (583) (702) (5,197)
Land revaluation reserve 4,474 4,472 39,879
Foreign currency translation adjustment 31,537 34,772 281,104
Remeasurements of defined benefit plans 521 (280) 4,644
Total accumulated other comprehensive income 113,337 123,163 1,010,224
Non-controlling interests 342,208 323,902 3,050,254
Total net assets 1,162,526 1,090,776 10,362,118
Total liabilities and net assets ¥2,862,052 ¥2,662,150 $25,510,759

Annual Report 201790
Millions of yen Thousands of US dollars
2017 2016 2017
Net sales ¥1,954,283 ¥2,101,764 $17,419,405
Cost of sales 1,285,764 1,404,801 11,460,594
Selling, general and administrative expenses 534,183 532,517 4,761,414
Operating income 134,336 164,446 1,197,397
Other income (expenses):
Interest and dividend income 8,856 9,321 78,938
Interest expenses (10,499) (11,976) (93,582)
Equity in earnings of affiliates 41,205 20,240 367,279
Net loss on foreign currency transactions (1,145) (8,518) (10,206)
Cost of inactive facilities (3,385) (3,209) (30,172)
Gain on sale of investment securities 27,288 15,831 243,230
Gain on step acquisitions 3,372 — 30,056
Gain on sale of property, plant and equipment 1,035 — 9,225
Impairment loss (34,271) (24,688) (305,473)
Restructuring charges (18,865) (4,791) (168,152)
Other, net (2,736) 913 (24,387)
Income before income taxes and non-controlling interests 145,191 157,569 1,294,153
Income taxes:
Current 33,795 67,640 301,230
Deferred (5,657) (22,469) (50,423)
Total income taxes 28,138 45,171 250,807
Net income 117,053 112,398 1,043,346
Net income attributable to non-controlling interests 31,571 30,947 281,406
Net income attributable to owners of the parent ¥ 85,482 ¥ 81,451 $ 761,940
Yen US dollars
2017 2016 2017
Net income per share ¥52.31 ¥49.84 $0.466
Diluted net income per share 52.27 49.78 0.466
Yen US dollars
2017 2016 2017
Cash dividends per share (applicable to the year) ¥14.00 ¥14.00 $0.125
Consolidated Statements of IncomeSumitomo Chemical Company, Limited and Consolidated SubsidiariesYears ended March 31, 2017 and 2016

Corporate Data
Annual Report 2017 91
Millions of yen Thousands of US dollars
2017 2016 2017
Net income ¥117,053 ¥112,398 $1,043,346
Other comprehensive income:
Valuation difference on available-for-sale securities (13,867) (19,852) (123,603)
Deferred losses on hedges (145) (494) (1,292)
Foreign currency translation adjustment 1,483 (52,613) 13,219
Remeasurements of defined benefit plans 2,825 (19,493) 25,180
Share of other comprehensive income of associates accounted for using equity method (1,912) (9,031) (17,043)
Total other comprehensive income (11,616) (101,483) (103,539)
Comprehensive income ¥105,437 ¥ 10,915 $ 939,807
Comprehensive income attributable to:
Owners of the parent ¥ 75,745 ¥ (4,667) $ 675,149
Non-controlling interests 29,692 15,582 264,658
Consolidated Statements of Comprehensive IncomeSumitomo Chemical Company, Limited and Consolidated SubsidiariesYears ended March 31, 2017 and 2016

Millions of yen
Shares of common
stock (thousands)
Common stock
Capital surplus
Retained earnings
Treasury stock, at cost
Valuation difference
on available- for-sale
securities
Deferred losses
on hedges
Land revaluation
reserve
Foreign currency
translation adjustment
Remeasure-ments of defined benefit plans
Non-controlling
interestsTotal net
assets
Balance at April 1, 2015 1,655,446 ¥89,699 ¥23,695 ¥477,445 ¥(8,870) ¥104,841 ¥ (97) ¥4,363 ¥82,284 ¥17,959 ¥326,897 ¥1,118,216Net income attributable to owners of the parent 81,451 81,451Cash dividends at ¥11.00 per share (17,988) (17,988)Decrease due to changes in scope of consolidation and equity method (3) (3)Gain on sale of treasury stock 1 1Net increase in treasury stock (83) (83)Decrease due to change in fiscal period of consolidated subsidiaries (1,418) (1,418)Other (221) 3 (19,940) (605) 109 (47,512) (18,239) (2,995) (89,400)
Balance at April 1, 2016 1,655,446 ¥89,699 ¥23,475 ¥539,490 ¥(8,953) ¥ 84,901 ¥(702) ¥4,472 ¥34,772 ¥ (280) ¥323,902 ¥1,090,776Cumulative effects of changes in accounting policies 194 (96) 98
Restated balance at April 1, 2016 1,655,446 89,699 23,475 539,684 (8,953) 84,805 (702) 4,472 34,772 (280) 323,902 1,090,874Net income attributable to owners of the parent 85,482 85,482Cash dividends at ¥13.00 per share (21,258) (21,258)Gain on sale of treasury stock 0 0Net increase in treasury stock (51) (51)Other (1,097) (7,417) 119 2 (3,235) 801 18,306 7,479
Balance at March 31, 2017 1,655,446 ¥89,699 ¥22,378 ¥603,908 ¥(9,004) ¥ 77,388 ¥(583) ¥4,474 ¥31,537 ¥ 521 ¥342,208 ¥1,162,526
Thousands of US dollars
Balance at April 1, 2016 $799,528 $209,243 $4,808,717 $(79,802) $756,761 $(6,257) $39,861 $309,939 $(2,496) $2,887,084 $ 9,722,578Cumulative effects of changes in accounting policies 1,729 (856) 873
Restated balance at April 1, 2016 799,528 209,243 4,810,446 (79,802) 755,905 (6,257) 39,861 309,939 (2,496) 2,887,084 9,723,451Net income attributable to owners of the parent 761,940 761,940Cash dividends at ¥13.00 (US$0.12) per share (189,482) (189,482)Gain on sale of treasury stock 0 0Net increase in treasury stock (455) (455)Other (9,778) (66,111) 1,060 18 (28,835) 7,140 163,170 66,664
Balance at March 31, 2017 $799,528 $199,465 $5,382,904 $(80,257) $689,794 $(5,197) $39,879 $281,104 $4,644 $3,050,254 $10,362,118
Annual Report 201792
Consolidated Statements of Changes in Net AssetsSumitomo Chemical Company, Limited and Consolidated SubsidiariesYears ended March 31, 2017 and 2016
Millions of yen Thousands of US dollars
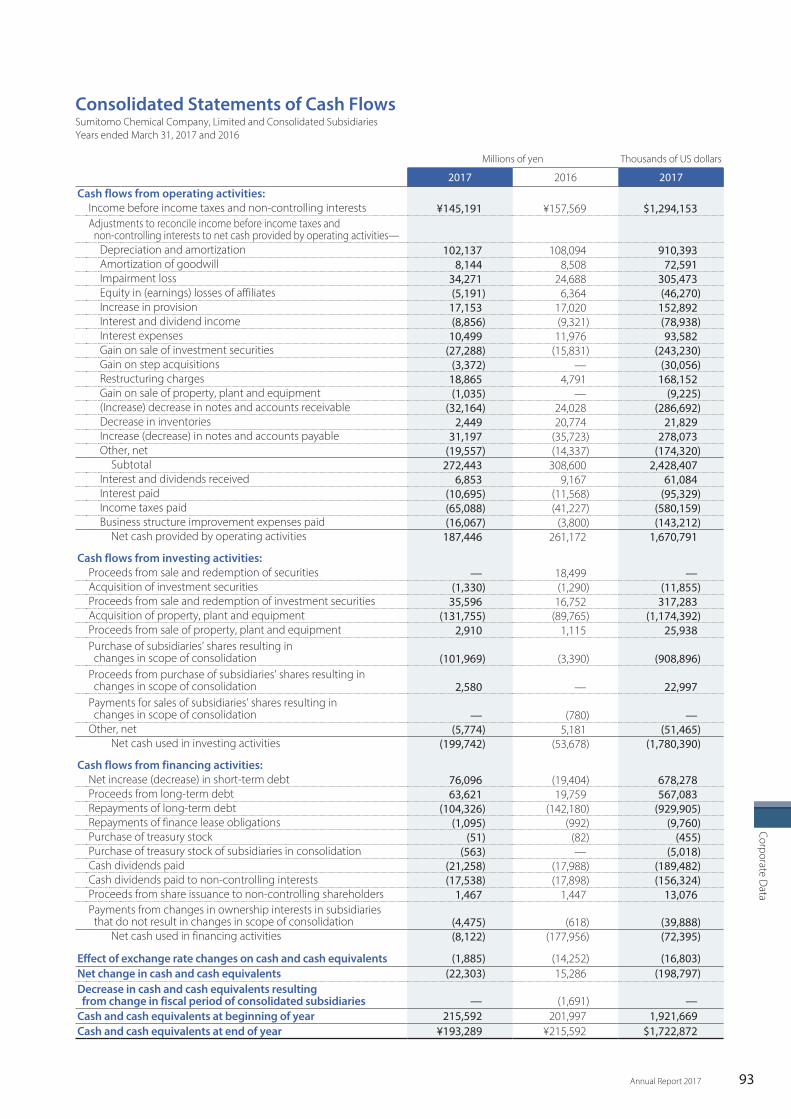
2017 2016 2017Cash flows from operating activities:
Income before income taxes and non-controlling interests ¥145,191 ¥157,569 $1,294,153Adjustments to reconcile income before income taxes and non-controlling interests to net cash provided by operating activities—
Depreciation and amortization 102,137 108,094 910,393Amortization of goodwill 8,144 8,508 72,591Impairment loss 34,271 24,688 305,473Equity in (earnings) losses of affiliates (5,191) 6,364 (46,270)Increase in provision 17,153 17,020 152,892Interest and dividend income (8,856) (9,321) (78,938)Interest expenses 10,499 11,976 93,582Gain on sale of investment securities (27,288) (15,831) (243,230)Gain on step acquisitions (3,372) — (30,056)Restructuring charges 18,865 4,791 168,152Gain on sale of property, plant and equipment (1,035) — (9,225)(Increase) decrease in notes and accounts receivable (32,164) 24,028 (286,692)Decrease in inventories 2,449 20,774 21,829Increase (decrease) in notes and accounts payable 31,197 (35,723) 278,073Other, net (19,557) (14,337) (174,320)
Subtotal 272,443 308,600 2,428,407Interest and dividends received 6,853 9,167 61,084Interest paid (10,695) (11,568) (95,329)Income taxes paid (65,088) (41,227) (580,159)Business structure improvement expenses paid (16,067) (3,800) (143,212)
Net cash provided by operating activities 187,446 261,172 1,670,791
Cash flows from investing activities:Proceeds from sale and redemption of securities — 18,499 —Acquisition of investment securities (1,330) (1,290) (11,855)Proceeds from sale and redemption of investment securities 35,596 16,752 317,283Acquisition of property, plant and equipment (131,755) (89,765) (1,174,392)Proceeds from sale of property, plant and equipment 2,910 1,115 25,938Purchase of subsidiaries’ shares resulting in changes in scope of consolidation (101,969) (3,390) (908,896)Proceeds from purchase of subsidiaries’ shares resulting in changes in scope of consolidation 2,580 — 22,997Payments for sales of subsidiaries’ shares resulting in changes in scope of consolidation — (780) —Other, net (5,774) 5,181 (51,465)
Net cash used in investing activities (199,742) (53,678) (1,780,390)
Cash flows from financing activities: Net increase (decrease) in short-term debt 76,096 (19,404) 678,278Proceeds from long-term debt 63,621 19,759 567,083Repayments of long-term debt (104,326) (142,180) (929,905)Repayments of finance lease obligations (1,095) (992) (9,760)Purchase of treasury stock (51) (82) (455)Purchase of treasury stock of subsidiaries in consolidation (563) — (5,018)Cash dividends paid (21,258) (17,988) (189,482)Cash dividends paid to non-controlling interests (17,538) (17,898) (156,324)Proceeds from share issuance to non-controlling shareholders 1,467 1,447 13,076Payments from changes in ownership interests in subsidiaries that do not result in changes in scope of consolidation (4,475) (618) (39,888)
Net cash used in financing activities (8,122) (177,956) (72,395)
Effect of exchange rate changes on cash and cash equivalents (1,885) (14,252) (16,803)Net change in cash and cash equivalents (22,303) 15,286 (198,797)Decrease in cash and cash equivalents resulting from change in fiscal period of consolidated subsidiaries — (1,691) —Cash and cash equivalents at beginning of year 215,592 201,997 1,921,669Cash and cash equivalents at end of year ¥193,289 ¥215,592 $1,722,872
Corporate Data
Annual Report 2017 93
Consolidated Statements of Cash FlowsSumitomo Chemical Company, Limited and Consolidated SubsidiariesYears ended March 31, 2017 and 2016

(As of March 31, 2017)
Paid-in Capital ¥89.7 billion
Number of Employees Non-consolidated: 5,867 Consolidated: 32,536
Common StockAuthorized: 5,000,000,000 sharesIssued: 1,655,446,177 shares(Book value: ¥89.7 billion)
Settlement Date March 31
Stock Transaction Units 1,000-share units
Ordinary General Meeting of Shareholders
Within three months from the next day of the settlement date
Number of Shareholders 91,044
Listings Tokyo
Transfer Agent and Registrar
Sumitomo Mitsui Trust Bank, Limited Stock Transfer Agency Division 4-1, Marunouchi 1-chome, Chiyoda-ku, Tokyo 100-8233, Japan
Independent Certified Public Accountants KPMG AZSA LLC
Major Shareholders
Major Shareholders Number of Shares Held(1,000 shares)
Shareholding Ratio(%)
Japan Trustee Services Bank, Ltd. (Trust Account) 108,213 6.54
The Master Trust Bank of Japan, Ltd. (Trust Account) 103,380 6.24
Sumitomo Life Insurance Company 71,000 4.29
Nippon Life Insurance Company 41,031 2.48
Sumitomo Mitsui Banking Corporation 35,377 2.14Japan Trustee Services Bank, Ltd. (Trust Account No.4) 29,664 1.79
Japan Trustee Service Bank, Ltd. (Sumitomo Mitsui Trust Bank, Ltd. Retrust Account /Sumitomo Life Insurance Company Employee Pension Trust Account)
29,000
1.75
Japan Trustee Services Bank, Ltd. (Trust Account No.5) 28,326 1.71
STATE STREET BANK WEST CLIENT–TREATY 505234 24,275 1.47
STATE STREET BANK AND TRUST COMPANY 505225 24,182 1.46
Dividend Policy
We consider shareholder return as one of our priority man-agement issues and have made it a policy to maintain stable dividend payments, giving due consideration to our business performance and a dividend payout ratio for each fiscal period, the level of retained earnings necessary for future growth, and other relevant factors. The full year dividend for fiscal 2016 was ¥14 per share, unchanged from the previous fiscal year.
IR Calendar
Distribution of Shareholders
Ownership of Foreign Investors
Fiscal 2016 (Year ending March 31, 2017)
May 2017 Fiscal 2016 Financial Results
June 2017 136th Ordinary General Meeting of Shareholders
Fiscal 2017 (Year ending March 31, 2018)
August 2017 1st Quarter Financial Results
November 2017 2nd Quarter Financial Results
February 2018 3rd Quarter Financial Results
May 2018 Fiscal 2017 Financial Results
June 2018 137th Ordinary General Meeting of Shareholders
(Note) This schedule is subject to change.
Japanese �nancial institutions46%
Number ofShareholders
91,044
Other Japanese corporations5%
Japanese individuals and others 16%
Foreign investors 33%
(%)50
(%)
0
10
20
30
40
’13/3 ’17/3’16/3’15/3’14/3
28.030.8 31.7
28.431.2
35.7
29.8 30.1
35.533.0
Sumitomo Chemical Japanese listed companies
Annual Report 201794
Corporate and Investor Information

Market Capitalization Price Book-value Ratio Price Earnings Ratio
Stock Performance
Fiscal Year 2012 2013 2014 2015 2016Share price high (yen) 360 458 631 792 674Share price low (yen) 186 250 333 443 396Share price at year-end (yen) 293 381 618 509 622Cumulative trading volume (thousands) 3,126,372 3,164,352 2,489,166 2,785,335 2,515,006
Fiscal Year 2012 2013 2014 2015 2016Shares outstanding* (thousands) 1,655,446 1,655,446 1,655,446 1,655,446 1,655,446Market capitalization* (billions of yen) 485 631 1,023 843 1,030Net income (loss) per share* (yen) (31.25) 22.62 31.93 49.84 52.31Net assets per share* (yen) 303.74 393.58 484.17 469.25 501.98Price earnings ratio* (times) — 16.8 19.4 10.2 11.9Price book-value ratio* (times) 1.0 1.0 1.3 1.1 1.2Cash dividends per share* (yen) 6 9 9 14 14Ratio of shares owned by foreign investors to shares outstanding* (%) 28.4 31.2 35.7 35.5 33.0
* Figures are for the end of each fiscal year.
800
Trading volume (Thousands of shares)Sumitomo Chemical trading volumes
0
200
400
600
500,000
400,000
300,000
200,000
100,000
2012 20162015201420130
2,000
1,500
0
500
1,000
Share price (Yen) TOPIX (Points)
Sumitomo Chemical (left axis) TOPIX (right axis)
(FY)
(Billions of yen) 1,200
300
600
900
’13/3 ’17/3’16/3’15/3’14/3
843
1,0301,023
631
485
0
20
5
10
15
’13/3 ’17/3’16/3’15/3’14/3
10.211.9
19.4
16.8
0
(Times)2.0
0.5
1.0
1.5
’13/3 ’17/3’16/3’15/3’14/3
1.11.2
1.3
1.01.0
0
(Times)
Corporate Data
Annual Report 2017 95