Sulphur nutrition and food security - IPNIanz.ipni.net/ipniweb/region/anz.nsf/0... · Sulphur...
47
Sulphur nutrition and food security Better Crops, Better Environment … through Science Rob Norton. Regional Director ANZ Charlie Walker, Incitec Pivot Fertilizers Sam Stacey, Adelaide University Creswick, November, 2010
Transcript of Sulphur nutrition and food security - IPNIanz.ipni.net/ipniweb/region/anz.nsf/0... · Sulphur...

Sulphur nutrition and
food security
Better Crops, Better Environment … through Science
Rob Norton.
Regional Director ANZ
Charlie Walker, Incitec Pivot Fertilizers
Sam Stacey, Adelaide University
Creswick, November, 2010
Outline of an agronomist’s view
• IPNI – interest in S
• Demand for food, feed & fibre – role of nutrients
• Why S now?
• S fertilizer use past & present
• S management for food production – Australian
– The 4 R’s Approach
• Summary

Establishment and Foundation
• Potash Institute and then Potash and Phosphate Institute (PPI) trace back to 1930’s in Canada.
• IPNI officially began operations January 1, 2007.
– Inclusion of N producers
– Potash & Phosphate Institute (PPI) ceased to exist.
– PPI’s Board committed its scientific staff to IPNI.
• Not-for-profit international decentralized NGO.
• Supported by leading fertilizer manufacturers.
• Australia & New Zealand program began October, 2009.

International Plant Nutrition Institute
(IPNI)
• As the theme of our
annual program report
… we are growing the
right way.
• 150 research projects
in >50 countries with
35 scientific staff.
• Outputs geared to
developing sustainable
nutrient management
strategies.
http://www.ipni.net
http://anz.ipni.net
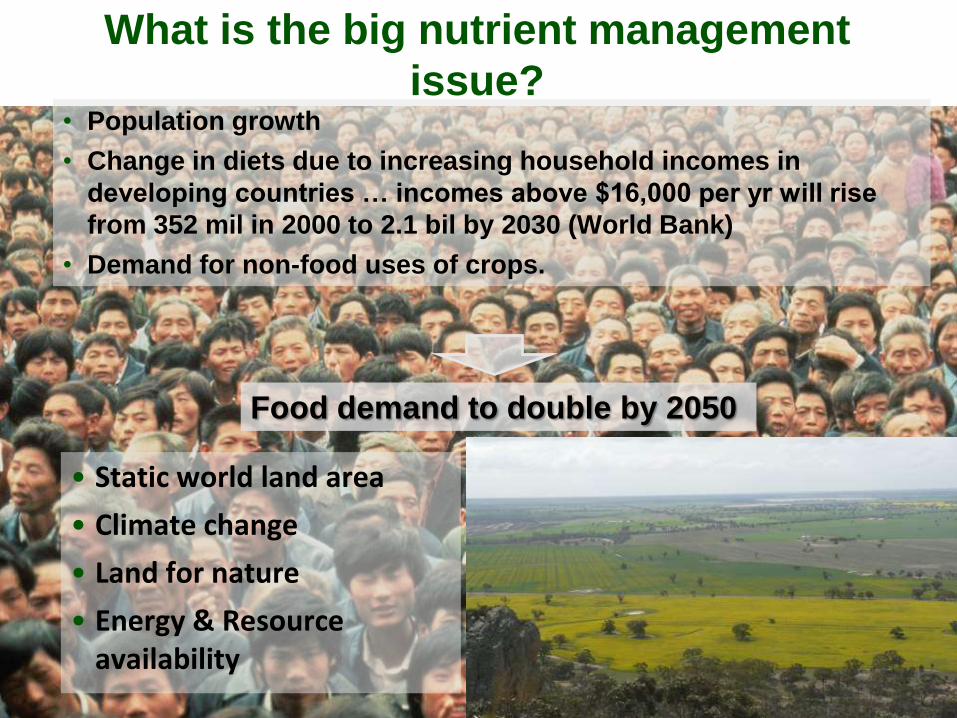
What is the big nutrient management
issue? • Population growth
• Change in diets due to increasing household incomes in
developing countries … incomes above $16,000 per yr will rise
from 352 mil in 2000 to 2.1 bil by 2030 (World Bank)
• Demand for non-food uses of crops.
• Static world land area
• Climate change
• Land for nature
• Energy & Resource availability
Food demand to double by 2050

World demand for food
0
2
4
6
8
10
1950 1960 1970 1980 1990 2000 2010 2020 2030 2040 2050
Population, billions
0.00
0.10
0.20
0.30
0.40
0.50
0.60
1961 1966 1971 1976 1981 1986 1991 1996 2001
Arable land per capita, ha
• “…food production has to increase 50% by 2013
and double in 30 years…‖(Source: Global Challenges for Humanity, 2008 State of the Future, Millennium Project)
Need for nutritious foods
Highly urbanised population in developed and developing countries
Source: FAO Source: FAO

Grain Supply and Food SecurityGlobal Wheat Production, Consumption & Ending Stocks
Source, USDA
2% 2% 3% 3% 4% % Prdn
10% 6% 9% 10% 13% % Trade

Degree of Food Insecurity
FAO 2010
Access, Nutritious, Affordable
Soils
Humans
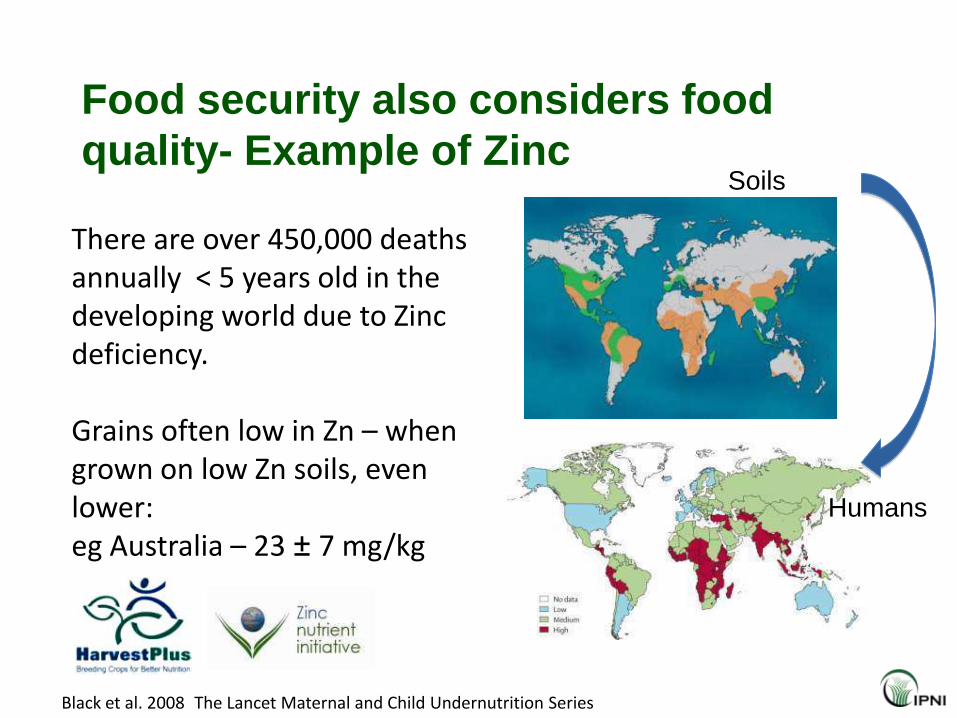
Food security also considers food
quality- Example of Zinc
There are over 450,000 deaths annually < 5 years old in the developing world due to Zinc deficiency.
Grains often low in Zn – when grown on low Zn soils, even lower:eg Australia – 23 ± 7 mg/kg
Black et al. 2008 The Lancet Maternal and Child Undernutrition Series

IFPRI 2009 Global Hunger Index – By Severity

World cereal production and fertilizer
consumption, million metric tons
0
20
40
60
80
100
120
140
160
180
200
0
500
1,000
1,500
2,000
2,500
3,000
NP
K C
onsum
piton,
Mt
To
tal C
ere
al P
rod
uctio
n,
Mt
Cereals Fertilizer
Source: FAO and IFA
Fertilizers account for 40-
60% of current global food
production…a major
contribution to society

World Fertilizer Demand (Mt nutrient)2007/08 to
2009/10
2014/15 % Change
N 101.0 112.1 +1.8% p.a.
P2O5 36.6 44.0 +3.1% p.a.
K2O 25.0 32.2 +4.3% p.a.
Total 162.7 188.3 +2.5% p.a.
S 49.2 62.1 +2.6% p.a.
Growth areas are East and South Asia, followed by Latin America.
Source, Heffer,
2010, IFA

Sources of Sulphur
• Mined from surface or shallow deposits or
extracted from salt domes – Frasch Process (no longer)
• Sulphides (ores) and sulphates (eg gypsum 125 Mt USGS)
• >75% from ―sour gas‖ rich oil/gas wells (Shell-Paques
Process – reacts H2S with NaOH to produce S).
• 85% converted to H2SO4, half acid for fertilizer production
• USGS suggests 5 bt of S from gas, oil & tar sands
• Additional 600 bt in coal/shales, etc.

Phosphate Hill Mine
• Mine phosphate rock
• Use S from the Lead/Zinc/Silver deposits at Mount Isa.
• Production capacity of 950 kt MAP/DAP

Sulphur Supply – mean 2002-08 46.5 Mt
4570 1220
7811
16908
1921357
6937
647 4596
79
West Europe
Central Europe
E. Europe & C. Asia
North America
Latin America
Africa
West Asia (M. East)
South Asia
East Asia
Oceania16908
• USA, Canada, Former Soviet Union, West Asia are the largest producers
• Canada is largest exporter of S
• Source IFA 2010
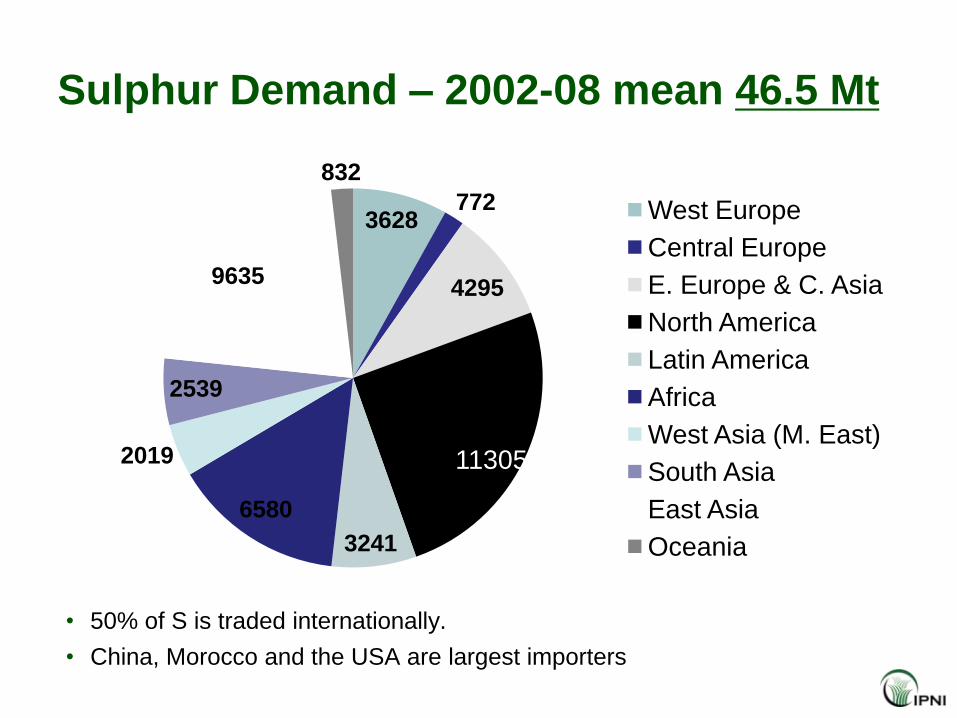
Sulphur Demand – 2002-08 mean 46.5 Mt
3628772
4295
11305
3241
6580
2019
2539
9635
832
West Europe
Central Europe
E. Europe & C. Asia
North America
Latin America
Africa
West Asia (M. East)
South Asia
East Asia
Oceania
11305
• 50% of S is traded internationally.
• China, Morocco and the USA are largest importers

Growth and Consumption of S
-4%
-2%
0%
2%
4%
6%
8%
10%
12%
0% 5% 10% 15% 20% 25% 30%
% G
row
th in
th
at
Mark
et
% of World Consumption
East AsiaOceania
North America
Latin America
Africa

World Elemental Sulphur Supply/Demand2010 2011 2012 2013 2014
Sulphur Supply (Mt)
Oil 23.2 24.7 26.0 27.6 28.6
Gas 23.9 25.9 28.0 29.7 33.2
Other 3.6 4.4 4.7 4.9 5.2
Total 50.6 55.1 58.7 62.3 67.1
Sulphur Demand (Mt)
For Acid 43.9 46.2 49.5 52.4 54.9
Non-Acid 6.6 6.8 6.9 7.1 7.2
Total 50.5 53.0 56.4 59.5 62.1
% Balance 0.2% 4% 4% 5% 7%
Source: M
Prud’homme,
IFA, June 2010

Why S and why now?
• Increased crop yields creating a higher S offtake.
• Use of high analysis fertilizers containing little incidental S
• Less use of high S fuels so less S from atmosphere.
• Slower organic matter turnover with conservation tillage
• Fewer S-containing pesticides
McNeill et al, 2005, Soil Use & Managementt/km2

Importance of S
• Component of essential amino acid in animal nutrition
• Key component in protein structure – disulphide bonding
• Present in several organic compounds … odours to
garlic, mustard and onion, health compounds in Brassica
spp.
• Crop yields!!!!!
Cysteine Methionine

Response to S
Rate of S
fertilizer
(kg/ha)
Canola Yield (t/ha) after:
Cereal Pasture
0 2.63 3.25
10 2.74 4.12
20 2.82 4.38
40 2.91 4.53
LSD 0.24

Importance of balanced nutrition
• S is only one part of a
balanced nutrition
package
• Example from left of
canola in Canada
• Benefits to the crop
come when all nutritional
limitations are met.
• Co-limitation studies
– N:P – 7:1 (Duivenbooden et al,
1996)
– N:S – 15:1 (Randell et al, 1981)

Wheat grain N:S ratio
S
RESPONSIVE
S
UNRESPONSIVE
Inadequate N
Randell et al. (1981) AJAR 32, 203-212
SE Australian N/S 2009
n=140 (2*70)

Maize Intensification in Mozambique7 locations – 2008-09 average yields
0
1
2
3
4
5
6
National Ave. Saved seed OPV seed Hybrid seed
Check
NPK
NPK+S
Ma
ize
Yie
ld (
t/h
a)
Nutrients applied 106 N, 72 P2O5, 36 K2O,18 S
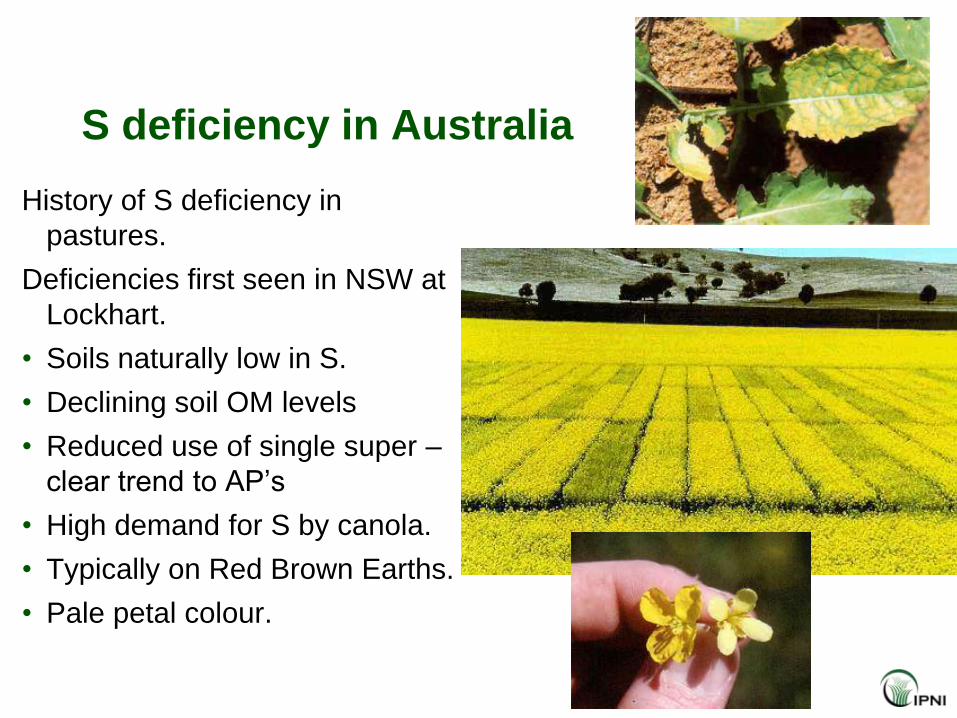
S deficiency in Australia
History of S deficiency in
pastures.
Deficiencies first seen in NSW at
Lockhart.
• Soils naturally low in S.
• Declining soil OM levels
• Reduced use of single super –
clear trend to AP’s
• High demand for S by canola.
• Typically on Red Brown Earths.
• Pale petal colour.

Soil S levels – ANRA Audit 2001
• Nationally
11% < 5 mg/kg
• New South Wales
25% < 5 mg/kg
• Victoria
3% < 5 mg/kg
Draws on data from mid-1990’s
Requires revision and review – current IPNI ANZ project
KCl-40
(mg/kg)
Crop Pasture
<8 52% 43%
8-12 20% 30%
>12 28% 27%
2010 Soil S test values (top 10 cm) for Victoria, South
Australia, New South Wales (~1200 tests)

Continental S balance – ANRA Audit

Notional farm gate S balance
• S inputs from current fertilizers – Most superphosphate
applied to pastures. DAP/MAP used for grain
• Notionally Australia is in positive S balance
• Not included in this balance
– Added S from mined/biproduct gypsum (4 Mt mined)
– Atmospheric input 4.5 ± 2.1 kg S/ha/y (NLWA 2001)
– S input from irrigation – depends on watershed position
247 kt S/y
+2.9 kg/ha/y
113 kt S/y
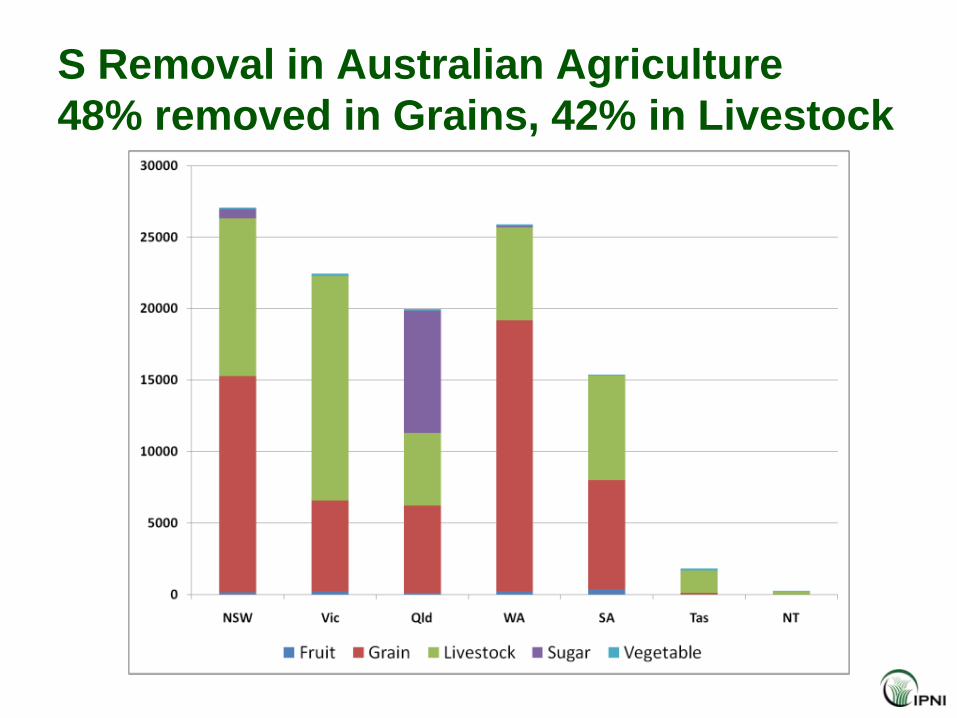
S Removal in Australian Agriculture
48% removed in Grains, 42% in Livestock

Importance of getting S right
• Key aspect of sustainability is getting nutrients balanced
against each other.
• At least balance total S inputs and outputs.
• Interaction with grain protein quality
• Interaction with S and Mo&Se&Cu&Zn – and many others
• Large differences among different crops in S demand
– Export ranges from 11 to 70 kg S/ha
– Wheat grain S content – relatively consistent (NVT analyses 2010)
P K S
3329 ±671 4606±645 1742±220
3600±800 4000±800 1700±400
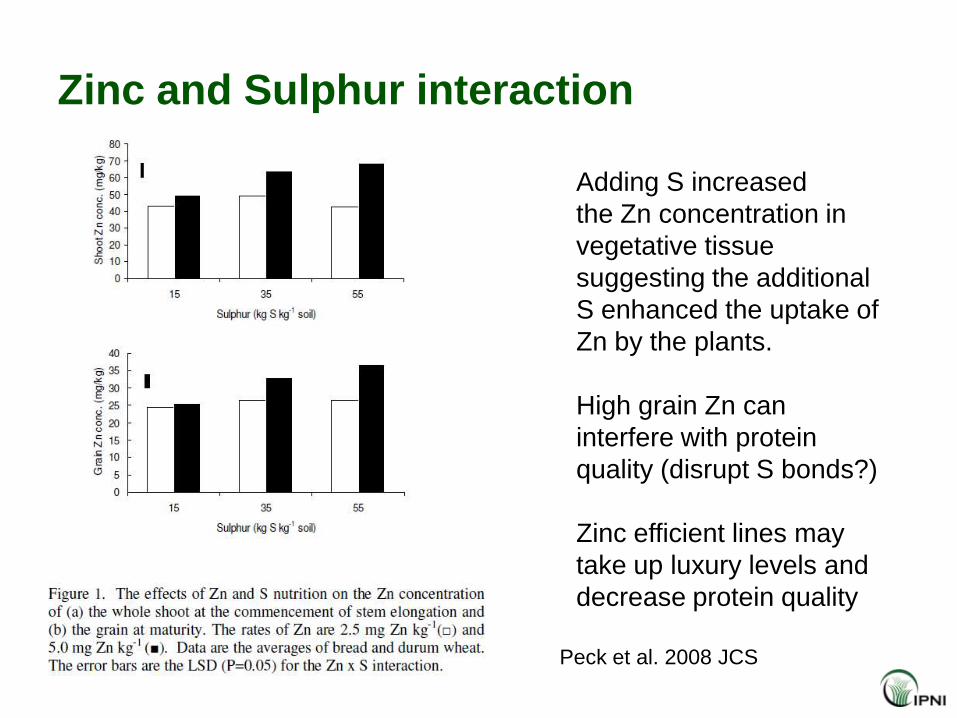
Zinc and Sulphur interaction
Adding S increased
the Zn concentration in
vegetative tissue
suggesting the additional
S enhanced the uptake of
Zn by the plants.
High grain Zn can
interfere with protein
quality (disrupt S bonds?)
Zinc efficient lines may
take up luxury levels and
decrease protein quality
Peck et al. 2008 JCS
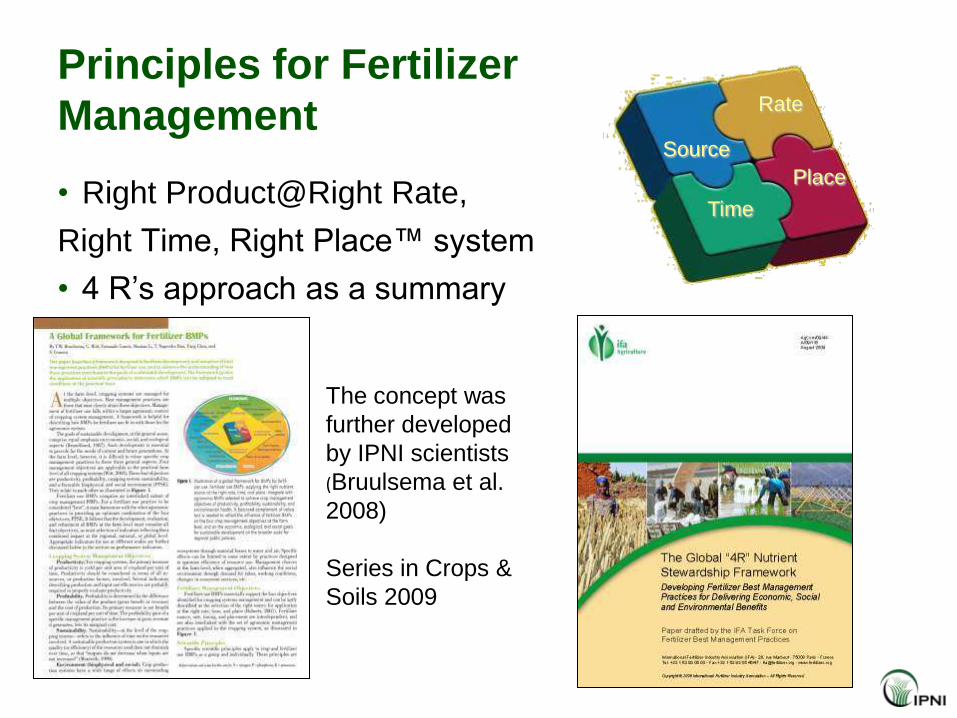
• Right Product@Right Rate,
Right Time, Right Place™ system
• 4 R’s approach as a summary
Principles for Fertilizer
ManagementSource
Time
Place
Rate
The concept was
further developed
by IPNI scientists
(Bruulsema et al.
2008)
Series in Crops &
Soils 2009

The Right Rate - Soil test
Crop Deficient Marginal Adequate
Pasture <5 5-10 >10
Canola <12 12-18 >18
Wheat <3 3-5 >5
KCl-40
(mg/kg)
Crop Pasture
<8 52% 43%
8-12 20% 30%
>12 28% 27%
2010 Soil S test values (top 10
cm) for Victoria, South Australia,
New South Wales (~1200 tests) Blair 1993 P&S

KCl40 –
Critical
value
8 ± 2 n=37
NSW,SA
S test calibrations - Pastures

Problem with leaching & soil tests
• Sulphate mobile
• Sulphate supplied
– Mineralisation OM
– Oxidation S
• Improved tests;
– Appropriate depth
– Take account of
some part of the
other S sources.
Soil ColloidSO4
=
Leaching
--
-
- -

Right place & right time
• Where the plant can get it –
– Root zone – control release rates to avoid leaching
• In synchrony with plant demand – ability to recover from
nutrient stress – eg Canola
S
applied
Kg/ha
Sowing 5-6
Leaf
Buds
Visible
Stem
Elongati
on
10 1.73 1.62 1.56 1.41 LSD
40 2.15 2.26 2.11 2.19 0.43
Hocking et al., 1996
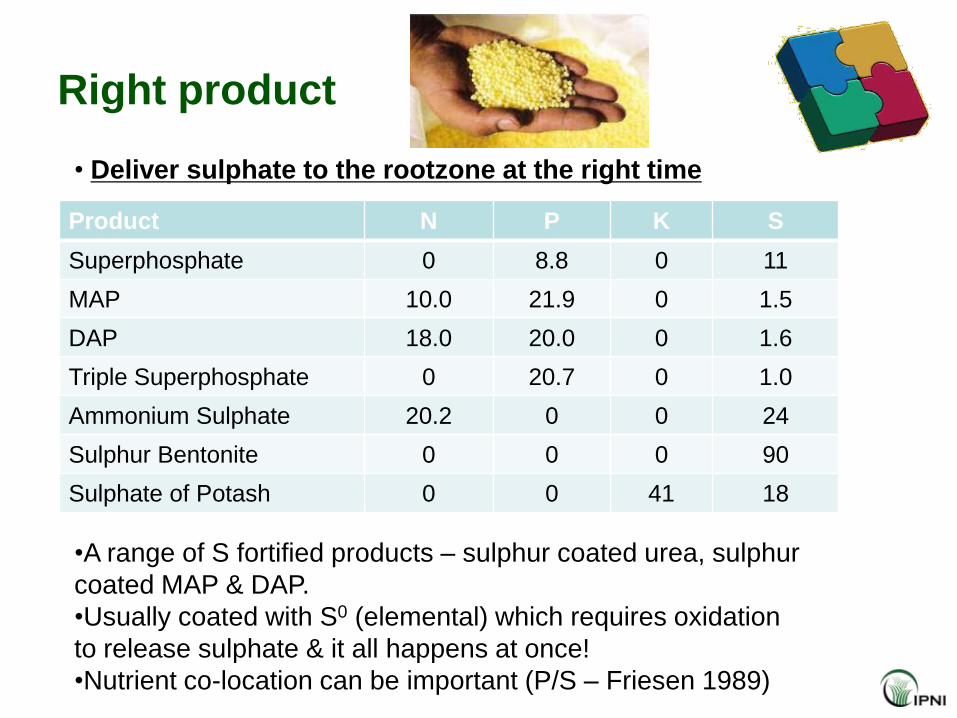
Right product
Product N P K S
Superphosphate 0 8.8 0 11
MAP 10.0 21.9 0 1.5
DAP 18.0 20.0 0 1.6
Triple Superphosphate 0 20.7 0 1.0
Ammonium Sulphate 20.2 0 0 24
Sulphur Bentonite 0 0 0 90
Sulphate of Potash 0 0 41 18
• Deliver sulphate to the rootzone at the right time
•A range of S fortified products – sulphur coated urea, sulphur
coated MAP & DAP.
•Usually coated with S0 (elemental) which requires oxidation
to release sulphate & it all happens at once!
•Nutrient co-location can be important (P/S – Friesen 1989)

Rates of sulphate release from different
sources

Developments in Fertilizer Technology
• S0 oxidation rapid with fine
particles
– Good for sulphate release
– Bad for handling
• Two new processes that
incorporate S0 into existing
products at manufacture
• For S fertilizers, keys are:
– High nutrient density
– Matched/balanced with other nutrients
– Controlled release of SO4
– Safe to store and transport – corrosive & explosive
smaller
Particle Size µ 2 weeks 4 weeks
<75 80 82
75-125 61 81
125-175 36 68
175-400 15 36
400-840 5 14
840-2000 2 5
2000-4000 1 2

Mosaic’s MicroEssentials Products
S0 fine particles
in MAP or DAP
matrix
Can also add Zn
12:18:0:10
N:P:K:S
Up to 14% S
50:50 S0:SO4

MES ResponsesFertilizer Crop No of Trials Average Yield
increase over MAP
MES10 Wheat 10 8%
Canola 7 11%
MES10 Zn Wheat 12 7%
Canola 9 20%
Sulfur response in canola at Woomelang. Left was treated
with MAP (12-22-0) + urea, right was treated with 12-18-
0-10. Both plots had equivalent N and P.

Thiogro S
• Technology developed by Shell to incorporate microfine S
into MAP, DAP and TSP.
– Alter S:SO4 ratio, even distribution in granule – alter the rate of
sulphate supply to the plant.
• Agronomic efficiency still being evaluated but there are
freight benefits due to a higher S density in these products.
Flavel et al., 2010,
ISSC.
Higher S & P
recoveries with
MAP12
S0 - SO4 2:1 S0:SO4

Gypsum & S0 mixture
• Recent product (WA) – granulated mixture of by-product
gypsum with S0. Called Canola Blue for canola grown in
low S soils of the region.
• Relative efficiency of ―Canola Blue‖ compared to gypusm
• ie application rate to achieve the same yield.
• Brennan et al. 2010 Journal of Plant Nutrition, 33: 8, 1180 — 1194
Site 1 Site 2 Site 3 Site 3
Relative Efficiency 1.13 1.00 0.89 1.11

Ammonium sulphate
• Traditional fertilizer – seen as a better S source than
gypsum (Khan poster).
– Root Zone acidification, Coplacement of N/S, Reduced N loss.
• As a plant fertilizer – not enough N – looking at
Urea/Ammonium Sulphate fluid fertilizers, compared to
UAN/ATS fluids

Summary• While there have been improvements in food security,
continued gains in food production and enhanced food
quality are still an imperative of agricultural science.
• Addressing sulphur nutrition is an important aspect of
ensuring food security and this will continue into the
future.
• There are adequate S resources to meet demand well
into the future.
• The current tools to assist with selecting the right S rate
are more art than science.
• New products will require refinement of the 4R’s
approach for S management into the future.


IPNI is supported by leading fertilizer manufacturers and industry associations