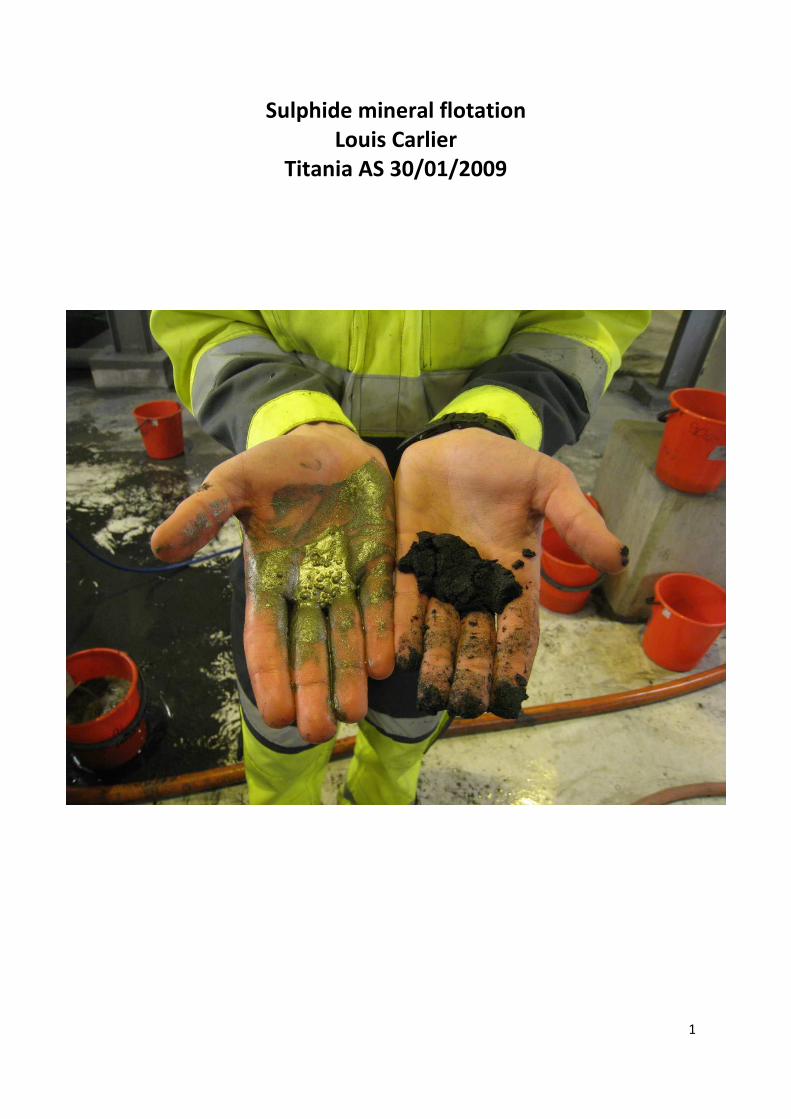
Sulphide mineral flotation Louis Carlier Titania AS 30/01/2009
33
1 Sulphide mineral flotation Louis Carlier Titania AS 30/01/2009
Transcript of Sulphide mineral flotation Louis Carlier Titania AS 30/01/2009
1
Sulphide mineral flotation
Louis Carlier
Titania AS 30/01/2009
2
Preface:
The research project described in this report was conducted in January 2009 at Titania AS in
Norway. I first came into contact with Titania AS when they had a presentation at the
Norwegian University of Science and Technology (NTNU). I was studying at the NTNU for
one semester to fulfil a minor as part of my Bachelor degree in Applied Earth Sciences at
Delft University of Technology.
I would first like to thank Titania AS for giving me an opportunity to do an internship.
Furthermore I would especially like to thank Wolfgang Shubert my supervisor for organising
the research project and sharing his expertise and knowledge with me.
The internship at Titania AS has been a great experience. I have learned a lot about
conducting research both in practical and theoretical sense. Furthermore I now understand
more how an entire mine and processing plant are operated. This new knowledge, I believe
will be of great value for me in the future.
Louis Carlier.
Student at the faculty of Applied Earth Sciences
Delft University of Technology, the Netherlands.
3
1. Abstract
The report describes a research project conducted by Louis Carlier in January 2009 at Titania
AS, ilmenite mine in Norway. This research project focuses on the first testing stage of
three, namely: laboratory cell test � pilot cell test � full scale test. The purpose of this
research project was to provide information on the flotation behaviour of sulphide minerals
using potassium-amyl xanthate as a collector. The effect of Ph, time, and reagent regime
were tested using a laboratory test cell. Some pilot cell tests were included to allow a
cleaning stage and gain information on the continuous flotation process of sulphide
minerals. The results of this project are recommendations for further pilot cell tests in the
form of precise testing ranges for: time, Ph, reagent quantities and cleaning stage.

4
2. Table of Contents
1. Abstract ............................................................................................................................................... 3
2. Table of Contents ................................................................................................................................ 4
3. Company overview: ............................................................................................................................ 6
4. Introduction: ....................................................................................................................................... 7
5. Research method ................................................................................................................................ 9
6. Result analysis ................................................................................................................................... 11
Time .................................................................................................................................................. 11
Recovery ........................................................................................................................................ 11
Enrichment .................................................................................................................................... 12
Concentrate quality ...................................................................................................................... 13
pH ...................................................................................................................................................... 13
Recovery ........................................................................................................................................ 13
Enrichment .................................................................................................................................... 13
Concentrate quality ...................................................................................................................... 14
Xanthate ............................................................................................................................................ 15
Recovery ........................................................................................................................................ 15
Enrichment .................................................................................................................................... 15
Concentrate quality ...................................................................................................................... 16
7. Pilot cell tests .................................................................................................................................... 17
Batch ................................................................................................................................................. 17
Continuous ........................................................................................................................................ 18
8. Conclusion ......................................................................................................................................... 19
9. Literature list ..................................................................................................................................... 21
10. Appendices ...................................................................................................................................... 22
Testing equipment and standard conditions for laboratory cell tests ............................................. 22
Floatation Cells .............................................................................................................................. 22
Reagants ........................................................................................................................................ 22
Standard conditions laboratory cell .............................................................................................. 22
Possible errors/inaccuracies ......................................................................................................... 22
Floatation probability formula ...................................................................................................... 23

Minerals in the Tellnes ore ............................................................................................................... 24
Processing flow chart ........................................................................................................................ 25
Gravimetric plant .............................................................................................................................. 26
Graphs ............................................................................................................................................... 27
6
3. Introduction:
Titania AS is a company which has been producing ilmenite from an open pit mine since
1960. The ore comes from a magmatic dyke deposit. The main minerals forming the deposit
are ilmenite 39,9 % and plagioclase 36,9 % (see appendix, Minerals in the Tellnes ore).
Sulphide bearing minerals present in the ore include:
- Pyrite
- Pyrrhotite
- Pentlandite
- Violarite
- Siegenite
- Millerite
- Chalcopyrite
In the process of enriching the ilmenite concentrate sulphides are currently separated from
the Ilmenite. Sulphides are sold as a by-product. These sulphide bearing minerals also
contain the elements nickel, copper and cobalt which have become more valuable
throughout the years. The majority of the current world’s production of nickel still comes
from sulphidic sources.
The process to separate sulphide from the ilmenite is done stepwise. In general, most of the
sulphide minerals travel with the ilmenite concentrate during the two parallel enrichment
process (see appendix, processing flow chart, page 25): the ilmenite flotation with tall oil
and the gravimetric separation. After these processes, the two concentrates are mixed and
leached at pH 1 to get rid of the apatite. After the leaching, sulphides are floated to
separate them from the ilmenite using Tall oil. However, tall oil residues in the sulphide by-
product are not wanted by the customers as it turns the sulfuric acid black after
calcinations.
The rising prices and higher quality demand have led to the idea of installing a sulphide
floatation in front of the ilmenite floatation. The steps necessary to reach full scale
production include: literature investigation, laboratory tests, pilot cell tests, full scale tests.
Furthermore many different slurry streams can be tested.
The most suitable streams will be tested first. These are the FCS and FRS respectively Fine
Clean Spiral and Fine Rougher Spiral coming from the gravimetric plant (see appendix,
gravimetric plant, page 26). Both streams have an ideal grain size distribution of 60 to 150
μm. FCS concentrate has larger sulphide content but a smaller debit of 45 t/h versus 75 t/h
for FRS.
The average concentration values in % for both streams are:
feed averages TiO2 S Ni Cu Co
FCS 43.58 0.29 0.07 0.02 0.02
FRS 38.32 0.25 0.06 0.02 0.02

7
The investigations includes the testing of FCS and FRS streams according to their floatation
behavior, time periods, pH values and reagents amounts are varied. Indicational pilot tests
will also be conducted.
The goal of this research is to narrow down the testing range of different parameters for the
Pilot cell tests. The results from the laboratory cell tests are used to gain further
understanding of the process and form the base for the Pilot cell tests.
8
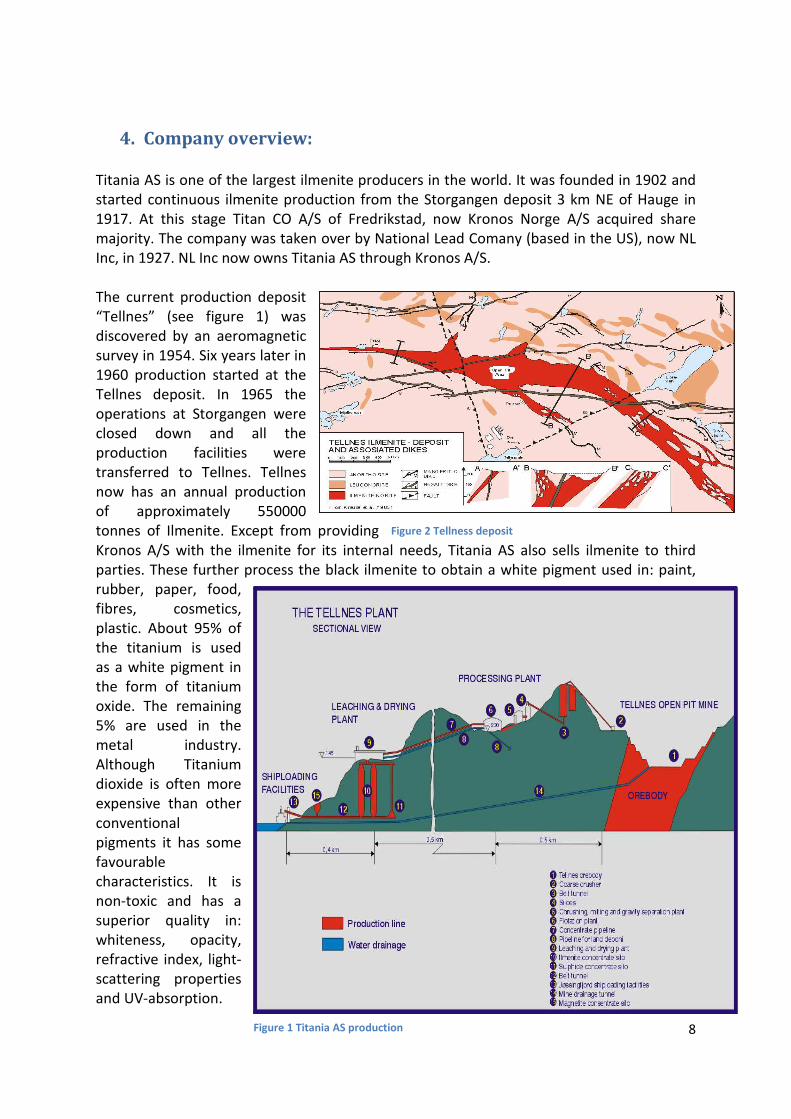
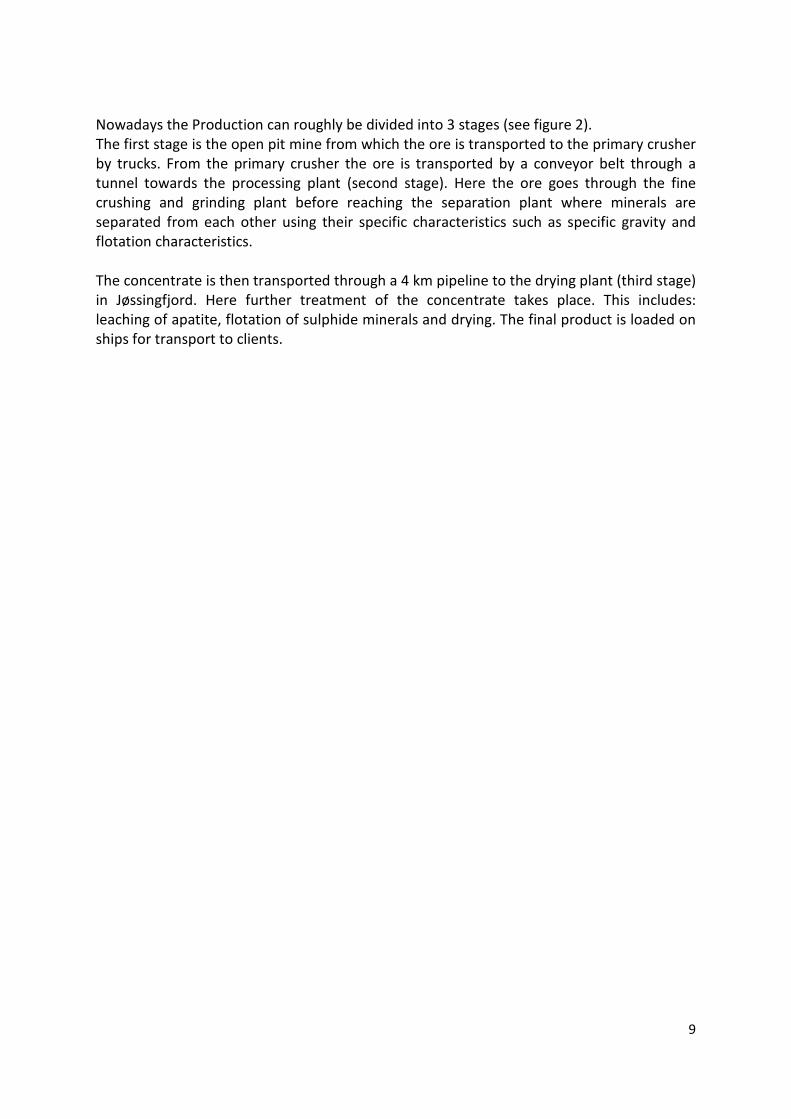
4. Company overview:
Titania AS is one of the largest ilmenite producers in the world. It was founded in 1902 and
started continuous ilmenite production from the Storgangen deposit 3 km NE of Hauge in
1917. At this stage Titan CO A/S of Fredrikstad, now Kronos Norge A/S acquired share
majority. The company was taken over by National Lead Comany (based in the US), now NL
Inc, in 1927. NL Inc now owns Titania AS through Kronos A/S.
The current production deposit
“Tellnes” (see figure 1) was
discovered by an aeromagnetic
survey in 1954. Six years later in
1960 production started at the
Tellnes deposit. In 1965 the
operations at Storgangen were
closed down and all the
production facilities were
transferred to Tellnes. Tellnes
now has an annual production
of approximately 550000
tonnes of Ilmenite. Except from providing
Kronos A/S with the ilmenite for its internal needs, Titania AS also sells ilmenite to third
parties. These further process the black ilmenite to obtain a white pigment used in: paint,
rubber, paper, food,
fibres, cosmetics,
plastic. About 95% of
the titanium is used
as a white pigment in
the form of titanium
oxide. The remaining
5% are used in the
metal industry.
Although Titanium
dioxide is often more
expensive than other
conventional
pigments it has some
favourable
characteristics. It is
non-toxic and has a
superior quality in:
whiteness, opacity,
refractive index, light-
scattering properties
and UV-absorption.
Figure 1 Titania AS production
Figure 2 Tellness deposit
9
Nowadays the Production can roughly be divided into 3 stages (see figure 2).
The first stage is the open pit mine from which the ore is transported to the primary crusher
by trucks. From the primary crusher the ore is transported by a conveyor belt through a
tunnel towards the processing plant (second stage). Here the ore goes through the fine
crushing and grinding plant before reaching the separation plant where minerals are
separated from each other using their specific characteristics such as specific gravity and
flotation characteristics.
The concentrate is then transported through a 4 km pipeline to the drying plant (third stage)
in Jøssingfjord. Here further treatment of the concentrate takes place. This includes:
leaching of apatite, flotation of sulphide minerals and drying. The final product is loaded on
ships for transport to clients.
10
5. Research method
Literature reviews provide general information about the reaction principles (see literature
list), reagent characteristics and possible results. The testing of our ore can be subdivided
into three stages. The principle for the use of three testing stages is to be more effective. By
starting on a small scale many tests can be conducted within a relatively short time.
The results from the tests in one stage will be used to determine the testing condition for
the following test stage.
The laboratory floatation cell is the smallest of all three. Although the full scale floatation
condition will differ from the laboratory floatation condition, valuable information can be
gained during these tests. The main purpose of the laboratory test is to narrow the range of
values found in the literature. The new, more precise values will be the base for the pilot
tests.
The pilot cell is the second testing stage. It has fewer restrictions than the laboratory cell
and greatly resembles a full scale floatation cell. The greatest advantage compared to the
laboratory cell is the ability to produce large amounts of concentrate and to perform a
continuous process. It can be connected to the processing plant, allowing it to test many
different streams directly. Again the pilot cell testing result narrow the testing ranges for the
full scale tests. The pilot cell can effectively be used in combination with the laboratory cell.
For example: the larger concentrate volume from the pilot cell make it possible to first float
sulphide bearing minerals and clean them afterwards in the laboratory cell.
Once the last testing stage is reached only several streams will be tested in a precise range
of condition. If the results are satisfactory the developing stage will be started.
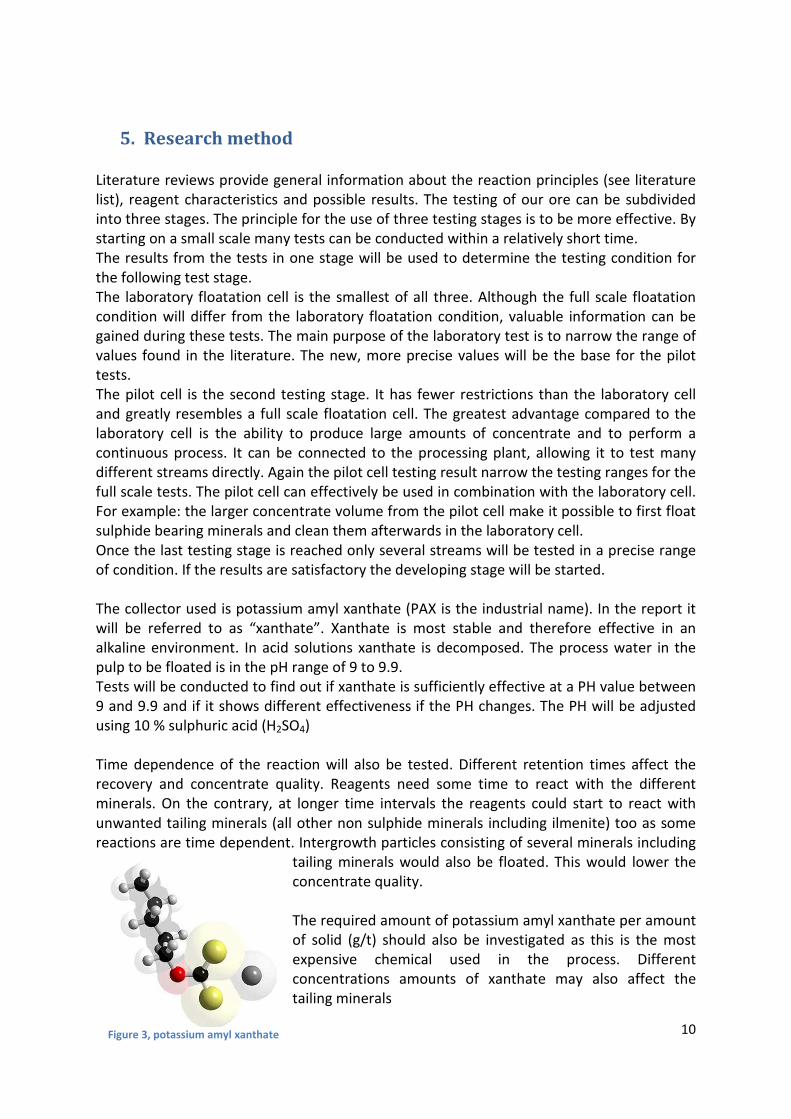
The collector used is potassium amyl xanthate (PAX is the industrial name). In the report it
will be referred to as “xanthate”. Xanthate is most stable and therefore effective in an
alkaline environment. In acid solutions xanthate is decomposed. The process water in the
pulp to be floated is in the pH range of 9 to 9.9.
Tests will be conducted to find out if xanthate is sufficiently effective at a PH value between
9 and 9.9 and if it shows different effectiveness if the PH changes. The PH will be adjusted
using 10 % sulphuric acid (H2SO4)
Time dependence of the reaction will also be tested. Different retention times affect the
recovery and concentrate quality. Reagents need some time to react with the different
minerals. On the contrary, at longer time intervals the reagents could start to react with
unwanted tailing minerals (all other non sulphide minerals including ilmenite) too as some
reactions are time dependent. Intergrowth particles consisting of several minerals including
tailing minerals would also be floated. This would lower the
concentrate quality.
The required amount of potassium amyl xanthate per amount
of solid (g/t) should also be investigated as this is the most
expensive chemical used in the process. Different
concentrations amounts of xanthate may also affect the
tailing minerals
Figure 3, potassium amyl xanthate

11
In each test (time, PH, quantity of xanthate) all condition but one will remain constant. (see
appendix for constant conditions). From each test the feed, concentrate and tailing will be
analyzed by an XRF analyzer. From the XRF analysis results the specific recovery and
enrichment of each element can be calculated. The concentrate quality will be pictured
using the percentages of each element of interest present in the concentrate. The XRF
results will provide information about elements and not minerals. This however, is a
reflection of the mineral contents in the feed, concentrate and tailing.
Formulas:
a = element content of feed in %
b = element content of tailing in %
c = element content of concentrate in %
Enrichment i � i=
Recovery =
As can be seen the enrichment “i” is a ratio between two concentration and therefore
dimensionless.
Although a total XRF element analysis will be obtained only several elements will be taken
into account. First TiO2 which is present in the ilmenite. In an ideal case it should be only be
present in the tailing and not in the floated concentrate. The sulphide bearing minerals
should be floated and therefore only be present in the concentrate and not in the tailing. To
represent the sulphide bearing minerals the element S will be taken into account as well as
Ni, Cu and Co. the last three elements are only present in sulphide bearing minerals in the
Tellnes deposit (see appendix, Minerals in Tellnes ore). S, Ni, Cu and Co should therefore
show a high correlation enrichement. Slight differences may occur due to the fact that
potassium amyl xanthate is a better collector for the minerals: pyrite, pyrrhotite,
pentlandite, violarite, millerit and chalcopyrite than for siegenite. The element Co is only
present in siegenite and should therefore have lower recovery and enrichment values.
The results will be presented in the form of graphs. The graphs will indicate if any optimal
condition is present within the tested range. In the process of analyzing the results we have
to take into account that a small error will have a relatively higher effect at the laboratory
test due to the smaller scale. It will therefore not be surprising to see deviations in the trend
curves. For a list a possible inaccuracies/errors see appendix.
Figure 4, different
streams
12
6. Result analysis
Time
Recovery
The first characteristic noticed in the Recovery % curves (graphs 1 and 10) is the good
correlation between S, Ni and Cu element. The Co recovery curve does not show any
correlation to the S, Ni and Cu curves. Furthermore the Co curve of the FCS test is exactly
the opposite of the Curve in the FRS test. This indicates that potassium-amyl-xanthate is not
optimized as a reagent for the floatation of siegenite (a Co mineral). As mentioned in the
“research method” potassium amyl xanthate was a very good reagent for the floatation of
pyrite, pyrrhotite, pentlandite, violarite, millerit and chalcopyrite which contain the
elements S, Cu and Ni. These three elements have the highest recovery. The element Ni
which is present in the minerals pentlandite, violarite, siegenite and millerite closely follows
the trend of the S and Cu elements.
The gradient of the recovery % curves represents the recovery rate. The highest recovery
rate for FCS is between the 2 and 4 minute measurement (7.2 % difference in recovery). This
indicates that there is still sufficient sulphide bearing minerals to be floated and the
sulphide bearing particles did not all have the time to react (come into contact) with the
collector and the air bubbles. The curves for FRS do not show such great differences in
recovery (only 0.9 % difference in recovery between the 2 and 4 minutes intervals). This is
caused by fact that the FRS slurry has a lower sulphide concentration than the FCS slurry. In
contrast to FCS most sulphide bearing particles will have been floated effectively within 2
minutes. As a result the FRS recovery curves are relatively horizontal and do not show great
variations.
An imprecision is present in both the FCS and FRS curves. In both the FCS and FRS the curves
representing S bearing minerals recovery show a dipping gradient at certain intervals.
Taking the FCS “S” curve to illustrate this error: between 2 and 4 minutes S bearing minerals
are being floated resulting in a rising recovery. The recovery values at 6 and 8 minutes are
lower than those at 4 min which means S bearing particles have sunken from the formed
froth layer. The 10 minute interval shows the highest S recovery. This indicates that S
bearing particles have been floated again. The float� sink�float sequence is improbable.
Furthermore the values between the 4 minute and 10 minute measurement all vary within a
range of 3,25 % which is relatively limited range.
According to the probability Formula (Ullmann’s Encyclopedia of Industrial Chemistry) it
would be more likely to have a rising curve which
would reach a maximum without dipping at any
moment (Will’s Mineral Processing Technology,
B.A. Wills and T.J.Napier-munn, page 295). Longer
time interval would mean higher chance for
particles to react with reagent and collide with air
bubbles (higher Pc and Pa) leading to higher
chance of successful floatation and ultimately
higher recovery. In both FCS and FRS we could say
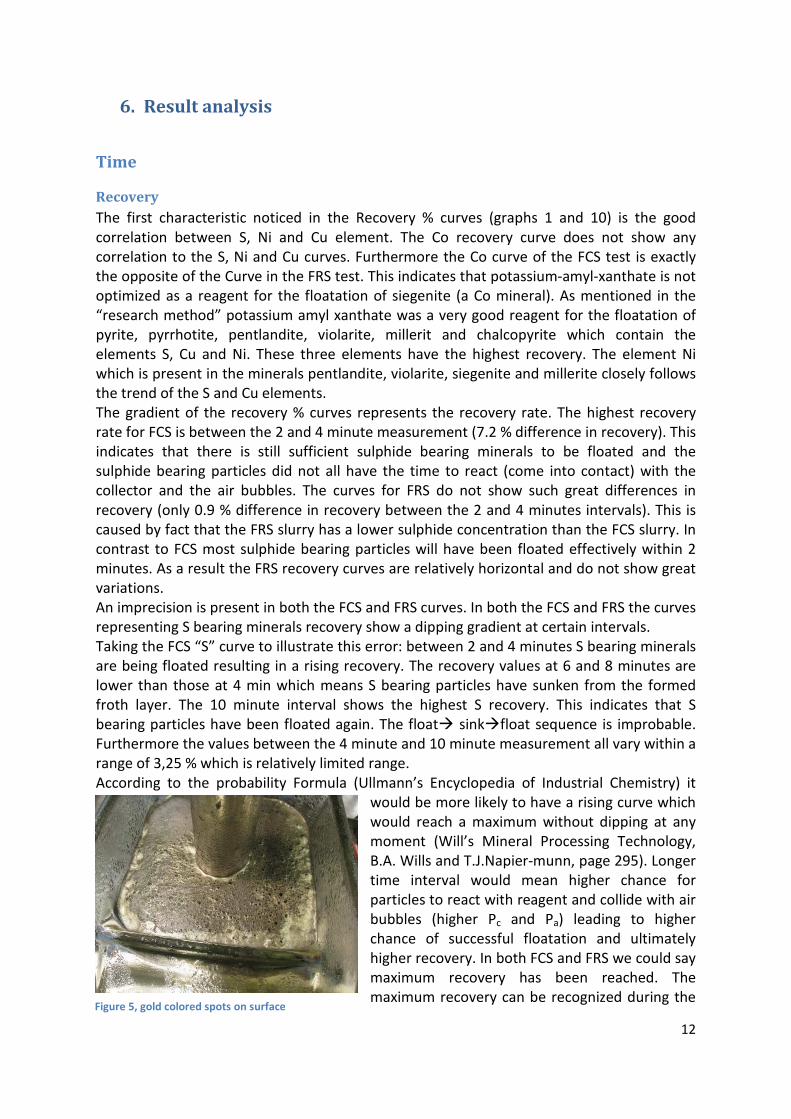
maximum recovery has been reached. The
maximum recovery can be recognized during the Figure 5, gold colored spots on surface
13
test as the moment at which the gold colored spots seize to appear on the surface (see
figure 5).These gold colored spots are sulphide bearing particles forming clusters. For FCS
the maximum sulphide recovery reached is 95,16% and for FRS 93,05 %.
Enrichment
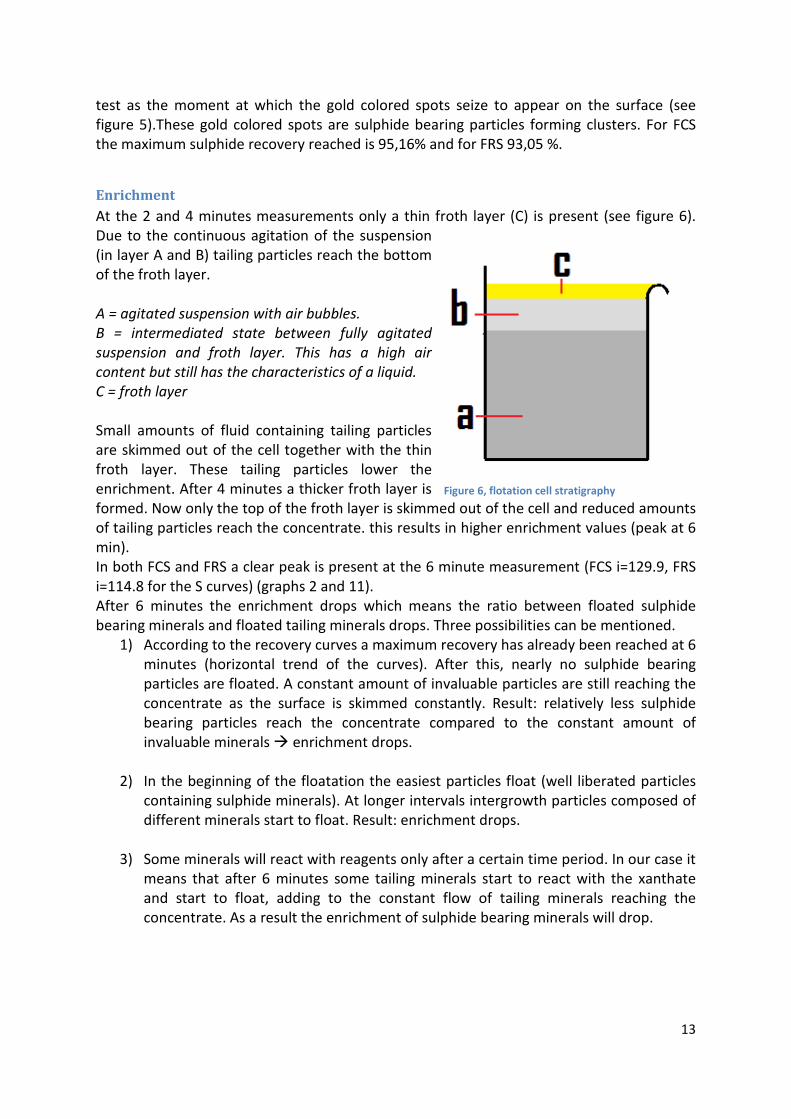
At the 2 and 4 minutes measurements only a thin froth layer (C) is present (see figure 6).
Due to the continuous agitation of the suspension
(in layer A and B) tailing particles reach the bottom
of the froth layer.
A = agitated suspension with air bubbles.
B = intermediated state between fully agitated
suspension and froth layer. This has a high air
content but still has the characteristics of a liquid.
C = froth layer
Small amounts of fluid containing tailing particles
are skimmed out of the cell together with the thin
froth layer. These tailing particles lower the
enrichment. After 4 minutes a thicker froth layer is
formed. Now only the top of the froth layer is skimmed out of the cell and reduced amounts
of tailing particles reach the concentrate. this results in higher enrichment values (peak at 6
min).
In both FCS and FRS a clear peak is present at the 6 minute measurement (FCS i=129.9, FRS
i=114.8 for the S curves) (graphs 2 and 11).
After 6 minutes the enrichment drops which means the ratio between floated sulphide
bearing minerals and floated tailing minerals drops. Three possibilities can be mentioned.
1) According to the recovery curves a maximum recovery has already been reached at 6
minutes (horizontal trend of the curves). After this, nearly no sulphide bearing
particles are floated. A constant amount of invaluable particles are still reaching the
concentrate as the surface is skimmed constantly. Result: relatively less sulphide
bearing particles reach the concentrate compared to the constant amount of
invaluable minerals � enrichment drops.
2) In the beginning of the floatation the easiest particles float (well liberated particles
containing sulphide minerals). At longer intervals intergrowth particles composed of
different minerals start to float. Result: enrichment drops.
3) Some minerals will react with reagents only after a certain time period. In our case it
means that after 6 minutes some tailing minerals start to react with the xanthate
and start to float, adding to the constant flow of tailing minerals reaching the
concentrate. As a result the enrichment of sulphide bearing minerals will drop.
Figure 6, flotation cell stratigraphy
14
Concentrate quality
The concentrate quality (graphs 3 and 12) closely follows the trends of the enrichment
curves. A clear inverse correlation between the TiO2 and S curve is visible. Also here a peak
in valuable element concentration in the concentrate is present at the 6 minute
measurement. Although Cu has a higher enrichment than Ni the concentrate has a higher Ni
percentage than Cu. This is caused by the original feed composition in which the Ni
concentration is higher than the Cu concentration. In the FCS feed, Ni has a concentration of
0,07 % in the feed and Cu 0,02 %. A higher Cu enrichment is not enough to overcome the
original concentration difference in the feed both in the FCS and FRS.
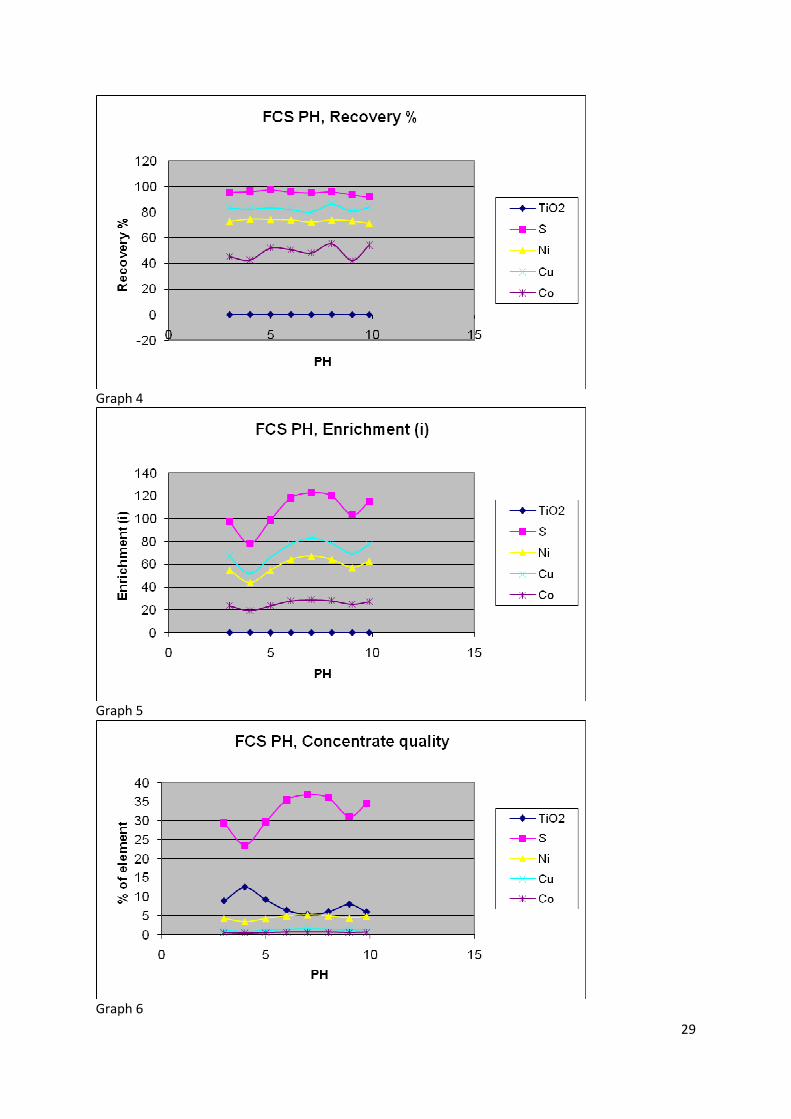
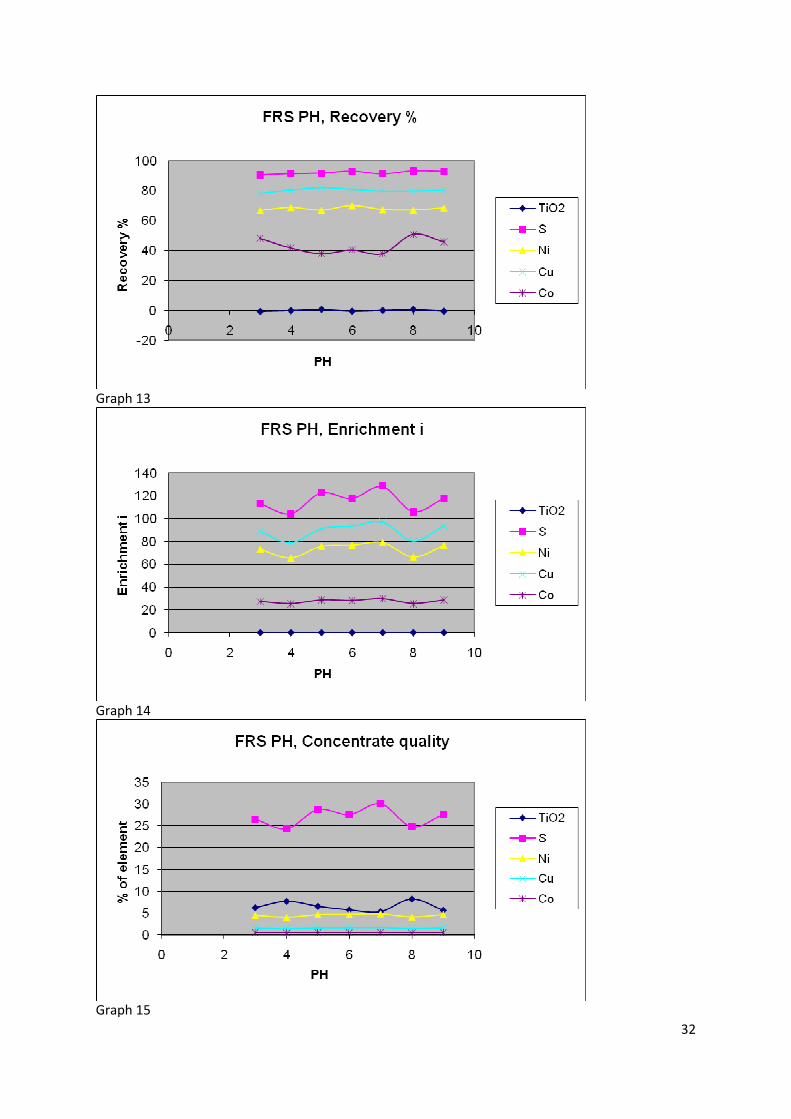
pH
Recovery
The recovery of both FCS and FRS is not significantly affected by the different PH conditions
(graphs 4 and 13). FCS sulphide recovery values vary between 91.8 % and 97.1 While FRS
values vary between 90.7 % and 93.3 %.
The S, Ni and Cu curves show the same stable trend while Co shows more variance, with
value ranges 42.1-55.5% (FCS) and 38.0-50.8 (FRS). Again the elements S and Cu have the
highest recovery closely followed by the element Ni.
These results do not show any loss in effectiveness of the collector (potassium amyl
xanthate) in the acidity range. The reason for this may be:
1) Xanthate decomposition reaction. The decompositions of Potassium Amyl Xanthate
could be a slow process and the time period involved in the laboratory tests too
short. It is important to investigate this during continuous floatation with the pilot
cell tests, as the collector may stay longer in the floatation cell.
2) Quantity of xanthate. According to the FCS xanthate tests 50 g/t (33 g/t for FRS) is
enough to reach the maximum recovery within 6 minutes at PH 7. Although the
xanthate may gradually be decomposed enough intact xanthate would remain to
react with the sulphide minerals.
Enrichment
In the enrichment curves a certain general trend is visible in both FCS and FRS (graphs 5 and
14). The S curves have a peak (FCS i=122,6, FRS i=128,26 for the element S) at pH 7. On both
sides of the peak in the acid and alkali range a minimum is present. For FCS the minimums
are at PH 4 (i=78,3) and 9 (i=103,09), for FRS the minimums are at PH 4 (i=103,96)and 8
(i=105,88) for the element S. FRS also has a minimum at PH 6. This one however is not as
significant as the ones at PH 4 and 8. It is also not present in the curves representing Ni and
Cu enrichment. It is known from literature that xanthate is more effective under alkaline
conditions. However the recovery values stated the xanthate was still effective in acid
conditions down to PH 3 (read recovery part).
Another way in which xanthate may lose its effectiveness is by losing its selectiveness.
Minerals that do not react with xanthate at a certain pH may be floated at another PH. (see:
Principles of Mineral Dressing, A.M. Gaudin, critical PH). Because the recovery curves
representing S, Ni,Cu and to a certain extend Co are rather constant the recovery
effectiveness of xanthate is not depending on the pH (under the standard testing
conditions). The difference in enrichment is therefore likely to have been caused by a loss in
15
selectiveness at pH 4 and 8-9. Under these pH conditions apparentlyother minerals present
in the slurry float. This as a result lowers the enrichment of sulphide, nickel, copper and
cobalt.
Concentrate quality
A clear inverse correlation is visible between TiO2 and S (graphs 6 and 15). In the FRS results
at pH 7 the TiO2 curve does not show any link to the dip in the S curve. This could support
the statement that the dip at pH 7 in the S curve is an imperfection in the
measurement/error. Both concentrates have the best quality at pH 7: FCS 36,9 % (S) and 5,4
% (TiO2), FRS 30,0 % (S) and 5,3 % (TiO2).

16
Xanthate
Recovery
Both the FCS an FRS recovery curves reach a maximum (graphs 7 and 16). In the FCS curves
the elements related to sulphide bearing minerals have a peak recovery at 58 g/t. The
greatest recovery differences are in the lower range from 17 g/t up to 50 g/t. The Time
recovery curves showed a maximum recovery had already been achieved at a 4 minute
interval (with 50 g/t). During the xanthate test the time was set at 6 minutes in all
measurements (see appendix: standard conditions). Any difference in recovery must
therefore be related to the added quantity of xanthate. Up to 50 g/t the added xanthate
quantity has a limiting effect on the recovery.
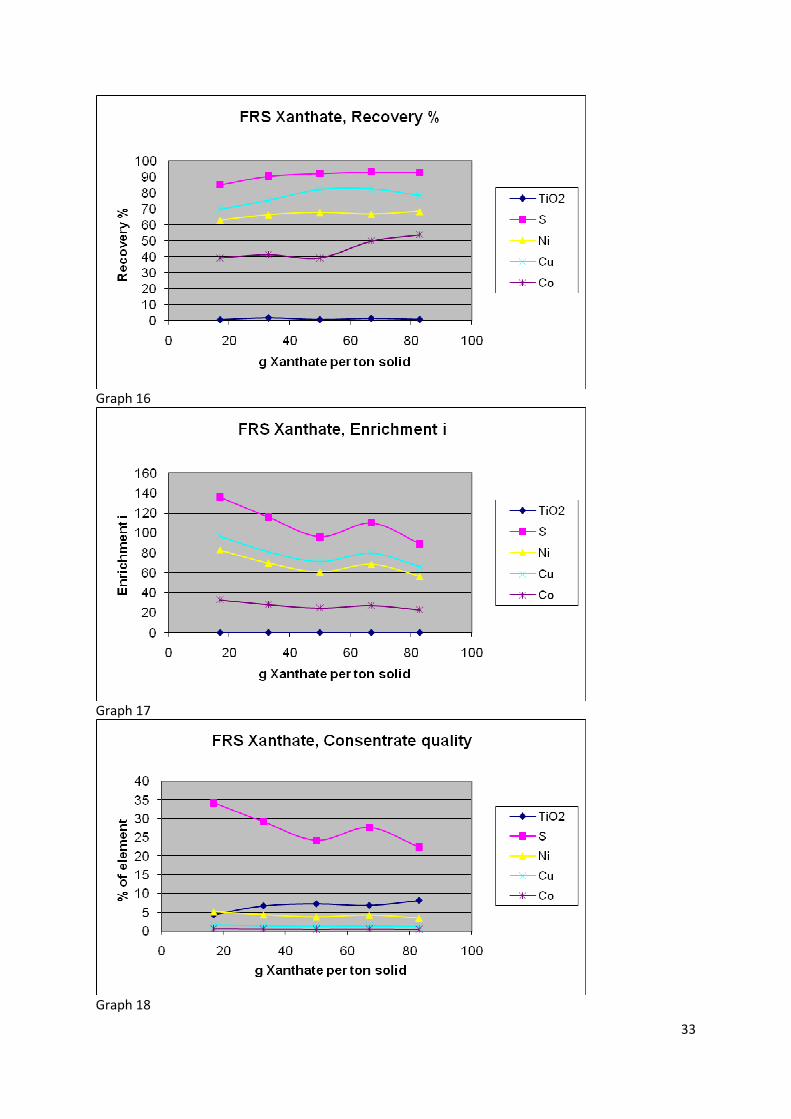
In the FRS results this limiting effect is less visible although it can be recognized in the S
curve in the range from 17 g/t to 33 g/t and to a less extend up to 50 g/t. Because the
concentration of sulphide bearing minerals in the FRS stream is lower less xanthate is
needed to achieve a maximum recovery.
The relation between sulphide bearing mineral recovery and g/t can be explained with the
probability formula (Ullmann’s Encyclopedia of Industrial Chemistry). The easiest particles
will be floated first. These are the particles composed of only one sulphide bearing mineral
or where the sulphide bearing mineral is dominant. Higher g/t values enhance the chance of
particles to come into contact with the reagent (higher chance of particle reagent bonding =
higher Pa). This will cause particles in which sulphide bearing minerals are not dominant to
be floated successfully as well. A peak recovery is achieved when no particle remains that
can effectively be floated even with higher values of g/t. The concentration of valuable
minerals in the remaining particles is so low that not enough air bubbles can bind to
overcome the gravitational force.
Enrichment
Great variations are visible in enrichment of both the FCS and FRS streams (graphs 8 and
17). In the FCS sulphide curve the values vary between i=81.0 – 152.4. In the FRS sulphide
curve the values vary between i=89.2 – 135.7. Not only is the enrichment range extensive,
but the FCS and FRS curve show different patterns of maximums and minimums.
The highest recoveries are achieved in the lower values of g/t. As the g/t rises the general
trend of the curves is dropping. This is in line with the higher “recovery=lower enrichment
principle” (B.A. Wills and T.J.Napier-munn, Will’s Mineral Processing Technology, page 295)
A low recovery indicates only the easiest particles have yet been floated. These are the
particles that consist of nearly pure sulphide bearing minerals. A higher recovery means
more particles with partially tailing minerals are being floated. As a result the enrichment of
the concentrate drops. This is only true if the reagent used for the floatation is known to be
an effective collector for the minerals present in the slurry.
FCS and FRS will be discussed separately.
FCS
Between 17 g/t and 33 g/t the recovery curve has the highest positive gradient (graph 8). In
these ranges the easer particles are floated and only a minor constant amount of tailing
17
material reaches the concentrate. The recovery rises and as a result the enrichment does so
too. At 33 g/t peak enrichment is reached. After this peak the recovery keeps rising however
more difficult particles start to be floated resulting in more invaluable material reaching the
concentrate. An inverse correlation between recovery % and enrichment (i) is reached. (see
description above.)
FRS
It was stated before that the FRS recovery curve at 33 g/t (graph 17) are much closer too
their maximum recovery than the FCS recovery curves under the same conditions. (due to
lower concentration of sulphide bearing minerals in the feed). The FRS enrichment curve
therefore immediately follows a inverse correlation with the recovery % curve. The 67 g/t
measurement remains inexplicable. Further tests could be done to find out if we are dealing
with an exception/error.
Concentrate quality
Again concentrate quality and enrichment curves are highly similar in trend (graphs 9 and
18). Both FCS and FRS have the best quality in the lower g/to values. 33 g/t for FCS and 17
g/t for FRS.
18
7. Pilot cell tests
For the first tests with the pilot cell the most ideal stream was used, FCS. The first test was a
batch test with the same standard conditions used in the laboratory tests. The propeller
speed and air supply was adjusted to the point at which all particles were kept in suspension
avoiding excessive turbulence that would destroy the froth layer. No preconditioning was
used.
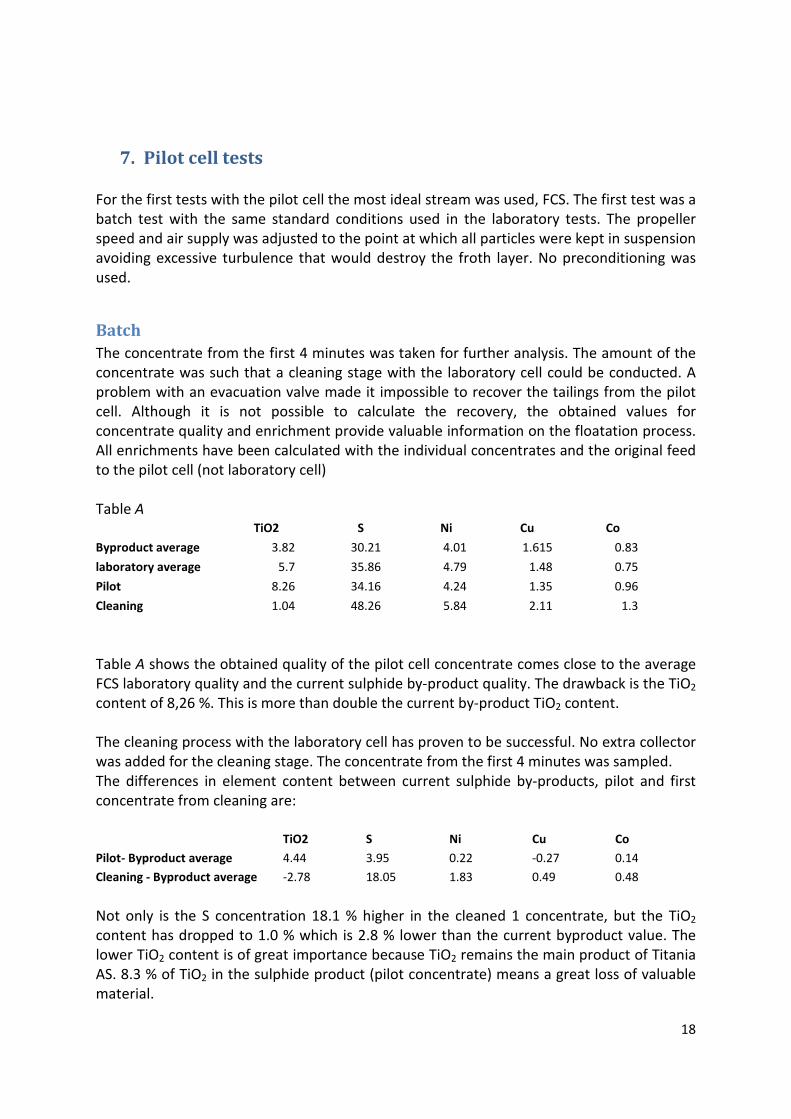
Batch
The concentrate from the first 4 minutes was taken for further analysis. The amount of the
concentrate was such that a cleaning stage with the laboratory cell could be conducted. A
problem with an evacuation valve made it impossible to recover the tailings from the pilot
cell. Although it is not possible to calculate the recovery, the obtained values for
concentrate quality and enrichment provide valuable information on the floatation process.
All enrichments have been calculated with the individual concentrates and the original feed
to the pilot cell (not laboratory cell)
Table A
TiO2 S Ni Cu Co
Byproduct average 3.82 30.21 4.01 1.615 0.83
laboratory average 5.7 35.86 4.79 1.48 0.75
Pilot 8.26 34.16 4.24 1.35 0.96
Cleaning 1.04 48.26 5.84 2.11 1.3
Table A shows the obtained quality of the pilot cell concentrate comes close to the average
FCS laboratory quality and the current sulphide by-product quality. The drawback is the TiO2
content of 8,26 %. This is more than double the current by-product TiO2 content.
The cleaning process with the laboratory cell has proven to be successful. No extra collector
was added for the cleaning stage. The concentrate from the first 4 minutes was sampled.
The differences in element content between current sulphide by-products, pilot and first
concentrate from cleaning are:
TiO2 S Ni Cu Co
Pilot- Byproduct average 4.44 3.95 0.22 -0.27 0.14
Cleaning - Byproduct average -2.78 18.05 1.83 0.49 0.48
Not only is the S concentration 18.1 % higher in the cleaned 1 concentrate, but the TiO2
content has dropped to 1.0 % which is 2.8 % lower than the current byproduct value. The
lower TiO2 content is of great importance because TiO2 remains the main product of Titania
AS. 8.3 % of TiO2 in the sulphide product (pilot concentrate) means a great loss of valuable
material.

19
Continuous
During the first continuous test the reagent dosage was not precise. By diluting the reagents
we were able to minimize the error. The second test was successful. The quantities of
concentrate were high enough to include a cleaning stage with the pilot cell.
concentrate
quality TiO2 S Ni Cu Co
Byproduct average 3.82 30.21 4.01 1.62 0.83
Laboratory
average 5.7 35.86 4.79 1.48 0.75
Pilot 16.88 23.24 3.31 1.028 0.70
Cleaning 0.87 48.77 7.71 3.66 1.26
The results from the continuous pilot cell test do not differ significantly from the batch test.
Sulfide bearing minerals were floated successfully, (S = 48.7 % in the cleaning concentrate).
Again the TiO2 concentration in the pilot cell concentration is too high. In the continuous
test it is twice as high as in the batch test. The cleaning stage is a good solution to avoid
loosing to much TiO2 (from 16.88 % to 0.87 % TiO2 due to cleaning stage).
(figure 7 and 8 clearly show the difference in the first flotation stage and the cleaning stages.
The cleaning stage has a much thicker and compact froth layer than in the first concentrate)
Figure 8, cleaning stage Figure 7, first concentrate
20
8. Conclusion
General observations conclude that potassium amyl xanthate is not optimized as a collector
for siegenite. Chalcopyrite is the most effectively floated mineral. Although the Cu
enrichment is higher than the one for Ni, it is not high enough to overcome the
concentration differences in the feed. TiO2 and S show an inverse correlation in
concentration as expected. Furthermore the principle of high recovery low quality is
especially visible in the xanthate tests. Although some optimum values can be defined the
reaction does not seem to be very dependent on either the reagent amount, pH value or
retention time. No extreme variations are present in the results.
Both the FCS and FRS concentrates were relatively close to the present by-product. Only the
TiO2 content remains high. Even if the FRS average concentrate has a lower S content it still
has a decent quality.
Cobalt should not be taken into account too seriously in further result analysis as this
element shows no clear pattern.
The FCS reached a maximum recovery at 4 minutes the enrichment and concentrate quality
show a peak at the 6 minute measurement. The 6 minute interval can therefore be regarded
as the optimal time interval. Pilot cell tests should be conducted within the range of 4 to 7
minutes.
The xanthate quantity tests showed a maximum recovery had been reached at 50 g/t The
highest enrichment and concentrate quality were at 33 g/t. More laboratory test should be
done to investigate if the result truly have so much variations or if errors are responsible for
the maximums and minimums. Now the best range to test with the pilot cell would be from
25 to 58 g/t This range includes all three peak values for recovery, enrichment and
concentrate quality.
The PH did not affect the recovery effectiveness of xanthate. It may however have affected
the selectiveness which could be an explanation for the minimum values in the enrichment
and concentrate quality curves. A general trend shows the xanthate is more effective from
PH 6 and higher. The recommended testing range for the pilot cell tests would be from PH 6
to 9. The FCS stream should also be tested under original PH.
Except from the Co curve for recovery the FRS time tests results showed great similarity
with the FCS results. The recovery curve for sulphide is relatively horizontal indicating a
maximum recovery may already have been reached at a 2 minute interval. Highest
enrichment and concentrate quality were obtained at the 6 minute measurement. The
recommended time range would be from 4 to 7 minutes, similar to FCS.
A higher xanthate quantity enables more difficult particles (intergrowth particles) to be
floated as well. The enrichment is the highest in the lower range of added xanthate
quantities. The enrichment and recovery are inversely correlated. Only the measurement at
67 g/t is inexplicable. Further test could reveal if this is an error or not. The general
concentrate quality trend shows the best concentrate quality is reached with xanthate
amounts of 17 to 33 g/t. The recommended range for the pilot cell tests would be from 17 g
to 50 g per ton. An optimum between recovery and quality is more likely to be found in this
range than with 67 g/t, making further investigation to a possible error at 67 g/t of limited
importance.

21
The PH does not really affect the recovery effectiveness. A loss of selectiveness may be the
cause of the minimum values in the enrichment and concentrate quality curves (similar to
FCS). At PH 6 an error may be present. A small minimum is present in the S curve but no
maximum is visible in the TiO2 curve which is inversely correlated to the TiO2 concentrate
quality curve. The more promising range to test would be from PH 5 to 8. The slurry should
also be tested with the original PH.
The Pilot cell installation has been completed and the first tests have brought promising
results. The machine is working. The batch and continuous tests do not differ significantly
from each other. Both are of higher quality than the current by product. The cleaning stage
is an effective process to reduce the high TiO2 content in the pilot cell concentrate. The
tailings from the cleaning process should be recirculated to avoid losing the remaining
sulfide minerals and TiO2. The process now has to be optimized taking into account the
recommendations based on the laboratory test results.
22
9. Literature list
Arthur F. Taggart, Handbook of Mineral Dressing, ores and industrial minerals.
Fourth printing, September 1950.
A.M. Gaudin, Principles of Mineral Dressing.
First edition
Page 367-399
Baki Yarar, Ullmann’s Encyclopedia of Industrial Chemistry flotation report.
Sixth edition.
B.A. Wills and T.J.Napier-munn, Will’s Mineral Processing Technology
Seventh edition, 2006.
Page 267-296
23
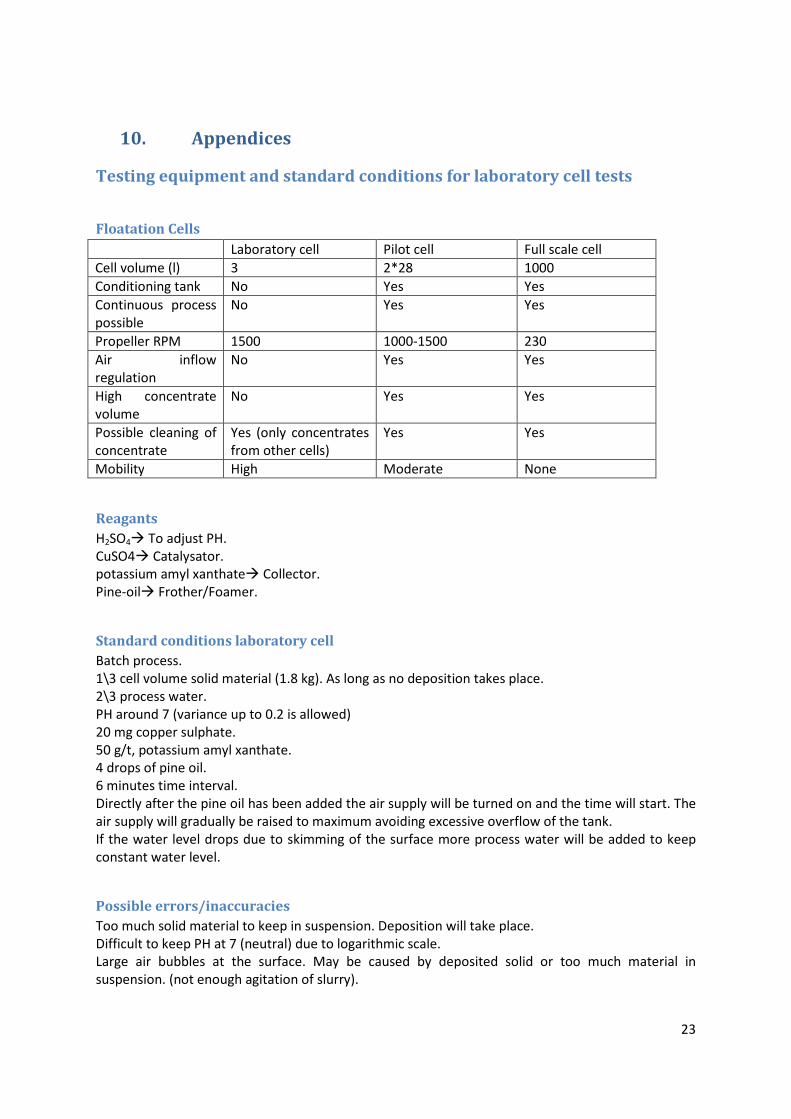
10. Appendices
Testing equipment and standard conditions for laboratory cell tests
Floatation Cells
Laboratory cell Pilot cell Full scale cell
Cell volume (l) 3 2*28 1000
Conditioning tank No Yes Yes
Continuous process
possible
No Yes Yes
Propeller RPM 1500 1000-1500 230
Air inflow
regulation
No Yes Yes
High concentrate
volume
No Yes Yes
Possible cleaning of
concentrate
Yes (only concentrates
from other cells)
Yes Yes
Mobility High Moderate None
Reagants
H2SO4� To adjust PH.
CuSO4� Catalysator.
potassium amyl xanthate� Collector.
Pine-oil� Frother/Foamer.
Standard conditions laboratory cell
Batch process.
1\3 cell volume solid material (1.8 kg). As long as no deposition takes place.
2\3 process water.
PH around 7 (variance up to 0.2 is allowed)
20 mg copper sulphate.
50 g/t, potassium amyl xanthate.
4 drops of pine oil.
6 minutes time interval.
Directly after the pine oil has been added the air supply will be turned on and the time will start. The
air supply will gradually be raised to maximum avoiding excessive overflow of the tank.
If the water level drops due to skimming of the surface more process water will be added to keep
constant water level.
Possible errors/inaccuracies
Too much solid material to keep in suspension. Deposition will take place.
Difficult to keep PH at 7 (neutral) due to logarithmic scale.
Large air bubbles at the surface. May be caused by deposited solid or too much material in
suspension. (not enough agitation of slurry).
24
A constant amount of tailing mineral will always reach the concentrate, this is due to: the
intergrowth characteristics of particles and tailing minerals reaching the froth layer. Also while
skimming manually fluid from under the froth layer may be skimmed out of the cell and reach the
concentrate. This fluid contains tailing minerals.
In pilot cell, inaccurate dosage of reagents.
If the concentrates are left too long in the oven, they will oxidize. This can ruin the concentrate.
Floatation probability formula
(Ullmann’s Encyclopaedia of Industrial Chemistry)
The ultimate objective of a flotation process is the selective removal of solid particles from the
aqueous medium which is accomplished by the adhesion of air bubbles to the hydrophobic
particles/collector. Particle floatability can be treated as a probability.
Pf = Pc*Pa*Ps
Pf = probability of flotation
Pc = probability of particle – bubble collision
Pa = probability of particle – bubble adhesion
Ps = probability of formation of a stable particle – bubble aggregate
25
Minerals in the Tellnes ore
Minerals in the Tellnes-ore Distribution
Composition Density Ore Grav. Cons Acidplant kons
Ilmenite FeTiO3, (FeO, MgO)TiO2 (Hem13) 4.7 39.9 93.3 94.3
Hematite Fe2O3 5,2 - 5,3
Magnetite Fe3O4 (Ilmenomagnetite) 5.2 1.5 0.4 0.3
Sulphide Several, ref eget oppsett 4,2 - 5,0 0.3 0.6 0.1
Rutile TiO2 4.2
Clinopyroxene (Ca(Mg, Fe2+)AlFe3+Ti {(Si, Al)2O6} ca. 3,4 6.5 1.5 0.9
Orthopyroxene (Mg, Fe)SiO3 (En77-75) ca. 3,5 8.6 2 3.3
Plagioclase (NaAlSi3O8)(CaAl2Si2O8) (An45-42) 2.6 36.9 1.3 0.5
Biotite K(Mg)3{AlSi3O10}(OH,F)2 3.0 4.2 0.2 0.2
Amfibol * NaCa2(Mg, Fe, Al)5(Al, Si)8O22(OH)2 3,3 - 3,5
Apatite Ca(PO4)3(F,Cl,OH) 3.2 0.6 0.2 0.04
Spinel (several) (Mg,Fe,Zn)Al2O3 3,6 - 4,0 1.5 0.5 0.4
clay minerals
Chlorite (Mg,Fe,Al)6(Al,Si4)O10(OH)8 2,6 - 3,4
Talc Mg3SiO4O10(OH)2 2.8
SUM 100.0 100.0 100.0
Composition of sulphide minerals in the Tellnes-ore
Sulphides
Ni/S % S % Fe % Ni % Cu % Co Ni/S *
Pyrite FeS2 < 0,01 53.45 46.55
Pyrrhotite Fe1-xS < 0,01 37.67 62.33
Pentlandite (Fe,Ni)9S8 1.03 33.23 32.56 34.21 1.03
Violarite (Fe,Ni)3S4 0.69 42.54 18.52 38.93 0.92
Siegenitte (Ni,Co)3S4 0.38 42.12 43.36 14.51 1.03
Millerite NiS 1.83 35.33 64.67 1.83
Chalcopyrite CuFeS2 < 0,01 34.94 30.43 34.63
26
Processing flow chart

27
Gravimetric plant
28
Graphs
Graph 1
Graph 2
Graph 3
29
Graph 4
Graph 5
Graph 6
30
Graph 7
Graph 8
Graph 9
31
Graph 10
Graph 11
Graph 12
32
Graph 13
Graph 14
Graph 15
33
Graph 16
Graph 17
Graph 18