Sulfate exports from multiple catchments in a glaciated …udel.edu/~inamdar/papers/EMAS2008.pdf ·...
19
Sulfate exports from multiple catchments in a glaciated forested watershed in western New York, USA Shreeram P. Inamdar & Myron J. Mitchell Received: 30 November 2006 / Accepted: 18 May 2007 / Published online: 14 July 2007 # Springer Science + Business Media B.V. 2007 Abstract Sulfate (SO 2 4 ) concentrations and fluxes were studied for multiple storm events in the Point Peter Brook watershed, a glaciated, forested water- shed located in Western New York, USA. Investiga- tions were performed across one large (696 ha) and three small (1.6–3.4 ha) catchments with varying extent of riparian and wetland areas. Concentrations of SO 2 4 in groundwater sources (mean values: 238– 910 μmol c L −1 ) were considerably greater than concentrations recorded for rainfall (60 μmol c L −1 ) and throughfall (72–129 μmol c L −1 ). Seasonality in SO 2 4 concentrations was most pronounced for valley- bottom riparian waters with maximum concentrations in late winter–spring (February–March) and a mini- mum in late summer (August). Concentrations of SO 2 4 in wetland water were considerably less than riparian water indicating the likelihood of SO 2 4 reduction in anoxic wetland conditions. Storm events displayed a dilution pattern in SO 2 4 concentrations with a minimum coinciding with the maximum in throughfall contributions. End member mixing anal- ysis (EMMA) was able to predict the storm event concentrations of SO 2 4 for four of the six compar- isons. Concentrations of SO 2 4 at the outlet of the large (696 ha) catchment were much greater than values recorded for the smaller catchments. Exports of SO 2 4 in streamflow exceeded the inputs from atmospheric deposition suggesting that watersheds like Point Peter Brook may not show any immediate response to decreases in atmospheric SO 2 4 deposition. Keywords Sulfur . Atmospheric deposition . Wetlands . EMMA . Storm events . Hydrochemistry Introduction Atmospheric deposition of sulfate (SO 2 4 ) in the northeastern United States (US) has shown a decreas- ing trend over the last few decades (Likens et al. 2002). Although stream concentrations in most watersheds are also declining (Likens et al. 2002), the mass exports of SO 2 4 from others continue to exceed the inputs of SO 2 4 from atmospheric deposi- tion (Hornbeck et al. 1997; Likens et al. 2002). The reasons for these mass balance discrepancies has not been completely ascertained, but possibilities include: (1) unaccounted inputs of dry deposition (Edwards et al. 1999; Likens et al. 2002); (2) net mineralization of sulfur (S) from soil organic matter (Eimers and Dillon 2002; Eimers et al. 2004; Shanley et al. 2005); (3) desorption of SO 2 4 from anion exchange sites in Environ Monit Assess (2008) 139:227–245 DOI 10.1007/s10661-007-9830-z S. P. Inamdar (*) Bioresources Engineering, University of Delaware, 260 Townsend Hall, 531 S College Ave, Newark, DE 19716, USA e-mail: [email protected] M. J. Mitchell Faculty of Environment and Forest Biology, SUNY-ESF, Syracuse, NY, USA
Transcript of Sulfate exports from multiple catchments in a glaciated …udel.edu/~inamdar/papers/EMAS2008.pdf ·...

Sulfate exports from multiple catchments in a glaciatedforested watershed in western New York, USA
Shreeram P. Inamdar & Myron J. Mitchell
Received: 30 November 2006 /Accepted: 18 May 2007 / Published online: 14 July 2007# Springer Science + Business Media B.V. 2007
Abstract Sulfate (SO2�4 ) concentrations and fluxes
were studied for multiple storm events in the PointPeter Brook watershed, a glaciated, forested water-shed located in Western New York, USA. Investiga-tions were performed across one large (696 ha) andthree small (1.6–3.4 ha) catchments with varyingextent of riparian and wetland areas. Concentrationsof SO2�
4 in groundwater sources (mean values: 238–910 μmolc L−1) were considerably greater thanconcentrations recorded for rainfall (60 μmolc L−1)and throughfall (72–129 μmolc L−1). Seasonality inSO2�
4 concentrations was most pronounced for valley-bottom riparian waters with maximum concentrationsin late winter–spring (February–March) and a mini-mum in late summer (August). Concentrations ofSO2�
4 in wetland water were considerably less thanriparian water indicating the likelihood of SO2�
4
reduction in anoxic wetland conditions. Storm eventsdisplayed a dilution pattern in SO2�
4 concentrationswith a minimum coinciding with the maximum inthroughfall contributions. End member mixing anal-ysis (EMMA) was able to predict the storm event
concentrations of SO2�4 for four of the six compar-
isons. Concentrations of SO2�4 at the outlet of the
large (696 ha) catchment were much greater than valuesrecorded for the smaller catchments. Exports of SO2�
4 instreamflow exceeded the inputs from atmosphericdeposition suggesting that watersheds like Point PeterBrook may not show any immediate response todecreases in atmospheric SO2�
4 deposition.
Keywords Sulfur . Atmospheric deposition .
Wetlands . EMMA . Storm events . Hydrochemistry
Introduction
Atmospheric deposition of sulfate (SO2�4 ) in the
northeastern United States (US) has shown a decreas-ing trend over the last few decades (Likens et al.2002). Although stream concentrations in mostwatersheds are also declining (Likens et al. 2002),the mass exports of SO2�
4 from others continue toexceed the inputs of SO2�
4 from atmospheric deposi-tion (Hornbeck et al. 1997; Likens et al. 2002). Thereasons for these mass balance discrepancies has notbeen completely ascertained, but possibilities include:(1) unaccounted inputs of dry deposition (Edwardset al. 1999; Likens et al. 2002); (2) net mineralizationof sulfur (S) from soil organic matter (Eimers andDillon 2002; Eimers et al. 2004; Shanley et al. 2005);(3) desorption of SO2�
4 from anion exchange sites in
Environ Monit Assess (2008) 139:227–245DOI 10.1007/s10661-007-9830-z
S. P. Inamdar (*)Bioresources Engineering, University of Delaware,260 Townsend Hall, 531 S College Ave,Newark, DE 19716, USAe-mail: [email protected]
M. J. MitchellFaculty of Environment and Forest Biology, SUNY-ESF,Syracuse, NY, USA

soils that previously adsorbed SO2�4 during elevated
periods of deposition (Alewell et al. 1999; Eimers andDillon 2002; Eimers et al. 2004); (4) weathering ofprimary S minerals from geological substrate (Baileyet al. 2004; Baron et al. 1995; Mitchell et al. 2001a);and (5) release of SO2�
4 due to oxidation of reducedsulfide from wetlands (Bayley et al. 1986; Devito andHill 1997, 1999; Lazerte 1993; Mitchell et al. 2006;Warren et al. 2001).
Mineral sources of SO2�4 include oxidation prod-
ucts of iron sulfides (pyrite, FeS2; pyrrhotite, FeS)which are common in bedrock formations of sedi-mentary and volcanic origin while other S-bearingminerals have been reported in the glacial till ofnortheastern US watersheds (Bailey et al. 2004;Shanley et al. 2005). Hornbeck et al. (1997) foundthat SO2�
4 exports from Sleepers River watershed inVermont were more than two times the inputs fromatmospheric deposition and attributed it to geologicrelease of S. Similarly, Mitchell et al. (1986) andGibson et al. (1983) found substantial geological Ssources for some catchments in the Rocky Mountainsof North America.
Wetlands have been reported as sinks as well assources of S depending on hydrologic conditions inthe watershed (Bayley et al. 1986; Devito and Hill1997; LaZerte 1993). Large releases of SO2�
4 havebeen reported from wetlands following dry summerperiods which promote oxidation of reduced sulfides(Devito and Hill 1997; Eimers and Dillon 2002). Incontrast, wetlands have been found to retain S inyears with average or wet summers (LaZerte 1993).Sulfur dynamics in wetlands may also be influencedby hydrogeologic settings. Devito and Hill (1997)working in Precambrian Shield catchments of southcentral Ontario in Canada found that valley-bottomwetlands with thin glacial tills were susceptible tolarge water table drawdowns and therefore release ofaccumulated S due to oxidation. In comparison,wetlands with deeper till depths remained saturatedyear-round and thus efficiently retained S. Hydrologicconnectivity of wetlands to streams has also beenfound to influence the export of SO2�
4 in streamflow(Warren et al. 2001). Although desorption of S fromsoils has been identified in a number of studies,Driscoll et al. (1998) and Bailey et al. (2004) assertthat desorption may not be a significant source ingeologically young soils of northeastern US.
These studies show that SO2�4 exports from water-
sheds may be influenced by a variety of sources.Internal sources of SO2�
4 have important implicationsfor how and when watersheds will respond to reducedatmospheric deposition and recover from deleteriousimpacts of SO2�
4 pollution. The exports of SO2�4 may
also vary with hydrologic flow paths in the watershed(Huntington et al. 1994; Lynch and Corbett 1989;Mitchell et al. 2006). Hence, to understand andquantify the processes affecting the exports of SO2�
4
it is critical we: (a) identify the internal sources; (b)determine the hydrologic flow paths that intersectthese sources; and (c) determine how SO2�
4 exportsvary across watersheds with wetlands and/or satu-rated areas. Investigations performed across multiplecatchments with varying landscape characteristicsand hydrologic conditions can especially provideimportant insights.
We explored the exports of SO2�4 across one large
(696 ha) and three small (1.6–3.4 ha) catchments withvarying extent of saturated areas and wetlands. Thesecatchments were located in the Point Peter Brookwatershed, a glaciated, forested watershed in westernNew York, USA. Sulfate concentrations in streamflowat Point Peter Brook were much greater (as high as1,000 μmolc L
−1) than values reported for many otherwatersheds in the Northeastern US and Canadasuggesting that the Point Peter Brook watershed hasa substantial internal SO2�
4 source. Sampling for SO2�4
was performed during storm events and non-stormperiods over three years. Special emphasis was placedon investigating the within-event patterns of SO2�
4 ,the sources of SO2�
4 in the watershed, and theinfluence of valley-bottom wetlands and/or saturatedareas on the export of SO2�
4 . Specific questions thatwere addressed in this study were:
& How do concentrations of SO2�4 in the Point Peter
Brook watershed compare with data from otherwatersheds? What are the sources of SO2�
4 in thewatershed?
& How do SO2�4 concentrations vary during and
among storm events? Can storm-event patterns beexplained by the relative contributions of water-shed SO2�
4 sources?& How do SO2�
4 concentrations and exports varyacross catchments with varying extent of saturatedand wetland areas?
228 Environ Monit Assess (2008) 139:227–245

Site description and monitoring
Site description
This study was conducted in the Point Peter Brookwatershed (Fig. 1), located in Cattaraugus County and55 km southeast of Buffalo in New York State, USA(420 26′ 30″ N; −780 55′ 30″ W). Mean annual wintertemperature is −3°C and the mean summer tempera-ture is 21°C. Annual precipitation averages 1,006 mmof which 200–250 mm occurs as snow (20 yearaverage based on the National Atmospheric Deposi-tion Program Weather Station at Chautauqua, NY;35 km southwest of the Point Peter Brook watershed;NADP 2006). Atmospheric S deposition in the regionis fairly high. The two-year (2003–2004) average
annual deposition of SO2�4 recorded at the nearest
NADP station in Chautauqua, NY amounted to520 mol ha−1 (NADP 2006).
Bedrock geology in the region consists of stratifiedlimestone, dolomite with gypsum and shale of theUpper Devonian period (Olcott 1995). Some shalescan have high S contents; for e.g., the Devonian Shalein Ohio (Kane et al. 1990) has been reported to contain5.35% S by weight. The parent material was derivedfrom glacial till (Kent Drift of Woodfordian formed19,000 y B.P.) (Phillips 1988). Vegetation on ridgetopsand hillslopes is dominated by deciduous trees includ-ing sugar maple (Acer saccharum), black maple (Acernigrum), American beech (Fagus grandiflora), yellowbirch (Betula alleghaniensis) with larger proportions ofconifers including hemlock (Tsuga canadensis) and
Fig. 1 a Location of PointPeter Brook watershed(PPBW) in New York State,USA; b the study catch-ments; and c instrumenta-tion and sampling locationswithin the study catchments
Environ Monit Assess (2008) 139:227–245 229

white pine (Pinus strobus) in valley-bottoms. Topog-raphy of the entire watershed is fairly distinct withwide ridgetops, steep hillslopes, and narrow valleybottoms. Slope gradients in the watershed range from 0to 69%, with a mean gradient of 14%. Elevation rangesfrom 254 to 430 m above mean sea level. A low-permeability clay layer, that is a part of the till layer,generates perched water tables and forces water tomove as shallow subsurface flow on the steep hill-slopes underlies the soils. The depth to the clay/tillmeasured using soil cores varies from 1.2 to 1.7 m inthe valley-bottom locations, 0.3–0.5 m along the sideslopes and 0.6 m at the ridgetops.
The catchments that were studied (S1, S2, S3, andS5) are shown in Fig. 1. Outlet for S1 (696 ha) waslocated on the main drainage of the Point Peter Brookwatershed, S2 (3.4 ha) was nested within S1 and S3(1.6 ha) was nested within S2. The width of thestream at S1(third order drainage) was 3.4 m. Catch-ment S3 drained a hillslope hollow with streamfloworiginating from two perennial seeps S3a and S3b thatdischarged at the channel head (Fig. 1). The width ofthe stream at S3 (first order tributary) was 0.40 m.Outlet S2 was located in a valley-bottom riparian areadownstream of S3 and the width of the stream at S2(first order tributary) was 0.38 m. Catchment S5(1.9 ha) located outside and downstream of S1enclosed a valley-bottom riparian wetland. Runoff toS5 also originated from a seep (S8) located more thantwo-thirds of the distance along the contributinghillslopes along the northeastern edge (Fig. 1). The
width of the stream at S5 (first order tributary) was0.45 m.
Watershed boundaries, slope gradients, aspect, andspatial extent of hillslope and valley-bottom saturatedareas for the catchments were determined using acombination of field surveys and GIS-based analysis(Inamdar and Mitchell 2006). The spatial distributionof wetness was characterized by the downslopewetness index (DWI) of Hjerdt et al. (2004) and ispresented graphically in Inamdar and Mitchell (2006).The dominant slope aspect for all three smallsubcatchments was northwest, whereas 17% of thehillslopes for S1 were oriented to the west (Table 1).Field-surveyed surface-saturated areas were highestfor S5 at 5.9% of the catchment area followed by S2(2.0%) and S3 (0.8%). The valley-bottom wetland inS5 constituted 4.7% with 1.2% of the saturated areason hillslopes. Organic matter concentrations of thewetland soil were ∼ 70%. Soil thickness in the S5wetland was 1 m or less (above gravel/loose uncon-solidated material) and lower than that observed forthe riparian area at S2 (1.5–2 m). The valley-bottomriparian area in S2 accounted for only 0.7% of thesaturated area with the remaining saturation (1.3%) indiscrete pockets on hillslope benches. The organicmatter content of surficial (0–20 cm) soils in theriparian area at S2 was between 3 and 11%. Saturatedareas in S3 were limited to the channel head (0.8%).
The field-surveyed saturated area % values for thesmall catchments were compared against wet areascorresponding to various thresholds on the DWI map
Table 1 Watershed characteristics and topographic attributes for the four subcatchments
Attribute Subcatchments
S1 S2 S3 S5
Area (ha) 696 3.4 1.6 1.9Relief (m) 254–430 255–307 260–307 255–304Mean catchment gradient 14.1 14.3 15.0 14.9Stream order and width (m) 3rd, 3.4 1st, 0.38 1st, 0.4 1st, 0.45Field surveyed saturated area in % and m2 in parenthesisTotal – 2.0 (675) 0.8 (129) 5.9 (1122)Valley-bottom – 0.7 (231) 0 4.7 (896)Hillslope – 1.3 (444) 0.8 (129) 1.2 (226)Downslope wetness index (DWI) momentsMean 5.12 5.39 5.28 5.67Variance 1.98 1.34 1.36 2.60Skew 1.61 0.90 0.91 1.44% catchment area with DWI > 10 2.1 0.9 0.7 4.3
230 Environ Monit Assess (2008) 139:227–245
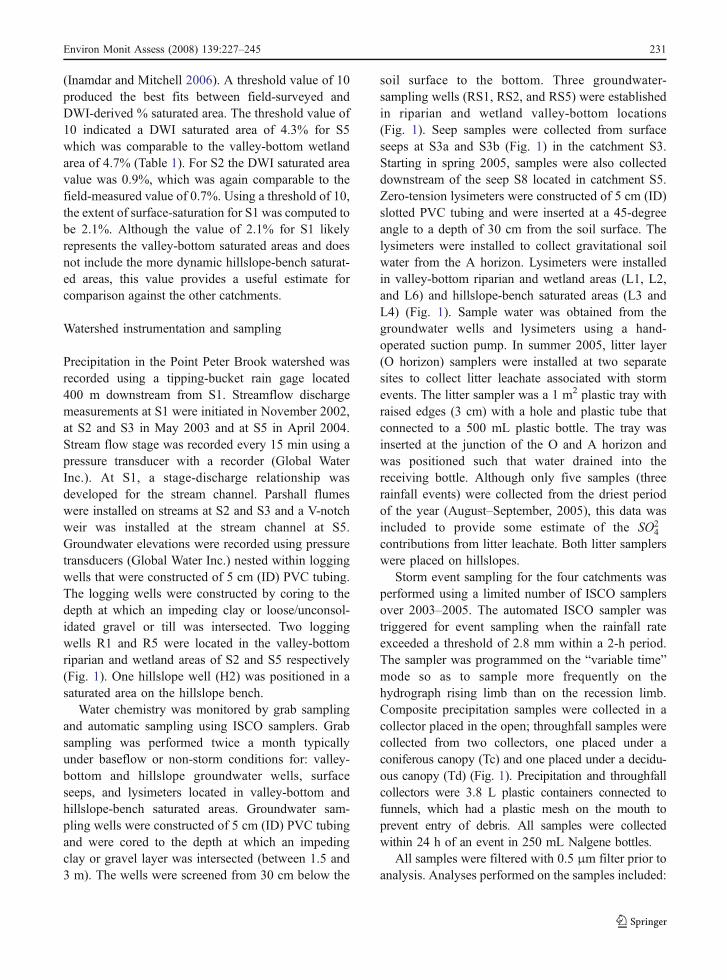
(Inamdar and Mitchell 2006). A threshold value of 10produced the best fits between field-surveyed andDWI-derived % saturated area. The threshold value of10 indicated a DWI saturated area of 4.3% for S5which was comparable to the valley-bottom wetlandarea of 4.7% (Table 1). For S2 the DWI saturated areavalue was 0.9%, which was again comparable to thefield-measured value of 0.7%. Using a threshold of 10,the extent of surface-saturation for S1 was computed tobe 2.1%. Although the value of 2.1% for S1 likelyrepresents the valley-bottom saturated areas and doesnot include the more dynamic hillslope-bench saturat-ed areas, this value provides a useful estimate forcomparison against the other catchments.
Watershed instrumentation and sampling
Precipitation in the Point Peter Brook watershed wasrecorded using a tipping-bucket rain gage located400 m downstream from S1. Streamflow dischargemeasurements at S1 were initiated in November 2002,at S2 and S3 in May 2003 and at S5 in April 2004.Stream flow stage was recorded every 15 min using apressure transducer with a recorder (Global WaterInc.). At S1, a stage-discharge relationship wasdeveloped for the stream channel. Parshall flumeswere installed on streams at S2 and S3 and a V-notchweir was installed at the stream channel at S5.Groundwater elevations were recorded using pressuretransducers (Global Water Inc.) nested within loggingwells that were constructed of 5 cm (ID) PVC tubing.The logging wells were constructed by coring to thedepth at which an impeding clay or loose/unconsol-idated gravel or till was intersected. Two loggingwells R1 and R5 were located in the valley-bottomriparian and wetland areas of S2 and S5 respectively(Fig. 1). One hillslope well (H2) was positioned in asaturated area on the hillslope bench.
Water chemistry was monitored by grab samplingand automatic sampling using ISCO samplers. Grabsampling was performed twice a month typicallyunder baseflow or non-storm conditions for: valley-bottom and hillslope groundwater wells, surfaceseeps, and lysimeters located in valley-bottom andhillslope-bench saturated areas. Groundwater sam-pling wells were constructed of 5 cm (ID) PVC tubingand were cored to the depth at which an impedingclay or gravel layer was intersected (between 1.5 and3 m). The wells were screened from 30 cm below the
soil surface to the bottom. Three groundwater-sampling wells (RS1, RS2, and RS5) were establishedin riparian and wetland valley-bottom locations(Fig. 1). Seep samples were collected from surfaceseeps at S3a and S3b (Fig. 1) in the catchment S3.Starting in spring 2005, samples were also collecteddownstream of the seep S8 located in catchment S5.Zero-tension lysimeters were constructed of 5 cm (ID)slotted PVC tubing and were inserted at a 45-degreeangle to a depth of 30 cm from the soil surface. Thelysimeters were installed to collect gravitational soilwater from the A horizon. Lysimeters were installedin valley-bottom riparian and wetland areas (L1, L2,and L6) and hillslope-bench saturated areas (L3 andL4) (Fig. 1). Sample water was obtained from thegroundwater wells and lysimeters using a hand-operated suction pump. In summer 2005, litter layer(O horizon) samplers were installed at two separatesites to collect litter leachate associated with stormevents. The litter sampler was a 1 m2 plastic tray withraised edges (3 cm) with a hole and plastic tube thatconnected to a 500 mL plastic bottle. The tray wasinserted at the junction of the O and A horizon andwas positioned such that water drained into thereceiving bottle. Although only five samples (threerainfall events) were collected from the driest periodof the year (August–September, 2005), this data wasincluded to provide some estimate of the SO2�
4
contributions from litter leachate. Both litter samplerswere placed on hillslopes.
Storm event sampling for the four catchments wasperformed using a limited number of ISCO samplersover 2003–2005. The automated ISCO sampler wastriggered for event sampling when the rainfall rateexceeded a threshold of 2.8 mm within a 2-h period.The sampler was programmed on the “variable time”mode so as to sample more frequently on thehydrograph rising limb than on the recession limb.Composite precipitation samples were collected in acollector placed in the open; throughfall samples werecollected from two collectors, one placed under aconiferous canopy (Tc) and one placed under a decidu-ous canopy (Td) (Fig. 1). Precipitation and throughfallcollectors were 3.8 L plastic containers connected tofunnels, which had a plastic mesh on the mouth toprevent entry of debris. All samples were collectedwithin 24 h of an event in 250 mL Nalgene bottles.
All samples were filtered with 0.5 μm filter prior toanalysis. Analyses performed on the samples included:
Environ Monit Assess (2008) 139:227–245 231

DOC on a Tekmar-Dohrmann Phoenix 8000 TOCanalyzer, cations on a Perkin-Elmer ICP-AEC Div3300 instrument, and anions on a Dionex IC. Thelaboratory is a participant in the United StatesGeological Survey (USGS) performance evaluationprogram, that helps ensure data quality (Mitchell et al.2001b).
Selection of storm events
Multiple storm events were monitored for S1, S2, S3,and S5 over the period May 2003 through August2005. Because of budget, equipment and personnelrestrictions not all catchments were sampled simulta-neously for all events. Events that are evaluated inthis study include: July 27 and August 9, 2003(summer events); April 12, May 20 and May 27,2004 (spring events); and August 30, 2005 (summerevent). These six events were selected since: (a) theyshowed clear and distinct temporal patterns in thesolutes; (b) were representative of the events for thoseseasons; and (c) had the most complete data set acrossthe catchments. Of these, four events – July 27 andAugust 9, 2003; May 20, 2004; and August 30, 2005were selected to display the detailed within eventpatterns of the SO2�
4 .
Event computations and statistics
The start of the event was defined when a perceptiblerise in discharge was observed after precipitation or theoccurrence of first ISCO sample, whichever occurredearlier. The end of the event was defined by the firstoccurrence of when discharge returned to pre-eventvalues or when a subsequent event began. Discharge perunit area or specific discharge (mm) was the totalvolumetric flow for the event divided by the catchmentarea. Antecedent moisture conditions for each stormwere computed by: (a) summation of the precipitationamounts for 7 days prior to the event (antecedentprecipitation index-API7); and (b) average of groundwater elevations (antecedent groundwater index-AGI7)for 7 days prior to the event. AGI7 values werecomputed using the riparian wells R1 and R5 and thehillslope-bench well H2. Groundwater elevations at H2varied over a larger range of values compared to wellsR1 and R5 and thus provided a more dynamic pictureof the changes in catchment wetness.
Runoff sources determined from EMMA and a modelfor runoff response
Spatial sources of runoff in the Point Peter Brookwatershed were previously identified by Inamdar andMitchell (2006) using silica (Si), magnesium (Mg2+),and dissolved organic carbon (DOC) as tracers in anend member mixing analysis (EMMA) model (Burnset al. 2001; Christopherson and Hooper 1992).EMMA identified groundwater discharged at seeps(SGW), throughfall (THF), and riparian water (RW)as the end members for stream chemistry. A three-stage model explaining the role of topography inrunoff generation and the temporal expression of thethree end members has been developed for the PointPeter Brook watershed (Inamdar and Mitchell 2007a).The three stages of runoff generation were: (a) Priorto storm events and during baseflow conditions,streamflow was composed of seep and ripariangroundwaters; (b) In the early part of the storm andon the rising limb of the hydrograph, throughfall wasintercepted on saturated areas and contributed tostreamflow as saturation overland flow; (c) Duringhydrograph recession, hydraulic gradients associatedwith subsurface hillslope runoff displaced riparianwater into the stream.
Results
Concentrations of SO2�4 in watershed compartments
The concentrations of SO2�4 varied considerably
across the watershed compartments (Fig. 2). Inaddition to SO2�
4 , concentrations of Mg2+ and Si werealso included in Fig. 2. High concentrations of Mg2+
and Si typically indicate groundwater or water thathave been in contact with bedrock, till, and/orsaprolite. Sulfate concentrations in rainfall and snowwere the lowest at 60 and 24 μmolc L
−1, respectively.Concentrations of SO2�
4 increased slightly as precip-itation percolated through the forest canopy and litterlayer. Sulfate concentrations in conifer throughfall(129 μmolc L−1) were nearly twice the deciduousvalue (72 μmolc L
−1). Concentrations in seep ground-water and hillslope groundwater (well HS1) weresimilar (442 and 472 μmolc L−1, respectively) butnearly eight times the precipitation value. While
232 Environ Monit Assess (2008) 139:227–245
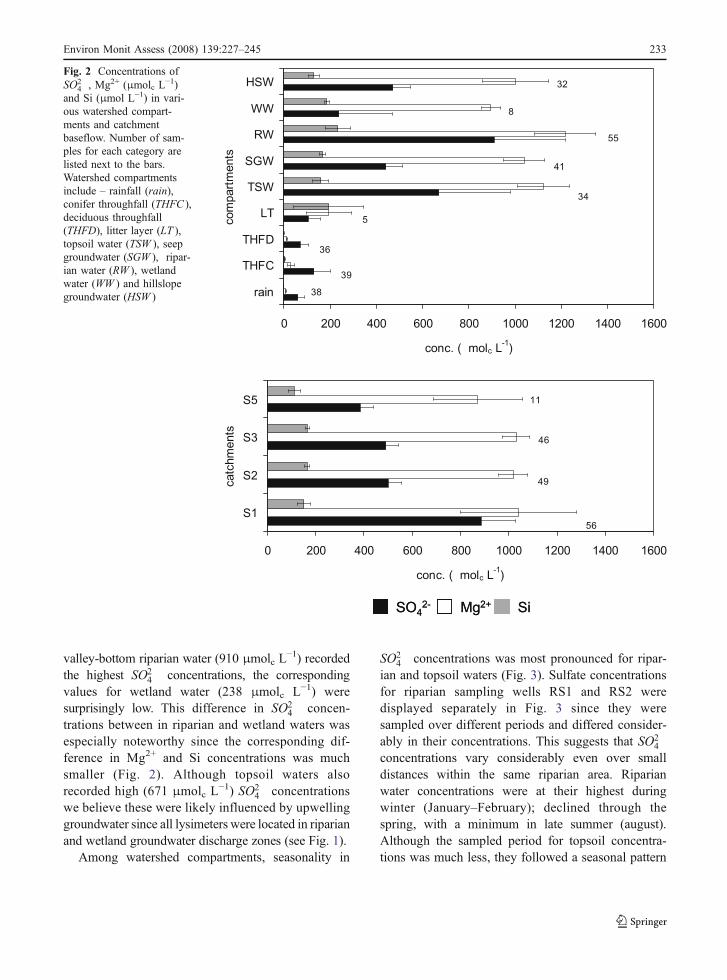
valley-bottom riparian water (910 μmolc L−1) recorded
the highest SO2�4 concentrations, the corresponding
values for wetland water (238 μmolc L−1) weresurprisingly low. This difference in SO2�
4 concen-trations between in riparian and wetland waters wasespecially noteworthy since the corresponding dif-ference in Mg2+ and Si concentrations was muchsmaller (Fig. 2). Although topsoil waters alsorecorded high (671 μmolc L
−1) SO2�4 concentrations
we believe these were likely influenced by upwellinggroundwater since all lysimeters were located in riparianand wetland groundwater discharge zones (see Fig. 1).
Among watershed compartments, seasonality in
SO2�4 concentrations was most pronounced for ripar-
ian and topsoil waters (Fig. 3). Sulfate concentrationsfor riparian sampling wells RS1 and RS2 weredisplayed separately in Fig. 3 since they weresampled over different periods and differed consider-ably in their concentrations. This suggests that SO2�
4
concentrations vary considerably even over smalldistances within the same riparian area. Riparianwater concentrations were at their highest duringwinter (January–February); declined through thespring, with a minimum in late summer (august).Although the sampled period for topsoil concentra-tions was much less, they followed a seasonal pattern
0 200 400 600 800 1000 1200 1400 1600
rain
THFC
THFD
LT
TSW
SGW
RW
WW
HSW
com
part
men
ts
conc. (µmolc L-1)
0 200 400 600 800 1000 1200 1400 1600
S1
S2
S3
S5
catc
hmen
ts
conc. (µmolc L-1)
38
39
36
5
34
41
55
8
32
56
49
46
11
SO42- Mg2+ SiSO42- Mg2+ Si
Fig. 2 Concentrations ofSO2�
4 , Mg2+ (μmolc L−1)
and Si (μmol L−1) in vari-ous watershed compart-ments and catchmentbaseflow. Number of sam-ples for each category arelisted next to the bars.Watershed compartmentsinclude – rainfall (rain),conifer throughfall (THFC ),deciduous throughfall(THFD), litter layer (LT ),topsoil water (TSW ), seepgroundwater (SGW ), ripar-ian water (RW ), wetlandwater (WW ) and hillslopegroundwater (HSW )
Environ Monit Assess (2008) 139:227–245 233

similar to that for riparian water. However unlikeriparian water, the other watershed compartments didnot reveal any distinct seasonal patterns in SO2�
4
concentrations. Sufficient data on wetland water wasnot available to identify any seasonal trends.
Concentrations in stream baseflow
Baseflow concentrations of SO2�4 for the largest
(696 ha) catchment S1 (Mean=885 μmolc L−1) were
significantly greater (p<0.01) than the values for the
smaller catchments (Fig. 2). In contrast, the meanconcentrations of Mg2+ and Si for catchment S1 werenot very different from the small catchments (Fig. 2).The ratio of mean SO2�
4 concentrations for S1 and S2was 1.77 while the corresponding values for Mg2+
and Si were 1.02 and 0.92, respectively. Among thesmaller catchments, mean baseflow SO2�
4 concentra-tions were least for the wetland catchment S5(385 μmolc L−1). Concentrations for catchment S5were significantly different from S2 and S3 (p<0.01),however there was no significant difference between
Fig. 3 Seasonal pattern ofSO2�
4 concentrations(μmolc L
−1) in variouswatershed compartments.Watershed compartmentsinclude – rain, coniferthroughfall (THFC), decid-uous throughfall (THFD),topsoil, seep groundwater(SGW), hillslope groundwa-ter (HSW), riparian water(RW – wells RS1 and RS2),and wetland water (WW)
Table 2 Hydrologic parameters for the six selected storm events across the four catchments
Shaded areas indicate events that were not sampled or data was not available.
234 Environ Monit Assess (2008) 139:227–245
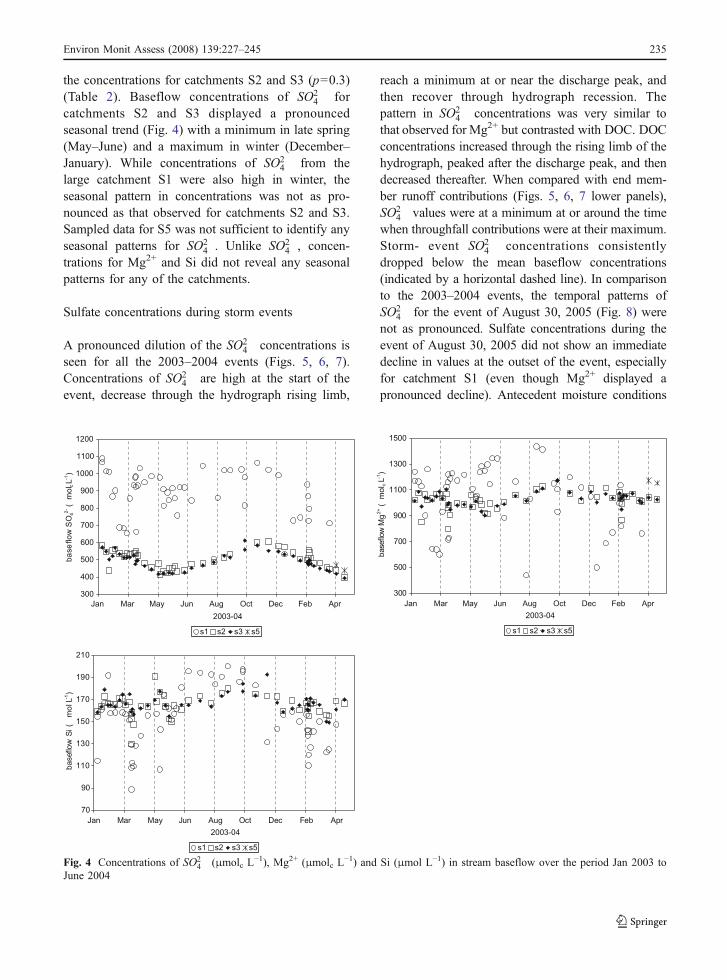
the concentrations for catchments S2 and S3 (p=0.3)(Table 2). Baseflow concentrations of SO2�
4 forcatchments S2 and S3 displayed a pronouncedseasonal trend (Fig. 4) with a minimum in late spring(May–June) and a maximum in winter (December–January). While concentrations of SO2�
4 from thelarge catchment S1 were also high in winter, theseasonal pattern in concentrations was not as pro-nounced as that observed for catchments S2 and S3.Sampled data for S5 was not sufficient to identify anyseasonal patterns for SO2�
4 . Unlike SO2�4 , concen-
trations for Mg2+ and Si did not reveal any seasonalpatterns for any of the catchments.
Sulfate concentrations during storm events
A pronounced dilution of the SO2�4 concentrations is
seen for all the 2003–2004 events (Figs. 5, 6, 7).Concentrations of SO2�
4 are high at the start of theevent, decrease through the hydrograph rising limb,
reach a minimum at or near the discharge peak, andthen recover through hydrograph recession. Thepattern in SO2�
4 concentrations was very similar tothat observed for Mg2+ but contrasted with DOC. DOCconcentrations increased through the rising limb of thehydrograph, peaked after the discharge peak, and thendecreased thereafter. When compared with end mem-ber runoff contributions (Figs. 5, 6, 7 lower panels),SO2�
4 values were at a minimum at or around the timewhen throughfall contributions were at their maximum.Storm- event SO2�
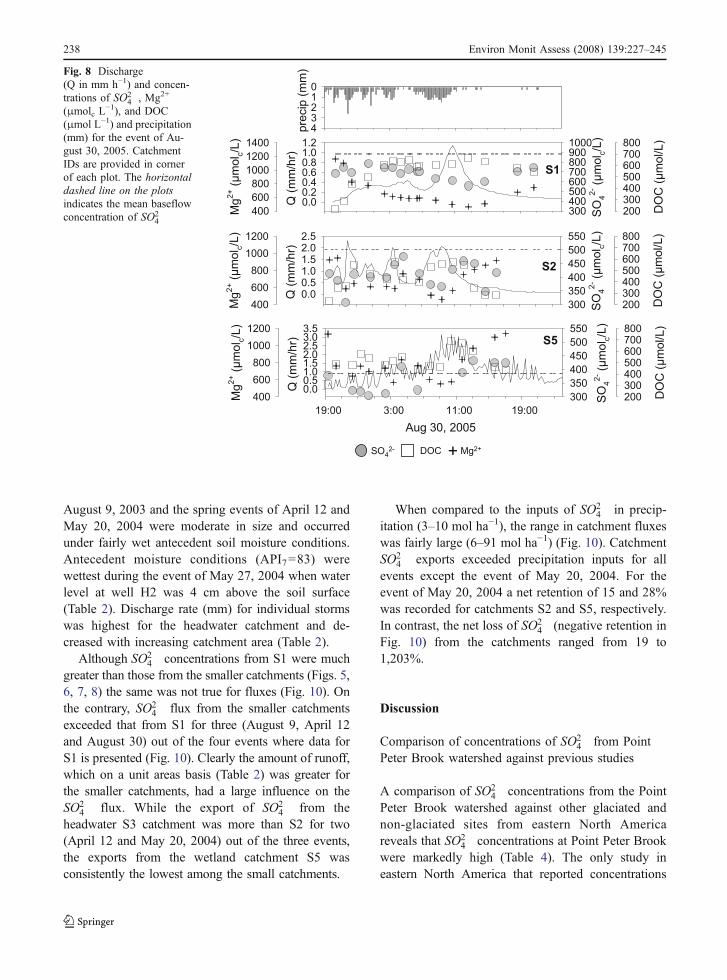
4 concentrations consistentlydropped below the mean baseflow concentrations(indicated by a horizontal dashed line). In comparisonto the 2003–2004 events, the temporal patterns ofSO2�
4 for the event of August 30, 2005 (Fig. 8) werenot as pronounced. Sulfate concentrations during theevent of August 30, 2005 did not show an immediatedecline in values at the outset of the event, especiallyfor catchment S1 (even though Mg2+ displayed apronounced decline). Antecedent moisture conditions
300
400
500
600
700
800
900
1000
1100
1200
2003-04
base
flow
SO
42- (
µmol
c L-1
)
s1 s2 s3 s5
300
500
700
900
1100
1300
1500
2003-04
base
flow
Mg
2+ (
µmol
c L-1
)
s1 s2 s3 s5
70
90
110
130
150
170
190
210
Jan Mar May Jun Aug Oct Dec Feb Apr
2003-04
base
flow
Si (
µm
olL-1
)
s1 s2 s3 s5
Jan Mar May Jun Aug Oct Dec Feb Apr Jan Mar May Jun Aug Oct Dec Feb Apr
Fig. 4 Concentrations of SO2�4 (μmolc L
−1), Mg2+ (μmolc L−1) and Si (μmol L−1) in stream baseflow over the period Jan 2003 to
June 2004
Environ Monit Assess (2008) 139:227–245 235
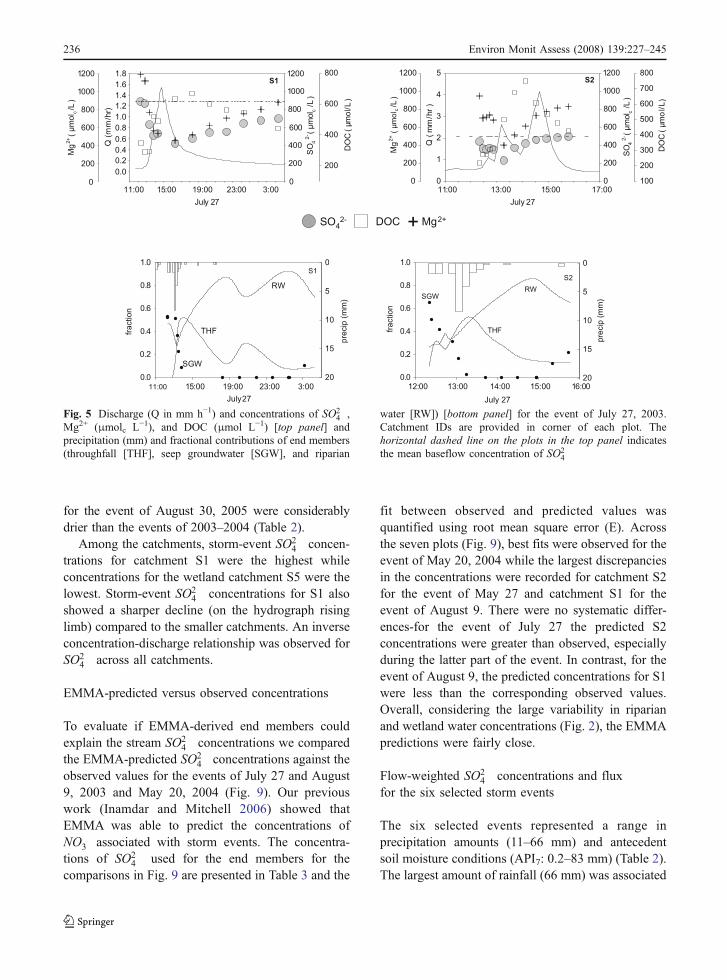
for the event of August 30, 2005 were considerablydrier than the events of 2003–2004 (Table 2).
Among the catchments, storm-event SO2�4 concen-
trations for catchment S1 were the highest whileconcentrations for the wetland catchment S5 were thelowest. Storm-event SO2�
4 concentrations for S1 alsoshowed a sharper decline (on the hydrograph risinglimb) compared to the smaller catchments. An inverseconcentration-discharge relationship was observed forSO2�
4 across all catchments.
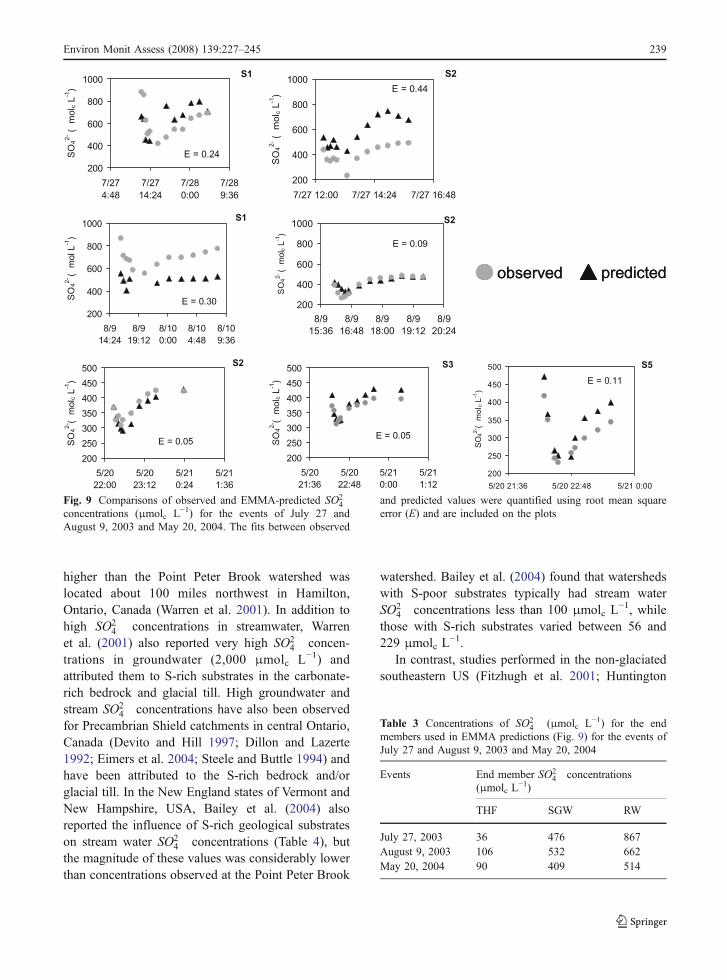
EMMA-predicted versus observed concentrations
To evaluate if EMMA-derived end members couldexplain the stream SO2�
4 concentrations we comparedthe EMMA-predicted SO2�
4 concentrations against theobserved values for the events of July 27 and August9, 2003 and May 20, 2004 (Fig. 9). Our previouswork (Inamdar and Mitchell 2006) showed thatEMMA was able to predict the concentrations ofNO�
3 associated with storm events. The concentra-tions of SO2�
4 used for the end members for thecomparisons in Fig. 9 are presented in Table 3 and the
fit between observed and predicted values wasquantified using root mean square error (E). Acrossthe seven plots (Fig. 9), best fits were observed for theevent of May 20, 2004 while the largest discrepanciesin the concentrations were recorded for catchment S2for the event of May 27 and catchment S1 for theevent of August 9. There were no systematic differ-ences-for the event of July 27 the predicted S2concentrations were greater than observed, especiallyduring the latter part of the event. In contrast, for theevent of August 9, the predicted concentrations for S1were less than the corresponding observed values.Overall, considering the large variability in riparianand wetland water concentrations (Fig. 2), the EMMApredictions were fairly close.
Flow-weighted SO2�4 concentrations and flux
for the six selected storm events
The six selected events represented a range inprecipitation amounts (11–66 mm) and antecedentsoil moisture conditions (API7: 0.2–83 mm) (Table 2).The largest amount of rainfall (66 mm) was associated
July 27
11:00 15:00 19:00 23:00 3:000.0
0.2
0.4
0.6
0.8
1.0
RW
THF
SGW
S10
5
10
15
20 12:00 13:00 14:00 15:00 16:00
0.0
0.2
0.4
0.6
0.8
1.0
THF
RWSGW
S2
0
5
10
15
20
+SO42- DOC Mg2+
July 27
11:00 13:00 15:00 17:00
Q ( m
m/h
r )
0
1
2
3
4
5
0
200
400
600
800
1000
1200
Mg
2+ (
µm
ol c
/L)
0
200
400
600
800
1000
1200
DO
C (
µm
ol/
L)
100
200
300
400
500
600
700
800S2
July 27
11:00 15:00 19:00 23:00 3:00
Q (
mm
/hr)
0.0
0.2
0.4
0.6
0.8
1.0
1.2
1.4
1.6
1.8
SO
4
2- (
µm
ol c
/L)
SO
4
2- (
µm
ol c
/L)
0
200
400
600
800
1000
1200M
g2+ (
µm
ol c
/L)
0
200
400
600
800
1000
1200
DO
C (
µm
ol/
L)
200
400
600
800S1
fra
ctio
n
pre
cip
(m
m)
fra
ctio
n
July 27
pre
cip
(m
m)
Fig. 5 Discharge (Q in mm h−1) and concentrations of SO2�4 ,
Mg2+ (μmolc L−1), and DOC (μmol L−1) [top panel] andprecipitation (mm) and fractional contributions of end members(throughfall [THF], seep groundwater [SGW], and riparian
water [RW]) [bottom panel] for the event of July 27, 2003.Catchment IDs are provided in corner of each plot. Thehorizontal dashed line on the plots in the top panel indicatesthe mean baseflow concentration of SO2�
4
236 Environ Monit Assess (2008) 139:227–245
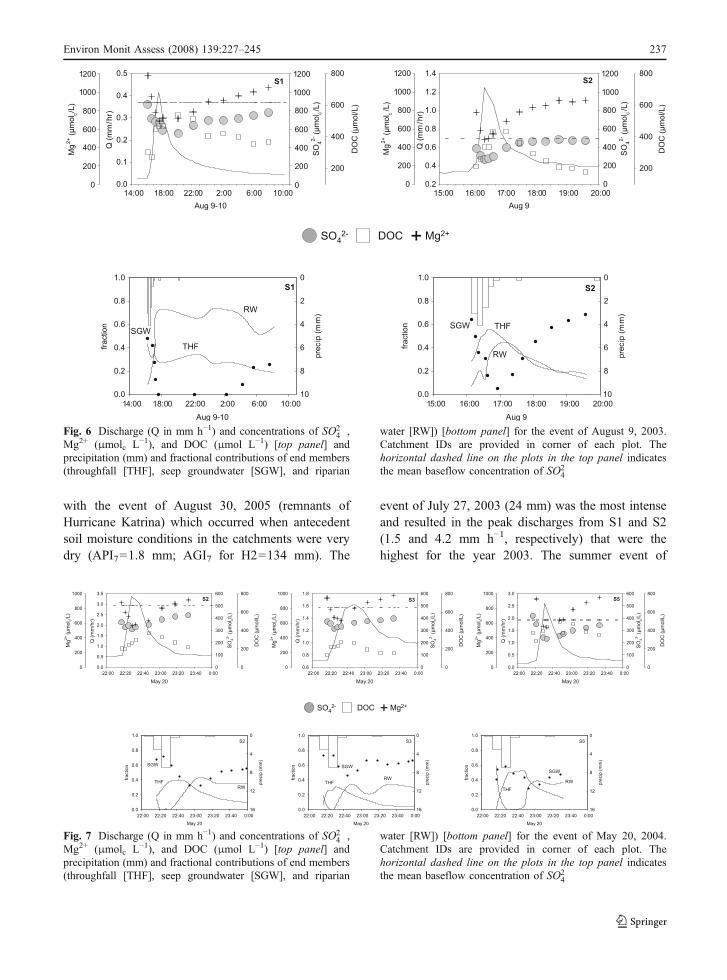
with the event of August 30, 2005 (remnants ofHurricane Katrina) which occurred when antecedentsoil moisture conditions in the catchments were verydry (API7=1.8 mm; AGI7 for H2=134 mm). The
event of July 27, 2003 (24 mm) was the most intenseand resulted in the peak discharges from S1 and S2(1.5 and 4.2 mm h−1, respectively) that were thehighest for the year 2003. The summer event of
Aug 9-10
14:00 18:00 22:00 2:00 6:00 10:00
0.0
0.2
0.4
0.6
0.8
1.0
RW
THF
SGW
S1
pre
cip
(m
m)
0
2
4
6
8
10
Aug 9
15:00 16:00 17:00 18:00 19:00 20:00
0.0
0.2
0.4
0.6
0.8
1.0
RW
THFSGW
S2
pre
cip
(m
m)
0
2
4
6
8
10
+SO42- DOC Mg2+
Aug 9-10
14:00 18:00 22:00 2:00 6:00 10:00
Q (
mm
/hr)
0.0
0.1
0.2
0.3
0.4
0.5
SO
4
2- (µ
mol c
/L)
0
200
400
600
800
1000
1200M
g2+ (µ
mol c
/L)
0
200
400
600
800
1000
1200
DO
C (µ
mol/L)
200
400
600
800S1
Aug 9
15:00 16:00 17:00 18:00 19:00 20:00
Q (
mm
/hr)
0.2
0.4
0.6
0.8
1.0
1.2
1.4
SO
4
2- (µ
mol c
/L)
0
200
400
600
800
1000
1200
Mg
2+ (µ
mol c
/L)
0
200
400
600
800
1000
1200
DO
C (µ
mol/L)
200
400
600
800S2
fraction
fraction
Fig. 6 Discharge (Q in mm h−1) and concentrations of SO2�4 ,
Mg2+ (μmolc L−1), and DOC (μmol L−1) [top panel] andprecipitation (mm) and fractional contributions of end members(throughfall [THF], seep groundwater [SGW], and riparian
water [RW]) [bottom panel] for the event of August 9, 2003.Catchment IDs are provided in corner of each plot. Thehorizontal dashed line on the plots in the top panel indicatesthe mean baseflow concentration of SO2�
4
May 20
22:00 22:20 22:40 23:00 23:20 23:40 0:00
fra
ction
0.0
0.2
0.4
0.6
0.8
1.0
RW
SGW
THF
S2
pre
cip
(m
m)
0
4
8
12
16
May 20
22:00 22:20 22:40 23:00 23:20 23:40 0:00
fra
ction
0.0
0.2
0.4
0.6
0.8
1.0
RW
SGW
THF
S3
pre
cip
(m
m)
0
4
8
12
16
May 20
22:00 22:20 22:40 23:00 23:20 23:40 0:00
fra
ction
0.0
0.2
0.4
0.6
0.8
1.0
RW
SGW
THF
S5
pre
cip
(m
m)
0
4
8
12
16
May 20
22:00 22:20 22:40 23:00 23:20 23:40 0:00
Q (
mm
/hr)
0.0
0.5
1.0
1.5
2.0
2.5
3.0
3.5
SO
4
2-(µ
mol c/L
)
0
100
200
300
400
500
600
Mg
2+
(µm
ol c/L
)
0
200
400
600
800
1000
DO
C(µ
mo
l/L
)
0
200
400
600
800
S2
May 20
22:00 22:20 22:40 23:00 23:20 23:40 0:00
Q (
mm
/hr)
0.6
0.8
1.0
1.2
1.4
1.6
1.8
SO
4
2-(µ
mol c/L
)
0
100
200
300
400
500
600
Mg
2+
(µm
ol c/L
)
0
200
400
600
800
1000
DO
C(µ
mo
l/L
)
0
200
400
600
800
S3
May 20
22:00 22:20 22:40 23:00 23:20 23:40 0:00
Q (
mm
/hr)
0.0
0.5
1.0
1.5
2.0
2.5
3.0
SO
4
2-(µ
mol c/L
)
0
100
200
300
400
500
600
Mg
2+
(µm
ol c/L
)
0
200
400
600
800
1000
DO
C(µ
mo
l/L
)0
200
400
600
800
S5
+SO42- DOC Mg2+
Fig. 7 Discharge (Q in mm h−1) and concentrations of SO2�4 ,
Mg2+ (μmolc L−1), and DOC (μmol L−1) [top panel] andprecipitation (mm) and fractional contributions of end members(throughfall [THF], seep groundwater [SGW], and riparian
water [RW]) [bottom panel] for the event of May 20, 2004.Catchment IDs are provided in corner of each plot. Thehorizontal dashed line on the plots in the top panel indicatesthe mean baseflow concentration of SO2�
4
Environ Monit Assess (2008) 139:227–245 237
August 9, 2003 and the spring events of April 12 andMay 20, 2004 were moderate in size and occurredunder fairly wet antecedent soil moisture conditions.Antecedent moisture conditions (API7=83) werewettest during the event of May 27, 2004 when waterlevel at well H2 was 4 cm above the soil surface(Table 2). Discharge rate (mm) for individual stormswas highest for the headwater catchment and de-creased with increasing catchment area (Table 2).
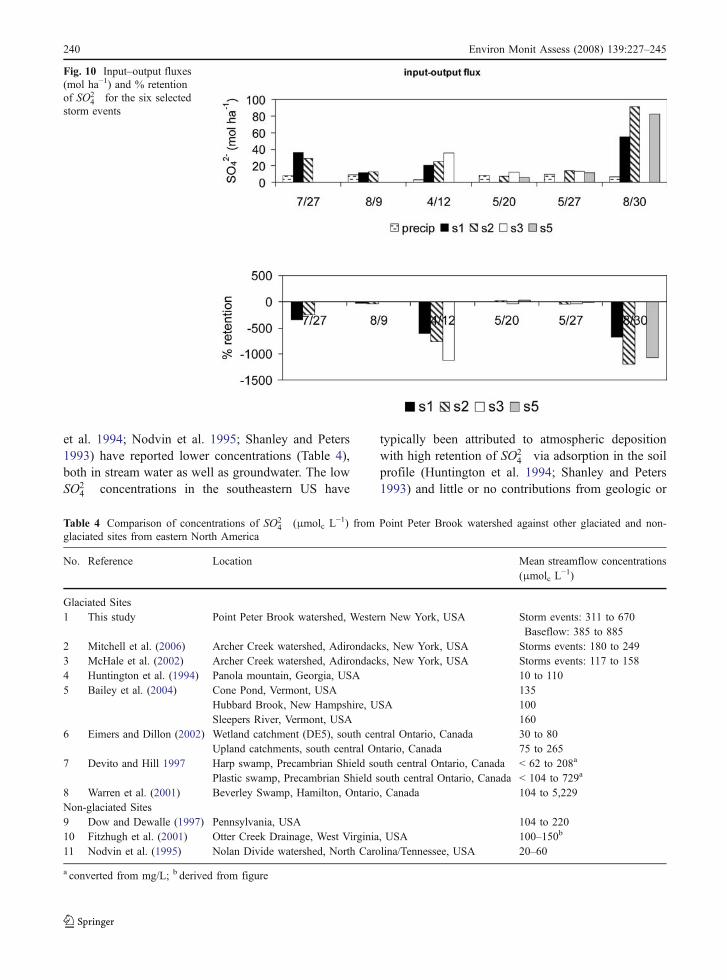
Although SO2�4 concentrations from S1 were much
greater than those from the smaller catchments (Figs. 5,6, 7, 8) the same was not true for fluxes (Fig. 10). Onthe contrary, SO2�
4 flux from the smaller catchmentsexceeded that from S1 for three (August 9, April 12and August 30) out of the four events where data forS1 is presented (Fig. 10). Clearly the amount of runoff,which on a unit areas basis (Table 2) was greater forthe smaller catchments, had a large influence on theSO2�
4 flux. While the export of SO2�4 from the
headwater S3 catchment was more than S2 for two(April 12 and May 20, 2004) out of the three events,the exports from the wetland catchment S5 wasconsistently the lowest among the small catchments.
When compared to the inputs of SO2�4 in precip-
itation (3–10 mol ha−1), the range in catchment fluxeswas fairly large (6–91 mol ha−1) (Fig. 10). CatchmentSO2�
4 exports exceeded precipitation inputs for allevents except the event of May 20, 2004. For theevent of May 20, 2004 a net retention of 15 and 28%was recorded for catchments S2 and S5, respectively.In contrast, the net loss of SO2�
4 (negative retention inFig. 10) from the catchments ranged from 19 to1,203%.
Discussion
Comparison of concentrations of SO2�4 from Point
Peter Brook watershed against previous studies
A comparison of SO2�4 concentrations from the Point
Peter Brook watershed against other glaciated andnon-glaciated sites from eastern North Americareveals that SO2�
4 concentrations at Point Peter Brookwere markedly high (Table 4). The only study ineastern North America that reported concentrations
Q (
mm
/hr)
0.00.51.01.52.02.5
SO
4
2- (µ
mol c/L
)
300
350
400
450
500
550M
g2
+ (µ
mol c/L
)
400
600
800
1000
1200
DO
C (µ
mol/L)
200300400500600700800
S2
pre
cip
(m
m)
01234
19:00 3:00 11:00 19:00
Q (
mm
/hr)
0.00.51.01.52.02.53.03.5
SO
4
2- (µ
mol c/L
)
300
350
400
450
500
550
Mg
2+ (µ
mol c/L
)
400
600
800
1000
1200
DO
C (µ
mol/L)
200300400500600700800
Aug 30, 2005
Q (
mm
/hr)
0.00.20.40.60.81.01.2
SO
4
2- (µ
mol c/L
)
3004005006007008009001000
Mg
2+ (µ
mol c/L
)
400
600
800
1000
1200
1400
DO
C (µ
mol/L)
200300400500600700800
S5
S1
+SO42- DOC Mg2+
Fig. 8 Discharge(Q in mm h−1) and concen-trations of SO2�
4 , Mg2+
(μmolc L−1), and DOC
(μmol L−1) and precipitation(mm) for the event of Au-gust 30, 2005. CatchmentIDs are provided in cornerof each plot. The horizontaldashed line on the plotsindicates the mean baseflowconcentration of SO2�
4
238 Environ Monit Assess (2008) 139:227–245
higher than the Point Peter Brook watershed waslocated about 100 miles northwest in Hamilton,Ontario, Canada (Warren et al. 2001). In addition tohigh SO2�
4 concentrations in streamwater, Warrenet al. (2001) also reported very high SO2�
4 concen-trations in groundwater (2,000 μmolc L−1) andattributed them to S-rich substrates in the carbonate-rich bedrock and glacial till. High groundwater andstream SO2�
4 concentrations have also been observedfor Precambrian Shield catchments in central Ontario,Canada (Devito and Hill 1997; Dillon and Lazerte1992; Eimers et al. 2004; Steele and Buttle 1994) andhave been attributed to the S-rich bedrock and/orglacial till. In the New England states of Vermont andNew Hampshire, USA, Bailey et al. (2004) alsoreported the influence of S-rich geological substrateson stream water SO2�
4 concentrations (Table 4), butthe magnitude of these values was considerably lowerthan concentrations observed at the Point Peter Brook
watershed. Bailey et al. (2004) found that watershedswith S-poor substrates typically had stream waterSO2�
4 concentrations less than 100 μmolc L−1, while
those with S-rich substrates varied between 56 and229 μmolc L
−1.In contrast, studies performed in the non-glaciated
southeastern US (Fitzhugh et al. 2001; Huntington
Table 3 Concentrations of SO2�4 (μmolc L−1) for the end
members used in EMMA predictions (Fig. 9) for the events ofJuly 27 and August 9, 2003 and May 20, 2004
Events End member SO2�4 concentrations
(μmolc L−1)
THF SGW RW
July 27, 2003 36 476 867August 9, 2003 106 532 662May 20, 2004 90 409 514
observed predictedobserved predicted
200
400
600
800
1000
8/914:24
8/919:12
8/100:00
8/104:48
8/109:36
SO
42-(µ
mol
L-1
)
E = 0.30
S1
200
400
600
800
1000
8/915:36
8/916:48
8/918:00
8/919:12
8/920:24
SO
42-(µ
mol
c L-1
)
E = 0.09
S2
200
400
600
800
1000
7/274:48
7/2714:24
7/280:00
7/289:36
SO
42- (
µmol
c L-1
)S1
E = 0.24
200
400
600
800
1000
7/27 12:00 7/27 14:24 7/27 16:48
SO
42- (
µmol
c L-1
) E = 0.44
S2
200
250
300
350
400
450
500
5/2022:00
5/2023:12
5/210:24
5/211:36
SO
42-(µ
mol
c L-1
)
E = 0.05
S2
200
250
300
350
400
450
500
5/2021:36
5/2022:48
5/210:00
5/211:12
SO
42-(µ
mol
c L-1
)
E = 0.05
S3
200
250
300
350
400
450
500
5/20 21:36 5/20 22:48 5/21 0:00S
O42-
(µm
olc L
-1)
E = 0.11
S5
Fig. 9 Comparisons of observed and EMMA-predicted SO2�4
concentrations (μmolc L−1) for the events of July 27 andAugust 9, 2003 and May 20, 2004. The fits between observed
and predicted values were quantified using root mean squareerror (E) and are included on the plots
Environ Monit Assess (2008) 139:227–245 239
et al. 1994; Nodvin et al. 1995; Shanley and Peters1993) have reported lower concentrations (Table 4),both in stream water as well as groundwater. The lowSO2�
4 concentrations in the southeastern US have
typically been attributed to atmospheric depositionwith high retention of SO2�
4 via adsorption in the soilprofile (Huntington et al. 1994; Shanley and Peters1993) and little or no contributions from geologic or
Fig. 10 Input–output fluxes(mol ha−1) and % retentionof SO2�
4 for the six selectedstorm events
Table 4 Comparison of concentrations of SO2�4 (μmolc L−1) from Point Peter Brook watershed against other glaciated and non-
glaciated sites from eastern North America
No. Reference Location Mean streamflow concentrations(μmolc L
−1)
Glaciated Sites1 This study Point Peter Brook watershed, Western New York, USA Storm events: 311 to 670
Baseflow: 385 to 8852 Mitchell et al. (2006) Archer Creek watershed, Adirondacks, New York, USA Storms events: 180 to 2493 McHale et al. (2002) Archer Creek watershed, Adirondacks, New York, USA Storms events: 117 to 1584 Huntington et al. (1994) Panola mountain, Georgia, USA 10 to 1105 Bailey et al. (2004) Cone Pond, Vermont, USA 135
Hubbard Brook, New Hampshire, USA 100Sleepers River, Vermont, USA 160
6 Eimers and Dillon (2002) Wetland catchment (DE5), south central Ontario, Canada 30 to 80Upland catchments, south central Ontario, Canada 75 to 265
7 Devito and Hill 1997 Harp swamp, Precambrian Shield south central Ontario, Canada < 62 to 208a
Plastic swamp, Precambrian Shield south central Ontario, Canada < 104 to 729a
8 Warren et al. (2001) Beverley Swamp, Hamilton, Ontario, Canada 104 to 5,229Non-glaciated Sites9 Dow and Dewalle (1997) Pennsylvania, USA 104 to 22010 Fitzhugh et al. (2001) Otter Creek Drainage, West Virginia, USA 100–150b
11 Nodvin et al. (1995) Nolan Divide watershed, North Carolina/Tennessee, USA 20–60
a converted from mg/L; b derived from figure
240 Environ Monit Assess (2008) 139:227–245

groundwater sources. Rochelle et al. (1987) andGalloway et al. (1983) attributed the differences insulfate retention among northern and southern regionsof the North American continent to the extent of thelast glaciation (Wisconsin) and the consequent impacton weathering and soil formation. Rochelle et al.(1987) found that sites north of the limit of theglaciation had zero net retention while sites south ofthe line were retaining 20 to 90% of the incoming S.
Sulfate concentrations in watershed compartmentsat the Point Peter Brook watershed (Table 2) clearlysuggest that groundwaters were the largest source ofSO2�
4 to the streams. We attribute the high concen-trations of SO2�
4 in groundwater to the contributionsof the weathering of S-containing minerals. Theaquifers in the region are an example of carbonate-rock aquifers. Bedrock in the region consists ofstratified limestone, dolomite with some gypsum,and abundant interbedded shale of marine origin.The high SO2�
4 concentrations observed in this studyare likely partly derived from the dissolution ofgypsum (Olcott 1995). It is also very likely that S-rich substrates in the shale and glacial till alsocontributed to groundwater SO2�
4 concentrations.
Sources of SO2�4 in the Point Peter Brook watershed
The large difference in concentrations of SO2�4 between
atmospheric (precipitation, throughfall) and groundwa-ter sources (Fig. 2) undoubtedly suggests that SO2�
4
fluxes in the Point Peter Brook watershed are regulatedby groundwater sources. There were however, impor-tant differences in SO2�
4 concentrations among thegroundwater compartments: (a) mean SO2�
4 concen-trations for seep groundwater were not only lower butalso had a narrower range than values measured forriparian water (Fig. 2); and (b) mean SO2�
4 concen-trations for the wetland water were markedly lowerthan riparian water, but similar to riparian waterdisplayed a wide range in concentrations.
We have previously (Inamdar and Mitchell 2006)proposed that two separate groundwater systems arelikely responsible for the groundwater discharge athillslope seeps and the recharge of valley-bottomriparian and wetland areas. The valley-bottom riparianareas are recharged by deeper groundwaters while theseeps are local groundwater systems (Inamdar andMitchell 2006). This difference in flow paths couldexplain the higher SO2�
4 concentrations in riparian
water since deeper flow paths would have morecontact time with the S-rich geologic substrate. Inaddition, it is also possible that riparian waterconcentrations in the valley-bottom positions are alsoinfluenced by the redox conditions in saturated andwetland areas at these locations. Reducing (or anoxic)conditions in saturated areas can lead to precipitationof SO2�
4 as sulfides and therefore a reduction in SO2�4
concentrations (Mitsch and Gosselink 2000). Alter-nately, oxidizing conditions can convert previouslydeposited sulfides to SO2�
4 and consequently result inan increase in SO2�
4 concentrations (Mitsch andGosselink 2000). The role of redox conditions ininfluencing SO2�
4 concentrations has been highlightedin numerous studies in glaciated catchments inNortheastern America (Bayley et al. 1986; Devitoand Hill 1999, 1997; Eimers and Dillon 2002; Warrenet al. 2001). Furthermore, Devito and Hill (1997)showed that wetlands subject to groundwater varia-tions yielded higher concentrations of SO2�
4 (associ-ated with oxidation of sulfides) as opposed wetlandsthat were continuously moist year-round.
Redox influences would explain much lower SO2�4
concentrations observed for wetland water (Fig. 2).Groundwater elevations in the wetland catchment S5were close to the soil surface year-round (note the AGIvalues for wetland well R5 in Table 2) and thus likelyprovided a reducing environment for the reduction ofSO2�
4 . Redox modification of SO2�4 could also explain
the seasonal pattern of SO2�4 for riparian water (Fig. 2)
and baseflow from catchments S2 and S3 (Fig. 3).Higher SO2�
4 concentrations during winter have beenreported in numerous studies (e.g., Devito and Hill1997) and can be attributed to oxidation of SO2�
4
during the preceding summer followed by flushing ofSO2�
4 during wet winter months (Evans et al. 1997).However, the lack of a pronounced seasonal pattern forS1 is surprising, especially considering the strongseasonal expression at S2 and S3. It is possible thatthe combined influence of a variety of riparian andwetland areas at the large catchment scale (696 ha)may have contributed to muted response for S1.
Pattern of SO2�4 concentrations during
and among storm events and the responsiblemechanisms
Storm event SO2�4 concentrations were consistently
lower than baseflow values across all events. During
Environ Monit Assess (2008) 139:227–245 241

storms, the decline in SO2�4 concentrations started on
the rising limb of the hydrograph and reached aminimum at or near peak streamflow discharge(Figs. 5, 6, 7). The decline in SO2�
4 concentrationscoincided with the rise in throughfall contributionsand the minimum in SO2�
4 concentrations occurredwhen throughfall contributions were at their peak.This temporal pattern and the low concentrations ofSO2�
4 in throughfall clearly indicate that groundwaterSO2�
4 concentrations were diluted by atmosphericwater (throughfall and precipitation) during stormevents. The temporal match between SO2�
4 and Mg2+
concentrations and the simultaneous contrast withDOC values further confirm this assessment. Magne-sium concentrations in streamflow at Point PeterBrook were primarily derived from groundwatersources while DOC concentrations were regulatedby contributions from throughfall, litter leachate, andriparian water (Inamdar and Mitchell 2006, 2007b).
An inverse relationship between SO2�4 and stream-
flow discharge was observed for all catchments. Theseinverse relationships contrast with strong positive C–Qrelationships reported elsewhere (Huntington et al.1994; Shanley and Peters 1993; Wigington et al.1990). Huntington et al. (1994) and Shanley and Peters(1993) found high SO2�
4 in surface soil waters and lowconcentrations in groundwater for a watershed inGeorgia, USA, and attributed the positive C–Qrelationship to the flushing of SO2�
4 from surface soilhorizons during periods of elevated wetness anddischarge. Furthermore, they also found that increasingSO2�
4 concentrations were accompanied with decreas-ing concentrations of base cations (alkalinity) – a directcontrast with our observations for Point Peter Brook.The inverse relationships and the strong correspon-dence of SO2�
4 with Mg2+ clearly suggest SO2�4
dynamics in Point Peter Brook was controlled bysubsurface and not near-surface sources of SO2�
4 .Although the dilution of SO2�
4 was observed acrossall events, the decline in SO2�
4 concentrations was notvery pronounced during the initial portion of theevent of August 30, 2005 (especially for catchmentS1, Fig. 8). Antecedent moisture conditions for theevent of August 30, 2005 were the lowest during theentire three-year (2003–2005) monitoring period(note API and AGI values in Table 2). Sulfate exportsand concentrations in streamflow have been observedto increase following extended dry periods or summerdroughts (Devito and Hill 1997; Eimers and Dillon
2002; Mitchell et al. 2006). The increase in SO2�4
concentrations has been attributed to the flushingexcess SO2�
4 generated by oxidation of previously-reduced SO2�
4 from wetlands and/or the release ofSO2�
4 from organic matter due to mineralization.Mitchell et al. (2006) found that SO2�
4 concentrationsincreased continuously for a series of four storms asthe catchment wetted-up following an extremely drysummer period. It is possible that the initial responsefor the event of August 30, 2005 at Point Peter Brookcould have been associated with oxidation of SO2�
4
over the antecedent dry period and subsequent exportof this excess SO2�
4 at the start of the event.
Influence of watershed SO2�4 sources on stream
concentrations
EMMA identified throughfall, seep, and ripariangroundwaters as the potential end members for streamchemistry at Point Peter Brook (Inamdar and Mitchell2006). Sulfate concentrations for riparian and seepgroundwaters were high while those in throughfallwere low. A comparison of EMMA-predicted andobserved SO2�
4 concentrations indicated that four ofthe six events produced good fits. Previous compar-isons of EMMA have provided mixed results. Devitoand Hill (1997) were unsuccessful in predicting SO2�
4
concentrations for wetland catchments due to thelarge variation in concentrations resulting from thereactive behavior of SO2�
4 within the wetlands. Incontrast, Steele and Buttle (1994), were successful inexplaining the exports of SO2�
4 from a 2.4 ha wetlandcatchment during a snowmelt event. We hypothesizethat the fits for Point Peter Brook were good becausethe influence of the reactive processes on SO2�
4
concentrations was small for the storm events or thestrong groundwater SO2�
4 signal at Point Peter Brookoverwhelmed any likely variations introduced by thereactive processes.
Sulfate concentrations and exports from catchmentswith varying extent of wetlands and riparian areas
Concentrations of SO2�4 in wetland water (well
located within catchment S5) were considerably lower(Fig. 2) than riparian water values (wells located incatchment S2) even though the corresponding valuesof Mg2+ and Si for these locations were not thatdifferent. Considering the large difference in wetland
242 Environ Monit Assess (2008) 139:227–245
and riparian water SO2�4 concentrations, the stream-
flow SO2�4 concentrations for catchment S5 were only
slightly lower than S2 and S3 (Fig. 2). We attributethis to the transport of seep groundwaters (which hadhigh SO2�
4 concentrations) over the wetland substratein S5 with limited mixing with the wetland waters(Inamdar and Mitchell 2006, 2007a). A number ofprevious studies have shown that wetlands reduce theconcentrations of SO2�
4 through the reduction of SO2�4
to sulfides under anaerobic conditions (Lazerte 1993;Devito and Hill 1997; Eimers and Dillon 2002;Warren et al. 2001). The work of Devito and Hill(1997) however, showed that groundwater elevationsand hydrologic connectedness of wetlands was as acritical factor. Wetlands with large variation in groundwater elevations alternated between sinks and sourcesof SO2�
4 while wetlands which were saturated year-round retained most of the SO2�
4 input (Devito andHill 1997). Groundwater elevations in the S5 catch-ment in Point Peter Brook were close to the surfaceall year round (Table 2) and thus likely provided acontinuous, stable, reducing environment for removalof SO2�
4 from wetland groundwater.Sulfate concentrations for the largest (696 ha)
catchment S1 were much greater and more variablethan the smaller catchments (especially S2 and S3).Higher concentrations of SO2�
4 at S1 can be attributedto three possibilities – (a) a greater proportion ofdeeper groundwater contributions; (b) release of SO2�
4
via oxidation of previously reduced sulfides fromvalley-bottom riparian areas contained within S1; and/or (c) an unidentified source. We believe it is somecombination of all of these three possibilities. Thedifference in concentrations of Mg2+ and Si amongthe catchments (Fig. 4) does suggest a slightly greaterproportion of deeper groundwaters at S1; however, itis unlikely that deep groundwaters alone can explainthe large difference in SO2�
4 concentrations. It islikely some contributions of SO2�
4 occurred fromvalley-bottom riparian areas which were subject togreater water level fluctuations than the wetlands. Wealso recognize that the intensive sampling performedin this study was limited to small portion of the largeS1 catchment and it is possible that the samplingscheme did not capture the full range of SO2�
4
concentrations that influenced the outflow at S1. Thedifferences in riparian well concentrations over a smalldistance (e.g., Fig. 3, wells RS1 versus RS2) highlightthe variability in SO2�
4 values for this watershed.
Atmospheric deposition and watershed exportsof SO2�
4
The Point Peter Brook watershed is subject to one ofthe highest rates of atmospheric deposition of SO2�
4
in the continental US (NADP 2006). The two-year(2003–2004) average annual wet (SO2�
4 ) depositionrecorded at the nearest NADP station in Chautauqua,NY amounted to 520 mol ha−1 (NADP 2006). Sinceno dry deposition was recorded at the NADP site, anestimate of potential dry deposition was determinedfrom the nearest USEPA Clean Air Status and TrendsNetwork (CASTNET) site – M.K. Goddard in MercerCounty Pennsylvania, 170 km southwest of PointPeter Brook watershed (USEPA 2007). Data (2003–2004) from the CASTNET site indicated that annualdry S deposition (SO2�
4 plus SO2) was on average76% of the wet SO2�
4 input. Inamdar et al. (2006)estimated the annual export of SO2�
4 from catchmentS1 at about 5130 mol ha−1, of which 20% occurredduring storm events and the remainder 80% duringnon-storm periods. A comparison of annual wet SO2�
4
input (520 mol ha−1) and the corresponding exportfrom S1 (5,130 mol ha−1) indicates an annual net lossof SO2�
4 of 886% from the Point Peter Brookwatershed. Even if all of the dry S deposition isassumed to be immediately available as SO2�
4 (1.76×520=915 mol ha−1), the net loss of SO2�
4 stillamounts to 460%. This comparison highlights theimportance of internal (geologic) sources in theexports of SO2�
4 from the Point Peter Brook water-shed. Hornbeck et al. (1997) reported net annuallosses of 47%, 72% and 138% for Hubbard Brook(NH), Cone Pond (NH), and Sleepers River (VT)watersheds, respectively. Warren et al. (2001)reported monthly exports of SO2�
4 as high as 614%for a swamp in a glaciated catchment in Hamilton,ON, Canada. In contrast, watersheds in the southeastUS (Huntington et al. 1994) indicate a net SO2�
4
retention of 6 to 35%. Clearly, the impacts ofdecreasing atmospheric deposition will have verydifferent implications for these watersheds withdiffering geology and climate conditions.
Conclusions
Concentrations and fluxes measured in this studyindicate that SO2�
4 exports from the Point Peter Brook
Environ Monit Assess (2008) 139:227–245 243
watershed were regulated primarily by geologic(groundwater) sources and atmospheric inputs hadlittle influence on the watershed SO2�
4 budgets. Theseresults highlight the importance of internal geologicalsources and suggest that watersheds like Point PeterBrook may respond very slowly to decreases inatmospheric SO2�
4 deposition.This study also indicated that while geologic
sources had a dominant influence on SO2�4 concen-
trations in Point Peter Brook, the valley-bottomriparian areas and wetlands likely played a role inmodifying these concentrations through redox pro-cesses. This study suggests that wetlands that aresaturated year-round may depress the SO2�
4 concen-trations while riparian areas subject to greater fluctua-tions in water level may yield a wider range in SO2�
4
concentrations.
Acknowledgements This study was funded through a USDANRI grant (No. 2002-00847) awarded to S. Inamdar. We arevery grateful to the Gowanda Water Department for providingaccess to the Point Peter Brook watershed. Joanna Tuk Rileyand Julia Graham are thanked for sample collection and datamanagement. Pat McHale and David Lyons provided the waterchemistry results expeditiously. The Great Lakes Center atBuffalo State College is also thanked for providing tuitionsupport for Joanna and Julie. The suggestions provided by theeditors and reviewers were extremely constructive and helpedimprove this manuscript.
References
Alewell, C., Mitchell, M. J., Likens, G. E., & Krouse, H. R.(1999). Sources of stream sulfate at the Hubbard BrookExperimental Forest: Long-term analyses using stableisotopes. Biogeochemistry, 44, 281–299.
Bailey, S. W., Mayer, B., & Mitchell, M. J. (2004). Theinfluence of mineral weathering on drainage water sulfatein the northeastern United States. Hydrological Processes,18, 1639–1653.
Baron, J. S., Allstott, E. J., & Newkirk, B. K. (1995). Analysisof long term sulfate and nitrate budgets in a RockyMountain basin. In Biogeochemistry of seasonally snow-covered catchments. Proceedings of a Boulder Sympo-sium, July 1995., IAHS Publ. 228.
Bayley, S. E., Behr, R. S., & Kelly, C. A. (1986). Retention andrelease of sulfur from a freshwater wetland. Water, Air andSoil Pollution, 31, 101–114.
Burns, D. A., McDonnell, J. J., Hooper, R. P., Peters, N. E.,Freer, J., Kendall, C., et al. (2001). Quantifying contribu-tions to storm runoff through end-member mixing analysisand hydrologic measurements at the Panola MountainResearch Watershed (Georgia, USA). Hydrological Pro-cesses, 15, 1903–1924.
Christopherson, N., & Hooper, R. P. (1992). Multivariateanalysis of stream water chemical data: The use of principalcomponent analysis for the end-member mixing problem.Water Resources Research, 28, 99–107.
Devito, K. J., & Hill A. R. (1997). Sulfate dynamics in relationto groundwater-surface water interactions in headwaterwetland of the southern Canadian Shield. HydrologicalProcesses, 11, 485–500.
Devito, K. J., & Hill, A. R. (1999). Sulfate mobilization andpore water chemistry in relation to groundwater hydrologyand summer drought in two conifer swamps on theCanadian Shield. Water Air and Soil Pollution, 113, 97–114.
Dillon, P. J., & LaZerte, B. D. (1992). Response of the PlasticLake Catchment, Ontario, to reduced sulphur deposition.Environmental Pollution, 77, 211–217.
Dow, C. L., & Dewalle, D. R. (1997). Sulfur and nitrogenbudgets for five forested Appalachian plateau basins.Hydrological Processes, 11, 801–816.
Driscoll, C. T., Likens, G. E., & Church, M. R. (1998).Recovery of surface waters in the northeastern UnitedStates from decreases in atmospheric deposition of sulfur.Water Air and Soil Pollution, 105, 319–329.
Edwards, P. J., Gregory, J. D., & Lee, A. H. (1999). Seasonalsulfate deposition and export patterns for a smallAppalachian watershed. Water, Air, Soil Pollution, 110,137–155.
Eimers, M. C., & Dillon, P. J. (2002). Climate effects onsulphate flux from forested catchments in south-centralOntario. Biogeochemistry, 61, 337–355.
Eimers, M. C., Dillon, P. J., & Schiff, S. L. (2004). Sulfate fluxfrom an upland forested catchment in south-centralOntario, Canada. Water, Air, and Soil Pollution, 152, 3–21.
Evans, H. E., Dillon, P. J., & Molot, L. A. (1997). The use ofmass balance investigations in the study of biogeochem-ical cycle of sulfur. Hydrological Processes, 11, 765–782.
Fitzhugh, R. D., Furman, T., & Korsak, A. K. (2001). Sourcesof stream sulfate in headwater catchments in Otter Creekwilderness, West Virginia, USA. Hydrological Processes,15, 541–556.
Galloway, J. N., Norton, S. A., & Church, M. R. (1983).Freshwater acidification from atmospheric deposition ofsulfuric acid: A conceptual model. Environmental Science& Technology, 17, 541A.
Gibson, J. H., Galloway, J. N., Schofield, C., McFee, W.,Johnson, R., McCarley, S., et al. (1983). Rocky Mountainacidification study. U.S. Fish and Wildlife Service,Division of Biological Services, Eastern Energy and LandUse Team, FWS/oBS-80/40.17.
Hjerdt, K. N., McDonnell, J. J., Seibert, J., & Rodhe, A. (2004).A new topographic index to quantify downslope controlson local drainage. Water Resources Research, 40,W05602, doi:10.1029/2004WR003130.
Hornbeck, J. W., Bailey, S. W., Buso, D. C., & Shanley, J. B.(1997). Stream water chemistry and nutrient budgets forforested watersheds in New England: Variability andmanagement implications. Forest Ecology and Manage-ment, 93, 73–89.
Huntington, T. G., Hooper, R. P., & Aulenbach, B. T. (1994).Hydrological processes controlling sulfate mobility in a
244 Environ Monit Assess (2008) 139:227–245

small forested watershed. Water Resources Research, 30(2), 283–295.
Inamdar, S. P., & Mitchell, M. J. (2006). Hydrologic andtopographic controls on storm-event exports of dissolvedorganic carbon (DOC) and nitrate across catchment scales.Water Resources Research, 42, W03421, doi:10.1029/2005WR004212, 2006.
Inamdar, S. P., & Mitchell, M. J. (2007a). Landscape controlson storm event runoff generation across multiple catch-ments in a forested glaciated watershed. Journal ofHydrology (in press).
Inamdar, S. P., & Mitchell, M. J. (2007b). Storm event exportsof dissolved organic nitrogen (DON) across multiplecatchments in a glaciated forested watershed. Journalof Geophysical Research, 112, G02014, doi:10.1029/2006JG000309.
Inamdar, S. P., O’Leary, N., Mitchell, M. J., & Riley, J. T.(2006). The impact of storm events on solute exports froma glaciated forested watershed in western New York, USA.Hydrological Processes, 20, 3423–3439.
Kane, J. S., Arbogast, B. F., & Leventhal, J. S. (1990).Characterization of Devonian Ohio shales DO-1 as aUSGS geochemical reference sample. GeostandardsNewsletter, 14, 169–196.
LaZerte, B. D. (1993). The impact of drought and acidificationon the chemical exports from a minerotrophic coniferswamp. Biogeochemistry, 18, 153–175.
Likens, G. E., Driscoll, C. T., Buso, D. C., Mitchell, M. J.,Lovett, G. M., Bailey, S. W., et al. (2002). The biogeo-chemistry of sulfur at Hubbard Brook. Biogeochemistry, 60,235–316.
Lynch, J. A., & Corbett, E. S. (1989). Hydrologic control ofsulfate mobility in a forested watershed. Water ResourcesResearch, 25(7), 1695–1703.
McHale, M. R., McDonnell, J. J., Mitchell, M. J., & Cirmo, C.P. (2002). A field-based study of soil water and ground-water nitrate release in an Adirondack forested watershed.Water Resources Research, 38(4), 2–1:2–16.
Mitchell, M. J., David, M. B., Maynard, D. G., & Telang, S. A.(1986). Sulfur constituents in soils and streams of awatershed in the Rocky Mountains of Alberta. CanadianJournal of Forest Research, 16, 315–320.
Mitchell, M. J., Mayer, B., Bailey, S. W., Hornbeck, J. W.,Alewell, C., Driscoll, C. T., et al. (2001a). Use of stableisotope ratios for evaluating sulfur sources and losses atthe Hubbard Brook Experimental Forest. Proceedings ofAcid Rain 2000, Japan. Water, Air and Soil Pollution, 130,75–86.
Mitchell, M. J., McGee, G. G., McHale, P., & Weathers,K. C. (2001b). Experimental design and instrumenta-tion for analyzing solute concentrations and fluxes forquantifying biogeochemical processes in watersheds.Methodology paper series of the 4th International Confer-
ence on ILTER in East Asia and Pacific Region,Ulaanbaatar-Hatgal, Mongolia. 2001, pp. 15–21 2001ILTER Network.
Mitchell, M. J., Piatek, K. B., Christopher, S., Mayer, B.,Kendall, C., & McHale, P. (2006). Solute sources instream water during consecutive fall storms in a northernhardwood forest watershed: A combined hydrological,chemical and isotopic approach. Biogeochemistry, 78,217–246.
Mitsch, W. J., & Gosselink, J. G. (2000) Wetlands (3rd ed.).New York, NY: Wiley.
National Atmospheric Deposition Program (NADP). (2006).NADP Weather site: http://nadp.sws.uiuc.edu/sites/siteinfo.asp?net=NTN&id=NY10 (last accessed April 2007).
Nodvin, S. C., Van Miegroet, H., Lindberg, S. E., Nicholas, N. S.,& Johnson, D. W. (1995). Acidic deposition, ecosystemprocesses, and nitrogen saturation in a high elevationSouthern Appalachian Watershed. Water, Air and SoilPollution, 85, 1647–1652.
Olcott, P. G. (1995). Groundwater atlas of the United States:Connecticut, Maine, Massachusetts, New Hampshire, NewYork, Rhode Island, Vermont. USGS Publication No. HA730-M. USGS, Reston, Virginia.
Phillips, R. A. (1988). Relationship between glacial geologyand streamwater chemistry in an area receiving aciddeposition. Journal of Hydrology, 101, 267–273.
Rochelle, B. P., Church, M. R., & David, M. B. (1987). Sulfurretention at intensively studied sites in the U.S. andCanada. Water, Air, and Soil Pollution, 33, 73–83.
Shanley, J. B., Mayer, B., Mitchell, M. J., Michel, R. J., Bailey,S. W., & Kendall, C. J. (2005). Tracing sources ofstreamwater sulfate during snowmelt using S and Oisotope ratios of sulfate and 35S activity. Biogeochemistry,76, 161–185.
Shanley, J. B., & Peters, N. E. (1993). Variations in aqueoussulfate concentrations at Panola Mountain, Georgia.Journal of Hydrology, 146, 361–382.
Steele, D.W.,&Buttle, J.M. (1994). Sulfate dynamics in a northernwetland catchment during snowmelt. Biogeochemistry, 27,187–211.
United States Environmental ProtectionAgency (USEPA). (2007).M.K. Goddard CASTNET website: http://www.epa.gov/castnet/sites/mkg113.html (last accessed April 2007).
Warren, F. J., Waddington, J. M., Bourbonniere, R. A., & Day,S. M. (2001). Effect of drought on hydrology and sulfatedynamics in a temperate swamp. Hydrological Processes,15, 3133–3150.
Wigington, P. J. Jr., Davis, T. D., Tranter, M., & Eshleman, K. N.(1990). Episodic acidification of surface waters due toacidic deposition, NAPAP Report 12, In Acidic deposi-tion: State of science and technology, National AcidicPrecipitation Assessment Program. Washington, DC:NAPAP.
Environ Monit Assess (2008) 139:227–245 245