SUITABLE POWERHOUSE DESIGN FOR KUCHING BARRAGE … /Archive-2017/September-2017/20.pdfRenewable...
19
ISSN: 2277-9655 [Samo* et al., 6(9): September, 2017] Impact Factor: 4.116 IC™ Value: 3.00 CODEN: IJESS7 http: // www.ijesrt.com © International Journal of Engineering Sciences & Research Technology [154] IJESRT INTERNATIONAL JOURNAL OF ENGINEERING SCIENCES & RESEARCH TECHNOLOGY SUITABLE POWERHOUSE DESIGN FOR KUCHING BARRAGE TIDAL POWER SCHEME Kamran Ahmed Samo* 1 , Andrew Ragai Henry Rigit 2 , Imran Ahmed Samo 3 , Abid Ali Shah Bukhari 4 , Ahsanullah Soomro 5 , Azhaili Baharun 6 1 Department of Mechanical and Manufacturing Engineering, Faculty of Engineering, Universiti Malaysia Sarawak, 94300 Kota Samarahan, Sarawak Malaysia 2 Department of Mechanical and Manufacturing Engineering, Faculty of Engineering, Universiti Malaysia Sarawak, 94300 Kota Samarahan, Sarawak, Malaysia 3 Collage of Energy, Beijing University of Chemical Technology, 100029, China 4 School of Engineering and Applied Sciences, Aston University, Aston Triangle, Birmingham, B47ET, United Kingdom 5 School of Energy and Environment, Southeast University, Nanjing, 210000, China 6 Faculty of Engineering, Universiti Malaysia Sarawak, 94300 Kota Samarahan, Sarawak, Malaysia DOI: 10.5281/zenodo.886756 ABSTRACT Renewable energy is the best solution and alternative to overcome the world growing energy demand and fossil fuels deficiency. Tidal energy is also renewable energy that uses barrage and tide height difference to extract energy. Kuching Barrage located in Sarawak was built to mitigate flood in the city of Kuching and has the potential for development into tidal power station. The purpose of this paper is to offer suitable tidal power plant system for tidal energy harnessing at Kuching Barrage. The study showed that Kuching Barrage has the potential for installation of tidal barrage power plant for tidal energy harnessing. If Kuching Barrage were to be used for tidal energy harnessing the tidal power plant would operate by ebb generation or during the barrage daily flushing operation. The tidal power plant scheme at Kuching Barrage would be a single basin and one-way operation. Additional powerhouse structure should be constructed if the tidal scheme were to be implemented. It was estimated that the powerhouse structure would be 56.21 m in measurement; 125 m in size and with the height of 35.51 m. KEYWORDS: Tidal power plant, tidal range, flow rate, Kuching Barrage 1. INTRODUCTION This paper focuses on low and high tides energy harnessing. The Malaysia’s coastline has a huge advantage making tidal energy source for the country [1]. Lake Sihwa and La Rance tidal power plants have the set up capacity of 254 MW and 240 MW individually [2]. These tidal power plants show capable energy extraction from tides. [3] The amount of energy harnessed from tides is abundant, compared to on its own renewable energy [4]. Malaysia has many renewable operating energy power plants and continuous offers shows the progressive support on renewable energy resources. The Malaysia renewable energy sources are solar, biogas, biomass and small hydro [5]. In the year 2015, SEDA described the viable capacity of solar PV is only 209.11 MW. Alike biogas, biomass and small hydro give an estimated 110.49 MW electrical energy. High start-up price, consistency and environmental issues are the factors paying to low generation from renewable energy. Solar and wind energy power are greatly exaggerated by climate change. Different any other renewable energy, low and high tide energy harvesting is predictable. Exact amount of energy outputs from tidal power plant can be estimated accurately [4].
Transcript of SUITABLE POWERHOUSE DESIGN FOR KUCHING BARRAGE … /Archive-2017/September-2017/20.pdfRenewable...

ISSN: 2277-9655
[Samo* et al., 6(9): September, 2017] Impact Factor: 4.116
IC™ Value: 3.00 CODEN: IJESS7
http: // www.ijesrt.com © International Journal of Engineering Sciences & Research Technology
[154]
IJESRT INTERNATIONAL JOURNAL OF ENGINEERING SCIENCES & RESEARCH
TECHNOLOGY
SUITABLE POWERHOUSE DESIGN FOR KUCHING BARRAGE TIDAL POWER
SCHEME Kamran Ahmed Samo*1, Andrew Ragai Henry Rigit2, Imran Ahmed Samo3, Abid Ali Shah
Bukhari 4, Ahsanullah Soomro5, Azhaili Baharun6 1Department of Mechanical and Manufacturing Engineering, Faculty of Engineering, Universiti
Malaysia Sarawak, 94300 Kota Samarahan, Sarawak Malaysia 2Department of Mechanical and Manufacturing Engineering, Faculty of Engineering, Universiti
Malaysia Sarawak, 94300 Kota Samarahan, Sarawak, Malaysia 3Collage of Energy, Beijing University of Chemical Technology, 100029, China
4School of Engineering and Applied Sciences, Aston University, Aston Triangle, Birmingham,
B47ET, United Kingdom 5 School of Energy and Environment, Southeast University, Nanjing, 210000, China
6Faculty of Engineering, Universiti Malaysia Sarawak, 94300 Kota Samarahan, Sarawak, Malaysia
DOI: 10.5281/zenodo.886756
ABSTRACT Renewable energy is the best solution and alternative to overcome the world growing energy demand and fossil
fuels deficiency. Tidal energy is also renewable energy that uses barrage and tide height difference to extract
energy. Kuching Barrage located in Sarawak was built to mitigate flood in the city of Kuching and has the
potential for development into tidal power station. The purpose of this paper is to offer suitable tidal power plant
system for tidal energy harnessing at Kuching Barrage. The study showed that Kuching Barrage has the
potential for installation of tidal barrage power plant for tidal energy harnessing. If Kuching Barrage were to be
used for tidal energy harnessing the tidal power plant would operate by ebb generation or during the barrage
daily flushing operation. The tidal power plant scheme at Kuching Barrage would be a single basin and one-way
operation. Additional powerhouse structure should be constructed if the tidal scheme were to be implemented. It
was estimated that the powerhouse structure would be 56.21 m in measurement; 125 m in size and with the
height of 35.51 m.
KEYWORDS: Tidal power plant, tidal range, flow rate, Kuching Barrage
1. INTRODUCTION This paper focuses on low and high tides energy harnessing. The Malaysia’s coastline has a huge advantage
making tidal energy source for the country [1]. Lake Sihwa and La Rance tidal power plants have the set up
capacity of 254 MW and 240 MW individually [2]. These tidal power plants show capable energy extraction
from tides. [3] The amount of energy harnessed from tides is abundant, compared to on its own renewable
energy [4]. Malaysia has many renewable operating energy power plants and continuous offers shows the
progressive support on renewable energy resources. The Malaysia renewable energy sources are solar, biogas,
biomass and small hydro [5]. In the year 2015, SEDA described the viable capacity of solar PV is only 209.11
MW. Alike biogas, biomass and small hydro give an estimated 110.49 MW electrical energy. High start-up
price, consistency and environmental issues are the factors paying to low generation from renewable energy.
Solar and wind energy power are greatly exaggerated by climate change. Different any other renewable energy,
low and high tide energy harvesting is predictable. Exact amount of energy outputs from tidal power plant can
be estimated accurately [4].

ISSN: 2277-9655
[Samo* et al., 6(9): September, 2017] Impact Factor: 4.116
IC™ Value: 3.00 CODEN: IJESS7
http: // www.ijesrt.com © International Journal of Engineering Sciences & Research Technology
[155]
2. LITERATURE REVIEW The potential energy of tides can be harnessed by constructing tidal barrages. A tidal barrage is a dam, which is
constructed crossway an estuary. Tidal barrage blocks the entering and leaving tides and then shapes a head of
water [2, 6]. Generation of electricity using tidal barrages is same as that of hydroelectric power generation
excluding that the tidal currents flow in both ways [7]. Electrical power is created by permitting water to flow
from one side to other side of barrage [8]. The tidal barrage contains turbines that are either unidirectional or bi-
directional [7]. Tidal barrage generate electricity either by the ebb or flood or both modes equally [2].
Construction of tidal barrage needs a high cost [9]. Change in water level due to construction of barrage and
possible flooding would disturb the coastline ecosystems around shore. Water quality and turbidity in the basin
can disturb the animals that live in water. However, these issues are very gentle, and need to be separately
assessed [10]. The present tidal schemes need larger tidal ranges for produce a big amount of energy output. For
a suitable location A 7 m minimum tidal range is required [11]. A lower tidal range is 5 m. however, 2 to 3 m
tidal ranges can be used [12] Tidal turbine can be operated with small head of water ranging 1 to 1.5 m. while
large tidal ranges are encouraging [13].
2.1 Method of Generation for Efficient Operation
There are various modes of barrage operation, like single or double basin. The single basin requirement is a
single barrage through estuary. It contains a group of sluices, which when open can permit water to flow over
the barrage and turbines to produce electric power. Single basin tidal barrage can be operated either Ebb or,
flood or Two-way mode [14].
The double-basin contains of two basins. Main basin is similar as that of an ebb generation single basin.
Alteration between a double-basin and a single-basin is that an amount of electric power during ebb stage is
used to pump water into the second basin, letting a part of storing. Thus, this method can control the distribution
of power as per customer demand [14]. The main advantage of double-basin scheme over single basin scheme is
that its capability to carry electricity of great electrical energy demand. However, double-basin methods are
unsure to develop practicable due to the disorder of low-head turbines. Besides, the double -basin systems great
structure costs due to the additional length of the barrage which could also limit the improvement of this method
[14].
Low and high tide energy technology has choices for generation of power:
Single way power generation at outgoing tide: The basin is engaged at flood tide over sluice doors that are
locked once the tide has touched its maximum level. At the outgoing tide, the water in the basin is free over the
turbines and power is produced. According to the reports using single cycle, power can be produced only for a
period of four hours per day for example, Annapolis plant in Canada [14, 15, 16].
Single way power generation at overflow tide: At overflow tide the sluice doors are engaged to separate the
basin although at its lowermost level. When the tide is in height the water from the sea-side movements into the
basin through the turbines, and hence generates power. The main drawback of this cycle is that it has low size
and hence harvests smaller amount electricity. Besides, it can be environmentally harmful as the water level in
the impoundment saved back at a low level for an extensive time period. Sihwa plant is a model of overflow
generation plant [14, 15, 16].
Two way power generation: Both inward and outward tides create power over the turbines. This sequence
produces power for four hours two times a day. However, adjustable turbines are necessary [15, 16]. Two way
generations have demonstrated advantages such as reduced non-generation period and a decrease in the number
of generators [10]. La Rance is an outgoing tide and overflow generation plant; in which bulb turbines are being
utilized to drive water for optimal power generation [14, 15].
2.2 Choice of the Tidal Turbine The turbine selection is dependent on the accessible net head and flow rate. The flow rate is used to conclude the
turbine capacity. Tidal barrage turbines usually are low head turbine. For turbine selection efficiency and price
are the side factors. For turbine selection to different types of turbines of estimated ranges of head, flow rate and
appropriate power are shown in Figure 1.

ISSN: 2277-9655
[Samo* et al., 6(9): September, 2017] Impact Factor: 4.116
IC™ Value: 3.00 CODEN: IJESS7
http: // www.ijesrt.com © International Journal of Engineering Sciences & Research Technology
[156]
Figure 1: Turbine application chart [17]
2.3 Net Head Calculation
Head is clear as the changes among water level in low and high tides. The head as the change of water level at
the upstream and downstream of barrage [18].
du ZZH (1)
Where H = Head (m); uZ = Upstream water level (m);
dZ = Downstream water level (m).
tQ is well-defined as the releases of water over a turbine and be determined from hill chart of the turbine. The
water release over sluice doors sQ can be planned based on its association with the consistent head.
HACQ gds 2 (2)
Where sQ = Release over sluice door (m3/s); dC =Release coefficient for sluice door (generally larger than 1);
A = Flow region over the hydraulic building (m2); g = Quickening due to the Earth’s gravity (9.81 m/s2);
H = Head (m).
A study completed by [19], practices Equation (3) and (4) to estimate Kuching Barrage door discharged in
overflowing and flushing process.
2
3
CLHQ (3)
P
H
C 24.078.1 (4)
Where Q = Release (m3/s); C = Release coefficient; L = Thickness of door (m); H = Greater water level
(m); P = Sill height (m).
2.4 Method of Estimating Potential Energy and Annual Energy Output
Theoretical assessment technique is used of equations. For tidal barrage, basin extent and mean tidal range has
important influence on power generation. Equation (5) is the expressions of potential drive in the water capacity
[2]. 25.0 bbP hgAE (5)

ISSN: 2277-9655
[Samo* et al., 6(9): September, 2017] Impact Factor: 4.116
IC™ Value: 3.00 CODEN: IJESS7
http: // www.ijesrt.com © International Journal of Engineering Sciences & Research Technology
[157]
Where PE Potential energy over a tide cycle (GJ); Sea density (1.025 t/m3 or 1025 kg/m3); g Quickening
due to Earth’s gravity (9.81 m/s2); bA Horizontal region of basin (km2); 2
bh Mean tidal range in basin (m).
The annual energy output from a barrage can be theoretical estimated [2]. Tidal energy schemes were measured
by low standards of power conversion efficiency , frequently reaching from 20% to 40%, (with an average of
33%) [20]. Thus, the potential annual tidal energy output from a barrage can be considered as [20]:
yrE = 2987.0 bb hA (6)
Where yrE Potential annual power output (GWh/year); bA Horizontal region of basin (km2); bh Mean
tidal range in basin (m); and Efficiency of power conversion (reaching between 20% to 40%).
It was informed that accuracy of Equation 6 was confirmed from the information of a few functioning tidal
power plants [21]. For example, the La Rance tidal power station, the second model was the Annapolis tidal
power plant of Nova Scotia power [22]. Another working experimental plant was the Jiangxia tidal power
station [23]. The Sihwa lake tidal power station [24],
2.5 Mean Potential Energy, Turbine Rated Head, and Runner Diameter
Equation (7) is used to assessment the estimated mean potential energy in a day [2].
86400
42.12
24PE
P (7)
Where P =Power (GW); pE = Potential energy over a tide cycle (GJ).
Equation (8) is used to calculate the turbine rated head for mean tidal range [25].
66.0rH Mean Tidal Range (8)
According to RET Screen’s guide to calculate turbine parameter, Equation (9) is used to calculate runner
diameter [25]. 473.0
1 dt QkD (9)
2.6 Power Output for Single Turbine
Equation (10) is used to estimate rated power for one turbine [25]. Rated power is in MW.
1000
22.8 rd
r
HQP (10)
3. METHODOLOGY This paper is assumed an outline of the methods used for water head and flow rate. The proposed a methodology
for estimation of output energy, basin area calculation, and annual energy output. The methodologies of ebb
generation cycle and selection of suitable turbine are also discussed.
3.1 Water Head and Flow Rate Calculation
The calculation of water head and flow rate is essential for turbine selection. The energy from potential location
requires the data of head and flow rate. An ebb cycle generation was used to estimate the available head and
flow rate at that site. Low and high tides are collected for every day and with Equation (1) tidal range is
considered. For calculate the gate flow rate Equation (2) will be used and opening essentials to be calculated.
For the duration of flushing process, the barrage gates are opened by one meter from the upstream [26, 27]. The
opening space of the five barrage doors will be considered to discover the actual flow release at for each door of
barrage. For calculate the gate discharge during flooding-in and flushing operation Equations (3) and (4) will be
used. The method of calculation is to be related to the flow rate value achieved using Equation (2) [19].
3.2 Basin Area Calculation
About 1430 km2 of region is surrounded in Kuching Barrage and the region of the river mouth is 2450 km2 [28].
The real basin region that would disturb the barrage process will be planned with ArcGIS Pro. This ArcGIS Pro

ISSN: 2277-9655
[Samo* et al., 6(9): September, 2017] Impact Factor: 4.116
IC™ Value: 3.00 CODEN: IJESS7
http: // www.ijesrt.com © International Journal of Engineering Sciences & Research Technology
[158]
is generally used for mapping purpose but will be used to calculate basin region of Kuching Barrage. According
to this technique, existing tidal plant basin region will also be calculated. Then calculated assessment will be
matched with the real specified basin area of the existing tidal power plants.
3.3 Estimation of Potential Energy and Annual Energy Output Calculation
For estimate the potential energy Equation (5) will be used and to estimate annual energy output Equation (6)
will be used. In addition, the power estimation method will be also use to estimate present plants and matched
the rate achieved with the power plant real power output [2]. The annual estimation power output power was
calculated based on theoretical method as described by [2]. The annual output power was calculated with the
power conversion efficiency. The estimated power output from the propose turbine are to be calculated using
formula.
3.4 Mean Potential Energy, Turbine Rated Head, and Runner Diameter
For calculate the estimated mean potential energy in a day Equation (7) will be used [2]. For calculate the
turbine rated head of mean tidal range Equation (8) will be used [25]. Equation (9) will be used to calculate
runner diameter of turbine [25].
3.5 Power Output for One Turbine
For calculate rated power of a turbine Equation (10) will be used [25].
3.6 Methods of Turbine Selection The smallest water head ranges between 1 to 1.5 m for operation of turbine. Maximum tidal power plant uses
low head turbine [29]. A particular site can harness energy at a positive capacity. The parameters comprise the
tidal range, flow, characteristics of shoreline and tidal energy technology. This research will match two present
tidal turbines established on power generation efficiency, maintenance and environmental effect. The two tidal
turbines are bulb-type and straflo turbine.
These two turbines will be valued based on earlier assessments and then maximum ranking will be possible to
be a selection of turbine. Choice of the suitable turbine will also be completed using the calculated parameters
of potential location. The turbine presentation chart will be used to choice the appropriate turbine agreeing to
parameters of the chosen location. The Figure 1 head-flow range of small hydro turbine chart is presented in
literature review. [30].
4. RESULTS AND DISCUSSIONS The result presents tidal range, and estimate output power for the power generation. Parameters at Kuching
Barrage are calculated. Also selection of suitable turbine is presented and described the bulb-type and straflo
turbines. Furthermore, a suitable powerhouse tidal power plat at Kuching Barrage is also discussed.
4.1 Parameters at Kuching Barrage
The determination of this research is to plan a suitable tidal power plant scheme at Kuching Barrage. The
Pending tide tables were used to estimate tidal range of the site. The parameters of Kuching Barrage are tidal
range, water flow rate, and horizontal basin area of Kuching Barrage.
4.2 Tidal Range of Kuching Barrage
For achieved tidal range and to analyze the tidal pattern of Pending the information from tide tables 2015 [40],
was used. Analysis of the information, found low tide and high tide in Pending is 1.3 m and 5.5 m individually.
The lowermost tidal range noted in August and the maximum was verified in April by the rate of 6.7 m and 6.9
m respectively. The highest peak tidal range is about 6.8 m. The sharing of information in Figure 2 is tilted to
the right through widely held of the information found on the lower left-hand side of the planned histogram.
At Pending tidal range involvement is not likely to exhausted 7 m yearly. There is visible information break in
the planned histogram. Two populations of information are detected. The initial population of sorts from 6.30 m
to 7.46 m and the next population sort from 7.67 m to 8.20 m. the first population information ranging has great
frequency of rates equal to the next information populations. The histogram results shows, the lowermost tidal
range will be 6.3 m and this tidal range can bit up to 8.2 m at Pending. The heights of tides at Pending are
tabulated in Table 1.

ISSN: 2277-9655
[Samo* et al., 6(9): September, 2017] Impact Factor: 4.116
IC™ Value: 3.00 CODEN: IJESS7
http: // www.ijesrt.com © International Journal of Engineering Sciences & Research Technology
[159]
Figure 2: Graph of calculated tidal range in 2015 at Pending
Table 1: Tides at Pending in 2015
Parameters Symbol Value (m)
Tidal range H 6.8
High tide hH 5.5
High water level spring tide )(springhH 5.7
High water level neap tide )(neaphH 5.0
Low tide lH 1.2
Low water level spring tide )(springlH 1.2
4.3 Water Flow Rate of Kuching Barrage
The water flow through the barrage gate is calculated based on Equation (2). During flushing process, the
barrage doors are mechanically unlocked by one meter from the upstream [26, 27]. The Kuching Barrage
opening region of each door is 25 m2 as the door width is 25 m.
One more parameter in determining the water flowing rate is the release factor and is supposed to be equivalent
to 1 m [2]. On 6.8 m tidal range and supposing dC is equal to 1, the total flow calculated of Kuching Barrage is
1443.82 m3/s. The water flow calculated for each gate 288.76 m3/s. The Kuching Barrage projection level is 8
m LSD and the tidal range of 6.8 m. The standards are temporary into Equation (3) and (4).
Using Equation (2), the total discharged of Kuching Barrage 1443.82 m3/s however, by Equation (3),1Q is
achieved. If C in Equation (4) is supposed to be equal to 1, then 1Q would be 2216 m3/s. Established on these
calculating, Kuching Barrage gates discharge are much large. The peak discharge of barrage can influence up to
6674 m3/s from 0 m3/s for period of flushing operation [19]. A graph of discharge over time compared to energy
output is scheduled using Mat lab is shown in Figure 3. Water head is supposed to be constant.
Agreeing to Figure 3, the energy output at highest flow of 6674 m3/s is about 373 MW. The mean release of the
barrage door is 1732 m3/s and the mean energy output is 96.34 MW. But, as the information only noted the

ISSN: 2277-9655
[Samo* et al., 6(9): September, 2017] Impact Factor: 4.116
IC™ Value: 3.00 CODEN: IJESS7
http: // www.ijesrt.com © International Journal of Engineering Sciences & Research Technology
[160]
highest release at every flushing process it cannot be determined that the energy output to be harnessed 96.34
MW [19]. Since power is exaggerated by the size of head and flow rate. The duration of the flushing, water head
would drop as the water level downstream increase and therefore, moving size of flow rate as well as energy
output.
Figure 3: Barrage gate flow rate during flushing operation and power output
4.4 Kuching Barrage basin region
The Kuching Barrage horizontal region of basin calculated is 3.88 km2. The similar technique is completed on
two existing locations of tidal power plant. Table 2 matches the calculated standards with the real size of basin
area for two existing barrages.
Table 2: Comparison of actual and calculated basin area of existing tidal power plant
Tidal Power Plant Actual Basin Area (km2) Calculated Basin Area (km2)
Severn Barrage 570 566.52
Lake Sihwa 43 42.44
4.5 Turbine Selection
Turbine should be capable to effort powerfully at small tidal range as Kuching Barrage mean tidal range is about
6.8 m. The strategy of turbine would not disturb the barrage gates magnitude and ship lock. For Kuching tidal
barrage three main types of turbines are used that are bulb-type turbine, Straflo turbine and tubular turbine. The
first two turbines are nominated for Kuching Barrage meanwhile these turbines are at present had been used in
large scale plants (La Rance and Annapolis Tidal Power Plant). Choice of the turbine is completed through
ranking every turbine established on four main specific are scheduled [4]:
I. Environmental characteristics
II. Efficiency
III. Initial price
IV. Maintenance necessities
4.5.1 Bulb-Type Turbine
The environmental characteristics of tidal turbine are related with fish crossing point with the turbine.
Researchers observed that the during turbine operation fish is existent however; the possibility of the fish to
come in in turbine motion is lesser than when the turbine is not in action [31]. This turbine is established by a
ISSN: 2277-9655
[Samo* et al., 6(9): September, 2017] Impact Factor: 4.116
IC™ Value: 3.00 CODEN: IJESS7
http: // www.ijesrt.com © International Journal of Engineering Sciences & Research Technology
[161]
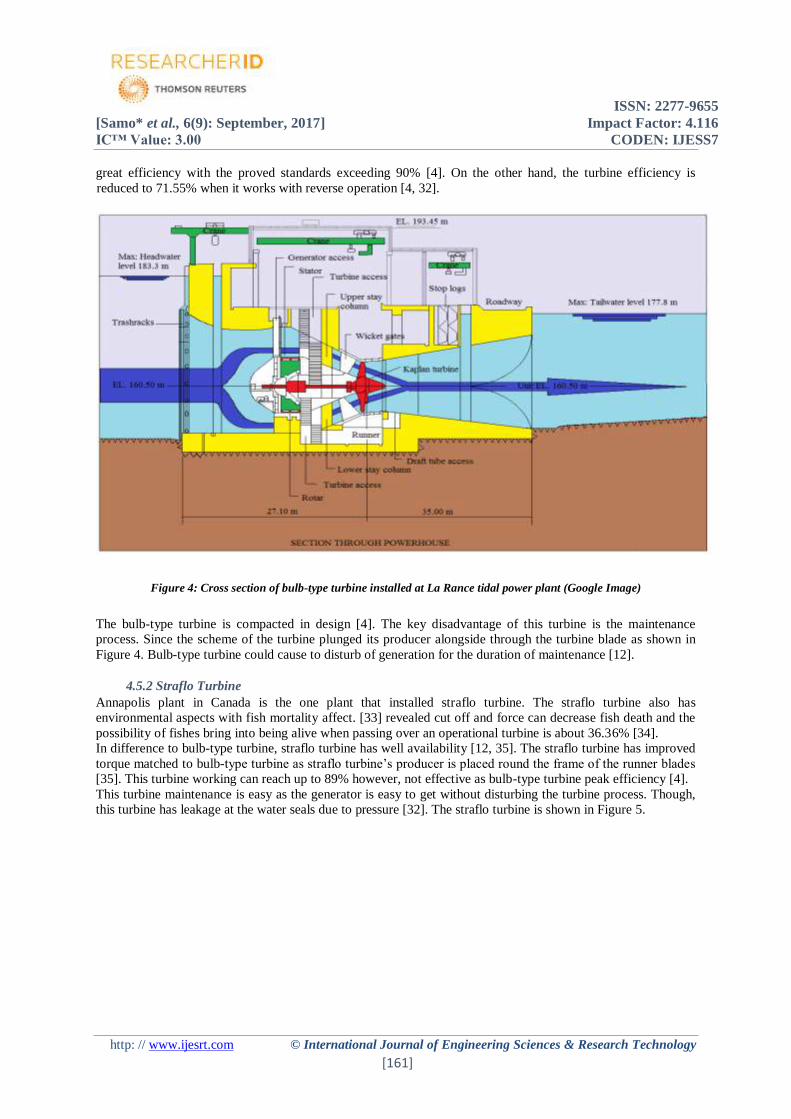
great efficiency with the proved standards exceeding 90% [4]. On the other hand, the turbine efficiency is
reduced to 71.55% when it works with reverse operation [4, 32].
Figure 4: Cross section of bulb-type turbine installed at La Rance tidal power plant (Google Image)
The bulb-type turbine is compacted in design [4]. The key disadvantage of this turbine is the maintenance
process. Since the scheme of the turbine plunged its producer alongside through the turbine blade as shown in
Figure 4. Bulb-type turbine could cause to disturb of generation for the duration of maintenance [12].
4.5.2 Straflo Turbine Annapolis plant in Canada is the one plant that installed straflo turbine. The straflo turbine also has
environmental aspects with fish mortality affect. [33] revealed cut off and force can decrease fish death and the
possibility of fishes bring into being alive when passing over an operational turbine is about 36.36% [34].
In difference to bulb-type turbine, straflo turbine has well availability [12, 35]. The straflo turbine has improved
torque matched to bulb-type turbine as straflo turbine’s producer is placed round the frame of the runner blades
[35]. This turbine working can reach up to 89% however, not effective as bulb-type turbine peak efficiency [4].
This turbine maintenance is easy as the generator is easy to get without disturbing the turbine process. Though,
this turbine has leakage at the water seals due to pressure [32]. The straflo turbine is shown in Figure 5.

ISSN: 2277-9655
[Samo* et al., 6(9): September, 2017] Impact Factor: 4.116
IC™ Value: 3.00 CODEN: IJESS7
http: // www.ijesrt.com © International Journal of Engineering Sciences & Research Technology
[162]
Figure 5: Cross section of straflo turbine installed at Annapolis tidal power plant [25]
4.5.3 Feasibility Matrix for Turbine Selection
For selection of turbine estimation criteria are listed. Ratings are given from 1 to 10 for each standard as shown
in Table 3. Based on highest total rating results turbines can be carefully chosen. Based on Table 3, bulb-type
turbine is selected for Kuching Barrage.
Table 3: Turbine selection using Feasibility Matrix
Criteria Rating Bulb-type Turbine Straflo
Turbine
Application for low tidal range 8 8 8
Reliability of technology 10 9 7
Efficiency to convert kinetic energy into mechanical energy 10 10 8
Cost for deployment and maintenance 8 6 8
Maintenance work 6 7 5
Environmental effect 6 8 8
Total Weight Factor - 392 360
4.5.4 Turbine Selection based on Kuching Barrage’s Parameters
Selection of turbine can be based on tidal range and flow rate. For the selection of suitable turbine, a
presentation chart is used to choice the appropriate turbine [17]. Discussing to Figure 6, tidal range of 6.8 m and
flow rate 288.76 m3/s; the best appropriate turbine is bulb-type turbine. Therefore, it is recommended that bulb-
type turbine to be mounted at Kuching Barrage.

ISSN: 2277-9655
[Samo* et al., 6(9): September, 2017] Impact Factor: 4.116
IC™ Value: 3.00 CODEN: IJESS7
http: // www.ijesrt.com © International Journal of Engineering Sciences & Research Technology
[163]
Figure 6: Turbine application chart [17]
4.5.5 Selected Turbine Parameters
Bulb-type turbine is recommended to be installed at Kuching Barrage. The parameters of selected turbine are
firm agreeing to the location parameters. Table 4 shows Kuching Barrage parameters.
Table 4: Parameters of Kuching Barrage
Parameters Value
Highest tide LSD +2.70
Lowest tide LSD -3.30
Regulated internal level LSD + 0.50
Tidal range 6.80 m
Barrage gate flow rate 288.76 m3/s
Horizontal basin area 3.88 km2
1. Rated Head, Hr
Equation (8) is used for calculated the turbine rated head for mean tidal range inferior than 9 m and single basin
plant [25].
2. Design flow rate
Design flow rate is planned in substituting rated head, rH obsessed by Equation (2).
3. Turbine Diameter or Runner Diameter
Equation (9) is used to estimate runner diameter and supposing k1 is equal to 0.41 greater than 1.8 m [25].
4. Power Output for Single Turbine
Equation (10) is used to estimate rated power of a turbine for dQ = 234.59 m3/s and rH = 4.488 m [25]. Rated
power is in MW. Table 5 displays the designed parameters of turbine.
6.8 m
288.76 m

ISSN: 2277-9655
[Samo* et al., 6(9): September, 2017] Impact Factor: 4.116
IC™ Value: 3.00 CODEN: IJESS7
http: // www.ijesrt.com © International Journal of Engineering Sciences & Research Technology
[164]
Table 5: Calculated turbine parameters
Parameter Symbol Unit
Rated head H r 4.488 m
Design flow rate Q d 234.59 m3/s
Throat area of turbine F 23.00 m2
Rated power output P r 8.65 MW
Runner diameter Dt 5.41 m
Researcher applied experiential methods as revealed in Figure 7 to conclude measurement of Saemangeum
powerhouse in Korea [25]. Put on the same method is used to estimation Kuching Barrage turbine diameter, tD
of 5.41 m. The considered parameters and plan sketch is displayed in Figure 8. The whole measurement of the
Kuching Barrage power plant is 42.31 m. for the turbine to be underwater at all times, the centerline must be
0.75 of the turbine diameter under the lowermost tide [27]. Kuching Barrage lowermost tide is at LSD -3.30 and
if the diameter is 5.41 m the centerline should be at least at the depth of LSD – 7.35.
Figure 7: Ideal bulb-type turbine dimensions [25]

ISSN: 2277-9655
[Samo* et al., 6(9): September, 2017] Impact Factor: 4.116
IC™ Value: 3.00 CODEN: IJESS7
http: // www.ijesrt.com © International Journal of Engineering Sciences & Research Technology
[165]
Figure 8: Kuching Barrage tidal power plant powerhouse dimensions
4.5.6 Mechanisms of Selected Turbine and its Purposes
The main mechanical components of Bulb-type turbine comprise of Kaplan runner, guide vanes, propeller shaft,
bearing and generator as displayed in Figure 9. The draft tube is the runner opening passageway of turbine,
facing to the ocean region in the situation of Kuching Barrage plant system. The key purpose of the draft tube is
to decrease the speed out of the turbine throat space. Perfect measurement of draft tube is 4.82 of the turbine
diameter [25]. Referring to Figure 8, Kuching barrage draft tube is 26.08 m extensive. Guide vanes are
important to modify flow of water in the runner according to the scheme angles of the runner blades. This
turbine has two circular bearings to care the horizontal shaft and amazed thrust through process [4].
Figure 9: Cross section of bulb-type turbine and generator [36]

ISSN: 2277-9655
[Samo* et al., 6(9): September, 2017] Impact Factor: 4.116
IC™ Value: 3.00 CODEN: IJESS7
http: // www.ijesrt.com © International Journal of Engineering Sciences & Research Technology
[166]
4.6 Energy Output from Kuching Barrage Kuching barrage at Pending was identified to be the potential location based on the highest potential energy.
The determination of this paper is to plan a suitable tidal power plant scheme at Kuching Barrage. The potential
location was determined based on tidal mapping (in earlier paper based, Tidal Energy Mapping and Potential
Locations at East Coast of Malaysia). The Kuching barrage is environmentally friendly and is free from any
security issues and did not obstruct the shipping lane. The energy output from Kuching Barrage have been
estimated using Equation 5 for potential energy generated power output over a cycle, and the annual power was
calculated by using Equation 6, which are described in literature review.
4.6.1 Kuching Barrage Potential Energy
Figure 10 displays the potential energy at pending. The tidal range start since April till October has fairly
advanced potential energy matched to other days of the year. Rendering to Sarawak Rivers Board, dry period is
practiced since the April till October. In dry period level of stream water is reduced and letting enters seawater
into the bay causing in the major actions of tidal in the bay than in wet period [37]. Therefore, in dry period the
tidal range is larger than for the duration of wet period.
Figure 10: Potential energy based on tidal range experienced 2015
4.7 Power Output Estimation Based on Kuching Barrage Parameters The site parameters, tidal range and flow rate were examined in this study. For Pending tide tables were used to
estimate tidal range of the location. The study showed that Kuching Barrage has the potential for installation of
tidal barrage power plant for tidal energy harnessing.
4.7.1 Daily Power Output Estimation
Established on Equation (5) and tidal range of 6.8 m, potential energy valued is 902 GJ tide per cycle. The daily
potential energy can be harnessed about 1804 GJ with nil potential energy during low tide. In demand to get
daily power output, the potential energy is distributed by the tidal period. The tidal period of semidiurnal tidal
form is 12.42 hours or 44712 seconds. The daily potential energy ( PE ) is 24/12.42. Based on theoretical
estimation 1743 GJ of potential energy is achieved which is about 1804 GJ from previous assumption [2].
Equation (7) can be used to estimate daily potential energy [2]. Thus, Kuching Barrage daily mean potential
energy is 0.02017 GW or 20.17 MW.
However, the energy output may not be continuous in the 12 hours (outgoing tides occur twice a day). The
Kuching Barrage power plant is estimated to produce energy output power for six hours however, generation
duration could accept dependent on tide pattern. Researchers corroborates that as the tidal range drops the

ISSN: 2277-9655
[Samo* et al., 6(9): September, 2017] Impact Factor: 4.116
IC™ Value: 3.00 CODEN: IJESS7
http: // www.ijesrt.com © International Journal of Engineering Sciences & Research Technology
[167]
energy output is also decreases as revealed in Figure 11[2]. Figure 11 shows the five turbines energy output and
the mean energy output is 29.1 MW. The Stage I, stage II and stage III is filling, holding and generating
individually. Using Equation (1) tidal range is calculated.
Figure 11: Varying power output due to the changes of sea level
4.7.2 Valuation of Annual Power Output
Annual energy output valuation is planned with Equation (6) and about 70.83 GWh/year ( P = 40%) and 35.41
GWh/year ( P = 20%). At minimum 35.41 GWh/year of power can be harness through the lowermost
efficiency. The theoretical standards are tabulated in Table 6 are related with present tidal power plant to
confirm technique of design [2]. Table 7 summarized the valued power output of Kuching Barrage scheme. The
Sejingkat demand of power is about 26.32 GWh. The generated power from the tidal plant can be distributed
obsessed by grid to growth power generation.
Table 6: Comparison of theoretical and actual power output of tidal power plant
Country Site Installed
capacity
(MW)
Ab
(km2)
∆hb
(m)
Eyr range at
Ƞ = 20 %
(GWh/year)
Eyr range at
Ƞ = 40 %
(GWh/year)
Actual or
expected output
(GWh/yr)
France La Lance 240 22.5 8.5 320.90 641.80 533
Canada Annapoils 20 6.0 6.4 48.51 97.02 50
China Jiangxia 3.9 1.37 5.1 8.88 17.76 6-7
Korea Shiwa 254 43 5.6 266.19 532.38 553
UK Severn 8640 570 7.5 6329.14 12658.28 15600
Malaysia Kuching Barrage - 3.88 6.8 35.41 70.83 -

ISSN: 2277-9655
[Samo* et al., 6(9): September, 2017] Impact Factor: 4.116
IC™ Value: 3.00 CODEN: IJESS7
http: // www.ijesrt.com © International Journal of Engineering Sciences & Research Technology
[168]
Table 7: Estimated power output of Kuching Barrage tidal power plant scheme
Power Estimation Value
Mean daily potential energy, P 20.17 MW
Turbine rated power, rp 8.65 MW/turbine
Mean daily turbine power, rP 29.1 MW (5 Turbines)
Potential annual power, yrE 35.41 GWh/year ( = 20%)
4.8 Powerhouse Design of Kuching Barrage The proposal of Kuching Barrage powerhouse is as displayed in Figure 8. At the downstream of the Kuching
Barrage opening the powerhouse is to be constructed. It is accommodate that for operation of the present barrage
structure. The proposal shown in Figure 8 and Figure 12 are drawn according to the design shown in Figure 7. The
powerhouse comprises of two stop logs at the bay and exit of the turbine. The main purpose of the logs is to support
short-term block of water movement in the course of maintenance work.
At Kuching Barrage will essentials further structure of powerhouse and fixing of fish screens at every door of the
barrage. The further constructions length is 56.21 m; 125 m in size and the elevation of 35.51 m as displayed in
Figure 12 and Figure 13. Furthermore, the powerhouse centerline is positioned at LSD -7.35 to check the turbine is
plunged at all the period. Fish screens are to be fixed at the upstream to avoid fish’s incoming turbine area. It is
discovered decrease of fish for each turbine once the fixing of fish screens at Três Marias Dam in Brazil [38].
Design of a turbine at one gate at Kuching Barrage is illustrated in Figure 15, which is based on the previous work
given by [39]. Turbine can be installed at below than low tide level as mentioned in [39]. The low tide level of
Kuching Barrage is -3.30 meter. The right hand is a storage basin as shown in Figure 15 and left hand shows the
sea side (upstream- downstream).
Figure 12: powerhouse layout of Kuching Barrage tidal power plant
ISSN: 2277-9655
[Samo* et al., 6(9): September, 2017] Impact Factor: 4.116
IC™ Value: 3.00 CODEN: IJESS7
http: // www.ijesrt.com © International Journal of Engineering Sciences & Research Technology
[169]
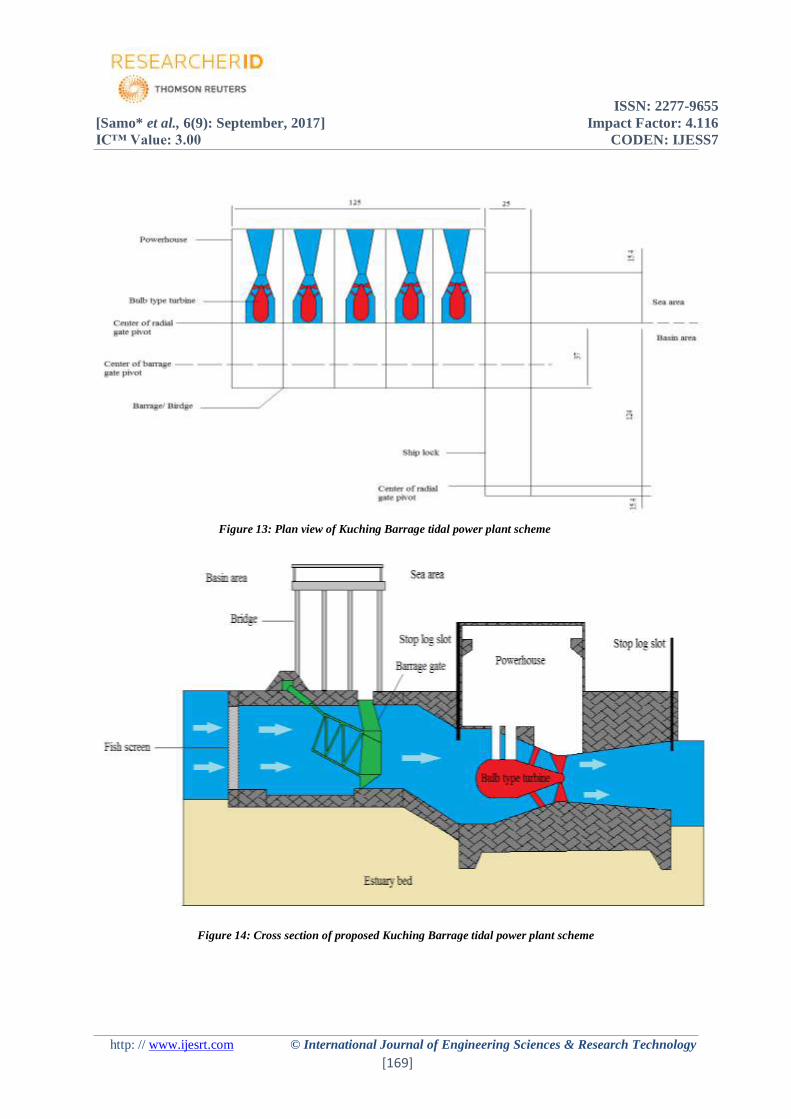
Figure 13: Plan view of Kuching Barrage tidal power plant scheme
Figure 14: Cross section of proposed Kuching Barrage tidal power plant scheme

ISSN: 2277-9655
[Samo* et al., 6(9): September, 2017] Impact Factor: 4.116
IC™ Value: 3.00 CODEN: IJESS7
http: // www.ijesrt.com © International Journal of Engineering Sciences & Research Technology
[170]
Figure 15: The turbine at one gate schematic diagram for Kuching Barrage
4.9 Proposed Operation of Kuching Barrage Tidal Power Plant Scheme Kuching Barrage located in Sarawak was built to mitigate flood in the city of Kuching and has the potential for
development into tidal power station. If Kuching Barrage to be used for tidal energy harnessing the tidal power
plant would function during the barrage daily flushing operation. The Kuching Barrage is a single-way process
and the turbine will only work at flushing method.
4.9.1 Ebb Generation
The Kuching Barrage is to produce energy by ebb generation. Figure 14 shows the cross section of the
suggested scheme at Kuching Barrage. The barrage gates are closed all time to possess the stream level and
avoid salty water pass obsessed by the stream. The gates are unlocked in daily flushing process at ebb tide [28].
Put up the barrage process, it is appropriate to produce energy in flush out process. At that time, shaft would
transfer the kinetic energy to producer and effort of coil in moving magnetic field inside the producer would
generate energy.
4.9.2 Single Basin Scheme
The calculated Kuching Barrage plant comprises of five bulb-type turbines mounted at every door of barrage.
The bulb-type turbine blades would face the sea side using 26.07 m measurement of draft tube for turbine
diameter of 5.41m (mention Figure 14 and Figure 8). The selected turbine is a one-way process. One-way
process is better as changeable turbines are challenging and costly [4]. Putting in the turbine would too support
for flushing operation with pumping.
4.10 Conclusion Harnessing tidal energy at Kuching Barrage had studied three parameters. Namely, tidal range, flow rate and
expected annual energy output. The Pending tidal range is about 6.8 m and planned discharged flow rate of five
gates 1443.82 m3/s. Bulb-type turbine was selected as the applicable turbine for Kuching Barrage.
The calculated diameter of bulb-type turbine was 5.41 m and the draft tube length was 26.08 m. The bulb-type
turbine was planned to be installed at five gates of Kuching Barrage. Rated power was about 8.65 MW/turbine.
ISSN: 2277-9655
[Samo* et al., 6(9): September, 2017] Impact Factor: 4.116
IC™ Value: 3.00 CODEN: IJESS7
http: // www.ijesrt.com © International Journal of Engineering Sciences & Research Technology
[171]
The total rated power was realized 29.1 MW for five turbines. Potential energy could be harness daily about
20.17 MW and the annual energy output to be harness at Kuching Barrage was about 35.41 GWh/year. This
valued annual energy output is viable as energy demand of Sejingkat is approximately 26.32 GWh. The daily
flushing process of Kuching Barrage during low tides and hence to put up the ebb generation process was the
appropriate. Kuching Barrage basin area was expected to be 3.88 km2. The estimated period of power generation
is to about 6 hours at determined. Kuching Barrage power plant was to be realized, further structure is essential
for the powerhouse. Based on this, the powerhouse dimension length is about 56.21 m; 125 m in width and the
height of 35.51 m. The construction is to be located downstream and the centerline habitation at -7.35 m LSD.
The Kuching Barrage scheme can be a reference for related research projects. Through the use of tidal
information by Department of Marine, Sarawak and the calculation techniques, this is now promising to mark
estimations potential for Sabah and Sarawak to generate electricity from tidal energy.
ACKNOWLEDGEMENT
The financial support for this work was provided by Universiti Malaysia Sarawak and data was provided by
Sarawak Marine Department, and Sarawak River Board Malaysia. Ministry of Higher Education Research Grant
No: ERGS/02 (02)/ 853/2012 (05).
REFERENCE
[1] Shafie, S. M., Mahlia, T. M. I., Masjuki, H. H., & Andriyana, A. (2011). Current energy
usage and sustainable energy in Malaysia: A review. Renewable and Sustainable
Energy Reviews, 15(9), 4370-4377.
[2] Xia, J., Falconer, R.A., Lin, B., & Tan, G. (2012). Estimation of annual energy output from a tidal
barrage using two different methods. Applied Energy, 93(0), 327-336.
[3] International Renewable Energy Agency. (2014). Tidal energy technology brief.
Available at: http://www.irena.org/documentdownloads/publications/tidal_energy_v4_web.pdf
[4] Waters, S., & Aggidis, G. (2016). Tidal range technologies and state of the art in review. Renewable and
Sustainable Energy Reviews. Elsevier Ltd.
[5] Leong, H. Y. (2011). Enter a new era of green energy. Retrieved from
http://www.thestar.com.my/business/business-news/2011/12/03/enter-a-neweraof-green-energy/
[6] Lim, Y.S., & Koh, S.L. (2009). Marine tidal current electric power generation: state of art and current
status, Renewable Energy, T. J Hammons, Intech. 211-226. Available from:
http://www.intechopen.com/books/renewable-energy/marine-tidal-current-electric-power-generation-
state-ofart-and-current-status
[7] Rourke, F.O., Boyle, F., & Reynolds, A. (2010). Tidal energy update 2009. Applied Energy, 87(2), 398-
409.
[8] Meisen, P., & Loiseau, A. (2009). Ocean energy technologies for renewable energy generation.
Global Energy Network Institute.
[9] Denny, E. (2009) The economics of tidal energy. Energy Policy, 37(5), 1914–1924.
[10] Jakhrani, A.Q., Rigit, A.R.H., & Samo, S.R. (2013). Estimation of Tidal Stream Energy Resources at
Sarawak Coastline and Their Potential Impact on Environment. Australian Journal of Basic and
Applied Sciences, 7(6), 503-514.
[11] Helston, C. (2012). Tidal Power. Available at http: //www.energybc.ca/profiles/tidal.html
[12] Leghari, R.H., Uqaili, M.A., & Harijan, K. (2012). Technologies for harnessing tidal power in
Pakistan.
In M. A. Uqaili, & K. Harijan (Eds.), Energy, environment and sustainable development, 111-119.
Vienna: Springer.
[13] Xia, J., Falconer, R.A., & Lin, B. (2010). Impact of different operating modes for a Severn Barrage on
the tidal power and flood inundation in the Severn Estuary, UK. Applied Energy, 87(7), 2374-2391.
[14] Etemadi, A, Emami, Y, Afshar, O.A, & Emdadi, A. (2011). Electricity generation by the tidal
barrages. Energy Procedia, 12, 928 – 935.
[15] Hammons, T. J. (1993). Tidal power. Proceedings of the IEEE, 81(3), 419-433.
[16] Hammons, T.J. (2011). Tidal power in the UK and worldwide to reduce greenhouse gas emissions
International Journal of Engineering Business Management, 3(2), 16-28.
[17] Pereira, B.S.A., Sobrinho, P.M., & Silveira, J.L. (2015). The use of LINGO programming language to

ISSN: 2277-9655
[Samo* et al., 6(9): September, 2017] Impact Factor: 4.116
IC™ Value: 3.00 CODEN: IJESS7
http: // www.ijesrt.com © International Journal of Engineering Sciences & Research Technology
[172]
develop a computer tool to provide a technical and economic analysis of a hydraulic potential that
allows the application of Francis turbines and Kaplan turbines. Available at:
https://www.researchgate.net/publication/302969536
[18] Xia, J., Falconer, R.A., & Lin, B. (2010). Impact of different tidal renewable energy projects on the
hydrodynamic processes in the Severn Estuary, UK. Ocean Modelling, 32(1–2), 86-104.
[19] Law, I.N., Oon, Y.W., Law, P.L., & Kho, F.W.L. (2011). Impacts of barrage flushing and flooding-in
operations on saline intrusion upstream. UNIMAS E-Journal of Civil Engineering, 2(1), 18-24.
[20] Tester, J.W., Drake, E.M., Driscoll, M.J., Golay, M.W., & Peters, W.A. (2005). Sustainable
energy: choosing among options: MIT press.
[21] Kerr, D. (2007). Marine energy. Philosophical Transactions: Mathematical, Physical and
Engineering Sciences, 365(1853), 971–992.
[22] Gorlov, A.M. (2001). Tidal energy. In: Encyclopedia of ocean sciences. Oxford: Academic Press,
London, 2955-2960.
[23] Wang, S., Yuan, P., Li, D., & Jiao, Y. (2011). An overview of ocean renewable energy in China.
Renewable and Sustainable Energy Reviews, 15(1), 91-111.
[24] Bae, Y.H., Kim, K.O., & Choi, B.H. (2010). Lake Sihwa tidal power plant project. Ocean
Engineering,
37(5), 454-463.
[25] Swane, H. (2007). Tidal power plant in Saemangeum (Master thesis, Delft University of Technology,
Netherlands). uuid:2895d44d-aa15-40cf-a4b1-89d21478c51f
[26] Singh, H. (2012). The physical environment of Sarawak. Kota Samarahan, Sarawak, Malaysia:
Universiti Malaysia Sarawak. ISBN 978-967-5527-44-9.
[27] SRB (n.d). Sarawak River Board. Barrage and Ship lock. The Sungai Sarawak Regulation
Scheme.Lembaga Sungai-Sungai Sarawak. Sarawak, Malaysia: Ministry of Infrastructure and
Communication,Sarawak.
[28] Mah, D.Y.S, & Selaman, O.B.S. (2012). Sarawak river barrages and environmental quality. Kota
Samarahan, Sarawak, Malaysia: Universiti Malaysia Sarawak. InfoGrafik Press Sdn. Bhd. 1-83.
[29] Xia, J., Falconer, R.A., & Lin, B. (2010). Hydrodynamic impact of a tidal barrage in the Severn
Estuary, UK. Renewable Energy, 35(7), 1455-1468.
[30] Mehmood, N., Liang, Z., & Khan, J. (2012). Harnessing ocean energy by tidal current technologies.
Research Journal of Aapplied Sciences, Engineering and Technology 4(18), 3476-3487.
[31] Viehman, H. A., & Zydlewski, G. B. (2015). Fish interactions with a commercial-scale tidal energy
device in the natural environment. Estuaries and Coasts, 38(1), 241-252.
[32] Araquistain, T.M. (2010). Tidal power: Economic and technological assessment (Master thesis,
Tsinghua University, Tsinghua, China or Universidad Polytechnic de Catalonia).
http://hdl.handle.net/2099.1/14731.
[33] Dadswell, M.J., Rulifson, R.A., & Daborn, G.R. (1986). Potential impact of largescale tidal power
developments in the upper Bay of Fundy on fisheries resources of the Northwest Atlantic.
Fisheries, 11(4), 26-35.
[34] Collins, N. (1984). Potential fish mortality associated with large hydroelectric turbines. Available at:
http://www.dfompo.gc.ca/Library/31203Collins551.pdf
[35] Balls, M. (1988). The optimal selection of turbine-generators for tidal power projects and the
optimization of their operation. (Doctoral dissertation, University of Salford, UK). Available at:
http://usir.salford.ac.uk/id/eprint/2041
[36] Voith Hydro Holding GmbH & Co. KG. (n.d.). Bulb/Pit/S-Turbines and Generators. Available at:
http://voith.com/en/Broschuere-Bulb_pit_S_turbines_screen.pdf
[37] Short, A.D., & Woodroffe, C.D. (2009). The coast of Australia. Cambridge University Press.
Available at: http://books.google.com
[38] Andrade, F.D., Prado, I.G., Loures, R.C., & Godinho, A.L. (2012). Evaluation of techniques used to
protect tailrace fishes during turbine maneuvers at Três Marias Dam, Brazil. Neotropical Ichthyology,
10(4), 723-730.
[39] Charlier, R.H. (2007). Forty candles for the Rance River TPP tides provide renewable and sustainable
power generation. Renewable and Sustainable Energy Reviews, 11(9), 2032-2057.
[40] SMD. (2015). Sarawak Tide Tables; including standard ports of Sabah: The Director of Marine
Sarawak Region, Sarawak Buoys and Lights Board.