Suitability of infrared microspectroscopic imaging for ... · IX70 (Olympus, Hamburg, Germany). A...
15
Suitability of infrared microspectroscopic imaging for histopathology of the uterine cervix Jens Einenkel, 1, * Ulf-Dietrich Braumann, 2,3, * Wolfram Steller, 4, * Hans Binder 2 & Lars-Christian Horn 5 1 Department of Obstetrics and Gynaecology, Centre for Women’s & Children’s Health, 2 Interdisciplinary Centre for Bioinformatics, 3 Institute for Medical Informatics, Statistics and Epidemiology, Leipzig University, Leipzig, 4 Institute for Analytical Chemistry, Dresden University of Technology, Dresden, and 5 Division of Perinatal and Gynaecologic Pathology, Institute of Pathology, Leipzig University, Leipzig, Germany Date of submission 3 December 2010 Accepted for publication 4 June 2011 Einenkel J, Braumann U-D, Steller W, Binder H & Horn L-C (2012) Histopathology Suitability of infrared microspectroscopic imaging for histopathology of the uterine cervix Aims: Infrared microspectroscopy (IR-MSP) has been proposed for automated histological tissue differentia- tion of unstained specimens based on chemical analysis of cell and extracellular constituents. This study aimed to determine the accuracy of IR-MSP-based histopa- thology of cervical carcinoma sections with complex tissue architecture under practically relevant testing conditions. Methods and results: In total, 46 regions of interest, covering an area of almost 50 mm 2 on sections derived from paraffin-embedded tissue of radical hysterectomy specimens, were analysed by IR-MSP (nominal resolu- tion 4.2 lm). More than 2.8 million pixel spectra that were processed using fuzzy c-means clustering followed by hierarchical cluster analysis permitted image seg- mentation regarding different biochemical properties. Linear image registration was applied to compare these segmentation results with manual labelling on hae- matoxylin and eosin-stained references (resolution 0.7 lm). For recognition of nine tissue types, sensi- tivities were 42–91% and specificities were 79–100%, mostly being affected by peritumoral inflammatory responses. Algorithmic variation of the outline of dysplasia and carcinoma revealed a spatial preference of false values in tissue transition areas. Conclusions: This imaging technique has potential as a new method for tissue characterization; however, the recognition accuracy does not justify a pathologist- independent tissue analysis, and the application is only possible in combination with concomitant conven- tional histopathology. Keywords: cervical cancer, computer-assisted image analysis, histopathology, infrared microspectroscopy Abbreviations: FCM, fuzzy c-means clustering; FPA, focal plane array; FTIR, Fourier-transform infrared; H&E, haematoxylin and eosin; HCA, hierarchical cluster analysis; IR, infrared; IR-MSP, infrared microspectroscopy; PCA, principal components analysis; ROI, region of interest; SIMCA, soft independent modelling of class analogies Introduction Infrared (IR) microspectroscopy (IR-MSP) is an emerg- ing imaging technique providing molecular informa- tion about metabolic and structural tissue status at high resolution. Such modern Fourier-transform infrared (FTIR) imaging systems, nowadays based on focal plane array (FPA) detectors combined with microscopic equipment, yield ‘spectrum pixels’ that locally represent the complex information referring to a certain spectral range of the electromagnetic waves. The spectral data can be analysed by univariate and multivariate spectrum pixel-related methods Address for correspondence: J Einenkel, Zentrum fu ¨ r Frauen- und Kindermedizin der Universita ¨t Leipzig, Liebigstraße 20a, 04103 Leipzig, Germany. e-mail: [email protected] *These authors contributed equally to this work. Ó 2012 Blackwell Publishing Limited. Histopathology 2012 DOI: 10.1111/j.1365-2559.2011.04140.x
Transcript of Suitability of infrared microspectroscopic imaging for ... · IX70 (Olympus, Hamburg, Germany). A...
Suitability of infrared microspectroscopic imaging forhistopathology of the uterine cervix
Jens Einenkel,1,* Ulf-Dietrich Braumann,2,3,* Wolfram Steller,4,* Hans Binder2 &
Lars-Christian Horn5
1Department of Obstetrics and Gynaecology, Centre for Women’s & Children’s Health, 2Interdisciplinary Centre for
Bioinformatics, 3Institute for Medical Informatics, Statistics and Epidemiology, Leipzig University, Leipzig, 4Institute for
Analytical Chemistry, Dresden University of Technology, Dresden, and 5Division of Perinatal and Gynaecologic Pathology,
Institute of Pathology, Leipzig University, Leipzig, Germany
Date of submission 3 December 2010Accepted for publication 4 June 2011
Einenkel J, Braumann U-D, Steller W, Binder H & Horn L-C
(2012) Histopathology
Suitability of infrared microspectroscopic imaging for histopathology of the uterine cervix
Aims: Infrared microspectroscopy (IR-MSP) has beenproposed for automated histological tissue differentia-tion of unstained specimens based on chemical analysisof cell and extracellular constituents. This study aimedto determine the accuracy of IR-MSP-based histopa-thology of cervical carcinoma sections with complextissue architecture under practically relevant testingconditions.Methods and results: In total, 46 regions of interest,covering an area of almost 50 mm2 on sections derivedfrom paraffin-embedded tissue of radical hysterectomyspecimens, were analysed by IR-MSP (nominal resolu-tion �4.2 lm). More than 2.8 million pixel spectra thatwere processed using fuzzy c-means clustering followedby hierarchical cluster analysis permitted image seg-mentation regarding different biochemical properties.
Linear image registration was applied to compare thesesegmentation results with manual labelling on hae-matoxylin and eosin-stained references (resolution�0.7 lm). For recognition of nine tissue types, sensi-tivities were 42–91% and specificities were 79–100%,mostly being affected by peritumoral inflammatoryresponses. Algorithmic variation of the outline ofdysplasia and carcinoma revealed a spatial preferenceof false values in tissue transition areas.Conclusions: This imaging technique has potential as anew method for tissue characterization; however, therecognition accuracy does not justify a pathologist-independent tissue analysis, and the application is onlypossible in combination with concomitant conven-tional histopathology.
Keywords: cervical cancer, computer-assisted image analysis, histopathology, infrared microspectroscopy
Abbreviations: FCM, fuzzy c-means clustering; FPA, focal plane array; FTIR, Fourier-transform infrared; H&E,haematoxylin and eosin; HCA, hierarchical cluster analysis; IR, infrared; IR-MSP, infrared microspectroscopy; PCA,principal components analysis; ROI, region of interest; SIMCA, soft independent modelling of class analogies
Introduction
Infrared (IR) microspectroscopy (IR-MSP) is an emerg-ing imaging technique providing molecular informa-
tion about metabolic and structural tissue status athigh resolution. Such modern Fourier-transforminfrared (FTIR) imaging systems, nowadays based onfocal plane array (FPA) detectors combined withmicroscopic equipment, yield ‘spectrum pixels’ thatlocally represent the complex information referring to acertain spectral range of the electromagnetic waves.The spectral data can be analysed by univariateand multivariate spectrum pixel-related methods
Address for correspondence: J Einenkel, Zentrum fur Frauen- und
Kindermedizin der Universitat Leipzig, Liebigstraße 20a, 04103
Leipzig, Germany. e-mail: [email protected]
*These authors contributed equally to this work.
� 2012 Blackwell Publishing Limited.
Histopathology 2012 DOI: 10.1111/j.1365-2559.2011.04140.x

(e.g. pattern recognition procedures, functional groupmapping, and single-band analysis), and eventuallyprovide simple arbitrarily coloured images without anystaining procedure.1,2 All of this appears to be ideal foran accurate, rapid, operator-independent and repro-ducible approach to characterize tissue sections, as hasalready been applied as a diagnostic tool for certaintissue probes.
The broad application field of IR-MSP-based histopa-thology has principally focused on the followingclinical problem areas: (i) discriminating normal tissuefrom pathological or, particularly, malignant tissuealterations (e.g. screening methods and frozen section-ing);3–13 (ii) analysing complex tissue architectures (tofurther objectify and specify visible light-based histo-pathological assessment);1,3,14,15 (iii) localizing specifictissue components and biomarkers;16–19 and (iv) eval-uating biochemical variations within specific tissuetypes over time (functional assays).17,20 Focusing onthe first two mentioned areas, exciting results with veryhigh values of accuracy have recently been reported forrecognition of benign and malignant lesions in severaltissues, including prostate, breast, pancreatic, oesoph-agus, brain and colon tissue.2–8 However, previousstudies have been limited in both their impact and theirrelevance concerning the number of analysed pixelspectra of the validation datasets. Some have remainedbelow 1000,4,5,8,13 and the majority of datasets havecovered fewer than 500 000 spectra,3,9,11,12,15,18
whereas regions of interest (ROIs) were, in part,restricted to well-defined areas.3,4,10,11 Therefore, qual-ity assessments of only small areas have raised thesuspicion of a spatial-related selection bias.21 A singlestudy that analysed xenografted human colon carci-nomas in a nude-mouse model comprised a very largedataset but did not determine the exact accuracy fortissue type recognition.22 Furthermore, the approach ofall previous studies was characterized by visual com-parisons between IR-based segmentations and conven-tional histopathology, which represents the diagnostic‘gold standard’. This, however, means that real co-registration is missing, and this introduces an avoid-able error that severely affects all further assessments.The successful translation of IR-MSP from a highlypromising method for basic research to applications forclinical research and diagnostics clearly requires bothmore comprehensive and less restricted investigations.
Encouraged by previous spectroscopic studies onexfoliated cells from the uterine cervix23–25 and prom-ising results of IR spectral mapping of normal, dysplasticand neoplastic changes of human cervical tissue,26–28
we have used radial uterine cervix tissue sectionsderived from patients with cervical cancer. For the first
time, we integrate both complete tissue segmentation ofhaematoxylin and eosin (H&E)-stained tissue sectionsand co-registration of IR-based and visible light-basedimages in order to precisely evaluate the accuracy ofIR-MSP-based histopathology to an unprecedentedextent.
Materials and methods
patient characteristics, sample preparation,
workflow, and manual tissue segmentation
The study included a set of six randomly selectedpatients with cervical cancer who underwent totalmesometrial resection,29 a special type of nerve-sparingradical hysterectomy, with pelvic and possibly para-aortic lymphadenectomy as the primary treatment, atthe Department of Obstetrics and Gynaecology, LeipzigUniversity. The distribution according to pertinentclinical and histopathological variables is shown inTable 1. Tumours were classified according to theguidelines of the World Health Organization.30 In-formed consent to take specimens for research afterclinical diagnosis was obtained.
The uterine cervix was opened lengthways, and radialsamples were used to prepare adjacent pairs of 10-lm-thick tissue sections. One was mounted on a conven-tional glass slide, stained with H&E, and imaged bytransmission light microscopy. This first section servedas a position reference and for identifying ROIs for IRmicrospectroscopy on the second section mounted on anIR-transparent calcium fluoride slide (Figure 1A,B). Inaddition, the slide was deparaffinized by washing inxylol and ethanol, according to the routine H&E stainingprocedure. After IR spectroscopic data were acquired,the section was also stained with H&E (Figure 1C).Photomicrographs with a nominal image resolution of�0.7 lm per square pixel were recorded with a digitalcamera fitted to an inverse light microscope OlympusIX70 (Olympus, Hamburg, Germany).
A sample size of 46 ROIs covering a total area of49.864 mm2 was arbitrarily selected. ROIs weredefined with the aim of capturing all tissue types of arespective section and, especially, for consideration ofcomplex transition areas near tissue boundaries.
Histopathological assessment and manual tissue typesegmentation of exactly the same ROIs (including smallperipheral margins) were performed by a trainedgynaecologic pathologist (L.-C.H.) in a blinded fashionwith respect to the IR segmentation result. The image-editing software Corel Photo-Paint X3 (Corel, Ottawa,ON, Canada) was used to delineate the differenttissue types, and the segmentation result was an
2 J Einenkel et al.
� 2012 Blackwell Publishing Ltd, Histopathology

inconsistency-free label image depicted with falsecolours (Figure 2A,B). The distribution of a total ofnine distinct tissue types is summarized in Table S1. Ifstaining-caused deformations of the second sectionpreviously used for IR-MSP were too pronounced, theadjacent section used for position reference was insteadtaken for manual segmentation in 24% of all 46 ROIs(n = 11; see highlighted values in Table S2).
ir-msp data acquis it ion and preprocess ing
IR spectra were recorded with a Bruker IFS66 ⁄ S FTIRspectrometer coupled to a Hyperion microscope andequipped with a 64 · 64 FPA detector (Bruker Optik,Ettlingen, Germany). Images of 4096 IR spectra at aspectral resolution of 8 ⁄ cm were acquired with Opussoftware (Bruker), with the FPA operated in continu-ous-scan mode by co-adding 21 interferograms.Nominal coverage of a single FPA detector elementcorresponds to a tissue area of 4.2 · 4.2 lm2 at
·15 magnification. If the ROI area exceeded267 · 267 lm2, a series of IR images were recordedby moving the sample stage in increments of 267 lm(mapping approach).
Data pretreatment included the merging of different IRimages into a single dataset, filtering, baseline correc-tion, and normalization. A spectral range from 950 to1800 ⁄ cm was captured, and to discriminate betweendifferent tissue types, a reduced range from 950 to1480 ⁄ cm was considered as a fingerprint region.Different backgrounds and offsets in the spectra werecorrected by subtracting a linear baseline over theconsidered ranges. Low-absorbance spectra with poorsignal-to-noise ratios were removed from further anal-ysis (‘reject’ cluster no. 13). The spectra were furtherscaled at the amide I band (1655 ⁄ cm) to obtain relativeintensities between zero and unity by multiplying by acorrection factor. This normalization is assumed tocompensate for the effect of global intensity changesresulting from slight variations in sample thickness.
Table 1. Patient characteristics and morphological findings of all tumour specimens
Characteristic ⁄ feature
Patient ⁄ tumour
I II III IV V VI
Age (years) 39 36 68 51 50 68
pT (tumour size andlocal spread)
1b1 1b2 2b 2b 2a 1b1
Tumour size (cm) (a ⁄ b ⁄ c) 2.5 ⁄ 3.0 ⁄ 2.2 4.9 ⁄ 4.0 ⁄ 3.6 2.7 ⁄ 3.6 ⁄ 1.3 5.2 ⁄ 4.0 ⁄ 2.5 2.7 ⁄ 2.5 ⁄ 0.9 2.0 ⁄ 2.0 ⁄ 0.5
pN (regional lymph nodes)*† 0 (0 ⁄ 48) 1 (3 ⁄ 34) 1 (1 ⁄ 35) 0 (0 ⁄ 34) 0 (0 ⁄ 59) 0 (0 ⁄ 43)
pM (metastases, distantlymph nodes)*†
X 0 (0 ⁄ 6) 0 (0 ⁄ 10) X X X
Typing Adenocarcinoma SCC SCC SCC SCC SCC
Relative depth of cervicalstroma invasion (%)
100 100 100 100 100 73
Grading 3 2 3 1 2 2
L (lymph vascular spaceinvolvement)*
1 1 1 1 1 1
V (blood vascular spaceinvolvement)*
0 0 0 0 0 1
Pattern of invasion Finger-like Finger-like Closed Finger-like Diffuse Closed
Peritumoral inflammatory response Strong Weak Strong Weak Weak Strong
SCC, Squamous cell carcinoma.
*X = Not known; 0 = no; 1 = yes.
†Number of positive nodes ⁄ number of all removed nodes.
Infrared microspectroscopic histopathology 3
� 2012 Blackwell Publishing Ltd, Histopathology

segmentation of the ir images
The applied two-stage segmentation was performed bythe analytical chemist (W.S.) in a blinded fashion, andutilized a combination of unsupervised and supervisedpattern recognition methods. The first bootstrappedthe second; that is, reference data for parameterizationin the final supervised step were gained from thepreceding unsupervised step. Whereas the latter wasaccomplished with our previously described approachconsisting of non-hierarchical fuzzy c-means clustering(FCM) following a hierarchical cluster analysis (HCA),1
here a supervised classification scheme called softindependent modelling of class analogies (SIMCA)was applied. SIMCA was considered for this workbecause the FCM ⁄ HCA method alone is no longerfeasible, owing to the quadratic complexity of computermemory requirements, and would demand the com-plete set of spectra to be clustered. However, SIMCArequires training data, which in turn can be providedby using FCM ⁄ HCA, as long as the underlying dataamount remains restricted. Direct access to trainingdata is not possible, as histological characterizationwould necessitate procedures adversely affecting anyfollowing IR-MSP processing.
In detail, unlike HCA, FCM clustering is feasible forlarge spectra numbers. HCA, however, provides clus-tering results with explicit similarity distance informa-tion. Therefore, after pre-clustering the data into 35clusters (far beyond the expected number of tissuetypes), in the HCA step the number of FCM clusters wasfurther restricted to 12, to roughly agree with thenumber of present tissue types, as was suggested afterinitial histopathological assessment of the microscopicimages. This FCM ⁄ HCA cascade for providing thetraining data for SIMCA was applied to a subset of theROIs with �0.5 · 106 spectra.
To perform the training for SIMCA, from this subsetof spectra about 4500 model spectra, together withtheir corresponding cluster labels 1–12 assigned byFCM ⁄ HCA, were extracted. The main criterion forselecting model spectra was to reflect the spectraldiversity observed for each of the 12 FCM ⁄ HCA pre-clustered regions, whereas the resulting number ofcontributing spectra remained between 200 and 1000per cluster. The basic principle of SIMCA is to accom-plish a separate principal components analysis (PCA)for the spectral data contributing to each cluster.Therefore, cluster-individual PCA models representedby a linear subspace around a mean vector wereobtained from the training phase. In the applicationphase of the SIMCA method, the vectorial distancebetween a sample and each PCA model was computed
500 µm
C
B
Escc
scc
BV
Ec
En
V
S
A
Figure 1. Microscopic overview of images of two neighbouring
sections of tumour II. A, Unstained section mounted on a CaF2
window with labelling of seven regions of interest (ROIs) (the size of
each region is given in Table S2). B, Adjacent section of A ⁄ C stained
with haematoxylin and eosin (H&E) for primary determination of the
ROIs. Ec, ectocervix; En, endocervix; V, vagina; E, epithelium; SCC,
squamous cell carcinoma; S, stroma; BV, blood vessels filled with
erythrocytes. C, Section A was stained with H&E after infrared data
acquisition; arrows indicate regions with clear differences in relation
to the adjacent section B (section-to-section variations).
4 J Einenkel et al.
� 2012 Blackwell Publishing Ltd, Histopathology

after projecting the sample spectra data into eachrespective linear subspace. The model with the closestdistance was considered to best represent the spectrumof the sample, so that its physical area (i.e. the IR pixel)could finally be assigned to a certain IR cluster. To
visualize the clustering results, coloured label imageswere provided, indicating respective regions withsimilar spectral absorption properties (Figure 2C).
image registration and evaluation of
ir tissue recognition
To objectively compare the segmentation resultsobtained from the IR chemical with dye-assistedimaging, an intermediate step was required to co-register the images of both modalities. An interactivelandmark-based linear (rigid) image registration wasapplied, whereby a redundant number of four respec-tive landmark points was assigned for each image pair.A least-squares fitting procedure was applied in order todetermine the registration parameters. Solutions forscaling, rotation and translation to accomplish theregistration can be directly computed. The referenceimage geometry was set to that of the histologicalimages; that is, the nominal pixel size for performanceof one-by-one comparisons was approximately0.7 · 0.7 lm2. This rigid registration and the adapta-tion of resolution were applied to all 46 ROI pairs, andfinally the coincidence of the IR-based segmentationresults and the manual labelling of the H&E-stainedsections was determined pixel by pixel (Figure 2D).
tumour segment outline variation experiment
Preliminary investigations have suggested the assump-tion that transition areas of adjacent tissue types areproblematic and represent the major error source in IR-MSP tissue recognition.21 The impact of these transi-tion areas on the accuracy of IR-MSP was estimated byan algorithmic variation of the outline of dysplasia andcarcinoma segments in the histopathological referencein relation to an IR cluster combination (clustercombination synonym ‘atypical tissue no. 2’; see
A
B
C
D
100 µm
Figure 2. Region of interest (ROI) no. 1 of patient ⁄ tumour II (see
Figure 1). A, Microscopic image of the haematoxylin and eosin
(H&E)-stained section (0.66 · 0.66 lm2 ⁄ pixel). B, Complete manual
segmentation of the H&E-stained image A with six tissue classes: red,
tumour; blue, cervical stroma; yellow, inflammatory cells; magenta,
erythrocytes; green, mucus and detritus; black, holes and fissures.
C, Infrared microspectroscopy (IR-MSP) image of a part of the same
tissue section taken before staining and scaled on the same size (lower
resolution of 4.2 · 4.2 lm2 ⁄ pixel spectra); the colours represent 12
IR clusters. D, Alignment of the infrared and H&E images after
registration (scaling, translation, and rotation) based on four
manually assigned orientation points; the image analyses yielded the
following values of sensitivity and specificity: 91.1% and 98.9% for
the areas of squamous cell carcinoma; 80.5% and 58.1% for stroma;
37.0% and 85.2% for inflammatory cells; and 16.0% and 99.9% for
erythrocytes.
Infrared microspectroscopic histopathology 5
� 2012 Blackwell Publishing Ltd, Histopathology

Results). Starting from the original result of the manualtissue type segmentation, the segment outlines werevaried stepwise (n = 15) in the following way: in orderto determine the alteration of sensitivity, the outlinewas shrunk, and to assess the specificity, the outlinewas enlarged (Figure 3).
statistical analysis
Data analysis was primarily descriptive. Sensitivity andspecificity statistics were used to evaluate IR-MSPimaging as a diagnostic test for the recognition ofdifferent tissue types. The terms true and false refer tothe histological reference regarding the presence orabsence of the tissue type of interest. Sensitivity is theproportion of true-positive spectra pixels of all pixels ofthe pertaining tissue type; specificity is the proportionof true-negative pixels of all pixels of the remainingtissue types. For easy comparison of these valuesbetween histopathologically defined subgroups, ‘accu-racy’, defined as a proportion of both true positives andtrue negatives in relation to all, was additionally used.Features measured in continuous scales were summa-rized in box-and-whisker plots, and categorical featureswere presented as counts and proportions. The Wilco-xon test was used for the analysis of paired values thatwere not normally distributed.
Results
matching matrix for microspectroscopic and
histopathological imaging
All 46 ROIs of the validation dataset were composed ofa total number of 2 864 960 spectra pixels. Subse-quently, the H&E-stained sections were digitalized at ahigher spatial resolution, which resulted in108 044 942 image pixels for the same overall area(resulting scaling factor: 6.14).
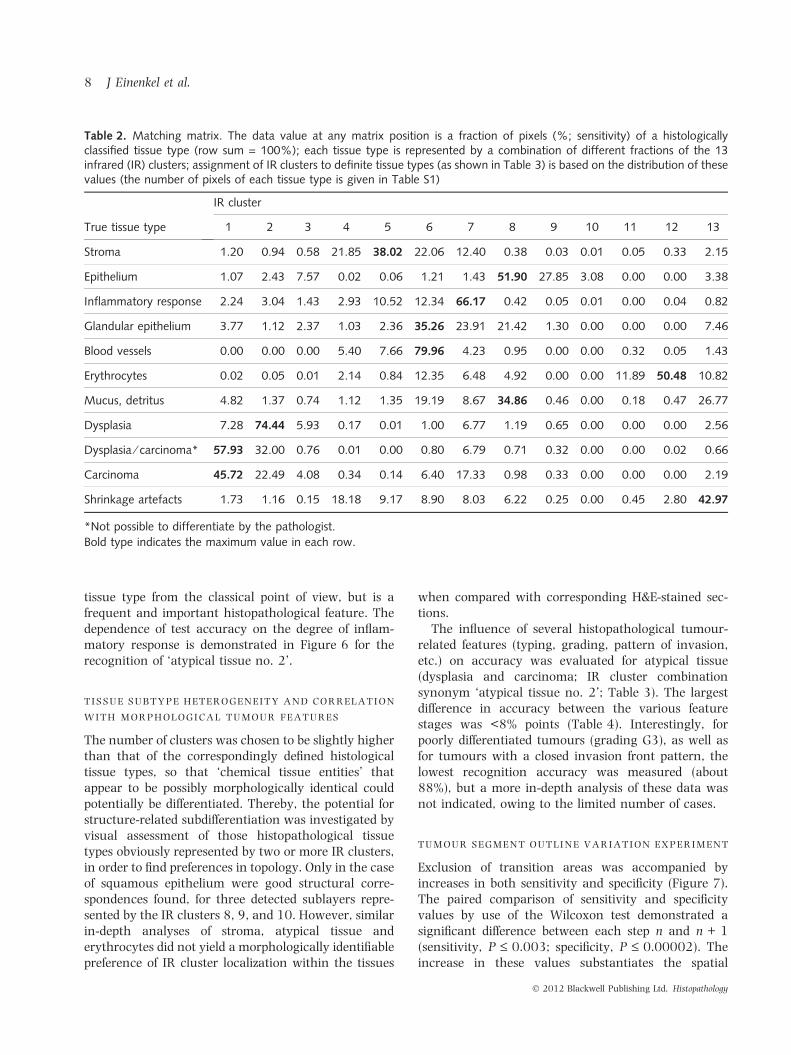
The basis for differential assessments of the resultsobtained is provided by the histology-related matchingmatrix (Table 2). The maximum values of coincidencebetween the different tissue types and all IR clustersranged from 35% to 80%, with the highest coincidencebetween ‘blood vessels’ and cluster 6. The worstmaximum values were found for ‘mucus and detritus’(IR cluster 8) and ‘glandular epithelium’ (IR cluster 6).Pixels of the former also showed a high level ofcoincidence (27%) with the ‘13th cluster’, representinga rejection class either for spectra arising from tissue-free areas or spectra with poor signal-to-noise ratios.Mucus and cell detritus were localized within hollows,glandular ducts and tissue-free areas, exhibiting
only low diagnostic importance. Glandular epitheliumshowed a flat frequency distribution over three IRclusters (6–8). Some other tissue types were ambigu-ously represented by several IR clusters, which wereexpediently combined for further analysis. In order toachieve an unambiguous assignment between onetissue type and several IR cluster combinations, ‘clustercombination synonyms’ were introduced (Table 3,column 3).
tissue type-related assessment of accuracy
by binary classif ication testing and its
variation between the different roi s
Considering all patients, values of sensitivity andspecificity ranged from 46% to 91%, and from 79% to100%, respectively, for recognition of the differenttissue types (Table 3). In spite of possible IR clustercombining, glandular epithelium was not reasonablyassignable. Although its maximum match occurredfor IR cluster 6 (peak: 35%), this cluster 6 in turnwas also well associated with stroma and bloodvessels and, in fact, it would be better included in acluster combination {4, 5, 6} associated with bothstroma and vessels (Table 2). This can clearly beattributed to the fact that this glandular epitheliumconsists of a stroma-adjacent cellular monolayer witha thickness in the order of the spatial resolution of IR-MSP (Figure 4). Unfortunately, this finding empha-sizes that some relevant histological structures withextents too close to the diffraction limit may possiblybe missed.
If the sensitivity and specificity are calculated notonly for the whole dataset, but separately for each ROI,the values show a considerable variance, as is demon-strated in the box-and-whisker plot in Figure 5.
In all cases where the adjacent section had to be usedfor segmentation, the test accuracy was not worsened(e.g. 92.9% versus 92.8% for recognition of atypicaltissue no. 2; Table 4).
error analysis of the classif ication results
The tissue types ‘stroma’ and ‘inflammatory response’were most frequently classified as ‘false positive’ in thesensitivity and specificity statistics (Table 3, rightmostcolumn). This outcome concerning ‘stroma’ wasexpected; stroma represents the dominantly occurringtissue type of the whole dataset (57%; Table S1), has akey tissue-supporting function, and occurs adjacent tomost other tissues. Furthermore, the ‘inflammatoryresponse’, i.e. the infiltration of tissue with inflamma-tory and immunocompetent cells, is not an actual
6 J Einenkel et al.
� 2012 Blackwell Publishing Ltd, Histopathology

Original images
A/B
C/D
E/F
G/H
True positives False negatives Exclusion area True negatives False positivesBorder of computation
Hom
ogen
eous
dis
trib
utio
n of
fals
e ne
gativ
esH
omog
eneo
us d
istr
ibut
ion
of fa
lse
posi
tives
Inho
mog
eneo
us d
istr
ibut
ion
of fa
lse
nega
tives
with
pre
fere
nce
of th
e tr
ansi
tion
area
sIn
hom
ogen
eous
dis
trib
utio
n of
fals
e po
sitiv
esw
ith p
refe
renc
e of
the
tran
sitio
n ar
eas
Exlusion of the transition area ofdifferent tissue types
Δ S
ensi
tivity
: 0.9
→ 0
.9Δ
Sen
sitiv
ity: 0
.9 →
0.9
5Δ
Spe
cific
ity: 0
.896
→ 0
.895
Δ S
peci
ficity
: 0.8
96 →
0.9
29Figure 3. Schematic represen-
tation of two possible changes
in sensitivity (A ⁄ B,C ⁄ D) and
specificity (E ⁄ F,G ⁄ H) at a time
as a function of the size of the
region of interest (ROI) and the
distribution of false negatives
and false positives, respectively.
In the case of the preference of
false negatives and positives in
the transition area of different
tissue types, exclusion of this
area yields a distinct increase in
sensitivity and specificity
(C ⁄ D,G ⁄ H). There is no change
in these values if the size of the
ROIs is reduced for a homoge-
neous distribution of both false
negatives and false positives
(A ⁄ B,E ⁄ F).
Infrared microspectroscopic histopathology 7
� 2012 Blackwell Publishing Ltd, Histopathology
tissue type from the classical point of view, but is afrequent and important histopathological feature. Thedependence of test accuracy on the degree of inflam-matory response is demonstrated in Figure 6 for therecognition of ‘atypical tissue no. 2’.
tissue subtype heterogeneity and correlation
with morphological tumour features
The number of clusters was chosen to be slightly higherthan that of the correspondingly defined histologicaltissue types, so that ‘chemical tissue entities’ thatappear to be possibly morphologically identical couldpotentially be differentiated. Thereby, the potential forstructure-related subdifferentiation was investigated byvisual assessment of those histopathological tissuetypes obviously represented by two or more IR clusters,in order to find preferences in topology. Only in the caseof squamous epithelium were good structural corre-spondences found, for three detected sublayers repre-sented by the IR clusters 8, 9, and 10. However, similarin-depth analyses of stroma, atypical tissue anderythrocytes did not yield a morphologically identifiablepreference of IR cluster localization within the tissues
when compared with corresponding H&E-stained sec-tions.
The influence of several histopathological tumour-related features (typing, grading, pattern of invasion,etc.) on accuracy was evaluated for atypical tissue(dysplasia and carcinoma; IR cluster combinationsynonym ‘atypical tissue no. 2’; Table 3). The largestdifference in accuracy between the various featurestages was <8% points (Table 4). Interestingly, forpoorly differentiated tumours (grading G3), as well asfor tumours with a closed invasion front pattern, thelowest recognition accuracy was measured (about88%), but a more in-depth analysis of these data wasnot indicated, owing to the limited number of cases.
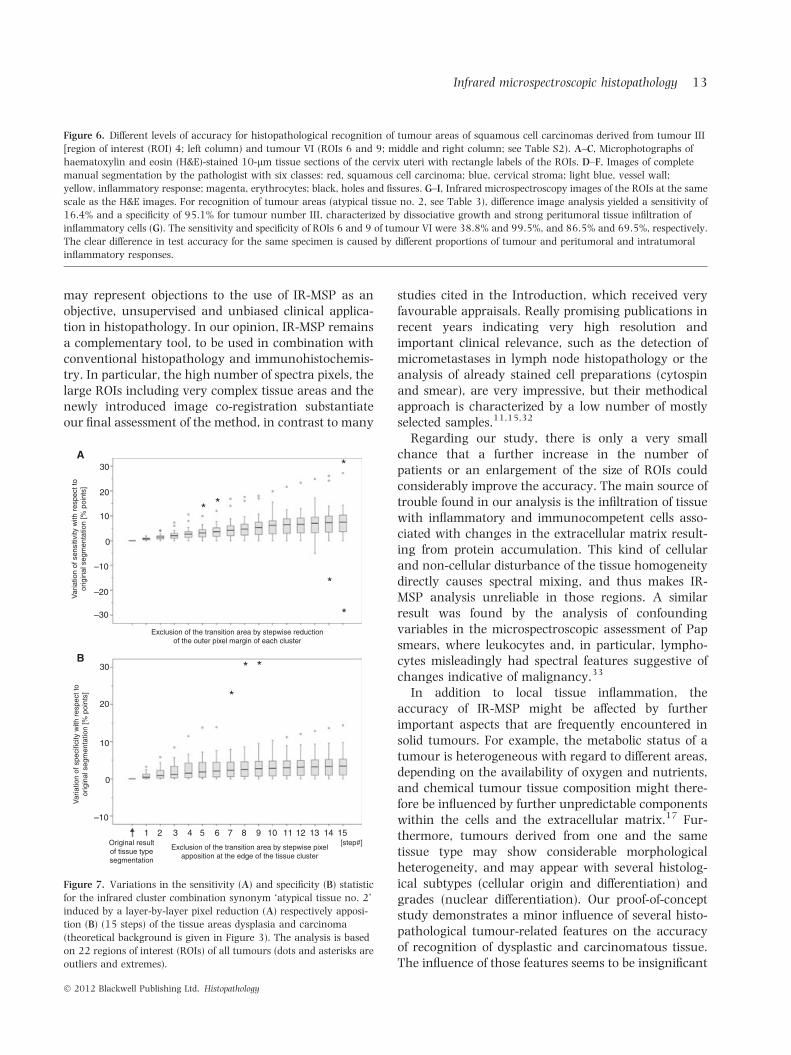
tumour segment outline variation experiment
Exclusion of transition areas was accompanied byincreases in both sensitivity and specificity (Figure 7).The paired comparison of sensitivity and specificityvalues by use of the Wilcoxon test demonstrated asignificant difference between each step n and n + 1(sensitivity, P £ 0.003; specificity, P £ 0.00002). Theincrease in these values substantiates the spatial
Table 2. Matching matrix. The data value at any matrix position is a fraction of pixels (%; sensitivity) of a histologicallyclassified tissue type (row sum = 100%); each tissue type is represented by a combination of different fractions of the 13infrared (IR) clusters; assignment of IR clusters to definite tissue types (as shown in Table 3) is based on the distribution of thesevalues (the number of pixels of each tissue type is given in Table S1)
True tissue type
IR cluster
1 2 3 4 5 6 7 8 9 10 11 12 13
Stroma 1.20 0.94 0.58 21.85 38.02 22.06 12.40 0.38 0.03 0.01 0.05 0.33 2.15
Epithelium 1.07 2.43 7.57 0.02 0.06 1.21 1.43 51.90 27.85 3.08 0.00 0.00 3.38
Inflammatory response 2.24 3.04 1.43 2.93 10.52 12.34 66.17 0.42 0.05 0.01 0.00 0.04 0.82
Glandular epithelium 3.77 1.12 2.37 1.03 2.36 35.26 23.91 21.42 1.30 0.00 0.00 0.00 7.46
Blood vessels 0.00 0.00 0.00 5.40 7.66 79.96 4.23 0.95 0.00 0.00 0.32 0.05 1.43
Erythrocytes 0.02 0.05 0.01 2.14 0.84 12.35 6.48 4.92 0.00 0.00 11.89 50.48 10.82
Mucus, detritus 4.82 1.37 0.74 1.12 1.35 19.19 8.67 34.86 0.46 0.00 0.18 0.47 26.77
Dysplasia 7.28 74.44 5.93 0.17 0.01 1.00 6.77 1.19 0.65 0.00 0.00 0.00 2.56
Dysplasia ⁄ carcinoma* 57.93 32.00 0.76 0.01 0.00 0.80 6.79 0.71 0.32 0.00 0.00 0.02 0.66
Carcinoma 45.72 22.49 4.08 0.34 0.14 6.40 17.33 0.98 0.33 0.00 0.00 0.00 2.19
Shrinkage artefacts 1.73 1.16 0.15 18.18 9.17 8.90 8.03 6.22 0.25 0.00 0.45 2.80 42.97
*Not possible to differentiate by the pathologist.
Bold type indicates the maximum value in each row.
8 J Einenkel et al.
� 2012 Blackwell Publishing Ltd, Histopathology

preference of false negatives and false positives in thetransition area (Figure 3C,D,G,H).
Discussion
Both H&E staining-based classical histopathology andIR-MSP-based biochemical histopathology are sophis-ticated pattern recognition methods; however, theyoperate on different levels. Whereas IR-MSP assessespatterns in the high-dimensional pixel spectra, con-ventional histopathology is based on comparativelylow-dimensional colour perception, and considerslocally extended structural patterns obtained at ahigher level of detail. A comparative analysis of bothmethods assumes that, for IR-MSP, slight cell differ-ences concerning concentration and conformations offunctional groups associated with proteins, lipids,nucleic acids and carbohydrates are distinctive enoughfor recognition of specific tissue types.
assessment of the methodical approach
To meet the requirements of conventional histopathol-ogy, practically relevant investigation conditions, suchas the use of formalin-fixed paraffin-embedded tissuesamples, large ROIs with transition areas on tissueboundaries, simultaneous recognition of all tissue types(possibly with strongly varying portions), and a highlevel of detail, are needed in the study design. Ourapproach comes close to these requirements, as follows.
The fixation and the impregnation of the specimenswith the embedding paraffin followed by deparaffiniza-tion is accompanied by obvious, and so far notcompletely evaluated, changes in the molecular tissuecharacteristics, and by the possibility that residualparaffin could impair the spectroscopic data.31 How-ever, the advantages of the approach outweigh theproblems with the fresh frozen section technique, sothat it has been used by most of the published studies.
Table 3. Characteristics of infrared (IR) spectroscopy as diagnostic test for recognition of histological tissue types with regard toall patients; cluster combination synonyms in bold type are further illustrated in Figure 5
True tissuetype
IR clusterno.
Clustercombinationsynonym
Sensitivity(%)
Specificity(%)
Both tissue types with the mostfrequent false-positive assignment
Stroma 4, 5, 6 Stroma 81.9 80.6 Shrinkage artefacts, inflammatoryresponse
Blood vessels 6 Blood vessels 80.0 84.0 Stroma, inflammatory response
Stroma andbloodvessels
4, 5, 6 Stroma and bloodvessels
82.2 83.4 Shrinkage artefacts, inflammatoryresponse
Epithelium 8, 9, 10 Epithelium 82.8 98.4 Shrinkage artefacts, Mucus, detritus
Inflammatoryresponse
7 Inflammation 66.2 88.2 Stroma, carcinoma
Erythrocytes 11, 12 Erythrocytes 62.4 99.5 Shrinkage artefacts, Stroma
Dysplasia 2 Dysplasia 74.4 95.2 Carcinoma, dysplasia ⁄ carcinoma
Carcinoma 1 Carcinoma 45.7 97.2 Dysplasia ⁄ carcinoma, Stroma
Dysplasia andcarcinoma
1, 2 Atypical tissue no. 1 71.9 97.4 Stroma, inflammatory response
Dysplasia andcarcinoma
1, 2, 3 Atypical tissue no. 2 75.8 96.4 Stroma, inflammatory response
Dysplasia andcarcinoma
1, 2, 3, 7 Atypical tissue no. 3 91.0 79.4 Stroma, Inflammatory response
Mucus, detritus,and shrinkageartefacts
‘13’ Detritus 41.7 97.8 Stroma, carcinoma
Infrared microspectroscopic histopathology 9
� 2012 Blackwell Publishing Ltd, Histopathology

Notably, direct analysis of paraffin-embeddedspecimens without prior chemical dewaxing is alsopossible.18,22
The average size of the 46 ROIs analysed in ourstudy was 1.084 mm2, which considerably exceeds theareas of ROIs of previous studies, particularly if theyused tissue microarrays to prepare the slides. Thestandard diameter of punches is 0.6 mm, resulting inan area of 0.283 mm2.3 Evidently, restricting theanalyses to very small selected areas is not appropriatefor evaluation of IR-MSP as a technique for generalhistopathology.
Spatial resolution is a critical measurement param-eter in IR-MSP, and strongly affects the character of theIR spectral data. The high lateral spatial resolutionobtained in our IR imaging setup corresponds withpreviously published analyses indicating a resolution ofapproximately 4–10 lm. A real improvement in reso-lution cannot be achieved with currently available IR-MSP equipment, because these values are near thediffraction limit (first realized by Abbe) in the mid-IRregion. Possibly, future developments, such as newnear field imaging techniques, might overcome thisproblem.
An important step in our processing chain is thepairwise rigid image co-registration employed for all
A
B
C
100 µm
Figure 4. Infrared (IR) microspectroscopy (IR-MSP)-based segmen-
tation of glandular epithelium. A, Haematoxylin and eosin-stained
microphotograph of a region of interest (ROI) of tumour VI. B,
Glandular epithelium is manually segmented and labelled orange; the
result of image registration is denoted by a rectangle. C, Corre-
sponding IR-MSP image; IR cluster 6 is also shown in orange; despite
the uninterrupted epithelial layer in A, cluster 6 looks like a
discontinuous streak; values of sensitivity, specificity and accuracy
are 43.1%, 84.6% and 79.2%, respectively, for this isolated ROI.
100
90
80
70
60
50
40
30Sen
sitiv
ity/s
peci
ficity
[%]
20
10
0
A B C D E
IR cluster synonym
Figure 5. Variation in sensitivity and specificity for selected infrared
cluster combination synonyms (see Table 3) computed for each
region of interest containing the considered tissue type. A, ‘Stroma
and blood vessels’ (n = 46). B, ‘Epithelium’ (n = 8). C, ‘Inflammation’
(n = 34). D, ‘Erythrocytes’ (n = 26). E, ‘Atypical tissue no. 2’
(n = 22). * Outliers
10 J Einenkel et al.
� 2012 Blackwell Publishing Ltd, Histopathology

ROIs to find an optimum of the pixel coincidence ofboth modalities. The compensation for deformationscaused by the staining procedure and by differencesin the adjacent section (in one-quarter of cases) wasreferred to the total area of an ROI. Treating partialdeformations would have required non-rigid co-regis-tration, a complex procedure necessitating an largeand unavailable number of corresponding landmarkpoints. Otherwise, a simple visual comparison of bothIR chemical and dye-assisted imaging is not accept-
able for studies characterized by precise statisticalanalysis.
assessment of the results obtained
The obtained values of sensitivity and specificityassociated with the limited recognition/identificationof small structures (e.g. glandular epithelium) and theconsiderable variance between ROIs of different local-ization were both surprising and disappointing, and
Table 4. Recognition of atypical tissue (see Table 3; ‘atypical tissue no. 2’: dysplasia and carcinoma) stratified according todifferent histopathological features and the relationship of haematoxylin and eosin (H&E) and infrared (IR) specimen sectionsbased on IR clusters 1, 2, and 3
Stratification featurePatient ⁄ tumour(ROI no.)
Total size ofH&E images(pixels)
Sensitivity(%)
Specificity(%)
Accuracy(%)
TypingSCC II, III, IV, V, VI 93 324 099 76.2 96.3 92.5
Adenocarcinoma I 14 720 843 69.5 97.0 95.0
pNpN0 I, IV, V, VI 66 936 310 85.1 95.4 93.5
pN1 II, III 41 108 632 56.9 97.8 91.7
GradingG1 IV 18 592 725 92.2 89.9 90.7
G2 II, V, VI 61 481 126 81.3 97.6 95.4
G3 I, III 27 971 091 35.2 96.9 88.6
Blood vascular space involvementV0 I, II, III, IV, V 95 914 517 75.3 96.3 92.6
V1 VI 12 130 425 80.8 96.8 94.4
Pattern of invasionClosed III, VI 25 380 673 45.3 96.7 87.7
Finger-like I, II, IV 61 171 952 87.6 95.9 94.4
Diffuse V 21 492 317 78.0 97.2 94.5
Peritumoral and intratumoral inflammatory responseWeak II, IV, V 67 943 426 86.8 96.1 94.3
Strong I, III, VI 40 101 516 50.0 96.8 90.4
Relationship between H&E and IR specimen sectionsSame section I (1, 6), II, III, IV (1, 7), V, VI
(1–6, 8–10) (n = 35)81 400 290 71.0 96.9 92.9
Adjacent sections I (2–5), IV (2–6), VI (7, 11)(n = 11)
26 644 652 86.4 94.6 92.8
SCC, Squamous cell carcinoma.
Infrared microspectroscopic histopathology 11
� 2012 Blackwell Publishing Ltd, Histopathology
A B C
D E F
G H I
100 µm
100 µm100 µm
12 J Einenkel et al.
� 2012 Blackwell Publishing Ltd, Histopathology
may represent objections to the use of IR-MSP as anobjective, unsupervised and unbiased clinical applica-tion in histopathology. In our opinion, IR-MSP remainsa complementary tool, to be used in combination withconventional histopathology and immunohistochemis-try. In particular, the high number of spectra pixels, thelarge ROIs including very complex tissue areas and thenewly introduced image co-registration substantiateour final assessment of the method, in contrast to many
studies cited in the Introduction, which received veryfavourable appraisals. Really promising publications inrecent years indicating very high resolution andimportant clinical relevance, such as the detection ofmicrometastases in lymph node histopathology or theanalysis of already stained cell preparations (cytospinand smear), are very impressive, but their methodicalapproach is characterized by a low number of mostlyselected samples.11,15,32
Regarding our study, there is only a very smallchance that a further increase in the number ofpatients or an enlargement of the size of ROIs couldconsiderably improve the accuracy. The main source oftrouble found in our analysis is the infiltration of tissuewith inflammatory and immunocompetent cells asso-ciated with changes in the extracellular matrix result-ing from protein accumulation. This kind of cellularand non-cellular disturbance of the tissue homogeneitydirectly causes spectral mixing, and thus makes IR-MSP analysis unreliable in those regions. A similarresult was found by the analysis of confoundingvariables in the microspectroscopic assessment of Papsmears, where leukocytes and, in particular, lympho-cytes misleadingly had spectral features suggestive ofchanges indicative of malignancy.33
In addition to local tissue inflammation, theaccuracy of IR-MSP might be affected by furtherimportant aspects that are frequently encountered insolid tumours. For example, the metabolic status of atumour is heterogeneous with regard to different areas,depending on the availability of oxygen and nutrients,and chemical tumour tissue composition might there-fore be influenced by further unpredictable componentswithin the cells and the extracellular matrix.17 Fur-thermore, tumours derived from one and the sametissue type may show considerable morphologicalheterogeneity, and may appear with several histolog-ical subtypes (cellular origin and differentiation) andgrades (nuclear differentiation). Our proof-of-conceptstudy demonstrates a minor influence of several histo-pathological tumour-related features on the accuracyof recognition of dysplastic and carcinomatous tissue.The influence of those features seems to be insignificant
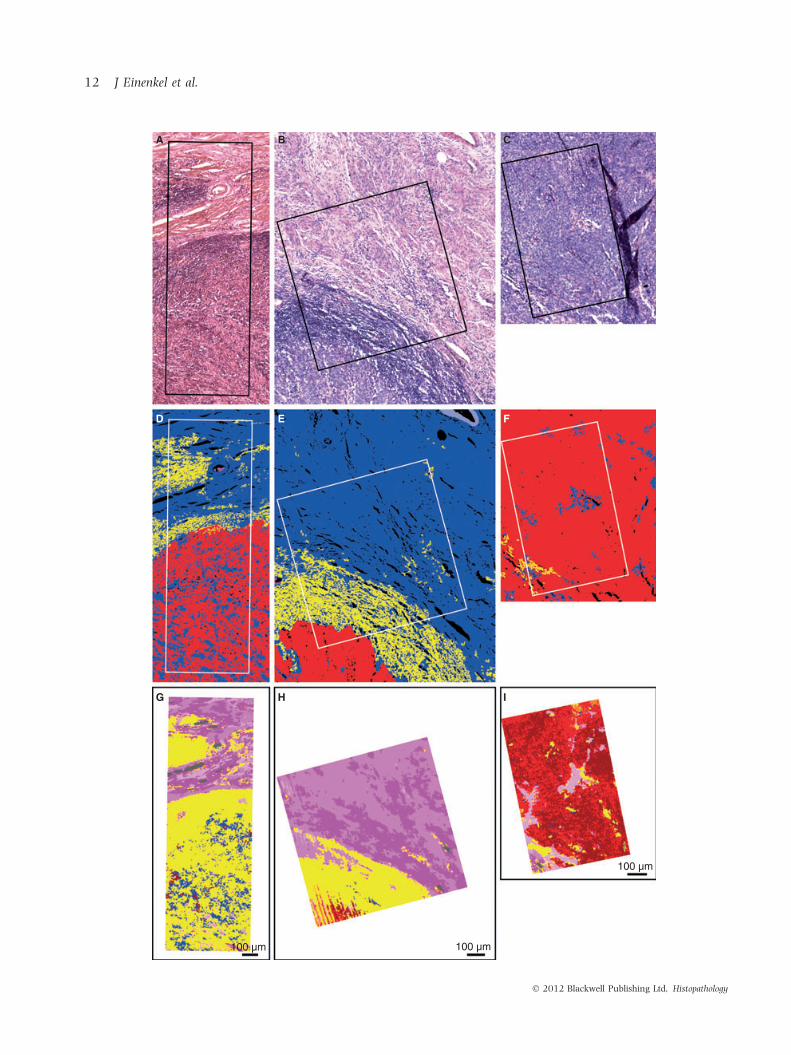
Figure 6. Different levels of accuracy for histopathological recognition of tumour areas of squamous cell carcinomas derived from tumour III
[region of interest (ROI) 4; left column) and tumour VI (ROIs 6 and 9; middle and right column; see Table S2). A–C, Microphotographs of
haematoxylin and eosin (H&E)-stained 10-lm tissue sections of the cervix uteri with rectangle labels of the ROIs. D–F, Images of complete
manual segmentation by the pathologist with six classes: red, squamous cell carcinoma; blue, cervical stroma; light blue, vessel wall;
yellow, inflammatory response; magenta, erythrocytes; black, holes and fissures. G–I, Infrared microspectroscopy images of the ROIs at the same
scale as the H&E images. For recognition of tumour areas (atypical tissue no. 2, see Table 3), difference image analysis yielded a sensitivity of
16.4% and a specificity of 95.1% for tumour number III, characterized by dissociative growth and strong peritumoral tissue infiltration of
inflammatory cells (G). The sensitivity and specificity of ROIs 6 and 9 of tumour VI were 38.8% and 99.5%, and 86.5% and 69.5%, respectively.
The clear difference in test accuracy for the same specimen is caused by different proportions of tumour and peritumoral and intratumoral
inflammatory responses.
30A
B
* *
*
*
*
*
*
*
20
10
0
–10
–20
–30
Exclusion of the transition area by stepwise reductionof the outer pixel margin of each cluster
Var
iatio
n of
sen
sitiv
ity w
ith r
espe
ct to
orig
inal
seg
men
tatio
n [%
poi
nts]
30
20
10
0
–10
Original resultof tissue typesegmentation
1 2 3 4 5
Exclusion of the transition area by stepwise pixelapposition at the edge of the tissue cluster
6[step#]
7 8 9 10 11 12 13 14 15
Var
iatio
n of
spe
cific
ity w
ith r
espe
ct to
orig
inal
seg
men
tatio
n [%
poi
nts]
Figure 7. Variations in the sensitivity (A) and specificity (B) statistic
for the infrared cluster combination synonym ‘atypical tissue no. 2’
induced by a layer-by-layer pixel reduction (A) respectively apposi-
tion (B) (15 steps) of the tissue areas dysplasia and carcinoma
(theoretical background is given in Figure 3). The analysis is based
on 22 regions of interest (ROIs) of all tumours (dots and asterisks are
outliers and extremes).
Infrared microspectroscopic histopathology 13
� 2012 Blackwell Publishing Ltd, Histopathology

if compared with the high variance resulting from thelocalization of separately calculated ROIs (Figure 5).Only a few analyses concerning such detailed morpho-logical assessment have been published so far. Aninteresting study, however, characterized by a smallnumber of spectra, examined samples of benign endo-metrial tissue and several subtypes of endometrialcarcinoma ⁄ sarcoma (endometrioid, serous papillaryand malignant mixed Mullerian tumours).13 The sep-aration between spectra derived from different subtypeswas good, and, additionally, depending on the presenceof antecedent tamoxifen usage, separation was dra-matically improved. Unfortunately, precise values ofthe sensitivity and specificity statistics were not given.
The subdifferentiation of tissue types revealed adistribution of three IR clusters in accordance withthe layer-related cell differentiation of squamous epi-thelium; these have already been demonstrated inprevious studies, and were mainly related to glycogenand nucleic acid bands.1,26,28 Our previous analysis hasshown that a still more detailed hierarchical classifica-tion of the IR data allows further segmentation of allmorphologically deducible cell layers.1 Furthermore, arecently published study that analysed uterine cervicalsamples of exfoliated cells by IR-MSP (referred to as‘spectral cytopathology’) actually detected cellularabnormalities in spectral characteristics of morpholog-ically normal-appearing cells.34 The observed discretebiochemical changes were interpreted as being probablycaused by infection with human papillomavirus. Thesame trends were observed in another study of oralmucosa cells, in which morphologically normal epithe-lial cheek cells infected with herpes simplex virus werecharacterized by cell changes that were only spectro-scopically detectable.35 Unfortunately, the quoted stud-ies are limited in their impact, because of the very lownumber of samples and the restrictive inclusion criteria.
With regard to oncological issues, recent studies havedemonstrated marked heterogeneity of tumour tissue,as well as the secreted mucus, that is undetectable byconventional histological staining.18,22 Our analysisconfirms the possibility of using IR-MSP to characterizespectral subtypes of tumour tissue (IR clusters 1–3), butthe interpretation of this finding is very complex. All ofthese studies make it obvious that IR-MSP has thepotential to track biochemical variations in cells andtissues that are not associated with visible morpholog-ical changes, and, therefore, the intended subdifferen-tiation of tissue types should be based not only onmorphologically detectable local preferences, but also onfurther molecular biological methods. In our opinion,the main issue in IR-MSP research is currently to findstable links between spectroscopic features and clearly
defined structural and functional cellular changes, toenable IR-MSP to be used in future clinical applications.
For the first time, the tumour segment outlinevariation experiment demonstrates a non-homogeneousdistribution of false negatives and false positives withinthe ROIs. The false assignment of IR data referring to thehistopathological reference is mainly located in transi-tion areas on tissue boundaries. A mixing of biochemicalinformation of cell components and of different tissuetypes in these areas remains a severe problem. Thisresult is in good accordance with previously publishedanalyses,3,8 leaving out those transition areas andfocusing only on inner segment regions exhibitingwell-defined tissue types, and thereby obtaining clearlyhigher accuracy values. Our variation experiment wellillustrates the effect of such a methodical difference,which was already considered as selection bias.21
In conclusion, the IR-MSP-ascertainable differences informalin-fixed paraffin-embedded tissue are too subtleand not specific enough for histopathological tissuediscrimination for the purpose of an automated diagnosisin the strict sense. Therefore, the values of recognitionaccuracy found are, at present, the major limitation ofthe current approach. The application of this imagingtechnique for medical diagnostics in order to understandmolecular differences associated with cell types and cellalterations is only possible in combination with concom-itant conventional histopathology using transmissionlight microscopy. However, we expect a greater potentialfor more specific issues, such as the discrimination offewer tissue types, the analysis of few substances in bio-analytical tools and biomolecular functional assays, orstudies regarding sequential variances over time.
Conflict of interest
The authors declare no conflict of interest.
References
1. Steller W, Einenkel J, Horn LC et al. Delimitation of squamous cell
cervical carcinoma using infrared microspectroscopic imaging.
Anal. Bioanal. Chem. 2006; 384; 145–154.
2. Bhargava R. Towards a practical Fourier transform infrared
chemical imaging protocol for cancer histopathology. Anal.
Bioanal. Chem. 2007; 389; 1155–1169.
3. Fernandez DC, Bhargava R, Hewitt SM, Levin IW. Infrared
spectroscopic imaging for histopathologic recognition. Nat.
Biotechnol. 2005; 23; 469–474.
4. Fabian H, Thi NAN, Eiden M, Lasch P, Schmitt J, Naumann D.
Diagnosing benign and malignant lesions in breast tissue
sections by using IR-microspectroscopy. Biochim. Biophys. Acta
2006; 1758; 874–882.
5. Chen YJ, Cheng YD, Liu HY, Lin PY, Wang CS. Observation of
biochemical imaging changes in human pancreatic cancer tissue
14 J Einenkel et al.
� 2012 Blackwell Publishing Ltd, Histopathology

using Fourier-transform infrared microspectroscopy. Chang. Gung
Med. J. 2006; 29; 518–527.
6. Wang TD, Triadafilopoulos G, Crawford JM et al. Detection of
endogenous biomolecules in Barrett’s esophagus by Fourier
transform infrared spectroscopy. Proc. Natl Acad. Sci. USA 2007;
104; 15864–15869.
7. Beljebbar A, Amharref N, Leveques A et al. Modeling
and quantifying biochemical changes in C6 tumor gliomas by
Fourier transform infrared imaging. Anal. Chem. 2008; 80;
8406–8415.
8. Baker MJ, Gazi E, Brown MD, Shanks JH, Gardner P, Clarke NW.
FTIR-based spectroscopic analysis in the identification of clini-
cally aggressive prostate cancer. Br. J. Cancer 2008; 99; 1859–
1866.
9. Isabelle M, Stone N, Barr H, Vipond M, Shepherd N, Rogers K.
Lymph node pathology using optical spectroscopy in cancer
diagnostics. Spectroscopy 2008; 22; 97–104.
10. Hammody Z, Argov S, Sahu RK, Cagnano E, Moreh R, Mordechai
S. Distinction of malignant melanoma and epidermis using IR
micro-spectroscopy and statistical methods. Analyst 2008; 133;
372–378.
11. Bird B, Romeo M, Laver N, Diem M. Spectral detection of micro-
metastases in lymph node histo-pathology. J. Biophotonics 2009;
2; 37–46.
12. Khanmohammadi M, Garmarudi AB, Ghasemi K, Jaliseh HK,
Kaviani A. Diagnosis of colon cancer by attenuated total
reflectance-Fourier transform infrared microspectroscopy and
soft independent modeling of class analogy. Med. Oncol. 2009;
26; 292–297.
13. Kelly JG, Singh MN, Stringfellow HF et al. Derivation of a
subtype-specific biochemical signature of endometrial carcinoma
using synchrotron-based Fourier-transform infrared microspec-
troscopy. Cancer Lett. 2009; 274; 208–217.
14. Lasch P, Haensch W, Naumann D, Diem M. Imaging of colorectal
adenocarcinoma using FT-IR microspectroscopy and cluster
analysis. Biochim. Biophys. Acta 2004; 1688; 176–186.
15. Bird B, Miljkovic M, Romeo MJ et al. Infrared micro-spectral
imaging: distinction of tissue types in axillary lymph node
histology. BMC Clin. Pathol. 2008; 8; 8–21.
16. Mordechai S, Sahu RK, Hammody Z et al. Possible common
biomarkers from FTIR microspectroscopy of cervical cancer and
melanoma. J. Microsc. 2004; 215; 86–91.
17. Petibois C, Deleris G. Chemical mapping of tumor progression by
FT-IR imaging: towards molecular histopathology. Trends Bio-
technol. 2006; 24; 455–462.
18. Travo A, Piot O, Wolthuis R et al. IR spectral imaging of secreted
mucus: a promising new tool for the histopathological recogni-
tion of human colonic adenocarcinomas. Histopathology 2010;
56; 921–931.
19. Baker R, Rogers KD, Shepherd N, Stone N. New relationships
between breast microcalcifications and cancer. Br. J. Cancer
2010; 103; 1034–1039.
20. Krishna CM, Sockalingum GD, Vadhiraja BM et al. Vibrational
spectroscopy studies of formalin-fixed cervix tissues. Biopolymers
2007; 85; 214–221.
21. Einenkel J, Steller W, Braumann UD, Horn LC, Krafft C.
Unrealistic expectations for IR microspectroscopic imaging. Nat.
Biotechnol. 2007; 25; 29–31.
22. Wolthuis R, Travo A, Nicolet C et al. IR spectral imaging for
histopathological characterization of xenografted human colon
carcinomas. Anal. Chem. 2008; 80; 8461–8469.
23. Wong PTT, Wong RK, Caputo TA, Godwin TA, Rigas B. Infrared
spectroscopy of exfoliated human cervical cells: evidence of
extensive structural changes during carcinogenesis. Proc. Natl
Acad. Sci. USA 1991; 88; 10988–10992.
24. Yazdi HM, Bertrand MA, Wong PT. Detecting structural changes
at the molecular level with Fourier transform infrared spectros-
copy. A potential tool for prescreening preinvasive lesions of the
cervix. Acta Cytol. 1996; 40; 664–668.
25. Walsh MJ, Singh MN, Stringfellow HF et al. FTIR microspectros-
copy coupled with two-class discrimination segregates markers
responsible for inter- and intra-category variance in exfoliative
cervical cytology. Biomark. Insights 2008; 3; 179–189.
26. Chiriboga L, Xie P, Yee H et al. Infrared spectroscopy of human
tissue. I. Differentiation and maturation of epithelial cells in the
human cervix. Biospectroscopy 1998; 4; 47–53.
27. Chiriboga L, Xie P, Yee H, Zarou D, Zakim D, Diem M. Infrared
spectroscopy of human tissue. IV. Detection of dysplastic and
neoplastic changes of human cervical tissue via infrared
microscopy. Cell. Mol. Biol. (Noisy-le-grand) 1998; 44; 219–
229.
28. Wood BR, Chiriboga L, Yee H, Quinn MA, McNaughton D, Diem
M. Fourier transform infrared (FTIR) spectral mapping of the
cervical transformation zone, and dysplastic squamous epithe-
lium. Gynecol. Oncol. 2004; 93; 59–68.
29. Hockel M, Horn LC, Manthey N et al. Resection of the embry-
ologically defined uterovaginal (Mullerian) compartment and
pelvic control in patients with cervical cancer: a prospective
analysis. Lancet Oncol. 2009; 10; 683–692.
30. Wells M, Ostor AG, Crum CP et al Epithelial tumours of the uterine
cervix. In Tavassoli FA, Devilee P eds. World Health Organization
classification of tumours. Pathology and genetics. Tumours of the breast
and female genital organs. Lyon: IARC, 2003; 259–279.
31. Faolain EO, Hunter MB, Byrne JM et al. Raman spectroscopic
evaluation of efficacy of current paraffin wax section dewaxing
agents. J. Histochem. Cytochem. 2005; 53; 121–129.
32. Pijanka J, Sockalingum GD, Kohler A et al. Synchrotron-based
FTIR spectra of stained single cells. Towards a clinical application
in pathology. Lab. Invest. 2010; 90; 797–807.
33. Wood BR, Quinn MA, Tait B et al. FTIR microspectroscopic study
of cell types and potential confounding variables in screening for
cervical malignancies. Biospectroscopy 1998; 4; 75–91.
34. Schubert JM, Bird B, Papamarkakis K et al. Spectral cytopathol-
ogy of cervical samples: detecting cellular abnormalities in
cytologically normal cells. Lab. Invest. 2010; 90; 1068–1077.
35. Papamarkakis K, Bird B, Schubert JM et al. Cytopathology by
optical methods: spectral cytopathology of the oral mucosa. Lab.
Invest. 2010; 90; 589–598.
Supporting Information
Additional Supporting Information may be found in theonline version of this article:
Table S1. Distribution of different tissue types withinthe samples of the uterine cervix defined by thepathologist.
Table S2. Number of image pixels, number of spectrapixels, and size of all regions of interest.
Please note: Wiley-Blackwell are not responsible forthe content or functionality of any supporting materi-als supplied by the authors. Any queries (other thanmissing material) should be directed to the correspond-ing author for the article.
Infrared microspectroscopic histopathology 15
� 2012 Blackwell Publishing Ltd, Histopathology