Suggested Short Title - digitool.library.mcgill.cadigitool.library.mcgill.ca/thesisfile45890.pdf ·...
221
__ .i: Suggested Short Title NUTRITIONAL ASPECTS OF DAIRY CATTLE INFERTILITY
Transcript of Suggested Short Title - digitool.library.mcgill.cadigitool.library.mcgill.ca/thesisfile45890.pdf ·...

__ .i:
Suggested Short Title
NUTRITIONAL ASPECTS OF DAIRY CATTLE INFERTILITY

M. Sc.
ABSTRACT
NUTRITIONAL ASPECTS OF DAIRY CATTLE INFERTILITY IN QUEBEC AND TRINIDAD
Hezekiah H. Nelson Animal Science Nutrition
Eleven dairy herds from Quebec, thirty herds from
Trinidad, plus a Trinidad Government Holstein herd and
Crossbred herd were surveyed to de termine factors, mainly
nutritional, affecting fertility. Mean services per
conception were 2.1, 2.2, 3.0 and 2.7; and mean calving
intervals were 399, 437, 488 and 435 days respectively. Two
herds (Quebec), three herds (Trinidad) and aIl Government-kept
heifers were the only herds meeting energy requirements,
One herd (Quebec), and another (Trinidad) were deficient in
phosphorous, and one herd (Quebec) was also deficient in
protein intake.
In herds with high milk production significant
correla tions (P < O. Dl) were observed between services per
conception and milk production and between calving interval
and milk production. In the Trinidad herds services per
conception declined from 2.5 to 1.8 and calving interval from
443 to 407 days from first to third lactation respectively.
Heat detection was a problem in many herds due to
inadequate observation and failure to observe some heat
signs. More time spent observing cows for heat would greatly
reduce breeding problems.

NUTRITIONAL ASPECTS OF DAIRY CATTLE INFERTILITY IN QUEBEC AND TRINIDAD
by
Hezekiah Horatio Nelson
A thesis submitted to the Faculty o~ Graduate Studies and Research in partial ~ul~ilment o~ the requirements for the
degree o~ Master of Science
Department of Animal Science, Macdonald College of McGill
University, Montreal, Quebec
® Hezekiah Horatio Nelson
August 1972
1973
~t • r

RESUME
M. Sc. Hezekiah H. Nelson Animal Science Nutrition
Onze troupeaux laitiers du Québec, trente de Trinidad, plus les vache Holstein gardées sur les fermes du Gouvernement de Trinidad et un troupeau croisé du même Gouvernement ont été examinés afin de déterminer les facteurs (surtout nutritionels) affectant la fertilité. Le nombre des services par conception a été en moyenne de 2.1, 2.2, 3.0 et 2.7 et les intervalles entre chaque vêlage ont été de 399, 437, 488 et 435 jours respectivement. Seulement cinq troupeaux dont deux au Québec et trois à Trinidad, ainsi que toutes les génisses gardées par le Gouvernement de Trinidad rencontraient les exigences en energie. Un troupeau au Québec et un à Trinidad étaient déficient en phosphore et un troupeau au Québec était déficient pour l'ingestion de protéine.
Dans les troupeaux où la production laitiére était élevée, des liaisons simples significatives (P<:O.Ol) ont été observées entre le nombre de services par conception et la production de lait et entre l'intervalle entre chaque vêlage et la production du lait. Dans les troupeaux de Trinidad le nombre de services par conce~tion a passé de 2.5 à 1.8 et l'intervalle entre chaque velage de q.43 à 407 jours de la première à la troixième lactation.
La détection des chaleurs était un problème dans plusieurs troupeaux à cause d'une surveillance inadequate et de la difficulté à reconnaître certains signes de chaleur. Une augmentation de la période d'observation des vaches dans le but de détecter les chaleurs aurait grandement réduit les problèmes de fer~ilité •
. ;,

-'!' ....
ACKNOWLEDGElVIENTS
l wish to express my sincere appreciation and thanks
to Dr. E. Donefer, Animal Science Department, for his
guidance and advice in the research conducted, and in
preparing this thesis.
l should also like to express my thanks to Dr. J.
Moxley for assisting in the statistical analysis of the data.
l should also like to thank the followingl The Canadian
International Development Agency for the scholarship which
enabled me to undertake this study; the Trinidad and Tobago
Gov~rnment for the facilities and personnel placed at my
disposaI in carrying out the survey in Trinidad; Mr. E. Unsworth
for the use of the facilities at the University of. the West
Indies, Trinidad; the farmers,both in Quebec and Trinidad
for allowing their herds to be used in this study; my
fellow graduate students for the very valuable discussions
and help rendered at Macdonald College and aIl those who in
someway assisted me in this research. Finally l wish to
express thanks to my wife,Gwendolyn, for her patience and
encouragement.

TABLE OF CONTENIJ:S
1. INTRODUCTION ••••••••••••••••••••••••••••
II. REVIEW OF THE LITERATURE • • el. • • • • • • • • • •
A. Incidence of Nutritional Infertility
B. Specifie Supply of Nutrients ••••••••
1. Plane of Nutrition ••••••••••••••
2. Protein •••••••••••••••••••••••••
a. General •••••••••••••••••••••
b. Protein-effect on fertility •
3. MineraIs
a. General • • • • • • • • • • • • • • • • • • • • • b. Calcium • • • • • • • • • • • • • • • • • • • • • c. Phosphorous •••••••••••••••••
i. General • • • • • • • • • • • • • • • • • ii. Phosphorous effect on
fertility •••••••••••••••
d. Calcium to Phosphorous Ratio
i. General •••••••••••••••••
ii. The role of CaaP ratio ••
e. Manganese •••••••••••••••••••
f. Other MineraIs ••••••••••••••
4. Vitamins ••••••••••••••••••••••••
a. General • • • • • • • • • • • • • • • • • • • • •
b. Vitamin A • • • • • • • • • • • • • • • • • • •
v
Page
1
4
4
6
6
13
13
14
17
17
18
21
21
22
28
28
28
34
39
41
41
42

C.
D.
Table of Contents (cont'd)
c. Vitamin D •••••••••••••••••••••
Effects of Feedstuffs • • • • • • • • • • • • • • • • • Causes of Nutritional Infertility •••••
Page
45
46
48
a. Lactational Stresses •••••••••• 48
b. Body Weight Change •••••••••••• 50
c. Blood Analysis Criteria ••••••• 52
III. OBJECT OF RESEARCH •••••••••••••••••••••••• 55
IV. DATA SOURCE AND METHODS ••••••••••••••••••• 56
A. Quebec Province ••••••••••••••••••••••• 56
1 • General. • • • • • • • • • • • • • • • • • • • • • • • • • • 56
2. Sampling Procedure •••••••••••••••• 56
a. Hay Samples ••••••••••••••••••• 56
b. Corn and Grass Silage ••••••••• 57
c. Grains or Concentrates......... 57
3. Blood Collection and Microhematocrit determination ••••••••••••••••••••• 57
B. Trinidad. • • • • • • • • • • • • • • • • • • • • • • • • • • • • • 58
1. Location and Climate •••••••••••••• 58
2. Sampling Procedure •••••••••••••••• 60
a. Pasture grasses ••••••••••••••• 60
b. Concentrates................... 61
3. Blood Collection and Microhematocrit determination ••••••••••••••••••••• 62
vi
l

Table of Contents (cont'd)
C. Feeding and Management •••••••••••••••
1. Quebec •••••••••••••••••••••••••••
2. Trinidad •••••••••••••••••••••••••
D. Ana1ytica1 Methods • • • • • • • • • • • • • • • • • • • 1. Preparation of Samp1es •••••••••••
2. Chemica1 Analyses ••••••••••••••••
a. Foragesand Concentrates •••••••
b. B100d Ana1ysis •••••••••••••••
3. Procedure to evaluate the energy content ofa •••••••••••••••••••••
a. Forages ••••••••••••••••••••••
b. Concentrates •••••••••••••••••
4. Other Data •••••••••••••••••••••••
E. Statistical Analysis of Data •••••••••
V. RESULTS AND DISCUSSION •••••••••••••••••••
1. Incidence of Infertility in Trinidad •••••••••••••••••••••••••
a. Services per Conception ••••••
.b. Ca1ving Interval •••••••••••••
c. Mi1k Production ••••••••••••••
2. Blood Components •••••••••••••••••
a. Serum Calcium ••••••••••••••••
b. Serum inorganic phosphorous ••
c. CaaP Ratio •••••••••••••••••••
vii
Page
62
62
63
64
64
64
64
65
65
65
67
70
70
72
72
72
79
82
83
83
88
91

4.
5.
Table of Contents (cont'd)
d. Hematocrit (Packed Cell Volume)
Feed Intake •••••••••••••••••••••••••
a. Chemical Composition ••••••••••••
b. Energy ••••••••••••••••••••••••••
c.
d.
Protein
Calcium
• • • • • • • • • • • • • • • • • • • • • • • • •
• ••••••••••••••••••••••••
e. Phosphorous •••••••••••••••••••••
f. CalciumaPhosphorous Ratio •••• ~ ••
Simple Correlations between services per conception and calving intervals with various parameters ••••••••••••• a. Age ••••••••••••••••••••••••.••••
b. Body Weight •••••••••••••••••••••
c. Milk Production •••••••••••••••••
d. Lactation Sequence (Number) •••••
e. Blood Components ••••••••••••••••
i. Serum Calcium •••••••••••••••
ii. Phosphorous •••••••••••••••••
iii. Hematocrit ••••••••••••••••••
f. Feed Intake •••••••••••••••••••••
Summary of Simple Correlations between services per conception and calving intervals with other parameters •••••
a. Quebec Herds ••• ~ ••••••••••••••••
b. Trinidad Herds ••••••••••••••••••
viii
Page
91
93
93
96
111
113
116
119
122
122
122
137
139
139
139
140
141
141
143
143
145

! .
Table of Contents (cont'd)
Page
c. Government Herd (Trinidad) ••• 146
i. Purebred Holstein •••••••• 146
ii. Crossbred Holstein/Zebu •• 146
6. A Comparison of Means of different Parameters between Quebec and AlI Trinidad Herds ••••••••••••••••••• 148
a. Body Weight •••••••••••••••••• 148
b. Mi1k Production •••••••••••••• 148
c. B100d Components ••••••••••••• ISO
d." Feed Intake •••••••••••••••••• 151
e. Lactation Sequence (Number) •• 151
f. Index of Ferti1ity • • • • • • • • • • • 15J
i. Services per Conception •• 15J
ii. Ca1ving Interva1 • •••••••• 7. Evaluation of effects of production
parameters on ferti1ity index.
154
Herd effects removed ••••••••••••• 156
8. Re1ationship between frequency of ca1vings and rainfa11, temperature and season of the year. (Trinidad) •••••••••••••••• 165
VI. SUMMARY AND CONCLUSIONS •••••••••••••••••• 169
LITERA TURE ClTED •••••••••••••••••••••••••••••• 175
APPENDIX TABLES ............ " ................. . 197
ix

LIS T OF TABLES
Table Page
1. Average Temperature in Trinidad • ••••••••••••• 59
2. Dairy Ration Composition ••••••••••••••••••••• 61
3. Estimated TDN and ENE content of Manufactured Dairy Feeds •••••••••••••••••••••••••••••••••• 68
4. The incidence of inferti1ity of catt1e in Trinidad ••••••••••••••••••••••••••••••••••••• 73
5. Mean Production and Reproduction Parameters for Cows (Quebec Herds) •••••••••••••••••••••• 75
6. Mean Production and Reproduction Parameters for Cows (Trinidad Herds) •••••••••••••••••••• 76
7. Mean Production and Reproduction Parameters for Cows (Government Herds Centeno, Trinidad) 78
8. Mean Concentration of B100d Components in Cows (Quebec Herds) •••••••••••••••••••••••••• 84
9. Mean Concentration of Blood Components in
10.
Il.
Cows (Trinidad Herds) •••••••••••••••••••••••• 85
Mean Concentration of B100d Components in Cows (Government Herds Centeno, Trinidad)
Mean Body Weight, Dai1y Production and Estimated Dai1y Feed Intake (Quebec Herds)
• • • •
• • •
87
97
12. Mean Body Weight, Dai1y Production and Estimated Dai1y Feed Intake (Trinidad Herds) 98
13. Mean Body Weight, Dai1y Production .and Estimated Dai1y Feed Intake (Government Herds Centeno, Trinidad) ••••••••••••••••••••••••••• 100
14. Summary of Requirements and Differences in Feed Intake (Quebec Herds) •••••••••••••••••••••••• 101
·x

List of Tables (Cont'd)
Table Page
15. Summary of Requirements and Differences in Feed Intake (Trinidad Herds) ••••••••••••• 102
16. Summary of Requirements and Differences in Feed Intake (Government Herds) Trinidad 104
17. Simple Correlations of Services per Conception and Calving Intervals with other Parameters (Quebec Herds) ••••••••••••••••••• 12;
18. Simple Correlations of Services per Conception and Calving Intervals with other Parameters (Trinidad Herds) ••••••••••••••••• 127
19. Summary of simple Correlations of Services per Conception and Calving Intervals with other Parameters (Quebec Herds merged, Trinidad Herds merged and the Government Herds, Centeno, Trinidad) ••••••••••••••••••• 144
20. A comparison of Means of different Parameters between Quebec and Trinidad Herds ••••••••••• 149
21. Means of Services per Conception and Calving Interval according to Lactation Sequence (Quebec Herds) •••••••••••••••••••••••••••••• 157
22. Means of Services per Conception and Calving Interval according to Lactation Sequence (Trinidad Herds) •••••••••••••••••••••••••••• 157
2;. Least Squares Estimates of the effects of lactation sequence on services per conception and calving interval (Quebec Herds) ••••••••• 159
xi

~ .... , List of Tables (Cont'd)
Table Page
24. Least Squares Estimates of the effects of lactation sequence on services per conception and calving interval (Trinidad Herds) ••••••••• 159
25. Least Squares Estimates of the affects of services per conception on various productive parameters (Quebec Herds) ••••••••••••••••••••• 162
26. Least Squares Estirnates of the effects of services per conception on various productive pararneters (Trinidad Herds) ••••••••••••••••••• 163
27. Least Squares Estirnates of the effects of services per conception on various productive parameters (Trinidad Government Herds) •••••••• 164
xii

j ... . r LIS T Olt~ FIGURES
Figure Page
1. Relationship between Cellulose Content (%) and TDN •••••••••••••••••••••••••••••••••• 69
2. Relationship between ENE (NVI) and age of pangola grass •••••••••••••••••••••••••••• 109
3. Relationship between ENE (NVI) and age of Napier grass •••••••••••••••••••••••••••• 110
4. Relationship between frequency of calvings and rainfall, temperature and season of the year ••••••••••••••••••••••••••••••••• 166
xiii

.INTRODUCTION
Whenever the world food problem is discussed
emphasis usually falls on theshortage of protein in those
countries referred to as developing. These countries lie
within the tropical and subtropical regions. Probably the
most difficult aspect of this food problem is to provide
supplies of protein adequate to assure good health.
Provision of adequate quantities of animal products is one
good way to help improve world protein nutrition.
Since we ourselves are animaIs, the proportions of
essential amino acids in the proteins of other animaIs come
much closer to meeting our needs than those in most plants.
Up to a few decades ago Animal Husbandmen had
accepted the dictum that development of organised dairying
under tropical and subtropical conditions was very nigh
impossible. However, with the possible exception of a few
limitations (particularly areas infested with the tse-tse
fly) such an undertaking is no longer considered to be
impossible or impractical.
During recent years many projects (for example in
India and Kenya) have been developed with United Nations
and bilateral aid,which have shown that production,
proçessing and handling of milk under unfavourable climatic
conditions are not only possible technically, but that such
developments have a considerable impact on the nutritional
_ .. f
2
and socio-economic conditions, and the general standard of
living of the population in the areas concerned.
In Trinidad the steady decline of the traditional
export crops such as sugar, cocoa, coffee, citrus and a
subsequent decline in the contribution of Agriculture to
the Gross Domestic Product (17% in 1953 to 10% in 1965)
caused a shift to a more diversified form of Agriculture.
The apparent success of tropical Puerto Rico in creating a
dairy industry with exotic cattle, gave an added impetus ,
for diversification along these lines so that Trinidad
embarked on importing Holstein cattle from various countries -
mainly Canada. The setting up of a dairy industry was
considered important since in 1964 Trinidad imported about
$30 million T.T. (about $15 million Canadian) worth of goods
comprising milk and milk products and Meat and Meat products.
Hence the development of a local dairy industry, and as a
consequence, the availability of Meat as a by-product
offerred one possible alternative to offset balance of pay-
ment problems.
Infertility is one of the largest economic losses
experienced in dairy herds. Losses are caused by retained
placenta, metritis, anestrus, silent estrus, cystic follicles,
repeat breeding and abortions. In Many instances, feeding
and other management practices, l such as inadequate observa
tion of cattle, can predispose to, and accentuate infertility
problems.

J
Since the nutritional status of the individual animal
and of populations has a profound effect, both direct and
indirect, on their reproductive processes, studies on the
effects of nutrition on reproduction are of great importance.
Many of the cows in the world experience periods of under
nutrition, especially before puberty and during lactation.
As animal husbandry practices improve, it would be expected
that problems associated with improper nutrition will decline.
However, it is quite clear that in both the advanced and
developing countries feeding and management practices give
rise to a situation where maximum reproductive performance
is essential, primarily from an economic point of view.
Inadequate nutrition can involve a shortage of food,
an excess intake of a balanced diet leading to obesity, or
alternatively, it can involve an excess or a lack of a
particular nutrient which might normally be required in
macro - or micro - quantities. AlI these situations can
leadto sUb-optimal reproductive performance.
As far as the main nutrients are concerned, it is
generally accepted that adequacy of these for health,
prOduction and growth in the young should provide sufficient
levels for fertility (Laing,1955).
The purpose of the study reported herein was to
relate, or identify if possible, the infertility of the dairy
cattle on the farms visited with their nutritional status,
and suggest possible areas of solution with specific emphasis
to the Trinidad situation.

ij ,
4
II. REVIEW OF THE LITERATURE
A. INCIDENCE OF NUTRITIONAL INFERTILITY
Few attempts to determine the occurrence and incidence
of nutritional infertility have been reported. Warnick
(1959) found that fertility rates were higher in non-1acta
ting than in lactating cows, and that cows grazing pastures
of higher nutritive value (clover-grass) had higher ferti
lit Y rates than those grazing grass pastures. The increase
in fertility as measured by calving percentage, was larger
in lactating (32%) than non-lactating (19%) cows on the
clover-grass pastures; and the interva1 from parturition
to first heat was reduced from 90 days to 72 days.
Donaldson g1 âl. (1967) found that, in six beef cattle
herds in Northern Queensland, Australia, the overall preg
nancy rates ranged from 50% to 75%. The Mean pregnancy
rates were 36.4% in lactating and 77.5% in non-lactating
cows, and 79.8% in "fat", 65.9% in "forward store" and 39.9%
in "store" or poor body conditioned cows.
Donaldson (1968) also reported low productivity of
cows in a large herd and that only 57% of the cows calved in
two or more successive years, while 32% calved strictly in
alternate years. Cows calving tirst as two year-01ds
produced more calves than cows ca1ving tirst as three year
olds or older, despite the severe nutritional and lacta-

5
tional strain placed on the cows calving at the younger age.
Lamond (1969a)reported that reproductive performance
in 13 herds of beef cattle in North-Eastern Australia,
showed that lactating heifers had lower pregnancy rates than
lactating cows, which in turn had lower rates than non
lactating animaIs. He also observed that within classes,
cows in poor body condition had lower fertility than those
in "forward-store" or fat condition. His main conclusion
was that improved nutrition of lactating heifers and cows
would be expected to increase pregnancy rates substantially.
AlI these reports have been on beef herds and generally
refer to observations on selected herds.
However, in a disease wastage survey of dairy herds
in the Moss Vale district of New South Wales, Mc Clure and
Dowell (1968, 1969) reported evidence of reproductive
inefficiency not caused by infectious disease or male infer
tility. This infertility was characterised by low first
service non return ("conception") rates, delay in, but
eventual establishment of pregnancy, and extended calving
intervals. The negative correlation between rainfall, and
the positive correlation between supplementary feeding and
high fertility suggested thatthere was sorne nutritional
component to this infertility and pasture-grazed cattle.
Reed (1961), quoted by Melrose and Brown (1962), in
a survey of one hundred national milk recorded herds, found
a close association between fertility and the acreage of

6
Kale (Brassica oleracea) grown. Winter fertility of cows was
lowered in herds where the percentage of Ka1e grown exceeded
9% of total farm acreage.
Thain (1967) in Tasmania, reported that a temporary
infertility was common despite the absence of vibriosis or
other recognizable infections. In a suryey . 29 of 49 dairy
herds (59%) grazed on subterranean and/or red clover-dominant
pastures had infertility problems compared with 10 of 62
herds (16%) fed pastures containing 1ittle or no clover.
B. SPECIFIC SUPPLY OF NUTRIENiS
1. Plane of Nutrition
Malnutrition, or an intake of an inadequate or faulty
diet, may cause reproductive failure. However, there is the
question whether the infertility May be due to specifie nutrient
deficiencies or whether it May be due to reduced calorie intake
which usually occurs in ma1nourished animaIs.
Many reports dealing with the influence of plane of
nutrition or intake of energy, both before and after partu
rition, on reproductive performance indicate that feeding
from weaning on low levels delays or prevents the onset of
puberty, and that the subsequent addition of extra energy
rations causes heifers to come into estrus and conceive when
mated. Reid et al. (196~) found that feeding at the rate of
62% of Morrison's feeding standards, delayed the onset of
puberty to 88 weeks of age compared with 49 weekds for the
heifers fed at the 100% level. Similarly, Short and Be1lows
(1971) indicated that by increasing the winter feed level in
heifers, increased the weight at puberty with a corresponq-
j

î Or ° o~ -
7
ing decrease in age. Fewer animaIs on the low and medium
plane of nutrition came into estrus during the breeding
season, and the reproductive potential was lowest in heifers
on the low plane. These heifers tended to conceive 1ater
and also had a higher pregnancy loss.
Van Demark and Mauger (1964), Van Demark et ~.
(1964), and Mann et!!. (1967) showed that puberty in bulls
was similarly de1ayed by this treatment. Van Demark et al.
(1964) found that underfeeding of bulls for an extended
period during growth was detrimenta1 not only to growth and
development but also to sperm producing capacity. Further
more increasing the plane of nutrition to 100% when the bull
was 46 months of age, appeared to have little effect on
fertility, as apparently the endocrine and reproductive
tract by that age, are re1atively unresponsive to increased
nutrient intake and therefore very little recovery from
underfeeding. At the same time reducing the energy intake
a t 46 months of age had li ttle effect in reducing the seme,n
producing potentials of a bull maintained at normal energy
recommendations up to 46 months.
A lowered plane of nutrition seemed to impair ovarian
function (Hart and Guilbert, 1928), However, Sorenson et al.
(1959) reported that on dairy females there was little
evidence that ovarian function was adversely affected by
either under or overnutrition once puberty was reached.
Joubert (1954) found that heifers on a low plane of nutrition
1

experienced an anestrous period during the winter lasting
up to 218 days and those heifers started recycling only
after adequate pasture became available and they recovered
their lost weight.
8
A low plane of nutrition during la te pregnancy seems
to delay the onset of the estrous cycles after parturition
and also depress first service pregnancy rates (Wiltbank
et al.,1962, 196~J Turman ~ al., 1964, Hight,1968).
Wiltbank et al. (1962) fed Hereford cows at two levels
of energy prior to calving and then after calving half the
cows on each level were switched tothe other level. The
amounts fed after calving contained an allowance for milk
production. The proportion of cows diagnosed pregnant was
95%, 77%, 95% and 20% for the cows fed the high-high, high
low, low-high, low-low energy levels respectively. The
differences among these groups were due largely to a high
proportion of cows on the low energy level after calving
failing to show estrus.
Reynolds et ll- (1964) depressed fertili ty by fe"eding
Aberdeen Angus heifers on a 10w plane which limited their
weight gain to 60 pounds over a 12 month periode The work of
Turman et âl. (196~) suggested that the nutritive level of
he if ers during their first pregnancy has a carry-over effect
on reproductive performance at their second mating. This
could possibly account for the lower pregnancy rates in
first calf heifers observed by Young (1965).

9
High planes o~ nutrition after calving seem to over
come the infertility effect caused by 10w planes in la te
pregnancy. Wiltbank ~ âl. (1964) observed that follicular
deve10pment was more obvious when the TDN intake was high
than when it was low; fertilization was more satisfactory
also. Cows which lost weight had the poorest results. There
was a relationship between the percentage of cows diagnosed
pregnant after the breeding period and the level o~ TDN fed
throughout the period after parturition.
Dunn et al. (1969) carried out detailed observations
on body weights and reproductive phenomena in hei~ers fed
known rations before and after parturition. Occurrence of
estrus during the first two months after calving was
greatest in the heifers fed a high-energy ration be~ore
calving. A low energy diet post-partum caused infertility
due to lengthening of the post-partum anestrus, and failure
to conceive even though the estrous cycles were of normal
length. Dunn et âl. also observed di~ferences in occurrence
of estrus between Aberdeen-Angus and Herefords fed low
energy level diets after parturition. However, Gardner
(1969) found that in Holstein cows neither level of pro
duction nor level of energy intake be~ore or after calving,
or both, had a significant effect on ~ertility.
Blakely (1965) quoted by Mc Clure (1970), wintered
three groups each of 16 Hereford heifers on three planes of
energy intake supplying 12.65 pounds, 9.66 pounds, and 4.24
l

10
pounds TDN respectively. The three diets contained "adequate
protein." AlI heifers were showing estrus before the trial
commenced but, after joining near the end of the trial, 15
of the 16 and 14 of the 15, respectively, of high and medium
plane heifers mated were pregnant, and only one of the two
that were mated in the group receiving 4.24 pounds TDN was
pregnant. One of the 16, and 14 of the 16 heifers,
respectively, in the medium and low-plane groups failed to
show signs of estrus at the time of breeding.
Rakha and Igboeli (1971) maintained 40 ranch cows of
Central African origin under two planes of nutrition for a
full calendar year. By the end of the experimental period
55% of the animaIs on the low plane had stopped cycling.
The incidence of silent ovulation in the low plane group
was significantly higher than in the group on the normal
plane of nutrition and there appeared no seasonal effects on
either length of the estrous cycle or estrous period of the
latter group.
Mc Taggart (1961) reported the effect on fertility
of over-estimating the carbohydrate available to milking
cows at pastùre. In a problem herd of 35 cows, Il were
infertile and most of these were giving 4 gallons per day
although it was shown that the pasture, not suppl emented,
contained starch equivalent for only 2 gallons. Abortions,
returns to service and prolonged heat intervals were
characteristic; though lower yielders merely tended not to

i ~-
11
exhibit heat. Similarly, Mc Clure (1961, 1965) and Mc Clure
and Dowell (1969) observed infertility syndromes in pasture
fed dairy cows characterized by first-service pregnancy
rates of about 30%; and an improvement in fertility when
the pastures were supplemented with concentrates and hay.
Prior to these results, Le Roux (1960) in Natal, observed
the same phenomena, directly linked with depressed fertility,
which resolved when either a maize Meal or coarse hay
supplement was fed.
The co-occurrence of low solids-not-fat in milk with
infertility has been noted, and attributed to insufficient
carbohydrate intake. Gould (1966) quoted by Dawson (1967),
has encountered one such case showing low solids-not-fat
with infertility in late winter; these are corrected on
turning out to grass, yields increase, indicating that the
pasture provided a more adequate concentration of nutrients
than what was previously fed.
Po or quality of forage and reduced intake of nutrients
due to the climate lead to infertility in tropical and sub
tropical areas (Mahadevan, 1966). Anestrus is the MOSt
common symptom, but too Many cows require more than one
service for pregnancy. Late maturity (cows often not calving
for the first time until they are 4 years old), and prolonged
calving intervals are quite common in tropical (Bos indicus)
breeds of cattle. However, there is no clear indication
whether infertility in tropical breeds is due entirely to
- .. '

t. poor nutrition or is associated with selection for such
characteristics as dual-purpose Meat and milk, draft or
survival.
12
According to Swanson (1967) there is a rate of
growth for each breed of dairy heifer, which is optimal for
conception at about 15 months of age. If dairy heifers are
grown faster than the optimum the maintenance requirement
becomes too costly when the animal is young. Also rapidly
grown heifers tend to have inferior productive performance
compared with heifers grown at a moderate or slow rate
(Reid et al. 196~).
Similarly Hentges ~ al. (1964) fad bulls concentrates
ad libitum for Il months from Il months of age and caused
obesity and loss of libido, particularly during hot weather,
but ch~nges in semen quality were negligible.
Morrow et al. (1969) reported that feeding high
producing dairy cows a liberal ration of concentra tes
resulted in development of a high incidence of cystic folli
cles, pro1onged calving intervals and more services per
conception than the controls. However, results from work
by Armstrong et~. (1966) and Gardner (1969) indicated
that neither level of production nor level of- energy intake
before or after calving, or both, had a significant effect
on ferti1ity.
On a physio1ogical basis Leathem (1966) pointed out
that undernutrition reduces secretion of gonadotrophin from

1)
the pituitary gland in Most species. Subsequently, Lamond
(1968, 1970a) showed that the plane of nutrition influenced
the ovarian response to gonadotrophine Also he observed
that fasts for 72 hours during the period after injection
of pregnant mare serum gonadotrophin (PMS) reduced folli
cular development.
Short-term effects of a sub-maintenance ration
studied by Hill et al. (1970) showed changes in ovarian
morphology, length of the estrous cycle and plasma progeste
rone level, and poor fertilization of ova. Later studies
suggested that considerable variability in the short-term
effects of undernutrition on reproductive phenomena was
associated with the variation in nutritional status of the
animaIs at the beginning of the experiment (Lamond,1970b).
2. Proteins
a. General
Proteins are fundamental to life for they govern and
take part in aIl phases of the activities of the living
cell; they serve as structural elements in soft tissues and
play a part in the metabolism of skeletal tissues.
Proteins are made up of some twenty different amino
acids and those which cannot be synthesized in the non
ruminant or calf in its pre-ruminant stage, or at a rate
adequate to meet the needs for growth and reproduction are
termed essential and must be supplied in the diet.
In the case of the ruminant, microbial synthesis can

\ ..
r .-
f
14
partially overcome the need for preformed protein or
essential amino acids to be supplied in the ration, for
the bacteria and protozoa can synthesize protein from non
protein non-amino acid sources such as urea and ammonium
salts and in amounts sufficient to sustain milk production.
Jakobson (1957) as reported by Dawson (1967), calcu
lated the protein requirement of the developing fetus as
rising from 38 to 225 gm daily (expressed as digestible
pure protein) between the sixth and ninth month. In
contrasting the amino acid content in maternaI blood, and
in deposited fetal protein, with that in the usual protein
concentrates fed to cattle, he concluded that the lysine
and methionine requirements tended not to be met from the
forage unless the quality synthesized in the rumèn should
prove adequate.
b. Protein effect on fertility
It does seem as though sorne infertility encountered
is due to insufficient protein or to the po or biological
value of that supplied. Janzen (1957) found a casein
preparation to be far more effective than either cod liver
oil or a mineraI salt supplement in curing infertility
problems of nutritional origin in the Hanover neighbour
hood.
DawsBn (1967) stated that reports by Richter (1957-
58) indicated that an addition of methionine to the ration
would cure obstinate cases of the liver dysfunction which

.... -"'
lS
has been associated by several workers,with cystic ovarian
disease, and hence the infertility observed in these animaIs
had also been resolved.
In a comparison of Brahman cattle and Herefords in
the Florida environment Howes ~ al. (196) showed that diets
in which crude protein was SO% below normal (total intake of
TDN also sUb-optimum), delayed puberty and jeopardised sub
sequent reproductive performance. It was considered that
the higher milk production of lactating Brahman cows necessi
tated a higher level of food intake to maintain adequate
reproductive function, and when the food was not readily
available the Brahman cows had longer periods from partu
rition to conception than the British cattle.
Bedrak ~~. (1964) also found that low intakes of
0.28 and 0.08 pound crude protein per day for 6i months
delayed or inhibited puberty in heifers initially weighing
SOO pounds.
Similarly Wiltbank et/al. (196S) fed heifers from
400 pounds body weight, until 180 days after first calving
or until 90 da ys pregnant with their second calves, on
three levels of energy, ad libitum, 66% ~ libitum, and
sufficient to maintain body weight, and on three levels of
protein 0.2), O.lS, 0.06 pound per 100 pound body weight
per day respectively. Most heifers on low energy and Many
on low protein intakes did not reach puberty. Those on high
and low protein diets were able to maintain only low intakes

16
and therefore it was not clear as to whether the effect was
due to low protein or low energy intakes.
Warnick et ~. (1965) raised heifers of various
breed types on two different.types of pasture and with two
levels of protein supplementation in the winter. At two
years old the heifers were aIl put on good quality pasture.
It was found that levels of protein supplementation did
not influence reproduction la ter on, (calving rate of 89%
vs 88% with low protein) but those on clover-grass had 96%
calving rate vs grass pasture of 81%. Also heifers on the
clover-grass pasture grew better and continued to produce
better throughout the next few seasons than did those on
grass alone. Of interest is the fact that grass plus
protein supplementation did not give as good results as
grass-clover, and raises the question of the importance of
legume-grass swards for cattle production.
Similar work by Cunha et al. (1966) indicated that
a deficiency of protein in the ration of beef cattle retarded
growth and development of young animaIs, reduced fertility
of the breeding herd and reduced the appetite and gains of
fattening cattle.
Experimental evidence such as those mentioned above,
are not so common with dairy cattle. Perhaps this is due
to the fact that dairy heifers, and most particularly
dairy cows, are seldom required to obtain their sole sourcè
of dietary protein from grazing, whereas many beef cattle

17
are range managed. Another point is that in Many instances
the direct effects ·of protein deficiency on reproduction in
cattle have been difficult to de termine because of other
dietary deficiencies.
However, Girou and Brochart (1970), in a population
of 1300 cows, observed a trend of decreasing fertility when
the protein supply was excessive, and the phenomena being
confirmed when analyzing the observations made in an experi
mental herd of 49 cows during three consecutive years. In
this he rd the energy supply was adapted to the requirements
each week, and the protein supply being qualitativèly and
quantitatively variable. They found that the threshold of
excess of digestible nitrogenous matters compatible with
normal fertility, to be between 200 and 300 gm per day
(p (,..01) .
3. MineraIs
a. General
The study of animal mineraI nutrition is very complex,
and although it is convenient to discuss each element
individually, many function in the body in pairs or groups.
Some mineraIs occur as structural components, and a number
act as enzyme activators. In some instances sorne elements,
example,calcium and molybdenum, may interfere with the
absorption and activity of other elements. This inter
action of mineraIs with each other is an important factor
:-::1--

in animal nutrition, and an imbalance of mineraI elements
as distinct from a simple deficiency, is important in the
determination of certain nutritional disorders of farm
18
animaIs. Supplementation of any diet with mineraIs should
always be carried out with care.
b. Calcium
Calcium is the most abundant mineraI element in the
animal body and is in the greatest demand during the growth
periode For Many years calcium has been recognised as a
critical nutrient in the ration of dairy cattle, but adequate
data on requirements have not been available for aIl phases
of growth and reprOduction. Moreover calcium and phosphorous
have a chemical affinity for each other, and therefore
suitable calcium to phosphorous ratios in the ration as a
whole have been found to be of importance.
Asdell (1955) reported that there was no evidence
that a deficiency of calcium in the feed caused reprOductive
troubles, but there was a good deal of circumstantial
evidence linking the importance of calcium-phosphorous with
reproduction. Generally it has been assumed that many cows
consume enough calcium from forage crops, particularly
those fed on legumes, since forages are comparatively high
in calcium.
Fitch et al. (1932) reported that both milk production
and reproduction were essentially the same on three rations
that contained 0.64, 0.32 and 0.18 per cent of calcium

19
respectively, on a dry matter basis. They la ter reported
(1935) that when the cows that had received calcium at the
0.18 per cent level for several years were fed a 0.12 per
cent calcium level, there was no adverse effect on repro
duction or on the production: of milk and fat.
Since it has been regarded that cows consume enough
calcium from forages most research work has been confined
rather to calcium to phosphorous ratios and effects of
phosphorous intake upon reproduction.
Ward et al. (1971) compared the effects of two
calcium intakes, averaging 100 and 200 gm, fed in rations
contributing 80 to 100 gm of phosphorous daily, on repro
ductive performance of 37 two to six year old Holstein cows
through 58 reproductive cycles. The experimental group of
animaIs received 300,000 l.U. of vitamin D3 weekly whereas
the controls did note They found that uterine involution
was completed eight days sooner (P<.05) in both rations
fortified with vitamin D3 but that first ovulation occurred
six days earlier (P~.05) in cows fed 200 gm calcium than
those fed 100 gm and this influence was not due to supple
mental vitamin D. The first recognizable post partum estrus
occurred 16 days earlier (p (.06) and conception occurred 37
days earlier (P < .025) in the vi tamin D supplemented than in
the unsupplemented cows. However there was no significant
differences in services per conception among the treatments.
lt would appear that apart from lowered bull
j

20
fertility which can result from ove rwork, mineral intakes
which can lead to impaired breeding performance in females
can also have an adverse effect on the fertilizing capacity
of bull semene
Hignett (1959) reported that at a cattle breeding
centre two 'bulls, which during the previous 12 months had
conception rates of 59 per cent (based on 1,267 artificial
inseminations) and 65 per cent (based on 693 artificial
inseminations) respectively, were given large calcium supple
ments (1.3 lb chalk per day), Within 3 to 6 months, the
conception rates had fallen to 33 per cent (based on 624 and
274 artificial inseminations respectively). Six to ten weeks
after withdrawa1 of the calcium supplement, the conception
rates had again risen to 53 and 46 per cent (based on'"118
and 112 artificial inseminations) respectively. Only the two
bulls receiving the chalk at the centre had this low level
of fertility.
It was pointed out that, possibly one of the most
interesting features of the observation, was that at no
time could any deterioration in semen quality be detected
in the laboratory. Thus it would appear that faulty feeding
can influence adversely the fertiliz:ing capacity of semen
before gross changes in the seminal picture become evident.
It is easy to realiz.e that, when the rations fed to
bulls, cows and heifers on a particular farm have mineral
levels likely to lead to impaired fertility, a serious
, j

21
breeding problem can result (Rignett, 1959).
In young calves a calcium deficient diet prevents
normal bone growth and retards general growth and develop
ment. Their bones are low in calcium and fracture sponta
neously. In mature cows, the feeding of rations low in
calcium over a long period of time may cause a depletion of
calcium and phosphorous in the bone$ resulting in fragile,
easily fractured bones and in reduced milk yields, but there
is no reduction in the calcium concentration in the milk
(Converse, 1954).
c. Phosphorous
i. General
By virtue of its role in the processes of energy
exchange, phosphorous is very closely associated with the
normal function of aIl animal tissues. Thus it is con
ceivable that any limitation to the phosphorous supply may
be reflected in a general impairment of the animal's body.
function.
TOday, it is a known fact that the successful
completion of many important metabolic reactions depends on
phosphorylation. Renee, it is not surprising therefore,
that early effects of phosphorous deficiency are those of
retardation of growth due to reduced appetite, lowered
reproduction and lactation.
During the early stages of phosphorous deficiency the

22
supply necessary for body function is obtained from skeletal
reserves. Continued depletion results in skeletal disorders
shown clinically by bone fragility.
T~e first evidence of deficiency is that blood plasma
inorganic phosphorous declines to subnormal levels. Normal
values are 4 to 6 mg per 100 ml for cows and 6 to 8 mg per
100 ml for calves under one year of age (Anon., 1971). The
first clinical symptom of deficiency is anorexial • Depraved
appetite - chewing of substances not ordinarily classified
as feed, such as wood, bones and hair - is often observed.
Cows, however,may suffer from phosphorous deficiency with
out manifesting depraved appetite.
ii. Phosphorous effect on fertility
The exact relationship between phosphorous and
fertility is not clear. In fact, reports in the literature
have been quite contradictory. Phosphorous deficiency has
been linked with reduced efficiency of feed utilization
(Theiler ~ ~.,1924). Riddell et al. (1934) showed that
the digestibility of feed was not impaired by phosphorous
deficiency, and this was confirmed by Kleiber ~ al (1936).
It has been demonstrated that phosphorous deficiency has an
adverse effect in the utilization of both energy (Kleiber
et al.,1936) and nitrogen (Stewart 1934 - 1935, quoted by
Little, 1970; and Morris and Ray, 1939). According to
lLack or loss of appetite

23
Morrow (1969), since the primary effeet of malnutrition on
fertility is anestrus, the infertility May be due to both
a low energy intake and a specifie deficiency.
Eckles ét al. (1935) in Minnesota reported that on
Many dairy farms on which there was a phosphorous deficiency,
not more than one calf was obtained from a cow every two
years, but there were not more than the usual number of
abortions. Many heifers often failed to come into heat
until they were past two years old. Cows tended to have
sub-normal ovaries and those that were affected tended to
have one or two heat periods after they had given birth to
a calf. If they became pregnant ai this time the calves
were carried to term; but if not, they tended to become
anestrus for the remainder of their lactation. Eckles at
~. concluded that the disturbances in estrus and the low
calf crops reported under natural conditions in phosphorous
deficient areas are probably due to the nutritive deficien
cies which accompany the lack of phosphorous or to the
combination of deficiencies that prevail and not exclusive
ly to phosphorous deficiency.
Similarly Theiler ~~ ~l. (1937) as reported by Little
(1970), observed estrus and normal ovulations in grossly
phosphorous deficient heifers during an experiment in which
approximately 3 gm of phosphorous per day was fed over an
extended periode
Subsequently, Palmer ~ al. (1941) studied combined

24
phosphorous and protein deficiency and found that sexual
maturity in heifers was delayed, there was repression of
normal evidences of estrus so that periods of estrus
appeared to be missed, but there was no interference with
normal regularity of ovulation or the ease of conception.
The reduction in breeding efficiency observed by these
workers in their previous experiment (Eckles ~ gl., 1935)
when phosphorous alone was deficient, was not observed in
this study, however, there was marked dystocia (mainly
maternaI) in four of the eight animaIs employed for the
breeding study and they considered this could be attributed
in a large measure to the dietary deficiencies imposed.
Aphosphorosis has been linked with infertility by
Sheehy (1946), O'Moore (1950), and with infertility without
clinical symptoms by Hignett and Hignett (1951). In the
subclinical cases aphosphorosis was associated with unthrifti
ness, low milk yield in dairy cows and anestrus or estrus
with repeated failures to conceive after service. Of the
clinical cases, first-calf heifers usually exhibit the
severest symptoms, while mature calves and cows were not so
seriously affected.
Sheehy (1946) found that feeding à supplementary
mineraI of sterilized bone flour at the rate of 2 oz. per day
or Meat and bone Meal (containing 34 per cent of calcium
phosphate) at the rate of t lb per day caused alleviation
of the disordered condition within a few weeks~ and

1
\
25
completely restored the affected animaIs to normal appearance
and health and reproductive activity in six to twelve weeks.
It appears that various types of ovarian dysfunction
have occurred at different phosphorous levels (Hignett,
1950). Anestrus was observed with low phosphorous levels,
whereas silent and irregular estrous periods were associated
with moderate deficiencies and infertility with marginal
levels.
Hignett and Hignett (1952) claimed that an intake of
about 50 gm of P205 daily was compatible with satisfactory
fertility in dairy heifers. This and other evidence, however,
was criticised by Abrams (1952b), who felt that the doubtful
vitamin D status of British cattle cast doubt upon conclu
sions about the effect of phosphorous deficiency as such on
bovine fertility. Subsequently, Littlejohn and Lewis (1960)
obtained no difference in fertility between animaIs given
2.0 and Il.4 gm of phosphorous per 100 kg, in contrast to
the findings of Hignett and Hignett (1952).
It has been inferred, for example, by Underwood
(1966), that adverse effects on estrus and conception are
those of a specifie phosphorous deficiency.
O'Moore (1952) cited a controlled experiment in
Ireland where extra protein when fed over a period in the
form of a high protei~low phosphorous supplement to anestrus,
hypophosphataemic cows on phosphate-low grazing pastures,
failed to bring about a recurrence of estrus. On the other

26
hand, cows which were pastured on the same grazings and
which had been anestrus from 3 to 5 months, came in estrus
when fed disodium phosphate daily over periods ranging from
10 to 3.5 days.,
O'Moore (1960) stated that a lactating cow grazing
on pasture containing 0.15% phosphorous will rapidly develop
unthriftiness, anestrus, low milk yields and retarded growth.
By way of contrast, however, the highest level of phospho
rous in South African pasture recorded by Bisschop (1964)
in 23 years of monthly sampling was 0.13%; the mean level
in the diet of animaIs grazing these pastures was less than
0.1%. Bisschop (1964) concluded that at no time did the
natural pasture provide sufficient phosphorous or crude
protein for optimum production. However, both dairy and
beef type cows were shown to have grown and reproduced
under these conditions, although rather inefficiently. Per
haps, it is probable that the specialized functions and
nutritional demands of high producing dairy cows are such
that extrapolation to the beef situation may not be justi
fied.
In a report by Snook (1964) it was observed that low
conception rates in high producing dairy cows were associated
with low blood phosphorous concentrations, which was unex
pected because of normal (but unstated) levels of phospho
rous in the pastures. A daily supplement of 20 gm of
phosphorous produced a graduaI response in terms of increased
,.. ," -'.,
butterfat production and reduced calving interval over a
number of lactations.
The close relationship between phosphorous and
prote in deficiencies was again emphasized by the results
27
of feeding trials in the Northern Territory of Australia
by Hart and Mitchell (1965). Supplementation of open range
beef cows in areas deficient in phosphorous, with 8 gm
phosphorous as monosodium orthophosphate per head per day
improved body weight and fertility, but fertility was
increased only in the lactating cows and not in the dry
cows (a pregnancy rate of 60% in the treated group as
compared with 41% in the controls). The authors considered
that the provision of protein is of equal if not of greater
importance than phosphorous for efficient animal production
in that area.
Recently, Morrow (1969) reported a response to
phosphorous supplementation by heifers, in terms of a
reduced number of servic~s per.conception. The phosphorous
deficiency resulted from intensified husbandry and cropping
practices which depleted the level of phosphorous in the
soil and consequently in the crops. Calculations of intake
and requirements for protein, energy, calcium and phospho
rous showed that the phosphorous intake was deficient. The
clinical signs observed were rough coat, depraved appetite
and infertility. The number of services per conception
ranged from 3.7 before phosphorous supplementation to 1.3

28
after phosphorous supplementation. Blood analysis
indicated that the levels of blood calcium, carotene,
vitamin A, hemoglobin and protein were normal whereas low
blood phosphorous levels of 3.9 mg/lOO ml verified the
deficiency. The feeding of dicalcium phosphate free choice,
to these heifers restored blood phosphorous levels to a
normal range (6.6 mg/lOO ml) and fertility was restored.
d. Calcium to Fhosphorous Ratio
i. General
There is a wide variation in the calcium and phospho
rous content of feed ingredients. Legumes are usually high
in calcium and low in phosphorous. The ratio is frequently
6.1 or higher. Grasses are relatively lower in calcium
with an approximate 211 ratio (Morrow,1969).
The level of calcium in the soil has little direct
effect on the calcium content of the plant. If the pH of
the soil drops too low, plants high in calcium, such as
legumes, do not grow; however, the phosphorous content of
the plant varies directly with the level in the soil(Anon.
1965). Generally, due to intensified husbandry and cropping
practices, the phosphorous content of many soils have become
depleted, so that it is important to analyse the forages,
especially for phosphorous content.
ii. The role of CalF ratio
The U.S. National Academy of Sciences (1971) recommends

., \
29
that the diet of a growing heifer and a dry cow should
contain 3.4 gm of calcium and 2.6 gm of phosphorous per Kg
of dry matter daily,(1.3Il ratio) and for a lactating cow
producing 20 - 30 Kg of milk daily the diet should contain
4.7 gm calcium and 3.5 gm of phosphorous per Kg of dry
matter daily (l.3al ratio).
Much interest in the relationship between the calcium.1
phosphorous ratio in the food and fertility levels of cattle
has been generated throughout the world. It is believed
that the utilization of phosphorous is impaired when the
ratio of calcium to phosphorous in the diet varies appre
ciably from the commonly accepted optimum of 1-2.1, parti
cularly when the level of phosphorous is marginalo
Webster (1932) suggested that New Zealand herds
grazing pasture with an adverse calciumlphosphorous ratio
had lower fertility than others on a more suitable ratio.
Hignett and Hignett (1951) from an analysis of the
relationship between intakes of phosphorous and calcium
and the fertility of cows and heifers, concluded that when
phosphorous intake was low a rise in the calcium intake
impaired fertility, but when phosphorous intake was high a
low calcium intake was often associated with low fertility,
with an increase in calcium intake improving breeding
efficiency. However, Hignett and Hignett (1953) found
that the vitamin D status of the animal might influence
fertility. With a high vitamin D status, fertility was not

i ~
\
JO
related to phosphorous intake but with a low vitamin D
status ferti1ity was improved on1y with a rise in phospho
rous intake. In animaIs having a low phosphorous intake,
the effect of the calciumlphosphorous ratio on ferti1ity
was apparently influenced by the vitamin D status, and
conception rate decreased more markedly with widening ratio
as the vitamin became depleted.
O'Moore (1952) observed more severe signs of aphos
phorosis on farms where the pasture exhibited a high
calciumlphosphorous ratio and on one farm there was evidence
for suspecting that a heavy application of ground limestone
to alkaline soi1 may have been a factor in the subsequent
occurrence of "bog lame" and low ferti1ity in the grazing
stock.
A critical experiment on the ro1e of the calcium.
phosphorous ratio on reproduction was reported by Litt1ejohn
and Lewis (1960), where ratios between 0.8 and 12.1 had no
effect whatever on ferti1ity. However, growth rate was
slightly depressed at the high ratio when the phosphorous
intake was approximate1y 2.0 gm per 100 Kg body weight.
With an adequate phosphorous intake of approximate1y
12 gm per day, Dowe et al. (1957) reported that the growth
rate of steers was significant1y depressed by ratios of 9
and 1)11. They conc1uded that if gains are used as a
criterion, then a critica1 ca1ciumsphosphorous ratio may
exist between 4.J11 and 9.1.1.

J .
]1
In a similar experiment in determining the optimal
calcium:phosphorous ratio or the range over which the ratio
may vary without harmful effects on growing cattle, Wise
et al. (196]) found that performance and nutrient conversion
were markedly decreased with calciumlphosphorous ratios
lower than laI. Ratios between 1.1 and 7:1 gave similar
and satisfactory results, but ratios above 7:1 resulted in
decrease performance and nutrient conversion values, but
adverse effects were not as marked as with ratios below 1.1.
Work by Ricketts and Campbell (1971) also established
that there was very little difference in growth rate of
Holstein steers fed a calciumlphosphorous ratio of 411 and
1:1 but steers fed 811 ratio gained much less. Also steers
on the 811 ratio had the lowest feed efficiency, converting
18.4 per cent of feed consumed to body weight, but not
significantly different from 19.6 per cent conversion with
a 1:1 ratio and 18.8 per cent conversion with the 411
calcium:phosphorous ratio fed.
Dawson (1967) reported that in a carefully p1anned
breeding experiment by Koefoed-Johnson (196], 1964)
intended to investigate the effects of varying calcium.
phosphorous ratios and vitamin A and D intakes on ascending
levels of phosphorous content in the ration; the main
result achieved was to show that the group of heifers on
the lowest phosphorous intake had more prolonged interva1s
between heats (mean 1ength 76 days) than in aIl the other

groups put together, although the former group was fully
fertile when served. After calving, however, 5 out of 8
of these heifers developed serious disease states,
32
including endometritis and 3 of the 8 calves were subviable,
while nothing comparable was shown among the other groups.
Further work in Spain by Sanchez-Garnica Montes and
Brenes Paya (1963) indicated various types of infertility,
and also osteomalacia in dairy cows housed aIl the year
round and never exposed to direct sunlight. In every
he rd phosphorous intake was similar - borderline - and it
was the widely varying calcium intake, level which de ter
mined, with the universal vitamin D deficiency (which was
only presumed to exist) the extent of infertility and bone
disease in any given herd.
Ward ~ al (1971) studied the reprOductive performance
of 2 to 6 year old Holstein cows fed calciumaphosphorous
ratios of 0.9al, 1.311, 2.1.1 and 2.511. The phosphorous
intakes averaged about 80 to 100 gm per cow daily wi th sorne
groups receiving 300,000 I.U. of vitamin D3 weekly. AlI
groups had essentially the same reproductive performance and
there was no difference in services per conception.
Steevens et al. (1971) investigated the effects of
different ratios and percentages of calcium and phosphorous
on milk production, reproduction, blood mineraI values and
occurrence of disease conditions in 48 dairy cows over an
extended period of time. One group of cows received a

33
calciumlphosphorous ratio of 311 with 0.4 per cent
phosphorous in the ration. The second group had a ration
with the calciumlphosphorous ratio of 311 but with 0.6 per
cent phosphorous and the third group was provided with 0.6
per cent phosphorous and a ratio of 1.511. They reported
very little difference in breeding performance of cows in
the different groups in the first year in days from calving
to first estrus and number of services per conception.
Four animaIs in the first group fed 0.4 per cent phosphorous
develpped ovarian dysfunctions of follicular cysts, delayed
ovulation and persistent corpus luteum. During the next
breeding season the results were basically the same, however,
a great number of services per conception was required in the
lower phosphorous group.
The findings of Steevens et al. (1971) seem to agree
very closely with results reported by Littlejohn and Lewis
(1960), in that there was no significant difference in
reproductive performance between groups fed rations with
varying calciumlphosphorous ratios.
The available evidence reviewed suggests that the ratio
and percentages of calcium and phosphorous are important con
siderations in formulating rations for dairy animaIs. The ratio
of calcimn to phosphorous in bone is about 211 in older animaIs
and feeding of diets with wide variations in calcium to phos
phorous ratio may lead to other disturbances. For example an
increased incidence of parturient paresis in cows fed an

34
excess of calcium in relation to phosphorous during the dry
period was noted by Boda and Cole (1954). Stott (1965)
reported a field study in which the incidence of parturient
paresis was markedly reduced following alternation of the
dietary calciumlphosphorous ratio by decreased calcium and
simultaneously increased phosphorous intake. More recently
Kendall ~ gl. (1968) found an unusually low ratio of calcium.
phosphorous during the dry period equally as detrimental as
an extremely high ratio in terms of the occurrence of
parturient paresis. A dietary calcium to phosphorous ratio
of approximately 2.211 is adequate for reducing the incidence
of parturient paresis (Kendall et al., 1970).
e. lVIanganese
AlI animal tissues contain manganese in low
concentrations, and the variability of concentrations within
tissues and species is very small. The highest concentration
normally occurs in bones, liver, kidney, pancreas and the
pituitary gland (Underwood, 1956), the concentration in
these tissues in most species being between 2 to 4 p.p.m.
on a fresh tissue basis.
Deficiency of manganese in the diet of rats, mice
and rabbits is associated with impaired growth, defective
mineralisation and structure of the bones and depressed
reproductive function in the female. Histological
examination of the ovaries of rats and rabbits showed no
r

(
35
significant defects, but in the male rat and rabbit
sterility and loss of libido were associated with extensive
tubular degeneration and lack of spermatozoa, (Underwood,
1956).
Hignett (1941) suggested that the heavy liming of
pastures was associated with delayed ovulation in cattle
and this he attributed to a manganese deficiency.
Bentley and Phillips (1951) reported that dairy cows
on a diet marginal in manganese content showed delayed
estrus, a slightly reduced conception rate and a greater
number of calves were born with weak legs and pasterns at
the first calving. There also existed, at that time, in
Wisconsin a nuisance sterility of about 10 per cent of
certain dairy herds where low manganese rations were fed
and this was persistent on farms where the forage manganese
content fell below 20 p.p.m.
Wilson (1952) found that in herds which exhibited a
high incidence of anestrus, especially in heifers a
supplement of 15 gm manganese sulphate, 1 of copper sulphate
and 240 mg of potassium iodide daily increased conception
rate from 37.2 par cent in controls to 61.9 per cent in
treated animaIs. From then on the severe infertility
problem from one of these herds was controlled by manganese
sulphate therapy, and in subsequent cases of functional
infertility in other herds, acid sodium phosphate or
manganese sulphate, either with or without copper sulphate

and potassium iodide, was recommended, usually with
apparently successful results.
Another report by Munro (1957) indicated that out
breaks of apparently functional herd fertility (associated
wi th herbage manganese_ levels ranging from Il to 26 p.p.m.)
decreased and conception rates improved immediately after
manganese was added to the diet. Conception rates to
either the first or second inseminations rose from 48 per
c:ent with 75 cows to 72 per cent wi th 74 cows for the year
prior to supplementation, and the year following, respective
ly.
A report from Rolland (Grashins et al. 1953, quoted
by Underwood, 1956) indicated that a manganese dèficiency
occurred in young cattle on certain sand and peat soils.
These showed symptoms of poor growth and body development,
leg deformities and "over-buckling" of the pastern, po or
fertility, frequent abortion, and the cattle had poor coats
with loss of hair pigment. These symptoms responded to
2 gm of manganese sulphate daily. The ovaries contained
only 0.6 p.p.m. of manganese in the dry tissue.
The Dutch worker, Tesink (1962), was able to raise
conception rate at first service from an average of 51 to
69 per cent in a large group of problem herds by feeding
720 mg manganese per head per day. In a small scale trial
(1963) he fed this level at calciumlphosphorous ratios of
1.6 and 3.0 to normal animaIs and found at the ratio of 3.1

37
there was no significant rise in manganese content of hair,
whereas at the 1.6.1 ratio there was a significant rise.
Additional evidence of the part manganese deficiency
can play in causing bovine infertility has been provided by
an extensive field study conducted in south-western England
by Wilson (1966). Half of the cows in 12 irSertile herds
pastured on low to medium manganese content soils were
given 4 gm of manganese sulphate daily with a resulting
first service pregnancy rate of 63% compared with 51% for the
control cows (P~0.05). The clinical signs shown included,
anestrus, infertility, and in some herds po or growth rates
and knuckling over of fetlocks in calves. Wilson found that
available soil manganese was often low in south-western
England, due sometimes to the effect of heavy liming, and
recommended for optimal fertility the available soil
manganese content should not be lower th an 3 p.p.m. and the
content of roughage 80 p.p.m.; 50 p.p.m. appeared to be
the critical level especially when calcium intake was high.
Wilson further observed that the incidence of abortion
due to Brucellosis in cows vaccinated against this disease
was raised when manganese appeared deficient and in such
cases could be reduced by feeding a manganese supplement.
This finding was subsequently confirmed by observations
from practice by Bourne (1966), who also found it necessary
to feed 100 mg manganese per 100 lb body weight rather than
the theoretical recommendation of 40 to 60 mg per 100 lb
1

38
body weight, in order to maintain consistently high
fertility. Boume attributed this to possible factors which
interfere with the absorption of manganese from ingested
food - one such factor being the calcium and phosphorous
content and the calciumlphosphorous ratio of the ration. He
further suggested that the dramatic reduction in Brucella
abortion in vaccinates, observed by Herrod-Taylor (1966) as
a result of feeding a phosphate rich supplement, may have
been due to a "conditioned"manganese deficiency.
Working under experimental conditions Rojas et al.
(1965) found that cows deficient in manganese, although
exhibiting regular estrous cycles, required an average of
four services compared with twofor the controls. AlI
calves born to deficient dams were deformed showing enlarged
joints, stiffness, twisted legs and a general physical weak-
ness.
AlI these results appear to be fairly consistent one
with another and with the early suggestion of Hignett (1941).
However, another view has been introduced by Havre and Dynna
(1961) in Norway, as reported by Dawson (1967). Manganese
deficiency had appeared over 6-7 years in young cattle on
one particular heavily limed farm. It was found that the
manganese content of the grass and hay was just within
normal limits but that its copper content at 2-3 p.p.m. was
very low. Feeding extra copper alone was much less effective
as a cure but a copper and manganese supplement was very

.i
\, .'
39
successful.
"Lack of Manganese" appears to produce ovarian
quiescence, infertility, abortion, poor corpus luteum
formation, bone weakness and deformity such as fetlock
knuckling in young stock. According to Dawson (1967) such
findings have also been reported from Eastern European
countries where Richter and Schroder (1964) associated them
with very low hair manganese content. Rasbech (1968) and
Krolak (1968) as reported by Mc Clure (1970), found that
low levels of dietary manganese caused subestrus or anestrus.
Rasbech found that, while 20 p.p.m. were adequate for
growth, aIl of the Il heifers failed to show heat.
f. Other MineraIs
Among other mineraIs essential for the general
welfare of the cow, deficiencies or excesses of copper,
iodine, cobalt and fluorine have been shown to be implicated
in reproductive disturbances.
The production of dead or nonviable goitrous calves
indicates an iodine deficiency in the ration of pregnant
cows. Schmidt et al. (1965) fed potassium iodide supplement
to 52 infertile buffalo cows in Egypt, and compared the
results with a control group along with another group
receiving a calcium, phosphorous and manganese- supplement.
A fourth group received both supplements and gave best
pregnancy results, but the group receiving only iodide did

( ,
40
nearly as weIl, whereas the other supplement alone was less
effective. This seems to indicate that iodide was the main
deficiency involved.
Copper deficiency has long been loosely implicated
with infertility, especially anestrus in cattle, but there
have been some reports of cattle breeding normally while
showing low blood or liver copper levels and systemic copper
deficiency symptoms (Dawson,1967'). The explanation of this
inconsistency probably lies in the complex relationships
of this trace element with others. Such findings indicate
that while it may be convenient to consider dietary
constituents under various headings it is always important
to recall the existence of interactions between pairs or
indeed complexes of different elements.
In Queensland, Australia, Donaldson et al. (1964)
obtained a significant improvement in pregnancy rate as
against controls in ranch heifers receiving a single
injection of 400 mg copper glycinate (p(0.05). Other work
in England, Munro (1964), attributed abortion and returns to
service as weIl as anestrus in cattle to copper deficiency.
Either copper injections or the feeding of anti-teart cake
proved effective counter-measures. Blood levels here were
no lower than 0.08 mg% (Dawson,1967).
Fluorine is present in varying amounts in feeds of
livestock, but it's essentiality for animaIs has not been
established. Systemic symptoms of fluorine poisoning has

41
been described, however, Van Rensburg and De Vos (1966)
reported field evidence indicating that chronic subclinical
fluorine poisoning induced by feeding 5 to 12 p.p.m.
fluorine in drinking water for more than one year caused
anestrus, a reduction in conception rate and a marked drop
in pregnancy rate.
4. Vitamins
a. General
Under normal conditions, natural feeds furnish most
vitamins or their precursors in adequate amounts. Ruminants,
such as the cow, are fortunate from a standpoint of their
vitamin supply since they are capable of synthesizing aIl
of the B vitamins and vitamins C and K in adequate
quantities. As a result, the need for dietary sources of
the above named vitamins has not been established for
animaIs on conventional rations. However, the adequacy of
vitamin intakes should be verified under certain conditions,
such as when forage is fed in limited amounts or is low in
quality, when sun-cured hay or exposure of animaIs to
sunlight is limited, and when milk replacers for young
calves are relied on extensively (Anon.,197l).
MaternaI transfer through the uterus to the fetus is
a critical source of vitamins for prenatal growth and
viability during the first weeks after birth, so that rations
fed to dairy cows should therefore include feeds that
contain ample carotene (vitamin A) and vitamin D.
~.

42
b. Vitamin A
Vitamin A deficiency in cattle or an inadequate
intake of carotene resu1ting in a depletion of the anima1's
reserve results in b1indness, (especially night blindness),
edema. lower milk production, and reproductive disturbances.
On Many feeding regimes aIl that would be necessary for
deficiency to arise would be over-sunning or weathering of
the hay to be fed before it was stacked. However, the
like1ihood of such deficiency under tropical conditions is
very remote. as forage is general1y not preserved.
In early work, Guilbert and Hart (1935) found that
rations deficient in carotene caused impaired reproductive
perf'ormance in beef cows. Marked vitamin A deficiency has
affected the reproductive function of dairy bulls by
restricting their ability to MOunt and deliver semene The
extent to which this function is impaired or retarded
depends on the severity of the deficiency (Hodgson ~ al.,
1946) •
Ghannam et al. (1966) and Ghannam et al. (1969) -- --:round that vitamin A dep1etion inhibited spermatogenesis
and reduced the diameter of the vasa deferentia. Lesser
degrees of avitaminosis A (plasma vitamin A leve1s of 5
to 10 ug/lOO ml for 7 months) increased the proportion of
deformed spermatozoa. particularly when bul1s were subject
to transport stress and deprived of drinking water
(Jaskowski ~ al., 1966). Further work by Kupferschmied

\ '.
(
4J
and Rehm (1968), indicated that a single dose of an
emulsifiable water-free vitamin preparation (vitamin A,
2,500,000 - J,OOO,OOO I.U.; Vitamin DJ ,J75,000 - 450,000 I.U.;
Vitamin E, 250 - JOO mg) significantly improved the quality
of sperm and reduced the proportion of still-births.
Long-time feeding of sub-optimal or deficient
carotene rations has detrimental effects on the structures
of certain tissues and organs, resulting in a loss of
reproductive efficiency and viability (Byers et al., 1956).
Later-generation animaIs were also affected. In the second
generation low-carotene bulls showed degeneration of the
seminiferous tubules, reduction in interstitial tissue and
Le'ydig cells, and reduced spermatogenesis. Second
generation cows showed marked loss of reproductive efficiency,
frequently aborted or produced still-born calves too weak
to survive.
Nicholson and Cunningham (1965), working on the
vitamin A deficiency problem in housed beef cattle heavily
barley fed, found that over 50% retained the placenta (and
smaller numbers aborted), and the birth of several dead or
weak calves resulted, unless the individual intake reached
at least 50,000 I.U. vitamin A daily. They also found thst
vitamin E, if fed, affected the animaIs' ability to use
vitamin A without assisting reproductive performance.
More recently Meacham ~~ al. (1970) found that in
-, . .;

44
beef cows conception rates were increased from 81.1% to
90.2% (P<:O.OS) and calf surviva1 increased by supplementing
the ration with vitamin A (16,000 I.U. during late gestation
and 40,000 I.U. per head per day during ear1y lactation).
A review by Dawson (1967), indicates that there seem
to be much attention being paid in Germany to obtain well
based diagnosis of vitamin A deficiency as a cause of herd
breeding problems, based on forage sample analysis. Aehnett
and Konermann (1961) considered it was the commonest cause
of breeding problems encountered in spring, and Ehrlich
(1962) produced similar evidence. Ehrlich recommended a
single injection of 1 million units vitamin A, and dai1y
B-carotene requirements as SO mg for body maintenance, 2S mg
per litre of milk and 200 mg to maintain a pregnancy.
Circumstantial evidence was also produced by Geyer (1961)
that retained placenta was characteristic of the late winter
syndrome in Germany. In 300 cows when receiving 1ess than
half of theoretical requirement, neonatal deaths reached 6%
and retained placenta affected 13% of cows.
Observations out of Israel reveal that apart from
problems of retained fetal'membranes encountered in dairy
cows due to subnormal blood levels of both vitamin A and
carotene, there was also increased incidence of metritis.
Injecting cows with 1 million units of vitamin A, 7 - 10
days before calving date decreased the incidence of
metritis as weIl as retained fetal membranes (Danieli,1968).
--)

f
\
45
c. Vitamin D
The important role played by vitamin D in preventing
disease and promoting the efficient utilization of calcium
and phosphorous by calves and ~ung cattle is now well
established. Calves born to cows maintained for a consider-
able time under vitamin D deficient conditions May have a
decided rachitic appearance and possibly a lowered Mineral
content of the bones.
As far back as 1938, Wàllis reported disturbances of
breeding efficiency of cows previously without any problemso
None of five Holstein cows showed estrus during vitamin D
deficiency, but there was no clear indication whether this
condition should be attributed to lack of vitamin D per ~
although the rations used c~ntained adequate amounts, in
good ratio, of calcium and phosphorous.
Subsequently, Abrams (1952a) concluded that the
evidence for deleterious effects of hypovitaminosis D on
growth and reprOductive phenomena was sound, and criticized
the conclusions of Hignett and Hignett (1952) about the
effect of phosphorous deficiency as such on bovine fertility,
since the status of vitamin D in British cattle, especially
in winter, was doubtful. Under tropical and subtropica~
conditions it seems MOSt unlikely that a deficiency of
vitamin D will ever be a problem in grazing cattle; however,
in interpreting data from the more temperate regions it May
be weIl worthwhile to consider the potential confounding

( \ ....
(
46
effects of vitamin D.
A recent report by Ward ~t al. (1971) indicates that
first observed estrus occurred earlier after .parturition in
cows which received supplemental vitamin D (P (.06), than
in those not receiving vitamin D. The interval between
parturition and subsequent conception averaged 37 days
shorter for cows supplemented with vitamin D than for cows
not receiving it, thus, shortening calving interval more
than a month.
C. EFFECT OF FEEDSTUFFS
Following the recognition by AIder and Trainin (1961)
of reproductive disorders in cattle grazing on lucerne
(Medicago sativa), Thain (1965, 1966, 1967) reported field
evidence that cattle grazing on subterranean clover
(Trifolium subterranean var. Mt. Barker) dominant pastures
in Tasmania were less fertile than cows grazing grass
dominant pastures. Additional field evidence was provided
by Lotan and AIder (1966) from problem herds in Israel.
These authors found that the clinical signs were irregu
larity of estrous cycle length ( 17 and 23 days) and a
lowering of the conception rate. The lucerne contained
25 ug estradiol equivalent jkg and the daily intake was
equal to or greater than 125 ug/day.
A close association between the feeding of Kale
(Brassica oleracea) and fertility has been reported

47
(Reed, 1961, Melrose and Brown,1962). In a controlled
experiment, Melrose and Brown indicated that there was a
lowered conception rate to first service and longer return
intervals after failures (average, 38.8 days vs 21.6 days)
in Friesian heifers fed Kale as opposed to controls. David
(1965) has provided additional evidence suggesting that
goitrogens in Kale may be responsible for infertility.
More evidence has continued to accumulate indicating
that over-mature grasses are not able to maintain body
weight, lactation, and reproduction. This could be quite
common in areas where drought is common, or periods where
nutritional stress occur annually, such as the tropical and
subtropical regions of Australia, Africa and the Americas.
This over-mature forage is of low digestibility and provides
a low intake of energy. ·It also contains insufficient
protein, mineraIs, especial1y phosphorous, and carotene
(Suther1an~ 1959). Thus Armstrong ~ Al. (1968) has shown
that beef cows lost weight during the dry season and gained
weight during the wet season in north-western Australia.
In feeding experiments, supp1ementing the dry pasture with
protein ri ch cotton seed meal they were able to reduce
weight losses of breeding cows from 47% to 0% and increased
the number of calves borne . Simi1ar results have been
obtained by Sparkle and Lamond (1968).
Immature pasture is not always able to maintain
body weight, lactation and high fertility in dairy cows

l. (Mc Clure,196l, 1965a,b). It appears that the quality of
the feed as weIl as insufficient intake is important
48
(Mc Clure, 1968b) for a comparable restriction in the intake
of dairy meal did not lower first service pregnancy rates.
Working with beef heifers, Buchanan-Smith ~ al.
(1964) found that those transferred to an all-concentrate
ration ad libitum were mated earlier than those left on
silage plus 1 pound mi10 and 1 pound cotton seed meal /day.
Thus it appeared that the al1-concentrate ration has a more
prompt influence on estrous occurrence than a roughage
ration.
Manufactured feeds and by-products of industry can
vary in composition and may be inadequate for reproduction.
A good example is sugar-be,et pulp which is markedly deficient
in phosphorous (A1derman, 196).
D. CAUSES OF NUTRITIONAL Ir~ERTILITY
Three aspects of the pathogenesis of nutritional
infertility have been reported.
a. Lactational Stresses
The opinion is frequently expressed by ~armers and
veterinarians that high-yielding dairy cows do not conceive
as easi1y as those producing at a lower level. Early
workers in this area have expressed differing views, some
indicating that lactation has an effect simi1ar to that of

49
growth rate, but to a greater degree. Lewis and Horwood
(1950), Mc Taggart (1961), Donaldson (1962), and Hooper and
Letts (1962) have indicated that lactation is a contributing
factor toherd infertility. However, Eckles (1929) and
Currie (1956) failed to find evidence that lactation
influenced reproduction. Meyer (196J), as reported by Mc
Clure (1970), in a review, has found that the available
evidence was cOnflicting and confused.
According to Mc Clure (1970) considerable interest
in lactation affecting fertility is evident in reports from
Europe. Nevertheless, subject to the limitations of
statistical survey data, many of the recent reports indicate
a significant, though sometimes small, depressant effect of
lactation on fertility.
Hewett (1968) found that the incidence of repeat
breeders among 16,000 cows on 1500 farms in Sweden was over
10%. The affected cows gave significantly more milk (84.4 kg)
during the first 120 days of lactation than the controls. the
difference was greater (108.0 kg) in cows which had one
previous lactation.
Evidence supporting the hypothesis that high producing
cows are less fertile than low producing cows has been
reported by Horvath (1966), Steele et al. (1967), and
Varejcko (1968). Varejcko found that the conception rate
to first service decreased from 69.2% for heifers to 40.8
46.7% after the second to the sixth calving, and the
insemination index from 1~48 to 1.94 - 2.22. The index
'-1 . ,

(
50
increased from 1.37 to 2.5 as milk production increased
from under 2000 to 5500 kg and was 2.25 for higher yielding
cows.
The practice of suckling is known to increase the
length of the interval from calving to the post-partum
estrus in cows (Clapp, 1937; Wiltbank and Cook, 1958;
Aliseihov, 1964; Saiduddin et al., 1967). Aliseihov found
that the interval in nurse cows was 108 days compared with
the 60 da ys of the cows in the dairy herd. It is not clear
whether this inhibition of reproduction is due to physiologi
cal responses to suckling or is the result of increased milk
yield shown to occur as the result of suckling (Fatel and
Fatel, 1963).
b. Body Weight Change
For some time it has been recognised that body weight
is related to fertility. Reid ~~. (1964) have shown that
the rate of weight gain of heifers affected.pubescence and
that puberty depended largely upon body weight. Nutritional
stress super-imposed on lactational stress has been known
to affect fertility. The loss of weight that occurred in
beef cattle in the dry season was associatedby Kidner
(1966) and Armstrong ~ al. (1968) with low fertility. Both
the body weight and fertility recovered when the summer
rains came and feed quality and quantity improved (Donaldson,
1962). General observations with beef cattle having their
first calf at foot are that such animaIs have the lowest

51
body condition score and lowest fertility of any class of
animals in beef herds. Sparkle and Lamond (1968) observed
that lactating heifers needed to be at least 100 pounds
heavier than they had been the previous year when they were
first mated in order to obtain satisfactory pregnancy rates.
Similar body weight and fertility observations have been
described when considering plane of nutrition (Turman ~ ~.,
1964; Reynolds ~ ~., 1964; Hight, 1968).
The high-producing dairy cow in the first month or
two of lactation is a special case of under-nutrition as
she is usually in a negative energy balance ev en when
offered liberal amounts of an adequate diet. Wh en maintained
wholly on pasture a further complication arises because,
although she may or may not be losing weight, she could be
on the borderline of deficiency of any number of nutrients
from day to day. In fact, the relation between supply of
nutrients and reproductive performance in grass farming
systems is a special and difficult problem (Lamond, 1970).
Problems of this nature, seem to occur in pasture
fed dairy cows in New Zealand and New South Wales, Australia
(Mc Clure, 1961, 1965a, b). Cows fed on lush young grass
or forage oats may lose excessive amounts of body weights
(between 5 to 10% of their immediate post-calving weight)
by the time of mating and fa il to hold to service. Supple
menting the pasture with 10 to 14 pounds hay/cow/day (or 12
pounds dairy meal, Mc Clure, 1970) decreased the weight loss

i \.
(-
52
and significant1y increased the fertility. Hutton (1963)
observed that the intake of pasture did not reach its
maximum until five months after ca1ving, and that cows in
early lactation were in a state of negative energy balance
and 10st weight. Such information emphasizes the importance
of the qua1ity of the feedstuffs fed at the particular
periode The weight of dry cows fed simi1ar pasture (Hutton,
1963) and 1actating cows fed dairy mea1 at high planes (Mc
C1ure, 1970) did not fa11. This association between 10ss of
body weight during ear1y lactation in dairy cows and 10w
first service pregnancy rates has also been confirmed by
King (1968) who found that 78% of cows increasing in body
weight he1d to first service compared with on1y 16% of the
cows 10sing weight.
c. Blood Ana1ysis Criteria
The measurement of various blood constituents for
examp1e, protein, calcium, phosphorous, hemog10bin, vitamin A
etc., can give an indication of nutritiona1 deficiencies or
previous disease conditions in the cows.
B1ake1y (1965), quoted by Mc Clure (1970), reported 10w
b100d-glutathione and cholesterol leve1s and thyroid secretion
rates in infertile Hereford heifers fed 4.2 pounds TDN/day.
Mc Clure (1965b) observed that, at the time of mating,
the b100d-glucose 1eve1s of infertile dairy cows fed on
1ush pasture were fa11ing and were lower than those of
fertile cows which were rising. Later,he observed (1968b,

(
5)
1970) that the blood glucose levels of cows fed on forage
oats (Avena sativa) were lower than those cows fed on
similar diets but supplemented with energy-rich concentrates,
and that cows fed low levels of either type of diet had
lower levels than cows fed at high planes. He suggested
that hypoglycaemia might be the primary biochemical les ion
occurring in lactating cows fed on lush pasture or forage
oats and losing "excessive" amounts of body weight at the
time of mating. Administration of insulin ta lactating cows
for three or four da ys before expected estrous periods
decreased the blood-sugar levels and suppressed estrus or
depressed the pregnancy rates of cows'mated within two days
after the last dose (Mc Clure,1968a). In mice, acute fasting
and insulin both of which caused hypoglycaemia, and adminis
tration of 2 - deoxy - D - glucose, a glu~ose metabolic
inhibitor, caused lesions which varied from embryonic death
to failure of ovarian follicular development (Mc Clure,
1966, 1967a, b).
In Europe, Arzumanjan and Dorotjuk (1964) observed
that the blood-protein coefficient, blood-sugar, and semen
albumen contents were higher in Black Pied cows which
conceived to insemination than in those failing to conceive.
They also observed that the service periods~of the cows
yielding ),000 kg to 5,000 kg of milk were longer than those
of cows yielding up to ),000 kg, again suggesting a
lactational stress factor affecting fertility.

In blood analyses conducted on 1,333 dairy cows,
hemoglobin values below 9.8 gm/lOO ml were associated with
anestrus and repeat breeding in 530 cows while the 803 cows
with normal reproductive performance had average hemoglobin
of 10.67 gm/lOO ml (Hansel, 1968 reported by Morrow,1970).
Low blood content of inorganic phosphorous has also been
associated with infertility (Morrow, 1969, 1970).

III. OBJECT OF RESEARCH
A review of the Literature has indicated the many
nutritional problems that can affect fertility.
The object of the research as reported in this
thesis wasl
1. To investigate the possible relationship between
infertility in dairy cattle and nutritional
criteria.
2. If nutritional infertility did exist, to determine
whether there was any relationship between the
condition observed on farms in the Province of
Quebec, and on farms in Trinidad with cattle of
similar origin and breed.
55

56
IV. DATA SOURCE AND METRODS
A. QUEBEC PROVINCE
1. General
Eleven dairy farms enrolled on the Dairy Herd Analysis
Service (D.H.A.S.) program of Macdonald College considered
as representative of farms on the program were selected for
data collection. This selection was done with the assistance
of Mr. Orance Mainville, who actively participated in the
study initially, and the D.H.A.S. field supervisors. These
farms were located mainly in South-Western Quebec and lie
within an approxima te 60-mile radius of Macdonald College.
Mr. Mainville and the D.H.A.S. supervisors acted as
interpreters (majority of farmers were french speaking) and
assisted in collecting forage, grain and blood samples and
any further descriptive information relative to the farm
operations. AlI herd owners were keen to co-operate and
the period of collection of aIl samples was April - May 1971.
2. Sampling Procedure
a. Hay Samples
Hay samples were obtained from baled hay by using a
"Penn State" forage sampling devicel • Sample cores were
randomly taken by drilling into the exposed ends of about
1 Scientific Systems Inc., State College, Pa., U.S.A.

\
57
6-8 baIes. The samples were then emptied into a pDlyethy
lene bag which was then sealed by folding the top over
several times and stapling across the fold and an
identification card listing the farmer and number of sample.
b. Corn and Grass Silage.
Samples of either corn or grass silage as were avail
able on the respective farms were collected either by drilling
or taking several handfùls from the exposed surface of the
silage. Any spoiled silage was removed before sampling. Cores
or handfuls were taken at random from about six spots from the
exposed face of the silo, and placed in the same type of
polyethylene bags as the hay samples, sealed very tightly to
minimise loss of moisture from the samples, and identified
accordingly. Silages were then dried on the same day.
c. Grainsoor Concentrates
Representative samples of grain mixtures or concen
trate mixtures were taken and placed in similar polyethylene
bags, sealed, and identified in similar manner as for hay
and silage.
3. Blood Collection and Microhematocrit Determination
Herd size varied from 26 to 54 with a mean of 32
Holstein cows. Ten cows were selected from each he rd for
blood sampling.
Blood samples, for serum and microhematocrit analysis,
were collected by venipuncture from the external jugular
vein of cows into clean, dry 127 x 16 mm vacutainer blood

58
collection tubes in 10-12 ml amounts. Hypodermic 16 guage,
1" sterile monoject needles were used for venipuncture.
Immediately after collection microhematocrit heparinized
capillary tubes measuring 75 mm x 1.0 mm were filled with
blood between two-thirds to three fourths capacity by
capillary attraction, the outside wiped off and the opposite
end of the capillary tube sealed with rubber caps. The
blood samples were then allowed to clot, the sera separated
by centrifugation at 2260 x G for 20 minutes and kept
frozen until analysed.
Packed Cell Volume (PCV) was determined by centri
fugation (using an International Hematocrit centrifuge) of
the sealed capillary tubes at 2260 x G for JO minutes and
the results read off using an International Microhematocrit
Reader.
B. TRINIDAD
1. Location and Climate
Trinidad is the southernmost of the West Indian
islands - an archipelago stretching from the tip of Florida,
in the United states of America to the north eastern coast
of Venezuela in South America. The island lies at 100 JO'
north latitude and 61 0 15' west longitude. The distinguish
ing feature of climate is rainfall; there are marked wet
and dry seasons. The former extends from May to December,
interrupted by a two or three week dry period in September

59
or October, and ~ dry season from January to April. The
mean annual rainfal1 varies from 50" (127 cm) to 75"
(190.5 cm). The climate is almost constant throughout the
year - a1ways hot and humid - but is tempered by the
breezes of the Atlantic. Humidity is high, usua1ly above
80%. The average annual maximum and minimum temperatures,
and diurnal variations are given in Table 1.
TABLE 1
AVERAGE TEMPERATURE IN TRINIDADI
TEMPERATURE
FAHRENHEIT CENTIGRADE
Highest Maximum Temperature 950
350
Lowest Minimum Temperature 600 170
Average Maximum Temperature (Annual) 880 310
Average Minimum Temperature (Annua1) 720 22.20
Maximum Diurnal Variation 270 150
Minimum Diurnal Variation 50 30
Mean Diurnal Variation 170 100
1 . Source: Government Meteorologica1 Station, Piarco

60
Thirty farms (approximately 20 acres each) were
selected for this investigation and these were considered
representative of a wide cross section of the established
farms with management varying from good to poor. Sixteen
of these farms were located at Wallerfield situated in the
north, eight at Carlsenfield and six at Esmeralda both
located in the central parts of the island. In addition
the Government station at Centeno, located in the north
and comprising both a Holstein herd and aherd of Holstein
Zebu cross were used in the study.
The period of collection of aIl data and samples was
between June 15th and July 31st. 1971.
2. Sampling Procedure
a. Pasture Grasses
Samples of developed pangola grass (Digitaria
decumbens,Stent.) pastures were cut by hand from 9 inch
(22.9 cm) squares at about 10 yard (9.1 m) intervals over
a large representative area of the grazing paddocks. Wh en
about 3 pounds (1.4 kg) of pasture had been obtained this
was placed in polyethylene bags and sealed very tightly
and identified. Samples of Napier grass (Pennisetum
purpurem) grown on some farms, were taken by cutting repre
sentative samples and treated exactly like the pangola
grasse Each sample was then frozen at _200 C until ready
for grinding.

61
b. Concentrates
Representative samp1es of a commercial dairy ration
(Table 2) as used on the farms were sea1ed in polyethylene
bags and stored for transporting to Macdonald College. As
different commercial feed companies prepared rations from
the same formulation it was necessary to take samples from
each farm to observe variation in production since no
controls exist for feed quality in the island.
TABLE 2: DAIRY RATION COMPOSITION1
Ingredient % Protein ~ Fibre Crude Digestible %
Coconut oil meal 27 5.7 4.9 2.9
Soy-bean oil meal 10 4.4 ].8 0.6
Wheat middlings JO 5.0 4.1 2.9
Brewers dry grain 10 2.] 1.7 1.6
Citrus meal 12.5 0.7 0.4 2.0
Molasses 7.0
MineraIs J.52
Total 100 18.1 14.9 10.0
lSource: Dr. J.G. Davidson, Ministry of Agriculture, Trinidad
2Consists of 1% dicalcium phosphate, 1% Na Cl., 0.5% limestone, 1% mixture of trace elements and vitamins.
TDN %
21.0
7.8
20.1
6.2
9.7
].8
68.6

62
3. Blood Collection and Microhematocrit Determination
Blood samples were collected from aIl animaIs above
1 year old and up to 7 months pregnant. A total of 472
animaIs were sampled on the 30 farms with a range of 10 -
21 and a Mean of 16 animaIs respectively. On the Government
Station 48 purebred Holstein and 112 Crossbred Holstein-
Zebu animaIs were sampled.
Blood sampling for serum and microhematocrit analysis
was basically the same method as previously described for
Quebec, however, the heparinized capillary tubes used
measured 32 mm x 0.8 mm and were sealed by a plug of clay.
Packed Cell Volume (PCV) was determined by
centrigufation (using a Drummond Microhematocrit Centrifuge)
of the sealed capillary tubes at 14,000 x G for 2 minutes
and the results read off on a Drummond Microhematocrit
Reader.
Sera separation was as previously described. Samples
were kept frozen and were subsequently packed in dry ice,
and along with forage and concentrate samples, were air
freighted to Macdonald College where aIl analyses were
carried out.
C • FEEDING AND MANAGEMENT
1. Quebec
The general practice on MOSt farms is to keep animaIs
on pastures, day and night, except when being milked, from
,.:

63
late Spring to early Fall and supplementing with grains
according to production and the quality of the available
pasture. For the rest of the year animaIs are housed and
fed hay, silage and grains according to production. Since
each herd involved in this study is enrolled on the D.H.A.S.
program, grain feeding recommendations are usually based on
the quality and amount of forage fed.
2. Trinidad
On aIl the farms involved the' dairy cows are kept on
permanent pastures of pangola grass day and night, except
during the periods of milking. It is generally accepted
that grazing should provide enough energy for body main
tenance, and in addition, a commercial dairy ration is fed
according to milk production at the rate of 4 pounds of
concentrate per 10 pounds of milk produced (1.8 kg per 4.5 kg).
During the dry periods, or periods of inadequate pasture
growth a basal ration of 2 pounds (0.9 kg) of citrus Meal is
usually fed to augment the pasture supply, or where available
zero grazing of Napier grass is substituted.
In MOSt cases adequate shade is provided in each
paddock, and rotational grazing is practiced to control
forage quali~y as weIl as to interrupt life cycles of
internaI and external (ticks) parasites. In addition
animaIs are sprayed within 7-14 days with Sevinl in order
lSevinll-naphthyl-N-methyl carbamate - sprayed on as suspension

(
64
to control tick infestation.
D. ANALYTICAL METRODS
1. Preparation of Samples
AlI samples were weighed then dried at 650 C overnight
in a forced air oven after which they were passed through
the medium (1.7 mm diameter) size screen (equivalent to
12 mesh U.S.B.S.) of a Raymond Laboratory Hammer Mill. AlI
hays, silages and grain mixtures were treated in the same
manner, however, the commercial concentrate preparation only
received grinding as it was previously air-dried.
Each ground sample was then thoroughly mixed, placed
in plastic bags and sealed tightly.
2. Chemical Analyses
a. Forages and concentrates
AlI forage and concentrate samples collected were
analysed for dry matter by the vacuum drying method of the
A.O.A.C. (1965) since the forced air oven drying was
considered as only 90%. The cellulose content of aIl samples
was determined by the method of Crampton and Maynard (1938) as
modified by Donefer et al. (1960). Crude protein analysis
was conducted according to the A.O.A.C. (1965) macro-kjel
dahl Methode Calcium analysis was determined according to
the A.O.A.C. (1965) atomic absorption spectroPhotometryl
on wet ashed samples. Phosphorous was determined according
lSp 90A Atomic Absorption Spectrophotometry - UNICAM

to the A.O.A.C. (1965) method for phosphorous in feeds
using a spectrophotometerl •
b. Blood Analysis
Serum calcium was determined by atomic absorption
spectrophotometry2 and serum inorganic phosphorous analysis
was by the method described by Simonsen et sl. (19~6).
J. Procedure to evaluate the Energy Content ofl
a. Forages
Nutritive Value Index (NVI) as developed by Crampton
et al. (1960) is defined by the following formulai
NVI = Relative Intake (RI) x % digestibility of energy.
A laboratory method developed by Donefer et al. (1966)
whereby NVI could be predicted from dry matter disappearance
(DMD) by incubation of a forage sample in an aqueous solution
of pepsin - HCl, was used in this study.
NVI was calculated by the following prediction
equation:
NVI = -0.75 + 1.60 X
where
x = per cent DMD
IBausch & Lomb Spectrop.hotometer.
·2SP 90A Atomic Absorption Spectrophotometry - UNICAM
A.O.A.C. (1965).

This evaluation procedure developed by Donefer and
his associates now serves as the basis for the Macdonald
College Feed Testing Program and is used to estimate the
"Quality Code" or estimated net energy(ENE) content of a
forage.
66
The system of assigning Quality Codes to indicate the
estimated net energy content of forages is being followed
by Many Dairy Herd Improvement Associations in the United
States, and was introduced by the New York State program.
The procedure used by the Macdonald College Feed
Testing Program was also used to predict the ENE content of
aIl forages used in this study.
NVI = Quality Code = ENE = megacalories (Meal) per
45.4 kg DM or therms
per 100 lb
In the Quebec herds the ENE consumed by each animal
was based on calculations from the actual amount of forage
fed - on a dry-matter basis - to a 1000 pound (454 kg) cow,
adjusted according tm the body weight of the individual
animal.
However, in Trinidad, the intake of pasture (pangola
grass) by individuals could not be determined and presumed
intakes were assessed from known dry matter requirements of
2.5 pounds (1.1 kg) of very liberal feeding of good roughage
per 100 pound (45.4 kg) body weight (Morrison, 1959), and
based on a report from Puerto Rico where cattle grazing on

r "-. '.
67
pangola grass consumed an average of close to 2.5 pounds
(1.1 kg) of dry forage per 100 pound (45.4 kg) of liveweight
(Vicente - Chandler ~al.,1964).
b. Concentrates
In the Feed Testing Pro gram at Macdonald College
calculations of Total Digestible Nutrients (TDN) of concen
trates are based on laboratory cellulose analysis ex~ra
polated from a regression equation arrived at from values
taken from N.R.C. Feed Composition Tablesl • Wh6le soy-beans,
beet pulp and molasses are exceptions to this relationship.
A high correlation exists (r = -.97) between crude
fiber (cellulose) and TDN, and this TDN content was calcu
lated from the following prediction equation (for Quebec
concentrates), as used bythe Macdonald Feed Testing Service.
y = 83 - 1.4 X
where
X = per cent ~ellulose) crude fiber
Due to the inherent difficulties of the crude fiber
analysis - both time consuming and empirical aspects - plus
the fact that cellulose determination is a routine analysis
in our laboratory, and the close relationship between
cellulose and crude fiber, it was decided to use cellulose
as an indicator of crude fiber. WeI ton (1968) observed
correlation coefficients between crude fiber and cellulose
varying from 0.91 to 0.99.
lFeed Composition data from N.R.C. Nutrient Requirements of Dairy Cattle 1971. National Academy of Sciences, Washington D.C

/
'-
68
TDN values for Trinidad were extrapolated on a similar
basis (Fig. 1), however, the regression line was lowered to
be consistent with the TDN values reported for the Trinidad
Dairy Ration (Table 2) in order to prevent inflation of the
readings of various feed compositions.
Since estimated TDN values for concentra tes closely
approxima te ENE values (Table 3) - in fact at 7% crude fiber
TDN and ENE were the same - it was decided to assume that
ENE of the grain mixture was the same as predicted TDN.
Based on the practical orientation of this study it
was considered that aIl assumptions used were valide
TABLE 3' ESTlMATED TDN AND ENE CONTENT OF MANUFACTURED DAIRY FEEDSI •
Maximum Crude Estimated Estimated Fiber as Guaranteed TDN Net Energy
1
~ ~ ~thermsLcwtl 4.0 79.5 81.3 5.0 78.0 79.1 6.0 76.5 77.1 7.0 75.0 75.0 8.0 73·5 72.8 9.0 72.0 70.9
10.0 70.5 68.3 Il.0 69.0 66.6 12.0 67.5 64.6 13.0 66.0 62.5 14.0 64.5 60.4
Source. Dairy Feed Manual College of Agriculture, The Pennsylvania State University.

Figure 1. Relationship between Cellulose content (%) and TDN •
85
80
75
65
60
\, '\ , " , , ,
" , , , \
" , , , \ " \
\
"
•
,
Trinidad
" , \
'\ \ , \ " " " , , ". , ,
'\ , , ,
" "
N.R.C.
69
" 55~----------~------~\~~~---------~~-------10 20 30
Cellulose Content (%) Source: Feed Composition data from N.R.C. Nutrient
Requirements of Dairy Cattle 1971.National Academy of Sciences, Washington D.C.

70
4. Other Data
AlI other information such as age, previous production,
lactation sequence and calving interval for the Quebec herds
were obtained from the D.H.A.S. records at Macdonald College.
In Trinidad, records were obtained from individual
cow records retained on the respective farms. Records of
bulls' fertility were obtained from the Government
Artificial Insemination~.I.) centre. Body Weight of each
animal was determined by the use of a Purina girth tapel •
E. STATISTICAL ANALYSIS OF DATA
For identification purposes the eleven herds in Quebec
will be referred to by the letters A to K inclusively. For
the thirty herds in Trinidad the numerals 1 to JO will be
used. However, the two Government herds (Trinidad) will be
referred to as Crossbred and Purebred Holsteins.
Means and Standard Error for aIl parameters, and
Simple Correlations between services per conception and
calving interval and aIl other parameters examined. were
calculated according to the method described by Steel and
Torrie (1960).
In this study unequal subclass frequencies causedthe
different classes of effects to be non-orthogonal. Thus
1 Made according to United States Department of Agriculture specifications.

f \
71
it was necessary to consider aIl effects simultaneously in
order to free them from entanglement. The method of analysis
used was that of least squares estima tes as outlined by
Harvey (1960).
The IBM 1620 Digital Computer was utilized to execute
the calculations of statistical analysis described above.

72
v. RESULTS AND DISCUSSION
1. Incidence of Infertility
Current economic conditions dictate high milk
production and breeding efficiency for profitable dairying.
Low fertility is widely recognised as one of dairy manage
ment's major problems. While much progress has been made
in improving dairy cattle fertility through disease control,
breeding problems have surpassed udder trouble and rank
second to low milk production as cause for culling,
increasing from 17 to 22% of aIl culled cows during 4 years
(Bonewitz et al., 1966-71). Services per Conception and
Calving Interval have been the criteria used as the index of
infertility.
a. Services per Conception
Table 4 indicates the incidence of infertility of
Cattle surveyed in Trinidad based on actual calvings.
These data indicate that the overall fertility rate was low
when compared to the first servié-a acceptable fertili ty
rate of 55% as proposed by Zemjanis (1965). However, it is
interesting to note the higher first service calvings on
the Trinidad Herds (Jrown Lands Herds) of 47.7% as compared
to the herds maintained on the Government Station, 34.0%
for the Purebred Holstein and 39.3% for the Crossbred
Holstei~Zebu herd. The values for the Government herds
'1

" .
.. --.--..., /"'----
Table 4. The incidence of infertility of cattle in Trinidad.
Fertility Index
First Service Conception rate in per cent.
Per cent of animals requiring 3 or more services.
Total conceptions invo1ved.
Government Station Crossbred No. Holstein
(a) heifers 31.3 (b) cows 45.6
Overall 39.3
40.2
(99) (125) 224
22LJ.
27.8 3LJ..9 34.0
46.1
No.
(18) (123) 141
141
Other Herds Holstein
(CrJ2wn Lands)
47-7
29.3
870
'"'1 \N
~

(-, !:._ f
closely follows the picture observed in Jamaica, from 25
herds whose first service conception rate was JJ%
74
(Zemjanis, 1965) and from J6 Friesians in Uganda where a
first service conce~tion rate of JO.5% was reported (Trail
and Marples, 1968). Pelissier (1972) analysed the breeding
records from 24 commercial dairy herds within California
and reported an average first service conception of 44.2%.
The Trinidad (Crown Lands) herds compare favourably with this
finding and,in fact represent a slight1y better picture.
In Tables 5, 6 and 7 are set out the number of
services required per conception for each herd in Quebec,
the Trinidad Herds (Crown Lands Herds) and the Government
Herds respective1y. If we accept the criterion of Zemjanis
(1965) of 1.8 services per conception then only herds
A, B, F and K or 4 of the Il or J6.4% of the Quebec herds,
and herds l, 5, 12, 25 and 27 or 5 o~ the JO or on1y 16.7%
of the Trinidad herds can be considered as having acceptable
fertility. When this finding is compared with previous
reports, Boyd et al. (1954) 1.68, Hollon et~. (1967) 1.7J,
Bozworth et al. (1972) 1.8, Morrow !1 al. (1966) 1.84, Van
Demark and Salisbury (1950) 1.97 and Pelissier (1970, 1972)
2.55 and 2·.44 services per conception respecti ve1y, i t wou1d
seem that herds H and l in Quebec and herds J, 6, 14, 19, 21,
22 (20%) and both Government herds do not compare favourab1y.
Again the trend in the Government kept Purebred Holstein

/-~ .. -...."\ f , , ~
Table 5. Mean Production and Reproduction Parameters for Cows (Quebec Herds).
Herd No. No. of Daily Production Ca1ving No. of Services Cows (kg) Interva1 Cows per
(days) Conception
A 9 1 17.9:t 1.0 ,387 :t 12.2 la 1.7 :t 0.,3
B 9 18.2 :t 1.4 415 :t 21.2 1,3 1.8 ± 0.,3 C la 18.0 ± 1.4 4,38 ± 28.4 la 2.,3 ± 0.4 D 8 14.9 ± 1.1 397 ± 16.0 9 2.2 ± 0.4 E 9 17.3 ± 1.7 420 ± 20.1 10 2.0.± 0.4 F 10 16.6 ± 1.2 418 + 19.5 10 1.7 ± 0.3 G 7 15.3 ± 1.2 374 ± 9.1 10 1.9 + 0.4 H 9 15.3 ± 0.8 367 ± 12.9 la 2.7 .:t 0.7 l 6 12.1 ± 1.9 406 + 15.4 10 3.2 + 0.9 -J 6 1,3.4 ± 1.,3 ,385 ± 24.7 10 2.2 + 0.4 K 7 1,3.9 ± 1.6 ,358 ± 6.8 10 1.6 ± 0.2
1Va1ues are means ± S.E. for number of anima1s invo1ved.
.~
" \.n

,~ ,r"'-"
Table 6. Mean Production and Reproduction Parameters for Cows (Trinidad Herds).
Herd No. No. of Dai1y Production Ca1ving No. of Services Cows , (kg) Interva1 Cows per
,da~sl Conce:etion
1 18 10.5 + 0.7 1 426 ± 18.9 21 1.6 + 0.2 2 12 8.1 ± 0.6 444 ± 29.9 13 2.0,± O.)
) Il 7.7 + 0.5 520 ± 55.9 12 2.8 ± 0.3 4 13 9.5 ± 0.4 469 ± 28.1 17 2.2 ± 0.3 5 13 7.6 ± 0.7 436 + 26.8 18 1.4 ± 0.2 6 10 7.4 ± 0.7 464 + 25.9 13 2.6 ± 0.5 7 15 9.5 + 0.4 388 ± 14.8 18 2.0 ± 0.2 8 13 10.1 ± 0.5 405 + 21.6 18 1.9 ± 0.2 9 9 7.8 + 0.5 368 :t 13.8 Il 2.3 ± 0.3
10 17 2.4 ± 0.4 Il 13 8.3 ± 0.6 350 ± 16.6 18 1.9 + 0.2 12 18 1.5 ± 0.2 13 12 2.0 + 0.2 14 13 10.3 + 0.7 465 ±. 34.0 16 2.8 ± 0.7 15 14 2.0 ± 0.2 16 16 2.0 ± 0.2 17 8 6.5 ± 0.5 418 ± 27.3 10 2.0 ± 0.3 18 10 5.8 ± 0.5 483 + 50.4 10 2.3 ± 0.3
-..J 0'\
~

,...~-
Table 6 Cont'd
Herd No. No. of Dai1y Production Ca1ving No. of Services Cows (kg) Interva1 Cows per
~da~s~ Conce12tion
19 7 7.0:t 0.4 516 :t 38.4 7 4.2 ± 1.1 20 13 7.2 + 0.3 433 :t 16.8 15 2.1 ± 0.3 21 7 10.7 :t 0.6 380 ± 27.6 12 2.9 ± 0.7 22 Il 10.1 ± 0.8 420 ± 25.4 17 3.0 ± 0.6 23 11 8.3 ± 0.4 416 ± 18.8 11 2.1 ± 0.2 24 12 10.0 ± 0.5 450 + 35.3 17 2.4 ± 0.4 25 11 10.1 ± 0.7 417 ± 27.1 12 1.7 ± 0.2 26 8 10.0 ± 0.5 456 ± 38.0 16 1.9 ± 0.1 27 Il 9.2 ± 0.7 439 ± 28.7 14 1.8 ± 0.2 28 Il 10.3 ± 0.6 458 ± 37.0 12 2.1 ± 0.5 29 13 9.1 ± 0.3 448 ± 22.0 14 2.2 ± 0.3 30 10 8.2 ± 0.6 506 + 35.6 11 2.3 + 0.2
, ·Va1ues are means ± S.E. for number dr anima1s invo1ved.
--.:l --.:l
J

, .
Table 7. Mean Production and Reproduction Parameters for Cows. (Governrnent Herds Centeno, Trinidad).
, Herd No. No. of Daily Production Calving No. of Cows (kg) Interval Cows
(days)
Purebred 29 9.6 ± 0.4 1 488 + 24.5 47 Holstein
Crossbred 35 7.9 ± 0.4 435 + 16.2 107 HOlstein/ Zebu
IValues are means ± S.E. for nurnber of animaIs involved.
Services per
Conception
3.0 ± 0.2
2.7 ± 0.2
" co
, .. J

79
he rd of 3.0 services per conception resembles that observed
in Jamaica of 3.3 (Zemjanis,1965).
First service conception rates of from 65 to 75% are
commonly quoted by artificial insemination (A.l.)
organizations in the United States (Pelissier,1972). Records
from the A.I. Centre (Trinidad) indicated that the average
first service conception rates for the bulls were 66% in
1969 and 69% up to May 1971. Artificial insemination data
are reported in terms of 60 to 90 day non-return rate.
Although the majority of the conceptions in this study was
based on actual calvings the difference between conception
and non-return rate should be recognized since Graham (1968)
reported that an 18% 60 to 90 day non-return rate was
reported for buffer that contained no sperm, and that a 24%
rate was reported for semen that contained only dead sperme
b. Calving Interval
Calving Interval calculations were based on the period
between ca1vings. This is one measure of breeding efficiency,
a1though it cannot be used alone to describe a herdls
breeding efficiency because it does not account for cows
cu1led after failure to conceive. According to Speicher
and Meadows, (1967) a twelve-month ca1ving interval is
desirable and economica1ly justified by greater return over
feed cost than with longer intervals.
If a twe1ve-month calving interval is idea1, a cow

80
must conceive by 90 days atter calving. Touchberry ~ al.
(1959) ca1culated that with 60% tirst service conception,
a herd would need a service interval of 47 to 60 days to
maintain a 365-day ca1ving interva1. Tables 5. 6 and 7
show that only herds H. K and G (27%) of the Quebee Herds
and only 9 and Il (6.7%) of the Trinidad Herds would
qua1ify in this category. with herds A, D and J (Quebec) and
7 and 21 (Trinidad) being borderline. Speicher and Meadows
(1967) conc1uded that delay in conception beyond 86 and up
to 116 days after freshening reduced milk and calf returns
over feed cost an average of $.50 for each day beyond 86
days. When conception was delayed 117 days or longer,
returns were decreased by $.78 for each day beyond 86 days.
Louca and Legates (1967) reported a more modest loss of
%.50 in milk and calf loss for each excessive day open.
Pe1issier (1972) considered a 108s of $.70 per day in excess
of a year1y calving interval as a reasonab1e adjustment of
the two former reports to current market priees.
When one considers the additional expenses for
replacement cost, additional breeding costs and veterinary
services and Medication it would seem that when the
consequences of low fertility are translated into economic
terms the magnitude of this problem can be tremendous.
Viewed in this light, then 45% of the Quebec herds (calving
interva1 over 400 days) are losing a tidy suro annual1y. The
picture for Trinidad is of a greater significance since 70%

81
of the herds and both Government herds have calving intervals
exceeding 400 days. In fact the very survival of herds 3, 19
and 30 with calving interva1s exceeding SOO days and herd 18
with calving interva1 of 483 days with a high Standard Error
of SO days, seem to be in jeopardy. Several authors have
stressed the importance of proper heat detection. Johnson
(1966) reported that difficulty in detecting heat is a
common cause of long ca1ving intervals. He indicated that
heat detection can be improved by proper training and more
careful observation. Johnson and Ulberg (1967) compared the
reprOduction efficiency of seven herds and found that days
lost per cow-year due to missed heats ranged from 9 to 38
days. Hall ~ Ai. (1959) found that 30% more ~eats were
detected by checking cows 4 times daily instead of twice.
Zemjanis ~~. (1969)proposed that only 10% of aIl anestrus
was due to disorders of the reprOductive tract. The remaining
90% was due to fai1ure to observe estrus, either from
inadequate observation or variations in intensity of estrous
symptoms.
Many dairymen attribute long calving intervals to
silent or short heat periods, and a few even maintain that
sorne cows just do not come in heat. A comparison of
individual herds shows that some dairymen are doing better
than others with heat detection and others might do better
if they tried harder. Such l believe would be the case
particularly with herds 3, 19 and 30 (Trinidad), for these

..' , \.
82
herds support the suspicion that these dairy farmers do not
give heat detection the concentration that is required.
c. Milk Production
Mean daily production for Quebec, Trinidad, and the
Trinidad Government herds are shown in Tables 5, 6 and 7.
With the exception of herd l (Quebec), it would appear that
the higher producing herds have longer calving intervals
than the lower producing ones. However, in the Trinidad
herds there is no particular trend shown. In rnany cases the
lower producing herds have longer calving intervals than
the higher producing ones. In the Government herds, the
hjgher producing Purebred Holstein he rd (9.6 :t 0.4 kg/day)
has a 53 day longer calving interval than the Crossbred
Holstein/Zebu herd (7.9 :t 0.4 kg/day).
The results of this study indicate that lactation
seern to have no effect on services per conception in any of
the herds.
Reports on the effects of lactation on fertility
have been inconsistent. Eckles (1929) and Currie (1956)
found that lactation had no effect on reproduction. However,
Lewis and Horwood (1950), Mc Taggart (1961), Steele et al.
(1967), and Varejcko (1968) have indicated that lactation
is a contributing factor to herd infertility. Lewis and
Horwood (1950) found that average calving interval has been
longer for Holsteins than for other breeds. They suggested

83
that the greater average production level May be responsible
for this difference.
2. Blood Components
The variability of bovine blood cellular components
May be attributed to breed, age, general environment, diet,
production level, and subclinical infections. Factors such
as method and precision of determination, time of day of
collection, and muscular activity have some bearing on the
ultimate values deriv.ed (Wood and Kramer,1968).
Analyses in this study were restricted to serum,
calcium, serum inorganic phosphorous and Hematocrit (Packed
Cell Volume) with the main interest being centered on blood
inorganic phosphorous levels on account of low levels being
widely associated by several authors with a decrease in
conception.
a. Serum Calcium
Serum Calcium values for each herd were well within
the established range with relatively small variations in
Standard Error among the herds in various environments
(Tables 8, 9 and 10). However, values for herds A and C
(Quebec) of 12.4 + 0.2 and 12.5 ± 0.3 mg/100 ml were slightly
above the higher range and these could be attributed to the
higher concentrations of calcium in the feed supplied. This
is borne out by Table Il, where the estimated intake of
calcium per cow per day was 147 and 215 g respectively.

Table 8. Mean Concentration of B100d Components in Cows (Quebec Herds).
Herd No. No. of AnimaIs Serum Serum
Normal A B
C
D
E
F
G
H
l
J
K
Dairy breeds 10 13 10
9 10 10 10 10 10 10 10
(Range)
Calcium Inorganic mg/100 ml Ph ..... os.p horous
mg/100 ml 1 2 9.4 - 12.2 4.0 - 6.0
4 12.4 ± 0.2 Il • .5 + 0.2 12 • .5 ± 0.3 10.4 + 0.2 9.6 ± 0.2
10.0 ± 0.1 10.2 ± 0.2 10.4 ± 0.2 10.6 ± 0.1 10.2 ± 0.2 10.3 + 0.2
4.6 ± 0.3 .5.4 + 0.2 .5.1 + 0.2 .5.2 ± 0.2 .5 • .5 ± 0.4 .5.9 ± 0.2 .5.4 + 0.2 .5.3 + 0.3 4 • .5 ± 0.2 6,2 ± 0.2 .5.2 + 0.2
CalP Ratio
2.8 + 0.2 2.1 + 0.8 2.4 ± 0.9 2.0 ± 0.8 1.8 ± 0.1 1.7 + 0.1 1.9 ± 0.8 2.0 + 0.2 2.3 + 0.9 1.6 + 0.7 1.9 + 0.7
Hematocrit (PCV)
% volume
24 - 463
27.3 ± 0.3 32.9 + 0.9 32.6 + 0.6 33.2 + 0.1 32.2 + 0.9 30.8 + 0.6 32.1 + 0.9 29.8 ± 0.1 32.9 + 0 • .5 2.5.3 :!:. 0.4 32.8 + 0.9
1Benjamin, M. Out1ine of Veterinary C1inica1 Patho1ogy. Iowa State University Press, Ames, Iowa. 1965.
2Nutrient Requirements of Dairy Catt1e, fourth revised edition, 1971 National Academy of Sciences.
3Scha1m, O.W. Veterinary Hemato1ogy. Second Edition 196.5. Lea & Febiger, Phil. 4Va1ues are means ± S.E. for number of animaIs invo1ved.
<Xl -1="
:...1

/....-- ...
1
Table 9. Mean C9ncentration of Blood Components in Cows (Trinidad Herds).
Herd No. No. of AnimaIs Serum Serum CalP Hematocrit Calcium Inorganic Ratio (PCV)
mg/lOO ml Ph~horous % volume m 100 ml
Dairy breeds (Range) 1 2 24 - 463 Normal 9.4 - 12.2 4.0 - 6.0 21 4 6.8 ± 0.2 1.5 + 0.1 )0.1 + 0.7 1 10.6 ± 0.3
2 13 Il.0 :!: 0.4 7.5 + o.) 1.5 ± 0.1 27.2 ± 0.7 3 12 10.3 ± 0.4 6.3 ± 0.2 1.6 ± 0.1 28.6 ± 1.0 4 17 10.6 ± 0.3 6.0 ± 0.0 1.7 ± 0.0 27.9 ± 0.7 5 18 10.6 ± 0.3 7.2 ± 0.2 1.4 ± 0.0 28.4 + 0.6 6 13 Il.J ± 0.3 6.) + 0.2 107 ± 0.0 29.4 + 0.0 7 18 9.9 ± o.) 6.4 ± 0.1 1.5 ± 0.0 )0.8 ± 0.5 8 18 Il.4 ± 0.5 6.7 ± 0.2 1.7 ± 0.0 J2.2 ± 0.6 9 Il 10.0 + 0.5 6.9 ± 0.4 1.5 ± 0.1 30.2 ± 1.0
10 17 Il.0 ± 0.3 7.5 + 0.3 1.5 + 0.0 29.8 ± 0.6 Il 18 Il.9 ± 0.4 6.J ± 0.1 1.0 ± 0.0 32.7 ± 0.6 12 18 Il.0 ± 0.3 6.6 ± 0.2 107 ± 0.0 31.0 ± 0.5 13 12 Il.8 ± 0.0 6.6 ± o.) 1.7 ± 0.0 )1.1 + 0.9 14 16 10.9 ± O.) 7.7 ± 0.2 1.4 ± 0.0 )0.7 ± 0.8 15 14 Il.5 ± 0.5 7.9 ± O.) 1.5 ± 0.1 32.7 ± 0.7 16 16 Il.5 ± 0.4 7.5 ± 0.2 1.5 ± 0.0 31.3 ± 0.8 17 10 10.8 ± 0.4 6.4 ± 0.2 1.7 ± 0.1 28.3 + 1.0 co
\J\
J

Table 9 Cont'd.
Herd No. No. of Anima1s
18 10 19 6 20 15 21 12 22 17 23 9 24 17 25 12 26 16 27 14 28 12 29 14 30 11
Serum Calcium
mg/100 ml
11.0 + 0.4 11.3 ± 0.7 10.9 ± 0.4 10.9 ± 0.4 12.1 ± 0.3 11.2 ± 005 10.7 ± 0.4 11.3 + 0.5 11.7 ± 0.3 11.2 + 0.3 10.8 ± 0.5 10.5 ± 0.4
9.8 + 0.1
Serum Inorganic
Phos'phorous m.gf100 ml 5.9 ± 0.2 5.9 ± 0.4·:~ 5.7 ± 0.2 5.6 ± 0.2 6.8 ± 0.2 5.9 ± 0.1 6.9 ± 0.2 5.9 ± 0.2 5.9 ± 0.3 6.2 + 0.1 5.6 ± 0.2 5.9 + 0.2 6.9 + 0.3
CalP Ratio
1.9 + 0.1 1.9 ± 0.0 1.9 + 0.1 1.9 ± 0.0 1.8 ± 0.0 1.8 ± 0.7 1.3 ± 0.1 1.9 ± 0.1 1.9 ± 0.9 1.8 ± 0.1 1.9 + 0.1 1.8 + 0.1 1.4 ± 0.1
Hematocrit (PCV)
% volume
27.8 + 0.6 25.8 ± 1.1 25.9 ± 0.9 31.6 + 0.6 29.5 + 0.7 29.1 + 0.8 30.9 + 1.0 32.6 ± 0 • .5 31.1 :t 0.7 29.4 + 1.0 31.1 + 0.8 29.7 ± 0.7 30.7 ± 0.7
1Benjamin, M. Out1ine of Veterinary C1inica1 Patho1ogy. Iowa State University Press, Ames, Iowa. 1965.
2Nutrient Requirements of Dairy Catt1e, fourth revised edition, 1971 National Academy of Sciences.
3Schalm, O.W. Veterinary Hemato1ogy. Second Edition 196.5. Lea & Febiger, Phil.
4Values are means + S.E. for number of animals involved.
CP 0\
,-1

....... -., ( ~ ,"'-'
Table 10. Mean Concentration of Blood Components in Cows (Government Herds, Centeno Trinidad).
Herd No. No. of AnimaIs Serum Serum CalP Calcium Inorganic Ratio
mg/lOO ml Ph~horous m 100 ml
Normal Dairy breeds (Range) 9.4 - 12.2 1 4.0 - 6.0 2
Purebred 47 Il.2 ± 0.2 Holstein
4 6.1 + 0.1 1.8 ± 0
Crossbred 107 Il.6 ± 0.2 6.3 ± 0.1 1.8 + 0 Holstein! -Zebu
lBenjamin, M. Outline of Veterinary C1inica1 Pathology. Iowa State University Press, Ames, Iowa. 1965.
2Nutrient Requirements of Dairy Catt1e, fourth revised edition, 1971 National Academyof Sciences.
Hematocrit (PCV)
% volume
24 - 463
30.2 ± 0.5
35.2 ± 0.4
3Schalm, O.W. Veterinary Hemato1ogy. Second Edition 1965. Lea & Febiger, Phil.
4Values are means ± S.E. for number of animaIs involved.
co ~
J

88
Herds E, 9.6 + 0.2 (Quebec) and 7, 9.9 + 0.3 and 30, - -9.8 + 0.1 mg/100 ml (Trinidad) fall closely to the lower
value of the range. Their estimated calcium intakes
(Table Il) of 116, 67 and 8S g per day respectively seem
quite adequate, therefore these low serum calcium values
might be due to a combination of factors since the time of
day of collection from each herd was not standardized.
There is 1ess variation among the Trinidad herds than
among the Quebec herds (Tables 8, 9 and 10) and this could
be due to the wide variation of roughage and grains grown
on Quebec Farms as compared to the almost constant pastures
of pangola grass and mixed concentrate fed to the Trinidad
Herds.
b. Serum Inorganic Phosphorous
Previously published reports indicated that drop in
blood phosphorous leve1 occurred before any outward c1inical
signs of phosphorous deficiency deve10ped (Theiler ~ al., 1927,
Malan et gl., 1928). Palmer and Eckles (1927) reported that
the blood phosphorous level in animaIs on a deficient diet
varied from 1.07 mg/lOO ml to 6.S6 mg/lOO ml, depending on
the degree of phosphorous deficiency. In another deficiency
study, heifers fed bone mea1 had b100d phosphorous·levels of
S.O mg/lOO ml, whereas the 1evel in the control group was
2.3 mg/lOO ml(Ma.1an et al., 1928).
More recently, Snook 1(1964) observed low conception

.89
rates in high producing dairy cows associated with low blood
phosphorous concentrations. Morrow (1969) observed that
heifers with low blood phosphorous levels ).9 mg/100 ml showed
signs of rough coat, chewing on wood, and infertility as
indicated by the need for repeated', .. breedings. When the
blood phosphorous levels were increased to 6.6 mg/100 ~l
fertility improved from 2.8 services per conception to 1.)
services per conception.
Mean blood phosphorous levels are shown in Tables
8, 9 and 10. Again like in the serum calcium values, all
herds from Quebec fall weIl within the established range with
herds A, 4.6 ± O.) mg/100 ml and l, 4.5 ± 0.2 mg/lOO ml
hovering towards the lower range. Although Herd l among the
Quebec herds, exhibited the greatest tendency towards
infertility ().2 ± 0.9 services per conception), its average
of 4.5 ± 0.2 mg/lOO ml coincides with the 4.5 mg/100 ml
considered by Hignett, as reported by Munro (1957), as
adequate for high fertility. Herd Ais fertility i8 relatively
high having 1.7 ±:O.) services per conception and )87 ± 12.2
days calving interval.
The me ans for serum inorganic phosphorous are higher
in practically aIl instances in the Trinidad herds (Tables 9
and 10) than in the Quebec herds (Table 8). This is unusual
when a comparison is made of the estimated p~osphorous intake
on Tables Il, 12 and 1) and from the fact that very little
mineraI supplement is fed in Trinidad, except for blocks of

90
Cobalt-Iodized Salt. In fact sorne of the means are higher
than the higher range and sorne values are closer to those of
yearling heifers 6-8 mg/100 ml (Morrow,1969). However,
these values are lower than those for the Government herds
of 17.2 ± 0.5 mg/lOO ml and 18.2 ± 0.3 mg/100 ml for the
Crossbred Holstein and Purebred Holstein herd found by
Davidson (1970). These values were also comparable with
those of Rusoff ~ âl. (1955) of 4.61 to 7.24 mg/100 for
Jersey and Crossbred heifers, with that of Lane et al. (1968),
mean for Guernsey cows of 6.1 mg/100 ml, and with Steevens
~~. (1971), mean for 27 HOlsteins, 15 Ayrshires and 6
Guernsey cows of 6.3 mg/lOO ml which increased to 7.5 mg/100 ml
when 0.6% phosphorous was fed.
Changes in blood constituents have been suggested as
measures of adaptability. Reports by Blincoe and Brody
(1951) and Rusoff et gl. (1951) indicate that high hemoglobin
values are associated with high adaptability to extreme
conditions of temperature. This was also true for specifie
gravit y, plasma inorganic phosphorous and hematocrit levels.
Blincoe and Brody also reported no obvious changes in blood
composition until 650 F and above when there is a marked
reduction in ascorbic acid and cholesterol levels. These
changes were associated with reduced feed intake. Tables
12 and 13 indicate a lower feed intake in the Trinidad animaIs
than in those in Quebec (Table Il), and since the Purebred

91
Holstein animaIs were initially imported into Trinidad from
Canada, the higher atmospheric temperatures and the lower
feed intake may account for the higher serum inorganic
phosphorous levels.
The mean values of 6.3 ± 0.1 mg/lOO ml for the Crossbred
HOlstein/Zebu cows are also comparable with those of Rusoff
et al. (1955) for Crossbred Jersey cows.
c. CalP Ratio
The CalP ratio was calculated from values of serum
calcium and serum inorganic phosphorous in each herd. Tables
8, 9 and la outline the respective values. Since the widely
recommended ratio is III or 211 or as close as possible to
these ratios only herds A, 2.8 ± 0.2, C, 2.4 ± 0~9 and l,
2.3 + 0.9 to 1 (Quebec, Table 8) can be considered as
falling above the normal. Whether this ratio has any effect
on the low fertility of herds C and l is not clear since herd
A has a high fertility (Table 5) and their ratio do not vary
very widely.
With the exception of herds 22 and 26 with relatively
high Standard Errors, aIl the Trinidad herds along with the
Governrnent herds, are weIl within the recommended ratios
(Tables 9 and 10).
d. Hematocrit (Packed Cell Volume)
In most tropical environrnents blood parasitism and

92
subclinical infections are numerous and impose a tremendous
stress which can increase variability of blood determinations.
Schalm (1965) considered that the differences in red cell
number of cattle as reported from different regions of the
world are of such magnitud~ as to suggest that breed, climate
and level of nutrition May have a significant influence on
red cell number and size in the cow.
In Tables 8, 9 and 10 are set out values for mean
Hematocrit. AlI herds fall within the normal range of
24 -46% volume (Schalm,1965). V~lues, in the main, also
compare with means for Holstein cows of 31.32% PCV reported
by Ferguson (1937). Herds A and J (Quebec) 27.3 ± 0.3% and
25.3 + 0.4% respectively, fall close to the lower range.
The significance of this is not clear but May suggest sorne
form of infection with internaI parasites.
In the Trinidad group (Table 9), herds 2, 3, 4, 5 and
17, 18, 19 and 20 are aIl close to the lower range. Trinidad
is infested with Boophilus ticks and introduced cattle have
suffered an illness characterised by fever, anaemia, jaundice
and sometimes death, occurring about two to six weeks after
the animaIs were put on tick infested pasture. Both bovine
babesiasis and bovine anaplasmosis have been recorded in
Trinidad, and Boophilus ticks are reported vectors of both.
Indeed, both disease May occur simultaneously in the same
animal (Williams and Gonzale~ 1968).
At the time of visit Many of the cows in herds

l . \ ' \. "
93
4, 18, 19 and 20 were covered with a certain amount of ticks.
Further Dr. Clive R. Ali (personal communication) has
isolated Coccidiosis, Haemonchus contortus and Trichostrongylus
axei from Many of these herds so that both external and
internaI parasites May account for the low hematocrit values.
Similar low values of mean 28.65% and range 19.0 - 33.0% were
reported for Holstein-Friesian in Nigeria (Wood and Kramer,
1968). These workers attributed this to the known incidence
of acute trypanosomiasis among sorne of the cattle, possible
effect of other subclinical blood parasitism, and to ehronic
and insidious form of trypanosomiasis which is not easily
recognised clinically, and irrespective of nutrition, tends
to alter the normal blood picture.
The Mean hematocrit value of 35.2 ± 0.4% PCV for the
Government Crossbred Holsteiq/Zebu herd is higher than for
aIl Holstein herds. This value is comparable to those for
N'Dama and Muturu of 36.00% and 36.2% PCV (reported from
Nigeria by Wood and Krame~ 1968); and earlier for Jersey-Red
Sindhi crosses by Rusoff et al. (1955). Blincoe and Brody
(1951) similarly reported higher hematocrit values in Brahman
(Indian evolved) than in Brown Swiss (European evolved)
cattle.
3. Feed Intake
a. Chemical Composition
In Appendix Tables l, 2 and 3 are set out details of
94
chemi.cal composition of aIl feeds examined on the Quebec
Farms. Comparison of these figures with analytical values
for similar feeds set out in Feeds and Feeding (Morrison,1959)
and Nutrient Requirements of Dairy Cattle, National Academy
of Sciences (1971) shows small variations anly. It is thus
presumed that digestibilit~es will also be similar.
For Trinidad, Appendix Table 4 shows the Chemical
composition of the Commercial Dairy Ration mixtures. Rations
l, 2, J and 4 were each prepared by a different Feed Company.
When compared to the Standard Formulation (Table 2) one can
observe the variations, and there are even some variations
among Company's preparation. The high cellulose content of
Ration No. 4 suggest that this Company is not using the
ingredients as specified in the Standard Formulation. In
fact there were visible indications that this ration contained
pea hulls which are known to be very high in cellulose content
(Appendix Table 4). The high cellulose content will no doubt
de crea se the digestibility of the feedstuff.
Since these feed companies are not required by law in
Trinidad to declare, at least maximum and minimum guarantees
of nutrient levels, there is always the possibility that sorne
entrepreneurs are going to take undue advantage of such a
situation. Chemical analyses for citrus pulp and coconut
meal are comparable with values reported by Creek (1967) and
by Devendr,a and Gohl (1970).
Appendix Tables 6 and 7 outline the Chemical Composition
, .... .1
l

95
for pangola and napier grass respective1y. There are no
known recorded tables of composition for Caribbean feedstuffs
so that values are compared with other published data.
Dry Matter values for pango1a grass are variable and
reflect the trend observed by other workers of increasing
dry matter with increasing maturity and decreasing crude
protein content (Butterworth ~ !!., 1961; Vicente-Chandler
~ ~., 1964; Grieve and Osbourr, 1965). The range in NVI
values from 24.1 to 37.4 are comparable to those of Grieve
and Osbourn (1965), Minson and Milford (1966), and Quintyne
(1972), at similar stages of maturity. There is a wide range
of crude protein from 7.6 to 18.8% depending on the stage of
maturity and the level of management. These values are
comparable with, and reflect the same trend of 5 to 8%
increasing to 18-20%, observed in Jamaica by Creek (1967)
and by Many other workers (Butterworth, 1961; Butterworth
et gl., 1961; Vicente-Chandler et ~., 1964; Grieve and
Osbourn, 1965; Gomide ~ gl., 1969; Devendra and Gohl, 1970).
Cellulose content was simi1ar to values reported by Gomide
~ gl. (1969) and Quintyne (1972). The mineraIs, calcium and
phosphorous, although there were slight variations, were
comparable to those of Vicente-Chandler ~ al. (1964) and
Gomide ~ §l. (1969).
Chemical composition for napier grass was comparable
to values reported by Vicente-Chandler ~ gl. (1964); Gomide
et gl. (1969), and Devendra and Gohl (1970). Where the major

(
elements of nutrition are adequate for health and production,
it is cornrnonly accepted that the amounts are sufficient to
maintain normal reproductive processes of early pregnancy.
b. Energy
In young animaIs, an insufficient supply of energy
results in retarded growth and delay in the onset of puberty;
in mature dairy cattle, it results in decline in milk yield
and loss of body weight while a prolonged and severe energy
deficiency May depress reproduction.
Tables Il, 12 and 13 outline the estimated daily net
energy intake whereas Tables 14, 15 and 16 show requirements.
(based on Nutrient Re~uirements of Dairy Cattle 1971,
Appendix Table 8) and the differences in intake for the Quebec,
the Trinidad herds and the Government herds respectively.
With the exception of herds C and G (Quebec), aIl herds are
receiving less than their requirements, whereas Herd l is
receiving just slightly above one-half (Table 14). Whether
the apparent herd infertility in Herd l can be ascribed to
insufficiency in ration is not clear since Herds A, F and K
of high fertility are also in negative energy balance. Herd
l May not always be in low energy intake since intakes were
based on winter feeding and not on the summer pasture periode
Generally the high producing dairy cow in the first
month or two of lactation is a special case of undernutrition
as she is usually in negative energy balance even when

(r "'
Table Il.
Herd No. No.
A 9 B 9 C 10 D 8 E 9 F 10 G 7 H 9 l 6 J 6 K 7
, "
Mean Body Weight, Dai1y Production and Estimated Dai1y Feed Intake. (Quebec Herds).
Body Dai1y EstimatedP-eed Intake Weight Production ENE Protein Ca P CalP
(kg) (kg) (Meal) (kg) (g) (g) Ratio
560.9 17.9 17.9 2.8 147 97 1·5 602.7 18.2 19.9 2.9 118 101 1.1 620.5 18.0 26.3 3.2 215 91 2.4 503.6 14.9 16.3 2.3 125 56 2·3 577.3 17.3 18.4 2.7 116 49 2.4 560.9 16.6 16.7 2.2 93 75 1.3 550.5 15.3 20.4 2.5 192 53 3.7 493.6 15.3 15.9 2.1 102 74 1.4 525.9 12.1 9.7 1.4 87 50 1.8 528.6 13.4 16.9 2.1 86 63 1.4 558.6 13.9 16.9 2.1 69 93 0.8
Il''-~
\0 '1
..J

Table 12. Mèan Body Weight. Dai1y Production and Estimated Dai1y Feed Intake. (Trinidad Herds).
Body Dai1y Estimated Fee~d~lntaKe Herd No. Weight Production ENE Protein Ca P Ca,P No,; (kg) (kg) (Meal) (kg) (g) (g) Ratio
1 18 450.9 10.5 10.5 1.9 91 56 1.6 2 12 444.5 8.1 10.8 2.5 68 67 1.0 3 Il 430.9 7.7 10-7 2.0 83 45 1.8 4 13 457.3 9.5 Il.2 2.1 78 43 109 5 13 436.4 7.6 9.7 2.2 62 55 1.1 6 10 460.0 7.4 9.4 1.6 48 43 1.1 7 15 442.3 9.5 9-7 1.6 67 63 1.1 8 13 478.6 10.1 Il.5 2.3 60 68 0.9 9 9 447.3 7.8 9.6 1.3 53 49 1.1
10 17 486.4 8.2 1.0 41 29 1.4 Il 13 510.5 8.3 10.0 1.3 55 54 1.0 12 18 489.1 8.9 1.2 43 38 1.1 13 12 431.8 8.5 1.6 38 31 1.2 14 13 487.3 10.3 10.5 1.4 75 38 2.1 15 14 514.1 10.5 1.3 21 21 1.0 16 16 467.3 8.4 1.6 21 21 1.0
\0 OJ
., -.. ~

Table 12 Cont'd.
Body Dai1y Herd No. Weight Production ENE No. {kgl {kgl {lVIca1l
17 8 458.6 6.5 8.6 18 10 436.8 5.8 9.9 19 7 454.1 7.0 10.1 20 13 433.6 7.2 8.3 21 7 46.5 • .5 10.7 10.8 22 Il 47.5.5 10.1 11.1 23 11 465.0 8.3 10.9 24 12 526.8 10.0 Il.6 25 11 490.0 10.1 10.2 26 8 515.5 10.0 10.6 27 Il 448.6 9.2 9·3 28 Il 527.; 10.; 12.7 29 1; 4;9.1 9.1 9.6 30 10 462.7 8.2 10.9
Estimated Feed Intake I:'rotein Ca P
'kgl (g) Cf;)
1.2 76 33 1.8 67 31 1.9 70 43 1.2 64 34 1.7 71 .54 1.7 88 .56 2.4 68 63 2.1 .59 73 1.9 75 59 2.4 74 60 107 71 51 2.; 67 60 1.6 .56 .50 1.6 8.5 27
~-Ca:IP
Ratio
2.5 2.2 1.6 1.9 1.3 1.6 1.1 0.8 1.3 1.2 1.4 1.1 1.1 3.2
l'''''''''
'" '"
..J

Table 131 Mean Body Weight, Daily Production and Estimated Daily Feed Intake. (Government Herds, Centeno, Trinidad).
Body Daily .. -- U __ -EsTimàt-ed Feed Intake
r
Herd No. No. of Weight Production ENE Protein Ca PCalP Obs • (kg) (kg) (Meal) (kgL----.Jg) Cg) Ratio
P/bred Holstein Cows
P/bred Holstein Heifers
C/bred Holstein/Zebu Cows
C/bred Holstein/Zebu Heifers
29
16
35
67
603.9 9.6 14.7
466.8 9.4
489.5 7.9 10.6
431.8 8.1
3.1 110 85 1.3
2.0 45 33 1.4
1.9 63 54 1.2
1.3 27 23 1.3
1-' o o
.. -1

r
Table 14. Summary of Requirements and Differences in Feed Intake. (Quebec Herds).
Differences in Feea-lritake R:eguirements Herd· ENE Prote in Ca P ENE Prote in Ca P No. (Meal) (kg) (g) (g) (Mca1) (kg) (g) (g)
A 22.1 2.0 68 50 -4.2 +0.8 +79 +47 B 22.9 2.1 69 54 -3.0 +0.8 +49 +47 C 22.9 2.1 69 51 +3.4 +1.1 +146 +40 D 19.3 1.7 59 43 -3.0 +0.6 +66 +13 E 21.8 2.0 67 50 -3.4 +0.7 +49 -01 F 21.2 1.9 64 48 -4.5 +0.3 +26 +27 G 20.2 1.8 61 45 +0.2 +0-7 +131 +08 H 19.6 1.8 60 44 -3.7 +0.3 +42 +30 l 17.7 1.6 53 39 -8.0 -0.2 +34 +11 J 18.6 1.7 56 42 -1.7 +0.4 +30 +21 K 19.3 1.7 57 42 -2.4 +0.4 +12 +51
1-' o 1-'

1
Table 15. Summary of Requirements and Differences in Feed Intake. (Trinidad Herds).
Reguirements Differences in-Feed Intake Herd ENE Protein Ca P ENE Prote in Ca lio. (Mga1 ) (kg) (g) (g) 'Meal) 'kgl (gl 1 15.6 1.4 45 34 -5.1 +0.5 +46 2 13.9 1.2 39 29 -3.1 +1.3 +29 3 13.3 1.1 38 29 -2.6 +0.9 +45 4 14.9 1.3 43 32 -3.7 +0.8 +35 5 13.5 1.2 38 28 -3.8 +1.0 +24 6 13.4 1.2 37 28 -4.0 +0.6 +11 7 14.9 1.3 43 36 -5.2 +0.3 +24 8 16.0 1.5 46 34 -4.5 ±0.8 +14 9 13.7 1.2 38 29 -4.1 +0.1 +15
10 8.8 0.6 21 15 -0.6 +0.4 +20 Il 14.7 1.3 42 31 -4.7 0.0 +13 12 8.8 0.6 21 15 +0.1 +0.6 +22 13 8.3 0.6 18 14 +0.2 +1.0 +20 14 16.1 1.4 47 35 -5.6 0.0 +28 15 9.2 0-7 21 16 +1.3 +0.6 00 16 8.6 0.6 21 15 -0.2 +1.0 00
P 'gl +22 +38 +16 +11 +27 +15 +27 +34 +20 +14 +23 +17 +17 + 3 + 5 + 6 1-'
0 1\)
.J

~~-,
1 .
Table 15 Cont'd
Reguirements Herd ENE Protein Ca P No. (Meal) (kg) (g) (g)
17 12.8 1.1 )5 26 18 12-7 1.0 )) 25 19 1).1 1.1 )6 27 20 1).) 1.1 )7 28 21 15.7 1.) 46 )4 22 15.6 1.4 44 )) 2) 14.0 1.2 40 )0 24 16.2 1.4 46 )4 25 16.0 1.4 46 )4 26 16.1 1.4 46 34 27 15.2 1.) 42 )1 28 16.4 1.4 47 )5 29 14.6 1.2 42 )1 )0 14.0 1.2 )9 )0
"- ~
Differences in Feed Intake ENE Protein Ca
.. (M~.a.1.) ____ (k~l _lgL_
-4.2 +0.1 +41 -2.8 +0.8 +)4 -).0 +0.8 +)4 -5.0 +0.1 +27 -4.9 +0.4 +25 -4.5 +0.) +44 -).1 +1.2 +28 -4.6 +0.7 +1) -5.8 +0.5 +29 -5.5 +1.0 +28 -5.9 +0.4 +29 -).7 +0.9 +20 -5.0 +0.4 +14 -3.1 +0.4 +46
P (~d
+ 7 + 6 +16 + 6 +20 +2) +)) +)9 +25 +26 +20 +25 +19
- 3
/-
J-I o \..ù

~,
t
Table 16. Summary of Requirements and Differences in Feed Intake (Government Herds). Trinidad.
Reguirements Differences in Feed Intake Herd ENE Protein Ca P ENE Protein Ca P No. (Meal) (kg) (g) Cg) (Meal) (kg) (g) (g)
P/bred 16.9 1.5 47 45 -2.2 +1.6 +6; +40 Holstein Cows
P/bred 8.5 0.6 18 14 +0.9 +1.4 +27 +19 Holstein Heifers
C/bred 14.5 1.3 41 30 -3.9 +0.6 +22 +24 Holstein! Zebu Cows
C/bred 8.0 0.6 18 14 +0.1 +0.7 + 9 + 9 HOlstein/ Zebu Heifers
j-J
~
",
J

105
offered liberal amounts of an adequate diet.
The Committee Report on Pre-natal and Post-natal
mortality in cattle (1968) considered that lack of sufficient
energy is one of the most common forms of nutritional
infertility. Fuquay et!l. (1966) found that level of grain
feeding during the first half of lactation did not signifi
cantly alter days to first estrus, days open, or total
services for conception. Also, Lamb ~!!. (1965) observed
no difference in reproductive performance of dairy cows fed
alfalfa hay plus grain and those fed alfalfa hay only during
lactation.
However, Mc Clure (1961, 1965, 1970), Mc Taggart
(1961) and Mc Clure and Dowell (1969) observed infertility
syndromes in pasture-fed dairy cows'characterised by low
first service pregnancy rates. These were associated with
a loss of 10% live weight between parturition and mati~,
and low blood-glucose levels in the infertile cows at mating.
This syndrome occurred in herds grazing short, rapidly
growing pasture and has been ascribed to an energy deficiency
in the diet leading to hypoglycemia.
With the exception of herds 12, 13 and 15 and both
heifer groups in the Government herds, aIl the other herds
in the Government and Trinidad groups are in negative energy
balance (Tables 15 and 16). The effect of this energy
deficiency on the fertility of the animaIs is not clearcut
since herds of good fertility (Table 6) are also deficient

c···
(
106
in energy. However, herds 14, 19, 20, 24, 26, 28 and 29
of low fertility are in large energy deficit.
It is questionable whether animal requirements in
the temperate regions are applicable to animaIs in the
tropical regions. Considerable experimental evidence
available regarding the effect of the climaticenvironment
on feed intake of cattle, suggests that high ambient tempera
tures depress the feed intake of aIl types of cattle, but
that feed intake of ~ taurus is depressed at lower ambient
temperatures than is that of Bos indicus breed (Worstell and
Brody, 1953; Johnson et al.,1958; Johnson et al.,1960;
Johnston et al.,196la, b; Allen, Pan and Hayman,1963;
Randel and Rusoff, 1963).
The effect of high environmental temperatures on feed
intake is very pronounced. Ragsdale et al. (1948) showed
that the feed intake of Holstein and Jersey cattle virtually
stopped when temperature rose to 40.6°C (105°F), and Robinson
and Klemm (1953) stated that rumination in Illawarra Shorthorn
cows ceased at body temperatures above 40°C (104°F). Payne
and Hancock (1957) found, that feed intake among identical
twins divided between New Zealand (mean temperature
12.3°0 (54.2 0 F) and Fiji Mean temperature 24.4°C (76.00F), was
lower in the Fiji twins, the major difference being in hay
intake.
High humidity combined with high environmental
temperatures also seem to have a more depressing effect on

(
107
feed intake than when the humidity is low. Ragsdale ~ g!.
(1953) reported that increasing humidity at environmental
temperatures above 23.90 0 (750 F) depressed the feed intake
of HOlstein, Jersey, Brown Swiss and Brahman cattle, while
Johnson ~!l. (1963) have shown that lactating Holsteins
were managed at environmental temperature of 32.20 0 (900 F),
feed intake was normal when relative humidity was 20 per cent,
but when it rose to 40 per cent there was severe depression
in both dry matter and Total Digestible Nutrient intake.
Since the Mean temperature of Trinidad is relatively
high (Table 1) and humidity is always high, it would be
consistent to find Holstein animaIs in particular to show
reduced feed intake as compared to animaIs in a temperate
zone environment.
The actual energy status of the animaIs in the
Trinidad Herds is not quite clear since the calculations
have0been based on requirements for temperate-zone cattle.
There is a serious gap in the world literature on the nutrient
requirements of animaIs in tropical regions and one must
assume there is a real need for developing research groups
tà attack this problem.
If climate can affect the level of nutrient intake,
body temperature, and the general metabolic function of the
ruminant, it May also affect the efficiency of feed
utilization. The limited experimental evidence of the
overall effect of climatic environment on efficiency of

( !
108
feed utilization under controlled conditions suggest that
increasing ambient temperature decreases efficiency, though
under field conditions the difference may be insignificant
(Hancock and Payne, 1955, Payne and Hancock, 1957; Wayman
et al., 1962) 1>
Since herds 12, 13 and 15 (Trinidad) and the heifers
on the Government Station were meeting their estimated daily
intake from forage alone, this indicates that weIl managed
pangola grass can supplU adequate energy to at least meet
maintenance requirements of dairy animaIs.
Figures 2 and 3 show the variation in NVI (ENE) of
pangola and napier grass at different stages of maturity.
Since Nutritive Value Indices are based on voluntary intake
criteria, the data indicates that intake of pangola grass
May not be affected by stage of maturity although there is
a fairly good indication that napier grass intake is related
to maturity.
Many workàrs have indicated that there are many varied
and limiting factors particularly in the rainy season, which
prevent the actual intake of enough forage, although the
forage may be nutritionally adequate. Rose ~ âl. (1963)
found that when the dry matter content was as low as 11%
animals could not consume enough to meet maintenance
requirements. Morrison (1959) estimated that the normal
amount of pasture consumed by cows is 90 - 150 lbs
(40.9 - 68.2 kg). In order that Herds 2 and 30 with body

(\ " J
....... H
~
Figure 2. Re1ationship between ENE (NVI) and age of pango1a grasse
50
40
• • • - , .-• -• • 1 - 30 • • -• • Il:l -Z Il:l •
20
10
0 2 4 6 8 10 12
Stage of Maturity (Weeks)
109

'-
{
\.
Figure). Re1ationship between ENE (NVI) and age of Napier grasse
60
• 50
• 40
..- • H
~ • - • • )0
• I%l Z I%l
20
10
2 4 6 8 10 12
Stage of Maturi ty (Weeks)
110
.,.

(
III
weights of 444.5 kg and 462.7 kg respectivel~ shou1d meet
maintenance requirements they had to consume 89.1 kg and
92.7 kg respective1y of a 12% Dry Matter forage (Appendix
Table 6). So that gut fill May be a limiting factor to
intake of adequate energy for these herds.
Butterworth ~~. (1961), Mahadevan and Searle
(1968), and Davidson (1969) found that milk production in
the Caribbean increased in the dry season due to increased
dry matter of the forage, and Davidson attributed this to
the fact that grazing is usually stopped during heavy rain
falls so that energy intake is curtailed •.
Another factor that May depress intake is the increase
of parasitism during the rainy season. The presence of
large numbers of gastro-intestinal parasites affects nutrition
by depressing appetite and decreasing the digestibi1ity of
certain nutrients (Gibson, 1963).
c. Protein
A 1ack of dietary protein will depress the rate of
growth, maturation, and milk production in dairy cattle.
Gestation May be interrupted if the deficiency is severe.
In Quebec (Table 14) with the exception of Herd l,
aIl herds were receiving more than an adequate supply of
proteine The low protein intake of Herd l reflects the low
amounts of forage and concentrate offered by this farmer.
Whether the low energy and protein fed to this he rd contri-
l

\. butes to its higher infertility in aIl the Quebec herds
studied would need further investigation.
112
AlI the herds· under the Trinidad grouping (Tables 14
and 15) were receiving more than an adequate protein supply,
with herds Il and 14 just meeting requirements.
The crude protein content of grasses has long been
held to be a limiting factor in cattle production in tropical
areas. During the rainy season the crude protein content of
weIl managed pangola grass is relatively high, and is adequate
to meet maintenance requirements (Grieve and OSbourn, 1965)
and for maintenance plus a production of 3 gallons of milk
without supplementation (Butterworth ~ al.,196l). The
crude protein content of the pangola grass (Appendix Table 6)
was comparable to that reported by Butterworth et al. (1961)
and by Creek (1967).
It has been genera1ly assumed by some that intake of
dry matter is dependent upon the protein content of the
forage consumed. When the protein content declines, intake
will thus be reduced. Pasture feeding of dairy cattle
invo1ve conditions that MOst commonly produce nutrient
deficiencies of protein and energy. In Many parts of the
world these conditions are frequently aggravated by high
temperatures and deficiency of rainfa1l.
Many workers have reported that the crude protein
content of pangola grass decreases with maturity (Vicente
Chandler et a1.,1961; Chicco, 1962; Grieve and Osbourn, 1965;

113
Quintyne, 1972) and that in the dry season the protein
content is quite low so that supplementation is necessary
(Butterworth et al., 1961; Creek,1967; Devendra and
Gohl. 1970).
Generally the prote in intake in this study, with one
exception, was quite adequate. Reports of protein intake
affecting fertility involved cases of inadequate intake, and
these were mainly with beef animals (Howes et al., 1963.
Bedrak et al., 1964; Warnick et al., 1965). Sorenson et al.
(1959) reported that in dairy females there was little
evidence that ovarian function was adversely affected by
either under or over-feeding once puberty was reached.
However, Girou and Brochart (1970) observed a trend
of decreasing fertility in dairy cows when the protein supply
was excessive. These workers found that the threshold of
excess of digestible nitrogenous matters compatible with
normal fertilitywas situated between 200 and 300 gm per day.
d. Calcium
A great deal of work has been done on the establish
ment of the mineral requirement of cattle for maintenance of
health and production, and in many instances on the possible
requirements for reproduction. This is of paramount importance
since in many dairying countries most herds are fed directly
off the farm, and any mineral deficiency in the soil or
pastures may be reflected in the cows. The relation of soils
and forages to welfare of animals dependent on them has been
~-.
, 1
)
114
recognized since the days of Hogg, the Ettrick Shepherd
(1831) in the Cheviot Hills of Scotland, nearly a century
and a half ago.
Tables Il and 14 indicate that aIl the Quebec herds
were receiving more than·their requirements, wi~h Herds
A. C. D and G receiving more than twice their requirement.
This was consistent with Many reports that forages in
general, and legumes in particular, are comparatively high
in calcium. The latter farms were aIl feeding legume hays.
Within the Trinidad herds (Tables 12, 13, 15 and 16)
w.i th "the exception of herds 15 and 16 which were just
meeting their requirements. aIl other herds wereadequately
supplied, and some ev en receiving as much as twice their
requirements. The lower intakes by herds 15 and 16 are
a reflection of the forage since these animaIs are not yet
in production hence they receive very little concentrate.
However, during the dry season the intakes will be increased
when supplementation of citrus Meal, which is high in calcium,
is provided.
The lower intakes of calcium as compared to the
Quebec herds May be due exclusive1y to the fact that no
1egume forage is fed in Trinidad.
Calcium is the mineraI found in largest amounts in
the animal body and is in greatest demand during the growth
period. Authors have quoted varying feed contents as being
desirab1e and satisfactory. Theiler and Green (1932) found

115
that 0.42% of calcium in the diet was satisfactory; Fitch
~ al. (1932) found that the minimum requirement for
reproduction in dairy cattle was 0.18% of the total ration
on a dry matter basis. However, Converse (1954) found
that diets as low as 0.16% were capable of maintaining
health and functions of lactating animaIs. Meigs ~ ~.
(1935) suggested that 25 gm daily for Jersey cows producing
3,000 kg milk in a lactation might be inadequate.
Other reports have indicated that higher amounts of
calcium have increased reproductive performance. Rusoff
"(1950) found that administration of calcium in the form of
oyster shell flour reduced services per conception in dairy
cows from 3 to 6 to 1 to 2 and" animaIs experienced normal
births whereas in 1947 abortion rate was 50%,and 66% in 1948,
although the blood picture for calcium, plasma inorganic
phosphorous and hemoglobin was normal. Ward II al. (1971)
found that feeding dairy cows 200 gm of calcium versus
100 gm but maintaining approximately a 2 to 1 ratio, animaIs
on the former diet completed uterine involution eight days
sooner and that first ovulation occurred six days ear1ier.
Generally it hasbeen found that many cows, especially
those fed on legume forage, consume considerably mare calcium
than is necessary without harmful effects. However,
parturient paresis may result when calcium intake in milking
cows is low.
In this study aIl herds were meeting their calcium

116
requirements based on the Nutrient Requirements of Dairy
Cattle (1971) so it appears that there is no possibility
of lack of calcium in the diets.
e • Phosphorous
The phosphorous intakes and balances after require
ments are met, for aIl herds are outlined in Tables Il, 12,
lJ, 14, 15, and 16. In the Quebec herds (Table 14) cows in
Herd E are receiving 1 gm below their requirements, whereas
the other herds are aIl adequatley supplied, with herds
A, B, C and K considered as receiving liberal amounts. The
low intake by herd E is due to the low supply of phosphorous
in the silage supplied (Appendix Table 2). The situation
in this herd may be aggravated since this farmer usually
fortify his ration with a 17% calcium and J% phosphorous
mineraI mixture, eXhibiting a 6.1 calciumlphosphorous ratio.
Within the Trinidad and Government herds (Tables
15 and 16), and with the exception of herd No. JO, aIl
animaIs were qui te adequately,' supplied. The deficiency of
J gm per head in herd JO can be attributed to the fact that
this farmer feeds a mixture of citrus meal and pea hulls
which are quite low in both protein and phosphorous and high
in calcium (Appendix Table 4).
Phosphorous requirements for cattle have been studied
for many years and the data linking phosphorous with
infertility have been conflicting and somewhat confused.

( , ,
117
Theiler and Green (1932) associated phosphorous
deficiency with infertilitYJ and abnormalities in repro
ductive behaviour were reported by Eckles ~~. (1932,
1935) as due to phosphorous deficiency. Estrous abnormalities,
ovulatory abnormalities and difficult calvings were reported
by Palmer ~~. (1941), aphosphorosis was linked with
infertility by O'Moore (1950), and with infertility without
clinical symptoms by Hignett and Hignett (1951). Hignett
and Hignett (1952) suggested that for satisfactory fertility
heifers should receive a daily intake of about 50 gm of
phosphorous.
In contrast to Hignett's and Hignett's findings,
Littlejohn and Lewis (1960), obtained no difference in
fertility between animaIs given 2.0 and Il.4 gm P/lOO kg
body weight daily. Salisbury and Van Demark (1961) considered
limited phosphorous intake to probably be the most prevalent
mineraI deficiency affecting reproduction.
Snook (1964) reported a daily supplement of 20 gm
phosphorous produced a graduaI response in terms of increased
butterfat production and reduced calving interval over a
number of lactations. HOwever, his data do not permit an
evaluation of possible differences in feed intake following
supplementation.
Underwood (1966) has suggested that adverse effects
on estrus and conception are those of a specifie phosphorous
deficiency. More recently, Morrow (1969) reported a response

{ , ..
(
118
to phosphorous supplementation by heifers, whereby increasing
the blood phosphorous from 3.9 to 6.6 mg/lOO ml, reduced
services perconception from 2.8 to 1.3.
Since the successful completion of Many important
metabolic reactions depends on phosphorylation, the initial
and basic effect of phosphorous deficiency is a depression
of feed intake. Little (1970) reported that responses to
phosphorous supplementation in the field are invariably
confounded by, and indistinguishable from those due to
concomitant increases in intake. He further demonstrated a
linear response in the volun~ry intake of phosphorous
deficient cattle when these were given graded supplements of
phosphorous to a diet adequate in other respects. He also
observed that supplements of phosphorous to such animaIs do
not result in growth responses when increases in feed intake
are not permitted.
The results reported in this study indicate that
apart from herd E (Quebec) and herd 30 (Trinidad)j' aIl herds
would be receiving adequate allowances of phosphorous
according to suggested requirements in Nutrient Requirements
of Dairy Cattle (1971). The significance of the effect of
the low intakes of phosphorous on the infertility of these
herds (herd E, 420 + 20.1 days calving interval, and
2.0 ± 0.4 services per conception; and he rd 30, 506 ± 35.6
days calving interval, and 2.3 + 0.2 services per conception)
cannot be ascertained~ Further investigations would be

119
necessary into this aspect, particularly, in the severe
case as represented by herd JO.
f. CalciumlPhosphorous Ratio
Calcium and phosphorous metabolism are usually
considered together, because of their association in the
skeleton, which contains 99% of the total calcium in the
body, but only 80% of the total phosphorous (ARC 1965).
Hence it is believed that the utilization of phosphorous is
impaired when the ratio of calcium to phosphorous in the diet
varies widely from the commonly accepted optimum of 1-211.
The results of the calcium to phosphorous ratio
intakes for aIl herds are outlined in Tables Il, 12, and lJ.
Herds C, D, E and Gare above the ratio of 2.1 whereas herd
K is below 111. The higher phosphorous to calcium in herd K
is as a result of feeding a mixture of oats and barley which
were high in phosphorous (Appendix Table 1).
In the Trinidad herds, wi th the e:xception of herds
17 and JO, above 2.1 ratio, and herds 8 and 24 below 111, -
aIl other herds are very close to, or weIl within the
optimum ratio. The higher phosphorous content in the forage
of herds 8 and 24 (Appendix Table 6) can be due to a higher
concentration of phosphorous in the soil of these farms.
Herd 30 is fed high amounts of citrus pulp which is low in
phosphorous and high in calcium, which accounts for the high
calcium to phosphorous ratio of 3.2.1.

',,- ...
120
Great interest in the relationship between the
calciumlphosphorous ratio in the diet and fertility has
been shown for Many years. Reports in Many instances have
been inconsistent. Further importance has been attached
to vitamin D status of the animals since vitamin D assists
phosphorous absorption and utilisation.
Hignett and Hignett (1951) found that a high calcium
to phosphorous ratio depressed fertility of heifers when
phosphorous intake was low, but increased it when phosphorous
intake was high; but these effects were minimised when a
high vitamin D status was maintained (Hignett and Hignett,
1953).
O'Moore (1952) reported more severe signs of
aphosphorosis on farms where the pasture exhibited a high
calcium to phospho'i;Jous ratio, al though he recognised that
low vitamin D states could play a contributory role.
Support for this observation was made by Abrams .(1952) who
concluded that the evidence for hypovitaminosis D on growth
and reproduction was sound.
However, Littlejohn and Lewis (1960) found that ratios
between 0.8 and 12.1 and adequate vitamin D had no effect on
fertility. Growth rate was slightly depressed at the high
ratio when the intake was approximately 2.0 gm/100 kg.
More recently, Ward et al. (l971) observed that estrus
occurred earlier after parturition in cows which received
supplemental vitamin D with a calcium to phosphorous ratio
,.

121
of 2.1 than those not receiving vitamin D; and the interval
between parturition and subsequent conception averaged J7
days shorter for cows supplemented with vitamin D than for
those not receiving it.
Steevens ~ âl. (1971) found no significant difference
in reproductive performance between groups fed a Ga.p ratio
or J.l with 0.4 and 0.6% phosphorous respectively, and Ca.P
ratio of 1.5.1 with 0.6% phosphorousr but in the group with
the 0.4% phosphorous, the incidence of ovarian dysfunctions
was higher, and in addition, a larger number of services per
conception was required in the second breeding season.
The results from this study indicate that the majority
of the herds are weIl within the optimum ratio of 1-2.1.
Since the reports of the effects of varying calcium to
phosphorous ratios on fertility, have been so inconsistent,
the significance of herds with ratios outside of the accepted
optimum is not apparent.
Cows in the Quebec herd usually receive sun cured hays,
and during the Summer are exposed to enough sunlight, so that
there is no apparent danger of vitamin D deficiency. Under
Trinidad conditions it seems most unlikely that a deficiency
of vitamin D will ever be a problem of grazingcattle.

122
4. Simple correlations between services per conception and ca1ving interva1s with other parameters.
a. Age
The correlations between services per conception and
calving intervals and various parameters for each herd are
compared in Tables 17 and 18 for the Quebec and Trinidad
herds respectively.
With the exception of herds 18, 19 and 21 (Table 18)
there is no significant correlation between age and services
per conception and ca1ving intervals. The highly positive
significant corrêlation between services per·conception and
age in herds 19 and 21 indicates that as the animals get
older they require more services to conceive. This would be
in agreement with Davidson (1969) who found that within the
Crossbred Holstein herd at Centeno, over a period of 10
years, cows required2.5 services per conception whereas the
heifers required 1.9.
b. Body Weight
HerdsB (Table 17) 9 and 14 (Table 18) show significant
positive correlation between body weight and calving interval.
This would indicate that as body weight increases in these
herds calving interval increases. Herds 9, 10 and 14 show a
significant positive correlation between body weight and
services per conception so that an increase in body weight in
these animals would entail more services to conceive. However,

~-."
Table 17. Simple Correlations of Services per Conception and Calving Intervals with other Parameters (Quebec Herds).
Herd No. A HerdNo-. B ,- "-'Herd -No. C Variables Services Calving Services Calving Services Calving Compared per Interval per Interval per Interval
Conce:g:tion Conce:gtion Conce:gtion
Age -.41 -.;; .54 .45 -.14 -.25 Body Weight -.58 .05 .01 * .72 -.;1 -.19 Milk Prod. -.19 -.01 .;1 -.56 -.07 -.06 Lactation No. -.58 -.1; .59 .;4 -.20 -.26
tfl op s:: Q)
-.01 .05 s:: Ca 0
.2; .1; .28 -.26 El P .;9 -.22 -.09 -.24 .01 -.2; 0 CalP -.26 .23 :15 .24 .25 .IS 0
'CI Hematocrit .24 -.04 -.62 ** 0 .13 -.87 .;2 0 r-f !Xl
Q)
~ Crude Protein -.42 -.05 .;7 -.15 -.22 -.19 op s:: Ca -.37 .15 .17 .25 -.32 -.25 H
'CI P -.42 -.10 .27 -.46 -.19 -.04 Q)
.45 -.06 * .26 Q) CalP -.0; .70 -.09 lit
of! ENE -.47 .01 .27 .44 -.27 -.le J-I 1\)
rD P!I!
\...>
...J

',--"
............. , . \
Table 17 Cont'd
Hard No. D ------ -- n - --Hard -N~ -E-- Herd No. F Services Calving Services Calving Services Calving Variables
Compared per Interval per Interva1 per Interval ConceDti~~ _____ Conception Qo_ncention
Ul
~
Age Body Weight Milk Prod. Lactation No.
~ Ca o a P o o CalP 'g Hematocri t o
.-1 I:Q
Q)
'@ Crude Protein op s:: Ca H
'd P Q) :! CalP of! ENE Ul lïI
-.07 .23 .40
-.11
-.68* .09
-.32 .13
.46
.21
.43 -.49 ~43
-.07 .16
-.12 -.12
-.08 .14
-.17 -.32
.04
.02
.04
.05
.03
.49
.24
.63 *
.31
.. Il -.04 -.05
.24
.60
.69 *
.57 -.23
.59
.46
.16
.43
.22
-.12
.22
-.23 .07
.34
.50
.40 -.19
.41
.36 -.45
.63*
.34
.10
.24
-.17 -.18
.39
.53
.49 -.26
.02
-.37 -.51 -.45 -.49
.05
.03
.06
.45
-.57 -.45 -.39
.24
-.67 * 1-' N -t="
1
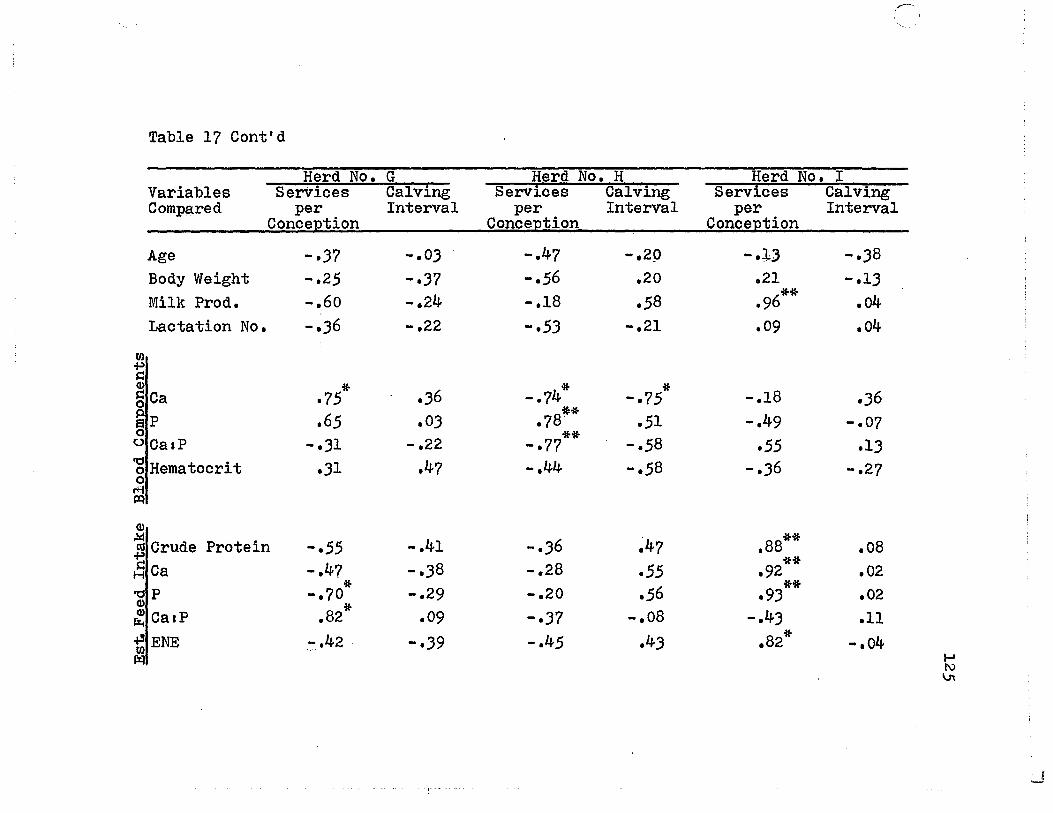
r·-·
Table 17 Cont'd
Herd No. G Herd No. H Herd No. l Variables Services Calving Services Calving Services Calvlng Compared per Interval per Interval per Interval
Conception ConceI!tion Conception
Age -.)7 -.0) -.47 -.29 -.l.3 -.)8 Body Weight -.25 -.)7 -.56 .20 .21 -.1) Milk Prod. -.60 -.24 -.18 .58 .9 6** .04 Lactation No. -.)6 -.22 -.5) -.21 .09 .04
(Il ~ ~ Q) * '* * ~ Ca .75 .)6 -.74 -.75 -.18 .)6 0
.78** aP .65 .0) .51 -.49 -.07 0 ** 0 CalP -.)1 -.22 -.77 -.58 .55 .1) '0 Hematocrit .)1 .47 -.44 -.58 -.)6 -.27 0 0
r+f ~
Q)
.!lcI Crude Protein -.55 -.41 -.)6 ~47 .88** .08 «1
~ ** ~ Ca -.47 -.)8 -.28 .55 .92 .02 H * .56 ** '0 P -.70 -.29 -.20 .9) .02
Q) * Q) CalP .82 .09 -.)7 -.08 -.4) .11 Ji:!
of.! .-.42 -.45 .4) * (Il
ENE -.)9 .82 -.04 r:q 1-'
!\)
\..n.
• ..1

1
\
Table 17 Cont'd.
Herd No. J Herd No. K Variables Services Calving Services Calving Compared per Interval per Interval
Conception Conception
Age .40 -.53 .45 .37 Body Weight .13 .48 .66 .08 Milk Prod. -.13 .56 -.43 -.39 Lactation No. .50 -.59 .47 .26
t/l op l=! ~ Ca .42 -.43 -.36 -.18 0
-.57 .02 .40 .02 a P 0 CalP .73 -.26 -.45 -.05 t)
rg Hematocrit .06 -.59 .69 . .33 0 M I.:Q
Q)
.!.:l • ~ Crude Protel.n -.10 .61 -.22 -.40 s:: Ca -.21 -.58 -.30 -.37 H
'd P -.10 .64 -.)7 -.28 Q) Q) CalP -.11 -.49 .44 .01 Ji:.t
.fl ENE -.08 .70 .06 . -.)0 1-' t/l N
I%.l Cl'.
* . Significant at P ~.05 **. .. . Sl.gnl.fl.cant at p,;<. 01
....... ' .. -J

,/
Table 18. Simple Correlations of Services per Conception and Calving Interva1s with other Parameters. (Trinidad Herds).
Meré'[ No. l Herd No. 2 Herd No. î Variables Services Ca1ving Services Ca1ving Services Ca1ving Compared per Interval per Interva1 per Interva1
QQDg ell:t ion Conce12tion Conce12tion
Age -.05 -.16 .30 .28 .52 .44 .26 * -.26 Body Weight .30 .67 .28 .20
Mi1k Prod. .66** .44 .41 .33 -.06 .05 Lactation No. -.25 -.28 -.05 -.44 -.39 -.13
(Il
1:1 * * Cl)
-.26 § Ca .41 .56 -.60 -.06 .09 El P .01 -.10 .45 .18 .32 .16 S CalP .23 .44 -.61 * -.18 -.26 -.09 "d Hematocrit -·30 -.23 -.23 -.34 -.06 .09 0 0
1"""1 !XI
Cl)
~ 6 ** * ** aS Crude Protein • a .50 .70 .37 -.20 .19 ~ Ca .74** .46* .45 .23 -.13 .17 H
* .42 "d P .50 .51 .31 -.52 -.11 Cl)
* Cl) CalP .31 .02 .01 -.20 .70 .44 J%..
...s ENE * .* .65* ·55 .47 .32 -.24 .19 1-'
(Il N P::1 -.,J
"
.. ~ "ï .. ..J

,0-" ,;-'
Table 18 Cont'd
Herd No. li Herd No. () Herd No. 2 Variables Services Calving Services Calving Services Calving Compared per Interval per Interval per Interval
Conception Conce}2tion Conce}2tion
Age .15 .16 -.19 .4) .07 -.24 Body Weight .21 .12 -.28 -.1) -.07 -.06 Mi1k Prod. .05 -.03 .20 8 ** • 1 -.14 -.26 Lactation No. -.16 -.11 -.)7 .22 -.24 -.48
tIl ~ s:: Q)
.40 -.14 6** s:: Ca œ)2 .05 .7 .)8 0
a P -051 -.45 .05 -.24 .)5 .40 0 * * 0 CalP .6) .6) -.10 .28 .58 .21 'tj Hematocrit -œ)9 -.)) -.18 .05 -.28 -.02 0 0 r-i f]:I
Q)
..!.:l Crude Protein .27 __ , .14 -.1) .24 -.02 «1 -.10 op
.64* t:i Ca -.04 -.21 .0) -.06 -.06 'tj P Q)
.29 .22 -.04 .64~ -.01 -.18 Q) CalP -.)8 -.40 .13 -.04 -.05 .42 lit
fS ENE .18 .09 -.17 .19 -.08 -.1) 1-' tIl p;:J l\)
CP
'. 1

,r_.-.
Table 18 Cont'd.
Herd No. 7 Herd No. 8 --~-~----~HeraN00
Variables Services Calving Services Calving Services Calving Compared per Interval per Interval per Interval
Conception Conception Conception
Age -.18 .00 .46 .10 -.14 -.19 . 4 8 ** 4* Body WeJ.ght .09 .0 .19 - .25 • 2 .7
Milk Prod. .48 .57* .52 .13 -.20 -.45 Lactation No. -.47 -.24 .39 .12
{/)
~ ~Ca .01 .04 -.24 -.19 -.19 .... 14 o aP .05 -.04 -.30 -.14 -.04 .... 23 SCalP .03 .12 -.08 -.09 -.05 .16
'g Hematocri t .09 .09 .01 - .02 - .39 - .33 o r-l Il:!
CI)
~Crude Protein .40 .40 .29 -.04 .59 .39 ~ ~ Ca .21 .39 .35 .14 .03 - .23 H * * 'tj P .59 .67 .41 .16 - .28 - .35 CI)
CI) Ca 1 P - .48 - .35 .12 .11 .53 .27 I%.t +' ENE .28 .25 .32 - .15 .54 .35 {/)
~ ~ 1\) ~
',,- -.

Table 18 Cont'd. --- ----- -- ----~
Herd No. 10 Herd No. Il Herd No. 12 Variables Services Calving Services Calving Services Calving Compared per Interval per Interval per Interval
Conception Conception Conception
Age .18 -.ll1! -.19 .07 Body Weight .49 * -.36 .16 .27 Milk Prod. .01 .68**
Lactation No. -.41 .09
CIl ~ ,:::
-.66** ~ Ca .16 - • .51 -.24 0
s P -.09 .02 .4.5 -.04 * 0 CalP .11 -.33 - • .56 -.16 0
"d Hematocrit .23 -.28 .06 .24 0 0 r-I I:Q
Q)
~ Crude Protein * -.14 al .13 -.21 • .5.5 ~ * .fi Ca .06 .04 • .59 -.07 "d P .11 .04 .64* -.20 Q) Q) CalP -.28 .02 -.18 .36 rz.. • ENE .24 -.28 .42 -.06 ...... ~
CIl \.,A)
~ 0
-l

...... ~ ....... '\ -', ."
Table 18 Cont'd •
Variables Compared
Herd No .13 HerdNo. -14 - Herd No. 15 Services Calving Services Calving Services Ca1ving
per Interval per Interval per Interval ConceptiQu_________ Conception Conception
Age Body Weight Milk Prod. Lactation No.
Ca
el P 0 CalP 0
'& Hematocrit 0 roi ~
(1)
~ l'tf Crude Protein ~ t:: Ca H
't:I P (1) (1) CalP lJ:i • ~ ENE (Il Il:l
-.48 -.04
.29
.07
.18 -.21
-.10 -.26 -.18 -.14 -.14
.42 .31 .42
.81** .71 ** .01 ** 4** .77 .7
-.09 -.24
.27 .00 .05
.19 .09 .40
.00 -.13 -.31 -.11 -.07 -.11
.88** 8 *'* • 3 .00
.88** 8 ** • 2 -.33 ** 8 ** .75 • 1 -.33
* -.33 -.54 .00 .89** .81** .01 1-'
\..> 1-' - ,
. ...1

r',
Table 18 Cont'd.
Herd No. lb Herd No. 12 Herd No. lB Variables Services Calving Services Calving Services Calving Cornpared per Interval per Interval per Interval
Conception Conception Conception
Age .40 .36 -.06 .60 * .18 Body Weight -.09 .11 -.32 -.53 -.13
* Milk Prod. .31 -.08 -.64 -.43 Lactation No. .00 -.47 .37 -.43
(/) op $:l
~ Ca -.16 .04 ·33 .07 .44 0 sP .04 .08 -.17 .02 -.01 0 CalP -.18 .03 .37 .07 .28 0
'0 Hernatocrit .35 .48 .40 -.45 -.37 0 0 ri p::j
Q) ,!4 Crude Protein ** as .00 .09 -.39 -.80 -·35 op * $:l Ca .00 .14 -.29 -.72 -.40 H
'd P Q)
.00 .24 ** -.?2 -.74 -.20 Q) CalP .00 -.35 -.02 .40 -.20 l'ti • ENE .00 -.76** op .15 -.30 -.29 (/)
r:iI ..... ~ l\)
'-1

, ............. ( . ,"
~,~ .. --
Table 18 Cont'd.
Herd No. 12 Herd No. 20 Herd No. 21 Variables Services Calving Services Calving Services Calving Compared per Interval per Interval per Interval
Conception Conception Conception
** .34 .14 Age .91 -.13 -.30 .13 Body Weight .01 .50 .21 -.05 -.44 -.40 Milk Prod. .01 -.17 .:37 .26 .02 .12 Lactation No. .33 -.03 -.39 -.10 .03 -.07 • tIl
~ * * Q.) -.24 ~ Ca ~.15 -.21 -.19 .72 .78
0
sP .54 .09 -.05 -.36 .29 .33 0 CalP -.50 -.33 -.17 -.03 .23 .25 0
'g Hematocri t -.20 " .36 -.28 -·33 .11 -.20 0 r-I çq
Q.)
~ Crude Protein -.04 .38 .32 .23 .06 .15 op
.1a .40 -.04 ~ Ca .22 .23 .07 H
'd P .03 -.07 .48 .33 .15 .23 Q.)
.44 -.46 Q.) CalP .34 -.40 -.21 -.15 P:.t • ENE .01 .42 op .30 .05 -.29 -.20 1-' tIl rx:I \".)
\".)
'-.
-,r

(' ., . \ ..--' , .
Table 18 Cont'd.
Herd No. 24 Herd No. 22 Herd No. 2J Variables Services Calving Services Calving Services Ca1ving Compared per Interva1 per Interva1 per Interval
Conception Conception Conception
Age .21 -.22 .86** .07 -.48 -.35 Body Weight .28 .36 .49 .07 .00 .05 Milk Prod. .47 .65 * .06 -.36 -.14 -.24 Lactation No. -.22 -.39 .39 -.45 * -.39 -.61
{Il f.l ~
~ Ca .47 .30 .27 -.17 -.21 .24 op .08 * -.09 .17 -.05 .37 .63 s 0 Ca .37 .10 .31 -.20 -.38 -.21 0
"d Hematocrit -.30 .18 .45 -.05 .41 .37 0 0 r-I ~
Q) ~ Crude Protein .40 .55 -.11 .31 -.05 -.06 CI1 f.l
.47 .64* ~ Ca .30 -.20 -.03 -.25 "d P .29 .49 .20 -.27 -.04 .01 Q)
.08 -.45 Q) CalP .2) .12 .20 -.02 r:r.. • ENE .39 .53 .45 -.01 -.05 -.04 op
{Il .... lïI \;IJ
~
j

~._-"
r '
Table 18 Cont'd.
Herd No. 25 Herd No. 20 Herd No. 21 Variables Services Ca1ving Services Ca1ving Services Ca1ving Compared per Interva1 per Interva1 per Interva1
Conception Conception ConceEtion
Age .25 .40 -.21 .05 .07 .37 Body Weight .35 .34 .46 .34 .38 -.31 Mi1k Prod. .32 .56 -.07 -.15 .28 -.08 Lactation No. -.03 -.39 -.33 -.01 .00 -.63 *
ID op s::: ~ Ca .15 .15 -.42 -.52 .00 -.45 op -.14 .40 ** -.17 .19 -.03 -.76 a 0 CalP .22 .21 -.41 -.63 .01 -.21 0
ro Hematocrit -.05 -.27 0
.09 .02 0.4 -.32 0 r-I J:Q
Q)
!!III Crude Protein .43 .49 .38 .22 .36 tG -.20 op s::: Ca .30 .55 -.11 -.22 .51 -.12 H
ro P .24 .53 .21 .05 .12 -.26 Q)
* Q) CalP .28 .28 -.45 ~ -.35 .70 .15 • op ENE .40 .52 .39 .26 .38 -.25 (Il
l':iI 1-' 'vJ \..Il

\ ;-' • 1
Table 18 Cont'd.
Herd No. 28 Herd No·. 22 Herd No. JO Variables Services Ca1ving Services Ca1ving Services Ca1vlng Compared per Interva1 per Interva1 peI' Interva1
Conception Conception Conception
Age .07 -.24 .47 .35 -.29 -.48 Body Weight -.42 .37: .45 .14 ** -.73 -.09 Mi1k Prod. -.12 -.17 -.12 .25 -.01 -.12 Lactation No. -.11 -.66 * .29 -.21 -.15 -.70 *
fil op ~
~ Ca .09 .14 -.03 -.19 .39 .37 0 * sP -.67 -.55 .12 .20 .32 -.40 0 * -.09 0 CalP .57 .50 -.19 -.22 .50
"I:j Hematocrit -.12 .45 .10 .09 .68* .04 0 0 r-I (l:I
CI> .!r4 -.47 -.47 * «S Crude Protein .20 .11 -.65 -.11 t= Ca -.32 -.01 -.26 .23 -.23 -.09 H
.16 -.25 .25 * .08 "I:j P -.39 -.59 CI> CI> CalP .30 -.31 .18 -.18 .43 -.21 I%i .., -.40 .26 -.41 * 1-' ENE .19 -.62 .13 fil \..ù l'ii 0'\
* Significant .at P L .05 ** .•
S ignificant a t P <.. .01
;..J

( .. - ,
1)7
in herd )0 there is a highly significant negative correlation
between body weight and services per conception, indicating
that as these animaIs decrease in body weight they required
more services to conceive.
Many dairy cows in their first month or two of
lactation are in a special case of undernutrition as they
are usually in negative energy balance even when offered
liberaJ. amounts of an adequate diet. When animaIs are
maintained on pasture a further complication arises, because,
although they May or May not be losing weight, they could be
on the border line of deficiency of any number of nutrients
from day to day (Lamond , 1970).
Under the section dealing with feed intake it was
pointed out that herd )0 was in negative energy and
phosphorous balance, and it also had an imbalanced calcium.
phosphorous ratio intake so that a combination of aIl these
deficiencies May be in part responsible for its infertility
prob1ems.
The significance of increase services per conception
with increasing body weight in herds 9, 10 and 14 is not
c1ear since it is inconceivab1e that the animaIs could be
becoming fat and so hindering conception.
c. Milk Production
In herds E, F and l (Quebec) there is a significant
correlation between services per conception and daily milk

138
production. The very high significance shown in herd l may
be reflected in the high negative energy and protein balance
observed (Table 14) so that if the animaIs continue to
produce reasonably weIl they would be drawing on body
reserves, thereby creating body conditions less than
favourable for high conception.
Herds 1 and 14 rank among the highest producers in
the Trinidad herds and the high correlation between production
and services per conception observed is in agreement with
Morrow ~ gl. (1966) and Davidson (1969). The findings of
Morrow ~ al. (1966),that selection for high milk production
also significantly increases the mean services per conception
and calving interval in the United states,can be applicable
to these herds,since under tropical conditions higher
producing dairy animaIs experience greater stress than low
producers.
The significant negative correlation between services
per conception and milk production observed in herd 18 may
indicate that there is an optimum level of production
compatible with high conception since herd 18 is the lowest
producer among aIl herds.
The significant positive correlation between calving
intervals and production level observed in herds 14 and 22
may also be.related to observations made by Morrow et al.
(1966), since these two herds are also in the highest

lJ9
producing groups. However, the relevance of such significance
shown by herds 5, 7 and Il is not clear since these herds are
among the lowest producers.
d. Lactation Sequence (Number)
There were no significant correlations between services
per conception and lactation sequence (number) in any of the
herds. However, there was a significant negative correlation
between lactation sequence and calving intervals observed in
herds 24, 27, 28 and JO (Table 18). This would indicate
that a shortening of the length of calving intervals would
increase thenumber of lactations in each herd. This would
be in keeping with accepted dairying principle. Table 6
shows the very long calving intervals associated with these
herds.
e. Blood Components
i. Serum Calcium
Comparing aIl herds, a negative but significant
correla.tion was observed between services per conception
and serum calcium level for Herds D and H (Table 17) and 2
(Table 18). Since the herds involved are weIl within the
accepted range for normal serum calcium levels (Tables 8 and 9)
these varying results May indicate that under the different
management regimes, each animal in each herd may possess its
own calcium serum level compatible with high fertility.

140
The close association between services per conception
and calving interval rnay be reflected in the sirnilar pattern
of a significant but negative correlation between calving
interval and serum calcium in herds H (Table 17) and Il
(Table 18) and in herds 1 and 21 (Table 18) with a significant
and positive correlation.
ii. Phosphorous
Within the Quebec herds (Table 17) with the exception
of herd H there are no significant correlations between
serum inorganic phosphorous and services per conception and
calving interval. The high correlations observed between blood
components and services per conception and calving interval
in herd H May be indicative of this herd possessing the
ideal calving interval of 367 days although an improvement
could be achieved in a better conception than the present
2.7 services (Table 5).
The trend observed in the Quebec herds was almost
identical for those in Trinidad. The only exception being
in herds 24 and 27 (Table 18) where a high positive and high
negative correlation respectively existed between serum
inorganic phosphorous and calving interval and in hérd 28
a high negative correlation existed between services per
conception and serum inorganic phosphorous.
Again these observations May be indicative of the
individual animal in each he rd possessing its own level

,,-._,'
141
of blood constituent compatible with conditions for optimum
conception.
iii. Hematocrit
With the exception of herds C (Table 17) and JO
Table (18) there is no significant correlation between
Hematocrit (Packed Cell VOlume) and services per conception.
The significance of the high negative correlation observed
in herd C indicates that as per cent volume of blood decreases
services per conception increase. The significance of the
relevance of the high positive correlation observed in herd
JO cannot be ascertained since PCV for herd JO is below the
normal Mean (Table 9).
There is no significant correlation between calving
interval and Hematocrit values.
f. Feed Intake
Of great importance is the high significant positive
correlation shown between protein, calcium, phosphorous and
energy intake with services per conception observed in Herd l
(Table 17). These results, if taken literally would be quite
misleading, since the indication would be that by increasing
the nutrients services per conception would also increase.
However, Table 14 shows that this herd is both in a negative
energy and protein balance. Of aIl the Quebec herds, Herd l
exhibits the MOSt services per conception (J.2 ± 0.9) ~nd
1

t ."
\ ... )
142
fairly long calving intervals (406 ± 15.4 days). One
possible interpretation is that the farmer is overfeeding
his high producing cows whereas the low producers are
underfed.
In herd G (Table 14) there is a high negative
correlation and a high positive correlation between phosphorous
intake and calciumlphosphorous ratio respectively, and services
per conception. This would be in agreement with Hignett and
Hignett (1952) and Steevens ~ âl. (1971) who found that a
larger number of services per conception was required when
the phosphorous intake was low.
Within the Trinidad group (Table 18) an almost
identical situation to that observed in Herd l (Quebec) exists
in herds 1 and 14. These two herds show a high significant
positive correlation between services per conception and
ca1ving interval and the intake of energy, protein, calcium
and phosphorous, the situation being more acute in herd 14~
An examination of Tables 6 and 14 indicates the infertility
prob1em of herd 14 and the deficiency in nutrients intake in
both herds. The positive correlation would indicate that as
nutrients intake increase there would be a concomitant
increase in inferti1ity problems - a MOSt unlikely situation.
A possible, but inconclusive explanation is that the ~armers
were overfeeding the high producing cows and underfeeding the
low producers.
The highly significant but negative correlation
Î

existing between protein, energy, calcium and phosphorous
and services per conception in herd 18, and the high negative
correlation between prote in, energy and phosphorous and
services per conception shown in herd 30 are indicative of
the close association between nutrition and reproduction.
An increase in the specifie nutrient status in each herd
will increase the fertility status by a reduction in services
per conception. This would be in keeping with numerous
reports from nutritionists and veterinarians (Morrow, 1969;
Olds, 1969; Boyd, 1970; Lamond, 1970).
5. Summary of Simple Correlations between services per conception and calving intervals with other parameters.
a. Quebec Herds
Table 19 outlines the summary of correlations between
services per conception and calving intervals with other
parameters by grouping aIl Quebec herds and aIl Trinidad
herds separately, so that herd effects are eliminated.
With the exception of a negative but lowsignificant
correlation between lactation sequence and calving interval
there are no significant relationships between any of the
other parameters and reproduction in the Quebec cows.
This significant association between lactation sequence and
calving interval seem to indicate that the younger animaIs
were giving more problems than older ones. Verification of
such an interpretation will need further investigation.
.t.

Table 19. Summary of simple Correlations of Services per Conception and Calving Intervals with other Parameters. (Quebec Herds merged, Trinidad Herds merged, and the Government Herds Centeno, Trinidad).
Government Herds Quebec Herds Trinidad Herds P!brecf-}{():Lstein Crossbred
Variables Compared
Sere Calv. Sere Calv. Sert Calv. Sere Calv. per Inter. per Inter. per Inter. per Inter.
Concep. Concep. Concep. ___ Collcep. -(112) (90) (90) (427) (28) (28) (47) (29) (29) (107) ()5) ()5)
** * ** * Age Body Wt.
.00
-.11 Milk Prod.Lact. No. -
CIl op
~ Ca §P {5 CalP o . '0 Hema' crl t g (PCV) r-! ~
Q)
-.0)
.06
-.05 .09
~Protein -.01 op r.::: Ca
H
'OP Q)
& CalP
+' ENE CIl
.02
.00
-.01
- .06
-.0)
-.18 .1)
-.0)
-.0)
.11 -.10 - .02
-.05 .02 .02
- .01
-.08 ~.
Numbers in parenthesis ~~ . ..
Slgnlflcant at P <.05 ~H.. .. < Slgnlflcant at P .01
-.18
.19 .18 .14 .16 .09 -.09 .28 -.07 .21 .)8
** * .18 .08 .06 .20 .04 .)6 .08
-.24*
.05
.04
.01
.01
.14
.16
.01
.09
.18
.02
.04· -.02 -.02
* .10 2 ** • 0 .10~·
.06
.21 ~.~.
.15 -.1)
.07
.08 -.00
-.10
-.02
~~
*
8** .1 -.00
.10
.10
.08 -.12
-.00 .01 .00
* -.12
.17**
.20**
-.02 .16** .16~H.
indicate number of observations
-.09 -.1)
.10 i~
.29
-.12 -.)8*
-.28 -.11
.0)
.29
.17 .00
.14 -.02 ,14 -.08
- ,13 .10
.17 .01
.24
-.09
.16
.02
.07 -.)0
.45*
.4)*
.27
.33
.42~·
-.1)
**
-.04 .40*
-.20
.22 .21 -.01 .04
.19 .22 -.01 -.11
-.10 -.06
- ,06
- .03 -.11
.2)
.)6*
.40*
-,16
.13
-.12 .16 .0)
-.0)
-.12 .06
-.09
.00
.04
.22
-.37*
-.04 ~
n , .;~

\ \
145
The low relationships between services per conception
and calving intervals with the other parameters examined is
an indication that management, which embodies almost every
aspect in dairy farming, was responsible for the wider
variations observed in individual herds. As a result of
removing or masking these individual herd effects, a more
uniform picture of relationships is then presented.
b. Trinidad Herds
In the Trinidad group the significant relationships
observed are mainly due to the large number of observations
involved so the relevance of these significance is
indeterminable since the "r" values are so small.
However, there is an indication that as the animaIs
become older services per conception increase and calving
intervals increase. Again this is in agreement with findings
of Davidson (1969) for animaIs in Trinidad.
The significant relationship between lactation
sequence and service~ per conception and calving intervals
is basically in agreement with expectation, and in keeping
with acknowledged dairy findings where fertility of cows
decrease with advancing age. Foley et al. (1972) reported
that fertility in dairy cows increases up to 4 years of age,
remains constant to 6 years, then gradually decreases with
advancing age.
The apparent difference in relationship between age

146
and calving interval observed in the Quebec group May be
due to the culling procedure whereby infertile animaIs are
culled before they get old.
A previous observation in herds 1 and 14, (Table 18)
where significant positive relationships exist between
services per conception and calving interval and crude protein,
energy, calcium and phosphorous intake, is manifest when
herd effects in the Trinidad group are eliminated. The MOSt
logical and important consideration seem to indicate that
high producing cows were very weIl fed and the low producers
were getting below requirements.
c. Government Herd (Trinidad)
i. Purebred Holstein
Hematocrit value has a significant positive relationship
with services per conception. The significance of this is
not clear. An examination of the Hematocrit value (Table 10)
indicates that the mean of 30$2 + 0~5 % volume is below the
Mean of the normal range.
The sii,nificant positive relationship observed between
body weight, crude protein, calcium and energy intake, and
calving interval May be explained in the same light of over
feeding of high producing cows and underfeeding low producers.
ii. Crossbred HOlstein/Zebu
A significant positive correlation exists between level
of production, calcium and phosphorous intake and services
1

(
147
per conception. The positive relationship between high
production and calving intervals agrees with the findings
of Morrow et gl. (1966) and Davidson (1969). Despite the
fact that Morrow et al. findings were in the United States
extrapolation of their data to tropical conditions may be
still relevant although the ceiling at which the relationship
exists may vary significantly.
Numerous authors have indicated that a phosphorous
deficiency affects reproduction in the dairy cattle
(Eckles et al., 1932, Eckles ~ al., 1935; Hignett and
Hignett, 1952; Morrow, 1969). The positive relationship
between phosphorous and services per conception and between
calcium and services per conception is contradictory to
these reports. There was a negative relationship between
services per conception and calciumaphosphorous ratio.
In summary the relationship between infertility as
measured by services per conception and calving intervals,
and various parameters have raised some interesting issues,
particularly where the Trinidad herds were concerned. For
example, are the farmers really over-feeding high producers
at the expense of low producers, thereby increasing the
infertility problem? And is the Government Cros~bred herd
at Centeno getting too much mineraIs or is there a lower
requirement for animaIs of the Zebu crosses compatible with
high fertility? Are the nutrient requirements for cattle of
Temperate Zone areas applicable to animaIs in the Tropics?
--, .

The significance of these results will require further
controlled investigations.
148
6. A Comparison of Means of different Parameters between Quebec and AlI Trinidad Herds
A comparison of the means of the various parameters
examined in the different localities are set out in Table 20.
Herds have been combined to eliminate individual herd effects.
a. Body Weight
~he Mean body weight of the Quebec herds is roughly
88 kg higher than the Trinidad herds and roughly 4 months
older. The body weight of the Quebec group is approximately
the same as the Government Purebred Holstein herd which is
about 6 months older. However, the body weight of the
Trinidad group is almost identical to that of the Government
Crossbred herd which is about 8 months younger.
b. Milk Production
The Mean daily production in the Quebec herds was
16.0 kg almost twice as much as the Trinidad herds
(8.9 kg daily), and the Government Purebred Holstein herd
(9.6 kg daily). However, the mean daily production of the
Government Crossbred/Zebu Holstein herd was 1.7 kg less than
the Purebred Holstein he rd under similar conditions of
management.
These results parallel reports by Mahadevan (1966),
Knudsen and Sohael (1970) and Mc Intyre (1971). These

t \
149
Table 20. A Comparison of Means of different Parameters between Quebec and Trinidad Herds.
Government Quebec Trinidad Purebred Crossbred Herds Herds Holstein Holstein
No. of 112 427 47 107 AnimaIs Age (Mths) 60.4 56.6 66.1 47.9 Body Weight 542.3 454.9 549.5 453.2
(kg) Mi1k Prod. 16.0(90) 8.9(283) 9.6(29) 7.9(35)
(kg) Lactation No. 3.0(90) 1.8(283) 2.4(29) 1.6(35)
B100d Ca(mg/l00 ml) 10.8 11.0 Il.2 Il.6 P (mg/100 ml) 5.3 6.6 6.1 6.3 Ca:P 2.1 1.7 1.8 1.8 Hematocrit 31.1 ,30.1 30.2 35.2 % volume
Intake Crude Protein 2.2 1.6 2.9 1.5
(kg) Ca (g) 112 57 85 39 P (g) 62 43 65 33 CalP 2.4 1.4 1.,3 1·3 ENE (Meal) 16.5 9.6 12.4 8.9
Services per 2.1 2.2 3.0 2.7 Conception Ca1ving 399.0(90) 437.2(283) 488.2(29) 435 (35) Interva1 (days)
Numbern in parenthesis indicate number of observations

; ,
150
workers found that animaIs imported from temperate regions
performed creditably when compared with those bred specially
for the tropical environment.
The performance of European-type dairy animaIs in
tropical regions has been studied by many workers (Wright,
1946; Payne and Hancock, 1957; Rice, 1965). Among the
general conclusions was that European-type animaIs did not
produce as much milk in the tropics as in the temperate
regions because of sub-standard plane of nutrition caused
by a seasonal variation in pasture in the tropics, associated
with marked differences in rainfall throughout the year. It
has also been suggested that European-type animaIs achieve
optimum production when daily temperatures lie between the
range of 10 to 2l.loC (Findlay, 1950) and thatthey are not
adapted to conditions where the mean annual temperature
exceeds 21.1oC (Wright, 1946).
These may be possible reasons for the low production
in Trinidad as compared to the herds in Quebec with animaIs
of similar origin and breed.
c. Blood Components
The serum calcium and Hematocrit values for the Quebec,
Trinidad and Government Purebred Herds showed very little
variation, however, the serum inorganic phosphorous was higher
in the animaIs in Trinidad.
The results for the blood components for the Government

151
Crossbred herd were higher than those for the Government
Purebred herd. These results are in agreement with those of
Davidson (1970) from the same Government herds, and with
Rusoff et al. (1951) and Blincoe et al. (1951) referred to
earlier.
d. Feed Intake
The general level of the components estimated in each
group is reflected by the level of production and chemical
composition of the concentrate and forage fed.
The difference in feed intake between the Government
Purebred Holstein and the Crossbred herd, where the
management for each herd is the same, is due to the better
managed pangola grass pasture offered to the Purebred herd
(Appendix Table 6). These pastures were recently fertilized
whereas those offered to the Crossbred herd were not at the
time of visite There May also be variations in soil nutrients
at the different locations in which each he rd is kept.
e. Lactation Sequence (Number)
It is interesting to note the difference in lactation
sequence between the Quebec herds and the Trinidad herds.
The Quebec herds have an average of 3 lactations compared
to the Trinidad group of 1.8 in animaIs of almost the sarne
age; and more than the Government herd (2.4) in animaIs
that are older. The results in the Crossbred he rd appear
slightly better. Many workers have reported that animaIs

152
in the tropics have their first calf at a very late age as
compared to 24-30 months in the temperate regions. Mahadevan
and Searle (1968) reported age at first calving in Barbados
as 33 months; in Trinidad the range was from 31-50 months
(Mahadevan et al.,1968); in Jamaica 33-42 months
(Wellington et al.,1970); and in many parts of Africa and
India the range was from 37-59 months (Mahadevan, 1966).
The age at first calving for the Crossbred herd at
Centeno was 39 months (Davidson 1969) so this can account for
the fewer number of lactations in this group.
The reasons for late maturing of animaIs under
tropical environment have been attributed to effects of
climate, differences in level of feeding and to parasites.
Broadly speaking, over a wide range of feeds used for
ruminants, voluntary feed intake declines as its digesti
bility declines. It is no doubt true that with tropical
grasses voluntary feed intake is poorly related to digesti
bility but a marked decline in intake occurs when the protein
content of the herbage dry matter falls below 7 per cent
(Milford and Minson, 1966).
Since the majority of the Holstein animaIs in Trinidad
were imported either as mature, or as heifers between the
ages of 9-14 months late m.aturity is almost ruled out.
However, other stress factors, such as climatic effects,
external (mainly ticks) and internaI parasites, and a
lowered plane of nutrition may account for the fewer calvings

and no doubt lower reproductive life observed in these
animaIs in Trinidad as compared to those in Quebec.
f. Index of Fertility
i. Services per Conception
153
The number of services required per conception in the
Trinidad herds (2.2) compares favourably with the results
from Quebec (2.1); whereas the Government Purebred herd
required almost 1 complete service more for each conception.
This difference in services per conception between the
Trinidad herds and the Trinidad Government herds is 1argely
a ref1ection of the use ·of "back up" bulls on the Trinidad
herds in cases of difficult breeders, whereas the Government
herd use A.I. exc1usive1y.
The Crossbred he rd required 0.3 services per conception
1ess than the Purebred herd, however, it wou1d seem that
its ferti1ity problem is increasing when compared to
Davidson's (1969) resu1ts of 1956-1966 of 2.5 services per
conception. This study included animaIs born in 1965 and
later.
Many services per conception can be attributed to
numerous causes. The reproductive function to be normal
requires perfect occurrence and synchronization of many
subfunctions and events in each sex (Zemjanis,1965). A
failure of any of these results in failure to conceive. In
addition to female and male infertility factors there are

154
many errors created at aIl levels of human interference.
Such factors as feeding and management of the herds, failure
to detect heat so that there is proper timing of service
which is the basis for successful mating. Errors in semen
processing, in treating of semen with antibiotics, in storing
and distribution of semen, inadequate insemination technique,
poor sanitation and unpredictability as far as availability
for service are aIl possible, and apparently occur in
Trinidad (Mills, 1969).
ii. Calving Interval
The calving interval for the Trinidad herds (437.2 days)
was 38 days longer than for the Quebec herds (399), or almost
two complete estrous cycles longer. However, the Trinidad
Government Purebred Holstein herd had an even longer calving
interval (488.2 days) than the Trinidad herds which was almost
the same as the Government Crossbred herd (435 days). Again
the fact that "back up" bulls are used on the Trinidad herds
will not only reduce services per conception but also the
resultant calving intervals.
Apart from this, Dav-idson (1969) reported that 75% of
both Government herds suffered frorn cystic ovaries, this no
doubt increase the incidence of infertility.
AlI these calving intervals are longer than the ideal
12 rnonths but the Quebec herds compare favourably with the
13.5 rnonths associated with Dairy Herd Irnprovernent data in
the United States (Pelissier, 1972).
,

155
ME\ny §lJ1ïhfH~IFl )1~Vê li\àVtH'l3.ted croesbreeding as a means
of reducing 1nrtnl'lj~.:I,:1.'IJ:y ;1,1'1 (J~ttls particularly under tropical
environmentêl wh€lt'~ (U~~tHlê, 611ml3.t:1o stress, and nutri tional
factors E\ff€H;,t fJ'3'hI1 'uh~ 1l:r6t1uot1on and fertili ty of cattle
of EuropeE\n QI'i~j:n.
If Wê làrê ,tif! Ut,:l~ 'bilé! (J(JVst'ntnent herde as an example
this idea mlàY fJ€l JUI\HJ1:t'J,fH\. Howevsr, we have seen the other
Trinidad n@I'Q§ (:t,mptH:"hl~(l §'btH;llt) potantially doing as weIl as
the cross'b:r.êQ§.
A numlH?I' @;f,' !t'Ml'lltm13 ()§.tl he reeponsible for long
cal ving intêt'V{ܧ. Ut;l:l.t;\~êlÏ ~ lt'él'lJ service or service interval
alone acoountêd ;rOJil :tri 1 U~~ Q~I 'llhê! variance of the interval
from partu:r.iti~m 'lm éH)1l\'.lêJ)'b1611. (Touohberry II §.l •• 1959) •
Mahadevan (l~QQ ~ ~ 'li'ln\l'lHI'U€ltl l3êliléJOtlal variations in feed
supply in t:r.gplf:lۆ CI fi 'II 'li:l. li:! l:'\13 Il ttll3.jor factor influencing
length of thê 13êirV,tt}@ 'Pt,n:'~1.I:Hl,
Fai.l.wrê 'b~ dê'lilH~'IJ O(}W13 11'1 heat saon enough after
calving WE\§ :r.ê§Fon§it\):Ll~ :t'O:fl 13. lfil3.jor portion of delayed first
services, mi§§êG h~t:\'b JIt:wj,t'ltl§ ë\dded to the seriousness of
the problem (fêl1§§&~~, 19?1).
Whi1.ê g'blH~\t' Q~UI;\I;!I3 §Uf.)ft 13.13 ambryonic death, retained
placentas, IànQ rty§'lil)();\,~.\ ooultl ë\tH~t)urtt for longer cal ving
intervals j,t Wf:nürt AllJ.)~~\~;\ 'tlh~t mil3sed heat periods were
responsibl~ fQt' 'th§ l\)H~!:~~i\ ~~lv11'1g intervals in the Trinidad
herds whose §ê:r.\fj,Q~~ P~"" OOflt'Jêptiotl were almost identical to .
those in QuePêQ. \r.l\tl tHt'~l\Ë'ml3 vl3.t'1a tion between herds (Table 6)

156
is an indication that many of the dairy farmers can improve
the breeding efficiency of their herds by concentration on
the problem more seriously. This is particularly so in
reference to estrous detection.
It appears that ~he calving interval is primarily a
management decision with the length of the calving interval
depending largely en the dairy farmers' ~ttitudes and ability
to detect heat since short heat periods,often during the
night, and silent heat periods make heat detection difficult
with many cows.
7. Evaluation of effects of production parameters on fertility index. Herd effects removed.
Tables 21 and 22 outline the mean effects of lactation
number on services per conception and calving interval for
Quebec and Trinidad herds respectively.
In the Quebec herds the lactation number dges not
seem to have any effect on the services per conception,
however, there is a steady decrease in calving interval
(exception second lactation) with each succeeding lactation.
This may indicate an earlier detection of estrus through
the farmers' better awareness of estrous expression as the
animaIs get older.
Within the Trinidad herds a more interesting picture
is unfold in that with each succeeding lactation there is a
progressive decrease in both services per conception and

157
Table 21. Means of services per conception and calving interval according to lactation sequence. (Quebec Herds).
Lactation No.
1
2
3 4
No. of Obs.
17 24
22 27
Services per Conception
Calving Interval
(days) 405 418
397 380
Table 22. Means of services per conception and calving interval according to lactation sequence. (Trinidad Herds).
Lactation No.
1
2
3
No. of Obs.
105 118
49
Services per Conception
2.5 2.1 1.8
Calving Interval
( days)
443 440 407

158
calving interval (Table 22). Three possible reasons, either
acting singly or in combination with each other, May account
for this development. Firstly, these imported animaIs May
be becoming adapted or building up some resistance to the
effects of tick borne disease and the rigours of a tropical
environment. Secondly, the practice of early removal of
problem animaIs May be giving a biased representation of the
exact situation. A third and equally, if not the most
logical explanation lies in the experience acquired by these
farmers both in the earlier detection of estrus and in the
general management and care of these animaIs.
The least squares estimates (Tables 23 and 24) were
computed to provide some indication of the effects of
lactation on services per conception and calving interval
in both the Quebec and Trinidad herd~. These estimates
indicate that after the fourth lactation there is a slight
increase in services per conception in the Quebec herds.
However, the Mean calving interval continues to decline due
to better heat detection.
In the Trinidad group the estima tes indicate a
progressive increase in fertility both in a lowered Mean
service per conception (a decrease by 0.31 services from the
mean) and calving interval (decrease by 47.2 days from the
Mean) after the third lactation. The reasons given for the
increase in fertility for the actual lactation means will
also hold for these estimates.

159
Table 23. Least Squares Estimates of the effects of lactation sequence on services per conception and ca1ving interva1. (Quebec Herds).
. ..
Lactation No. No. of Obs. Services per Ca1ving Conception Interva1
~da~s ~
1 17 +0.20 -4.9 2 24 -0.17 +24.3
3 22 -0.04 -4.0 4 27 +0.01 -15.6
Table 24. Least Squares Estirnates of the effects of lactation sequence on services per conception and ca1ving interva1. (Trinidad Herds).
Lactation No. No. of Obs. Services per Ca1ving Conception Interva1
,da~s~
1 105 +0.44 +48.7 2 118 -0.13 -1.5 3 49 -0.31 -47.2

160
The analysis of variance for the services per
conception (Appendix Tables 9 and 10) shows that there were
highly significant differences (P~O.Ol) between yield and
services per conception (Quebec herds) and between lactation
sequence and services per conception (Trinidad herds). The
significant differences between yield and services per
conception observed in the Quebec herds is in agreement with
the report by Morrow et al. (1966) who found that high
producing cows required significantly (PC:O.05) more services
than the lower producing ones.
The analysis of variance for calving interval
(Appendix Table 12) indicates that there is a highly
significant difference (P~O.Ol) between lac.tation sequence
and calving interval (Trinidad herds) and a significant
difference (P~0.05) between crude protein intake and
calving interval (Quebec herds). These significant
differences between lactation sequence and calving interval
and services per conception in the Trinidad herds can be
explained in the same manner as was previously done for the
actual means. However, it is questionable whether the
significant difference observed between crude protein intake
and calving interval (Quebec) is meaningful since there was
no correlation between these two parameters when herd
effects were removed.
Least squares estimates of the effects of services
per conception on the various productive parameters examined

161
in this study are presented in Tables 25, 26 and 27 for the
Quebec, Trinidad and Government herds respectively. There
is no consistent picture observed between calving intervals
and lactation sequence in the Quebec herds. This inconsisten
cy may be due to the method of sampling plus the fact that
animals not yet having a calf are not included. The variation
from the mean of 29 days between animaIs requiring 1 service
per conception and those requiring 4 services per conception
is really not what would be expected. However, milk yield
shows a definite trend, increasing steadily as the number
of services increase. Since the feed intake for aIl herds
were based on production the trend observed for production
was indicative, and in fact was the case, for feed intake.
In the Trinidad herds the trend for an increase in
calving interval and a decrease in lactation sequence as
services per conception increase from 1 to 4 is in agreement
with what was expected. However, the wide differences
between lst and 4th services and 3rd and 4th services of
176 and 95 days respectively can be due to improper heat
detection, silent estrus, early embryonic death, abortions
or a combination of these symptoms. The differences between
lst service and 2nd service and between 2nd and 3rd service
of 38 and 43 days respectively, would indicate that the
problem lies mainly in improper heat detection, since
exactly one heat period has been missed. There is some
inconsistency in milk yield between the 2nd and 3rd services.

Table 25. \ Least Squares Estimates of the effects of services per conception on various productive parameters. (Quebec Herds).
Feed Intake Services Calving Milk Lact. Crude Calcium Phosph. Energy
per Interval Yield Seq. Protein Conception (days) ()05 days) (g) (g) (g) (Mcal)
kg
1 -15 -)1) +0.02 --:38 -1 -2 -0.06 2 - 9 -180 -0.02 - 7 -0·3 -1 +0.11
3 +10 + 59 +0.11 -20 -0.6 -1 -0.27 4 +14 +434 -0.12 +65 +2 +4 +0.21
Means 399 4895 3.0 2438 126 74 18.3
" .... -
Ca,P Ratio
+0.01 -0.02 +0.04 -0.03 1.8
1-' 0-. 1\)
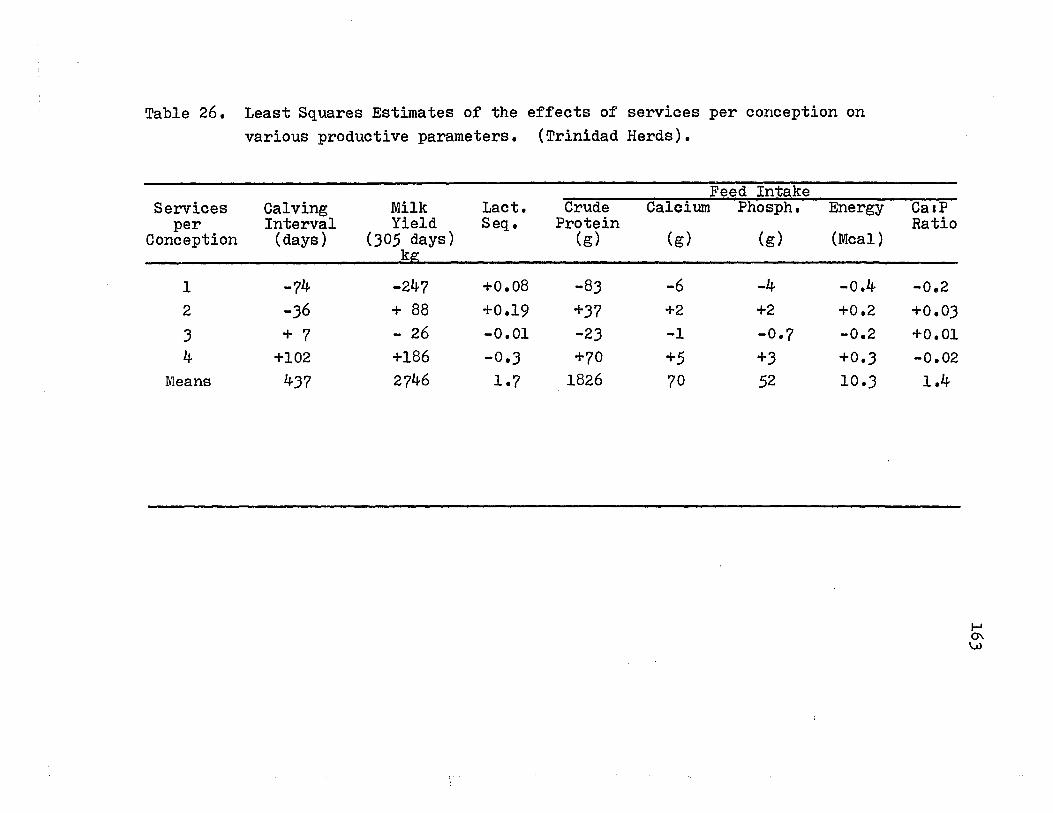
Table 26. Least Squares Estimates of the effects of services per conception on various productive parameters. (Trinidad Herds).
Feed Intake Services Calving Mi1k Lact. Crude Calcium Phosph. Energy
per Interval Yield Seq. Protein Conception (days) (305 days) Cg) (g) Cg) (Meal)
kg
1 -74 -247 +0.08 -83 -6 -4 -0.4 2 -36 + 88 +0.19 +37 +2 +2 +0.2
3 + 7 - 26 -0.01 -23 -1 -0.7 -0.2 4 +102 +186 -0.3 +70 +5 +3 +0.3
Means 437 2746 1.7 1826 70 52 10·3
CalP Ratio
-0.2 +0.03 +0.01 -0.02 1.4
1-' 0'. \.Al

Table 27.
Services per
Conception
l 2
3 4
Means
Least Squares Estimates of the effects of services per conception on various productive parameters. (Trinidad Government Herds).
Feed Intake Calving Milk Lact. Crude Calcium Phosph. Energy Interval Yield Seq. Protein
(days) (305 days) (g) (g) (g) (Meal) kg;
-24 -289 +0.3 -79 -6 -6 -0.4 -47 -226 +0.1 + 8 -0 -0 +0.2 +29 +129 -0.02 +14 +3 +1 +0.03 +49 +182 -0.4 +56 +3 +5 +0.2 459 2653 2.0 2463 86 68 12.3
CalP Ratio
+0.03 -0.01 +0.02 -0.04 1.3
1-' (J\ -{:"

165
In the Government herd, with the exception of the
2nd calving interval, there is uniformity in increasing
calving interval, increasing milk yield and decrease in
lactation sequence as services per conception increase.
The difference in 73 days between lst and 4th service shows
that heat expression and detection are more consistent and
theproblem here could be related to proper time of
insemination, quality of semen, to the A.I. operator's
competence or to physiologica1 abnorma1ities of the cows.
8. Relationship between freguency of calvingsand rainfall, temperature and season of the year. (Trinidad)
Figure .4 out1ines the number of calvings according ·12
to month from 1965 to May 1971, a 30 year rainfal1 period
plus me an temperatures3for Trinidad.
The majority of the calvings take place from January
to May which is the period of the dry season. It would
appear therefore, that the months of June to October wh en
the calving rate is low, are the best months for conception
to occur. The peak of the rainy season also occurs during
the latter months. At this time the pastures are young and
rapidly growing and are richer in prote in.
Many authors have reported that in the rainy season
the crude protein content of weIl managed pangola grass
IIndividua1 cow records from aIl Trinidad herds and the Trinidad Government herds.
2Land Capability Survey of Trinidad and Tobago No. 3, Government Printery, Trinidad and Tobago. 1966.
3Government Meteorologica1 Station, Piarco, Trinidad.
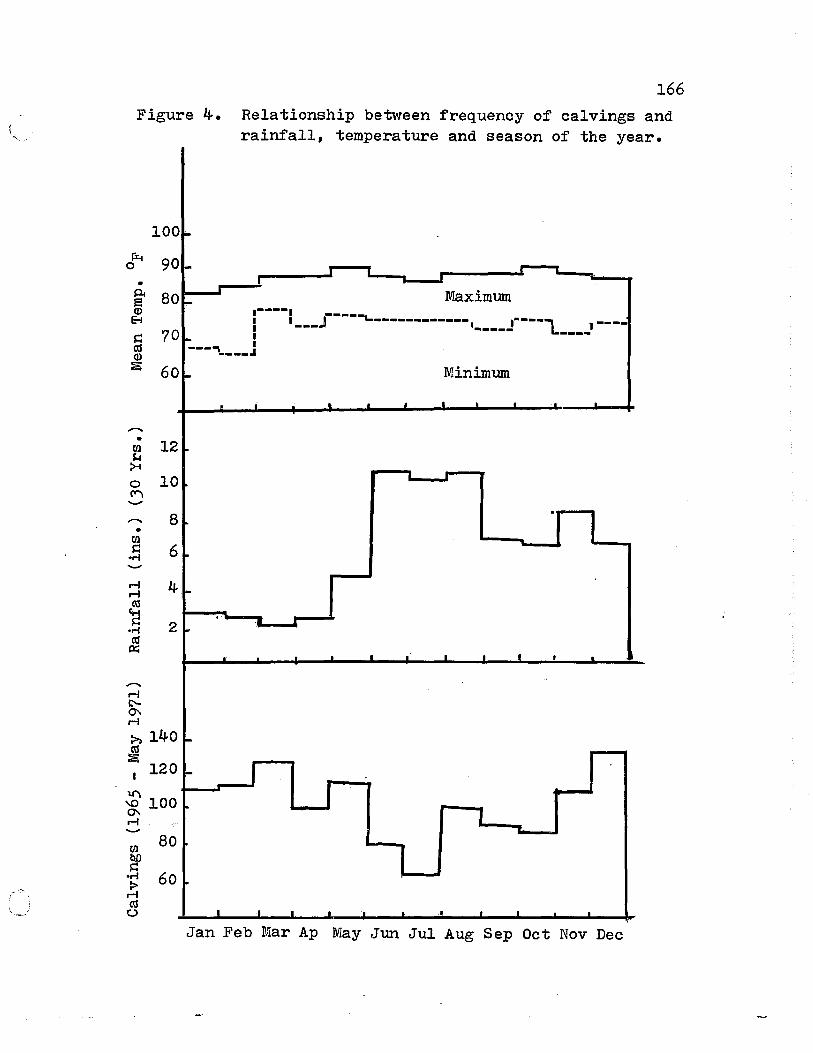
166
Figure 4. Re1ationship between frequency of ca1vings and rainfa11, temperature and season of the year.
Il:.t o
,..... •
tIl H ~
0 C""\ .......
...-.. •
tIl 1=:
.r-f ....... ri ri
CG
ca .r-f
CG Il::
......... ri c--
'" ri
12
10
8
6
4
2
~ 140 ~ 1 120
::f' 100 '" ri '-'"
tIl 80
~ .r-f 60 ::-ri CG o
lWaximum .----. ----1 1 J ~------------ ,-----, ---. 1 --- 1---__ L 1 1 -------..,-___ J
Minimum
.L.-.---J.--
Jan Feb Mar Ap May Jun Jul Aug Sep Oct Nov Dec

. \
167
pastures can be relatively high, ranging from 12 - 20,%,
whereas in the dry season crude protein content falls to
as low as 4 - 5% (Butterworth et âl., 1961; Grieve and
OSbourn, 1965; Creek, 1967).
Results of this study (Appendix Table 6) are in close
agreement with the relatively high protein content during
the rainy season.
The mineraI content of grasses in the young succulent
state is usually adequate but, particularly phosphorous,
declines with the maturity of the forage.
Generally the feeding value of pastures in the rainy
season is higher than in the dry season. The apparent
higher conception of cows during the rainy season then may
be attributed to the overall better supply of nutrients
from forage sources.
The variation in the high environmental temperatures
is very small and seem to have no effect on the number of
calvings. Many reports indicate that conception rates are
usually affectedby high environmental temperatures and
humidities by causing a deterioration in semen quality in
bulls (Johnston et âl., 1963), lower fertilization rates,
and embryonic mortalities (Ulberg, 1958; Kelly and Hurst,
1963; Mc Intyre, 1971).
However, Mahadevan (1966) and Payne (1970) indicate
that the effects of high environmenta1 temperatures and
humidity on ferti1ity are 1ess severe in high altitudes and

168
maritime areas.
The results of this study may be indicative of the
maritime influences on temperature since the trade winds
from the Atlantic ocean tend to minimise these severe
effects.
. ,,",

! '-
169
VI. SUMMARY AND CONCLUSIONS
Although the main reason for this investigation
was an attempt to find whether there was a link between
feed quality, as laid down' by standards, and herd infertility,
it was felt desirable to deriye as much information as
possible from the results.
Eleven herds, with ten animaIs representative of each
herd, from the Province of Quebec, and thirty herds - rang~ng
from 10 to 21 animaIs per herd, from Trinidad plus a
Trinidad Government Purebred Holstein and a Crossbred
Holstei~Zebu herd were used in the study.
The overall fertility rate in the herds in Trinidad
was low, being 47.7% in the Trinidad herds (Crown Lands
Farms), 34.0% for the Purebred Holstein, and 39.3% for the
Crossbred Holstei~Zebu herd for first service calvings
respectively.
Chemical analyses of the forages and concentrates
from both Quebec and Trinidad when compared to reported
analytical values for similar feeds, showed slight
varia tions •
With the exception of two herds Quebec, (herds C
and G) and three herds Trinidad (herds 12,13, lS),plus
aIl heifers on the Trinidad Government Station, aIl other
herds were in negative energy balance based on U.S. Nutrient
Requirements of Dairy Cattle (1971). Herd l (Quebec) was

170
also in negative protein balance, but aIl other herds were
adequately supplied. AlI herds were adequately supplied
with calcium intake but herds E (Quebec) and )0 (Trinidad)
were below their phosphorous requirements. The intake of
calcium to phosphorous ratio in most herds was weIl within,
or close to, the normally accepted range of 1-2.1 with the
exception of Herds Gand )0, ).7 and ).2 and herds K and 24,
0.8 and herd 8, of 0.9 to l ratio respectively.
Energy supply seem to be the limiting nutrient
during winter feeding in Quebec. The extent to which energy
supply is limiting in the Trinidad herds cannot be ascertained
since intakes were based on requirements associated with
temperate regions, and many reports indicate that both
environmental and physiological factors limit the feed intake
of ruminants in the tropics.
In aIl herds blood serum inorganic phosphorous and
serum calcium appeared weIl within the normal range,
however, there were more variations in the calcium.phospho
rous ratio in the Quebec herds than in those in Trinidad,
due mainly to a greater variety of feedstuff grown in Quebec.
However, serum inorganic phosphorous was generally higher
in the Trinidad herds.
Mean Hematocrit (Packed Cell Volume) for aIl herds
was within the normal range, but 2 herds in Quebec and 8 in
Trinidad were close to the lowèr range. It was assumed that
both external (mainly Boophilus ticks) and internaI parasites

171
were mainly responsible for these lower values in the
Trinidad herds. The Mean Hematocrit values for the Crossbred
Holstein/Zebu herd were higher (35.2 + 0.4%) than in aIl
other groups.
In one herd in Quebec there was a significant
correlation (P<:O.Ol) between services per conception and
calcium, phosphorous, calciumaphosphorous ratio, and energy
intake. This was also true for 5 herds in Trinidad.
Significant correlations also existed between calving
interval and these nutrients intake in another five herds.
Generally, where milk production was high there was a
significant correlation (P<O.Ol) between services per
conception and milk production and between calving interval
and milk production.
These significant effects were not conclusive proo!
that he rd fertility was in tact impaired, because in some
herds with infertility problems this trend was not observed,
but was also seen in others of low infertility. This
indicates the great difficulty in determining the cause of
infertility in a herd, and May suggest, that further
controlled nutritional trials are required before any real
conclusions could be drawn, since the causes of infertility
May weIl be due to factors other than those under examination.
Services per conception between the Quebec herds
(herd effects removed) were almost identical to that observed
in the Trinidad herds (herd effects removed), (2.1 and 2.2).

However, the Government herds required slightly more
(3.0 and 2.7) services per conception for the Purebred
Holstein and the Crossbred Holstein/Zebu respectively.
172
The use of "back up" bulls in the Trinidad herds was
responsible for this difference in the Trinidad situation
since the Government herds use A.I. exclusively.
Mean calving interval for Quebec herds was 399 days,
for Trinidad herds 437 da ys and for the Government Purebred
Holstein and Crossbred herd 488 and 435 days respectively.
It was concluded that improper heat detection was
the main cause of the longer calving intervals in Trinidad
since 'the difference in calving interval between the Quebec
and Trinidad herds was 38 days (approximately two estrous
periods) and the number of services per conception was
almost identical. Within the Government herds other
additional possibilities such as improper insemination
technique, semen quality, and probable physiological abnorma
lities may be responsible.
In the Quebec herds lactation sequence had no effect
on services per conception, however, calving interval
decreased from 405 days for lst lactation to 380 days for
4th lactation. In the Trinidad herds, however, lactàtion
sequence affected both services per conception and calving
interval. Services per conception declined from 2.5 to 1.8
and calving interval from 443 to 407 days from lst to 3rd
lactation respectively. Either of three possibilities,

173
acting singly or in combination with each other, can account
for this picture in Trinidad. Firstly, the animaIs were aIl
imported basically from Canada - a temperate region - and
were building up sorne resistance to tick-borne disease, thus
becoming progressively more adapted to a tropical environ
ment with the passage of time. Secondly, the practice of
early culling of problem animaIs so that only those of high
fertility remained. A third, and probably the most important
factor, is the experience acquired by the farmers, both in
the earlier detection of estrus and in the general care and
management of the animaIs.
There were highly significant differences (P<:O.Ol)
between lactation sequence and services per conception and
between lactation sequence and calving interval in the
Trinidad herds. Estimated values for effects of services
per conception on calving interval showed that there was a
difference of 176 days between lst service and 4th service
in the Trinidad herds. Generally, lactation sequence
decreased as number of services increased.
In Trinidad the period of highest fertility coincided
with the peak of the rainy season, when forage growth was
more luxuriant and of a higher nutrient status than in the
dry seasone Based on a~tual calvings, it would appear that
temperature had no effect on fertility level in Trinidad.
In conclusion, the longer calving interval in the
Trinidad herds with almost identical services per conception

(~ .
174
"
as the Quebee herds, would indieate that the main problem
of infertility was improper observation o~ heat periods.
The extreme variation between aIl herds would indieate that
Many dairy ~armers eould improve the breeding e~fieieney
of their herds by eoneentrating on more e~~ieient heat
deteetion. This would also apply to the Quebee herds.
The extent to whieh low energy intake a~~eeted
fertility, partieularly in the Trinidad herds, is not elear,
sinee known requirements ~or da~ry eattle in the tropies
are not available. Further controlled studies would be
neeessary to indieate what role nutrition, or speei~ie
nutrients played in the i~ertility of these herds particu
larly under the Trinidad conditions.

175
LITERATURE CITED
Abrams, J.T. 1952a. Livestock and their environmentsl ' Sunlight and Vitamin D. Part II. Veto Rec. 64:174.
Abrams, J.T. 1952b. Livestock and their environments. Sunlight and Vitamin D. Veto Rec. 64.185.
Adler, J.H. and D. Trainin. 1961. The apparent effect of a1fa1fa on the reproductive performance of dairy catt1e. Proc. IVth Int. Congo Anim. Reprod., 3.451.
Aehne1t, E and H. Konermann. 1961. Use of mixed fodder ana1ysis in investigation of herd breeding prob1ems. Proc. IVth Int. Congo Anim. Rep., The Hague, 3.437.
Agricu1tura1 Research Counci1. 1965. The Nutrient Requirements of Farm Livestock.No. 2. Agricultura1 Res. Coun. London.'
A1derman, G. 1963. Mineral nutrition of 1ivestock in South Wa1es in relation to reproductive disorders. Veto Rec. 75·1015.
A1iseihov, A.M. 1964. Reproduction in nurse cows. Veterinariya (Mosk.) 41.65. (Anim. Breed. Abstr. 33:2269).
Allen, T.E., Y.S. Pan and R.H. Hayman. 1963. The effect of feeding on evaporative heat loss and body temperatuJ.'e in Zebu and Jersey heifers. Austr. J. Agric. Res. 14.580.
Anon. 1965. The effect of soils and ferti1izers on the nutritiona1 qua1ity of plants. Agric. Information Bull. 299, Agric. Res. Service, Washington, D.C.
Anon. 1971. Nutrient requirements of Dairy Catt1e. National Academy of Sciences Public. No. 3 Washington D.C. 1971.
A.O.A.C. 1965. Official methods of ana1ysis. 10th Edition of Official Agricultura1 Chemists, Washington, D.C.
Armstrong, D.V.; L.D. Brown, J.W. Thomas and S.M. Getty. 1966. High level grain feeding and herd hea1th. J. Dairy Sei. 49 '. 730.

176
Armstrong, J., A.G. Henderson, D.R. Lang, D.W. Robinson and H. Suijendorp. 1968. Preliminary observations on the productivity of female catt1e in the Kimberly region of North-Western Australia. Austr. Veto J. 44,)57.
Arzumanjan, E.A. and E.N. Dorotjuk. 1964. The importance of biochemical factors in controlling infertility in cows. Vest. Sel'-Khoz. Nauki. Mosk., 9154. (Anim. Breed. Abstr., 3313327).
Asdell, S.A. 1955. Cattle fertility and sterility. Boston. Little, Brown and Company, Toronto.
Bedrak, E., A.C. Warnick, J.F. Hentges and T.J. Cunha. 1964. Effect of protein intake on gains, reproduction and blood constituents of beef heifers. Fla. Agric. Exp. Stn. Tech. Bull. No. 678.
Bent1ey, O.G. and P.H. Phi11ips. 1951. manganese rations upon dairy catt1e. 341396.
The effect of low J. Dairy Sei.
Bisschop, J.H.R. 1964. Feeding phosphates to cattle. Bull. Dep. Agric. Tech. Servi S. Afr. No. 365.
B1incoe, C .and S. Brody. 1951. The influence of temperature on blood composition of cattle. Res. Bull. Mo. Agric. Exp. Sta. No. 448.
BOda, J.M. and H.H. Cole. 1954. The influence of dietary calcium and phosphorous on the incidence of milk fever in dairy cattle. J. Dairy Sei. 371)60.
Bond, J. and J.N. Wiltbank. 1970. Effect of energy and protein on estrus, conception rate, growth and milk production of beef females. J. Animal Sei. 30:438.
Bonewitz, R., E.P. CalI and J.R. Dunham. 1966-71. Kansas Dairy Herd Improvement Association Annual Summaries. 1966-67, 1967-68, 1968-69, 1969-70, 1970-71. Extension Dairy Sei., Manhattan.
Boume, F.J. 1966. and abortion.
Correlation of phosphorous deficiency Veto Rec. 78:435.
Boyd, L.J. 1970. Managing Dairy Catt1e for fertility. J. Dairy Sei., 531969.
Boyd, L.J., D.M. Seath and D. Olds. 1954. Relationship between level of milk prOduction and breeding efficiency in dairy cattle. J. Animal Sei. 13:89.

\ '-
177
Bozworth, R.W., George Ward, E.P. CalI and E.R. Bonewitz. 1972. Analysis of factors affecting calving intervals of dairy cows. J. Dairy Sei. 551334.
Buchanan-Smith, J.G., W. Bannister, R.M. Durham and S.E. Curl. 196~. Effect of all-concentrate fed ad libitum versus
.roughage ration on occurrence of estrus inbeef heifers. J. Animal Sei. 23=902.
Butterworth, M.H. 1961. Studies on pangola grass at I.C.T.A., Trinidad. II. The digestibility of pangola grass at various stages of growth. Trop. Agric. Trin. 38.189.
Butterworth, M.H., C.G. Groom and P.N. Wilson. 1961. The intake of pangola grass (Digitaria decumbens.Stent.), under wet-and dry-season conditions in Trinidad. ' J. Agric. Sei. 50.407.
Byers, J.H., I.R. Jones, and J.F. Bone. 1956. Carotene in the ration of dairy cattle. II. The influence of sub-optimal levels of carotene intake upon the microscopie aspect of selected organs. J. Dairy Sei. 29.1556.
Chicco, C.F. 1962. (Study of digestibility of grasses in Venezuela. IV. Nutritive value of pangola grass in various stages of growth). Agron. Trop. 12.57.
Clapp, H. 1937. A factor in breeding efficiency of dairy cattle. Proc. Am. Soc. Anim. Prod. (1937) 259. '.
Committee Report. 1968. in Cattle. Public. Washington, D.C.
Prenatal and post-natal Mortality 1685. Nat. Acad. Sei.
Converse, H.T. 1954. Calcium requirements of dairy cattle. U.S. Dept. Agric. Tech. Bull .• 1092.
Crampton, E.W. and L.A. Maynard. 1938. The relation of cellulose and lignin content to the nutritive value of animal feeds. J. Nutr. 151383.
Crampton E.W., E. Donefer and L.E. Lloyd. 1960. A Nutritive Value Index for forages. J. Animal Sei. 19'538.
Creek, J.M. 1967. A study of the effects of some husbandry practices on the productivity of beef cattle, and of land grazed by beef cattle in Jamaica. Ph.D. Thesis. Univ. of London.

178
Cunha, T.J., P.M. Peacock, C.E. Haines and R.W. Kidder. 1966. General nutrition of beef cattle. Beef cattle in Florida. Bull. Fla. Dept. Agric. No. 28.82
Currie, E.J. 1956. The influence of milk yield on fertility in dairy cattle. J. Dairy Res. 23'301.
Danieli, Y. 1968. Observations on the relationship between vitamin A and reproductive disorders in dairy cows. Refuah Veto 25.12. (Vet. Bull. 39. 775)
David, J. 1965. Ph. D. Thesis, Univ. Bristo~. Cited by Tassell, R. 1967. The effects of diet on reproduction in pigs, sheep and cattle. VI. Cattle - proteins, vitamins, mineraIs and other dietary substances. Brit. Veto J. 123.550.
Davidson, J.G. 1969. The performance of Crossbreds (Bos indicus X Bos taurus) on Government Farms, Trinidad. Unpublished.
Davidson, J.G. 1970'. A study of production and fertility of Holsteins imported to the tropics. Unpublished.
Dawson, F.L.M. 1967. Recent advances in knowledge of the role of nutrition in fertility of cattle. Feed Forum. Vol. 2, No. 2.18.
Devendra, C. and B.I. Gohl. 1970. The chemical composition of Caribbean feedingstuffs. Trop. Agric. Trin. 471335.
Donaldson, L.E. 1962. Some observations on the fertility of beef cattle in northern Queensland. Austr. Veto J. 38.447.
Donaldson, L.E. 1968. The pattern of pregnancies and lifetime productivity of cows in a northern Queensland beef cattle herd. Austr. Vet. J. 44.493.
Donaldson, L.E., J.M. Harvey, A.W. Beattie, G.I. Alexander and M.A. Burns. 1964. Effects of copper and cobalt supplementation on the growth rate and fertility of Shorthorn heifers in northern coastal Queensland. Queensland J. Agric. Sei. 21.167.
Donaldson, L.E., J.B. Ritson and D.B. Copeman. 1967. The reproductive efficiency of several north Queensland beef herds. I. Physiological and managemental factors and embryonic neonatal losses. Austr. Vet. J. 4311.

179
Donefer, E., E.W. Crampton and L.E. Lloyd. 1960 •. Prediction of the nutritive value index of a forage from in vitro rumen fermentation data. J. Animal Sei. 191545.
Donefer, E., E.W. Crampton and L.E. Lloyd. 1966. The prediction of digestible energy intake potentia1 .(NVI) of forages using a simple in vitro technique. Proc. X Int. Grass1d. Congo p.442.
Dowe, T.W., J. Matsushima and V.H. Arthaud. 1957. The effects of adequate and excessive calcium when fed with adequate phosphorous in growing rations for beef calves. J. Animal Sei. 16,811.
Dunnj T.G., J.E. Ingalls, D.R. Zimmerman and J.N. Wiltbank. 1969. Reproductive performance of 2-year-old Hereford and Angus heifers as influenced by pre-and post-calving energy intake. J. Animal Sei. 29'719.
Eckles, C.H. 1929. A study of the breeding records of dairy herds. l\1inn. Agric. Exp. Stn. Tech. Bull. No. 258.
Eckles, C.H., T.W. Gullickson and L.S. Palmer. 1932. Phosphorous deficiency in the rations of cattle. Minn. Agric. Exp. Stn. Tech. Bull. No. 91.
Eck1es, C.H., L.S. Palmer, T.W. Gu11ickson, C.P. Fitch, W.L. Boyd, L. Bishop and J.W. Nelson. 1935. Effects of uncomplicated phosphorous deficiency on estrous cycles, reproduction and composition of tissues of mature dairy cows. Corne11 Veto 25:22.
Ehrlich, C. 1962. Nutritiona1 reproductive disorders in Westphalian cattle and their control. Prakt. Tierarzt. 3,87.
Ferguson, L.C. 1937. Studies on bovine blood. I. The sedimentation rate and percentage volume of erythrocytes in normal b1ood. J. Amer. Veto Med. Assoc. 91,163.
Find1ay, J.D. 1950. The effects of temperature, humidity, air movement, and solar radiation on the behaviour and physiology of cattle and other farm animaIs. Hannah Dairy Res. Inst. Bull. No. 9.
Fitch, C.P., W.L. Boyd, C.H. Eckles, T.W. Gullickson, L.S. Palmer B.nd C. Kennedy. 1932. Report of an experiment ta de termine the effect of a low calcium ration on reproduction in cattle. Cornell Veto 22'156.

180
Fo1ey, R.C., D.L. Bath, F.N. Dickinson and H.A. Tucker. 1972. Dairy Catt1el Princip1es, Practices, Prob1ems, Profits. Lea & Febiger. Philadelphia.
Fuquay, J., A.H. Rakes, L.C. Ulberg and D.G. Davenport. 1966. Effect of high levels of energy intake during early lactation on the reproductivè performance of dairy cows. J. Dairy Sei. 491447.
Gardner, R.W. 1969. Interactions of energy levels offered to Holstein cows prepartum and postpartum. II. Reproductive performance. J. Dairy Sei. 5211985.
Geyer, K. 1961. Retained placenta and reproductive disorders on a low carotene diet. Diss. Hannover.
Ghannam, S., H. A1-Alily and S. Deeb. 1966. The effect of different 1evels of vitamin A on the reproductive organs of young bulls. Int. J. Fert. ll1J06.
Ghannam, S., O. Shehata, S. Deeb and H. Al-A1ily. 1969. The effect of vitamin A dep1etion on the vasa deferentia of young bu1ls. Res. Veto Sei. 10.79.
Gibson, T.E. 196J. The influence of nutrition on the relationships between gastro-intestinal parasites and their hosts. Proc. Nutr. Soc. 22115.
Girou, Rand M. Brochart. 1970. ~lergy and protein level of the diet with reference to fertility in the dairy cow. Effect of a post-oestral feed supplementation. Annales De Zootechnie. 19167.
Gomide, J.A., C.H. Noller, G.O. Mott, J.H. Conrad and D.L. Hill. 1969. Effect of plant age and nitrogen fertilization on the chemical composition and in vitro cellulose digestibility of Tropical grasses. Agron. J. 611116.
Gomide, J.A., C.H. Noller, G.O. Mott, J.H. Conrad and D.L. Hill. 1969. Mineral composition of six tropical grasses as influenced by plant age and nitrogen fertilization. Agron. J. 611120.
Graham, E.F. 1968. The usefulness of useless data field tests and responsibilities. Proc. 2nd Tech. Conf. on Artificial Insemination and Reproduction, Chicago, Feb. 8-10, 1968, pp. 88-JO. Published by National Association of Animal Breeders.

181
Grieve, C.M. and D.F. Osbourn. of sorne tropical grasses.
1965. The nutritional value J. Agric. Sci .. 651411.
Guilbert, H.R. and G.H. Hart. 19,35. Minimum vitamin A requirements with particular reference to cattle. J. Nutr. 101409.
Hall, J.G., C. Branton and E.J. Stone. 1959. Estrus, estrous cycles, ovulation time, time of service and fertility of dairy cattle in Louisiana. J. Dairy Sci. 4211086.
Hancock, J and W. Payne. 1955. The direct effect of Tropical clirnate on the performance of European-type cattle. I. Growth. Emp. J. Exp. Agric. 2,3155.
Hansel, W.H. 1968. Endocrinology for animal scientists. (Unpub1ished) Dept. Animal Sci. Cornell Univ. Ithaca N.Y.
Hart, B. and G.L. Mitchell •. 1965. Effect of phosphate supplementation on fertility of an open range beef herd on the Barkly Tableland. Austr. Veto J. 411,305.
Hart, G.H. and H.R. Guilbert. 1928. Factors influencing percentage calf crop in range herds. Univ. of Ca1if. Bull. 458.
Harvey, W.R. 1960. Least Squares Analysis of data with unequal subclass numbers. V.S.D.A. ARS. 20-8.
Havre, G.N. and O. Dynna. 1961. copper deficiency in cattle.
Occurrence of eonditioned Acta. Veto Scand. 21,375.
Hentges, J.F., F.A. Capote and F.C. Neal. 1964. Comparison of a self-fed concentrate and supplemented forage diet for developing bul1s. Anim. Sei. Mimeogr. Sere Fla. Agric. Exp. Stn. Aw64-l2. (Anim. Breed. Abstr. ,34. 2052).
Herrod-Taylor, E.E. 1966. Correlation of phosphorous deficieney and abortion. Veto Rec. 781,324.
Hewett, C.D. 1968. A survey of the incidence of the repeat breeder eow in Sweden with referenee to herd size, season, age and milk yield. Brit. Veto J. 124.,342.
Hight. G.K. 1968. Plane of nutrition effects in late pregnancy and during lactation of beef cows and their calves to weaning. N.Z. J. Agric. Res. lla7l.
Hignett, S.L. 1941. Sorne aspects of bovine sterility. Veto Rec. 5,3121.

182
Hignett, S.L. 1950. Factors inf1uencing herd ferti1ity in cattle. Veto Rec. 621652.
Hignett, S.L. 1959. Some nutritiona1 and other inter-acting factors which may influence the fertility of cattle. Vet. Rec. 711247.
Hignett, S.L. and P.G. Hignett~ 1951. The influence of nutrition on reproductive efficiency in cattle. 1. The effect of calcium and phosphorous intake on the ferti1ity of cows and heifers. Veto Rec. 63.603.
Hignett, S.L. and P.G. Hignett. 1952. The influence of nutrition on reproductive efficiency in catt1e. II. The effect of the phosphorous intake on ovarian activity and fertility of heifers. Veto Rec. 641203.
Hignett, S.L. and P.G. Hignett. 1953. The influence of nutrition on reproductive efficiency in cattle. III. The influence of vitamin D status on the effect of ca1~ium and phosphorous intake on the fertility of cows and heifers. Veto Rec. 65.21.
Hill, J.R. (Jr.), D.R. Lamond, D.M. Henricks, J.F. Dickery and G.D. Niswender. 1970. The effects of undernutrition on ovarian function and ferti1ity in beef heifers. Biol. Reprod. 2178.
Hodgson, R.E., S.R. Hall, W.J. Sweetrnan, H.G. Wiseman and H.T. Converse. 1946. Effect of vitamin A deficiency. J. Dairy Sei. 291669.
Hogg, J. 1831. Remarks on certain diseases of sheep. Quarter1y J. Agric. 111697.
Hollon, B.F., C. Branton, R.E. Mc Dowel1 and Meyerhoeffer. 1967. Reproductive performance of purebred versus crossbred dairy catt1e. J. Dairy Sei. 501611.
Hooper, P.T. and G.A. Letts. 1962. Pre1iminary ferti1ity studies in beef catt1e in the Northern Territory. Austr. Vet. J. 38.73.
Horvath, M. 1966. Data on the reproduction of high yie1ding cOWS. Magy. Al1atorv. Lap. 211307. (Anim. Breed. Abstr. 1330. 1967).
Howes, J.R., J.F. Hentges, (Jr.), A.C. Warnick and T.J. Cunha. 1963. Comparative growth and reproduction of Hereford and Brahrnan Catt1e in F10rida. Quart. J. Fla. Acad. Sei. 26136. (Anim. Breed. Abstr. 32, No. 1907).
Hutton, J.B. 1963. Effect o~ lactation on intake in dairy cow. Proc. N.Z. Soc. Anirn. Prod. 23139.

183
Jakobsen, P.E. 1957. Protein synthesis in foetal deve10pment. Inst. Sterilitetsforsk. Copenh. Report No. 299.
Janzen, R. 1957. Three feed supplements for dairy herd sterility. Disso Hannover.
Jaskowski, L., L. Wa1kowski, T. Rulski, L. Szulc and B. Klosowski. 1966. Badania nad wp1ywem podklinicznych postaci hypowitaminosy A na produkcje i jakosc nasienia buhajow. Polskie Archwm wet. 10.191. (Anim. Breed. Abstr. 35, 3568).
Johnson, A.D. and L.C. Ulberg. 1967. Heat detection pays big dividends. Hoard's Dairyman 112.1167.
Johnson, H.D., A.C. Ragsdale, I.L. Berry, M.D. Shanklin and S. Mc Larney. 1963. Environmental physiology and shelter engineering with special reference to domestic animaIs.' LXVI. Temperature-humidity effects including influence of acclimation in feed and water consumption of Holstein cattle. Mo. Agric. Exp. Stn. Res. Bull. No. 846.
Johnson, H.D., A.C. Ragsdale and R.G. Yeck. 1958. Environrnental physio10gy and shelter engineering with special reference to domestic animaIs. XLIX. Effects of 500 and 800F on the feed and water consumption of Brahman, Santa Gertrudis and Shorthorn calves during growth. Mo. Agric. Exp. Stn. Res. Bull. No. 683.
Johnson, H.D., A.C. Ragsdale, R.G. Yeck and J.F. Jones. 1960. Environrnental physiology and shelter engineering with special reference to domestic animaIs. LIX. The effects of constant environmental temperatures 500 or 800F on the feed and water consumption of Holstein,Brown-Swiss and Jersey calves during growth. Mo. Agric. Exp. Stn. Res. Bull. No. 786.
Johnson, K.R. 1966. Estrus intensity in dairy cattle. J. Dairy Sei. 49=731.
~
Johnston, J.E., G.A. Hindery, D.H. Hill and A.J. Guldry. 1961a. Factors concerned in hot weather effects on growth and feed efficiency of dairy heifers. J. Dairy Sei. 44.976.
Johnston, J.E., G.A. Hindery, D.H. Hill and A.J. Guidry. 1961b. Effect of sudden exposure to hot conditions on physiological functions of dairy heifersa J. Dairy Sei. 44.1191.

184
Johnston, J.E., H. Naelapo and J.B. Frye. 1963. Physiological responses of Holstein, Brown Swiss and Red Sindhi crossbred bulls exposed to high temperatures and humidities. J. Animal Sci. 22:2
Joubert, D.M. 1954. The influence of high and low nutritional planes on the oestrus cycle and conc"eption rate of heifers. J. Agric. Sci. 45.164
Kelly, J.W. and V. Hurst. 1963. The effect of season on fertility of the dairy bull and the dairy cow. J. Amer. Veto Med. Assoc. 143.40.
Kendall. K.A., K.E. Harshbarger, R.L. Hays, E.E. Ormiston and S.L. Spahr. 1970. Responses of dairy cows to diets containing varied levels of calcium and phosphorous. J. Dairy Sci. 531681.
Kendall, K.A., R.L. Hays and E.E. Ormiston. 1968. Postpartum serum calcium and phosphorous levels associated with calcium carbonate and monosodium phosphate feeding. J. Dairy Sci. 51.978. "
Kidner, E.M. 1966. Seasonal body weight changes in suckled Boran cows at pasture and their probable association with the interval between calvings. E. Afr. Agric. For. J. 31'399.
King, J.O.L. 1968. The relationship between the conception rate and cpanges in body weight, yield and SNF content of milk in dairy cows. Veto Rec. 831492.
Kleiber, M., H.H.Goss and H.R. Guilbert. 1936. Phosphorous deficiency metabolism and food utilization in beef heifers. J. Nutr. 121121.
Knudsen, P.B. and A.S. Sohael. 1970. The Vom Herdl A study of the performance of a mixed Friesia~Zebu he rd in a tropical environment. Trop. Agric. Trin. 471189.
Krolak, M. 1968. Effect of manganese, added to the diet, on cattle fertility and manganese content in hairs. Polskie Archv~. weto Il.293.
Kupferschmied, H. and W.F. Rehm. 1968. Vitamin A and male fertility. Wien. Tierarztl. Mschr. 551504. (Besamungsstation, Pierrabot, Neuenburg Switzerland). Veto Bull~ 391706. "
Laing, J.A. 1955. Fertility and Infertility in the Domestic AnimaIs. lst Ed. Bailliere, Tindall and Cox, Lond.

185
Lamb, R.C., C.H. Mickelsen and L.L. Perkes. 1965. Influence of sire and ration on reproductive performance of dairy cows. J. Dairy Sei. 48.823.
Lamond, D.R. 1968. Nutrition and reproduction in Bovine infertility. Wellington, N.Z. Edit. Services. Ltd. p.7l.
Lamond, D.R. 1969a. Sources of variation in reproductive performance in selected herds of beef cattle in northeastern Australia. Austr. Veto J. 45.50.
Lamond, D.R. 1970. The influence of undernutrition on reproduction in the cow. Anim. Breed. Abstr. 38'359.
Lamond, D.R. 1970a. The effect of pregnant mare serum gonadotrophin (P~~) on ovarian function of beef heifers, as influenced by progestins, plane of nutrition and fasting. Austr. J. Agric. Res. 21.153.
Lamond, D.R. 1970b. Nutrient status in relation to reproduction. Abstr. in J. Animal Sei. 30'322.
Lane, A.G., J.R. Campbell and G.F. Krause. 1968. Blood mineraI composition in ruminants. J. Animal Sei. 2.766.
Leathem, J.H. 1966. Nutritional effects on hormone production. J. Animal Sei. 25.68.
Le Roux, D.L. 1960. Poor fertility in dairy herds. J. S. Afr. Veto Med. Assoc. 31.107.
Lewis, R.C. and R.E. Horwood. 1950. The influence of age, level of production and management on calving interval. Quart. Bull. Mich. St. Univ. Agric. Exp. Stn. 32.546.
Little, D.A. 1970. Factors of importance in the phosphorous nutrition of beef cattle in Northern Australia. Austr. Veto J. 46.241.
Littlejohn, A.I. and G. Lewis. 1960. Experimental studies of the relationship between calcium.phosphorous ratio of the diet and fertility of heifers. Veto Rec. 72.1137.
Lotan, E. and J.H. Adler. 1966. Early effects of excessive alfalfa feeding on bovine fertility. Refuah Veto 23.110.
Louca, A. and J.E. Legates. 1967. Losses in yield due to excessive days open Abstr. J. Dairy Sei. 50.975.

'.
186
Mahadevan, P. 1966. Breeding for milk production in Tropical cattle. Tech. Commun. Commonw. Bur. Anim. Breed. Genet. No. 17. Farnham Royal, Bucks. Commonwealth Agricultural Bureaux.
Mahadevan, P., J.G. Davidson, S.J. Cawlishaw, A.G. Searle, P.S. Long and H.E. Johansson. 1968. The performance of grade Holstein cattle in the southern Caribbean. Paper presented at the Second World Conference on Animal Prod. Univ. Maryland. U.S.A.
Mahadevan, P. and A.G. Searle. 1968. Performance of Grade Holstein cattle in Barbados. Livestock Conference, Barbados. W.I. (Unpublished).
Malan, A.L., H.H. Green and P.J. du Toit. 1928. Studies in mineraI metabolism. V. Composition of Bovine Blood on phosphorous deficient pasture. J. Agric. Sci.181376.
Mann, T., L.E.A. Rowson, R.V. Short and J.D. Skinner. 1967. The relationship between nutrition and androgenic activity in pubescent twin calves, and the effect of orchitis. J. Endocr. 38,455.
Mc Clure, T.J. 1961. An apparent nutritional lactational stress infertility in dairy herds. N.Z. Veto J. 91107.
Mr Clure, T.J. 1965a. Experimental evidence ~or the occurrence of nutritional infertility in otherwise clinically healthy pasture-fed lactating dairy cows. Res. Veto Sci. 61202.
Mc Clure, T.J. 1965b. A nutritional cause of low non-return rates in dairy herds. Austr. Veto J. 411119.
Mc Clure, T.J. 1966. Infertility in mice caused by fasting at about the time of mating. 1. Mating behaviour and littering rates. J. Reprod. Fert. 121243.
Mc Clure, T.J. 1967a. Infertility in mice caused by fasting at about the time of mating. II. Pathological changes. J. Reprod. Fert. 131387.
Mc Clure, T.J. 1967b. Infertility in mice causedby fasting at about time of mating. III. Pathogenesis. J. Reprod. Fert. 131393.
Mc Clure, T.J. 1968a. Hypoglycaemia, an apparent cause of infertility of lactating cows. Brit. Veto J. 1241126.
Mc Clure, T.J. 1968b. Malnutrition and infertility of cattle in Australia and New Zealand. Austr. Vetl J. 441134.

187
Mc Clure, T.J. 1970. A review of developments in nutrition as it is related to fertility in cattlel 1964-9. N.Z. Veto J. 18.61.
Mc Clure, T.J. and A.E. Dowell. 1968. Surveyof dairy herds in the Moss Vale district of New South Wales. I. Disease wastage. Austr. Veto J. 441536.
Mc Clure, T.J. and A.E. Dowell. 1969. Surveyof dairy herds in the Moss Vale district of New South Wales. II. Fertility of herds. Austr. Veto J. 45141.
Mc Intyre, K.H. 1971. Milk production from Bos taurus dairy cows in Fiji. Trop. Agric. Trin. ~3l7.
Mc Taggart, H.S. 1961. Relationship between level of milk production and fertility of dairy cows at grasse Vet. Rec. 731801.
Meacham, T.N., K.P Bovard, B.M. Priode and J.P. Fontenot. 1970. Effect of supplemental vitamin A on the performance of cows and their calves. J. Animal Sci. 311428.
Meigs, E.B., W.A. Turner, E.A. Kane and L.A. Shinn. 1935. The effects, on càlcium and phosphorous metabolism in dairy cows, of feeding low-calcium rations for long periods. J. Agric. Res. 5111
Melrose, D.R. and B.B. Brown. 1962. Some observations on the possible effect o~ Kale feeding on fertility in dairy cattle. J. Reprod. Fert. 41232.
Milford, R. and D.J. Minson. 1966. The feeding value of tropical pastures "Tropical Pastures" by Davies and Skidmore. Faber & Faber, Lond.
Mills, M.S. 1969. Report on infertility and artificial insemination in cattle in Trinidad and Tobago. Ministry of Agric. St. Clair. Trinidad.
Minson, D.J. and R. Milford. 1966. The energy values and nutri"tive value indices of Digi taria decumbens, Sorghum almum, and Phaseolus atronurpureus. Austr. J. of Agric. Res. 171411
Morris, S. and S.C. Ray. 1939. The effect of a phosphorous deficiency on the protein and mineraI metabolism of sheep. Biochem. J. 3311209.
Morrison, F.B. 1959. Feeds and Feeding, 22nd Edition. The Morrison Publishing Company, Clinton, Iowa.

, , ~ .... '
188
Morrow, D.A. 1969. Phosphorous deficiency and infertility in dairy heifers. J. Amer. Veto Med. Assoc. 154t761.
Morrow, D.A. 1970. Diagnosis and prevention of infertility in cattle. J. Dairy Sci. 531961.
Morrow, D.A., S.J. Roberts, K. Mc Entee and R.G. Gray. 1966. Postpartum ovarian activity and uterine involution in cattle. J. Amer. Veto Med. Assoc. 149:1596.
Morrow, D.A., H.F. Tyrrell and G.W. Trimberger. 1969. Effects of liberal concentrate feeding on reproduction in dairy cattle. 'J. Amer. Veto Med. Assoc. 15511946.
Munro, I.B. 1957. Infectious and non-infectious herd fertility in East Anglia. Veto Rec. 691125.
Nicholson, J.W.G. and H.M. Cunningham. 1965. Retained placenta, abortions and abnormal calves from beef cows fed aIl barley rations~ Cano Veto J. 6.275.
Olds, D. 1969. fertility.
An objective consideration of dairy herd J. Amer. Veto Med. Assoc. 154:253.
O'Moore, L.B. 1950. Aphosphorosis in Ireland. Nature 165:192.
O'Moore, L.B. 1952. Problems in animal health associated with mineraI imbalance in grazing herbage. Veto Rec. 641475.
O'Moore, L.B. 1960. In "Production and use of grass." Soc. Chem. Ind. Monograph No. 9.
Palmer, L.S. and C.H. Eckles. 1927. Effect of phosphorous deficient rations on blood composition. Proc. Soc. Exptl. Biol. & Med. 241307.
Palmer, L,.S., C.P • Fitch, T.W. Gullickson and W.L. Boyd. 1935. Supplementary report of an experiment to determine the effect of a low calcium ration on reproduction in cattle. Cornell Veto 251229.
Palmer, L.S., T.W. Gullickson, W.L. Boyd, C.P. Fitch and J.W. Nelson. 1941. The effect of rations deficient in phosphorous and protein on ovulation, estrus, and reproduction of dairy heifers. J. Dairy Sci. 24:199.
Patel, R.D. and B.M. Patel. 1963. Increase in the milk production of cows due to s,uckling of cal ves. Indian J. Dairy Sci. 16.126.
Payne, W.J.A. 1970. Cattle Production in the Tropics. Volume 1. Longman Group Limited, Lond.

189
Payne, WoJoA and J. Hancock. 1957. The direct effect of tropical climate on the performance of European-type cattle. II. Production.Emp. J. Exp. Agric. 25'321.
Pelissier, C.L. 1970. Factors contributing to low breeding efficiency in dairy herds. J. Dairy Sei. 531684.
Pelissier, C.L. 1972. Herd Breeding Problems and their Consequences. J. Dairy Sei. 55.385.
Quintyne, R.C. 1972. The effect of stage of growth and level of nitrogen fertilization on the yield and nutritive value of pangola grass (Digi-caria decumbens Stent.) M. Sc. Thesis Macdonald College, Mc Gill Univ. Montreal.
Ragsdale, AoC., S. Brody, H.J. Thompson and D.M. Worstell. 1948. Environmental Physiology. Influence of temperature 500 - 1050 F on milk production and feed consumption in dairy cattle. Mo. Agric. Exp. Stn. Res. Bull.425.
Ragsdale, A.C., H.J. Thompson, D.M. Worstell and S. Brody. 1953. Environmental physiology and shelter-engineering with special reference to domestic animaIs. XXI. The effect of humidity on milk production and composition, feed and water consumption, and body weight in cattle. Mo. Agric. Exp. Stn. Res. Bull. No. 521.
Rakha, A.M. and G. Igboeli. 1971. Effects of nutrition, season and age on the estrous cycle of indigenous Central African Cattle. J. Animal Sei. 32.943.
Randel, PIF. and L.L. Rusoff. 1963. Effect of heat stress on growth, feed consumption,and digestibility in Holstein calves from birth to 90 days of age. J. Dairy Sei. 46.368.
Rasbech, N.O. 1968. Manganese concentrations in of heifers fed various amounts of manganese. 3157. (Vet. Bull. 39.772.)
Reed, H.C.B. 1961. The relationship between Kale in dairy cattle. Proceedings IVth Int. Congo The Hague, p.457.
the avaries Zucht Hyg.
and fertility Anim. Reprod.
Reid, J.T., J.K. Loosli, G.W. Trimberger, K.L. Turk, S.A. Asdell and S.E. Smith. 1964. Causes and prevention of reproductive failures in dairy cattle. IV. Effect of plane of nutrition during early life on growth, reproduction, health and longevity of Holstein cows. 1. Birth to fifth calving. Cornell Univ. Agric. Exp. Stn. Bull. No. 987.

Reynolds, W.L., T.M. De Rouen, J.W. High, E.J. Warrick and R.S. Temple. 1964. pastures in terms of reproduction of J. Animal Sei. 231890.
190
J.N. Wiltbank, Eva 1 ua tion of
beef cattle.
Rice, E.B. 1965. Milk production in warm climates. Dairy Sei. Abstr. 27143
Richter, H. and M. Schroder. 1964. Manganese content of cattle hair. Mh. Vet. Med. 191180 .
Richter, K. 1957, 1958. Causes of increased incidence of sterility among cattle and possibilities of control. Prakt. Tierarzt No. 12, 357 and No. l, 4.
Ricketts, R.E. and J.R. Campbell. 1971. What calcium and phosphorous ratio for Holstein steers? Hoard's Dairyman. 116 No. 4.
Riddell, W.H., J.S. Hughes and C.P. Fitch. relation of phosphorous deficiency to of feed in dairy cattle. Tech. Bull. Stn. No. 36.
1934. The the utilization Kans. Agric. Exp.
Robinson, K.W. and G.H. Klemm. 1953. A study of heat tolerance of Grade Australian Illawarra Shorthorn cows during early lactation. Austr. J. Agric. Res. 41224.
Rojas, M.A., I.A. Dyer and W.A. Cassatt. 1965. Ma~anese deficiency in the bovine. J. Animal Sei. 24166*.
Rose, W.K., E.A. Irving and R.M. Hetherington. 1963. Analysis of feeds of dairy cattle in South Australia with special reference to calciumlphosphorous ratio. Austr. Veto J. 391253.
Rusoff, L.L. 1950. Effect of calcium on reproduction and milk production in dairy cows. J. Animal Sei. 91666.
Rusoff, L.L., J.B. Frye and G.W. Scott. 1951. Blood studies of Red Sindhi-Jersey crosses. I. Hemoglobin, hematocrit, plasmal calcium and plasma inorganic phosphorous values of Red Sindhi and Jersey daughters and their Jersey dams. J. Dairy Sei. 34.1145.
Rusoff, L.L., M.W. Schein and J.J. Vizinat. 1955. Blood studies of Red Sindhi-Jersey crossesl III. Effect of a fixed hot environment on blood constituent levels of Jerseys and Sindhi-Jersey crosses. Science 121.437.

191
Saiduddin, S., J.W. Riesen, W.E. Graves, W.J. Tyler and L.E. Cassida. 1967. Effect of suckling on the interva1 from parturition to first estrus in dairy cows. J. Animal Sci. 261950.
Salisbury, G.W. and N.L. Van Demark. 1961. Physio10gy of Reproduction and Artificial Insemination of Cattle. W.H. Freeman and Co., San Francisco.
Sanchez-Garnica Montes, ç. and J. Brenes Paya. 1963. Effects of mineraI imbalance on fertility of dairy cows. Proc. XVII. Wor1d Vet. Congo 1.261.
Schalm, O.W. 1965. Veterinary Hematology. Second Edition. Lea & Febiger, Philadelphia.
Schmidt, K., A.B. El Wishy and M. Salah-Ed-Din. 1965. Influence of calcium, phosphorous, manganese, vitamin D and iodine on fertility in Egyptian buffaloes. Vet. Med. J. Giza. 10.205.
Sheehy, E.J. 1946. Aphosphorosis in cattle in Offaly. Nature, 157.442.
Short, R.E. and R.A. Bellows. 1971. Relationships among weight gains, age at puberty and reproductive performance in heifers. J. Animal Sci. 321127.
Simonsen, D.G., M. Wertman, L.M. Westover and J.W. Mehl. 1946. The determination of serum phosphate by the Molybdivanadate Method. J. Biol. Chem. 166.747.
Snook, L.C. 1964. Reproductive efficiency in dairy cows due to lack of phosphorous in the diet. Int. Congo Anim. Reprod. and Insem. 5.148.
Sorenson, A.M., W. Hansel, W.H. Hough, D.T. Armstrong, K. Mc Entee and R.W. Bratton. 1959. Causes and prevention of reproductive failures in dairy catt1e. Cornell Univ. Agric. Exp. Stn. Bull. 936.
Sparkle, E.J. and D.R. Lamond. 1968. The influence of supplementary feeding on growth and fertility of beef heifers grazing natural pasture. Austr. J. Exp. Agric. Anim. Husb. 8.425.
Speicher, J.A. and C. Meadows. 1967. Milk production and costs associated with length of calving intervals of Holstein cows. J. Dairy Sei. 501975.

(
Steel, R.G.D. and J.H. Torrie. Procedures of Statistics. Inc. N.Y.
1960. Principles and Mc Graw Hill Book Co.
192
Steele, J.R.~ C. Branton, B. Hollon and R.E. Mc Dowell. 1967. Some phenotypic relationships between measures of fertility and milk yields in dairy cattle. J. Dairy Sei. 50:ô12.
Steevens, B.J., L.J. Bush and J.D. Stout. 1971. Effects of varying amounts of calcium and phosphorous in rations of dairy cows. J. Dairy Sei. 541655.
Stott, G.H. 1965. Parturient paresis related to dietary phosphorous. J. Dairy Sei. 4811485.
Sutherland, D.N. 1959. Factors affecting the performance of beef cattle on unimproved pastures in Queensland. Austr. Vet. J. 351120.
Swanson, E.W. 1967. Optimum§rowth patterns for dairy cattle. J. Dairy Sei. 501244.
Tesink,J. 1962. Bovine fertility and mineraI supplementation of the ration. Tijdschr. Diergen, 8711219.
Tesink, J. 1963. Feeding trials wi th manganese supplement'. Tijdschr. Diergen, 88147.
Thain, R.I. 1965. Bovine infertility possibly caused by subterranean cloverl a preliminary report. Austr. Vet. J. 4-11277.
Thain, R.I. 1966. Bovine infertility possibly caused by subterranean cloverl further report and herd histories. Austr. Vet. J. 421199.
Thain, R.I. 1967. Evidence for the widespread involvement of clover pastures in bovine infertility in Tasmania. Austr. J. Sei. 291220.
Theiler, A., P.J. Du Toit and A.I. Malan. 1937. Studies in mineraI metabolism. 37. The influence of variations in the dietary phosphorous and the CalP ratio on the production of rickets in cattle. Onderstepoort J. Vet. Sei. Anim. Ind. 81375.
Theiler, A and H.H. Green. 1932. Aphosphorosis in ruminants. Nutr. Abstr. and Rev. 11359.

193
Theiler, A., H.H. Green and P.J. Du Toit. 1924. Phosphorous in the Livestock Industry. J. Dept. Agric. Univ. S. Afr. 81460.
Theiler, A., H.H. Green and P.J. Du Toit. 1927. Minimal mineraI requirements in cattle. J. Agric. Sei. 171291.
Touchberry, R.W.,K. Rottensten and H. Andersen. 1959. Associations between service interval, interval from first service to conception, number of services-per conception, and level of butterfat production. J. Dairy Sei. 4211157.
Trail, J.C.M. and H.J.S. Marples. 1968. Friesian Cattle in Uganda. Trop. Agric. Trin,,- 45.17.3.
Turman, E.J., L. Smithson, L.S. Pope, R.E. Renbarger and D.F. Stephens. 1964. Effect of feed level before and after calving on the performance of two-year old heifers. Feeding and breeding tests. Mise. Pub. Oklahoma Agric. Exp. Stn. MP-74, 10.
Ulberg, L.C. 1958. The influence of high temperature on reproduction. J. Heredity 4912.
Underwood, E.J. 1956.. Trace elements in human and animal nutri tion. Acad~' Press Inc. U.S.A.
Underwood, E.J. 1966. The Mineral Nutrition of Livestock. C.A.B. Farnham Royal.
Van Demark, N.L., G.R. Fritz and R.E. Mauger. 1964. Effect of energy intake on reproductive performance of dairy bulls. II. Semen production and replenishment. J. Dairy Sei. 47.898.
Van Demark, N.L. and R.E. Mauger. 1964. Effect of energy intake on reproductive performance of dairy bulls. I. Growth reproductive organs, and puberty. J. Dairy Sei. 47'798.
Van Demark, N.L. and G.W.-Salisbury. 1950. The relation of postpartum breeding interval to reproductive efficiency, in the dairy cow. J. Animal Sei. 9'.307.
Van Rensburg, S.W.J. and W.H. de Vos. 1966. The influence of excess fluorine intake in the drinking water on reproductive efficiency in bovines. Onderstepoort J. Veto Res • .33:185.

194
Varejcko, J. 1968. Relationship between milk production and fertility in Kravarsky cattle. I. Relationship between milk production and conception rate. Acta. Univ. Agric. Fac. Veto Brno. 37.1. (Anim. Breed Abstr. 37.334) •
Vicente-Chandler, J., R. Caro-Costas, R.W. Pearson, F. Abruna, J. Figarella and S. Silva. 1964., The intensive management of tropical forages in Puerto Rico. Univ. of Puerto Rico Agric. Exp. Stn. Bull. 187.136.
Vicente-Chandler, J., J. Figarella and S. Silva. 1961. Effects of nitrogen fertilization and frequency of cutting on the yield and composition of pangola grass in Puerto Rico. J. Agric. Univ. P.R. 45'37.
Wallis, G.C. 1938. Some effects of a vitamin D deficiency on mature dairy cows. J. Dairy Sei. 21'315.
Ward, G., G.B. Marion, C.;"'. Campbell and ,J.R. Dunham. 1971. Influences of calcium intake and vitamin D supplementation on reproductive performance of dairy cows. J. Dairy Sei. 54.204.
Warnick, A.C. 1959. Mimeo.Series No. 59-10. Fla. Agric. Exp. Stn. 4. Cited by Donaldson, L.E., J.B. Ritson and D.B. Copeman. 1967. The reproductive efficiency of several north Queensland beef herds. I. Physiological and managemental factors and embryonic neonatal losses. Austr. Veta J. 43:1.
Warnick, A.C., M. Koger, A. Martinez and T.J. Cunha. 1965. Productivity of beef cows as influenced by pasture and winter supplement during growth. Fla. Agric. Exp. Stn. Bull. No. 095.
Wayman, O., H.D. Johnson, C.P. Merilan and I.L. Berry. 1962. Effect of ad libitum or force-feeding of two:rations on lactating dairy cows subject to temperature stress. J. Dairy Sei. 45.1472.
Webster, B.M. 1932. Bovine sterility in New Zealand. Austr. Veto J. 8.199.
Wellington, K.E., P. Mahadevan and K.L. Roache. 1970. Production characteristics of Jamaica Hope breed of 'dairy cattle. J. Agric. Sei. 74.463.
Welton, R.F. 1968. The efficiency of various laboratory methods for the evaluation of farm-produced forages. M. Sc. Thesis. Mc Gill Univ. Montreal.

195
Williams, H.E. and F.O. Gonzalez. 1968. Two tick-borne diseases affecting Exotic Cattle introduced into Trinidad. Trop. Agric. Trin. 45.23.
Wilson, J.G. 1952. Herd functional infertility, with reference to nutrition and mineraI intake. Vec. Rec. 64:621.
Wilson, J.G. 1966. Bovine functional infertility in Devon and Cornwall. Response to manganese therapy •
... Veto Rec. 791562.
Wiltbank, J.N. and A.C. Cook. 1958. The comparative reproductive performance of nursed cows and milked cows. J. Animal Sei. 171640.
Wiltbank, J.N., J. Bond, E.J. Warwick. R.E. Davis, A.C. Cook, W.L. Reynolds and M.W. Hazen. 1965. Influence of total feed and protein intake on reproductive performance in the beef female through second calving. Agric. Res. Serve Tech. Bull. No. 1314. U.S. Dept. Agric. Washington, D.C.
Wiltbank, J.N., W.W. Rowden, J.E. Ingalls, K.E. Gregory and R.M. Koch. 1962. Effect of energy level on reproductive phenomena of mature Hereford cows. J. Animal Sei. 21.219.
Wiltbank, J.N., W.W. Rowden, J.E. Ingalls and D.R. Zimmerman. 1964. Influence of post-partum energy level on reproductive performance of Hereford cows restricted in energy intake prior to calving. J. Animal Sei. 2311049.
Wise, M.B., ~ .• L. Ordoveza and E.R. Barrick. 1963. Influence of variations in dietary calcium.phosphorous ratio and performance and blood constituents of calves. J. Nutr. 79.79.
Wood, A.S. and J.W. Kramer. 1968. Blood values observed in some breeds of cattle in the savannah region of Nigeria. Trop. Agric. Trin. 451187.
Worstell, D.M. and S. Brody. 1953. Environmental Physiology. XX. Comparative physiological reactions of European and Indian cattle to changing temperature. Mo. Agric. Exp. Stn. Res. Bull. No. 515.
Wright, N.C. 1946. Report on development of cattle breeding and milk production in Ceylon. Ceylon Gov't. Paper No.20. ColombolCeylon Gov't.Press.

196
Young, J.S. 1965. Inferti1ity in range catt1e. N.Z. Veto J. 1311
Zemjanis, R. 1965. Report on catt1e ferti1ity survey and re1ated activities. Agency for Int. Dev. cio Amer. Emb. Kingston, Jamaica.
Zemjanis, RO., M.L. Fahning and Schultz. 1969. Anestrusthe practitioner's di1emma. Veto Scope. 1411.

( \
197
Appendix Table 1. Chemica1 Composition of Grain Mixtures fed on Quebec Farms.
On a Dry Matter Basis ~Moisture freel Farm D.M. Est. Crude Ce11u- Ca P No. TDN (%) Pro- 10se
or ENE tein ~ Mca1L4.!2.4 kg ~ ~ ~ ~
A 86.8 68 18.9 10.8 0.96 0.96 B 87.1 69 17.,3 9.9 0.55 0.86 C 80.5 72 1,3.8 8.0 0.78 0.8,3 D 84.9 71 14.8 8.6 0.,38 0.57 E 90.0 7,3 1,3.8 7.2 0.75 0.57 F 90.0 72 19.4 9.2 1.00 1.02 G 80.7 69 14.8 9.9 0.82 0.62 H 90.0 74 16.4 6.9 0.78 0.78 l 90.0 72 14.,3 8.5 0.95 1.02 J 89.1 72 15.2 8.4 0.67 0.79 K 90.0 70 1,3.8 9.5 0.56 1.11

." ...... ~.'
Appendix Table 2. Amount Fed and Chemiea1 Composition of Si1age on Quebee Farms.
On a Dry Matter Basis (moisture free) Farm Amount Fed D.M. ENE Crude Ca P
per 1000 lb (454 kg) Content Meal per Pro-eow 45.4 kg tein
lb. k~_~_ % % ~ ___ %
A 30 13.6 26.8 51 7.9 0.27 0.18 B 30 13.6 30.3 52 7.2 0.18 0.18 C 50 22.7 30.6 52 7.6 0.39 0.22 D 22 10.0 25.4 59 8.1 0.24 0.15 E 20 9.1 31.2 34 9.0 0.15 0.04 F 40 18.2 28.9 51 6.6 0.07 0.05 G 50 22.7 29.9 52 9.0 0.62 0.13 H
l 20 9.1 28.6 36 13.1 0.76 0.18 J 35 15.9 28.2 51 7.4 0.25 0011 K 45 20.5 30.9 34 4.2 0.07 0.06
1-' 'Ü (Xl

-'~'-
Appendix Table 3. Amount Fed and Chemiea1 Composition of Hays on Quebee Farms.
On a Drl Matter Basis ~moisture free) Farm Amount Fed D.M. ENE Crude Ca P
per 1000 lb (454 kg) Content Meal per Pro-eow 45.4 kg tein
lb. kg. % \
% % % 1
0'.67 A 17 7.7 93.5 36 10.7 0.17 B 17 7.7 93.2 35 10.7 0.69 0.16 C 17 7.7 91.0 45 14.4 1.29 0.1) D 16 7.3 94.9 44 12.6 1.26 0.18 E 25 Il.4 92.3 38 10.7 0.47 0.14 F Il 5.0 91.3 36 9.0 0.49 0.12 G 14 6.4 90.9 42 12.2 1.40 0.12 H 28 12.7 91.5 33 5.7 0.37 0.10 l 10 4.5 90.1 40 10.7 0.70 0.18 J 1) 5.9 89.7 34 7.1 0.42 0.12 K 15 6.8 91.0 36 10.1 0.40 0.17
".-
1-' \0 '\,()

Appendix Table 4. Average Composition of Concentrates analysed from Trinidad.
On -a~r;y: Matter Basfs (moisturefréj] Ingredient No. of D.M. Crude Ce11u- Ca P
Samp1es Content Protein 10se % % % % %
Wheat Midd1ings 1 91.9 19.4 9.4 0.17 1.21 Coconut Meal 4 94.3 24.0 17.6 0.09 0.58 Pea Hulls 2 92.3 6.8 67.2 0.50 0.13 Citrus Pu1p 1 92.8 5.9 26.1 1.71 0.09 Dairy Ration 1 3 92.9 17.8 12.1 1.36 1.18 Dairy Ration 2 4 90.8 16.8 10.4 1.36 0.78 Dairy Ration 3 4 92.1 17.3 12.3 1.17 1.04 Dairy Ration 4 1 91.9 19.1 25.7 0.73 0.63
,/
N o o

201
Appendix Table,. Estimated TDN or ENE values of eoneentrates fed to Trinidad herds as extrapolated from Figure 1 using laboratory cellulose analyses.
Cellulose Estimated TDN(%) % or ENE
(Meal per 45.4 kg)
Standard Dairy Ration (Theoretiea1 Values)
9.34 68.7
Manufaetured Rations 12.9 63.1
" " 10., 67.0
" " 12.1 64.7
" .. 12.6 63.8
" " 10.0 67.8
" " 10.6 66.8
" " 10.8 66.3
" " 12·3 64.2 " " 13.4 62.,
" " 12.9 63.2 " " Il.4 64.2
" " 9.1 69.0

202
, \_, Appendix Table 6. Average composition of Pango1a grass
(Digitaria decumbens, Stent.) found on pastures surveyed.
On a Dr~ Matter Basis ~moisture free~ Farm D.M. ENE Crude Ce11u- Ca. P No. Content Mca1 per Pro- 10se
45.4 kg tein % % % % %
1 18.7 25.1 9.6 40.0 0.40 0.43 2 Il.9 36.7 18.8 32.1 0.38 0.38
3 19.2 37.4 15.6 34.3 0.52 0.34 4 14.8 35.7 14.8 33.1 0.40 0.26
5 15.4 31.6 15.9 35.3 0.24 0.27 6 12.9 30.5 10.8 33.9. 0.20 0.22
7 21.2 30.6 9.7 33.4 0.29 0.28 8 18.5 34.9 14.9 33.8 0.23 0.28
9 14.4 31.7 7.6 31.5 0.27 0.21 10 19.7 29.1 8.2 36.0 0.30 0.24 Il 21.9 29.0 6.2 32.6 0.29 0.28 12 19.3 31.2 8.9 35.2 0.34 0.30 13 16.4 35.1 14.6 33·3 0.38 0.32 14 13.2 30.0 7.8 36.8 0.33 0.18 15 20.8 37.1 10.4 33.8 0.20 0.23 16 15.5 32.8 14.1 35.1 0.27 0.19 17 21.8 28.2 8.4 37.0 0.52 0.20 18 14.8 35.6 13.9 31.8 0.47 0.25 19 15.6 33.8 14.4 32.0 0.46 0.29 20 21.9 27.6 8.6 32.4 0.40 0.20 21 16.0 32.1 10.1 35.2 0.32 0.28 22 15.8 , . ;3.2 13.6 32 • .5 0.49 0.34 23 14.7 35.2 16.3 33·0 0.33 0.30
( ' '
\.

20.3
"- ~) Appendix Table 6 Cont'd.
On a Dry Matter Basis (moisture free) Farm D.M. ENE Crude Cel1u- Ca P No. Content Meal per Pro- lose
45.4 kg tein % % % % %
24 15.4 29.4 Il.8 .37 • .3 0.18 0 • .31 25 14.7 29.4 Il.8 .37 • .3 0 • .3.3 0 • .30 26 15.4 .31.8 14.9 .3.3.9 0.29 0 • .31 27 14.7 29.4 Il.7 .37 • .3 0 • .30 0 • .30 28 16.2 .35 • .3 1.3.0 .35 • .3 0.22 0.2.3 29 19.6 .31.2 10.8 .34.2 0.27 0 • .30 .30 11.9 .35.1 Il.5 .34.1 0 • .31 0.29 Govern- 15.6 .36.6 17 • .3 .3.3.1 0.44 0 • .35 ment Farm 20.9 .32.7 11.6 .36.5 0.25 0.21

204
Appendix Table 7. Average composition of Napier grass (Pennisitum purpurem) collected on some farms.
On a Dry Matter Basis (moisture free) Farm D.M. ENE Crude Cellu- Ca P No. Content Meal per Pro- lose
45.4 kg tein % % % % %
1 1,3.0 4,3.4 16.4 ,3,3.,3 0.52 0.26 ,3 26.8 28.4 10.2 ,36.1 0.19 0.22
10 1,3.6 ,36.7 8.,3 ,35.8 0.24 0.,31 16 14.4 ,35.,3 8.8 ,34.8 0.49 0.16 24 15.8 ,3,3.8 Il.7 ,34.4 0.26 0.45 29 17.8 ,31.7 9.4 ,34.7 0.17 0.22 Govern- Il.7 5,3.6 18.9 28.4 0.78 0.59 ment

205
Appendix Table 8. Dai1y Nutrient Requirements of Dairy Catt1e1 •
Body Weight Protein NE Crude Dig. Lactating Ca P
Cows (kg) (g) (Meal) (g) (g)
Maintenance of Mature Lactating Cows
350 468 220 6.9 14 Il
400 521 245 7.6 17 13 450 585 275 8.3 18 14 500 638 300 9.0 20 15 550 691 325 9.6 21. 16 600 734 345 10.3 22 17 650 776 365 10.9 23 18 700 830 390 Il.6 25 19 750 872 410 12.2 26 20 800 915 430 12.8 27 21
Mi1k Production (Nutrients required per kg of Mi1k)
% Fat 3.5 74 48 0.69 2.6 1.9 4.0 78 51 0.74 2.7 2.0
1 Nutrient Requirements of Dairy Catt1e Fourth revised edition, 1971 National Academy of Sciences Washington, D.C.

206
\ .... .... Appendix Table 9 • Ana1ysis of variance for services per conception (Herd effects removed).
Quebec Herds.
F. Value Source D.F. M.S. Obs 5% 1%
Herds 10 18.80 Lactation Number 3 0.33 1.16 2.76 4.13 Body Weight 1 2.30 1.17 4.00 7.08
** Yie1d 1 15.00 7.75 Protein 1 1.30 0.67 Calcium 1 0.23 0.11 Phosphorous 1 3.84 1.98 N. Energy 1 0.94 0.48 Error 70 0.20
Appendix Table 10. Ana1ysis of variance for services per conception (Herd effects removed). Trinidad Herds.
F. Value Source D.F. M.S •. Obs 5% 1%
Herds 24 ).70 Lactation Number 2 8.12 5.64** 3.00 4.61 Body Weight 1 0.52 0.)6 3.84 6.6) Yie1d. 1 0.91 0.63 Protein 1 0.80 0.54 Calcium 1 ).45 2.)9 Phosphorous 1 2.40 1.66 N. Energy 1 0.6) 0.44 Error 2)9 1.44
* (
Significant at P< .05 ** Significant at P< .01

,1
~ '1. .. /'
- . { , ..... ~
Appendix Table Il.
Source
lierds Lactation Number Body Weight Yield Protein Calcium Phosphorous N. Energy Error
Appendix Table 12.
Source
Herds Lactation Number Body Weight Yield Protein Calcium Phosphorous N. Energy
207
Analysis of variance for ca1ving interval (lierd effects removed). Quebec lierds.
F. Value D.F. M.S. Obs 2~ 1~
10 24457.1
3 5948.5 2.08 2.76 4.13 1 1152.0 0.40 /.r.00 7.08 1 3984.1 1.39
12329.8 4.32 * 1 1 4J24.4 1.51 1 301.9 0.10 1 117.5 0.04
70 2848.4
Analysis of variance for ca1ving interval (lierd effects removed). Trinidad lierds.
F. Value D.F. M.S. Obs 5% 1%
24 36718.0 2 107530.4 12.93 ** 3.00 4.61 1 28.9 0.00 3.84- 6.63 1 353.4 0.04 1 9167.3 1.10 1 1272.2 0.15 1 1412.2 0.16 1 292.3 0.03
Error 239 8315.0
* **
Significant at P < .05 Significant at P < .01