Sugary Beverages: Why the Fuss and What You Can … · Sugary Beverages: Why the Fuss and ... how...
25
1 Sugary Beverages: Why the Fuss and What You Can Do January 17, 2013
Transcript of Sugary Beverages: Why the Fuss and What You Can … · Sugary Beverages: Why the Fuss and ... how...
1
Sugary Beverages:Why the Fuss and What You Can Do
January 17, 2013

2
Featured Speakers
• Ian Brissette, PhD
New York State Department of Health
• Melanie Shefchik, MA, CHES
Rockland County Department of Health
Disclosure Statements
The planners and presenters do not have any financial arrangements or affiliations with any commercial entities whose products, research or services may be discussed in this activity.
No commercial funding has been accepted for this activity.

3
Evaluations
Nursing Contact Hours, CME and CHES credits are available.
Please visit www.phlive.org to fill out your evaluation and complete the post‐test.
Thank you!
Thank You to Our Sponsors:
• University at Albany School of Public Health
• NYS Department of Health

4
Communication Goals
• Describe the data sources the New York State Department of
Health (NYS DOH) uses for public health surveillance on sugary
drinks
• Illustrate how data can be used to focus public health programs
addressing sugary drink consumption
• Demonstrate how ongoing data collection is an integral part of the public health response to sugary drinks
Health Outcomes Associated with Sugary Drink Consumption
• Obesity and weight gain in children & adults(Malik et al 2010; Olsen & Heitmann, 2009; Malik, Schulze & Hu, 2006; Schulze et al, 2004)
• Type 2 Diabetes in adults(Schulze et al, 2004; Hu & Malik, 2010 Reviewed in Malik et al 2010)
• Cardiovascular Disease (hypertension & high cholesterol)(Winkelmayer et al 2005; Dhingra et al, 2007)
Regular Consumption of Sugary Drinks
Sustained Excess Calorie Consumption
Obesity & Obesity Related
Conditions

5
United States Trends in Beverage Consumption in Children and Adults, 1977‐2006
87.4
153.7
64.4
141.7
0
50
100
150
200
1977‐78 1989‐91 1994‐1998 2005‐06
Soda/Fruit DrinksChildrenSoda/Fruit DrinksAdults
Kcal per capita
Adapted from Popkin, Physiology and Behavior, 2010; based on NHANES
Public Health Surveillance
Ongoing systematic collection, analysis and interpretation and dissemination of data regarding a health‐related event for use in public health action to reduce morbidity and mortality and improve health.
Centers for Disease Control and Prevention, MMWR,2001, 50, RR‐13.
6
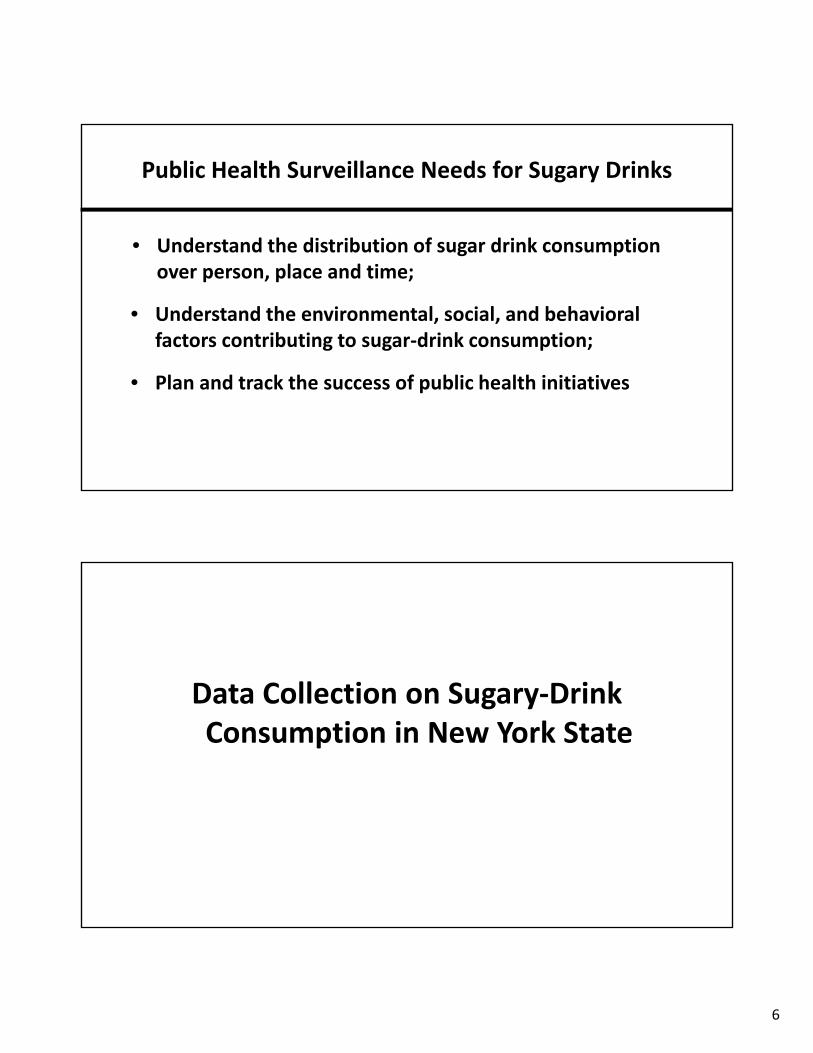
Public Health Surveillance Needs for Sugary Drinks
• Understand the distribution of sugar drink consumption over person, place and time;
• Understand the environmental, social, and behavioral factors contributing to sugar‐drink consumption;
• Plan and track the success of public health initiatives
Data Collection on Sugary‐Drink Consumption in New York State
7
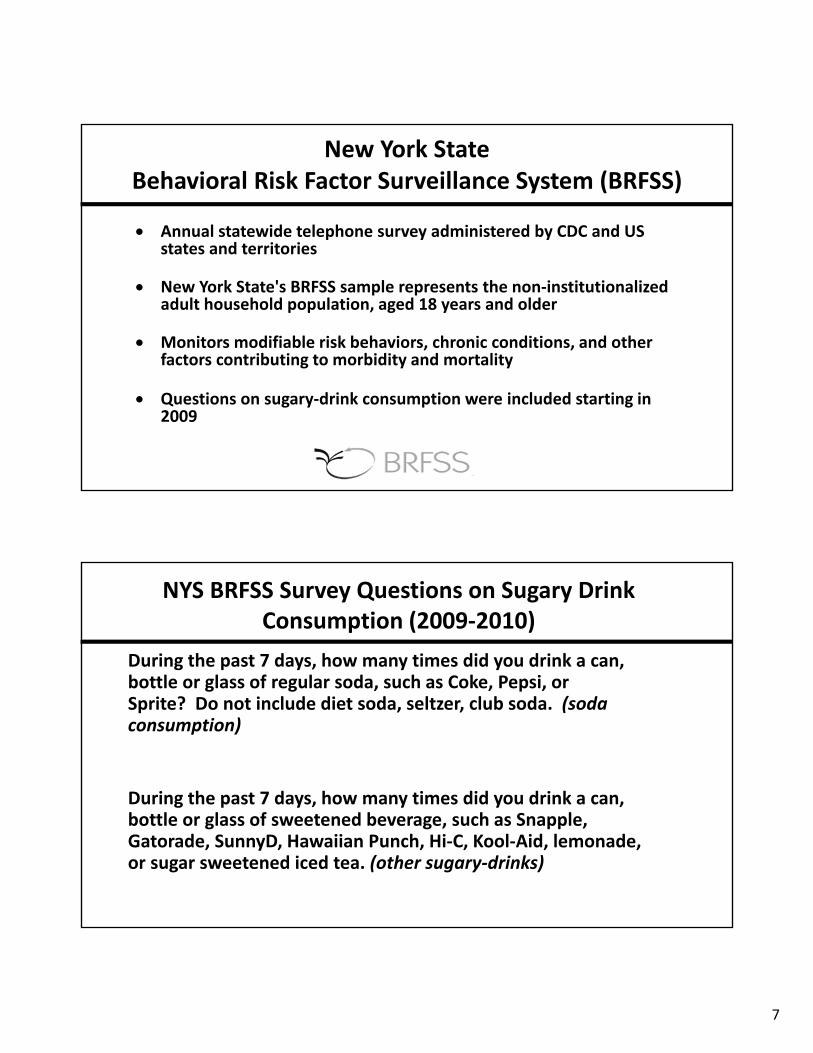
Annual statewide telephone survey administered by CDC and US states and territories
New York State's BRFSS sample represents the non‐institutionalized adult household population, aged 18 years and older
Monitors modifiable risk behaviors, chronic conditions, and other factors contributing to morbidity and mortality
Questions on sugary‐drink consumption were included starting in 2009
New York State Behavioral Risk Factor Surveillance System (BRFSS)
During the past 7 days, how many times did you drink a can, bottle or glass of regular soda, such as Coke, Pepsi, or Sprite? Do not include diet soda, seltzer, club soda. (soda consumption)
During the past 7 days, how many times did you drink a can, bottle or glass of sweetened beverage, such as Snapple, Gatorade, SunnyD, Hawaiian Punch, Hi‐C, Kool‐Aid, lemonade, or sugar sweetened iced tea. (other sugary‐drinks)
NYS BRFSS Survey Questions on Sugary Drink Consumption (2009‐2010)

8
9.127.3
31.1
12.313.0
21.2
0
5
10
15
20
25
30
35
40
45
50
Regular Soda Other Sugary Drinks Regular Soda or Other SugaryDrinks
Percent
Beverage Type
Children
Adults
Daily Consumption of Sugary Drinks Among Children (2 to 17 years) and Adults by Beverage Type, NYS BRFSS 2009‐10
Daily Consumption of Regular Soda and Other Sugary Drinks Among Children and Adults by Age, NYS BRFSS 2009‐10
25.2 30.6 37.830.6 24.9 21.6 18.2 14.2
0
5
10
15
20
25
30
35
40
45
50
2-5 6-11 12-17 18-29 30-39 40-49 50-59 60+
Per
cent
Children Adults
9
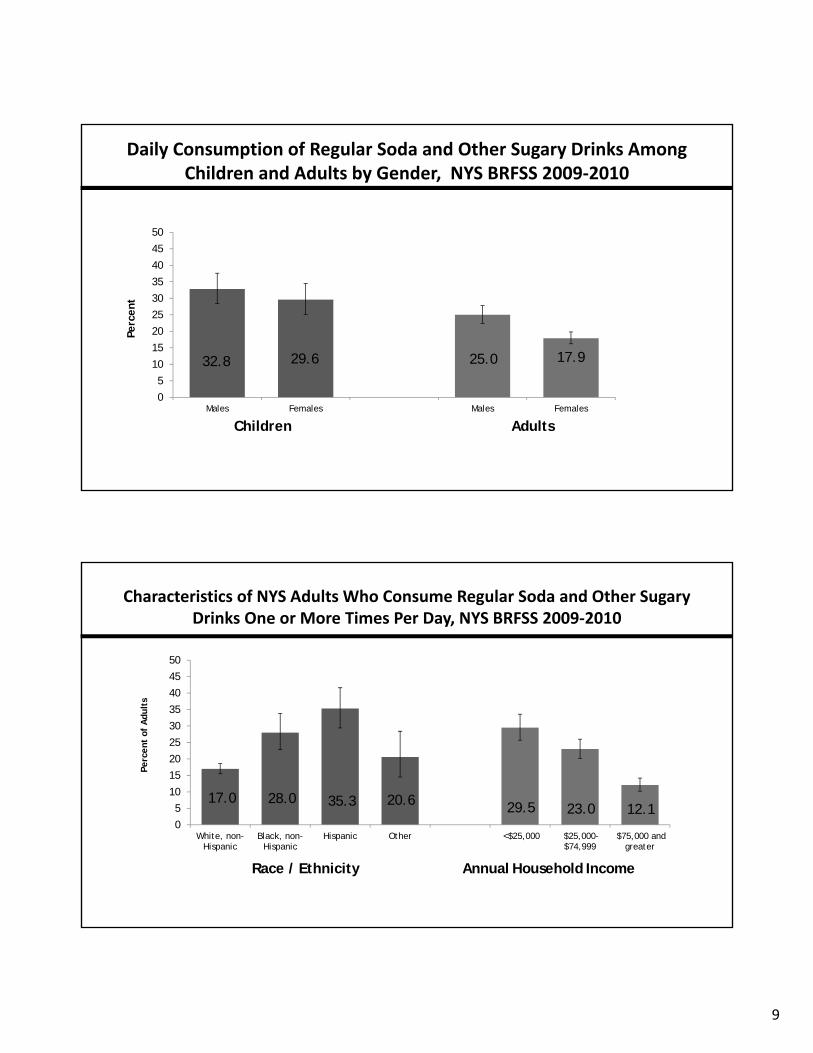
Daily Consumption of Regular Soda and Other Sugary Drinks Among Children and Adults by Gender, NYS BRFSS 2009‐2010
32.8 29.6 25.0 17.9
0
5
10
15
20
25
30
35
40
45
50
Males Females Males Females
Perc
ent
Children Adults
Characteristics of NYS Adults Who Consume Regular Soda and Other Sugary Drinks One or More Times Per Day, NYS BRFSS 2009‐2010
17.0 28.0 35.3 20.6 29.5 23.0 12.10
5
10
15
20
25
30
35
40
45
50
White, non-Hispanic
Black, non-Hispanic
Hispanic Other <$25,000 $25,000-$74,999
$75,000 andgreater
Per
cent
of A
dult
s
Race / Ethnicity Annual Household Income

10
Key Findings on Sugary Drink Consumption, NYS BRFSS 2009‐2010
• Among children, daily consumption of other sugary drinks is 3 times more common than daily soda consumption.
• Among adults, males consume more soda and other sugary drinks than females.
• Daily sugary drink consumption is most prevalent among children between 12 and 17 years old and least common among adults 60+ years of age.
• Daily sugary drink consumption is more prevalent among younger adults, Hispanic adults and adults with lower household income.
Data Collection Beyond Sugary Drink Consumption

11
Sugary Drink Environment: Availability and Promotion
Public Health Strategies to Address Sugary‐Drink Consumption
Adapted from: Frieden, T. R. Am J Public Health 2010;100:590‐595

12
Data Collection to Assess Public Opinion About Sugary Drinks and Strategies to Limit Availability
• Random Digit Dial Telephone Survey of New York Adult Residents (n = 1,253)
• Completed by Siena College Research Institute on behalf of NYSDOH, January 15th‐25th 2012
• Assessed beliefs about sugary drinks and support for potential measures to reduce their availability (margin of error = +/‐2.8%)
Assessing Public Beliefs About the Harmfulness/Benefit of Regular Consumption of Drinks in Children
Thinking about children, between the ages of 2 and 12,
drinking beverages. As I read you 6 types of drinks, tell me
whether you consider drinking one 12 ounce serving per day, a typical can, of each of those drinks to be:
• harmful to a child's health
• beneficial to their health or
• neither harmful nor beneficial?

13
Public Beliefs About the Harm/Benefit of Daily Consumption of Drinks by Children 2‐12 Years, NYS 2012
1 3
79
196 6
8778
7
41
6860
0%
10%
20%
30%
40%
50%
60%
70%
80%
90%
100%
Soda Diet soda 100% Juice Sports drinks Fruit‐flavoreddrinks
Iced tea
Percent of Adults
Don't know Benficial Neither harmful nor beneficial HarmfulBeneficial
9.127.3
31.1
0
5
10
15
20
25
30
35
40
45
50
Regular Soda Other Sugary Drinks Regular Soda or Other SugaryDrinks
Percent of Child
ren
Differences in parents’ beliefs about other sugary drinks, particularly sports drinks, may contribute to observed patterns of sugary drink consumption in children.
Daily Consumption of Sugary Drinks Among Children (2 to 17 years) by Beverage Type, NYS BRFSS 2009‐10

14
Indicate whether you would be in favor or opposed to each of these potential public policies…
• Forbidding licensed childcare centers from serving sugar‐sweetened beverages
• Banning the sale of sugar‐sweetened beverages (SSBs) at elementary schools
• Banning the sale of SSBs at middle schools
• Banning the sale of SSBs at high schools
• Eliminating all vending machines that sell SSBs in public schools
Assessing Public Opinion About Policies Addressing Sugary Drinks in Public Schools and Childcare Centers
6169
62
44
59
0
10
20
30
40
50
60
70
80
90
100
Forbidding licensedchildcare centers from
serving SSBs
Banning the sale of SSBsat elementary schools
Banning the sale of SSBsat middle schools
Banning the sale of SSBsat high schools
Eliminating all vendingmachines that sell SSBs in
public schools
Percent of Adults Favoring
Public Support for Policies to Address Availability of Sugary Drinks in Public Schools and Child Care Centers Among NYS Adults, 2012

15
Indicate whether you would be in favor or opposed to requiring
that kid’s meals in fast food restaurants include only drinks
like water, milk or 100% juice.
Assessing Public Opinion About Sugary Drinks and Children’s Meals
62 58
77 76 73 71
57
0
10
20
30
40
50
60
70
80
90
100
Total White Black Latino Other <$50,000 >=$50,000
Percent of Adults Favoring
Public Support For Requiring Fast Food Restaurants to Include Only Drinks Such as Water, Milk or 100% Juice in Kid’s Meals by Demographics, NYS 2012
16
Key Findings, 2012 NYSDOH Public Opinion Poll
• Adults’ beliefs about the harm/benefits of regular consumption differ for soda versus other sugary drinks, particularly sports drinks
• Majority of adults support restricting sugary drinks in child care and public elementary and middle schools
• Majority of adults support requiring healthier beverage options in fast food kids’ meals. Support is particularly high among non‐whites and Hispanic adults and adults with <$50,000 in household income.
Additional Information on NYSDOH Data on Sugary Drinks
Additional Reports on Sugary‐Drink Consumption:http://www.health.ny.gov/statistics/brfss/reports/docs/1203_brfss_sugar_sweetened_beverages.pdf
http://www.health.ny.gov/statistics/brfss/reports/docs/brfssbrief_sugarbev_112310.pdf
http://www.health.ny.gov/statistics/brfss/reports/
Availability of Raw Data and Questions from BRFSS on METRIX:https://apps.nyhealth.gov/METRIX/main.action
Specific Questions:
Ian Brissette, PhD; New York State Department of Health
E‐mail:[email protected]

17
Reducing Sugar‐Sweetened Beverages in Rockland County, NY
Steps to a Healthier Rockland is an initiative of the Rockland County Department of Health, Health Promotion and Education Division to address the burden of chronic disease including lifestyle related
chronic diseases such as obesity and diabetes.
It’s Not Just Soda!
Soda Energy drinks Sports drinks Sweetened teas Lemonades Fruit drinks Coffee drinksAny other drink with added sugar!

18
Program Goal
Reduce the availability and consumption of sugar‐sweetened beverages (SSBs) by creating policies, practices, and environments that support healthier beverages
1. Implement an awareness and media campaign2. Modify beverage options in county‐owned vending machines
3. Collaborate with other sites to make similar changes
Media & Educational Campaign
• Partnered with NYC Department of Health & Mental Hygiene: Health Media & Marketing & Publications Divisions

19
Print Materials
Bus Campaign
“During our recent visits with clients, they began to talk about the posters regarding sugar‐sweetened beverages seen while riding the bus. These posters have not only reinforced what we recommend but reinforced it at the point of consumption since many people drink these beverages while riding the bus.”—Clinic Dietician

20
Mall Directories & Door Clings
Commercials
NYC Health Department videos are available at www.youtube.com/user/NYCHealth

21
Point of Purchase Messaging
Source: Beverage Digest Fact Book 2010

22
Modifying Vending Machines
Obtained copy of existing vending contract
Completed pre‐assessment of each machine
Met with purchasing department & vendor
Received product list & surveyed employees
Developed policy and modified contract
Implementation of new product mix (pending)
Vending Policy Recommendations
• Water must be minimum of 2 rows
• Water must be in most prominent location and sugary drinks in least prominent
• Water must be priced at least 25 cents less
• No more than 2 rows can be sugary drinks (defined as > than 25 calories per 8 oz)

23
What can your organization do?
• Practice and promote healthy meetings
• Modify your vending machines
• Provide pricing differentials
• Provide free water to employees
• Provide taste tests for healthier beverages
• Implement point of purchase messaging
• Promote and encourage these changes to your partners
What can your organization do?
• Distribute educational materials
• Include articles about SSBs in your newsletter
• Post messages and videos on your social media outlets or website
• Create displays that show that amount of sugar in beverages
• Offer community & worksite presentations

24
Public Feedback & Testimonials
“I was recently on a plane and was planning to order a ginger ale when your ad popped into my head. I ordered a refreshing seltzer instead!”—DOH Employee
“In the last two weeks, 3 patients of mine have mentioned the ads regarding sugary drinks. They all reported they were eliminating the soda and drinking more water.”—Clinic Nurse
Resources
• Rockland County Department of Health: http://www.rocklandsteps.org/beverages
• New York State Association of County Health Officials
(NYSACHO):
www.cutyoursugar.org
• New York City’s Sugary Drinks Page: http://www.nyc.gov/html/doh/html/cdp/cdp_pan_pop.shtml
• Rethink Your Drink‐Centers for Disease Control & Prevention: http://www.cdc.gov/healthyweight/healthy_eating/drinks.html

25
Evaluations
Nursing Contact Hours, CME and CHES credits are available.
Please visit www.phlive.org to fill out your evaluation and complete the post‐test.
Thank you!