Sugarcane Signaling and Regulatory Networks - FAPESP · Sugarcane Signaling and Regulatory Networks...
36
Signal Transduction Laboratory Institute of Chemistry University of São Paulo Glaucia Mendes Souza http://sucest-fun.org Sugarcane Signaling and Regulatory Networks
Transcript of Sugarcane Signaling and Regulatory Networks - FAPESP · Sugarcane Signaling and Regulatory Networks...

Signal Transduction Laboratory
Institute of Chemistry
University of São Paulo
Glaucia Mendes Souza
http://sucest-fun.org
Sugarcane Signaling and Regulatory Networks
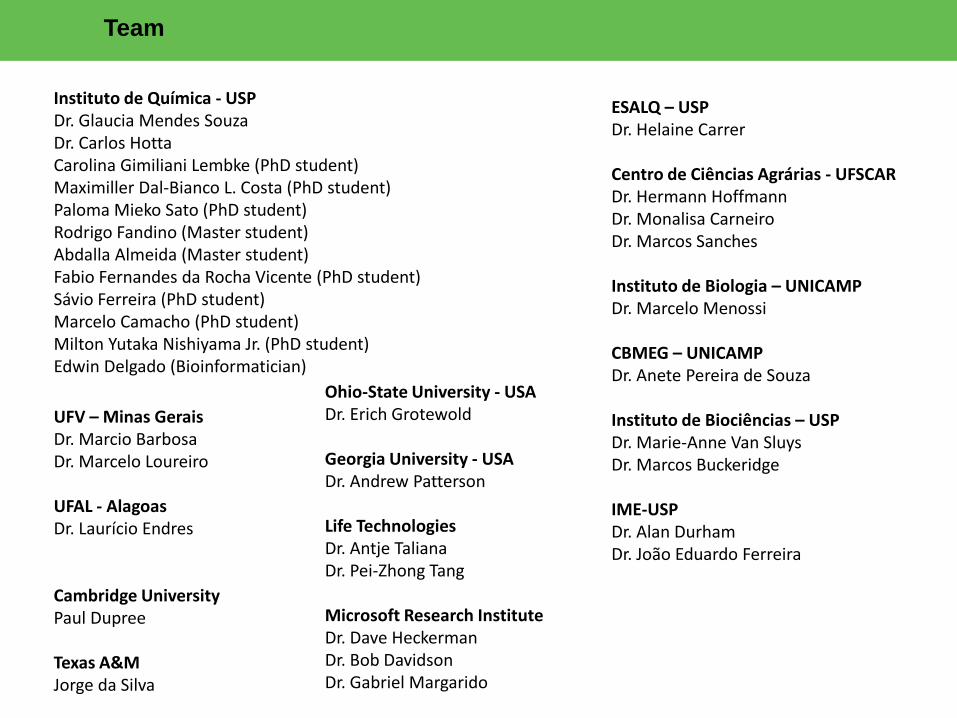
Team
Instituto de Química - USP Dr. Glaucia Mendes Souza Dr. Carlos Hotta Carolina Gimiliani Lembke (PhD student) Maximiller Dal-Bianco L. Costa (PhD student) Paloma Mieko Sato (PhD student) Rodrigo Fandino (Master student) Abdalla Almeida (Master student) Fabio Fernandes da Rocha Vicente (PhD student) Sávio Ferreira (PhD student) Marcelo Camacho (PhD student) Milton Yutaka Nishiyama Jr. (PhD student) Edwin Delgado (Bioinformatician)
ESALQ – USP Dr. Helaine Carrer Centro de Ciências Agrárias - UFSCAR Dr. Hermann Hoffmann Dr. Monalisa Carneiro Dr. Marcos Sanches Instituto de Biologia – UNICAMP Dr. Marcelo Menossi CBMEG – UNICAMP Dr. Anete Pereira de Souza Instituto de Biociências – USP Dr. Marie-Anne Van Sluys Dr. Marcos Buckeridge IME-USP Dr. Alan Durham Dr. João Eduardo Ferreira
UFV – Minas Gerais Dr. Marcio Barbosa Dr. Marcelo Loureiro UFAL - Alagoas Dr. Laurício Endres Cambridge University Paul Dupree Texas A&M Jorge da Silva
Ohio-State University - USA Dr. Erich Grotewold Georgia University - USA Dr. Andrew Patterson Life Technologies Dr. Antje Taliana Dr. Pei-Zhong Tang Microsoft Research Institute Dr. Dave Heckerman Dr. Bob Davidson Dr. Gabriel Margarido

Motivation: improving yield has become essential for the sustainability of biofuel production
We need to develop tools for
sugarcane biotechnology

Goals
Identification of genes associated to sucrose, fiber quality and content and
drought tolerance
Evaluation of gene function through the generation and analysis of transgenic
sugarcane plants
Sugarcane gene promoter sequence and regulatory motif identification
Development of the SUCEST-FUN Database and computational tools

Need to understand the brazilian germplasm
and develop tools for the biotechnological route of sugarcane improvement
Approach: evaluate at the sequencing, expression and physiological level
50 cultivars 4 ancestor genotypes 8 progenies
RB867515 S. officinarum S. robustum S. sinensis S. spontaneum
Agronomic traits of interest: brix, yield, drought and fiber quality and content
SP80-3280
4x44 K - 45220 oligos
1217 controls Agilent
43803 oligos representing SAS
14522 sense
7380 antisense
Oligo design
350
50 5' 3'
390
310
90 10 Start site

448 hybridizations
10,262 differences in gene expression when cultivars and tissues with contrasting sucrose
content were compared
12,249 changes related to drought stress
3,524 when ancestral sugarcane species were compared to a commercial sugarcane cultivar
with differing fiber deposition patterns
Total Number of Differentially Expressed data points by treatment
(crossing biological replicates)

S. spontaneum as an energy crop?
Plants X mass X % dry matter S .spontaneum 273 x 0,223kg x (100-63,1) = 2246,4 kg of total dry matter RB867515 73 x 1,563 x (100-83,7) = 1859,8 kg of total dry matter
22
3
156
3
22
3
73
Savio Ferreira

Expression pattern analysis of ancestral species
- Few cell wall related genes were
differentially expressed
- S. spontaneum presented an up
regulation of catabolic pathways
(mainly carbohydrates) and down
regulation of anabolic pathways
- S. officinarum showed a down
regulation of carbohydrate
degradation genes; in leaf, few cell
wall genes were down regulated
(C3H, XTH, CesA, Csl)
- S. robustum showed a pattern
similar to S. spontaneum, presenting
an up regulation of carbohydrate
degradation (mainly starch) and
krebs Cycle.
Savio Ferreira

BB AB BB AB BB AB0
5
10
15
20 *** *** ***
_______ _______ _______2 4 5
Brix
7 9 1110
15
20
25
BB
AB
***
Meses
Brix
(Média
)
B)
A)90 High and Low Brix Genotypes selected
RIDESA Breeding Program – Monalisa Sampaio
Photosynthesis
Sucrose
Reducing Sugars
Fiber
Plant Height
Number of internodes
Diameter
Biomass
Yield
Physiology, Morphology, Biochemistry
61 genotypes
Paloma Mieko Sato & Rodrigo F. Andrade
Transcriptome at 7 months
Expression pattern analysis of genotypes contrasting for sucrose content

Photosynthesis slightly negative correlation with sucrose
Photosynthesis no correlation with fiber, yield or biomass
Paloma Mieko Sato & Rodrigo F. Andrade

Sucrose positive correlation with brix and internode number
Sucrose negative correlation with reducing sugars
10
12
14
16
18
20
22r = 0.9874
P value < 0.0001
oB
rix
0.5
1.0
1.5
2.0
2.5
3.0
r = -0.8765
P value < 0.0001
% R
ed
uc
ing
su
ga
rs
4 6 8 10 12 14 16 18 20
4
6
8
10
12
14
16r = 0.6993
P value < 0.0001
% Sucrose
Inte
node n
um
ber
4 6 8 10 12 14 16 18 20
0.5
1.0
1.5
2.0
2.5 r = 0.5661
P value < 0.0001
% Sucrose
Pla
nt
he
igh
t (m
)
A)
D)C)
B)


Transgenics for Protein Kinases and Phosphatases
C. Lembke, P. M. Sato

Transgenics Transcriptome: SnRK1, SnRK2, SnRK3
GMRG_Term Pop_freq Pop_frac Study_frac Raw_es e-score Description Contributing_genes
GO:0009733 2,27E+01 33/14522 14/1941 3,75E-01 1,30E+02 response to auxin stimulus
1122 genes altered, 360 unknown

SCSGFL5C08F02.g
Auxin responsive factor
LB SS HB SS LB AS HB AS
0.00
0.05
0.10
0.15
0.20
0.25
Crossing 2
mR
NA
ta
rge
t/ U
BE
2 m
RN
A
SCEPAM1018E02.g
cane UPK-20
LB SS HB SS LB AS HB AS
0.0000
0.0002
0.0004
0.0006
0.03
0.06
0.09
0.12
0.15
Crossing 5
mR
NA
ta
rge
t/G
AP
DH
mR
NA
SCEPAM2014B12.g
Sucrose transporter
153 SS 238 SS 153 AS 238 AS
0.0000
0.0001
0.0002
0.0003
0.0004
0.0005
0.0006
0.0007
mR
NA
ta
rge
t/G
AP
DH
mR
NA
SCCCLR1001E04.g
Rubisco
321 SS 318 SS 321 AS 318 AS
0.00000
0.00005
0.00010
0.00015
0.00020
0.00120.00140.00160.00180.0020
0.0070
0.0075
0.0080
mR
NA
ta
rge
t/G
AP
DH
mR
NA
SCCCRZ3001D04.g
Triose phosphate translocator
714 SS 710 SS 714 AS 710 AS
0.000
0.001
0.002
0.003
0.004
0.005
0.012
0.014
0.016
0.018
0.020
mR
NA
ta
rge
t/G
AP
DH
mR
NA
A) B)
C) D)
E)
*
*
*
**
*
*
*
*
*
Regulation of the antisense may be important!

Alignment of SnRK1 Sugarcane X Sorghum
Motivo Sequência Motivo Sequência
ABRELATERD1 ACGT AGL3 ATTA
ABRERATCAL AGCAGC ANAERO2CONSENSUS GAAAAT
ACGTATERD1 GGATT ANT AAACCA
ACGTATERD1 TGACG Athb-1 CATCTG
AGCBOXNPGLB CCGCGG ATHB-5 CAACA
AP1 AAACCA CDC5 TGGGCC
ARR10 CAACGG MYB1AT ACTTTG
ARR1AT AACTAAC P1BS GTATATGC
ASF1MOTIFCAMV AACGG RAV1 gagCAACAacgc
CGCGBOXAT TGGGCC RAV1-A CAACA
Core TTTTTAG SITEIIATCYTC TGGGCC
ERF1 GCCGCC SORLIP1AT GCCAC
GATABOX GATAAG SV40COREENHAN GTGGAAAG
GCCCORE CCGAC TBOXATGAPB ACTTTG
GT1CONSENSUS GCCAC TGBOXATPIN2 AACGTG
IBOX GCCAC
LTRECOREATCOR15 GTGGAAAG
MYB2CONSENSUSAT CATCTG
MYB4 AACTAAC
MYBCORE CCGTTG
MYBCOREATCYCB1 AACGG
MYCATERD1 CATGTG
RAV1AAT CAACA
Light Sugars
Drought
and ABA
Drought
and ABA
JA and
auxin
1,807 1,729 1,1361,338 1,946
6,775
20,778
15,747
3,964
0,0
5,0
10,0
15,0
20,0
25,0
SCEN 1024 E12 PUB
% I
NP
UT
IgG 7`` REAMP Pol II 7`` REAMP Pol II 7`` 2 REAMP
Chromatin Precipitation: 13-fold
enrichment, 1.56 Gb of data
Sugarcane Genome 8.7 Gb of data
Gene promoter analysis

Infrastructure: Transformation Pipeline, green houses SP, Araras and ESALQ
Monalisa Carneiro: Sugarcane cultivation and harvest Helaine Carrer: Technical improvements Biolistics and Agrobacterium Regeneration from calli or leaf disk Great improvement in regeneration time
Glaucia Souza, Helaine Carrer, Marcelo Menossi: 31 gene targets introduced into the pipeline Silencing (8 constructs) Over-expression (19 constructs) (3 constructs into Brachypodium and 4 into tobacco) 72 plants confirmed for expression 8 to 15% efficiency biolistics and 4 to 10% Agrobacterium

Infrastructure: SUCEST-FUN Database
Milton Nishiyama-Jr.
Bioinfo Support for 16 BIOEN projects
8 thousand accesses/month (public site)
96 registered datamining users (private site)

Sucest-Fun Web Services
http://sucest-fun.org
Milton Nishiyama-Jr., Edwin Delgado

Time in continuous light (h)
0 24 48 72 96 120
Lum
inescence (
photo
ns/1
800 s
)
0,0
6,0e+5
1,2e+6
1,8e+6
ZT8
ZT20
2011/00818-8 - Development of alternative
biological models for the study of sugarcane
regulatory networks Dr. Carlos Hotta (coordinator) jun/11 –
ongoing
Aims:
1- To develop tools to use other biological models as
alternative to sugarcane
LUCIFERASE under a circadian promoter is a tool developed for Arabidopsis
that is being adapted to use in Brachypodium and sugarcane

2011/00818-8 Dr. Carlos Hotta jun/11 –
ongoing
Aims:
2- To associate the sugarcane circadian clock with its high
productivity and ability to accumulate sucrose >30% of the sense transcripts and > 20% of the antisense transcripts are
controlled by the circadian clock
Pathways like carbohydrate metabolism, photosynthesis, protein synthesis
and degradation, sugar and starch synthesis and degradation are controlled
by the circadian clock

Supressor of induced cell death by Bax protein and
negative regulator of cell death in plants, animals and
yeast
FUNCTIONAL GENOMICS OF PHOTOSYNTHETIC GENES IN SUGARCANE Helaine Carrer – ESALQ
Transgenic Sugarcane Tolerant to Drought
Program Cell Death Inhibitor Protein
Gene
AtBi-1 (Programmed cell death and stress)
COMT (sugarcane)
C4-PEPC (sugarcane)
β- Carbonic Anydrase (Arabidopsis)
FS I-Sub. L (sugarcane)
FS-II Sub. K (sugarcane)

COMT-AS lines COMT
expression Total lignin means
(%) Total lignin
Holocellulose Extractives
WT-SP803280 1.00 15.54±0.17a 100 61.05± 23.75
P9-SP803280 -13.79 13.96±0.09c 89,8 61.53± 24.51
P16-SP803280 -4.843 14.89±0.26ab 95,8 60.72± 24.39
P20-SP803280 -14.43 14.93±0.14ab 96,1 62.48± 22.59
P32-SP803280 -14.41 14.57±0.26ab 93,7 61.12± 24.31
WT-RB835486 1.00 15.46±0.29a 99,5 59.03± 25.61
P4-RB835486 -16.84 13.97±0.06c 89,9 59.71± 26.32
P9-RB835486 -12.18 14.51±0.16ab 93,3 59.99± 35.49
Table1. COMT gene expression and Total lignin means of sugarcane transgenic lines, varieties SP80-3280 and RB 835486 transformed with COMT antisense fragment
COMT silencing: 4% to 11% reduction in lignin

II I
I II III IV V
28cm
I WT
17cm WT
WT III
IV
A B C
D
Figure 1. COMT-AS transgenic lines of sugarcane: A) I – Transgenic line without support; WT – Wild type as control; B) WT – Wild type as control, III – line P20-SP803280 with gentle inclination and IV – severe inclination; C ) I – P9-SP803280, II - P20-SP803280, III - P16-SP803280, IV and V – P32-SP803280 transgenic lines showing different down-inclination; D) I – P4-RB835496 and II – P9-RB835486 transgenic lines showing different down-inclination
COMT Transgenic Plants

INFORMATION TECHNOLOGY APPLIED TO BIOENERGY GENOMICS:PROBABILISTIC
ANNOTATION USING ARTIFICIAL INTELIGENCE – Ricardo Vêncio - FACULDADE DE MEDICINA
DE RIBEIRÃO PRETO/USP
Genomics
(Microsoft/FAPESP):
1) Develop an IT methodology and software framework for automatic
probabilistic annotation;
2) Apply 1) to re-annotation of sugarcane:
* transcriptome, (SUCEST, 2003)
* genome annotation, to be sequenced by the BIOEN
Metabolomics (BIOEN):
Develop a probabilistic model for metabolite identification from
complex spectra;
100%
5% 0%
100%
Next: Start
manuscript
drafting
Next: Start manuscript
drafting
Next: from tests to results

Genomics – Probabilistic Annotation
D.Almeida-e-Silva, master candidate; Prof. Vêncio, LabPIB-USP

Adapted from: Rogers et al. (2008)
Metabolomics – Probabilistic Annotation
R.Silva, PhD candidate; Prof. Vêncio, LabPIB-USP

Sugarcane Analysis: METABOLOMICS AND PROTEOMICS OF
SUCROSE ACCUMULATION IN SUGARCANE Laboratory Max Feffer of Genetics of Plants, ESALQ-USP, Piracicaba
Coordinator: Prof. Carlos Alberto Labate – Fapesp Process 2008/56100-5
Group members: Camila Ribeiro; Danielle Silva; Fabrício Moraes; Fernando Silva; Ilara Budzinski; Simone Gonzalez; Thais Regiani
Leaf Nucleus Isolation
Histones
DNA regulation
RNA regulation
Transcriptions factors
• UDP-Glucose pyrophosphorylase
• Sucrose phosphate synthase
• RUBISCO
• Phospholipase
• Ubiquitin
• GAPDH
Leaves
phosphoproteins
1 - Understand the mecanisms related to sucrose accumulation.
2 - Undestand drought stress.
Main Objectives:
Is 4 months old sugarcane leaves different from 12 months old?
Sucrose accumulation gene expression qPCR Metabolomics (GC-MS) PCA

Proteomics: Non-irrigated sugarcane leaves Proteomics: Control sugarcane leaves
Functional category: Response to stress
14-3-3 like protein
peptidyl-prolyl cis-trans isomerase
glioxalase I
betaine aldehyde dehydrogenase
abscisic stress ripening protein
drought inducible 22 kDa
Photosynthesis: soil water content
-5
0
5
10
15
20
25
0 500 1000 1500 2000
100%
58%
23%
Reidratadarehydrated
Photo
synte
sis
(mg C
O2·d
m-2
·h-1
) PAR (Photosynthetically active radiation)

Sugarcane Metabolomics (LC-MS): Drought Stress
Methanol + Formic acid (N)
Leaves +1
stalks 5 e 9
Extraction: Two buffers
1 2 1 – Methanol + Formic acid (N)
2 – Methanol + Chloroform + Water (G)
SP-3280
Is N buffer different from G
buffer?
-70
-60
-50
-40
-30
-20
-10
0
10
20
30
40
50
60
-200 -100 0 100 200
t[2]
t[1]
S cores C omp[1] vs . C omp[2] colored by S ample G roup
IG
IN
SG
SN
INININ
IG
IG
IG
SNSN
SN
SG
SG
SG
INININ
IG
IG
IG
SNSNSN
SG
SG
SG
INININ
IG
IG
IG
SNSNSN
SG
SGSG
INININ
IG
IG
IG
SN SN
SN
SG
SGSG
INININ
IG
IG
IG
SNSN
SN
SG
SG
SG
Hotelling’s T2 Ellipse (95%) = (196; 55.63)
R2X[1] = 0.779
R2X[2] = 0.06277
EZinf o 2 - Simone_Folha_51 (M4: PCA-X) - 2012-10-17 16:54:02 (UTC-3)
N G
Are irrigated plants different from
non-irrigated ?
Methanol + Chloroform+ Water (G)
S
I
I
S

To understand the differential sucrose yield in Brazilian sugarcane
genotypes, using an integrate approach in which plant physiology,
morphology and anatomy are considered as the causes of variation in
sugarcane performance.
Basic question:
Why do some sugarcane genotypes accumulate more sucrose in stalks than others?
Derived questions:
Question #1- Do they have higher photosynthetic capacity and/or higher leaf area and/or
higher sucrose storage capacity and/or any difference in carbohydrate metabolism in
leaves or stalks?
Question #2- Does canopy architecture favor the plant metabolism, especially
photosynthesis? Does the high solar energy availability at the basal canopy positions
change the functional leaf area and then the plant photosynthesis and carbohydrate
production in sugarcane genotypes with contrasting canopy architecture and yield?
Question #3- Is the sugarcane genotype with high sucrose yield less affected by
environmental constraints during the winter season? How do sugarcane cultivars with
differential sucrose yield respond to cold and/or drought stress? Does this response
change during the plant cycle?
Integrating Physiological, Morphological And Anatomical Traits
To Understand The Differential Sucrose Yield In Sugarcane
Genotypes
Eduardo Caruso Machado - IAC

100 150 200 250 300 350 400 450 500 550
0
500
1000
1500
2000
2500
SP79-1011 IACSP94-2094 IACSP95-50000
50
100
150
200
250
300
350
Pro
ductio
n (
ton
ha
-1)
Stalk
TotalA
0
5
10
15
20
25
IACSP95-5000IACSP94-2094
Sta
lks m
-1
SP79-1011
SP79-1011
IACSP94-2094
IACSP95-5000
Sta
lk v
olu
me
(cm
3)
Days after planting
D
0
500
1000
1500
2000
2500
3000
3500
Le
af are
a d
ura
tio
n (
d-1)
B
0
20
40
60
80
100
120
140
160
SP79-1011 IACSP94- 2094 IACSP95-5000
Ne
t P
ho
tosyn
tesis
[m
ol m
-2 (
30
0d
)-1]
SP79-1011 IACSP94- 2094 IACSP95-5000
C
Question #1- Do they have higher photosynthetic capacity and/or higher leaf
area and/or higher sucrose storage capacity and/or any difference in
carbohydrate metabolism in leaves or stalks?
Increased
production in
IAC95-5000
may be
associated to
increased Net
Photosynthesis,
increased LAD
and increased
stalk volume

IACSP93-2060 IACSP95-30280
500
1000
1500
2000
2500
Dry
ma
tte
r (g
)
Sugarcane varieties
Stalk
Leaves
IACSP93-2060 IACSP95-30280
5
10
15
20
25
30
Ph
oto
sy
nth
es
is (
mg
m-2
d-1)
Sugarcane varieties
Upper canopy position
Bottom canopy positionA B
0 500 1000 1500 2000 2500-5
0
5
10
15
20
25
30
35
40
0 500 1000 1500 2000
Photosynthetic photon flux density (mol m-2 s
-1)
IACSP95-3028
Upper canopy position
Ph
oto
sy
nth
es
is (m
ol
m-2 s
-1)
Bottom canopy position
IACSP93-2060
C D
SP79-1011 (erect leaves)
Actual Changed0
4
8
12
16
Ph
oto
syn
thesis
(m
g C
O2 m
-2 d
-1)
Canopy morphology
Canopy position 1 2
Ca
no
py
po
sit
ion
1
2
E
F
Question #2- Does canopy architecture favor the plant metabolism, especially
photosynthesis? Does the high solar energy availability at the basal canopy positions
change the functional leaf area and then the plant photosynthesis and carbohydrate
production in sugarcane genotypes with contrasting canopy architecture and yield?
Higher photosynthesis in inferior leaves is
related to higher biomass production

0.1
1
10 ψ
Pn
E
gs
Fv/Fm
ΦPSII
ETR NPQ
SS
Suc
Sta
NSC
Pro
Ref
IACSP94-2094
IACSP96-2042
0.4
0.6
0.8
1.0
1.2
1.4
1.6
1.8
2.0
10 20 30 40 50Stalkyield(kg)
IntegratedCO2assimila on(molm-2)
Ref WDRef WD
IACSP94-209416.6±5.2IACSP96-204238.0±1.6
Genotypes/condi onsCRPN(%)
*n.s.
By R.V. RIBEIRO, R.S. MACHADO, E.C. MACHADO, D.F.S.P. MACHADO, J.R. MAGALHÃES FILHO and M.G. A. LANDELL (2013) Revealing drought resistant and productive patterns in sugarcane genotypes by evaluating both physiological responses and stalk yield. Experimental Agriculture (in press)
Question #3- Is the sugarcane genotype with high sucrose yield less affected by
environmental constraints during the winter season? How do sugarcane
cultivars with differential sucrose yield respond to cold and/or drought stress?
Does this response change during the plant cycle?
The cultivar with more photosynthesis had more stalk yield but was much more sensitive to drought

BIOEN Plataforms
SUCEST-FUN Database e Bioinfo Tools
Sugarcane Transgenics
Transcriptome
ChIP-Seq
Promoter Identification
Nuclear Proteome
Metabolomics
Morphological, physiological trait analysis
Main Findings
Genes associated to sucrose content, fiber, clock and drought identified
Regulatory and metabolic pathways for sucrose content and drought tolerance found
Morphological and physiological traits associated to yield, drought and sucrose content
NEXT
Systems Biology Experiment
Whole genome analysis of promoter regions (allelic variation)
Regulatory and metabolic pathway annotation and manipulation (Promoter Discovery)
RNA-Seq Plataform
Organ-specific regulatory networks (diurnal rhythms)
Interactions between regulatory networks (drought and circadian clock)
Impact of different alleles in regulatory networks – Arabidopsis tests with different clock
alleles