Sugar Consumption Alters Perception of and Response to ...
37
Union College Union | Digital Works Honors eses Student Work 6-2016 Sugar Consumption Alters Perception of and Response to Stress in Undergraduate Students: Understanding the "Freshmen Fiſteen" Katherine M Keever Union College - Schenectady, NY Follow this and additional works at: hps://digitalworks.union.edu/theses Part of the Endocrine System Commons , Higher Education Commons , and the Nutrition Commons is Open Access is brought to you for free and open access by the Student Work at Union | Digital Works. It has been accepted for inclusion in Honors eses by an authorized administrator of Union | Digital Works. For more information, please contact [email protected]. Recommended Citation Keever, Katherine M, "Sugar Consumption Alters Perception of and Response to Stress in Undergraduate Students: Understanding the "Freshmen Fiſteen"" (2016). Honors eses. 167. hps://digitalworks.union.edu/theses/167
Transcript of Sugar Consumption Alters Perception of and Response to ...

Union CollegeUnion | Digital Works
Honors Theses Student Work
6-2016
Sugar Consumption Alters Perception of andResponse to Stress in Undergraduate Students:Understanding the "Freshmen Fifteen"Katherine M KeeverUnion College - Schenectady, NY
Follow this and additional works at: https://digitalworks.union.edu/theses
Part of the Endocrine System Commons, Higher Education Commons, and the NutritionCommons
This Open Access is brought to you for free and open access by the Student Work at Union | Digital Works. It has been accepted for inclusion in HonorsTheses by an authorized administrator of Union | Digital Works. For more information, please contact [email protected].
Recommended CitationKeever, Katherine M, "Sugar Consumption Alters Perception of and Response to Stress in Undergraduate Students: Understandingthe "Freshmen Fifteen"" (2016). Honors Theses. 167.https://digitalworks.union.edu/theses/167

Sugar Consumption Alters Perception of and Response to Stress in Undergraduate
Students: Understanding the “Freshman Fifteen”
By
Katherine M. Keever
* * * * * * * *
Submitted in partial fulfillment
of the requirements for
Honors in the Department of Biology
June 2016
Union College

1
Abstract Psychological stress is a common part in everyday life that directly affects the
body through the nervous system and neuroendocrine hormones. A perceived stressor
leads to the activation of the hypothalamic-pituitary-adrenal (HPA) axis, and the
synthesis and release of the glucocorticoid hormone cortisol from the adrenal cortex.
Studies have linked the release of cortisol during high-stress periods to an increased
intake of sugary and fatty foods, consistent with a suspected glucocorticoid-metabolic-
brain-negative pathway, with high sugar consumption leading to lower stress and
subsequently cortisol levels. In this study, undergraduate students’ diets were
supplemented with either a high sugar drink or water for one week and then subjected to
the Trier Social Stress Test (TSST). Subjects’ perceived stress was measured with the
Revised Undergraduate Student Hassle Scale (RUSHs) in terms of academic, social, and
personal categories, and saliva samples were collected pre and post TSST to analyze
salivary cortisol levels using an enzyme-linked immunosorbent assay (ELISA). A
consistent correlation was observed between sugar and water group participants’
perceived stress and baseline cortisol levels, along with statistically significant
differences in perceived stress and cortisol response to the TSST. The results of this study
indicate the need for specific stress-reduction interventions for college students to reduce
unhealthy stress-induced changes in dietary habits.

2
TABLE OF CONTENTS
Abstract 1
Table of Contents 2
Introduction 3
Materials & Methods 13
Results 17
Discussion 22
Acknowledgements 26
References 27
Appendix A: ELISA Protocol 31

3
Introduction
The “freshman fifteen” refers to the prevailing myth that exists among
undergraduates that when a student goes through their first year of college, they will gain
an average of 15 pounds from their original pre-college weight. Vadeboncoeur,
Townsend, & Foster (2015) conduced a meta-analysis of studies done on students
transitioning from high school to college, and found that 60.9% of the students included
in the study gained an average of 7.5 pounds during their freshman year of college. They
also discovered that one in ten students did gain an average of 15 pounds, which served
to provide somewhat of a base for the myth of the “Freshman 15.” Potential risk factors
that may be contributing to first year weight gain include unhealthy dieting choices,
interrupted sleeping patterns, increase in alcohol consumption, decline in physical
activity, and newly introduced psychological factors in academic, personal, and social
parts of the student’s life (Vadeboncoeur, Townsend, & Foster, 2015). The academic
portion refers to psychological stress created through high academic pressure coursework
in undergraduate classes, such as upcoming exams and projects, deciding a major, grades,
etc. Personal psychological stress may include adjusting to living with a roommate or in a
dorm, being away from home, discrimination from peers, and adjusting lifestyle to
college. Making friends, pressure to go out, balancing friends from hometown and
college are a few that could be considered in the psychological social stress for a college
student. Individuals with a higher BMI entering college were more likely to gain weight
when under high stress (Boyce and Kuijer, 2015).
Stress is defined as any uncomfortable “emotional experience accompanied by
predictable biochemical, physiological, and behavioral changes.” (Baum, 1990). It can be

4
divided into three separate categories: environmental, psychological, and biological stress.
The psychological category specifically places an emphasis on the individual and their own
ability to cope, and is enormously important in terms of mental health as it has been
strongly linked to mental illnesses like depression, schizophrenia, and anxiety disorders
(Herbert 1997 & Cohen, Kessler, and Gordon, 1995). In addition to mental health, stress
has the ability to affect one’s physical health. Segerstrom and Miller (2004) compiled a
comprehensive report that examined different types of stress and their effects on the
immune system. They found that chronic stress, such as unemployment or being a
caregiver, was associated with the suppression of both cellular and humoral processes of
the immune system. The physical toil from stress in common day life has become
widespread in recent times, with the American Psychological Association reporting three
out of four Americans have visited the the doctor for stress related ailments (The American
Institute of Health).
Stress is considered to be a multifactorial element and can be presented in many
different forms. A chronic stressor (as mentioned above) would involve matters present for
a long time, such as circumstances in one’s home life. An example of an acute stressor
would be something immediate such as giving a speech or receiving an injury. There are
also varying degrees of how severe the stressor is, the frequency at which the exposure
takes place, as well as taking into account a person’s own perception of the stress and how
it differs between individuals (Lucassen, Pruessner, & Sousa, 2013). Studies have
highlighted the direct effect of stress on the body, weight loss and gain being one. Harris
et al. (1998) demonstrated that when using a moderate psychological and physical stressor
of restraint on rats, the repeated restraints induced an initial period of weight loss and

5
reduced food intake, followed by higher fat accumulation than non-restrained rats. The
study indicated that the induced metabolic state favored energy storage as fat rather than
protein, with similar effects being observed in humans due to sharing a common pathway
activated by stress.
An individual’s perception of an internal or external factor as unpleasant triggers a
series of psychological and biological processes that is meant to evaluate and then respond
to the stressor, in order to restore body homeostasis (Lucassen et al, 2013). For balance to
be restored, the stress response incorporates the nervous system and the endocrine system,
each playing a crucial role in triggering and maintaining the body’s response to a perceived
stress (Widmaier, Raff, & Strang, 2013). The nervous system is split into two separate
parts: the central nervous system and the peripheral nervous system. The central nervous
system consists of the brain and spinal cord, while the peripheral nervous system contains
the somatic nervous system and the autonomic nervous system (ANS) (Kandel, Schwartz,
& Jessel, 2000). The ANS is responsible for control of the involuntary bodily functions,
such as breathing, heart rate, and digestion, and helps to relay signals from internal organs
to parts of the brain, specifically the medulla, pons, and the hypothalamus (Streeton,
National Dysautonomic Research Foundation). The ANS is split into two divisions: the
sympathetic and the parasympathetic. These pathways allow for a direct route for
autonomic nerves to convey unconscious, necessary changes as a reaction to stimuli, such
as stress (Streeton). When a stressor is perceived by an individual, the ANS pathway,
through the sympathetic division, is the first to be activated in the immediate “flight or
flight” response. The adrenal medulla releases the hormones epinephrine and
norepinephrine, which work to ready the body in a physical response by raising heart,

6
respiratory and metabolic rate, as well as directing blood flow towards crucial parts of the
body that would be necessary in a physical response (Lucassen et al, 2013). This release of
hormones in response to stress brings into play the relationship between the nervous and
endocrine system, as the second portion of the stress response involves the hypothalamic-
pituitary-adrenal (HPA) axis.
The HPA axis is extermely important to the stress response to both chronic and
acute stress. Once an individual registers
a stressor, the HPA axis is activated by
the hypothlamus releasing
corticotrophin-releasing hormone
(CRH). The release of CRH then
increases the production of
adrenocorticotropic-hormone (ACTH)
in the anterior pituitary, which
subsequently stimulates the adrenal cortex to produce the glucocorticoid hormone cortisol
(Yau & Potenza, 2013). The presence of the steroid hormone cortisol in the body then
creates a negative feedback loop that leads to the hypothalamus and anterior pituitary to
cease production of CRH and ACTH, respectively, and allows for the body to regain
homeostasis after the perceived stressor. This exchange of information that occurs between
the hypothalamus and the pituitary, and the resulting effects, is known as the
neuroendocrine system; meaning it involves the stimulation of the nervous system and the
secretion of hormones from the endocrine system (Medical Dictionary). Hormones play a
Figure 1. The HPA axis and its regulation (Source: Adam Bender 2014 Student Research Grant, Union College. 2014)

7
critical role in maintaining the stress response, and are crucial in initiating the necessary
physiological changes, and come in a variety of forms with different functions.
Steroid hormones, and their role between the brain and endocrine system, were
discovered by Geoffrey Harris when pioneering research on communication between the
hypothalamus and the pituitary through steroid hormones (Harris, 1970). Synthesized from
cholesterol, the steroid hormones are produced by endocrine glands to develop and drive
physiological responses to stimuli. The secretion of adrenal steroid hormones, one of which
being cortisol, are highly involved in maintaining the homeostasis of the body through
glucose metabolism and the stress response with the HPA axis (Evans, 1988). Guillemin
and Rosenberg (1955) lent support to the existence of the HPA axis using the pituitary of
a rat, and demonstrating that CRH from the hypothalamus led to the release of ACTH from
the pituitary. The HPA axis is mediated by a multitude of factors that include
neurotransmitters, neuropeptides, and steroid hormones, and work to activate and control
different aspects of the pathway. Neuropeptides are chemical signals in the brain, and
defined as small proteinaceous substances produced and released by neurons through the
regulated secretory route and acting on neural substrates (Burbach, 2011). Stress activates
different neuropeptides such as CRH, vasopressin, neuropeptide Y, and ghrelin, each of
which exerts different functions on the brain to influence a certain physiological response
to the stressor (Joels & Baram, 2009). The activation of the HPA axis and involved
neurotransmitters is accompanied by the release of cortisol, arguably the most important
hormone involved in the stress response.
Edward C. Kendall and Philip S. Hench first discovered cortisol, also known as
hydrocortisone, in the 1930’s through their methods of extracting hormones from bovine

8
adrenal glands (Saenger, 2010). Being one of the six hormones extracted, it is defined as
being a steroid hormone by its four ring linked structure, three rings with six carbons and
one with five (Figure 2). Cortisol is produced by stimulation of the zona fasciculata of the
adrenal cortex by ACTH. It belongs to the
glucocorticoid family, whose receptors are known to
be involved in regulating metabolism of almost every
vertebrate (Adam & Epel, 2007; Pelt, 2011).
Glucocorticoids are particularly known for their anti-
inflammatory actions by inhibiting the expression of
inflammatory genes, and increasing transcription of anti-inflammatory genes (Barnes,
1998). In addition to its effects on the immune system, cortisol alters the body’s
metabolism by elevating blood glucose levels through glycogenolysis in the liver and
breaking down proteins and fat, along with decreasing the size of blood vessels to raise
blood pressure and therefore heart rate (Dickerson & Kemeny, 2004). The raised glucose
levels result in an increase of energy that can be used to respond to the perceived stressor.
Although cortisol is always present in the stress response, a prolonged presence of the
hormone can be detrimental. Due to the fact that cortisol is associated with the suppression
of the immune system, its presence during chronic stress weakens the body’s defense
against disease and infection. Cortisol also directly affects fat storage, as stress-induced
cortisol secretion has been implicated in visceral fat storage, with studies finding that a
higher BMI is associated with social stressors over a period of time (Epel, McEwen, &
Seeman, 2000). Furthermore, continuous cortisol levels during periods of chronic stress
has been connected to more serious health issues. Bergmann, Gyntelberg, & Faber (2014)
Figure 2. Structure of cortisol

9
found evidence that chronic psychological stress is a risk factor for developing metabolic
syndrome, a health concern that is characterized by a large waistline, high triglyceride
level, lower HDL cholesterol, high
blood pressure, and high fasting blood
sugar. Along with being linked to
higher BMI and obesity, cortisol has
been implicated in causing changes in
eating patterns once the stress response
pathway has been initiated. The
immediate “fight or flight” response
with noepinephrine and epinephrine is
correlated with lowering appetite, while
the activation of the HPA axis ending in cortisol is accompanied with increasing appetite
and higher calorie intake, especially on the day a stressor takes place (Torres & Nowson,
2007; Epel et al., 2000). Cortisol being released leads to a cascade involving other
neuropeptides and processes in the body, which work to inhibit and activate hormones
influencing hunger. Increased cortisol secretion leads to higher levels of neuropeptide Y,
and the down-regulation of leptin, a hormone involved in reducing food intake (Torres &
Nowson, 2007; Girard, 1997). Neuropeptide Y (NPY) receptors have been found in areas
of the brain such as the hypothalamus, the limbic system, the pons, and the brain stem, all
of which are involved in emotional, autonomic, and endocrine processes in the body.
Plasma NPY is positively correlated with the release of cortisol and negatively correlated
with psychological distress (Morgan et al., 2002). High levels of NPY stimulate hunger
Figure 3. NPY and leptin regulation from cortisol release

10
and food-seeking behavior, and provide a connection between the gut and brain with how
stress influences hunger and the resulting consequences (Hirsch & Zukowska, 2012). In
addition to food intake and food seeking behaviors being manipulated by NPY and cortisol,
the type of food eaten during a period of stress has been determined to be altered from that
of a relatively stress free time. McCann, Warnick & Knopp (1990) found that when
comparing groups of people with differing levels of workload, those that believed they had
a larger workload and more stress consumed greater amounts of fatty foods, further
emphasizing the fact that cortisol secretion influences eating habits. In studies of patients
with Binge Eating Disorders (BED), participants were more likely to crave sweet things
and have the desire to binge after being exposed to the stressor than those without BED.
Additionally, after exposure to a Trier Social Stress Test (TSST), a laboratory technique
designed to simulate acute psychological stress, those individuals in the BED group had
cortisol levels that were positively correlated with higher binge scores (Rosenberg, Block,
& Avi, 2013). In summary, the secretion of cortisol leads to higher levels of NPY, which
results in increased hunger and a greater desire for fatty and sugary foods. Diggins, Woods-
Giscombe, and Waters (2015) analyzed the existence of emotional eating and stress in
African American college women, with emotional eating being defined as the consumption
of foods during times of increased stress, especially high sugar and high fatty foods. Their
results indicated that an association existed between emotional eating and perceived stress,
and that higher perceived stress was a positive indicator for emotional eating among the
college women.
Higher desire for sugary foods in the presence of stress presents the risk for
developing a dependence on sugar during stressful times. Sugar intake activates dopamine
11
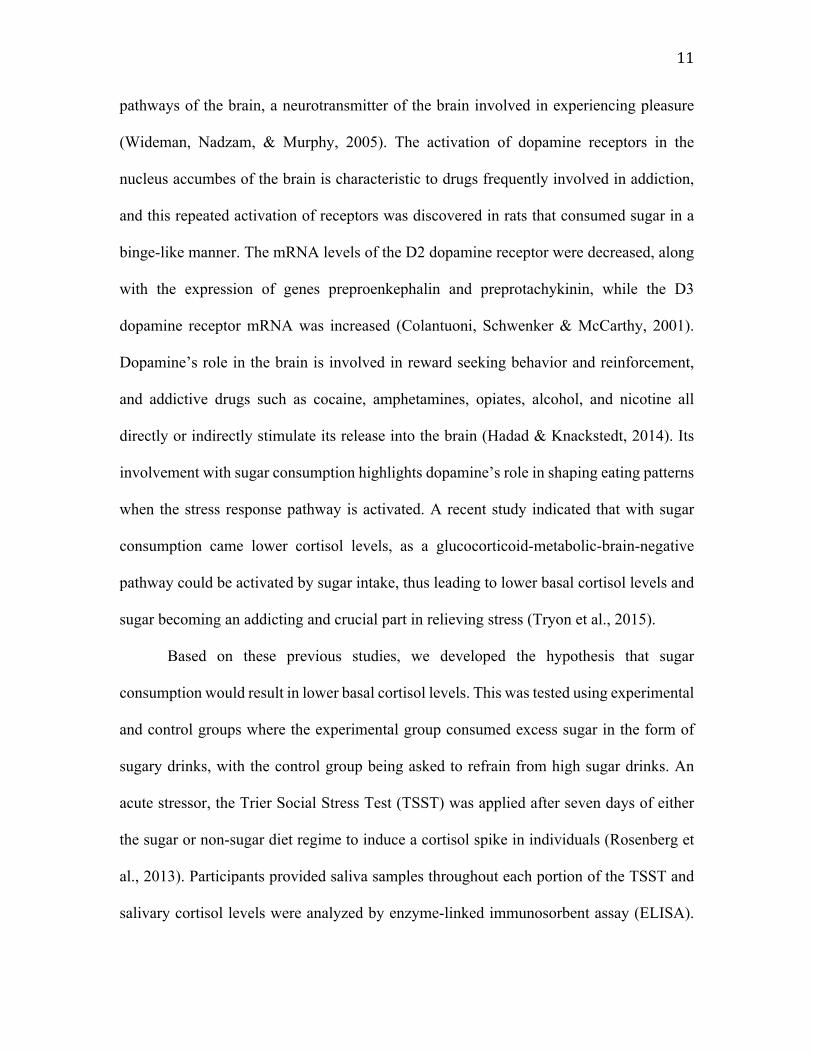
pathways of the brain, a neurotransmitter of the brain involved in experiencing pleasure
(Wideman, Nadzam, & Murphy, 2005). The activation of dopamine receptors in the
nucleus accumbes of the brain is characteristic to drugs frequently involved in addiction,
and this repeated activation of receptors was discovered in rats that consumed sugar in a
binge-like manner. The mRNA levels of the D2 dopamine receptor were decreased, along
with the expression of genes preproenkephalin and preprotachykinin, while the D3
dopamine receptor mRNA was increased (Colantuoni, Schwenker & McCarthy, 2001).
Dopamine’s role in the brain is involved in reward seeking behavior and reinforcement,
and addictive drugs such as cocaine, amphetamines, opiates, alcohol, and nicotine all
directly or indirectly stimulate its release into the brain (Hadad & Knackstedt, 2014). Its
involvement with sugar consumption highlights dopamine’s role in shaping eating patterns
when the stress response pathway is activated. A recent study indicated that with sugar
consumption came lower cortisol levels, as a glucocorticoid-metabolic-brain-negative
pathway could be activated by sugar intake, thus leading to lower basal cortisol levels and
sugar becoming an addicting and crucial part in relieving stress (Tryon et al., 2015).
Based on these previous studies, we developed the hypothesis that sugar
consumption would result in lower basal cortisol levels. This was tested using experimental
and control groups where the experimental group consumed excess sugar in the form of
sugary drinks, with the control group being asked to refrain from high sugar drinks. An
acute stressor, the Trier Social Stress Test (TSST) was applied after seven days of either
the sugar or non-sugar diet regime to induce a cortisol spike in individuals (Rosenberg et
al., 2013). Participants provided saliva samples throughout each portion of the TSST and
salivary cortisol levels were analyzed by enzyme-linked immunosorbent assay (ELISA).

12
The goal of the study was to test whether sugar consumption affected cortisol levels, as
well as examining the effect of sugar consumption on perceived stress, in hopes of
providing more clarification to existing literature in the relationship between sugar and
stress.

13
Materials and Methods
Participants
23 participants, 10 males and 13 females, were recruited by researchers on a
volunteer basis with compensation of nine dollars. All were Union College undergraduates
at an average age of 21, and were asked their preference on being assigned to the sugar or
non-sugar (control) consumption portion of the study. Any participant with a family history
of diabetes, sugar intolerance, high blood pressure (140/90mm Hg), kidney or liver disease,
elevated triglycerides, or on any medications related to controlling blood sugar were
automatically placed into the group abstaining from sugary drinks. A total of nine people
were used in the sugar consumption leg of the study, with 14 in the control (water) group.
The participants’ anonymity was ensured by randomly assigning them a number, which
would begin with “55” and end with either “1” or “2” to identify if placed in the water or
sugar group, respectively.
The Trier Social Stress Test
The Trier Social Stress Test was used to induce stress in the participants,
subsequently causing a change in their cortisol levels. After completing all assigned
surveys, participants were told that they would have five minutes to prep a five-minute
speech to say in front of a panel of three judges, on explaining to an employer why a liberal
arts education at Union College would be help them earn a job. They were not allowed to
write down their speech, and had to stay in front of the judges for the entire five minutes.
In order to give them incentive to make an effort with their speech, they were told that a
prize would be given out at the end of the study to the person with the best speech. The
panel consisted of members from Professor Cohen’s research lab, who were instructed to

14
act as though they were truly evaluating the participants’ performance. After the five-
minute speech, a member of the panel would instruct the participant that they would be
undergoing an arithmetic problem for five minutes, and count backwards from 1022 by
intervals of 13. Whenever the participant made a mistake, a member of the panel would
say “1022” and indicate that they start from the beginning at 1022. After the five minutes,
participants were allowed to leave the room, and were immediately briefed by the
researcher.
Materials
Participants were given a total of four surveys to complete before and after the
TSST. Before the TSST, they were asked to rate themselves on a scale of one to ten on
how stressed they felt, if they had assignments or sporting events occurring that same week,
and their food preferences. They also completed the Undergraduate Student Hassle Scale
(RUSHS), a survey of 57 questions in order to gauge the stress present in academic, social,
and personal parts of their lives. Post TSST, they were once again asked to rate themselves
on a scale of one to ten, their stress during any portions of the test, and their food
preferences. Participants then filled out a demographic survey to collect information on
their gender, major, body data, eating, sleeping and exercise habits, and any medication
they were currently taking. Each participant was also asked to keep a food log for the seven
days prior to the TSST, and write down their meals and beverages consumed to properly
assess the sugar content in their diet.
Procedure
Seven days prior to coming into the lab, participants were asked to begin their sugar
or non-sugar diet through the consumption of sugary or non-sugary beverages, and record

15
their diet. Participants were asked to come into the laboratory between the hours of 6pm-
7:30pm for the total of an hour, in order to control for changes in cortisol levels that occur
periodically throughout the day. After arriving in the lab located on the second floor in
Wold, participants were asked to give a saliva sample and fill out two surveys. Once all
required tasks were completed, they were led into the adjoining lab and received
instructions to begin the TSST. Immediately after finishing the math portion of the TSST,
participants were brought back into the original lab and asked to give a second saliva
sample. They were debriefed and informed the purpose of the TSST and the study, and
asked to give a third saliva sample after a 30-minute “cool down” period.
Enzyme-Linked Immunosorbent Assay (ELISA)
The saliva samples were analyzed for their cortisol level content using the
competitive binding technique with cortisol HRP-conjugate in an enzyme-linked
immunosorbent assay (ELSA). All deviations from the ELISA protocol (Appendix A) are
listed. Corning Easy Wash microtiter plates were coated with rabbit anti-cortisol polyclonal
antibody in coating buffer at 1:15,000 dilution instead of 1:30,000, as a much more
concentrated antibody dilution yielded more accurate results on cortisol levels in the saliva.
The dilution of cortisol HRP in EIA buffer was increased from 1:6,000 to 1:10,000, with
Figure 4. Typical layout for 96-well microtiter plate used for ELISAs
16
the ratio between antibody and cortisol-HRP significantly improving the standard curve.
The amount of standards and samples added was increased from 2.5ul/well to 25 ul/well,
along with a pooled IEV cortisol sample in the very last three rows of the plate for a positive
cortisol control. The standards, ranging from 400ng/ml – 1.25ng/ml, were adjusted slightly
in concentration in order to develop a more precise standard curve. Saliva samples from
participants were centrifuged at 12,000rpm for five minutes, keeping the supernatant and
discarding the pellet. Each pre-TSST, post-TSST, and 30-minute saliva sample were placed
in separate sections on the plate with three wells each, with a total of nine wells
corresponding to one participant. 7.5milliliters of Solution A and Solution B were used for
the TMB Peroxidase per plate, and one kinetic run and one endpoint run were run for each
plate, as one endpoint was deemed sufficient enough to collect just as exact results as two.

17
Results
RUSHS scores and Perceived Stress in Sugar vs. Water Group
Comparing the scores from the Revised Student Undergraduate Scale (RUSHS),
survey between sugar consumption and non-sugar consumption (water) group, revealed
higher RUSHS scores for the sugar group than the water group in terms of academic, social,
personal, and overall perceived stress participants (Figure 6). The difference was
significant for the academic (p= 0.027) and overall (p= 0.037).
Change in Cortisol Levels: Pre-TSST to Post-TSST
Analysis of the change in cortisol levels from pre-TSST (cortisol 1) to post-TSST
(cortisol 2) indicated a difference from cortisol baseline levels to the post-stressor period.
The sugar consumption group displayed a significantly higher percent change in cortisol
levels than the water group (p< 0.05). The higher percent change demonstrates that the
0
100
200
300
400
Academic* Personal Social Overall*
Revised Undergraduate Student Hassle Scale (RUSHS) Stress Scores
Water Sugar
Figure 5. The Revised Undergraduate Student Hassle Scale (RUSHS) scores for academic, personal, social, and overall stress for participants in the sugar consumption vs. non-sugar consumption (water) group. Academic and overall stress were significant with p< 0.05.
18
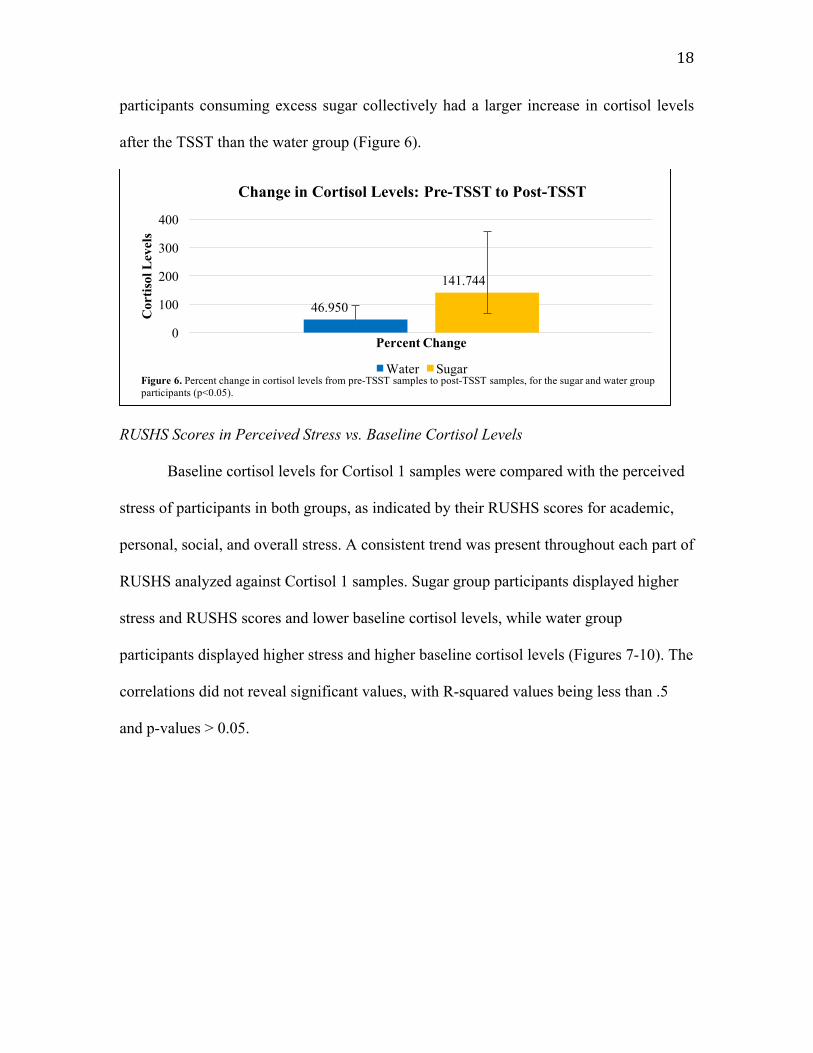
participants consuming excess sugar collectively had a larger increase in cortisol levels
after the TSST than the water group (Figure 6).
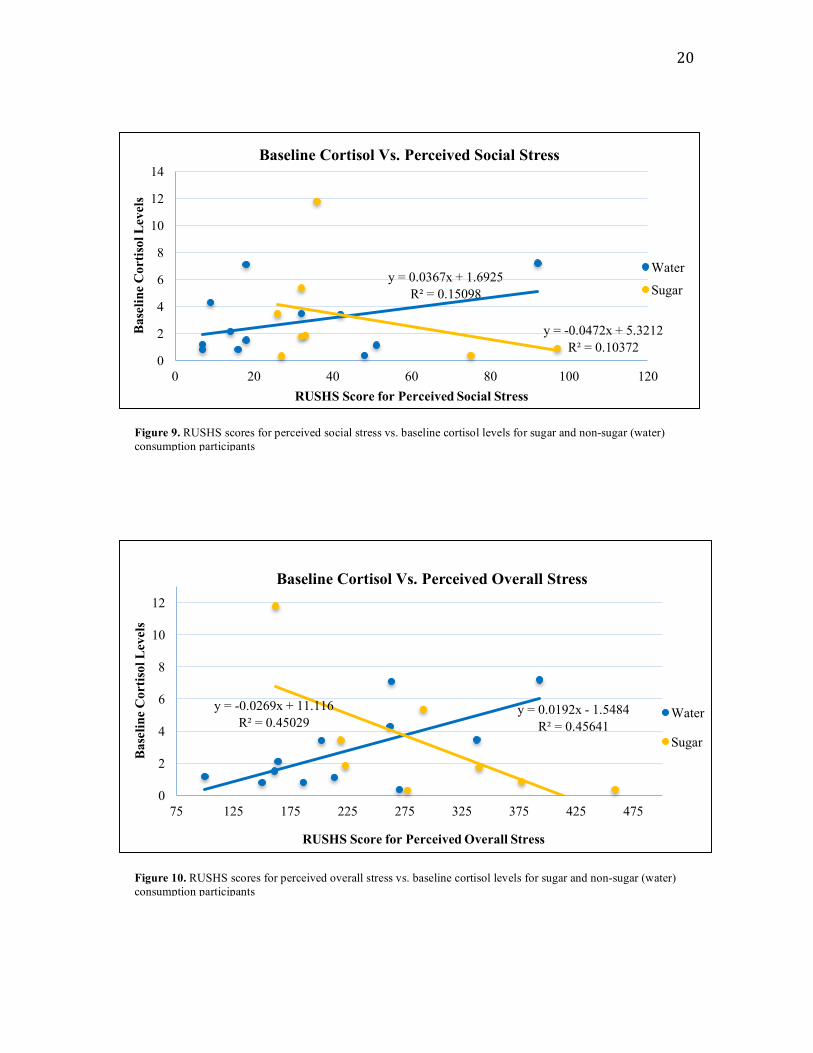
RUSHS Scores in Perceived Stress vs. Baseline Cortisol Levels
Baseline cortisol levels for Cortisol 1 samples were compared with the perceived
stress of participants in both groups, as indicated by their RUSHS scores for academic,
personal, social, and overall stress. A consistent trend was present throughout each part of
RUSHS analyzed against Cortisol 1 samples. Sugar group participants displayed higher
stress and RUSHS scores and lower baseline cortisol levels, while water group
participants displayed higher stress and higher baseline cortisol levels (Figures 7-10). The
correlations did not reveal significant values, with R-squared values being less than .5
and p-values > 0.05.
46.950
141.744
0
100
200
300
400
Cor
tisol
Lev
els
Percent Change
Change in Cortisol Levels: Pre-TSST to Post-TSST
Water SugarFigure 6. Percent change in cortisol levels from pre-TSST samples to post-TSST samples, for the sugar and water group participants (p<0.05).

19
y = 0.0348x - 1.3707R² = 0.33642y = -0.0551x + 11.781
R² = 0.44606
0
2
4
6
8
10
12
50 70 90 110 130 150 170 190 210
Bas
elin
e C
ortis
ol L
evel
s
RUSHS Score for Perceived Academic Stress
Baseline Cortisol vs. Perceived Academic Stress
Water
Sugar
y = 0.0277x + 0.6539R² = 0.27682y = -0.0607x + 8.8638
R² = 0.3897
0
2
4
6
8
10
12
0 20 40 60 80 100 120 140 160
Bas
elin
e C
ortis
ol L
evel
s
RUSHS Score for Perceived Personal Stress
Baseline Cortisol vs. Perceived Personal Stress
Water
Sugar
Figure 7. RUSHS scores for perceived academic stress vs. baseline cortisol levels for sugar and non-sugar (water) consumption participants
Figure 8. RUSHS scores for perceived personal stress vs. baseline cortisol levels for sugar and non-sugar (water) consumption participants
20
y = 0.0367x + 1.6925R² = 0.15098
y = -0.0472x + 5.3212R² = 0.10372
0
2
4
6
8
10
12
14
0 20 40 60 80 100 120
Bas
elin
e C
ortis
ol L
evel
s
RUSHS Score for Perceived Social Stress
Baseline Cortisol Vs. Perceived Social Stress
Water
Sugar
y = 0.0192x - 1.5484R² = 0.45641
y = -0.0269x + 11.116R² = 0.45029
0
2
4
6
8
10
12
75 125 175 225 275 325 375 425 475
Bas
elin
e C
ortis
ol L
evel
s
RUSHS Score for Perceived Overall Stress
Baseline Cortisol Vs. Perceived Overall Stress
Water
Sugar
Figure 9. RUSHS scores for perceived social stress vs. baseline cortisol levels for sugar and non-sugar (water) consumption participants
Figure 10. RUSHS scores for perceived overall stress vs. baseline cortisol levels for sugar and non-sugar (water) consumption participants

21
Normal vs. Abnormal Response to Stress
A normal response to stress was determined to be a rise in cortisol levels from
Cortisol 1 (pre-TSST) to Cortisol 2 (post-TSST), and a decrease in cortisol levels from
Cortisol 2 to Cortisol 3 (30-minute cool down period). An abnormal response to stress was
defined as anything varying from that, including cortisol levels decreasing from Cortisol 1
to Cortisol 2 or rising from Cortisol 2 to Cortisol 3 (Figure 11). Participants were placed
into a normal or abnormal response to stress based on their cortisol levels (Figure 11). The
results for a normal response to stress revealed that the sugar consumption group showed
a significantly larger increase in cortisol levels from Cortisol 1 to Cortisol 2 than the water
group (p< 0.024). Sugar group participants also showed a significantly greater decrease in
their cortisol levels when compared to the water group (p<0.048).
-300
-200
-100
0
100
200
300
400
500
Cortisol 1 to Cortisol 2 (+) * Cortisol 2 to Cortisol 3 (-) * Cortisol 1 to Cortisol 2 (-) Cortisol 2 to Cortisol 3 (+)
Cor
tisol
Lev
els
Water Group Sugar Group
Abnormal ResponseNormal Response
Figure 11. Abnormal and normal responses of cortisol levels in participants. Cortisol 1 represents pre-TSST, Cortisol 2 represents directly after TSST, and Cortisol 3 is 30 minutes post-TSST.

22
Discussion
Based on previous literature concerning sugar consumption and cortisol levels, we
developed the hypothesis that sugar consumption would result in lower basal cortisol
levels. A correlation was observed in the data between the perceived stress and cortisol
levels of the subjects for both the experimental and control group. Sugar participants
reported higher perceived stress in terms of RUSHS, with ELISA assays revealing lower
baseline cortisol levels. On the other hand, water participants presented with higher
RUSHS scores and perceived stress, along with higher baseline cortisol levels when
compared to the sugar consumption group. Although the association was not statistically
significant, the trend was consistent through reported academic, personal, social, and
overall stress when comparing baseline cortisol and RUSHS scores.
In order to examine the data more in depth and differentiate between individuals
that had or had not experienced the normal stress response, with increased salivary
cortisol levels after the TSST and decreasing cortisol levels 30 minutes later, the sugar
and water groups were split into normal and abnormal stress response. The separation
eliminated any individuals who had not been stressed by the TSST in terms of their
cortisol levels, and aided in sorting out those who may have self-reported not feeling
distressed but had increased cortisol levels that revealed otherwise. The sugar group had
statistically significant differences from the water group both directly after the TSST and
30 minutes later, with sugar consumption participants showing a much larger increase in
cortisol levels directly after undergoing the stressor, and displaying lower cortisol levels
and a faster “cool down” than water participants in the 30 minute period. Their levels
differed from the water group as they had lower baseline cortisol levels, a greater
23
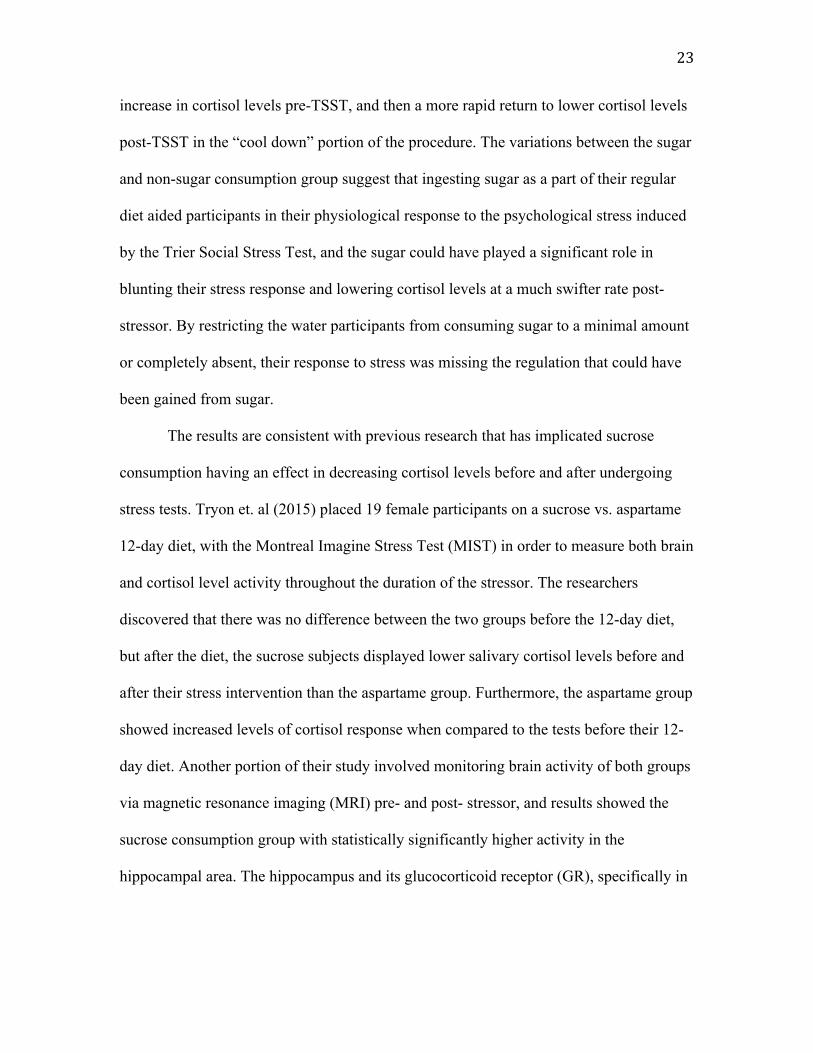
increase in cortisol levels pre-TSST, and then a more rapid return to lower cortisol levels
post-TSST in the “cool down” portion of the procedure. The variations between the sugar
and non-sugar consumption group suggest that ingesting sugar as a part of their regular
diet aided participants in their physiological response to the psychological stress induced
by the Trier Social Stress Test, and the sugar could have played a significant role in
blunting their stress response and lowering cortisol levels at a much swifter rate post-
stressor. By restricting the water participants from consuming sugar to a minimal amount
or completely absent, their response to stress was missing the regulation that could have
been gained from sugar.
The results are consistent with previous research that has implicated sucrose
consumption having an effect in decreasing cortisol levels before and after undergoing
stress tests. Tryon et. al (2015) placed 19 female participants on a sucrose vs. aspartame
12-day diet, with the Montreal Imagine Stress Test (MIST) in order to measure both brain
and cortisol level activity throughout the duration of the stressor. The researchers
discovered that there was no difference between the two groups before the 12-day diet,
but after the diet, the sucrose subjects displayed lower salivary cortisol levels before and
after their stress intervention than the aspartame group. Furthermore, the aspartame group
showed increased levels of cortisol response when compared to the tests before their 12-
day diet. Another portion of their study involved monitoring brain activity of both groups
via magnetic resonance imaging (MRI) pre- and post- stressor, and results showed the
sucrose consumption group with statistically significantly higher activity in the
hippocampal area. The hippocampus and its glucocorticoid receptor (GR), specifically in
24
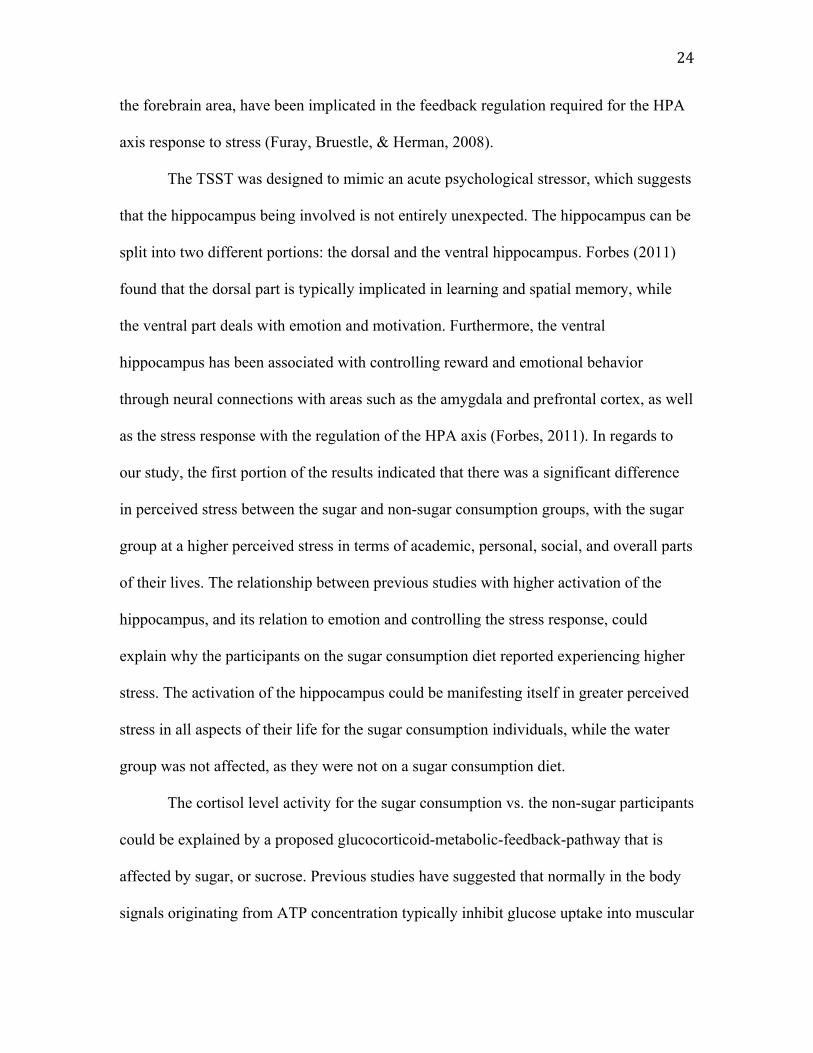
the forebrain area, have been implicated in the feedback regulation required for the HPA
axis response to stress (Furay, Bruestle, & Herman, 2008).
The TSST was designed to mimic an acute psychological stressor, which suggests
that the hippocampus being involved is not entirely unexpected. The hippocampus can be
split into two different portions: the dorsal and the ventral hippocampus. Forbes (2011)
found that the dorsal part is typically implicated in learning and spatial memory, while
the ventral part deals with emotion and motivation. Furthermore, the ventral
hippocampus has been associated with controlling reward and emotional behavior
through neural connections with areas such as the amygdala and prefrontal cortex, as well
as the stress response with the regulation of the HPA axis (Forbes, 2011). In regards to
our study, the first portion of the results indicated that there was a significant difference
in perceived stress between the sugar and non-sugar consumption groups, with the sugar
group at a higher perceived stress in terms of academic, personal, social, and overall parts
of their lives. The relationship between previous studies with higher activation of the
hippocampus, and its relation to emotion and controlling the stress response, could
explain why the participants on the sugar consumption diet reported experiencing higher
stress. The activation of the hippocampus could be manifesting itself in greater perceived
stress in all aspects of their life for the sugar consumption individuals, while the water
group was not affected, as they were not on a sugar consumption diet.
The cortisol level activity for the sugar consumption vs. the non-sugar participants
could be explained by a proposed glucocorticoid-metabolic-feedback-pathway that is
affected by sugar, or sucrose. Previous studies have suggested that normally in the body
signals originating from ATP concentration typically inhibit glucose uptake into muscular

25
and adipose tissue, and streamline resources towards the blood-brain barrier (Peters,
Schweiger, Pellerin, et. al, 2004). In the face of high stress, this pathway is reversed to
favor catabolism and uptake of energy. Dallman et. al (2003) studied the eating habits
and pronounced effects from adrenalectomized rats, including a sucrose vs. saline diet
and how the HPA axis would respond. The results showed that the more sucrose ingested,
the less corticotrophin releasing factor (CRF) mRNA was expressed. On the other hand,
as the amount of mesenteric fat on the rats increased, the expression of CRF mRNA
decreased as well, suggesting that both the amounts of sucrose and fat favor a decrease in
activation of the HPA axis due to being interpreted as a large amount of energy storage.
In regards to our study, the sugar could be interpreted as a source of high energy and
helping to deactivate the HPA axis. This may explain the lower baseline levels and the
exaggerated response to stress. The faster cortisol level cool down period from post-
TSST to 30 minutes later for sugar consumption participants, rather than just water, could
be explained by the high amount of sugar and energy still present, and the body using that
energy to stop the stress response as evidenced by the low cortisol levels. This provides
further evidence for a glucocorticoid metabolic feedback pathway as suggested in
previous research, as the non-sugar consumption group did not have the same results with
their cortisol level, and asked to obey a sugar-free diet.
Future directions for this study include increasing the sample size (n = 22), in
order to control for potential outliers in the data. To control for confounding variables
that could be present in each of the individuals being tested, the subjects would have to
be restricted to simply one gender or females not taking birth control. After the methods
had been implemented and the testing of subjects began, a study was published that stated

26
women taking oral contraceptives exhibited higher baseline cortisol levels pre-TSST and
post-TSST (McQuaid, et al., 2016). Although participants were asked to list any sort of
medication they were on, in addition to their gender while filling out demographic
information, the effects that the birth control may have had on cortisol levels was not
examined. The results of this study has implications on how to address undergraduate
students during their years in college, in not only education for proper diet and stress
management in the first year, but throughout the duration of their university or college
career. With the growing amount of pressure being placed upon students in the coming
age, and being held to a higher standard of academic success, it is essential that programs
are implemented in order to ensure that programs highlighting healthy eating and stress
reduction habits are put into place.
Acknowledgements
First and foremost, I would like to truly thank and acknowledge my advisor,
Professor Brian D. Cohen, for his invaluable guidance, assistance, and plethora of
knowledge throughout both my senior year thesis research and my academic career at
Union College. I would also like to thank the Union College Biology and Psychology
Department for the opportunity to create a biology-psychology thesis, along with the
Union College Student Research Grant on providing me the funding to do so. Finally, I
would like to thank the members of my lab and Team Cohen, specifically my lab partner
David Roy, from their assistance with TSST panels to their continuous support.

27
References
Adam TC, Epel ES. Stress, eating, and the reward system. Physiology and Behavior. 2007;91:449-458.
Barnes PJ. Anti-inflammatory actions of glucocorticoids: Molecular mechanisms. Clinical Science. 1998(94):557-573.
Baum, A. (1990). “Stress, Intrusive Imagery, and Chronic Distress.” Health Psychology.Vol. 6, pp. 653-675.
Bergmann N, Gyntelberg F, Faber J. The appraisal of chronic stress and the development of the metabolic syndrome: A systematic review of prospective cohort studies. Endocrine Connections. 2014;3(R55):1-26.
Berset M, Semmer NK, Elfering A, Jacobshagen N, Meier LL. Does stress at work make you gain weight? A two-year longitudinal study. Scand J Work Environ Health. 2011;37(1):45-53.
Boyce J., Kuijer R.G. Perceived stress and freshman weight change: The moderating role of baseline body mass index. Physiology & Behavior. Volume 139, February 2015, Pages 491-496.
Burbach J. What are neuropeptides? Methods Molecular Biology. 2011(789):1-36.
Cohen S, Kessler RC, Gordon LU. Strategies for measuring stress in studies of psychiatric and physical disorders. In: Cohen S, Kessler RC, Gordon LU, editors. Measuring stress: A guide for Health and Social Scientists. Oxford: Oxford University Press; 1995.
Colantuoni C, Schwenker J, McCarthy J, et al. Excessive sugar intake alters binding to dopamine and mu-opioid receptors in the brain. Neuroreport. 2001;12(16):3549-3552.
Dallman M.F., Pecoraro N, & Akana S.F., et. al. Chronic Stress and Obesity: A new view of “comfort food”. PNAS. 100(20): 11696-11701.
Dickerson SS, Kemeny ME. Acute stressors and cortisol responses: A theoretical integration and synthesis of laboratory research. Psychol Bull. 2004;130(3):355-391.
Diggins A,Woods-Giscombe C, Waters S. The association of perceived stress, contextualized stress, and emotional eating with body mass index in college-aged Black women. Eating Behaviors. Volume 19, December 2015, Pages 188-192.

28
Epel ES, McEwen B, Seeman T, et al. Stress and body shape: Stress-induced cortisol secretion is consistently greater among women with central fat. Psychosomatic Medicine. 2000; 62(5): 623-632.
Evans RM. The steroid and thyroid hormone receptor superfamily. Science. 1988;240(4854):889-895.
Furay, A.R, Bruestle, A.E, & Herman J.P. The Role of the Forebrain Gluccocorticoid Receptor in Acute and Chronic Stress. Endocrinology. 2008; 49(11): Online.
Forbes, Erika E. Dorsal vs. Ventral Hippocampal Neurogenesis: Implications for Cognition and Mood. Neuropsychopharmacology. 2011; 36: 372-373.
Girard J. Is leptin the link between obesity and insulin resistance? Molecular Endocrinology and Development. 1997;23(3):16-24.
Guillemin R, Rosenberg B. Humoral hypothalamic control of anterior pituitary: a study with combined tissue cultures. Endocrinology. 1955;57:599–607
Hadad NA, Knackstedt LA. Addicted to palatable foods: Comparing the neurobiology of bulimia nervosa to that of drug addiction. Psychopharmacology. 2014;231(9):1897-1912.
Harris GW. Effects of the nervous system on the pituitary-adrenal activity Progress in Brain Research. 1970(32):86-88.
Harris, Ruth B. S., Jun Zhou, Bradley D. Youngblood, Igor I. Rybkin, Gennady N. Smagin, and Donna H. Ryan. Effect of repeated stress on body weight and body composition of rats fed low- and high-fat diets. Am. J. Physiol. 275 (Regulatory Integrative Comp. Physiol. 44): R1928– R1938, 1998
Herbert J. Stress, the brain, and mental illness. British Medical Journal. 1997;315:530-535.
Hirsch D, Zukowska Z. NPY and stress 30 years later: The peripheral view Cell Molecular Neurobiology. 2012;32(5):645-659.
Joels M, Baram TZ. The neuro-symphony of stress. Nature Reviews Neuroscience. 2009;10:459.
Kandel ER, Schwartz JH, Jessel TM, eds. (2000). "Ch. 17: The anatomical organization of the central nervous system". Principles of Neural Science. McGraw-Hill Professional.

29
Kiss A, Aguilera G. Regulation of the hypothalamic pituitary adrenal axis during chronic stress: Responses to repeated intraperitoneal hypertonic saline injection. Brain Res. 1993; 630(1): 262-270.
Kunz-Ebrecht SR, Mohamed-Ali V, Feldman PJ, Kirschbaum C, Steptoe A. Cortisol responses to mild psychological stress are inversely associated with proinflammatory cytokines. Brain Behav Immun. 2003;17(5):373-383.
Lucassen PJ, Pruessner J, Sousa N, et al. Neuropathology of stress. Acta Neuropathol. 2013(127):109-135.
McCann BS, Warnick GR, Knopp RH. Changes in plasma lipids and dietary intake accompanying shifts if perceived workload and stress. Psychosomatic Medicine. 1990;52:97-108.
McQuaid RJ, McInnis OA, Paric A, Al-Yawer F, Matheson K, & Anisman H. Relations Between Plasma Oxytocin and Cortisol: The Stress Buffering Role of Social Support. Neurobiology of Stress.
McEwen BS, Gray JD, Nasca C. Redefining neuroendocrinology: Stress, sex and cognitive and emotional regulation. Journal of Endocrinology. 2015(226):67-83.
Morgan CA, Rasmusson AM, Wang S, Hoyt S, Hauger RL, Hazlett G. Neuropeptide-Y, cortisol, and subjective distress in humans exposed to acute stress: Replication and extension of previous report Society of Biological Psychiatry. 2002;52:136-142.
MT B. Psychological stress, immunity, and the effects on indigenous microflora. Advanced Experimental Medical Biology. 2016(874):225-246.
Nash JM, Park A. Addicted. (cover story). Time. 1997;149(18):68.
“Neural.” TheFreeDictionary.com. Medical Dictionary. Web.
Pelt A. Glucocorticoids: Effects, action mechanisms, and therapeutic uses. Nova Science. 2011.
Peters A, Schweiger U, Pellerin L, et al. The selfish brain: competition for energy resources. Neurosci Biobehav Rev. 2004;28(2):143–180
Raz I, Katz A, Spencer MK. Epinephrine inhibits insulin-mediated glycogenesis but enhances glycolysis in human skeletal muscle. American Journal of Physiology - Endocrinology and Metabolism. 1991;260(3):E430-E435.

30
Rosenberg N, Bloch M, Avi IB, et al. Cortisol response and desire to binge following psychological stress: Comparison between obese subjects with and without binge eating disorder Psychiatry Research. 2013;208:156-161.
Saenger AK. Discovery of the wonder drug: From cows to cortisone. Clinical Chemistry. 2010;56(8):1349-1350.
Segerstrom SC, Miller GE. Psychological stress and the human immune system: A meta-analytic study of 30 years of inquiry. Psychological bulletin. 2004;130(4):601-630.
Streeten, David H.P. “The Autonomic Nervous System.” National Dysautonomia Research Foundation.
Torres SJ, Nowson CA. Relationship between stress, eating behavior, and obesity. Nutrition. 2007;23(11-12):887-894.
Tryon MS, Stanhope KL, Epel ES, et al. Excessive sugar consumption may be a difficult habit to break: A view from the brain and body. Journal of Clinical Endocrinology and Metabolism. 2015;100(6):2239-2247.
Tsigos C, Chrousos GP. Hypothalamic–pituitary–adrenal axis, neuroendocrine factors and stress. J Psychosom Res. 2002;53(4):865-871.
Vadeboncoeur C, Townsend N, Foster C. A meta-analysis of weight gain in first year university students: is freshman 15 a myth? BMC obesity. 2015;2:22. doi:10.1186/s40608-015-0051-7.
Wideman CH, Nadzam GR, Murphy HM. Implications of an animal model of sugar addiction, withdrawal and relapse for human health. Nutr Neurosci. 2005;8(5):269-276.
Widmaier E, Raff H, Strang K. Vander's human physiology: The mechanisms of body function. 13th ed. ; 2013.
Y.H.C. Yau MNP. Stress and eating behaviors. Minerva Endocrinology. 2013;38(3):255-267.

31
Appendix A
ELISA Protocol
I. Buffer Preparation and reagent supplies • Rabbit anti-cortisol, polyclonal antibody (cat.# 20-CR50, Fitzgerald Ind. Int’l, MA)
o Stored at -200C (also, 1:100 dilutions stored at -200C) o * Currently used at ~1:30,000 dilution o ** Alternate Monoclonal AB: #E86220M, Meridian Life Sciences Inc.,
ME • Cortisol-HRP conjugate; (cat. # 65-IC08, Fitzgerald Ind. Int’l, MA)
o Liquid; Stored at 40C o * Currently used at ~1:6000 dilution in EIA Buffer
• TMB Microwell Peroxidase Substrate (cat #50-76-03; KPL/Kirkegaard & Perry) • Bovine Serum Albumin (Sigma # A7030) • Pressure Sensitive Film (Falcon #3073; from Sigma) • Corning/Costar Easy Wash microtiter plates (#3369 Corning), Fisher # 07-200-642 * Exact dilution will vary with lot and should be determined before running assays.p Coating Buffer (0.05M, pH 9.6): 15 mM Na2CO3 0.159 g MW = 105.99 g/mol 35 mM NaHCO3 0.294 g MW = 84.01 g/mol 0.02% Sodium Azide 0.020 g dd H2O 100 ml Add chemicals to 100 ml H20; Store at 4oC for no more than one week. Phosphate Buffer Stocks (2X concentrated) for EIA Buffer and Wash Solution: Solution A 0.2M NaH2PO4 12.0 g/500 ml MW = 119.98 g/mol Solution B 0.2M Na2HPO4 14.2 g/500 ml MW = 141.96 g/mol Wash Solution (10 X concentrated stock; store at 4oC): 1.5M NaCl 87.66 g MW = 58.44 g/mol 0.5% Tween 20 (liquid) 5.0 ml dd H2O 1 L
Alternate pre-made Wash Solution: 2mM imidazole, 0.02% Tween 20, 0.5 mM EDTA and 160 mM NaCl (20x concentrate; cat #50-63-00; KPL/Kirkegaard & Perry)
Wash Solution (1 X working solution): 0.1M PBS, 0.15M NaCl, 0.05% Tween 20 10X conc stock 100 ml dd H2O 400 ml Solution A 195 ml Solution B 305 ml EIA Buffer (0.1M PBS) for 100 ml: for 200 ml: Solution A 19.5 ml 39 ml Solution B 30.5 ml 61 ml

32
0.15 M NaCl 0.877 g 1.754 g 0.1% BSA 0.1 g 0.2 g ddH2O 50 ml 100 ml Adjust pH to 7.4; Store at 4oC. HCl (0.5M) = 5.0 ml of 5 M HCl plus 50 ml dd H2O Ringers Solution (for preparation of standards) 140 mM NaCl 8.182 g/L MW = 58.44 g/mol 10 mM NaHCO3 0.84 g/L MW = 84.01 g/mol 2mM NaH2PO4 0.24 g/L MW = 119.98 g/mol 1mM MgSO4 0.12 g/L *1mM CaCl2 0.147 g/L MW = 147.02 g/mol 4mM KCl 0.298 g/L MW = 74.56 g/mol Add to 1 L of dd H2O; Adjust to pH 7.8 *Add after mixing other standard solutions and bringing up to at least half of the final volume in dd H2O. For Standards: Add 0.1% BSA at 1.0 g/L II. Dilutions of Standards for Cortisol EIA • Cortisol frozen stock solution 0.4 mg/ml in ethanol at -80°C. • Use 0.1%BSA in Ringer’s solution (see above) • Aliquot standards to labeled tubes, store at -80 °C Option #1: Dilute 0.4 mg/ml stock in EtOH to 0.1 mg/ml (250 µl stock + 750 µl EtOH), then follow dilutions below… Concentration µl of: µl of Ringers 500 ng/ml 10 µl of 0.1 mg/ml 1,990 µl 400 ng/ml 1,600 µl of 500 ng/ml 400 µl 200 ng/ml 1,000 µl of 400 ng/ml 1,000 µl 100 ng/ml 1,000 µl of 200 ng/ml 1,000 µl 50 ng/ml 1,000 µl of 100 ng/ml 1,000 µl 25 ng/ml 1,000 µl of 50 ng/ml 1,000 µl 10 ng/ml 200 µl of 100 ng/ml 1,800 µl 5 ng/ml 1,000 µl of 10 ng/ml 1,000 µl 2.5 ng/ml 1,000 µl of 5 ng/ml 1,000 µl Option #2: Alternate Standards (Lower range); no dilution of original stock… Concentration µl of: µl of Ringers 400 ng/ml 5 µl of 0.4 mg/ml 5 ml 320 ng/ml 1,600 µl of 400 ng/ml 400 µl 160 ng/ml 1,000 µl of 320 ng/ml 1,000 µl 80 ng/ml 1,000 µl of 160 ng/ml 1,000 µl 40 ng/ml 1,000 µl of 80 ng/ml 1,000 µl 20 ng/ml 1,000 µl of 40 ng/ml 1,000 µl
33
10 ng/ml 1,000 µl of 20 ng/ml 1,000 µl 5 ng/ml 1,000 µl of 10 ng/ml 1,000 µl 2.5 ng/ml 1,000 µl of 5 ng/ml 1,000 µl 1.25 ng/ml 1,000 µl of 2.5 ng/ml 1,000 µl
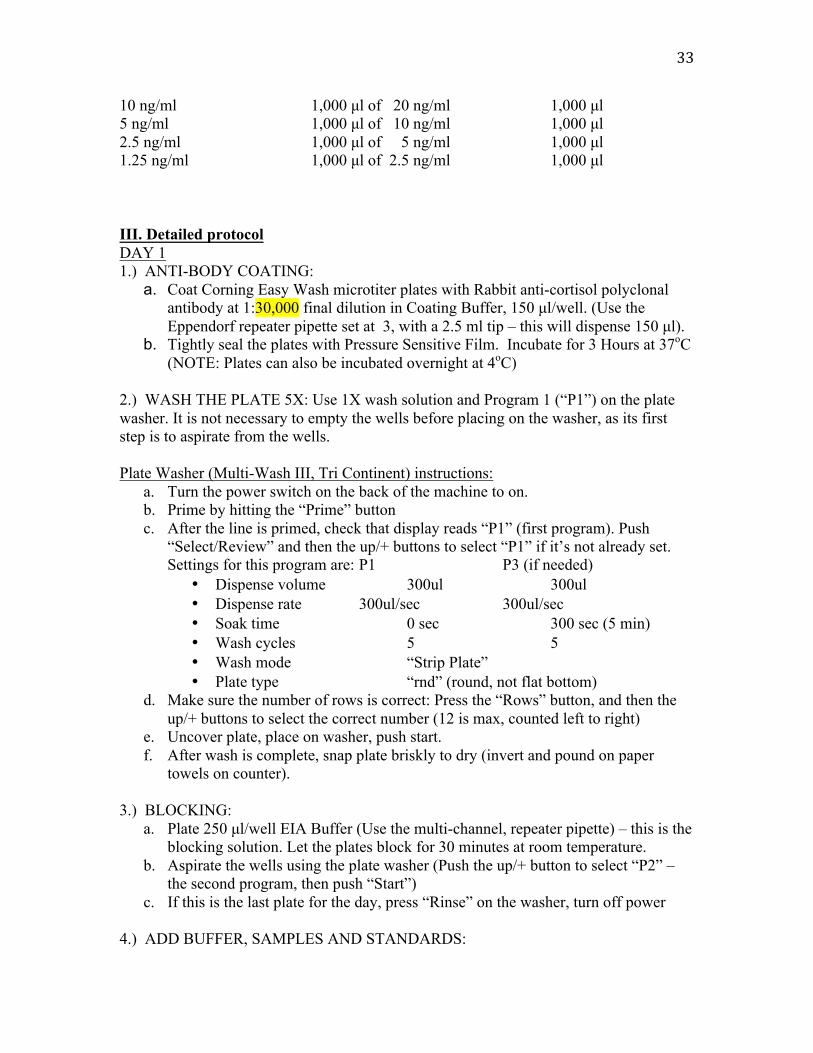
III. Detailed protocol DAY 1 1.) ANTI-BODY COATING:
a. Coat Corning Easy Wash microtiter plates with Rabbit anti-cortisol polyclonal antibody at 1:30,000 final dilution in Coating Buffer, 150 µl/well. (Use the Eppendorf repeater pipette set at 3, with a 2.5 ml tip – this will dispense 150 µl).
b. Tightly seal the plates with Pressure Sensitive Film. Incubate for 3 Hours at 37oC (NOTE: Plates can also be incubated overnight at 4oC)
2.) WASH THE PLATE 5X: Use 1X wash solution and Program 1 (“P1”) on the plate washer. It is not necessary to empty the wells before placing on the washer, as its first step is to aspirate from the wells. Plate Washer (Multi-Wash III, Tri Continent) instructions:
a. Turn the power switch on the back of the machine to on. b. Prime by hitting the “Prime” button c. After the line is primed, check that display reads “P1” (first program). Push
“Select/Review” and then the up/+ buttons to select “P1” if it’s not already set. Settings for this program are: P1 P3 (if needed)
• Dispense volume 300ul 300ul • Dispense rate 300ul/sec 300ul/sec • Soak time 0 sec 300 sec (5 min) • Wash cycles 5 5 • Wash mode “Strip Plate” • Plate type “rnd” (round, not flat bottom)
d. Make sure the number of rows is correct: Press the “Rows” button, and then the up/+ buttons to select the correct number (12 is max, counted left to right)
e. Uncover plate, place on washer, push start. f. After wash is complete, snap plate briskly to dry (invert and pound on paper
towels on counter). 3.) BLOCKING:
a. Plate 250 µl/well EIA Buffer (Use the multi-channel, repeater pipette) – this is the blocking solution. Let the plates block for 30 minutes at room temperature.
b. Aspirate the wells using the plate washer (Push the up/+ button to select “P2” – the second program, then push “Start”)
c. If this is the last plate for the day, press “Rinse” on the washer, turn off power 4.) ADD BUFFER, SAMPLES AND STANDARDS:

34
a. Using the Repeater pipette, add 100 µl/well of cortisol-HRP conjugate in EIA Buffer at 1:6000 to each well except for the “Blanks”!
b. Add 100 µl EIA Buffer to each “Blank” well. c. Add 2.5 µl/well of Standard or Sample. d. Add 150µl/well EIA Buffer to the plate (Use the multi-channel, repeater pipette). Follow your plate template to make sure you’ve done this correctly!
5.) OVERNIGHT INCUBATION – Seal the plate tightly with Pressure Sensitive Film and incubate overnight at 25oC. DAY 2: 6.) Remove TMB Peroxidase substrate (KPL) from 4 oC 1.5 hours before use. Mix equal volumes of the two solutions – use plastic graduated cylinders and mix into a polypropylene beaker (DO NOT USE GLASS!) 7.) SET UP MICROPLATE READER: (VMax, Molecular Devices)
a. Open Windows; open Soft Max software (icon on desktop) b. Open the Cortisol EIA template file – this will have 3 “plates” already set for you
to use. Immediately SAVE to a new file for your particular experiment. c. Choose the appropriate plate for the Kinetic, Endpoint #1 and Endpoint #2 runs,
as listed below 8.) WASH THE PLATE 5X: Use 1X wash solution and Program 1 (“P1”) on the plate washer. Pound dry as before. 9.) ADD TMB REAGENT: 150µl/well (Use the multi-channel, repeater pipette). NOTE: This step should be accomplished as quickly as possible (~ 1 min.) to minimize across the plate differences. (We place controls on each side of every plate in order to monitor this, such as the "0" standard and a pooled plasma sample.) 10.) KINETIC RUN: Place the plate in the reader, choose the Kinetic plate and click on “Read”. Monitor the progression of the curves that appear on screen. The reaction time will vary with the freshness of the TMB used but should be ~10 minutes. The desired range is E0=0.6-0.9. The plate settings for this run should be:
• Mode: Kinetic 1 • Wavelength 1: 650 nm (NOTE: this wavelength allows for monitoring the
initial blue color development of the TMB) • Runtime: 10 minutes • Read interval: 10 seconds • Automix: ON
11.) ENDPOINT RUN #1: At the end of the kinetic run, choose the plate for Endpoint Run #1 and click “Read”. Reader settings:
• Mode: Endpoint 1 • Wavelength 1: 650 nm • Automix: ON
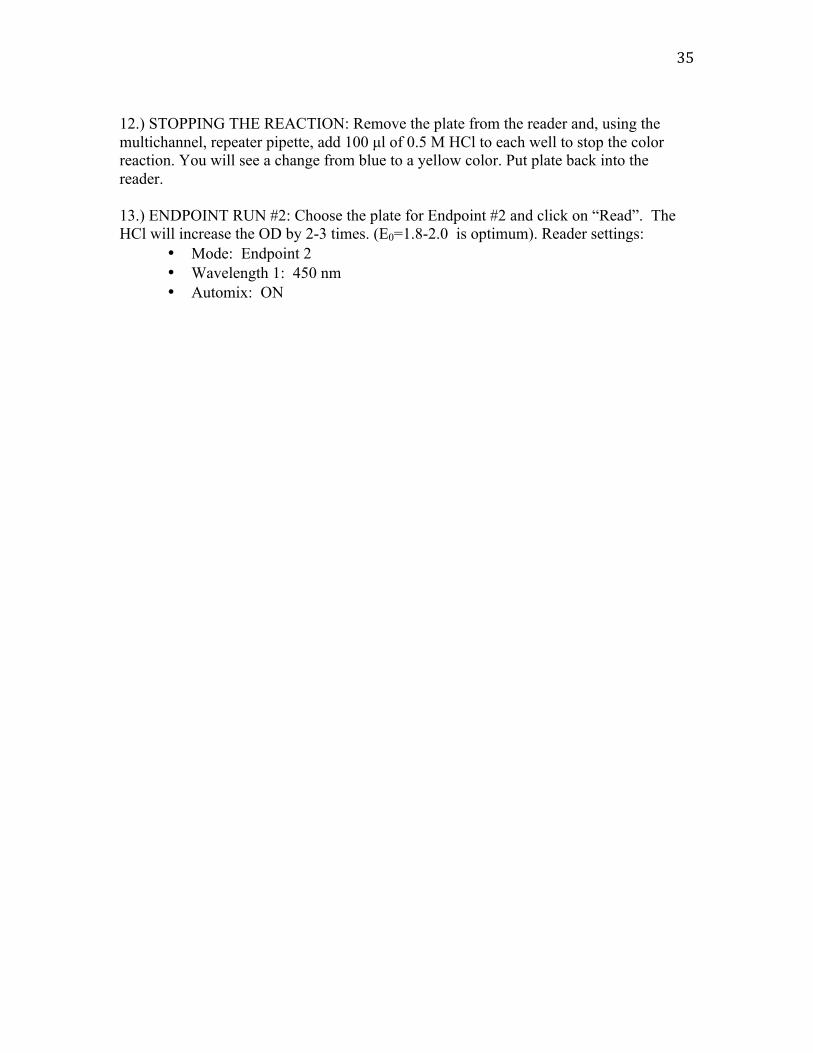
35
12.) STOPPING THE REACTION: Remove the plate from the reader and, using the multichannel, repeater pipette, add 100 µl of 0.5 M HCl to each well to stop the color reaction. You will see a change from blue to a yellow color. Put plate back into the reader. 13.) ENDPOINT RUN #2: Choose the plate for Endpoint #2 and click on “Read”. The HCl will increase the OD by 2-3 times. (E0=1.8-2.0 is optimum). Reader settings:
• Mode: Endpoint 2 • Wavelength 1: 450 nm • Automix: ON