Univ. of Worcester-Hankyong National Univ. Exchange Exhibition 2015
SUFURIC ACID (U42SO4)- THE POINT CHARGE NOOELCU) TEXAS=UNIV AT AUSTIN N A NCCORM[CK DEC 97 NM226-9S-G-2359UNLSIF IED UNF/C 7/2 M
IIm I -
111 - : Ill 2
... 8
1.81. 5 111 .4 1111 .
Pj LH~ H I
Lp'V. 1

4% % %4"~4 %4
4'°" 111', f LEAN AB INITIO STUDY OF THE CRYSTALLINE
STRUCTURE OF SULFURIC ACID (H2SO4)-
THE POINT CHARGE MODEL
to~DTIC
y JAN 1 9 1988
0 S DE%~
APPROVED:
9.
I
DRP§Ki77V
lz~ rpu.,lc reI4rcus. -,
%d % %%p

To my wife Laura and our first child
.5
.5
4
S.
S.
S.
ni-Ic
AI' J
a
~-, .,
I
,I/p - ~ ~SJ. ~ >4"

h
AN AB INITIO STUDY OF THE CRYSTALLINE
STRUCTURE OF SULFURIC ACID (H2SO4)-
THE POINT CHARGE MODEL
by
Mark Alan McCormick, B.S.
THESIS
Presented to the Faculty of the Graduate School of
The University of Texas at Austin
in Partial Fulfillment
of the Requirements
for the Degree of
Master of Arts
THE UNIVERSITY OF TEXAS ATAUSTIN
December 1987
4~
' 1 -. -. % .._ .- . % . . ,.- ' .- - ,-.- - . % - - .-.- %.%- - - . - - ..- - - - .. -.., % -, % %. , % - - -% ,-N

ACKNOWLDGEMENTSI must first thank the person that made it possible for me to attend the
University of Texas. Vickie Masters "Federal Expressed" me an application at the
last minute and helped speed its processing. Without her knowledge of the chaotic
bureaucracy of both the Navy and the University, I would probably be in Auburn,
Alabama typing this thesis.
Dr. Svein Saebo for his help in modifying the program TEXAS.
Dr. Robert Wyatt and Dr. Stephen Webber kindly agreed to sit as committee
members for this thesis.
Connie Kanetzky a wonderful friend who has given me a better
understanding of Texas and its traditions
Kerwin Dobbs another wonderful friend whose interesting discussions
have sparked new ideas.
Dr. James E. Boggs has given guidance, time, and shared his knowledge,
without which this paper would have been an impossible task. He has my sincere
-~ thanks for all of his help.
Dr. Raymond Davis and Vincent Lynch for their help in understanding the
world of crystallography.
Finally, I thank my wife, Laura, for all her support. Not only has she put
A" up with me through it all, she also endured proofreading my thesis. Although she
.4
told me that she did not understand some of it, her ability to spot and correct my
grammar, spelling, etc. (ad infinitum) was invaluable.
iv
%-1 br s wu p b % %
. A t
Dr.~~~~~~~ ~~~ *vi Saebe fo-, epi odfigteTXS
a
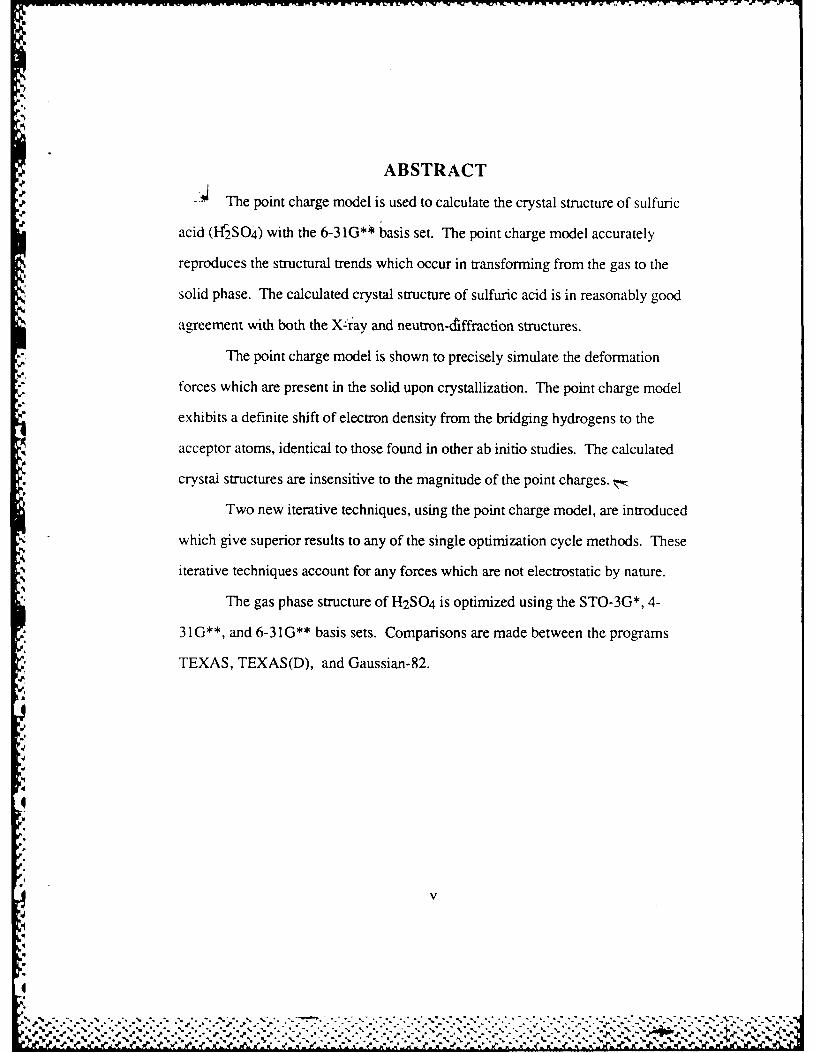
ABSTRACTS The point charge model is used to calculate the crystal structure of sulfuric
acid (HSO4) with the 6-31G* ;P basis set. The point charge model accurately
reproduces the structural trends which occur in transforming from the gas to the
solid phase. The calculated crystal structure of sulfuric acid is in reasonably good
agreement with both the X-tray and neutron-&ffraction structures.
The point charge model is shown to precisely simulate the deformation
forces which are present in the solid upon crystallization. The point charge model
exhibits a definite shift of electron density from the bridging hydrogens to the
acceptor atoms, identical to those found in other ab initio studies. The calculated
* crystal structures are insensitive to the magnitude of the point charges. ,
Two new iterative techniques, using the point charge model, are introduced
which give superior results to any of the single optimization cycle methods. These
iterative techniques account for any forces which are not electrostatic by nature.
The gas phase structure of H2SO4 is optimized using the STO-3G*, 4-
31G**, and 6-31G** basis sets. Comparisons are made between the programs
TEXAS, TEXAS(D), and Gaussian-82.
.4
Iv
%?%
I

TABLE OF CONTENTS
A-ckniowledgments ......................................iv
Abstract .................................................................... v
Table of Contents .......................................................... v,
AList of Tables...............................................................VII
List of Figures ............................................................ v.III
Chapter One .............................................................. I
Introduction........................................................
Chapter Two ................................................................ 6
Methods ............................................................. 6
Level of Theory and Basis Set Selection............................... 6
Method to Simulate Crystal-Field...................................11.I
Convergence Criteria ................................................ 23
Chapter Three ............................................................. 25
Sulfuric Acid....................................................... 25
Gas................................................................. 28
'aCrystal .............................................................. 36
Chapter Four.............................................................. 60
Conclusion.......................................................... 60
Suggestions for Future Work ....................................... 62
Bibliography ............................................................... 64
Vita........................................................................ 68
vi
%
-%p~-- - . . I ~ -.
1'4
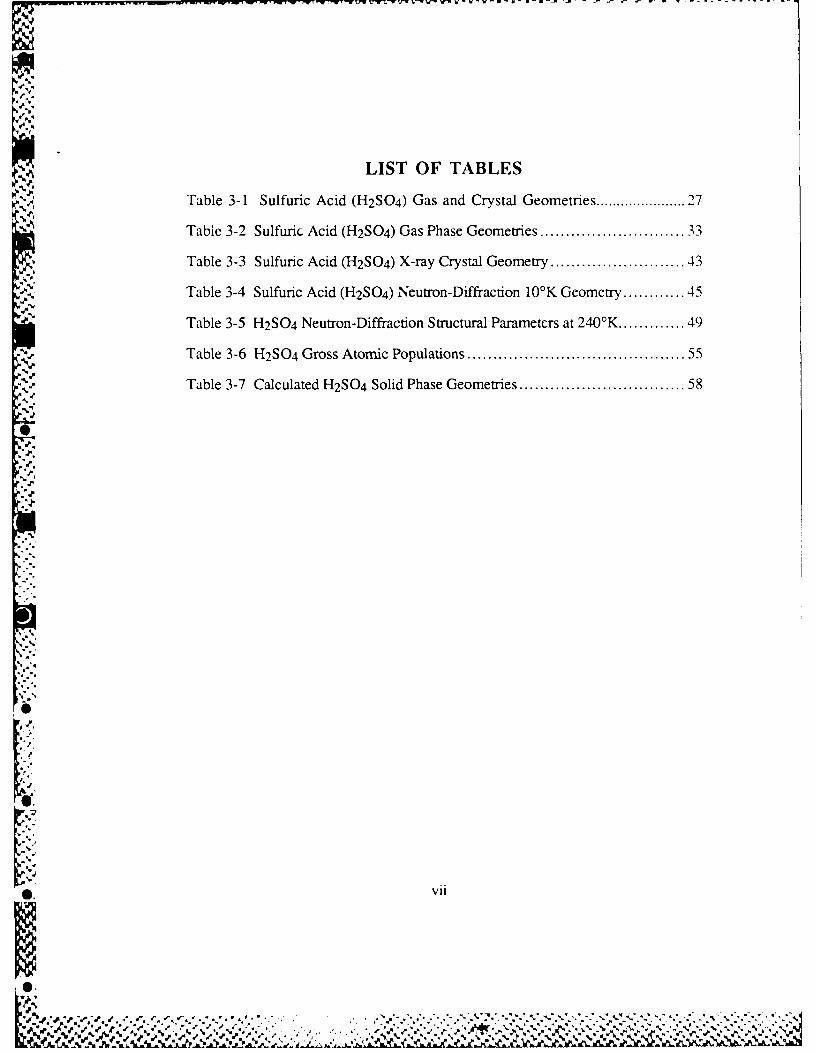
LIST OF TABLES
Table 3-1 Sulfuric Acid (H2SO 4 ) Gas and Crystal Geometries .................. 27
Table 3-2 Sulfuric Acid (H2SO 4) Gas Phase Geometries .......................... 33
Table 3-3 Sulfuric Acid (H2SO 4 ) X-ray Crystal Geometry ....................... 43
Table 3-4 Sulfuric Acid (H 2 SO 4 ) Neutron-Diffraction 10'K Geometry....... 45
Table 3-5 H2SO4 Neutron-Diffraction Structural Parametcrs at 240'K ............. 49
,, Table 3-6 H2S 4 Gross Atomic Populations ..................................... 55
Table 3-7 Calculated H2SO 4 Solid Phase Geometries .............................. 58N
'vii
L '
'p.
:SN I.
• i. "qd
Jx
LIST OF FIGURES
F ig ure 2 -1 .................................................................................... 8
Figure 3-1 Atom Numbering Scheme for Sulfuric Acid (H 2 SO 4 ) ................ 26
- Figure 3-2 H2 SO 4 p,p structure 0=0'=O ........................................... 31
, Figure 3-3 Total Electron Density Plot of H2 SO 4 in the 01-S-01 Plane .......... 53.4
0
r ii
,'%
r%%
*' viii

-S
CHAPTER ONE
INTRODUCTION
Over the years, many researchers have shown the ability to apply quantum
theory to chemistry in order to supplement experimental results. However, it has
only been in the past decade with the great advances in computers coupled with the
development of efficient algorithms that ab initio calculations have become practical
on molecules of more than a few atoms.
The term "ab initio" is frequently cited in the literature but rarely defined.
Ab initio calculations can basically be thought of as those which treat all the
electrons and do not utilize parameters which are fit to experimental data as
compared to semi-empirical calculations. For example, a Hartree-Fock calculation
of a restricted closed-shell single determinant wave function is one in which no
approximation is made to the integrals or the electronic Hamiltonian. However, it
is completely specified by the choice of a basis set and the coordinates of the
nuclei.1
One area in which ab initio calculations have been particularly successful is
in evaluation of molecular structure. The theoretical determination of a molecular
structure involves minimizing the total energy of the molecule with respect to
I simultaneous variation of the internal coordinates. 2 The application of this
procedure to complex molecules became practical only after the introduction of the
gradient method by Pulay. This method greatly reduced the time to calculate an
'F;. optimum geometry especially for large molecules. 3 The resulting optimized
structure has a known basis set dependance which results in a constant error for a
.,. 1
r!
,I
.. .,",, ;€ ",'-".",", '. r .^' " .'.'r""- "" "., "." F F," . ' "" " ".' . .- .'' . -".. '' "-"- .'" .' """""".
given parameter called the offset value. This offset value is reasonably constant
over a wide range of molecules. 4 Boggs and coworkers have reported extremely
accurate structures by combining experimental and theoretical data. The structures
presented in their study are more accurate than either theoretical or experimental
techniques could produce alone. 5 Not only have ab initio calculations been able to
accurately reproduce experimental bond lengths, bond angles, and conformations
but in some cases ab initio calculations have actually shown where experiments
have determined incorrect structural parameters. Although the latter is the
"' ~*exception, it shows both the value and validity of ab initio calculations as a
supplement to experimental data.
The ability to determine accurate molecular structures is the key to many
areas of chemistry. The structure of a molecule not only defines its physical
properties but also influences how it reacts with other molecules. This information
'-.-. is vital to such diverse areas as the development of "stable", powerful explosives
and propellants, the synthesis of effective catalysts, the understanding of how
enzymes with only specific structures can fit into certain substrates, the
determination of complex reaction mechanisms, and the production of
superconductors. However, to a chemist, the most fundamental concern which
- structural information can shed light on is chemical bonding. 6 The understanding
of chemical bonding is fundamental to all areas of science.
One area in which there is a great deal of interest is the structural differences
which occur in some molecules. These differences can be between the same type
of bond (eg, C-H) or functional group (eg, ClH3) over a variety of similar
0 ... compounds with different substituents. These changes can also occur within the
%. . .C. .C .4 .. . . J . . . .I . .
0% %

same molecule when it is in a different phase or chemical environment (eg, in
solution). These structural differences need not be large to be important. In fact,
they can be very small. Differences on the order of 0.01 A in a bond length or a
couple of degrees in a bond angle may reveal extremely valuable structural
information if they are reliably determined. However, only real structural
differences should be considered and any apparent differences which are detected
must be eliminated if meaningful comparisons are to be made. 7 Apparent
differences can arise from either the particular interaction of radiation with matter or
because of the vibrational averaging which occurs in a particular experiment. It is
important to note that all experimental techniques produce geometrical parameters
which are based on averaging of the molecular vibrations. However, at Last
theoretically, ab initio calculations give equilibrium intermolecular distances which
correspond to the minimum of the potential energy surface and are not subject to
molecular vibrations.
The vast majority of all ab initio calculations are performed on isolated
gas" phase molecules. The reason for this is quite simple - computer capacity.
The most accurate results come from ab initio calculations performed with large
basis sets. However, current computer capacity limits large basis set calculations tO
no more than about two dozen atoms. This limit of two dozen atoms with a fairly
large basis set is pushing the capacity of even the Cray supercomputer. Thus, in
order to conduct conventional ab initio calculations on solids, the size of the basis
set would have to be greatly reduced, a lower level of theory must be used, or
.p assumptions must be made about the symmetry of the molecule. These restrictions
almost always result in less accurate molecular parameters.
I%
. . ."/"
I. ,', , ","- . ",", "," " . . . . . .- " . . o"- . . "-"- . -". - "-'- . ." "". > ." . . . .. . -"- . > ' "
6]
"- -"' - " -- " " "-%-" " " "-"-"-'- " ""-"-"/' ' " ""v """." " " ' " """"" -""" '"" "-A"" """ """ '' -"-'"".

The intent of my work was to study the structural changes which occur in a
molecule between the gas and solid phase through the use of ab initio calculations.
In selecting a particular molecule to study, I established several criteria. First, thle
number of atoms in the molecule must be small enough that a large basis set could
be used to give accurate results but be within the capacity of the Cray
supercomputer. All of the calculations in this study were performed on the Cray X-
MNP/24 at the University of Texas Center for Highl Performance Computin g
"p-.
(UTCHPC). Second, there must be an accurate experimental detern..nto of the
gas and solid phase structure so that comparisons could be made with the
* calculations. Finally, if possible the molecule should be one which is of general
interest. After careful consideration, sulfuric acid (H-,S0 4 ) was selected as thle
molecule to study which met all of the above criteria.
In order to reduce the calculation of solids to one that can be handled by
present computers, a simpler method must be used in order to simulate the effects
of the crystal lattice. The problem is basically how to accurately represent the
molecular-charge distribution of the surrounding molecules in the solid. The
i. simplest is to use the Mulliken population analysis. 8 The Mulliken population
analysis comes from parameters that are already calculated in quantum mechanical
_.
calculations. The major problem with this method is that the assignment of charges
to the atoms is rather arbitrary and is often very basis set dependent. 8 Howvever, a
previous study done using the Mulliken population analysis and point charges wkas
S able to accurately reproduce the crystal structure of cyanoformamide
(NCCONH2). 9 The purpose of my study was to apply the point charge method to
a different type of molecule and to develop some new techniques in order to sce
.1
M.A.k. A .2A APP suecmu. All f theJ caclain i hi tdywr performed.&,J~A& on te a y,. .". P/24 a th Unversty f TxasCener or Hgh erfrmace omptin• -,-%,".-,.,~~~~~ ~ (UC%) eod hr utb nacraeeprmna eenlaino h
their effect. The theoretical methods used in this study are presented in Chapter 2.
Chapter 2 includes not only the basis set and level of theory considerations but also
a review of the various methods which have been used to simulate crystal field
effects. Chapter 3 contains the sulfuric acid results including the optimized gas
phase geometry and the various techniques used to calculate the solid geornetr.-Z
-, Chapter 4 presents my conclusions and suggestions for future studies.
%
A"
4"
- .°. . .. . . . . . . . . . . . ..,'~'-:. *. . . . . .
). . . . .. . . . . . . . . . . . . . . ....
-- - - *,
. - , . - * S- - -- .
CHAPTER TWO
METHODS
In any ab initio calculation, the selection of the basis set and the level of
theory are crucial. A decision must be made between the computational cost and
the desired accuracy. Obviously, the most accurate results are desired from any
calculation. However, a structure accurate to 0.01 A at one-hundredth the cost of
one which is accurate to 0.001 A maybe preferred if the first structure demonstrates
"S the effects which are being studied. Although, this is a hypothetical example, it
points out the importance of extremely careful selection of the basis set and level of
r. "theory. In my particular study, the selection of a method to simulate the crystal-
field effects is also a major factor. Again, selection involves a compromise. In this
case, a compromise must be made between computational cost, accuracy, and ease
of ;mplementation. In this chapter, I will discuss the various methods used in this
study. The level of theory and basis set are discussed first, followed by the crystal-
field simulation method. Finally, I will discuss the convergence criteria used in this
study.
LEVEL OF THEORY AND BASIS SET SELECTION
The ultimate goal of quantum chemistry is the calculation of the solution to
0the Schr6dinger equation resulting in an exact molecular wave function. However,
that requires an infinitely large basis set expansion of the wave function along with
the implementation of full configuration interaction. This is clearly an unattainable
goal. In actuality, the basis set is truncated to a finite size and the electron
correlation, if treated at all, is limited to a few configurations. These specifications
6
",%
'%S%'p.-
•$ S"

'N.
-7
define a theoretical model within which all structures, energies, and other physical
properties can be studied. 10 While proper selection of the model is important,
recognizing and understanding the limitations of the given model on the results is
imperative.
The main sources of error in any geometry optimization using the gradient
method are neglect of electron correlation ( where it is either ignored or
incompletely treated) and the use of a finite basis set. The combined effect of these
errors on the results obtained from a computed molecular structure are shown in
Figure 2-1. The figure depicts the error in some arbitrary structural parameter
(such as a C-H bond) in a variety of molecular environments plotted against
-- increasing basis set size. When an infinite basis set is used (the Hartree-Fock
limit), the error due to the neglect of electron correlation is found to be remarkably
constant for the given parameter over a wide range of molecules. For much smaller
basis sets, the error is expected to fall within the shaded area. However, at some
point (X), the basis set is sufficiently large that the scatter in the calculated
parameter is extremely small. This results in a constant known error for the given
parameter called the offset value. The remaining absolute error is due to the
truncation of the basis set and the neglect of electron correlation. Thus, the major
flaw with small basis sets is the inconsistency of the error. 4
In order to keep the computational costs low for large molecules, the
calculation should be performed as close as possible to the point X. Any increase
in the basis set results in an increase in computation time and disk storage space
proportional to the fourth power of the number of basis functions (N4). Beyond
point X, the wave function approaches the Hartree-Fock limit where only electron!%
_
r - r w " A 4 -
%
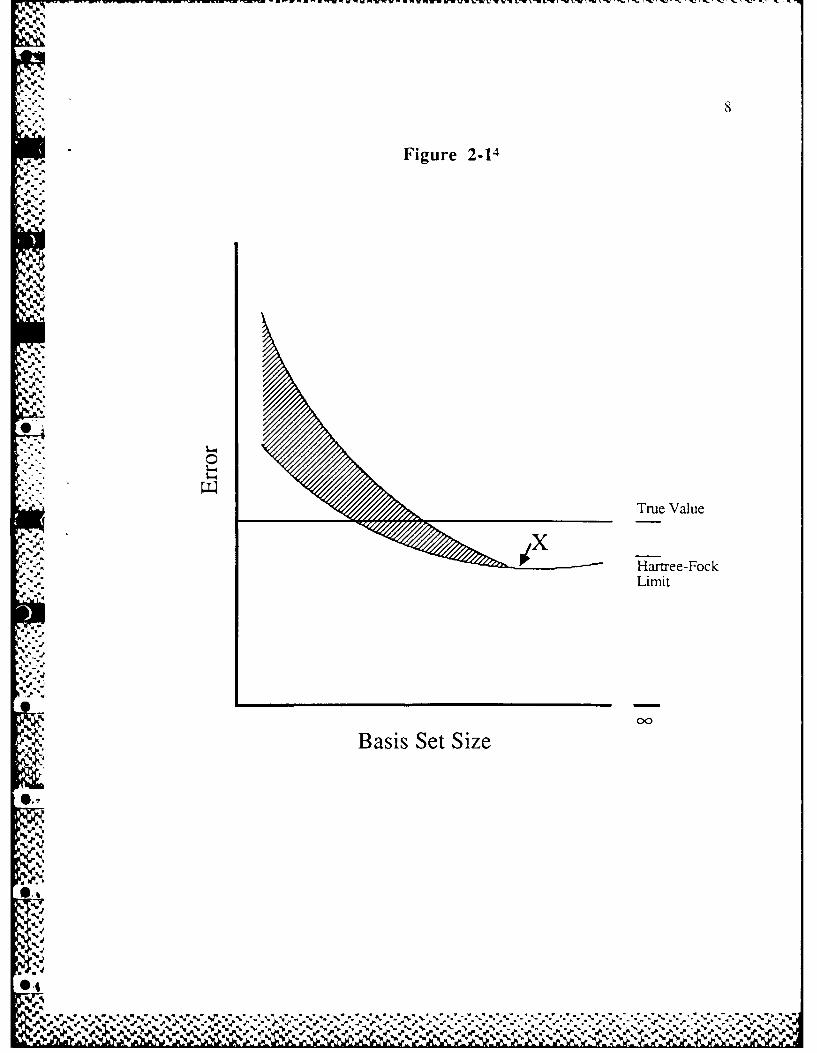
Figure 2-14
. .
,2,t2,True Value
00
'.'-, --- Hartree-Fock,.', Limit
"-. -'--
" ; Basis Set Size
0._
"'S . . . . ¢ ,",--".',. ." "-"-"-,.'-"-"-'."-"."-". . ._. . .- ' ',,.-..-,....,..-'-'-, '.'-',.....', ., ,

9
correlation error remains. The incorporation of any high-level electron correlation
treatments results in a large increase in computation time and disk storage roughly
proportional to n6 where n is the number of electrons in the molecule. 1 Even the
most efficient correlation methods, such as the local correlation method 12 , are two
to three times more expensive than a single determinant calculation. Therefore,
depending upon the size of the molecule and the number of basis functions, the
treatment of electron correlation may be prohibitively expensive for a given
molecule.
Based on the above observation, calculations can be done efficiently at point
X. For many structural parameters, point X corresponds to approximately double
zeta basis sets. However, for some parameters such as torsional angles around
nitrogen or oxygen, it is essential to add at least one set of polarization functions to
-, the basis to reach that point. The offset value for most bond angles is zero using
this basis set. However, bond distances have non-zero offset values at this level
and for some types of bonds the basis set must go beyond double zeta. 13 A
common misconception is that the addition of d orbitals (polarization functions) to
first and second row elements is incorrect since d orbitals in these elements are not
actually occupied. The addition of polarization functions is only done to allow
greater flexibility in the description of the bonds. Their addition does not imply that
d orbitals are actually involved in the formation of these bonds.
Because of the size of the H2SO 4 molecule, the treatment of electronS,.
correlation is prohibitively expensive. Unless stated otherwise, the calculations in
my study were completed at the single determinant level using the gradient program
TEXAS14 with no symmetry restrictions. During the course of my study, Pulay's
% %J
%, %4. *~
group completed a new version of TEXAS which was used for a few additionalcalculations. The major improvements are increased speed and the ability to use
true Gaussian d functions. After some optimization of the program by Cordell for
-the Cray, I have seen up to a 30% increase in speed over the old version of
TEXAS. The inclusion of true d functions has replaced the use of displaced p
functions which were used to construct d functions in the previous version of
TEXAS. Throughout this paper, the new version of TEXAS will be referred to as
TEXAS(D).
As stated earlier, one of the most important parts of any ab initio calculation
is the selection of a basis set. The literature is inundated with almost 100 basis
sets 15 which range from the minimal STO-3G basis set to very extensive triple zeta
plus multiple polarization function basis sets. Thus, the selection of a basis set for
a particular problem must be made based on the ab initio program used, the
accuracy required, and how much computation time is available. The TEXAS
program efficiently uses split valence shell basis sets where the s and p Gaussian
exponents are equal. Pople's 6-31G** basis sets are used almost exclusively
throughout this study.16 ,17,18 ,19 ,20 Some calculations, which will be specifically
mentioned, were completed using a 4-31G** basis set on sulfur 2 1 with a 6-31G**
basis set on oxygen and hydrogen (referred to throughout the remainder of this
paper as 4-31G**). The asterisks in the notation for the basis sets refer to the
inclusion of polarization functions. The first asterisk refers to the addition of d0.
functions to the heavy atoms sulfur (exponent=0.65) 17 and oxygen
(exponentO---.8) 22. The second asterisk refers to the addition of p functions to
hydrogen (exponent=1. 1)22 . As discussed earlier, the inclusion of polarization
e.2 -- 2 - -% -. .. 5*-®
functions is essential to accurately obtain torsional angles around oxygen. Another
basis set which was used to study the sulfuric acid dimer was Pople's STO-.3G*. 23
That basis set consists of the minimal STO-3G basis with the addition of five d
functions only to second row atoms.
METHOD TO SIMULATE CRYSTAL-FIELD
Numerous studies have been made in order to apply ab initio calculations to
.4 solids. One reason is the advantages which ab initio calculations offer over some
experimental methods. While X-ray and neutron diffraction provide valuable
information about the spatial arrangement of the atoms in molecules and the packing
Nof the molecules in lattices, they tell us nothing of the forces which determine the.%
crystal structure. In addition, they give no information on why the molecules pack
in the observed space group or the influence of crystal forces on the conformation
5.4. of flexible molecules. 24 In some cases the experimental methods cannot "locate"
particular parts of a molecule, especially hydrogens. In the case of sulfuric acid,*1
°
three X-ray diffraction studies, with the latest being done in 1978, could not
"locate" the hydrogens. It was not until a neutron diffraction study was done in
- 1983 that the hydrogens were located. Another problem with the experimental data
is the vibrational averaging which is inherent to all experimental methods. It is
Iy these questions and others to which ab initio calculations can be directly applied.
One area in which theoretical methods have been frequently applied is the
study of hydrogen-bonding. "I he ab initio methods which have been used rangeS•.
from the complex use of an atom-centered multipole expansion 25 to the simple'I-
point charge model.9 It was not until the study by Saeb0, et al. that the influence of
crystal forces on the intramolecular geometry was studied in detail. Saebo reported
.14.%
%0
%"--212
impressive agreement between X-ray diffraction and calculated structural
parameters by using point charges based on a Mulliken population analysis.
Regardless of the methods which have been used, the importance of the
electrostatic interaction energy in determining the energetically most favorable
geometry is well established.8,9, 24 ,26,27 In fact, it led Bonaccorsi, et al. 28 to the
'. electrostatic assumption". Bonaccorsi and coworkers postulated that the minima
in the total interaction energy coincide with those in the electrostatic energy for
'p rotational degrees of freedom. 28 Thus, it is clear that approximating the
electrostatic energy via a model can reveal valuable molecular structure information
if the model is sufficiently detailed.
One study which specifically considered crystal-field effects was the
calculation of the rotational conformation of acetamide. 29 In that case, the crystal
structure had shown that the torsion angle was between 00 and 300. However,
several attempts by other authors to compute the lattice energies and total
crystallographic conformational energies (lattice+torsional) could not account for
that torsional angle. A procedure was developed to compute the lattice energy as
the sum of three long-range contributions (electrostatic, polarization, and
dispersion) and a short-range repulsive contribution. That procedure yielded a
minimum lattice energy with a torsional angle between 00 and 300 as observed in the
crystal structure. 29 Similarly, through the use of calculated electrostatic molecular
potentials, researchers were able to compute the preferred arrangement of linear
chains of formamide molecules as observed in the crystal. 30
The combination of experimental and theoretical methods has been used in. o-.. several studies. One study of hydrogen bonding, crystal packing, and the effect of
Sj

crystal forces on the molecular conformation of amides and carboxvlic acids
expounded upon the "marriage" of X-ray diffraction and ab initio calculations.2 4
The goal of that study was to obtain a general force field for organic and biological
molecules. In that study, the lattice energy was calculated as a sum of the Lennard-
Jones potential and the Coulombic interaction. The researchers were able to use
their procedure to explain the crystal-packing mode of formic and acetic acid. Their
study clearly showed that the electrostatic interactions were the overriding factor in
determining the particular packing occurring. 24 In another "marriage',
experimental electron densities were combined with calculations in order to study
the role of Coulomb forces in the crystal packing of amides. In this case, the
researchers were able to use the Coulomb interaction energies in order to determine
the possible and preferred molecular packing modes. In addition, they were able to
obtain reliable estimates of the van der Waals atom-atom potential parameters using
the calculated Coulomb energies. 27
In one investigation, the electrostatic energy in the formic acid crystal was
studied. 26 The geometry of formic acid was not optimized; instead the researchers
used the experimental gas and crystal geometries to conduct their study. In their
study, two approaches were pursued - multipole and point charge lattice sums. In
the multipole method, the electrostatic energy is expanded in a series to yield the
various multipole moments. That particular study used multipole moments up to
the sixth moment. The electrostatic energy then becomes a sum of the interaction
energy between the polar multipole moments. In the point charge method, the
charge distribution is represented by a set of point charges which were obtained
from a Mulliken population analysis. The electrostatic energy simply reduces to the
.1.
.,1P0
%6

K~'4
sum of the interaction energy between the point charges. Several important
conclusions were made from the results. First, the electrostatic portion of the lattice
energy of formic acid was both large in magnitude and varied strongly with the
orientation of the molecule. Several orientations, including the one observed
experimentally, were found to minimize the electrostatic energy. The location of
these minima were dictated by interactions with nearest-neighbor molecules.
Second, the point charge method agreed qualitatively with the multipole series for
the dependence of the electrostatic energy on the molecular orientation. Finally and
most importantly, the electrostatic component of the lattice energy was found to act
as the driving force for molecular distortion upon crystallization. 26
The conclusion which can be drawn from all of the above studies is that
theoretical calculations can give extremely valuable information about a wide variety
of crystal parameters. However, it is now time to specifically address the crystal
parameter which is of interest in my study - molecular structure. A straightforvard
approach which has been applied to the calculation of molecular structure is to
compute it directly in the solid. This involves selecting a model of an extended
"supermolecule" that is sufficiently large to represent the condition existing inside
the crystal. That same method has been previously used to study such phenomenaS
as the adsorption of a gas on a surface, where the solid is represented by a small
number of atoms. One way of implementing this method is to consider all the
molecules within a unit cell as the "supermolecule" and then impose boundarvO.
conditions to correct for effects at the cell edge. However, as the size of the
molecular system increases, the accuracy of the computed results suffers. As a
result, the "supermolecule" method has not been conducive to highly accurateS.
N.
FA~'.. p .d d ,* . ~*' ** ~ U

-~ 15
results for molecules of appreciable size.4 A recent study using that method has
been completed by Cordell and Boggs on furan molecules. 31 The calculations were
done on furan dimers and trimers located in the spatial orientation found in the
crystal. Their study was able to show which neighbor molecules stabilized the
crystal structure and to what extent. The interaction energies of the various subsets
/ ,.of the unit cell were shown to be essentially additive, with the packing forces
expected to decrease the calculated crystal stabilization by 5 to 10%. In addition,
they concluded that the short C=C bond length reported for the crystal was an
artifact of the X-ray diffraction experiment. 3 1 However, as stated earlier, the
supermolecule" technique is only useful for relatively small molecules. There is
- also an appreciable cost associated with it which increases as N4. Thus, large basis
set and/or large molecule calculations using the "supermolecule" concept are very
expensive.
Based on the previous discussion, there are major problems which afflict
many of the methods which have been used to simulate crystal-field effects. All of
the above methods suffer from one or more of the following problems: high
computational cost, low accuracy, or difficulty in implementation. Recently, a
method has been proposed by Saebo, et al. to calculate crystal structures which
seems to overcome these problems. Their study consisted of investigating the
geometry changes which occur in cyanoformamide in going from the gaseous to the
solid states, with emphasis on the effect of the crystal forces on the intramolecular
geometry. Their approach consisted of using a simple point charge model to
simulate the crystal-field effects. First, the geometry of the free molecule was
optimized and a wave function obtained. Next, a Mulliken population analysis was
"
" %

* ,. .'%
run to generate the magnitude of the point charges. The point char-es were then
placed around the free molecule in the spatial arrangement which corresponded to
the previously determined X-ray diffraction structure. Since the hydrogens were
not located in the X-ray diffraction experiment, the N-H1 bond distances were set to
1.0 A. Finally, the geometry of the free molecule was optimized inside of the point
charges. The resulting optimized structure yielded bond lengths and bond angles
l.,.- with a maximum deviation of 0.011 A and 0.4', respectively, compared to the X-
ray diffraction structure. The major advantages of their method were not only the
% accurate results and the ease of implementation but also the very slight increase in
computation time compared to the free molecule. The small increase in computation
time was only due to the increase in the number of one-electron integrals and
nuclear repulsion terms. 9 Thus, their method appears to possess all the advantages
of the previously discussed methods with none of the disadvantages.
',- There are a few problems with the point charge model which need to be
considered. The model assumes that the crystal-field effects can be simulated
through purely electrostatic interactions. However, these are not the only forces
-'SR which bind molecules together in solids. In order to fully understand the types of
forces which bind crystals together, the various crystals which exist must beAl reviewed. There are basically four types of crystals -ionic, covalent, metallic. and
molecular. Metals represent a special class of solids and will not be discussed
further. In ionic crystals, the atoms are bound together by largely electrostaticS..
forces and there is no such thing as an individual molecule. Covalent solids are
actually one huge molecule which is composed of covalently bonded atoms. The
atoms are held together by sharing electrons with their neighbors. On the otherO.
04
. .. ..0.%
. .W%S'S'S*S 55 "- . .r----'

,= .',
"-' *hand, molecular crystals actually contain a cclection of distinguishable molecules
which are bound together. The molecules are held together mostly by dipole
interactions, van der Waals' forces and hydrogen bonds. In reality, very few
crystals fall strictly into one of these categories. Instead, many crystals are held
together by more than one of these forces. Not only are there numerous examples
of crystals composed of both ionic and covalent bonds but even molecular crystals
may contain a small amount of ionic or covalent bonding. 32 But, all of these forces
share a common denominator - they all depend upon charged particle interactions.
e.. In summary, the forces which bind crystals together are very complex and in0
. certain cases may not be fully described by only electrostatic interactions.
The foremost problem with the point charge model used by Saebo and
€' coworkers is that it does not specifically allow for intermolecular electron transfer.
The neglect of electron transfer in their method could certainly degrade the accuracy
of calculated crystal structures in which covalent bonding is a major force.
However, since few covalent crystals exist, their method should give satisfactory
results for a wide variety of other crystals. In fact, the study by Saebo indicated
that hydrogen bonding was dominated by electrostatic effects. While the neglect of
electron transfer must not be forgotten when interpreting results using this method,
the point charge method should produce reasonable results when applied to a large
variety of crystals, especially molecular crystals involving hydrogen bonding.
There still remain a couple of problems with the Mulliken population
- -analysis which need to be considered. First, it tends to produce charges which are
rather arbitrary and basis set dependent. Any defects in the point charge model are
dominated by possible errors in the magnitude of the point charges. 9 Second, sinceO.
,-- .
r.r,. r -. - r rw w rw w w . n w .'r S '. . t, _ _ SW <V .T - - . r F . -' - . -, .- ,"" I' . . . ' "' ' ' .'" ,-
it is based on a simplified model of describing the electron distribution, the
Mulliken population analysis often yields multipole moments which are quite
different than those calculated from the actual wave function. 8 Although, there are
other standard population analysis methods such as that of lAUwdin, they suffer
from the same disadvantages.1
In order to obtain more accurate charges, a different method has been
recently proposed. 8 In that method, the molecular electrostatic potential evaluated
at points in space around the molecule is used as a guide and is then fit to the point
charge models. The procedure provides for selected restraints on the calculated
dipole or quadrupole moments, and for the use of additional point charges to
represent lone pairs in the molecule. That study found very good agreement with
experimental enthalpies of formation for hydrogen bonding on nucleic acid pairs.
Based on the above results, the researchers found their method superior to the
Mulliken population analysis. Even given a set of point charges which accurately
reproduce the molecular electrostatic potentials, it is not a trivial task to determine a
set of nonbonded parameters that can be used with the charges to give good
-" geometries. 8 This method also tends to assign larger absolute values of charge to
%. . the atoms compared to the Mulliken population analysis. However, ease of
implementation was the overriding factor in choosing between these two methods.
While their method may produce a more accurate point charge model than the
Mulliken method, it is by no means a trivial task to implement their method. The
V. method which provides the best compromise based on the selection criteria is the
point charge model using the Mulliken population analysis.
I Both versions of TEXAS have been modified to accommodate the point
-A%
'N~~~~ ~~ % %- - / " " ' ' ' """""""" ' """""" ' " " " ' "" ' ' '"""""" "" '" "" " ' " """ ""

19
charge model. The programs require that the point charges be input in Cartesian
coordinates with their associated net charge. The energy which is calculated
excludes the point charge-point charge interactions but includes the point charge-
molecule interactions. Therefore, the calculated energy accurately shows the
stabilization of the crystal when compared to the free molecule energy.
The major reason that the Mulliken population analysis is easy to implement
is because the required parameters are already calculated in any standard SCF
program. The only required parameters are the atomic number, the density matrix
(P), and the overlap matrix (S). The number of electrons that are associated withO
any basis function is simply the diagonal element of the product of the density and
overlap matrices which corresponds to that basis function. The corresponding
number of electrons that are associated with a given atom in a molecule is obtained
by summing over all basis functions on that atom. This assumes that all the basis
functions are centered on atomic nuclei. The net charge of any atom (point charge
magnitude) is simply the difference between the charge of the atomic nucleus and
the number of electrons associated with that atom. The net charge is positive if the
number of electrons associated with the atom is less than the nuclear charge and
negative otherwise. Although this method is simple, it must be remembered thatO
there is no unique definition of the number of electrons that are associated with a
.r. given atom or nucleus in a molecule. In the case of CH4 , the Mulliken population
analysis results in a net charge on hydrogen which is double that given by the
Lbwdin method at the STO-3G level ( 0.06 and 0.03, respectively ). The basis set
used also has a profound effect on the net charge which results. A Mullikenpopulation analysis on CH4 gives hydrogen a net charge of 0.06 at the STO-3G
O.
.
.- , . .. . . , ,S, . . , ., .. , , . .- . . .. ., . ,.. ., . .- ... ... .. .... . . .. .,. .• . .. .+ .

INrrr -1,w-r -N-ur. X- - A V N Y- -1- ''i-d-6-a-_
'Sb.
20
level but 0.12 at the 6-31G** level. 1 Despite its drawbacks, the Mulliken
population analysis is readily obtained and has been shown to give exceptional
results.
As discussed previously, the method employed by Saeb0, et al. was simply
to optimize the free molecule surrounded by the point charges. They chose to place
the point charges in positions as determined by X-ray diffraction and to assign them
net charges based on a Mulliken population analysis of the optimized free molecule.
Despite their convincing results, they suggested two improvements within the
frame of their model. The first was to introduce the new net charges calculated for
the free molecule in the surrounding point charges. Secondly, they recommended
-! increasing the size of the basis set.9 These questions and several others are the
focus of my study.
Based upon the suggestions of Saeb0 and coworkers, the expansion of the
basis set by inclusion of polarization functions is a logical extension of their work.
The increased flexibility offered by the polarization functions is an improvement in
the basis set over that used in their study. Also, the idea of introducing the new
point charge values calculated from the free molecule suggests an iterative approach
to me. Although Saebo and coworkers envisioned only one additional optimization
cycle, I felt that multiple optimization cycles would allow more flexibility in the
model by allowing it to dynamically change. The iterative technique was applied in
my study by optimizing the free molecule inside the point charges based on both X-
ray and neutron diffraction structures. Then the net charges were recalculated by
running a Mulliken population analysis on the new "free" molecule geometry. The
new net charges were assigned to the experimental point charge locations and the
V."WI
11pj

21
cycle was repeated until the free molecule converged in both structure and energy.
This should eliminate some of the error associated with the Mulliken population
analysis.
"- One problem with the Saebo method is that it requires a detailed
experimental structure of the solid. While X-ray diffraction structures are available
for a wide range of compounds, they quite often are unable to locate the hydrogens
which was the case for both cyanoformamide and sulfuric acid. Then, in order to
implement their method, the positions of the hydrogens must be assumed which
certainly could have profound effects on the results. In addition, experimental
results are prone to mistakes just like any other method. For sulfuric acid, the early
X-ray diffraction results determined the symmetry to be C2V instead of the actual
C2. Therefore, it would be helpful to have a method which was not quite so
dependent on the experimental results.
One solution is to position the point charges based upon the free molecule
instead of the experimental structures. The coordinates of the free molecule can
easily be converted from Cartesian to fractional coordinates and then used to
generate the point charges. That requires only the cell dimensions and the space
group of the crystal and it preserves the internal geometry of the free molecule.
* These parameters can be determined from experiment, assumed from similar
crystals, or simply guessed. This would permit calculations on molecules for
which there are no experimental results or for which incomplete crystal structures
exist. However, the major advantage of my method would be for calculations on
molecules where the electron density is shifted away from the nuclear center and for
which only X-ray diffraction crystal structures exist. One of the disadvantages of4.
..
'" 7 "* "* ", " " , . . z -" * * , :- . -. -" -' -. ,- ,' -" .' -. ' -.. _. .- ', ,. ''. .' - . '.,,: . " -w " " .""- --"- "" " "

X-ray crystallography is the fact that it gives bond lengths which are not ver,
- accurate. That is due to the manner in which X-rays interact with matter. The
*' ' , interatomic distances determined by X-ray diffraction represent the distance
between centers of electron density and not nuclei. In molecules of this type, X-ray
diffraction can give results for bond lengths which greatly differ from the true bond
lengths. 7 The error in bond length could cause profound effects on the structure
calculated in the point charge model. The technique of basing the point charges on
the free molecule has been applied in my study using both the X-ray and neutron
-- diffraction data. In these calculations, the only experimental information that was
used were the cell dimensions and the space group. The calculations were repeated
in an iterative manner until the "free" molecule converged in both structure and
energy. By basing the point charges on the "free" molecules, any errors caused by
inaccurate X-ray bond lengths should be eliminated.
Since the value of net charge determined by the Mulliken population
analysis seems to be somewhat arbitrary, the structural results should have a
dependence on the charges that are generated. However, it is not knowa whether
this is a significant factor affecting the calculated structure. The dependence on the
magnitude of the charges was approached in two manners. First, a Mulliken
population analysis was run on both the experimental X-ray and neutron diffraction
structures. That required a single point SCF calculation be done at the experimental
geometry in order to generate a wave function. The resulting point charges variedS
by as much as 15% from those calculated for the optimized free molecule. Second,
the value of the point charges was normalized to one of the previously calculated
charges. This preserved the neutrality of the molecule and resulted in charges for
S.,
."2
.. IN. ' . .
N-- " "-%' " " , , . ".. ". .". . - ' '.% %- % , -. , .,. .-. .,, , , - . .

w4.
the atoms about double those for the free molecule. The new charges were than
used to compute geometries which were compared to those calculated using the
charges based on the free molecule.
Although the increased computation time required by the addition of point
charges is small, on the order of 500-700 seconds per run, it would still be
beneficial to limit the point charges to as few as possible. The increased
computation time becomes a significant factor for the iterative methods which
require up to 30 runs. In the Saeb0 study, the closest neighbor molecules were
included. But there are obviously pieces of these molecules which are far er, iugh
away from the free molecule such that their electrostatic interaction is essentially
* .- zero. Hence, if they were not included, the computation time could be further
reduced. In order to investigate the effect on the computed structure, calculations
were made where only atoms within a given sphere from the center were included.
Because of the requirement to maintain a neutral charge, a dummy charge was
generated to make the sum of the point charges zero and it was placed in excess of
150 A from the free molecule.
CONVERGENCE CRITERIA
The point charge calculations require a different type of convergence criteria
than normal calculations on isolated molecules. This is due to the residual
Cartesian forces which result from the presence of the point charges. In the point
charge calculations, the optimized geometry occurs when the internal forces are
small but the Cartesian forces may still be quite large.
An isolated molecule geometry is considered optimized when the following
conditions are met: 33
,,.'. %.%%*0W0 J! W%. *M.. .. 4-. '4* ' . U ~* .
00, jL~'i 'A L

24
1. All Cartesian forces are less than 0.005 mdyne/angstrom.
2. Stretching and bending internal coordinate forces are less than
0.005 mdyne/angstrom or /radian.
3. Torsional internal coordinate forces are less than 0.001
mdyne/radian.
4. The internal force on torsional coordinates has changed sign.
Conditions I through 3 are the normal conditions used to determine
geometry convergence. Condition 4 is absolutely essential to ensure convergence
of low energy torsional and out-of-plane motions.34 The above conditions should
give convergence of calculated bond lengths to ± 0.002 A, bond angles to ± 0.20,
and torsional angles to ± 2.00.
As discussed earlier, the convergence criteria for the point charge
calculations must be slightly different. For these calculations, conditions 2 through
4 above must be met with the additional requirement for all Cartesian coordinate
displacements to be less than 0.0005 A. The restriction on the change in Cartesian
coordinates is based upon the work by Saebo and my review of other isolated
molecule optimizations when conditions 1 through 4 were met.
4
m . o o . • d" o- .- , d' . . . ° ° -. . . ° •- . . . .. . . . . . . . . . . ° . . . N . . i € .• % • . • % ° . °°. . .- . - .- %- .% -". • °°°% -% 4". ., . °. " %' .. - , ' %
. . . q

4', -= , - . ,;t < , . 2 . . c--u- s , .& i , • ¥ , • . - . . . . .4
CHAPTER THREE
SULFURIC ACID
One reason for the great interest in sulfuric acid is because of its presence in
acid" rain. The harmful effects of "acid" rain have been widely reported over the
last decade. These detrimental effects include large fish kills, contamination of
water supplies, and damage to automobile finishes. The Northeastern portion of
the United States has been hit especially hard. Research has found this to be
predominantly due to the increased burning of high sulfur coal in the Midwest.
More recently, the effects of "acid" rain have been reported worldwide. Many old
churches and monuments in Europe are rapidly being destroyed by "acid" rain. For
these reasons and several others, such as the detection of sulfuric acid in the
Venusian atmosphere, many studies have been done on sulfuric acid. These
studies have centered on the formation and structure of sulfuric acid, especially the
intermediates that are involved. Results from some of these studies have lead to an
understanding of the formation of sulfuric acid and its detection in the vapor phase.
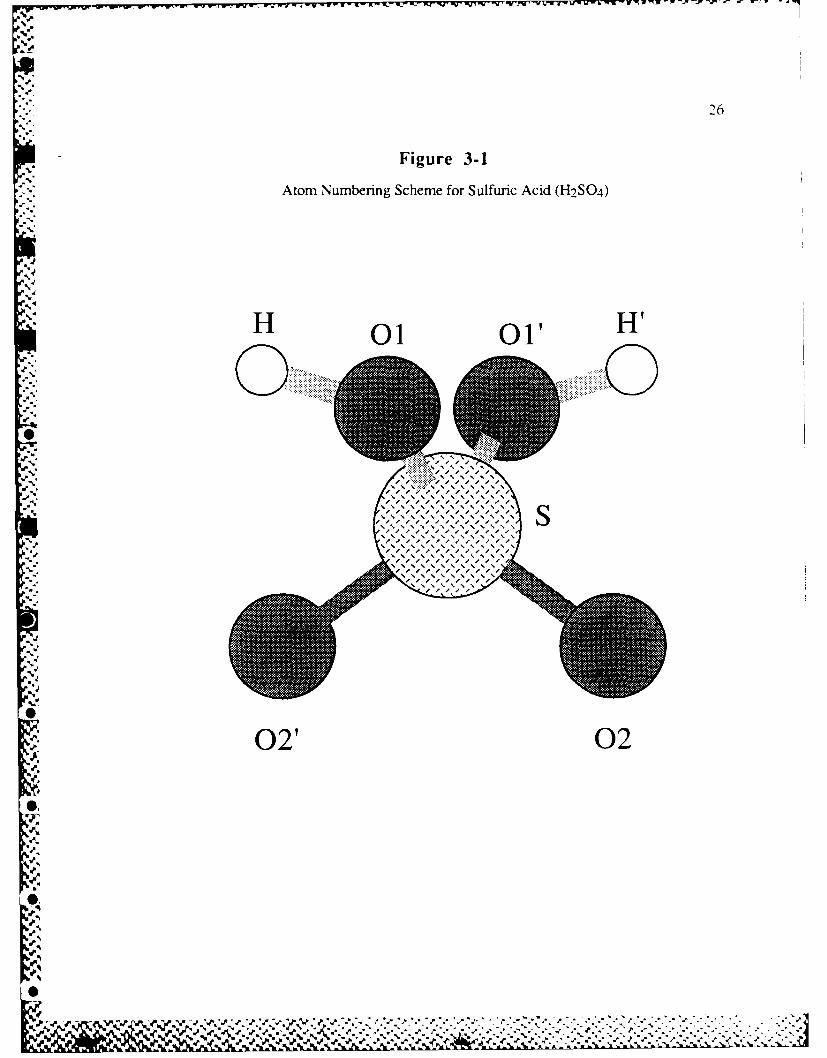
As discussed in Chapter One, sulfuric acid undergoes significant structural
changes transforming from a gas to a solid. Regardless of the phase, the symmetry
remains C2. The H2SO4 molecule with C2 symmetry is shown in Figure 3-1 along
with the atom designations that will be used throughout the paper. These structural
alterations can easily be seen in a comparison of the gas and solid structures as
shown in Table 3-1. The most dramatic change is the shortening of the S-C single
bond on the order of 0.05 A. In addition, there is a noticeable decrease in the
O=S=O bond angle coupled with an increase in the O-S-0 bond angle. The'e
25
% , ~ 5 '-0%~
26
Figure 3-1
Atom Numbering Scheme for Sulfuric Acid (H2SO4)
'4
H 01 O' H
0100
-p
.. . .... .._. { 4. .... ......... .
02' 02
%S .
% % / / /
U p% % % % % 1 % % % %
II //p// %S 4 % %% % %,

27
Table 3-1a
Sulfuric Acid (H 2 SO 4 ) Gas and Crystal Geometries
MWb X-RAY(1978)c NDd X-RAY(1965)e
Phase gas solid solid solid
S-01 1.574+0.01 1.528(5) 1.48 1.535(15)
S=02 1.422+0.01 1.419(5) 1.49 1.426(15)
01-H 0.97+0.01 f 0.91 f
Z,H-OI-S 108.5±1.5 f 113.6 f
/O1-S-01 101.3±1 103.7(4) 112.8 104.0(10)
* Z02-S-02' 123.3±1 118.3(4) 110.1 118.6(10)
ZOI-S-02 108.6+0.5 110.6(3) 108.0 110.5(10)
ZO1-S-02' 106.4£0.5 106.3(3) 109.0 105.9(10)
t(H-01-S-Ol')g 90.9±1 f 84.1 f
T(H-01-S-02)g -20.8+1 f -36.5 f
a. Bond lengths in angstroms. Bond angles in degrees.
b. Preferred microwave structural parameters and uncertainties from referce 35.
c. X-ray diffraction geometry with estimated standard deviations esd's) in
parentheses from reference 36.
d. Neutron-diffraction I0 K structure from reterence 7. The estimated
uncertainties are reported in the paper as 41).5 () ,,k.
e. X-ray diffraction eeonticti' Nith d in parcrithees, frwi rom rence 38.
f. The hi(rogew \,crc not hkatcId in ('ther X rt, ditt racti "1i11t '
-. t(ijkl is the tosional angle t-.,,ccn the ,k and Iki pLine,.
0 .
O.
% J . J
J.- ,- - - - . . . * - -

significant changes are attributed to the hydrogen bond formation in the crystal. 7 I
have been able to reproduce these structural changes with the point charge model.
The remainder of this chapter will deal with the results I have obtained for
both the gas and solid phases of sulfuric acid. The gas phase will be discussed
first, followed by the crystal phase.
GAS
Although vapor pressure studies in 1923 showed that solutions with
concentrations exceeding 85% had measurable vapor pressures above 2000 F, early
studies of gaseous sulfuric acid were hampered by several problems. An infrared
, (IR) spectrum of gaseous sulfuric acid was not completed until 1965, because of its
low volatility and attack on windows at high temperatures. In that study, the
:observed H2SO4 bands were assigned in agreement with the expected chemical
series (X-S02-Y: X,Y= F. OH, Cl ....CH 3). Based on those assignments, the
researchers incorrectly concluded that free H2 S0 4 molecules had an approximate
tetrahedral configuration with C2V symmetry, similar to the other X-S0 2 -Y
compounds.39
The first molecular orbital calculation of the gas phase structure of H2S0 4
was undertaken in 1978. The purpose of that study was to gain insight into the gas
phase reaction of S0 3 and H20 to form HS04 using semi-empirical CNDO/2
calculations. Those researchers incorrectly calculated the symmetry of H2S0 4 as
C2V in agreement with the earlier IR study. The calculated structural parametersS.-
.. were 01-I1= 1. (4 A, S-0f= 1.63 A, S-02= 1.56 A, ZOI-S-O'= 97', ZH-O1-S=
97.5' , and ZO2-S-O2'= 1160 with the H-0I-S-O'-Hi' atoms being planar.40
Their configuration is referred to as the compact C2v geometry where the OH
., '. ,.... .,...........~ ,....... ......... ....... ......-.... ......-.......-.............................-.....-......-...-... .-..,Th, - o -. ir. .-
- ". io is referredto
.-,. a . .... . , . ,t . , €, . . . * . /. * .. ° .% . . .- - . .- ,.% . .%, ... ° 0% - .... • - .
29
groups point toward and bisect the terminal SO2 group with a torsional angle (I-
01-S-01' and ZH'-01'-S-01) of 1800.
The first ab initio calculation on H2SO 4 was completed in 1980 due to tile
importance of sulfur-oxygen compounds in air pollution chemistry, specifically
11 acid" rain. 4 1 The optimum geometries in that study were calculated using the
STO-3G* basis set. Previous calculations on similar compounds using the STO-
-, 3G or 4-31G basis sets had shown poor agreement between experiment and
calculated structural parameters though the STO-3G* basis set had been shown to
2, give acceptable geometries. Since the researcher's principal interest was in the
geometry about the sulfur atom, the OH length and SOH angle were fixed at 0.994
A and 1050, respectively [these values corresponded to their optimum values in
S0 2(OH)]. The calculated STO-3G* geometry for sulfuric acid was S-O1= 1.63
A, -2=1.45 A, ZO1-S-O1'= 990, ZO1-S-O2= 1070, and Z02-S-02'= 1250.
The H-O-S-O dihedral angles were set to 900 by the researchers based upon the best
idealized conformation. The addition of d functions to the basis set was shown to
greatly improve the calculated energy. The energies calculated at the optimum
geometry for the STO-3G* and 4-31G* basis sets showed an energy improvement
of 316.1 and 170.6 kcal/mole, respectively, over the energies at the STO-3G and 4-
31G levels. 4 1
The correct C2 symmetry was finally determined in 1980 from the
*, microwave spectra of four isotopic species of H2SO 4 . From those spectra, the
researchers determined a detailed structure for gaseous H2SO 4 which is shown in
Table 3-1. In contrast to the previously determined compact C2V geometry, the 011
bonds were found to have rotated past the S02 and SO2' bonds resulting in
%

dihedral angles of -20.8' with them. That structure possessed a H-01-S-0'
dihedral angle of 90.9' as compared to 1800 found in the CNDO/2 calculation. 35
The H2SO 4 molecule with C2 symmetry is shown in Figure 3-1.
The continued interest in H2SO 4 prompted two additional ab initio studies
of its structure and torsional modes. 42,43 Both of these studies determined the
potential energy surface for H2SO4 as a function of 0 (ZH-0 1-S-0 I') and 0' (Z
H'-0'-S-0l). The p,p structure ("p" denotes periplanar or cis) is shown in
Figure 3-2 where 0=0'=0 ° . These researchers performed most of their calculations
-at the STO-3G level except for some selected conformations which were calculated
at the 4-31G level. Despite the different structures used for sulfuric acid, as
discussed below, the results of these two studies were surprisingly similar.
The first study was started prior to the completion of the microwave study.
As a result, Kaliannan and coworkers used the geometry of dimethyl sulfate
-.- [S0 2 (OCH3)] obtained by electron diffraction in their study of sulfuric acid. The
O-H bond length and H-O-S bond angle were set at 0.96 A and 109.47',
respectively. Their construction of the potential energy surface consisted of
calculations at 22 conformations of 0 and 0'. They found the global minimum
occurring at 0=0'=90' in good agreement with the microwave study value of
0==90.9'. Their calculated dipole moment at that conformation was 2.51 debve
(D) compared to the microwave value of 2.725 D. A secondary minimum was
found to occur at 0=-0'=120' with an energy about 1.2 kcal/mole above the global
minimum. They also determined that the variation in energy was very small in the
range 90'-120' for both 0 and 0', suggesting that the molecule is reasonably fleiXIc
in that range. A comparison of their potential energy surface to that of 11PO.4-
.~~~~.. .

4o.
Figure 3-2
H2 S0 4 p,p structure 0=-O' ("p" denotes periplanar or cis)
HO OHt
01 01
S
a,4
02'. 02
. . . . . .
%
found the two to be very similar with the global minimum occurring at 0=0zYin m
both cases. The results of their 4-31G calculations at the STO-3G optimized
geometries confirmed the presence of the global minimum at 0=0'--90' in agreement
with the microwave experiment. 42
Lohr has also conducted a study of the structure and torsional modes of
H2S04. In his study, the microwave values for bond lengths and bond angles
were used. He constructed his potential surface from 43 calculated points at the
STO-3G level. Lohr found the global minimum had C2 symmetry and occurred at0
p=O'=98.6 , somewhat larger than the microwave value of 0=0'=90.9' . A local
minimum with Cs symmetry was also found at 4=-4'=104' with an energy of 1.36
kcal/mole relative to the global minimum. Calculations at eleven selected points
were done using the larger 4-31G basis set. The structure with C 2 symmetry was
found to have a minimum energy at 0=0'=94.9' which is somewhat closer to the
microwave value than is the STO-3G value. 43 The results of both torsional mode
studies confirm the C2 symmetry which is observed in the microwave study.
I optimized the gas phase of sulfuric acid with several different basis sets.
The programs TEXAS, TEXAS(D), and GAUSSIAN-82 44 were used to obtain an
optimum structure at the 6-31G** level. In addition, calculations were conducted
at the 4-31G** level using TEXAS and at the STO-3G* level using GAUSSIAN-
85 45. The results of my calculations on gaseous sulfuric acid are presented in
Table 3-2.
The 6-3 IG** basis set admirably reproduces the experimental structure.
With very few exceptions, the calculated 6-31G** structure is within the
experimental uncertainties of the microwave study. The major variances occur inaS oc
V.., , , ' '" ,% t, O g ., , " ' ', .- "' " . . - . , . - . - - . .- .•. ' . . . - ,
0 o [ .i'[''''' ,4"." -. s=-j ." " ,"•
°,% . ".' .%* \

NW
33
Table 3-2a
Sulfuric Acid (H2SO 4) Gas Phase Geometries
MWb 6-31G**C 6-31G**c 6.31G**c 4.31G**c STO-3G*C
TEXAS(D) G-82 G-85
, S-01 1.574£0.01 1.570 1.569 1.569 1.563 1.620
S=02 1.422+0.01 1.411 1.411 1.411 1.408 1.446
01-H 0.97+0.01 0.950 0.950 0.950 0.950 0.993
ZH-01-S 108.5±1.5 110.7 110.8 110.8 111.2 105.6
/O1-S-OI' 101.3±1 101. 101.8 101.8 101.7 100.1
Z02-S-02' 123.3±1 123.5 123.6 123.6 123.5 125.6
ZO1-S-02 108.6±0.5 108.1 108.1 108.1 108.3 108.9
ZO1-S-02' 106.4±0.5 106.7 106.7 106.6 106.5 105.2
t(H-01-S-OV) 90.9±1 88.9 89.2 88.8 87.8 79.1
r(H-01-S-02) -20.8±1 -23.2 -22.9 -23.3 -24.2 -31.0
Energy:
"Hartree -698.051422 -698.052804 -689.766048
-698.052805 -697.659157
kcal/mole -438,033.781 -438,034.65 -432,834.63
-438,034.649 -437,787.631
a. Bond lengths in angstroms. Bond angles in degrees.
h. Preferred microwave structural parameters and uncertainties from reference 35.
c. This work. Calculations run with TEXAS unless noted otherwise.%'. 4
.*
p",.-,-.,-, . ,' .- ,"- ,... - . . . . . ..- . -. . . . ..... - -.. .- -. , . - r.:. - -
the torsional angles which are notoriously difficult to reproduce. Considering the_
2.00 uncertainty in the value of the calculated torsion angles, the agreement is very
good.
The development of TEXAS(D) by Pulay's group prompted me to optimize
the gas phase structure with it for comparison. As shown in Table 3-2, the 6-
3 lG** structures are identical for both TEXAS and TEXAS(D). My calculations
confirm that the displaced p functions used to construct d functions in TEXAS are
more than adequate. The only difference between these two calculated structures is
in the energy. The TEXAS(D) energy is 0.868 kcal/mole lower than that calculated
in TEXAS. The improved energy in TEXAS(D) must be due to the use of true d
functions. For most calculations, this energy difference is insignificant. Based on
calculated structures and energy, neither TEXAS nor TEXAS(D) offer anv
advantage over the other with the exception of the slightly lower energy in
TEXAS(D). In terms of computation time, TEXAS(D) is superior, posting
decreases of up to 30% over TEXAS. TEXAS(D), however, requires double the
amount of disk space to store the integrals as compared to TEXAS.
Because of the recent acquisition of a Cray version of GAUSSIAN-82, I
decided to make a comparison between it and TEXAS(D). Since both programs
'7. incorporate true d functions, I expected identical results. As shown in Table 3
the results are essentially identical. The few tenths of a degree difference between
torsional angles is well within the calculated uncertainty of ± 2.0'. The TEXAS(D)
program calculated an energy which is only 6 x 10⁻⁴ kcal/mole lower than
GAUSSIAN-82. Based upon my comparison, both TEXAS(D) and GAUSSIAN-
10, 82 do give identical results for calculations conducted with the same basis set.
". . ..... ......... . .... . . .. ....... ..'2 -,.- .,--, ..,-.. .d- " " ' , . ' ' - ' - . "-" .- .' .-- . . - . "' - "- -J" - - -<" " - - -
.!,
Initially, I was interested in reducing the computation timt, required for one
optimization run. As a result, I completed an optimization run o: gaseous sulfuric
acid at the 4-31G** level. The 4-31G** basis set I utilized contained a 4-31G**
basis on sulfur and 6-31G** on both oxygen and hydrogen. As shown in Table 3-
2, the 4-3 1G** basis set gave structural parameters almost identical to those
computed with TEXAS at the 6-3 lG** level. The major distinctions are the shorter
01-S bond length and the torsional angles at the 4-31G** level. The computation
time saved at the 4-31G** level was significant. The 4-31G** calculation ran 15%
faster than the 6-31G** calculation, 1761 seconds compared to 2066 seconds. The
time savings is due to the reduction in the number of primitive Gaussian functions.
Although the number of contracted Gaussians is the same for both basis sets at 89,
the number of primitive Gaussians is reduced from 208 to 198 in going from the 6-
31 G** basis set to the 4-3 1G** basis set. The major disagreement between the
two calculations is the total energy. The 6-31G** calculation results in an energy
247 kcal/mole lower than the energy at the 4-31G** level. For many calculations,
the 4-31G** basis set would be satisfactory. Since I was concerned with
observing structural changes, I chose to use the more accurate 6-31G** basis set in
the crystal calculations. In addition, the 6-31G** basis set {(Ils4pld/4slp)
contracted to [4s2pld/2slpl) represents a significant improvement over the basis
set used by Saebo and coworkers {(7s3p/4s) [4s2p/2s]1. The 6-31G** basis set
not only increases the number of primitive functions but also adds polarization
functions to hydrogen and the heavy atoms.
In order to make comparisons with some dimer calculations, I optimized
sulfuric acid at the STO-3G* level. As shown in Table 3-2, the calculated
II~v"Id
Sy
parameters at this level differ greatly from the experimental structure. The large
error in the torsional angles at the ST0-3G* level confirms the need for polarization
functions on oxygen to accurately calculate these angles. More importantly, while
no symmetry restrictions were placed on any of the other calculations, I had to
restrict the ST0-' G* calculation to C2 in order to prevent the program from
determining a structure with C1 symmetry. While minimal basis set calculations
can yield valuable information, the need for accurate structural information almost
4.
always requires using a larger basis set.
4*.
CRYSTAL
The first X-ray diffraction study of sulfuric acid was completed in 1954 by
Pascard. That study incorrectly concluded that sulfuric acid crystallized in the
noncentrosymmetric space group C2 and possessed C2V symmetry.46 In 1964,
Pascard-Billy refined the original intensity data with anisotropic temperature factors
for oxygen atoms to a reliability (R) factor of only 0. 124. The reported dimensions
of the H2Sa 4 molecule deviated significantly from idealized C2V symmetry.
Pascard-Billy determined that the correct space group was actually C2/c and the
H2S0 4 molecule possessed C2 symmetry. Although Pascard was not able to locate
the hydrogens, he theorized that they each formed a hydrogen bond with a double
bonded oxygen on an adjacent molecule. In that configuration, one H adS04
molecule is hydrogen bonded to four adjacent molecules with the hydrogen atom
lying on the -01 ... 02= line.38
In 1978, Yu and Mak felt that the atomric parameters reported earlier could
be further refined by full-matrix anisotropic least squares with correction for
secondary extinction. Their study showed significant improvement of the standard
.V '
" nncetroymmtri spce rou C2andposessd Cv smmery.6
I 1964i
37
deviations in atomic parameters over those reported earlier with an R value of
0.099. Their measured hydrogen bond length (01-H.. .02) of 2.624 A belongs to
the short type. They concluded that the hydrogen atom almost lay on the
internuclear 01. .02 line if a tetrahedral S-O-H angle was assumed.36
The hydrogen atoms were finally located in 1983 by Moodenbaugh and
coworkers using powder neutron-diffraction techniques. Diffraction data was
collected near the melting point (240'K) and at 10'K to search for order-disorder
transitions in the hydrogen bond network. The neutron-diffraction scans revealed.
to the limits of detection, that the sulfuric acid sample was single phase with
monoclinic symmetry at both temperatures. The principal conclusions from their
study were that the hydrogens were ordered at both temperatures and the
parameters of the other atoms were qualitatively consistent with the single-crystal
X-ray studies.37
The generation of the point charges used in my calculations was facilitated
by the use of several computer programs. The BMFIT4 7 (Best Molecular Fit)
program derives the best least-squares fit between two sets of atoms. I used
BMFIT in order to convert calculated structures into fractional coordinates in the
crystal space. The program DAESD 48 calculates interatomic distances and angles
in crystal structures. The DAESD program was used to generate all the molecules
within a given unit cell. The programs ZERO and MOLE were written by me in
order to generate the actual point charge locations. Both programs convert the
contents of a unit cell into a molecule and its nearest neighbors. In the program
ZERO, all neighbor atoms within a given sphere of radius r from the central
molecule are punched. In addition, a dummy charge is generated and placed at
%6;%d%

(100,100,100) in order to maintain the neutrality of the point charges. In MOLE,
.-. all neighbor molecules that have their central atom within r from the central
" molecule are punched. In the case of MOLE, the neutrality of charge is maintained
by including whole molecules instead of individual atoms.
My studies have shown that great care must be taken in generating the point
charges. As discussed in Chapter Two, I initially tried to limit the number of point
charges in order to reduce the computation time. I did this by using the program
ZERO to generate the point charges. The program ZERO allowed me to include
* only the nearest atoms and not the nearest molecules. I could then eliminate atoms
- on adjacent molecules that were far enough away that they had essentially zero
electrostatic interactions with the central molecule. However, this method proved
to be entirely unsatisfactory. Not only was the savings in computation time
/negligible, but this method also introduced artificial symmetries into the calculated
structure. In my particular case, the point charges generated using the program
ZERO artificially reduced the symmetry of H2SO 4 from C2 to C1. As a result, all
pof my crystal calculations were made using the nearest neighbor molecules
generated by MOLE. After careful scrutiny of the point charges, I found that
including the 18 nearest H2SO 4 molecules insured that all nearest neighbor atoms
4were included in the point charges. All of the reported calculated crystal structures
used 126 point charges based on the 18 nearest H2SO 4 molecules.
The crystal calculations which I have completed can be divided into fourO
categories - SF, SE, MF, and IF. These designations are used throughout the
remainder of the paper and are defined as follows:
'p.,
~~~~~~.............................:','.,.............."....5.,"., .......... .. .....-., -. ".--.".........

" SF- A single optimization cycle was run. (Note: An optimization cycle
i :..::::means that the convergence criteria of Chapter Tw o have been met.)
_A : The point charge magnitudes are based on the optimized free (geas
,, -,phase) molecule. The point charge locations are based on the- experimental crysta structures. This is the method used by Saebo
and coworkers.
;.Qa-.SE- This is identical to the SF method except that the point charge
-'.'-'.magnitudes are based on a calculation at the experimental crystal
, q
%,- .geometry.
'e.Y' MF- This method is a continuation of the SF method involving multiple
**..%. 39
SF -igeoptimization cycles. In this case, a Mulliken population analysis i
run on the new cnegmolecule geometry obtained from the SF
' - method. (Note: The term "free", in quotation marks, refers to the
central molecule surrounded by the point charges.) The new net
charges are assigned to the experimental point charge locations and
1 another optimization cycle is completed on the "free" molecule. The
,t process is repeated until the "free" molecule converges in both
structure and energy.
IF- This is an iterative method involving multiple optimization cycles
SE- his similar to the MF method. In this case, however, both the pointcharge magnitudes and locations are based on the optimized free
MF-.h(gas phase) molecule. The only information used from thegroup. After each optimization cycle, the magnitude and location of
.cagsaeasindt h experimental poinlsuy sth n t c hargdi enaions ande
atpe
process~~~~~~~~~~~ isrpae.ni-tekre oeue ovre nbt

.
-40°'.' 1
the point charges are adjusted to those corresponding to the newlv
optimized "free" molecule. The process is continued until the "free"
molecule converges in both structure and energy.
The SE method was conceived by me to test the sensitivir' of the calculated
crystal structures to the magnitude of the point charges. A Mulliken population
analysis was run on the wave function from a single point SCF calculation at the
experimental geometry to obtain the experimental net charges. As expected, the net
charges from the experimental geometry differed significantly from those of the
optimized free molecule. Although using the net charges from the free molecule
seems logical since a wave function already exists, no study has been made
previously to compare the effects of the two sets of net charges. Since a single
point SCF calculation is relatively small (about 650 seconds), the calculation of the
4experimental net charges and their subsequent use in the SE method seems a
reasonable alternative to the SF method.
The use of the iterative method in the point charge model is an extension of
an improvement proposed by Saebo and coworkers. They simply suggested that
the point charge model might be improved by including the net charges of the
newly optimized "free" molecule. My idea was to iterate this process until the
a.' molecule converged in both structure and energy. My iterative technique is
therefore self-consistent. The major advantage of my method is that it adds
flexibility to the point charge model. A significant concern with the point charge
model is that it may not incorporate all the forces which bind crystals together. As
% discussed in Chapter Two, all of the binding forces in crystals involve charged
' particle interactions. Since the model basically allows for electrostatic interactions
a,
~~~~~~~~...... ........ ,.....-..... -...... ". ....... '.*'-.--'2-'.--.-' ..... ',

%.
%,betv en the electron, and the point chares. the iteratie method \houLld Jccuratek
recreate the enironment inside the crystal. In addition, anv effect of the arbitrarv
assignment of net charge in the population analysis should be greatly minim"ized
since the net charges are vanied in response to their environment.
I devised the IF method for a couple of reasons. First, experimental crystal
data is often incomplete or inaccurate. As discussed previously, X-ray
crstalloraphy frequently cannot locate hydrogen atoms. Even when all the atoms
are located, the precision with which an atom can be positioned in a crystal is
subject to systematic errors. These errors can be divided into two classes: errors in
the model and errors in the data. If it was possible to collect data with no errors.
many significant structural errors could be introduced if an improper model is used
in the refinement. The IF method is not as dependent on the experimental data
since it uses only the cell dimensions and space group of the crystal. The cell
dimensions and space group are more easily determined and can be found even if
all the atoms are not located. Second, a principal concern with the point charge
model is that it may not adequately represent the crystal environment. The IF
..method allows for movement of the point charges. Therefore, the point charges
should ultimately reside in the crystal locations if the point charges properly model
the crystal environment. Thus, the IF method serves as a test of the validity of the
point charge model.
i., The first calculations that I completed were based on the X-ray study of Yu
and Mak. Since the hydrogens were not located in their study, I assigned their
location by assuming an 01-H bond length of 0.95 A and a hydrogen bond angle
(ZOI-H...02)of 1800. The results of these calculations are presented in Table 3-3.
%%
% W, %S ," . % " ° " . ° . " o % % % % '" - " , %.° "N % ' ' ". %. ° %

-... t 4- .W..F .... "....wj 7.
42
In addition to the calculations based on the X-ray study, I also conducted
calculations based on the neutron-diffraction study. The 10'K neutron-diffraction
data was used as the basis for the calculations because of its minimal thermal
motion and due to errors in the 240'K data I discovered. The results of these
calculations are presented in Table 3-4. The numerous problems with the neutron-
diffraction study will be discussed later.
One aspect that all of the calculated solid structures share is a lower energy
than the gas phase. The energy improvement in the solid structures is on the order
of 50-70 kcal/mole. The lower energy in the crystal is expected based on the0
stabilizing effect of the neighbor molecules in the solid. The calculated energy
improvement which corresponds to 12.5-17.5 kcal/mole per hydrogen bond
compares favorably to 7.8 kcal/mole for cyanoformamide 9, 5.4 and 5.9 kcal/mole
-f for CH 3CN... HOCH3 , respectively 49, 3.9-9.6 kcal/mole for the water dimer
(depending upon basis set) 50 , and 7.0-10.3 kcal/mole for the various
monohydrated formamide complexes 51. In addition, all of the calculated crystal
-',p.-, structures mimic the major structural changes which occur in H2SO 4 in going from
a gas to a solid. Specifically, the calculated crystal structures show a substantial
shortening of the S-0 bond along with an increase in the ZOI-S-O1' and a
decrease in the Z02-S-02' compared to the gas. Further, all of the calculated-crystal structures agree with the general and very characteristic structural feature
between bond angles for sulphones (XSO 2Y). Hargittai has demonstrated that the
Z X-S-Y < Z X(Y)-S=O < Z O=S=O, regardless of the X and Y ligands. The
Z O=S=O is considerably larger than the ideal tetrahedral angle while the Z X-S-Y
,. is considerably smaller. 52 While these results alone substantiate the point charge
O,.,
aFo-- ,,",
,*1 ",, . '. ,,5'.,v.'Gs' ,,.c -,g , '- ,.a",%. '- " '"."''""""""""€ ',.-,...
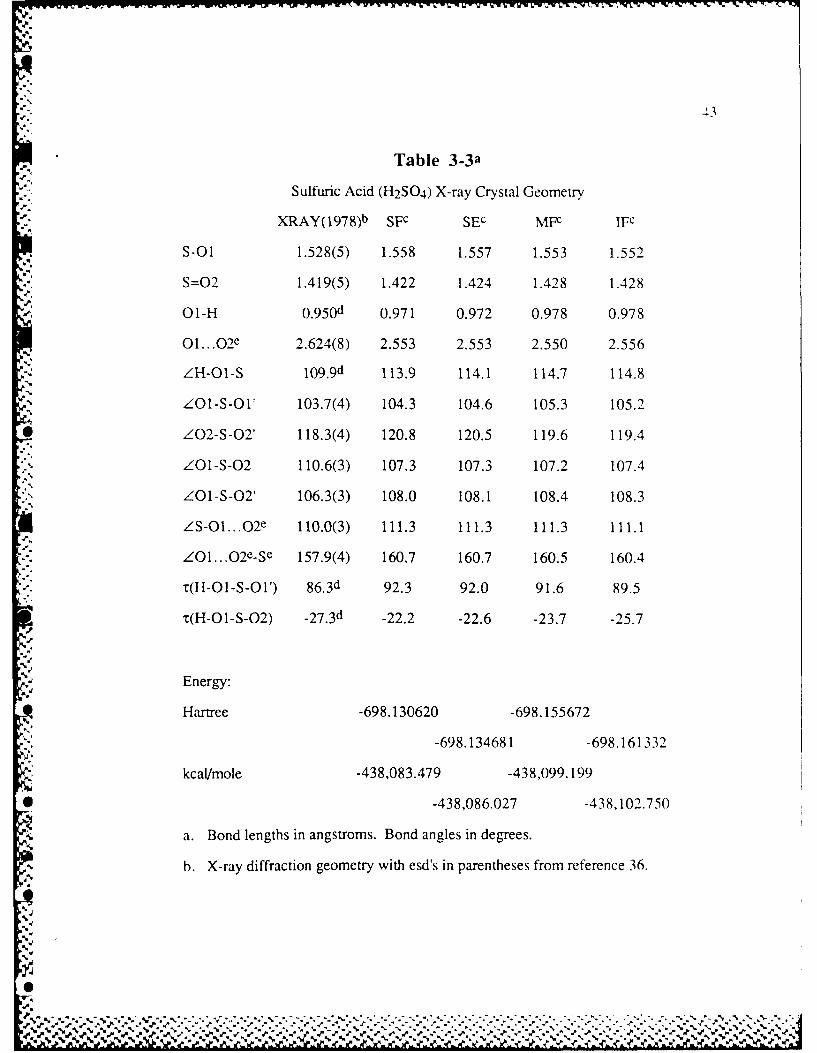
* 43
Table 3-3a
Sulfuric Acid (H2SO4 ) X-ray Crystal Geometry
XRAY(1978)b SFC SEc MFc IFc
S-01 1.528(5) 1.558 1.557 1.553 1.552
S=02 1.419(5) 1.422 1.424 1.428 1.428
01-H 0.950 d 0.971 0.972 0.978 0.978
01.. .02e 2.624(8) 2.553 2.553 2.550 2.556
ZH-01-S 109.9 d 113.9 114.1 114.7 114.8
/O1-S-OI 103.7(4) 104.3 104.6 105.3 105.2
* Z02-S-02' 118.3(4) 120.8 120.5 119.6 119.4
ZO1-S-02 110.6(3) 107.3 107.3 107.2 107.4
ZO1-S-02' 106.3(3) 108.0 108.1 108.4 108.3
ZS-01 ...O02 e 110.0(3) 111.3 111.3 111.3 111.1
Z-O1 ..02e-Se 157.9(4) 160.7 160.7 160.5 160.4
T(H-01-S-O1') 86 .3d 92.3 92.0 91.6 89.5
't(H-01-S-02) -27 .3d -22.2 -22.6 -23.7 -25.7
Energy:
Hartree -698.130620 -698.155672
-698.134681 -698.161332
kcal/mole -438,083.479 -438,099.199
* -438,086.027 -438,102.750
a. Bond lengths in angstroms. Bond angles in degrees.
b. X-ray diffraction geometry with esd's in parentheses from reference 36.
.5
.,
.5. ' "g-" "" " 5-.''" " ".5 .. .. .- "5 "'.... . .. .. 5.. t '2d1'. . . S.. -' .- 'a *h " ".:' L - .'"5..

c. This work. Calculated using the 6-31G** basis set.
d. Based on setting the 0 1-H bond length to 0.95 A and the 0 111I .. .02 bond
angle to 180'.
e. Atom is located at fractional coordinates -l1/2+x,l1/2+y,z on an adjacent
- molecule.
% % % %

45
*.'. Table 3-4a
Sulfuric Acid (H 2SO4) Neutron-Diffraction 10'K Geometn
NDb SFC SEC MFc IFc
S-01 1.48 1.554 1.551 1.549 1.552
S=02 1.49 1.425 1.428 1.431 1.428
01-H 0.91 0.972 0.976 0.980 0.979
01 .. .0 2d 2.52 2.55 2.55 2.55 2.55
H...02d 1.65 1.59 1.58 1.58 1.58
ZH-01-S 113.6 113.5 114.4 114.3 115.2
* ZO1-S-01' 112.8 104.9 105.7 106.0 105.4
Z02-S-02' 110.1 120.0 119.1 118.6 119.5
ZO1-S-02 108.0 107.2 107.2 107.0 107.3
ZO1-S-02' 109.0 108.3 108.4 108.8 108.2
Z"OI-H...02d 175 171.5 173.8 171.3 172.7ZS-01 ... O02 d 111.9 112.1 112.0 112.1 112.3
ZO1 ... o 2 d-sd 155.3 159.3 159.1 159.1 158.9
T(H-01-S-OI') 84.1 93.1 90.5 92.6 91.3
t(H-01-S-02) -36.5 -21.9 -25.1 -23.4 -23.9
Energy:
Hartree -698.136173 -698.165534
-698.160937 -698.160931
kcal/mole -438,086.963 -438,105.387
-438,102.503 -438,102.499
O0o

9
4 6
a. Bond lengths in angstroms. Bond angles in degrees.
b. Neutron diffraction 10'K structure from reference 37. The estimated
uncertainties are reported in the paper as ±0.05-0. 10 A.
c. This work. Calculated using the 6-31G** basis set.
d. Atom is located at fractional coordinates - 1/2+x, 1/2+y,z on an adjacent
molecule.
% - ?1-0O
- .:'5-,%'-
o.1
O.,
S2.5"..
S ,/
S.. 5'
. ..5 .. . .. _ . _ . €- " ,"5% '. e .d. . '

--7
model, the remaining differences between the calculated and experimental crystal
structures need closer scrutiny.
The differences between the calculated and neutron-diffraction crystal
ructures are easily explained by examining the experimental data. Moodenbaugh
and coworkers report estimated standard deviations (esd's) of ± 0.05-0. 10 .
Although their calculated esd's are about 0.01 A, the larger esd's arise from an
apparent discrepancy in the 0 1-H bond length which is known to be temperature
independent to about ± 0.002 A.37 Based on their± 0.05-0. 10 A uncertainty in
bond lengths, all of the calculated values fall within that range. Any comparison
with the neutron-diffraction study by Moodenbaugh and coworkers is essentially
useless because of the extremely large uncertainties in the experimental data.
There are numerous reasons for the large errors reported by Moodenbaugh
and coworkers. First, the structural model that is used in any refinement of the raw
crystal data is crucial to the results. In their study, they based the heavy atom
positions on the 1965 X-ray study with its larger esd's instead of the 1978 study
with its smaller esd's. They were unaware of the 1978 study. They also chose to
use isotropic temperature factors for simplicity, even though both of the X-ray
diffraction studies indicate that anisotropic factors would be more appropriate.
Their R factors, on the order of 0.20, are approximately double those from the X-
ray diffraction studies. Second, the quality of their data is rather poor with an
unfavorable typical peak to background ratio of 1:2. This is probably due to the
%fact that they used a powder sample since they could not obtain a suitable single
crystal. The high background caused by incoherent scattering required them to use
the Rietveld refinement method which is not normally used.
I
. ., ."4.4 .,','."2 & .",2a.",, . . . -"-"A . " - "a'" -,2j, . -,. , - - -, - - -.-.

Finally, the data from the neutron-diffraction experiment is questionable at
best. Table 3-5 shows the bond lengths and angles reported by them at 240'K.
However, when I used their coordinates to calculate structural parameters, the
actual S-C1 bond length differs greatly from that they reported. At first glance,
only the reported S-01 bond length would appear to be in error. If the value of
1.67 A that I calculated is correct, the S-01 bond length would undergo a
shortening of 0.19 A between 240'K and 100K which is highly unlikely since
H2SO4 was found to be ordered at both temperatures. In addition, the values I
calculate from their data for the ZOI-S-O1' (=87.9°) and Z02-S-02' (=I 33. °)
differ greatly from those in the X-ray diffraction study (003.7' and 118.3) and in
the neutron-diffraction study at 100K (112.80 and 110.10). The discrepancies in the
S-C1 bond length and the angles about sulfur suggest to me that there is an error in
* the fractional coordinates of the sulfur atom. Since sulfur occupies the speci:d
position 0,y, 1/4, the error appears to be in the y fractional coordinate. I have made
several attempts to determine the correct sulfur coordinates by varying the y
coordinate. In my opinion, the most probable structure for H2SO.4 based on the
data presented in the paper at 240'K, occurs when y--0.068 as shown in Table 3-5.
-' The reported value is y=0.028(6). My value of 0.068 appears to be a logical
transposition of the reported value. At v--0.068, there is much better a.reemcnt
W" between the 100K and 240'K structures. I have talked to Moodenbauh about this
problem. Moodenbaugh was not previously aware of the problem and told me heI
put much more reliance on the heavy atom positions from the X-ray studies.
Further, he indicated absolutely no interest in trying to resolve the problem. The
numerous problems with the neutron-diffraction study by Moolenbaugh and
I
* '1' . .- - .,- -.. -.-. "• . . .. . "." . . . .... .... " .- " .-.- ,.-.- ' ,- '. , , -,'* "---",",".".'- ' ..,. ,.
e4 / " , . , .. ,o4 ''•d " . ' ' .°...' ° " ,' ' ° .•°% "% "*° """"" "°"°°' " " % ",% ' " "° • . " 4
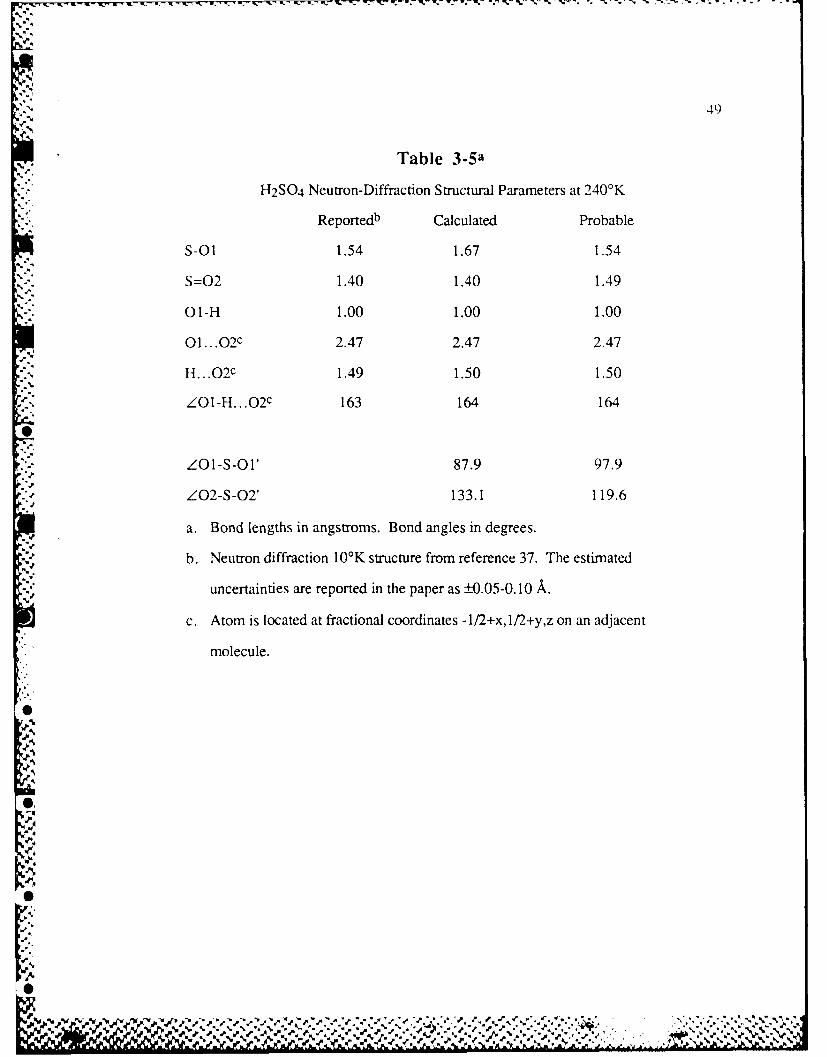
49
Table 3-.5a
H2S0 4 Neutron-Diffraction Structural Parameters at 240'K
Reportedb Calculated Probable
S-01 1.54 1.67 1.54
S=02 1.40 1.40 1.49
01-H 1.00 1.00 1.00
01. ...02c 2.47 2.47 2.47
H... .02c 1.49 1.50 1.50
-. ZOI-H ... 02c 163 164 164
ZO1-S-01, 87.9 97.9
Z02-S-02' 133.1 119.6
a. Bond lengths in angstroms. Bond angles in degrees.
b. Neutron diffraction 10'K structure from reference 37. The estimated
uncertainties are reported in the paper as ±+0.05-0. 10 A
c. Atom is located at fractional coordinates -1/2+x, 1/2+y,z on an adjacent
molecule.
e-. 14 ; I%
e %.4 e
% * :q
,,%1- ~ -. % . . U W - V P 1 r i # - - .' - -,V C- . .----- .-.. . -- .r v-u . I. 'W F -,.-U -.
p.
50
coworkers certainly warrant another neutron-diffraction study of H 2 S0 4 .
A comparison of the calculated and X-ray crystal structures in Table 3-3
shows relatively good agreement. By far the largest discrepancy is in the S-O1
single bond length. The X-ray experiment determined the S-O1 distance to be
about 0.03 A shorter than the calculation. As discussed earlier, a major
disadvantage of X-ray diffraction is that it determines distances between centers of
electron density and not nuclei. Since the shorter bond length could be a
consequence of the X-ray experiment, I decided to investigate it further. In order to
investigate the S-01 bond length discrepancy, I chose three distinct approaches.
The first was to calculate the crystal structure with an expanded basis set. The
second involved calculations on the H2SO 4 dimer. In the third method, I used the
program MOCALC 53 in order to look at the total electron density along the S-01
bond.
Since the point charge model may not adequately describe the hydrogen
bonding, the calculated S-01 bond length may be too long. However, various
studies on dimers have shown that not only similar double zeta basis sets49,5 1,54 ,55
but also even the minimal STO-3G basis set 50 adequately describe hydrogen
bonding. Saebo and coworkers concluded from their study of cyanoformamide
that hydrogen bonding was dominated by electrostatic effects.9 In addition, Tang
and Fu concluded from ab initio studies of hydrogen bonding between methyl
cyanide (CH 3CN) or methyl isocyanide (CH 3NC) and methanol (CH 3OH) that it
was a result of ionic binding of two closed-shell systems.49 Nevertheless, in order
to see if an expansion in the basis set might better describe the hydrogen bonding, a
calculation was made with the 6-31 +G** basis set. 10 The "+" implies the addition
-%-%..5.I .,€-€ ,2 ,,, ,2,-. . .. , , . .y, ,2.,2., , ... , e -,,. , , ,.., . '..'.. ,' .. -.., ... ,..
51
of a diffuse sp shell to the hydrogen atoms (exponent=0.0360). The addition of
diffuse functions is required in the calculation of anions, transition structures, and
other species with significant electron density far removed from the nuclear center.
The optimized geometry with the 6-31 +G'3* basis set was practically identical to
that of the 6-3 1G** basis set with no difference in the S-01 bond length.
Another approach I pursued was to optimize the structure of the H2S0 4
dimer. The two molecules chosen were those that were hydrogen bonded in the
crystal. The dimer calculation showed a definite shortening of the S-01 bond at the
STO-3G* level. The hydrogen bonded S-01 and S-02 bond lengths were 1.58
and 1.46 A, respectively, compared to 1.62 A and 1.45 A in the monomer at the
STO-3G* level. The shortening shown in the dimer must be viewed with caution.
In the optimized dimer, the two molecules rotated, as a result of the program, such
that two hydrogen bonds were formed between them instead of only one as found
in the crystal. This is apparently caused by the lack of neighbor molecules which
prevent the rotation in the crystal. My attempts to conduct dimer calculations at the
6-31G** level with the inclusion of the point charges have not been successful. I
initially planned to optimize the dimer structure at the STO-3G* level with the
inclusion of the point charges. However, because of the success of the total
electron density plot in explaining the shortened bond in the X-ray study, I have not
4. completed any additional dimer calculations.
The program MOCALC 53 allows plotting electron density of either a single01
molecular orbital or all of the molecular orbitals. MOCALC was specifically
written to use the data generated in the TEXAS program. In order to investigate the4.
shortened S-01 bond, I have completed a total electron density plot of H2S04 in
'p.S
%-%~1 7.'"
a - 52
the 01-S-01' plane which is shown in Figure 3-3. As Figure 3-3 clearly shows,
the electron density of the 01 atom is definitely shifted toward the S atom. After
talking with several crystallographers, I have determined that there is no commonly
used quantitative method to account for this apparent bond shortening. The
crystallographers simply accept the fact that it exists. In order to get a quantitative
feel for the magnitude of this shortening, I have simply assumed the location of the
center of the electron density on the 01 atom in Figure 3-3. By making simple
measurements with a ruler, I have determined, that in the case of H2SO4 the
shortening of the S-01 bond length in the X-ray study is on the order of 0.03-0.05
A. Thus, as shown in Figure 3-3, I conclude that the short S-01 bond length
reported in the X-ray studies is a consequence of the X-ray experiment.
The various methods used in this study to determine the magnitude and
- location of the point charges yielded some interesting results. As shown in Table
3-3 and 3-4, the SF and SE methods yielded almost identical geometries despite the
differences in the magnitude of the point charges. In both cases, the magnitude of
the point charges obtained from the experimental crystal structures in the SE
method differed by as much as 15% from those calculated for the optimized free
molecule. The differences between the SF and SE structures were no more than
0.004 A in bond lengths and 0.90 in bond angles. In most cases, within the
uncertainties of the calculations, the two methods gave structures which agree. The
convincing agreement between these two methods shows that the structures
calculated using the point charge method are relatively insensitive to the magnitude
of the charges. This indicates that the arbitrary manner in which the Mulliken
population analysis assigns net charge has little effect on the calculated results.
. ................................................................... "

53
Figure 3-3
Total Electron Density Plot of H2S0 4 in the 0 1-S-0 1V Plane
CONTOUR INTERVAL -0.060000
r -p. W

54
,9 My study shows that the iterative technique used in the MF and IF methods
offers several advantages over the single optimization cycle methods. Both of these
methods show substantial improvements in the total energy over the SF method.
The energy improvements are on the order of 15-19 kcal/mole. Throughout the MF
and IF optimization cycles, the calculated structural parameters continued to better
approximate those in the crystal. Specifically, the S-01 bond length continued to
shorten, the ZO1-S-Ol' increased, and the Z02-S-02' decreased. The
improvements in both the energy and structural parameters confirm the use of the
iterative approach. One particularly interesting result from the MF and IF methods
is the change in gross atomic populations. Three ab initio studies by Ottersen and
Jensen found that there is a transfer of electron density from the hydrogen atom to
the acceptor atom. The formamide (HCONH 2) dimer showed a transfer of 0.05
electron across the hydrogen bond. 54 Ottersen's study of the keto (HCONH-7) and
enol (HOCHNH) tautomers of formamide exhibited gross atomic population
increases of 0.057 and 0.089 on the acceptor atoms and decreases of 0.046 and
0.044, respectively, in the bridging hydrogens. 55 Their study of the four
monohydrated formamide complexes demonstrated gross atomic population
increases of 0.009-0.034 for the acceptor atoms and decreases of 0.015-0.039 for
the bridging hydrogens. 5 1 The gross atomic populations for my calculations using
the iterative method are presented in Table 3-6. All four of my calculations clearly
follow the trend of Ottersen and Jensen by exhibiting a transfer of electron density
from the bridging hydrogens to the acceptor atoms (02/02'). These results
confirm the ability of the point charge model to accurately describe the crystal
-" environment for hydrogen bonded systems. In summary, the iterative technique
"'e,' .p., .. ,' ' ' 'a g .' a '- - - - . % .' *" , % . '', . "€ a " € - . '''-

Table 3-6a
H2S0 4 Gross Atomic Populations
Free Optimized NetMolecule Geometryb Change
X-ray:
.MF- S 14.18843 14.11860 -0.07001/01' 8.65419 8.67702 +0.023
H/It' 0.60258 0.51039 -0.092
02/02' 8.64902 8.75329 +0.104
IF- S 14.18843 14.10879 -0.080
01/01' 8.65419 8.67743 +0.023
H/H' 0.60258 0.50813 -0.094
02/02' 8.64902 8.76004 +0.111
Neutron-Diffraction:
MF- S 14.18843 14.11909 -0.069
01/01' 8.65419 8.66920 +0.015
H/H' 0.60258 0.50504 -0.098
02/02' 8.64902 8.76621 +0.117
IF- S 14.18843 14.10930 -0.079
01/01' 8.65419 8.67745 +0.023
H/H' 0.60258 0.50761 -0.095
02/02' 8.64902 8.76029 +0.111
a. All values were calculated from the Mulliken population analysis with the 6-
31G** basis set.0.1
VY-7, b. These values were obtained using the indicated methods after the calculations
converged in both energy and structure. In all cases this required 5
optimization cycles.
%'%.%
0-r, "..
r, -' ,' • , .,, , ", " , ,. _ . ., - .. , ."-- . .. .'.- . - .., .-.' ... .- .- . .- . . .. . .

tends to mi-inim-ize any detrimental effects of the Mulliken population analysis. In
addition, by allowiqng the point charge model to dynamically change in relation to its
environment, any effects or forces which are not entirely electrostatic by nature
appear to be accounted for. The only disadvantage of the iterative technique is the
amount of computation time required. With each run averaging 2,500 seconds and
up to 30 runs required, the iterative technique is fairly expensive. However, the
accurate results from these methods far outweigh their cost. The MF and IF
methods are clearly superior to the SF method used by Saebo and coworkers.
My study has shown that the IF method is particularly useful. Not only
0
does it allow calculations on molecules for which incomplete experimental
structures exist, but it also gave better results in my calculations based on the X-ray
data. T1he fact that the MF and IF X-ray structures are almost identical substantiates
the point charge model. T1he point charge model reproduces the deformation forces
which are present in the solid upon crystallization as shown by the IF method. In
the IF method, the point charges are initially positioned in the free molecule
geometry but they are subsequently adjusted to the newly calculated "free" molecule
geometry. Since the point charges eventually assume the approximate structure of
the crystal, the point charge model must essentially reproduce the forces present in
the crystal. Based on my results, both the MF and IF methods are superior to the
'U.
SF method and they allow much more flexibility in the model. Since both the IMF
and IF methods have been shown to give almost identical results, either method can
he used but the IF method should certainly be used in cases where the experimental
data is incomplete.
t omA major concern with the point charge model is the dependence of the
%.
U.'.,p+ SFmeho and thyalo uhmoefexblt inh moe. Sic- ohteM
i ndI mehd-aebe-hont ieams idntcarsuts eihe meho can
, beused bt theIF metod shuld cetainl be usdU incssweeteeprmna
calculated structure on the magnitude of the point charges. In order to investigate
* the dependance, I made several runs in which I varied only the magnitude of the
* point charges. The point charges were positioned according to the arrangement
found in the 100K neutron-diffraction study and the free molecule was optimized
inside these point charges as in the SF method. The results of those calculations
are shown in Table 3-7. In run #1 which uses the SE method, the magnitude of the
point charges was calculated from the experimental geometry. The net charges in
run #2 were calculated from the optimized free molecule. Run #2 is equivalent to
the SF results reported in Table 3-4. In run #3, I arbitrarily normalized the net
charges of the free molecule to the 02/02' net charge. Despite the difference in the
net charges which vary by up to 80%, the calculated geometries are extremely
similar. The maximum difference in bond lengths and bond angles is 0.02 Aand
2. 10, respectively, occurring only in run #3 with its extreme values of charge. I
conclude from these results that the structures calculated using the point charge
model are fairly insensitive to the magnitude of the point charges. Therefore, the
arbitrary assignment of net charge by the Mulliken population analysis has little
effect of the calculated structure.
t1,
S%%
.....
S-?-.
'5
-al4/- fudi h 0Knurndfrcin td n h remlcl a piie
Siq
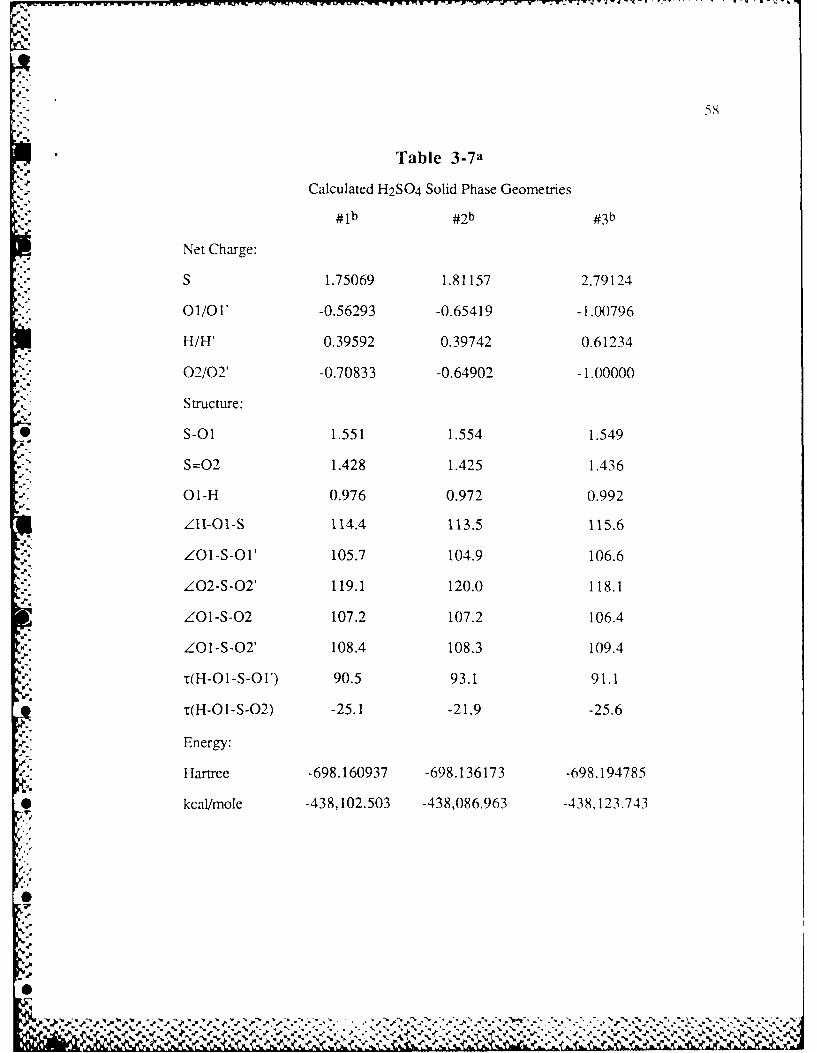
5 8
Table 3-.7a
Calculated H12S04 Solid Phase Geometries
#lb #b#3b
Net ChargTe:
S 1.75069 1.81157 2.79124
01/01, -0.56293 -0.65419 -1.00796
H/H' 0.39592 0.39742 0.61234
02/02' -0.70833 -0.64901 -1.00000
Structure:
*S-01 1.551 1.554 1.549
S=02 1.428 1.425 1.436
-,01-H 0.976 0.972 0.992
ZH-0l-S 114.4 113.5 115.6
z01-S-01' 105.7 104.9 106.6
Z02-S-02' 119.1 120.0 118.1
ZO1-S-02 107.2 107.2 106.4
-*ZO1-S-02' 108.4 108.3 109.4
T(H-01-S-01') 90.5 93.1 91.1
T(H-01-S-02) -25.1 -21.9 -25.6
Energy:
Hartree -698.160937 -698.136173 -698.194785
*kcal/mole -438,102.503 -438,086.963 -438,123.743
.......

FV VF TV V T.- 7 1 -.
a. Bond lengths in angstroms. Bond angles in degrees.
b. Geometry optimized at the 6-31G** level. The point charge locations are based
on the 10'K neutron-diffraction data. The magnitude of the point charges w.ere
obtained as explained in the text.
lo
.-
U'i
U-
ft
U.
I
A,
* 4UtU A A.U UK. ,''''
F.. I' .- 2 P-
v-r
Chapter Four
CONCLUSION
In this paper, I have presented a thorough ab initio study of sulfuric acid
and the point charge model. The point charge model has been shown to he
extremely advantageous in the calculation of crystal structures with few limitations.
In addition, I have presented a comprehensive review of various crystal field
simulation methods which have been used. In this chapter, the important results
from my study are summarized and my suggestions for future work are offered.
My calculations of the gas phase structure of H2 SO 4 show that the 6-31G**
basis set accurately reproduces the microwave structure. With few exceptions, the
calculated 6-31G** structure is within the experimental uncertainties of the
microwave study. The 4-31G** basis set gave a similar structure to the 6-3lG**
results with a substantial savings in computation time. My study has confirmed
that the use of displaced p functions to simulate d functions has essentially no effect
on the calculated structure. The only difference being in the total energy which is
less than 1 kcal/mole lower with the true d functions. The ab initio programs
TEXAS(D) and Gaussian-82 give identical results with the 6-31G** basis set tor
H2SO 4 as expected. My calculations confirm that polarization functions are
absolutely essential to reproduce torsional angles on oxygen.
My calculations of the crystal structure of -12SO4 demonstrate that the point
charge model accurately reproduces the structural trends which occur in
transforming from the gas to solid phase. My study of the point charge model
proves that it precisely simulates the deformation forces which are present in the
60

solid upon crystallization. During the course of my study, I discovered that the
only neutron-diffraction study of H2S0 4 is plagued by numerous errors, rendering
it totally useless.
The calculated crystal structures based on the X-ray diffraction study are iII
good agreement with the experiment. The major discrepancy is in the S-O single
bond length which is calculated about 0.03 A longer than in the X-ray study. After
a thorough investigation, I conclude that the discrepancy is due to a shifting of
electron density from the oxygen atom towards the sulfur atom, resulting in the
short experimental bond length.I
The iterative technique gives superior results to any of the single
optimization cycle methods. Even with the point charges arranged in the gas
"geometry, the point charge model gives almost identical structural results to those
calculations where the charges are positioned in the crystal structure. The point
charge model more than adequately describes the crystal forces, especially for
systems involving hydrogen bonding.
The iterative technique minimizes any possible drawbacks of the point
charge model. Any consequence of the arbitrary assignment of net charge by the
Mulliken population analysis is minimized by allowing the charges to vary. By
allowing the point charge model to dynamically change in relation to its
environment, any forces which are not electrostatic by nature appear to be
accounted for.I
Further evidence of the point charge model's ability to represent the crystal-I
environment is exhibited in the change in gross atomic population throughout the
iterative cycles. There is a definite shift of electron density from the bridging
I%-a P
'-, %j A*.*.
",A

. ."
hydrogens to the acceptor atoms (02/02'), identical to those found in other ab iMi1io
studies of dimers.
My study proves that the calculated crystal structures are Insensitive to the
magnitude of the point charges. I conclude that the arbitrary assignment of charge
by the Mulliken population analysis has a negligible effect on the point char e
model.
SUGGESTIONS FOR FUTURE WORK
The remainder of this chapter is a short presentation of areas that I feel need
further work.
Although the results of my study confirm the validity of the point charge
model, the only types of crystals that have been tested to date involve hydrogen
bonding. I strongly feel that further studies should be done on crystals bound
together by both ionic and covalent bonds.
A quantitative method needs to be developed to treat the shift of electron
density that frequently occurs in X-ray diffraction studies. Currently, no
quantitative method exists and bond lengths determined by X-ray diffraction are
. often reported shorter than their actual value. The development of such a method is
desperately needed to facilitate comparisons between calculated and experimental
crystal structures.
The problems that I have presented with the neutron-diffraction study of
H2SO 4 by Moodenbaugh and coworkers point to repeating that study. The new0,
study should incorporate the Yu and Mak data and be done on a single crystal if
possible. As a minimum, Moodenbaugh's data should be refined again u>in, the
heavy atom positions from the 1978 X-ray study and anisotropic temperature
PI . 4. No%
pr o.

63
factors. I expect that the results of a new neutron-diffraction study will confirm
that the S-0 single bond length is closer to my calculated value than the X-ray
" value.
After discussions with several crystallographers, they all feel that a present
day X-ray diffraction study of H2SO4 could locate the hydrogens. With the aid of
a crystallographer, I have unsuccessfully tried to refine the Yu and Mak data to
locate the hydrogens. Since no further knowledge can be gained from past X-ray
diffraction studies, I feel a new X-ray study should be completed. The positions of
the hydrogens, if located, can then be compared to the neutron-diffraction study to
establish its accuracy.
".% , .,,
,*p p
S.
A,
'l.A

Bibliography
1. A. Szabo and N. S. Ostlund, Modem Quantum Chemistry: Introduction to
Advanced Electronic Structure Theory, Macmillan Publishing Co., New York.
1980.
2. J. E. Boggs, unpublished work.
3. P. Pulay, Modem Theoretical Chemistry Vol. 4: Applications of Electronic
Structure Theory, ed. H. F. Schaefer, Plenum Press, New York, 1977.
4. J. E. Boggs and F. R. Cordell, J. Mol. Struct. (Theochem), 76, 329, (1981).
5. J. E. Boggs, J. Mol. Struct., 97, 1, (1983).
6. J. E. Boggs, J. Mol. Struct., 130, 31, (1985).
7. I. Hargittai and M. Hargittai, Molecular Structure and Energetics, Vol. 2, VCH
- Publishers, New York, 1986.
8. U. C. Singh and P. A. Kollman, J. Comput. Chem., 5, 129, (1984).
..:.+ 9. S. Saebo, B. Klewe, and S. Samdal, Chem. Phys. Lett., 97, 499, (1983).-10. W. J. Hehre, L. Radom, P. v. R. Schleyer, and J. A. Pople, Ab Initio
4Molecular Orbital Theory, John Wiley and Sons, New York, 1986.
11. J. E. Boggs, Phys. Chem. Minerals, 14, 407, (1987).
12. S. Saeb0 and P. Pulay, Chem. Phys. Lett., 113, 13, (1985).
13. J. E. Boggs, unpublished work.
14. P. Pulay, Theoret. Chim. Acta., 50, 299, (1979).
15. E. R. Davidson and D. Feller, Chem. Rev., 86, 681, (1986).
16. M. S. Gordon, J. S. Binkley, J. A. Pople, W. J. Hehre, J. Am. Chem. Soc.,
104, 2797, (1982).
64
A..C~ r...4 ~ e.-.
17. M. M. Franci, W. J. Pietro, W. J. Hehre, J. S. Binkley, M. S. Gordon, D. J.
DeFrees, and J. A. Pople, J. Chem. Phys., 77, 3654, (1982).
18. WV. J. Hehre, R. Ditchfield, and J. A. Pople, J. Chem. Phys., 56, 2257,
(1971).
19. R. Ditchfield, W. J. Hehre, and J. A. Pople, J. Chem. Phys., 54, 724,
(1974).
20. P. C. Hariharan and J. A. Pople, Theoret. Chim. Acta, 28, 213, (1973).
2 1. WV. J. Hehre and W. A. Lathan, J. Chem. Phys., 56, 5255, (1972).
S 22. P. C. Hariharan and J. A. Pople, Theoret. Chim. Acta, 28, 213, (1973).
23. J. B. Collins, P. v. R. Schleyer, J. S. Binkley, and J. A. Pople, J. Chem.
* Phys., 64, 5142, (1976).
24. P. Dauber and A. T. Hagler, Ace. Chem. Res., 13, 105, (1980).
25. A. Pullman, C. Zakrewska, and D. Perahia, Int. J. Quantum Chem., 16, 393,
(1979).
26. P. H. Smit, J. L. Derissen, and F. B. v. Duijneveldt, J. Chem. Phys., 67,
274, (1977) and references therein.
27. Z. Berkovitch-Yellin and L. Leiserowitz, J. Am. Chem. Soc., 102, 7677,
(1980).
28. R. Bonaccorsi, C. Petrongolo, E. Scrocco, and J. Tomasi, Theoret. Chim.
Acma, 20, 331, (1971).
29. J. Caillet, P. Claverie, and B. Pullman, T'heoret. Chim. Acta, 47, 17, (1978).
30. H. Berthod, A. Pillman, J. F. Hinton, and D. Harpool, Theoret. Chint Act,
57, 63, (1980).
31. F R. Cordell and J. E. Boggs, unpublished work.
I~ J. %
66
32. A. P. Cracknell, Crystals and their Structures, Pergarnon Press, New York,
1969.
33. F. R. Cordell, personal communication.
34. J. E. Boggs and Z. Niu, J. Comp. Chem., 6, 46, (1985).
35. R. L. Kuczkowski, R. D. Suenram, and F. J. Lovas, J. Am. Chem. Soc.,
103, 2561, (1981).
36. P. Yu and T.C. W. Mak, J. Crys. Mol. Struct., 8, 193, (1978).
37. A. R. Moodenbaugh, J. E. Hartt, J. J. Hurst, R. W. Youngblood, D. E. Cox.
and B. C. Frazer, Phys. Rev. B, 28, 3501, (1983).
38. C. Pascard-Billy, Acta Crystallogr., 18, 827, (1965).
39. S. M. Chackalackal and F. E. Stafford, J. Am. Chem. Soc., 88, 723, (1966).
40. P. M. Holland and A. W. Castleman Jr., Chem. Phys. Lett., 56, 511, (1978).
41. N. C. Baird and K. F. Taylor, J. Comput. Chem., 2, 225, (1981).
42. P. Kaliannan, S. Vishveshwara, and V. S. R. Rao, J. Mol. Struct.
[THEOCHEMI, 92, 7, (1983).
43. L. L. Lohr, J. Mole. Struct. [THEOCHEM, 87, 221, (1982).
44. GAUSSIAN-82, J. S. Binkley, M. J. Frisch, D. J. DeFrees, K.
Rahgavachari, R. A. Whiteside, H. B. Schlegel, E. M. Fluder, and J. A.
Pople, Dept. of Chemistry, Carnegie-Mellon University, Pittsburgh, PA, 1986.
'p. 45. GAUSSIAN-85, R. F. Hout, Jr., K. D. Dobbs, S. D. Kahn, M. M. Francl,
E. S. Blurock, W. J. Pietro, M. P. McGrath, R. Steckler, and W. J. Hehre.
46. R. Pascard, Compt. Rend. Acad. Sci. (Paris), 240, 2162, (1955).
47. Written by L.-K. Liu (1977) and modified by R. E. Davis (1984), Dept. of
Chemistry, University of Texas.
..b,. j- .;. 2 % d j . .. .. % ,,.\t, . , 2"J ,*,"- ," , .'-".. "-"."-"- "'I-'V V. *"-" . .- ".. ',

-5o.1
48. Written by D. R. Harris (1964), Biophysics Dept., Roswell Park Mem. Inst.
Modified by R. E. Davis (1979), Dept. of Chemistry, University of Texas.
49. T.-H. Tang and X.-Y. Fu, Int. J. Quant. Chem., 24, 317, (1983).
50. R. Rein and M. Shibata, "Intermolecular Forces", D. Reidel Publishiniz, 198 1.
51. T. Ottersen and H. H. Jensen, J. Mole. Struct., 26, 375, (1975).
52. 1. Hargittai, The Structure of Volatile Sulphur Compounds, D. Reidel
Publishing Co., 1985.
53. MOCALC, H. Sellers, University of Texas, 1980.
54. T. Ottersen and H. H. Jensen, J. Mole. Struct., 26, 355. (1975).
55. T. Ottersen, J. Mole. Struct., 26, 365, (1975).
% Sl

-yr -- - - ----N-r
Vita
Mark Alan McCormick was born in Wilmington, Ohio on 27 November
1958, the son of Alice Ruth (I lutchison) McCormick and Clifford Allen
S .cCorm.ick. After moving throughout Ohio, he graduated from Findlay Senior
11l-11 School, Findlay, Ohio in 1977. Ile was appointed by Congressman
Tennyson Guyer and entered the United States Naval Academy (Annapolis) in July
1977. Ile graduated with Distinction on 27 May 1981 and received the deg.ree of
Bachelor of Science. On the same day, he was commissioned an Ensign in the
United States Navy. After a personal interview with Admiral I lyman G. Rickover.
he was selected to enter the Naval Nuclear Power Program in the spring of 198 1.
Ensign McCormick was initially assigned TAD to the Naval Research
Laboratory (NRL) in Washington, D.C. After working in the Theoretical
* Chemistry Section at NRL for five months, he reported to the Naval Nuclear Power
- School (NPS) located in Orlando, Florida in November 1981. After graduating
near the top of his class, he reported to the S3G Naval Nuclear Prototype at
Ballston Spa, New York in May 1982. After qualifying as Engineering Officer of
the Watch (EOOW), he reported to the Submarine Officer's Basic Course (SOBC)
in New London, Connecticut. Ile graduated with Distinction from SOBC in March
1983.
Ensign McCormick reported to the Blue Crew of the USS Simon Bolivar
(SS BN-64 1), a Trident missile configured fleet ballistic missile submarine,
homeported in Charleston, South Carolina in April 1983. Ile completed three
strategic deterrent patrols and received his "Dolphins'"i September 1984. During"
that time, he served as the Main Propulsion Assistant (MPA), Chemistry and
%-.,
. "* .
, ' F
Radiological Controls Assistant (CRA), and Interior Communications Officer. In
February 1985, Lieutenant McCormick passed his Engineer's Exam and was
certified as an Engineering Officer of a Naval Nuclear Propulsion Plant. LT
-'McCormick then returned to the USS Simon Bolivar which had commenced a
nuclear refueling overhaul at the Portsmouth Naval Shipyard in Portsmouth, New
Hampshire. He remained onboard for ten months serving as the Refueling Officer
and Assistant Engineer. While assigned to the USS Simon Bolivar, LT
McCormick was awarded two Navy Achievement Medals and a Commander
Submarine Group SIX Commendation for his superior performance.
In January 1986, LT McCormick was ordered to the University of Texas
and entered the graduate program. After completing his Master of Arts degree, LT
McCormick will report to the Submarine Officers Advanced Course (SOAC) in
New London, Connecticut and will subsequently be assigned to a submarine as
either an Engineer or Navigator in Charleston, South Carolina.
Mark McCormick married Laura Lee Avrett on 26 November 1982 in
Tuscaloosa, Alabama. They are expecting their first child in January 1988.
Permanent address: 2117 N.E. 3rd Street
Boynton Beach, Florida 33435
0%,
1.V
S%

r~inan~m-, .m I " -& -k A. .- LV .7sC .by % jW w - N~- w - - e W-k- ~ ~ ~ ~ .VZWV
Fl
iLAefdD P