SUCCEEDING IN EMERGING MARKETS - NASBITE
71
SUCCEEDING IN EMERGING MARKETS Michael Pacurar Global Director, Trade & Government Raymond Clark Development Executive, Trade & Government
Transcript of SUCCEEDING IN EMERGING MARKETS - NASBITE

SUCCEEDING IN EMERGING MARKETS
Michael Pacurar
Global Director, Trade & Government
Raymond Clark
Development Executive, Trade & Government

PART I: WHY EMERGING MARKETS?
PART II: CHOOSING THE RIGHT MARKET

PART I: WHY EMERGING MARKETS?
INTRODUCTION
ASSESSING MARKET POTENTIAL
STRATEGIES FOR SUCCESS
CONCLUSION

PART I: WHY EMERGING MARKETS?
INTRODUCTION
ASSESSING MARKET POTENTIAL
STRATEGIES FOR SUCCESS
CONCLUSION

© Euromonitor International
5
Emerging markets still hold the key INTRODUCTION
Source: Euromonitor International from national statistics/OECD/IMF.

© Euromonitor International
6
Emerging markets still hold the key INTRODUCTION
Source: Euromonitor International from national statistics/OECD/IMF.

© Euromonitor International
7
Emerging markets still hold the key INTRODUCTION
Source: Euromonitor International from national statistics/OECD/IMF.

© Euromonitor International
8
Emerging markets still hold the key INTRODUCTION
Source: Euromonitor International from national statistics/OECD/IMF.

© Euromonitor International
9
What does this mean on the ground? INTRODUCTION
Source: Euromonitor International from national statistics/OECD/IMF.
Between 2013 and 2025 Emerging Markets Will See:

PART I: WHY EMERGING MARKETS?
INTRODUCTION
ASSESSING MARKET POTENTIAL
STRATEGIES FOR SUCCESS
CONCLUSION
© Euromonitor International
11
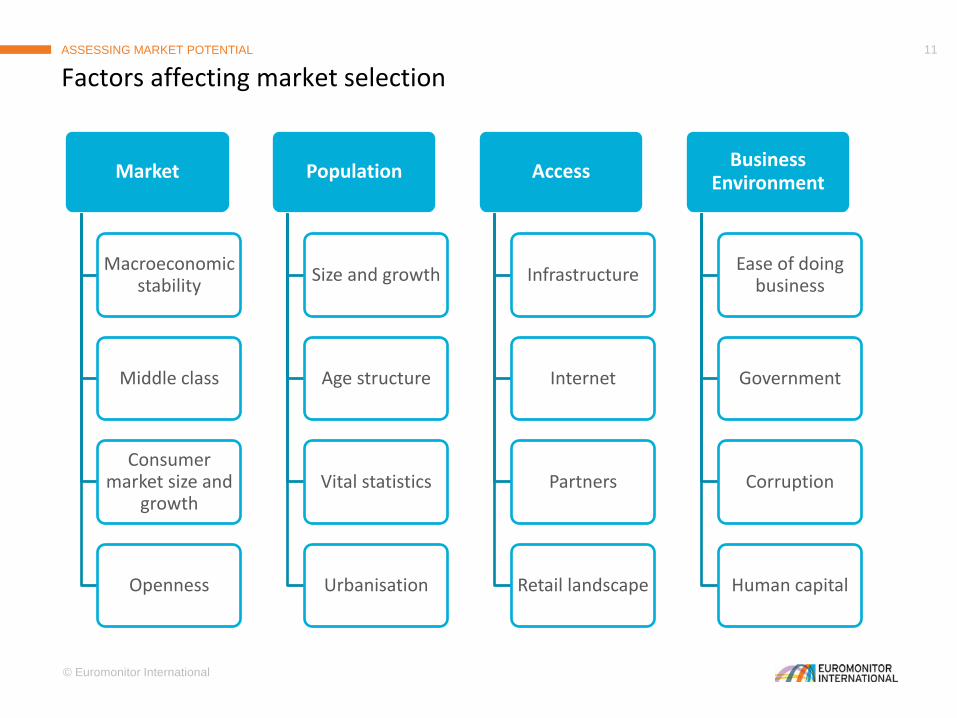
Market
Macroeconomic stability
Middle class
Consumer market size and
growth
Openness
Population
Size and growth
Age structure
Vital statistics
Urbanisation
Access
Infrastructure
Internet
Partners
Retail landscape
Business Environment
Ease of doing business
Government
Corruption
Human capital
Factors affecting market selection ASSESSING MARKET POTENTIAL

© Euromonitor International
12
Market
Macroeconomic stability
Middle class
Consumer market size and
growth
Openness
Population
Size and growth
Age structure
Vital statistics
Urbanisation
Access
Infrastructure
Internet
Partners
Retail landscape
Business Environment
Ease of doing business
Government
Corruption
Human capital
Factors affecting market selection ASSESSING MARKET POTENTIAL

© Euromonitor International
13
Market
Macroeconomic stability
Middle class
Consumer market size and
growth
Openness
Population
Size and growth
Age structure
Vital statistics
Urbanisation
Access
Infrastructure
Internet
Partners
Retail landscape
Business Environment
Ease of doing business
Government
Corruption
Human capital
Factors affecting market selection ASSESSING MARKET POTENTIAL

© Euromonitor International
14
Market
Macroeconomic stability
Middle class
Consumer market size and
growth
Openness
Population
Size and growth
Age structure
Vital statistics
Urbanisation
Access
Infrastructure
Internet
Partners
Retail landscape
Business Environment
Ease of doing business
Government
Corruption
Human capital
Factors affecting market selection ASSESSING MARKET POTENTIAL

© Euromonitor International
15
Market
Macroeconomic stability
Middle class
Consumer market size and
growth
Openness
Population
Size and growth
Age structure
Vital statistics
Urbanisation
Access
Infrastructure
Internet
Partners
Retail landscape
Business Environment
Ease of doing business
Government
Corruption
Human capital
Factors affecting market selection ASSESSING MARKET POTENTIAL

© Euromonitor International
16
Market
Macroeconomic stability
Middle class
Consumer market size and
growth
Openness
Population
Size and growth
Age structure
Vital statistics
Urbanisation
Access
Infrastructure
Internet
Partners
Retail landscape
Business Environment
Ease of doing business
Government
Corruption
Human capital
Factors affecting market selection ASSESSING MARKET POTENTIAL

© Euromonitor International
17
A granular strategy: Across countries
ASSESSING MARKET POTENTIAL
Source: Euromonitor International from national statistics/UN/OECD/IMF. Note: Data refer to a ranking of consumer expenditure growth in 120 major cities globally.

© Euromonitor International
18
A granular strategy: Across countries
ASSESSING MARKET POTENTIAL
• Chinese and Indian cities dominate the rankings of fastest-growing consumer markets
Source: Euromonitor International from national statistics/UN/OECD/IMF. Note: Data refer to a ranking of consumer expenditure growth in 120 major cities globally.
© Euromonitor International
19
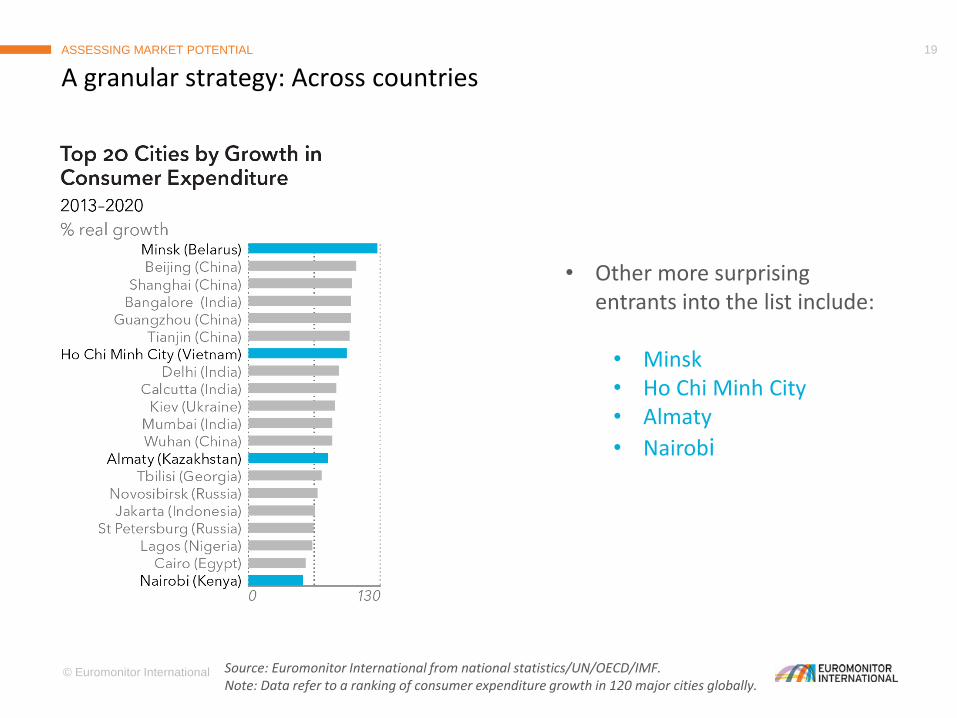
A granular strategy: Across countries
ASSESSING MARKET POTENTIAL
• Other more surprising entrants into the list include:
• Minsk • Ho Chi Minh City • Almaty
• Nairobi
Source: Euromonitor International from national statistics/UN/OECD/IMF. Note: Data refer to a ranking of consumer expenditure growth in 120 major cities globally.

© Euromonitor International
20
A granular strategy: Within a country ASSESSING MARKET POTENTIAL
Source: Euromonitor International from national statistics.

© Euromonitor International
21
A granular strategy: Within a country ASSESSING MARKET POTENTIAL
Source: Euromonitor International from national statistics.

© Euromonitor International
22
A granular strategy: Within a country ASSESSING MARKET POTENTIAL
Source: Euromonitor International from national statistics.

© Euromonitor International
23
Young, fast-growing populations
Rapid urbanisation
Strong economic growth Weak infrastructure
Corruption and poor governance
Widespread poverty
Frontier markets offer potential on a vast scale ASSESSING MARKET POTENTIAL
Opportunities
Challenges

PART I: WHY EMERGING MARKETS?
INTRODUCTION
ASSESSING MARKET POTENTIAL
STRATEGIES FOR SUCCESS
CONCLUSION

© Euromonitor International
25
Knowledge is power STRATEGIES FOR SUCCESS

© Euromonitor International
26
A tale of two markets STRATEGIES FOR SUCCESS
Source: Euromonitor International from national statistics. Note: All data refer to 2013.

© Euromonitor International
27
A tale of two markets STRATEGIES FOR SUCCESS
Source: Euromonitor International from national statistics. Note: All data refer to 2013.

© Euromonitor International
28
A tale of two markets STRATEGIES FOR SUCCESS
Source: Euromonitor International from national statistics. Note: All data refer to 2013.

PART I: WHY EMERGING MARKETS?
INTRODUCTION
ASSESSING MARKET POTENTIAL
STRATEGIES FOR SUCCESS
CONCLUSION

© Euromonitor International
30
Choose wisely – remembering the market, population, access and business environment factors affecting selection:
Look beyond the usual suspects
Think granular
Learn from others – winning strategies are based on knowledge:
Differentiate between and within markets
Localisation
Sales strategies
Price and features
Winning in emerging markets requires staying power CONCLUSION

PART I: WHY EMERGING MARKETS?
PART II: CHOOSING THE RIGHT MARKET

PART II: CHOOSING THE RIGHT MARKET
INTRODUCTION
MARKET
POPULATION
ACCESS
BUSINESS ENVIRONMENT
CONCLUSION

PART II: CHOOSING THE RIGHT MARKET
INTRODUCTION
MARKET
POPULATION
ACCESS
BUSINESS ENVIRONMENT
CONCLUSION

© Euromonitor International
34
The First and Most Important Step to Success
INTRODUCTION

© Euromonitor International
35
Market
Macroeconomic stability
Consumer market size and
growth
Middle class
Openness
Population
Size and growth
Age structure
Vital statistics
Urbanisation
Access
Infrastructure
Internet
Retail landscape
Partners
Business Environment
Ease of doing business
Regulations
Corruption
Human capital
Factors Affecting Market Selection
ASSESSING MARKET POTENTIAL

PART II: CHOOSING THE RIGHT MARKET
INTRODUCTION
MARKET
POPULATION
ACCESS
BUSINESS ENVIRONMENT
CONCLUSION

© Euromonitor International
37
Market
MARKET
Market
Macroeconomic stability
Consumer market size and
growth
Middle class
Openness
Is the country sizeable and stable
enough to do business in?
Are consumers/companies well-off
enough to buy my products and
services?
Is the potential growth of the market
attractive enough to offset any risk?
Are the conditions for foreign
businesses right?

© Euromonitor International
38
Macroeconomic Stability – Look Below the Surface
MARKET
Source: Euromonitor International from IMF/national statistics/OECD

© Euromonitor International
39
There is Usually a Trade-Off Between Size and Growth
MARKET
Source: Euromonitor International from IMF/national statistics/Eurostat/OECD

© Euromonitor International
40
- 50 100 150
Panama
China
Ghana
Qatar
Ethiopia
Sierra Leone
Turkmenistan
Mongolia
Macau
Nauru
Real % growth
There is Usually a Trade-Off Between Size and Growth
MARKET
The World’s Fastest-growing Economies: 2009-2014
Source: Euromonitor International from IMF/national statistics/Eurostat/OECD

© Euromonitor International
41
Openness is Central to Success
MARKET
Trade Investment New Ideas

© Euromonitor International
42
0
40
80
120
160
UAE MalaysiaThailand Poland Qatar SaudiArabia
Mexico Chile SouthAfrica
Turkey
% o
f G
DP
Openness is Central to Success
MARKET
Trade Investment New Ideas
Total Trade as % of GDP: 2014
Source: Euromonitor International from national statistics/OECD/IMF

© Euromonitor International
43
0.0
2.0
4.0
6.0
8.0
Chile Turkmenistan
% o
f G
DP
Chile Turkmenistan
Overall
Score
78.5 41.4
Investment
Freedom
90.0 0.0
Business
Freedom
69.3 30.0
Financial
Freedom
70.0 10.0
Openness is Central to Success
MARKET
Trade Investment New Ideas
Source: UNCTAD/2015 Index of Economic Freedom, The Heritage Foundation
Note: The index is based on 10 quantitative and qualitative factors, grouped into four broad categories of economic
freedom: rule of law; limited government, regulatory efficiency, and open markets.
FDI Inflows as % of GDP: 2013 Index of Economic Freedom: 2015

© Euromonitor International
44
0% 20% 40% 60% 80% 100%
China
Russia
Brazil
India
Agree
Neither agree nor disagree
Disagree
Openness is Crucial
MARKET
Percentage of Respondents who Describe Themselves as Liking to
Try New Products and Services: 2013
Source: Euromonitor International's Global Consumer Trends Survey 2013
Note: Between 1,800-2,000 consumers in each market are surveyed
Trade Investment New Ideas

IKEA CHINA
Local FLAVOUR
Granular STRATEGY

PART II: CHOOSING THE RIGHT MARKET
INTRODUCTION
MARKET
POPULATION
ACCESS
BUSINESS ENVIRONMENT
CONCLUSION

© Euromonitor International
47
Population Matters
POPULATION
Population
Size and growth
Age structure
Vital statistics
Urbanisation
Where do my target customers live?
Where will they live in the future?
Which age segment offers most
opportunities?
Is my target audience growing and will
it continue to do so?
Is it geographically dispersed or
concentrated?

© Euromonitor International
48
Size and Growth: India and China Compared
POPULATION
247 million increase in the Indian
population to 2030
India

© Euromonitor International
49
Size and Growth: India and China Compared
POPULATION
247 million increase in the Indian
population to 2030
50 million increase in the Chinese
population to 2030
Source: Euromonitor International from national statistics/UN
India
China

© Euromonitor International
50
-10 0 10 20 30 40
80+75-7970-7465-6960-6455-5950-5445-4940-4435-3930-3425-2920-2415-1910-14
5-90-4
Change in millions
9.4 million fewer children
aged 0-9 years in
2030
45%
35-54 year olds as
a % of total
population growth
Age Structure
POPULATION
Population Growth in India by Age Group: 2012-2030
Source: Euromonitor International from national statistics/UN

© Euromonitor International
51
Vital statistics - births, deaths and migration - are the building blocks of population
change.
Growth driven by migration leads to a different
demographic make-up to a population driven by
natural increase.
Life expectancy impacts consumption trends and
varies dramatically from region-to-region and even
within a region.
Life expectancy at birth in Nigeria in 2014: 53 years
Life expectancy at birth in Chile in 2014: 80 years
Vital Statistics Are…Vital!
POPULATION
Average Fertility
Rates 2014-2030
Population Change
2014-2030
Japan 1.6 -8%
UAE 1.6 +25%
Source: Euromonitor International from national statistics/UN

© Euromonitor International
52
0 20 40 60 80
Angola
Ghana
Côte d'Ivoire
Senegal
Mozambique
Tanzania
Ethiopia
Uganda
% of total population
0 20 40 60
Angola
Ghana
Côte d'Ivoire
Senegal
Mozambique
Tanzania
Ethiopia
Uganda
% of urban population
Urbanisation and City Configurations
POPULATION
Urbanisation in African
Markets of the Future: 2014
% of the Population Residing in the Largest
Cities in African Markets of the Future:
2014
Source: Euromonitor International from national statistics and
www.citypopulation.de

© Euromonitor International
53
Mexico City in Focus
POPULATION
Source: Euromonitor International from national statistics/OECD/IMF

© Euromonitor International
54
Mexico City in Focus
POPULATION
Source: Euromonitor International from national statistics/OECD/IMF

© Euromonitor International
55
Mexico City in Focus
POPULATION
Source: Euromonitor International from national statistics/OECD/IMF

PART II: CHOOSING THE RIGHT MARKET
INTRODUCTION
MARKET
POPULATION
ACCESS
BUSINESS ENVIRONMENT
CONCLUSION

© Euromonitor International
57
Access All Areas
ACCESS
Access
Infrastructure
Internet
Partners
Retail landscape
Will it be difficult to get products to market?
Are consumers easily accessible for sales,
marketing and promotional activities?
Would a local partner facilitate market
entry?
Is the retail landscape modern or
traditional?

© Euromonitor International
58
0
2,000
4,000
6,000
8,000
10,000
12,000
14,000
16,000
18,000
-
1.0
2.0
3.0
4.0
5.0
6.0
La
nd
are
a, ‘0
00
sq
. km
Qua
lity o
f in
fra
str
uctu
re, 0
-7
Quality of overall infrastructure Land area
Infrastructure Can Add Significant Costs
ACCESS
Quality of Infrastructure v Land Area: 2014-2015
Source: FAOSTAT/WEF Global Competitiveness Report 2014-2015.
Note: Quality of overall infrastructure is based on responses from an executive survey.
Respondents were asked ”How would you assess general infrastructure (e.g. transport,
telephony, and energy) in your country? 1 = extremely underdeveloped; 7 = well developed and
efficient by international standards.”
© Euromonitor International
59
0
2,000
4,000
6,000
8,000
10,000
12,000
14,000
16,000
18,000
-
1.0
2.0
3.0
4.0
5.0
6.0
La
nd
are
a, ‘0
00
sq
. km
Qua
lity o
f in
fra
str
uctu
re, 0
-7
Quality of overall infrastructure Land area
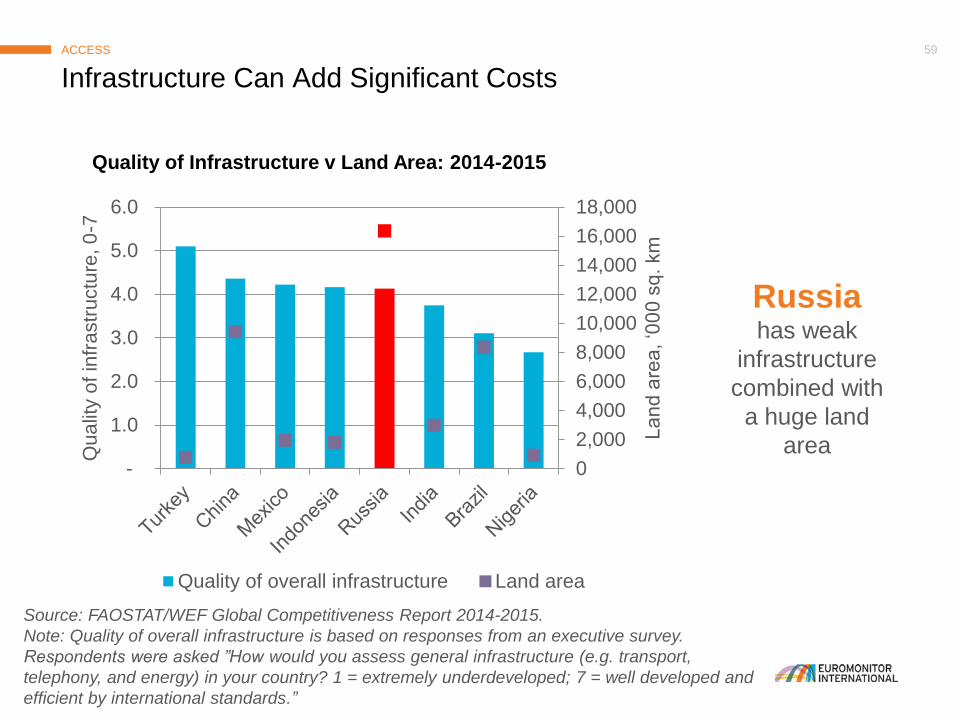
Infrastructure Can Add Significant Costs
ACCESS
Quality of Infrastructure v Land Area: 2014-2015
Russia has weak
infrastructure
combined with
a huge land
area
Source: FAOSTAT/WEF Global Competitiveness Report 2014-2015.
Note: Quality of overall infrastructure is based on responses from an executive survey.
Respondents were asked ”How would you assess general infrastructure (e.g. transport,
telephony, and energy) in your country? 1 = extremely underdeveloped; 7 = well developed and
efficient by international standards.”

© Euromonitor International
60
Sharing the Risks and Rewards
ACCESS
Tata Starbucks Ltd
• Launched in Mumbai and opened its
50th store in Chennai in July 2014
• In 2013, Tata Starbucks had a 2.2%
brand share in Chained Cafés/Bars,
way behind the market leader Café
Coffee Day
• Looking at moving into second and third
tier cities
• Its alliance with Tata has enabled it to
grow its business at a faster rate than
would otherwise have been the case
Go it alone Strategic
partnership Acquisition

© Euromonitor International
61
0
5
10
15
20
25
30
% o
f to
tal re
tail
sa
les fro
m to
p 5
re
taile
rs
The Nature of Retailing
ACCESS
Concentration of Retailing Sector in Selected
Emerging Asian Economies: 2014
• Modern v traditional
retail sector
• Distribution challenges:
• Micro-distributors
• Direct distribution
Source: Euromonitor International from trade sources

Colgate CAMEROON
Distribution THREE-WHEELED MOTORCYCLES
500% INCREASE IN DELIVERIES

PART II: CHOOSING THE RIGHT MARKET
INTRODUCTION
MARKET
POPULATION
ACCESS
BUSINESS ENVIRONMENT
CONCLUSION

© Euromonitor International
64
A Business Environment Fit for Purpose
BUSINESS ENVIRONMENT
Business Environment
Ease of doing business
Regulations
Corruption
Human capital
Is there a level playing field between
domestic and foreign investors?
Is the rule of law sufficient?
How can business beat corruption?

© Euromonitor International
65
Mexico ranks 39th of 189 economies
6 days to start a business
11 days to import
85 days to get electricity
Nigeria is ranked at 170th of 189 economies
28 days to start a business
33 days to import
260 days to get electricity
Easy Does it
BUSINESS ENVIRONMENT
Source: World Bank Doing Business

© Euromonitor International
66
Regulations can be an effective barrier to entry:
Financial cost
Reduced productivity
Opportunity cost
-0.8
-0.6
-0.4
-0.2
0.0
0.2
0.4
0.6
Mexico Turkey Brazil Indonesia China Russia India Nigeria
Regulatory Burden can be a Barrier to Entry
BUSINESS ENVIRONMENT
Regulatory Quality Index in BRIC and MINT: 2013
Source: World Bank
Note: Regulatory quality index captures perceptions of the ability of the government to
formulate and implement sound policies and regulations that permit and promote private
sector development. The index ranges between -2.5 and 2.5 with higher values
corresponding to better governance,

© Euromonitor International
67
Corruption has an impact on:
Economic growth
FDI inflows
Business risk
A two-fold impact on business:
Subdues market demand
Supresses economic development 0.0 2.0 4.0 6.0
Russia
Nigeria
Indonesia
Mexico
China
India
Brazil
Italy
Turkey
USA
Germany
Corruption Costs
BUSINESS ENVIRONMENT
Corruption Perceptions Index in
Selected Economies: 2014
Source: Transparency International
Note: perceptions of the degree of corruption as seen by
business people and country analysts, and ranges between
10 (highly clean) and 0 (highly corrupt).

PART II: CHOOSING THE RIGHT MARKET
INTRODUCTION
MARKET
POPULATION
ACCESS
BUSINESS ENVIRONMENT
CONCLUSION

© Euromonitor International
69
The four pillar model offers methodological clarity to emerging market selection:
The first pillar, market, incorporates the most fundamental concerns of any emerging
market strategy.
Many of the most important decisions that planners must make should be shaped by
the factors within the second pillar – population.
To Sum Up
CONCLUSION
The factors within the third pillar,
access, concern the realities of
market entry.
The fourth pillar, business
environment, incorporates the
practicalities of doing business.

© Euromonitor International
70
Can you afford not to be in emerging markets? CONCLUSION

THANK YOU FOR LISTENING
Michael Pacurar
Global Director, Trade & Government
Raymond Clark
Development Executive, Trade & Government
http://blog.euromonitor.com/economic-and-consumer-insight/