Suburban Residential Growth 2021-2025
40
Suburban Residential Growth 2021-2025 Monitoring growth and change series 21-0014831-9602
Transcript of Suburban Residential Growth 2021-2025
A
Suburban Residential Growth 2021-2025Monitoring growth and change series
21-0
0148
31-9
602

ii
Publishing Information
21-0014831-9602
Title Suburban Residential Growth 2021-2025
Author Calgary Growth Strategies Planning & Development
Status ISC: Unrestricted
Published Date October 2021
Additional Copies The City of Calgary Planning Services Centre, 3rd Floor, 800 Macleod Tr. S.E. P.O. Box 2100, Station M Calgary, AB T2P 2M5
Phone 311 or Outside of Calgary 403-268-5311
Web calgary.ca/geodemographics
Acknowledgements & Contacts This information update is prepared by an inter-departmental team
City of Calgary
Calgary Growth Strategies Matthew Sheldrake Carlie Ferguson Andrea Buttazoni Nazrul Islam
Fire Bruce McBride
Transportation Planning Travis Gaede
Water Resources Olga Abramovich
Creative Services Pat Wong
External Review
BILD Calgary Region
We are grateful for the contribution of BILD (Building Industry and Land Development) in preparing this document.
The City of Calgary provides this information in good faith but it provides no warranty, nor accepts any liability from any incorrect, incomplete or misleading information or its improper use. No part of this material may be reproduced or utilized in any form or by any means, electrical or mechanical, including photocopying, or transmitting or by an information storage or retrieval system, without acknowledgement of the Suburban Residential Growth Report 2021-2025.
© The City of Calgary, 2021

ii
Table of Contents
Executive Summary 1
1.0 Introduction 2
2.0 The Calgary market 3
3.0 Residential growth in new and actively developing suburban communities 4
Dwelling units and land forecast by sector 2021-2025 (May 2020-April 2025) 4
Dwelling units and land absorption by sector 2016-2020 7
4.0 Planned land supply 10
5.0 Sector profile 13
North sector 13
Northeast sector 17
East sector 20
Southeast sector 23
South sector 26
West sector 30
Northwest sector 33
6.0 Conclusion 36
Industry Comments 37

1ii
Executive Summary
The Suburban Residential Growth 2021-2025 report provides key information on the dynamics of Calgary’s suburban market (which includes actively developing and new communities) and specifically looks at existing land supply and forecasts for growth over the next five years. It provides an in depth analysis of the suburban areas broken down by sector including information on servicing status and requirements, near term forecasted growth patterns, total suburban planned land supply capacity and categories of the planned land supply: unfunded and unserviced land, funded land (budgeted to be serviced or growth management overlay removed), and serviced land.
This document relies upon housing growth forecasts provided by The City of Calgary’s Corporate Economics division, industry input, local area plans, and the goals outlined in the Municipal Development Plan. Estimates for housing and population for Calgary were produced in Spring 2020. The forecasts estimate that 50,500 dwelling units will be built between 2021-2025 averaging 10,100 dwelling units (4,300 single/semi and 5,800 multi) per year. Calgary’s population increase for the same period is estimated to be 85,700 people for an average of 17,140 people per year. More than 100 per cent of the forecasted population (88,800 people) and 64 per cent of the housing growth (32,350 units) is anticipated to be captured in new suburban development. This means developed areas of city are forecasted to lose around 3,100 people during the forecasted period.
Suburban areas continue to be the leading growth location for new housing and population in Calgary. Over the last five years, actively developing suburban communities have captured an average of 61 per cent of the city wide total units, absorbing 27,700 units (14,700 single/semi and 13,000 multi) or an average of 5,500 units per year. Forecasts for 2021-2025 estimate that 64 per cent of the city’s total dwelling units will be built in new and actively developing communities. This provides for 32,350 dwelling units (18,850 single/semi and 13,500 multi), averaging
6,500 dwelling units per year. On a sector basis, the Northeast, Southeast and North sectors are expected to capture the largest share of growth (68 per cent of suburban growth) considering market demand and land supply. The remaining 32 per cent is expected to be captured by the South, West, East and Northwest sectors.
The Municipal Development Plan identifies two major targets for new suburban areas. The first target aims to maintain up to a 15 year supply of Planned Land (area structure plans in place). The other is to ensure 3 to 5 years of serviced land exists and is available with City infrastructure capacity in place to accommodate development. Years of supply for suburban areas is determined by using average annual single/semi forecasts for the next five years against existing planned land supply and categories of the planned land supply.
Planned Land Supply: As of April 2020,the planned land supply (areas with an approved Area Structure Plan) is able to accommodate 196,000 dwelling units (104,000 single/semi and 92,000 multi) on 7,500 hectares of land. This can accommodate 555,000 people at full build-out and provides an estimated 23 to 32 years of land supply, considering single/semi dwelling units supply and forecasted demand. The planned land supply is broken down into three categories considering current servicing status and funding: unfunded and unserviced, funded and serviced.
Unfunded and Unserviced Land Supply: This category of planned land is not serviced and funding for the required infrastructure to allow development is not allocated under current budget. The unfunded and unserviced land supply has capacity for 62,400 dwelling units (39,400 single/semi and 23,000 multi) for 191,500 people and can provide 9 to 12 years of land supply.
Funded Land Supply (City of Calgary serviced land funding commitment): In the One Calgary (2019-2022) service plan and budget, funding was approved by Council for leading infrastructure and services that will help to increase serviced land supply in new communities and actively developing communities. The funded land supply is able to accommodate 66,700 dwelling units (39,000 single/ semi and 27,700 multi) to house 189,800 people. The funded land supply capacity can provide an estimated 9 to 12 years of land supply.
Serviced Land Supply: The serviced land supply has capacity for 66,300 dwelling units (25,400 single/semi and 40,900 multi) for 173,600 people and can provide 6 to 8 years of land supply.
The current level of serviced and funded land (approved under One Calgary 2019-2022 service plan and budget and expected to be available over the next five years) have capacity to address the market demand for the next 15-20 years, but capacity varies at sector level.

2
Annual updates to this report include:
� an inventory (existing and potential capacity) of Calgary’s growth capacity in suburban areas by sector,
� a review of current development activity around the city, by sector and community,
� a forecast of population and housing changes including potential residential land demand,
� an assessment of balance between existing serviced land capacity and expected demand.
This provides readers with:
� a common information base,
� a detailed yearly analysisof growth dynamics and opportunities,
� yearly inventory of the serviced land supply to assist in the evaluation of new service extensions.
1.0 Introduction
The Suburban Residential Growth Report provides comprehensive data and forward-looking information as it relates to land, unit, population capacity and forecasting in Calgary’s new and actively developing communities. The report relies upon data from a number of City of Calgary sources, including city-wide population and housing growth forecasts. Further, the report is informed by input from industry representatives who provide a market perspective which helps provide support for the City’s forecasts.
This report provides key information on the dynamics of growth in new and actively developing communities. The information provided here is used to assist in ensuring short-term (five years) growth capacity is supported by existing and planned municipal infrastructure investments (water, sanitary, storm, transportation and fire). It is used to examine the balance between residential land demand and supply over the coming five-year period. The intent is to identify whether a sufficient supply of readily developable land exists, in a variety of locations, to facilitate competitive land and housing markets while maintaining responsible fiscal management of City resources.
This report seeks to provide an accurate picture of recent suburban residential development inventory and activity, and forecasts estimated demand for the 2021-2025 period. The inventory is prepared in collaboration with City infrastructure departments, and is reviewed by BILD Calgary Region.
The report does not contain policy recommendations or explicit budget priorities; its contribution lies in providing a comprehensive information base to support planning, development and City investment decisions in the short-term.
The annual updates to this report include:
� land, unit and population inventoryas of April 2020 for the residential land supply;
� a review of historical and current suburban development activity innew suburban areas;
� housing, population and residentialland supply forecasts;
� an assessment of the balance between existing serviced land supply and expected demand; and
� a review of infrastructure extensions in geographic sectors.

32
2.0 The Calgary market
Population
The Calgary Economic Region (CER) held an estimated population of 1,655,000 in 2020 and is projected to increase by 130,000 people to 1,785,000 by 2025. Calgary’s population forecast for 2025 is 1,392,100 accounting for 79 per cent of the region’s total population, which would be an addition of 85,700 people.
Housing
The Calgary Metropolitan Area (CMA) added 9,200 new housing starts in 2020. As part of this, Calgary had 7,900 starts, which is 86 per cent of the region. Over the last five years Calgary averaged 85 per cent of the region’s new housing starts. Forecasts for the region estimate 62,200 total housing starts over the next five year and Calgary is expected to have 50,500 starts, 81 per cent of the regional share. For further understanding of the housing and population forecast dynamics please review Calgary & Region Economic Outlook 2021-2026 available on The City of Calgary web site.
Calgary and region population and housing
Historical Forecast
Measure 2016 2017 2018 2019 2020 2015-2020 2021 2022 2023 2024 2025 2021-2025 5 Year Average
Calgary Economic Region "CER"
Population 1,547,000 1,568,000 1,593,000 1,625,000 1,655,000 118,000 1,668,000 1,691,000 1,722,000 1,754,000 1,785,000 130,000 26,000
Housing Starts (CMA) 9,200 11,500 11,000 11,900 9,200 52,800 11,700 12,100 12,500 12,800 13,100 62,200 12,440
City of Calgary
Population 1,235,200 1,246,300 1,267,300 1,285,700 1,306,400 1,323,400 1,339,900 1,357,500 1,375,100 1,392,100
Annual Population Growth 4,200 11,200 21,000 18,400 21,000 75,800 17,000 16,500 17,600 17,600 17,000 85,700 17,140
Total Population Growth % 0.4% 0.9% 1.7% 1.5% 1.6% 1.3% 1.2% 1.3% 1.3% 1.2%
Net Migration -6,500 1,100 11,700 9,600 12,300 28,200 8,600 9,000 9,900 10,200 9,800 47,500 9,500
Natural Increase 10,700 10,100 9,300 8,800 8,700 47,600 8,400 7,500 7,700 7,400 7,200 38,200 7,640
Total Population Share of Region 80% 79% 80% 79% 79% 79% 79% 79% 79% 78% 78% 79%
Housing Starts 7,500 9,500 9,400 10,600 7,900 44,900 9,700 9,900 10,100 10,300 10,500 50,500 10,100
Regional Share of Housing Starts 82% 83% 85% 89% 86% 85% 83% 82% 81% 80% 80% 81%
Source: City of Calgary: Calgary & Region Economic Outlook 2021-2026, Alberta Government: Alberta Population Projections, 2021-2046

44
Forecast estimates of total units 2021-2025,City of Calgary and suburban sectors
3.0 Residential growth in new and actively developing suburban communities
Dwelling units and land forecast by sector 2021-2025 (May 2020-April 2025)
Over the next five years (May 2020– April 2025), the Southeast, Northeast and North sectors are estimated to see the most growth, followed by the South, West, East and Northwest sectors.
Forecasts for 2021-2025 estimate that 64 per cent of the city-wide total units will occur in new and actively developing communities. This provides for 32,350 units (6,470 units per year average). Total units combine both single/ semi and multi-residential forecasts. Forecasts of total units for new and actively developing community areas are dispersed amongst the seven sectors. It is estimated that 1,161 gross residential hectares of land would be required to accommodate these units or 232 hectares per year on average. Map 1 and table below display the growth forecast for 2021-2025.
On a sector basis, the total units forecasts (single/semi and multi-residential) suggest the Southeast, Northeast and North will capture major suburban share of the growth, each capturing 23 per cent of the sectoral share. The South sector is expected to capture 21 per cent, the East and the West sector to capture 4 per cent each, whereas the Northwest is expected to capture 2 per cent of the share.
The South is expected to increase sectoral share beyond the forecast period as the sector has the highest number of actively developing communities at different stages of development. The East sector may also see an increase in the share with introduction of new communities after the forecast period.
Over the next five years, suburban housing starts are expected to be 6,500 units per year, which is 18 per cent higher than last five years annual average of 5,500 units
90 per cent of the suburban housing growth is expected in Northeast, North, Southeast and South sector.
3,770 single/semi units are expected on average over the next five years, compared to last five year average of 2,940 units.
Year 2021 2022 2023 2024 2025 2021-2025 Yearly Average
City-Wide Forecast (Total Units) 9,700 9,900 10,100 10,300 10,500 50,500 10,100
Total Units - Forecast Estimates for Growth into New Suburban Communities
Sector Average Historical Share 2021 2022 2023 2024 2025 Forecast Share 2020-2025
5 year 2 year Units % Units Pop Hectares
NORTH 24% 24% 1,600 1,500 1,390 1,410 1,400 23% 7,300 18,607 242
NORTHEAST 29% 26% 1,200 1,530 1,500 1,490 1,620 23% 7,340 20,797 258
EAST 0% 0% 30 140 330 370 490 4% 1,360 4,007 62
SOUTHEAST 25% 23% 1,490 1,530 1,440 1,480 1,440 23% 7,380 19,965 270
SOUTH 16% 19% 1,250 1,300 1,390 1,420 1,510 21% 6,870 19,544 250
WEST 6% 7% 290 300 310 280 220 4% 1,400 3,675 56
NORTHWEST 0% 0% 50 110 160 190 190 2% 700 2,228 21
TOTAL 100% 100% 5,910 6,410 6,520 6,640 6,870 100% 32,350 88,823 1,161
Average number of total units and land needs to new suburban communities each year = 6,470 17,765 232
SHARE of city total units 60% 60% 61% 65% 65% 64% 65% 64%
Source: City of Calgary: Planning & Development, Calgary & Region Economic Outlook 2021-2026

Uni
ts
0
100
200
300
400
500
600
700
800
900
1000
1100
NORTHWESTWESTSOUTHSOUTHEASTEASTNORTHEASTNORTH
20252024202320222021
760760
1010
30
720
120
30
820
890
110
820 820
170
90
800850
190
800870
170110
820 840
230
840900
140 140
840800
320
860 880
160 140
N NE E SE S W NW N NE E SE S W NW N NE E SE S W NW N NE E SE S W NW N NE E SE S W NW
Uni
ts
0
100
200
300
400
500
600
700
800
900
1000
1100
NORTHWESTWESTSOUTHSOUTHEASTEASTNORTHEASTNORTH
20252024202320222021
770840
20
190
0
490
170
680640
30
710
480
130
20
590650
140
640
520
140
50
590650
140
640
520
140
50
560
820
170
630
60 50
580
N NE E SE S W NW N NE E SE S W NW N NE E SE S W NW N NE E SE S W NW N NE E SE S W NW
544
Figure 1: Forecast estimates of single/semi units 2021-2025, City of Calgary and suburban sectors
Figure 2: Forecast estimates of multi units 2021-2025, City of Calgary and suburban sectors

SE
NW
W
N
E
NE
S
C
THS
CRM
SGH
LEB
NOL
CPF
HSD
LEG
MAH
SAD
HKS
RVW
ALP
EVN
GLR
SPH
SVO
WAL
LIV
YKV
BVD
WSP
BLM
ASP
HSN
SETCRA
KCA SKR
CSC
CARABT
RSNCNS
PCK
WWO
Forecast Estimates assume:Total Unit Growth: 32,350(6,470 units per year average)(3,770 single/semi and2,700 multi-units)
Population Growth: 88,823(17,765 people per year average)
Land Needs: 1,161 hectares(232 hectares per year average)
Northeast SectorUnits: 7,340 23%Population: 20,797Land: 258 ha
Northwest SectorUnits: 700 2%Population: 2,228Land: 21 ha
North SectorUnits: 7300 23%Population: 18,607Land: 242 ha
West SectorUnits: 1,400 4% Population: 3,675Land: 56 ha
South SectorUnits: 6,870 21%Population: 19,544Land: 250 ha
Southeast SectorUnits: 7,380 23%Population: 19,965Land: 270 ha
East SectorUnits: 1360 4%Population: 4,007Land: 62 ha
If these lands do not develop in the fiveyear time frame it should be assumedthat the partially serviced/unservicedlands shown in light blue would beutilized in other areas of the sector forwhich they are located. Forecasts shown are intended to show a generaldevelopment pattern of where growth may likely occur using today’sassumptions.
As with any forecast growth locations should be considered as possible growthdirections. Actual locations may and do vary and the specific timing ofdevelopment is not certain. These growth forecasts show physical locationsbut are not intended to act as targets for the sector nor meant to show exact
Funding of city-sizeinfrustructure for thepartially/unserviced is identifiedin blue under One Calgary(2019-2022) servicing plan andbudget and developer isresponsible for developer-sizeinfrustructure.
LegendAreas within approved AreaStructure Plan & serviced
Transportation/Utility Corridor
City Limits
These areas are partially serviced/unserviced as of 2020 December
66
Map 1: New suburban areas growth forecasts 2021-2025 (five years)
766
Dwelling units and land absorption by sector 2016-2020
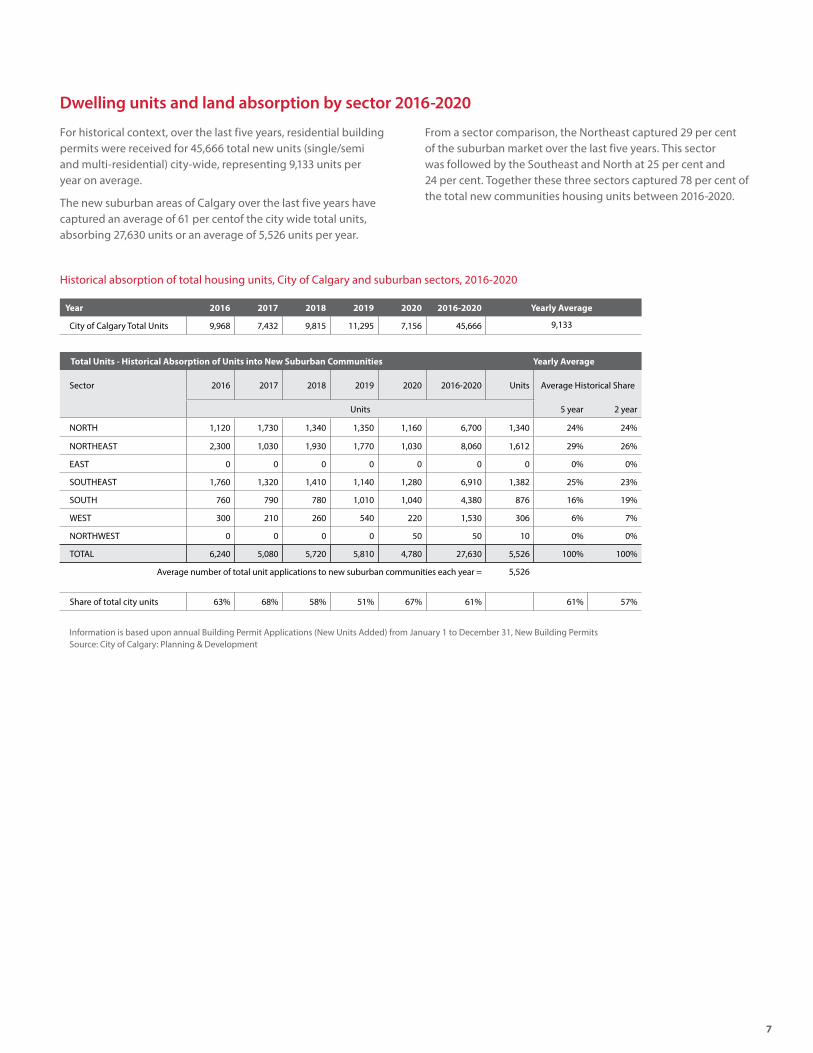
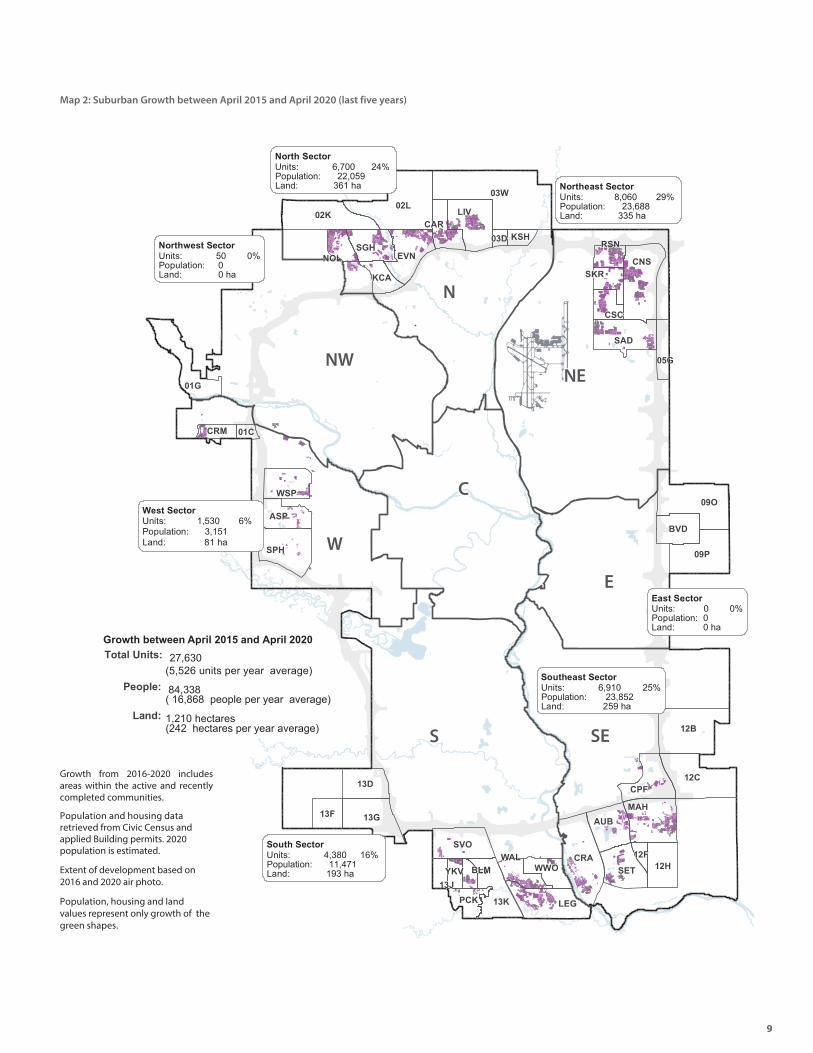
For historical context, over the last five years, residential building permits were received for 45,666 total new units (single/semi and multi-residential) city-wide, representing 9,133 units per year on average.
The new suburban areas of Calgary over the last five years have captured an average of 61 per centof the city wide total units, absorbing 27,630 units or an average of 5,526 units per year.
From a sector comparison, the Northeast captured 29 per cent of the suburban market over the last five years. This sector was followed by the Southeast and North at 25 per cent and 24 per cent. Together these three sectors captured 78 per cent of the total new communities housing units between 2016-2020.
Historical absorption of total housing units, City of Calgary and suburban sectors, 2016-2020
Year 2016 2017 2018 2019 2020 2016-2020 Yearly Average
City of Calgary Total Units 9,968 7,432 9,815 11,295 7,156 45,666 9,133
Information is based upon annual Building Permit Applications (New Units Added) from January 1 to December 31, New Building Permits Source: City of Calgary: Planning & Development
Total Units - Historical Absorption of Units into New Suburban Communities Yearly Average
Sector 2016 2017 2018 2019 2020 2016-2020 Units Average Historical Share
Units 5 year 2 year
NORTH 1,120 1,730 1,340 1,350 1,160 6,700 1,340 24% 24%
NORTHEAST 2,300 1,030 1,930 1,770 1,030 8,060 1,612 29% 26%
EAST 0 0 0 0 0 0 0 0% 0%
SOUTHEAST 1,760 1,320 1,410 1,140 1,280 6,910 1,382 25% 23%
SOUTH 760 790 780 1,010 1,040 4,380 876 16% 19%
WEST 300 210 260 540 220 1,530 306 6% 7%
NORTHWEST 0 0 0 0 50 50 10 0% 0%
TOTAL 6,240 5,080 5,720 5,810 4,780 27,630 5,526 100% 100%
Average number of total unit applications to new suburban communities each year = 5,526
Share of total city units 63% 68% 58% 51% 67% 61% 61% 57%
Uni
ts
0
100
200
300
400
500
600
700
800
900
1000
1100
NORTHWESTWESTSOUTHSOUTHEASTEASTNORTHEASTNORTH
20252024202320222021
770730
840
0
350
100
0
1080
800
0
670
470
190
0
830
700
0
620
430
230
0
820850
0
580 600
160
0
680
880
0
540600
120
30N NE E SE S W NW N NE E SE S W NW N NE E SE S W NW N NE E SE S W NW N NE E SE S W NW
Uni
ts
N NE E SE S W NW N NE E SE S W NW N NE E SE S W NW N NE E SE S W NW N NE E SE S W NW0
100
200
300
400
500
600
700
800
900
1000
1100
1200
1300
1400
1500
NORTHWESTWESTSOUTHSOUTHEASTEASTNORTHEASTNORTH
20202019201820172016
990
390
1460
0
410
200
0
650650
230
0
320
20 0
790
510
1230
0
350
30 0
560530
920
0
410380
0
740
480
150
0
440
100
20
88
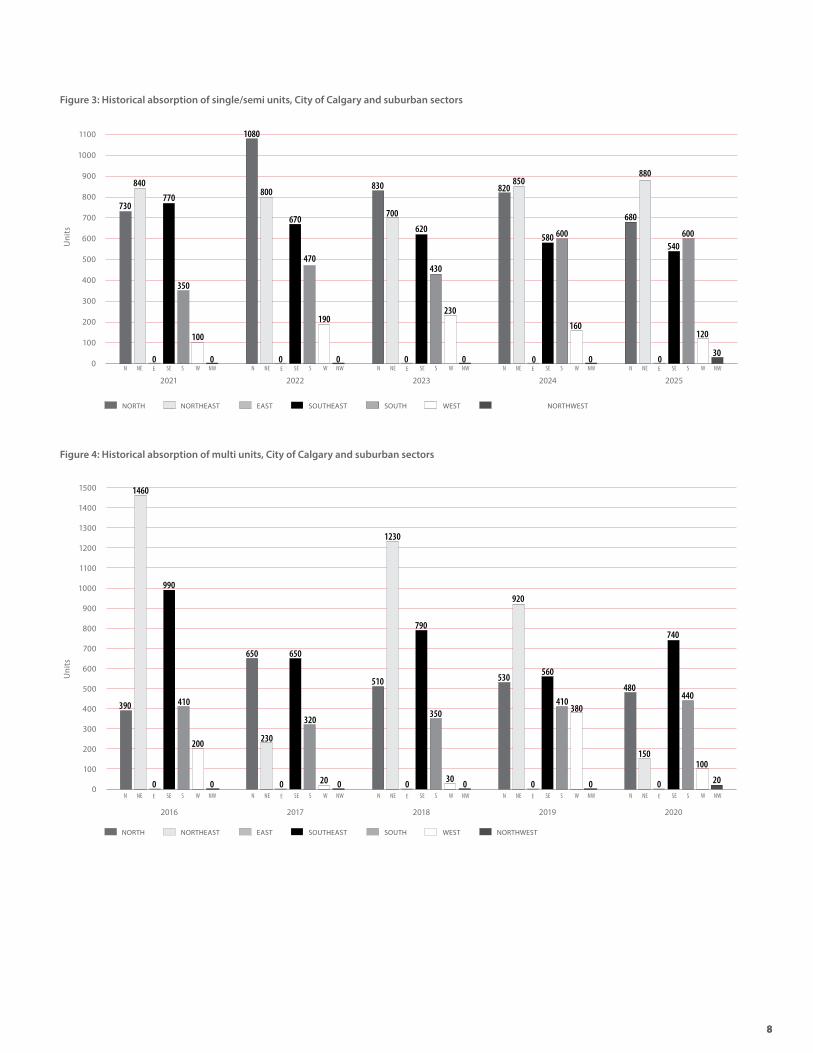
Figure 3: Historical absorption of single/semi units, City of Calgary and suburban sectors
Figure 4: Historical absorption of multi units, City of Calgary and suburban sectors
SE
NW
W
N
E
NE
S
C
13J
09P
01C
09O
13K
05G
WWOBLM
03W
KSH
MAHAUB
12HSET
BVD
CRA
03D
12F
WSP
EVN
13G
LEG
SPH
WAL
LIV
RSN
13F
SKR
12B
CRM
SGH
01G
ASP
SAD
KCA
CSC
CNS
CAR
13D12C
NOL
CPF
02L
YKV
PCK
02K
SVO
Northwest SectorUnits: 0 0%Population: 0Land: 0 ha
West SectorUnits: 1,530 % Population: 3,151Land: 81 ha
Northeast SectorUnits: 2 %Population: 2Land: 335 ha
East SectorUnits: 0 0%Population: 0Land: 0 ha
Southeast SectorUnits: 25%Population: 23,Land: 259 ha
South SectorUnits: 1 %Population: 11,Land: 193 ha
North SectorUnits: 2 %Population: 2Land: 361 ha
People:
Land:
Growth between April 2015 and April 2020 Total Units: 27,630
(5,526 units per year average)
84,338 ( 16,868 people per year average)
1,210 hectares(242 hectares per year average)
9
Map 2: Suburban Growth between April 2015 and April 2020 (last five years)
Growth from includes areas within the active and recently completed communities.
Population housing data retrieved from Civic Census
Extent of development based on 201 and 20 air photo.
Population, housing and land values represent only growth of the green shapes.
10
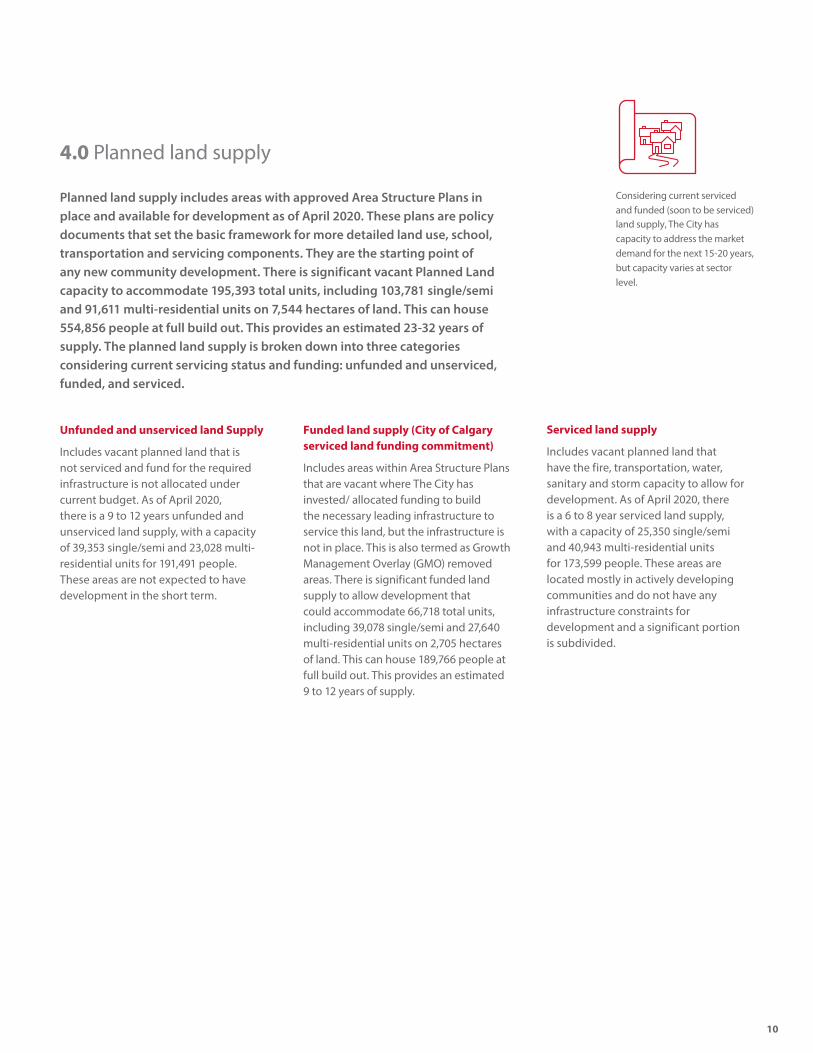
4.0 Planned land supply
Planned land supply includes areas with approved Area Structure Plans in place and available for development as of April 2020. These plans are policy documents that set the basic framework for more detailed land use, school, transportation and servicing components. They are the starting point of any new community development. There is significant vacant Planned Land capacity to accommodate 195,393 total units, including 103,781 single/semi and 91,611 multi-residential units on 7,544 hectares of land. This can house 554,856 people at full build out. This provides an estimated 23-32 years of supply. The planned land supply is broken down into three categories considering current servicing status and funding: unfunded and unserviced, funded, and serviced.
Unfunded and unserviced land Supply
Includes vacant planned land that is not serviced and fund for the required infrastructure is not allocated under current budget. As of April 2020, there is a 9 to 12 years unfunded and unserviced land supply, with a capacity of 39,353 single/semi and 23,028 multi-residential units for 191,491 people. These areas are not expected to have development in the short term.
Funded land supply (City of Calgary serviced land funding commitment)
Includes areas within Area Structure Plans that are vacant where The City has invested/ allocated funding to build the necessary leading infrastructure to service this land, but the infrastructure is not in place. This is also termed as Growth Management Overlay (GMO) removed areas. There is significant funded land supply to allow development that could accommodate 66,718 total units, including 39,078 single/semi and 27,640 multi-residential units on 2,705 hectares of land. This can house 189,766 people at full build out. This provides an estimated 9 to 12 years of supply.
Considering current serviced and funded (soon to be serviced) land supply, The City has capacity to address the market demand for the next 15-20 years, but capacity varies at sector level.
Serviced land supply
Includes vacant planned land that have the fire, transportation, water, sanitary and storm capacity to allow for development. As of April 2020, there is a 6 to 8 year serviced land supply, with a capacity of 25,350 single/semi and 40,943 multi-residential units for 173,599 people. These areas are located mostly in actively developing communities and do not have any infrastructure constraints for development and a significant portion is subdivided.

1110
Land supply capacity in new suburban areas: unfunded and unserviced, funded and serviced land as of April 2020
Total Planned Land Supply [A+B+C]Years of
Supply (total planned land) Unfunded and Unserviced [A]
Years of Supply (unfunded and
unserviced)(serviced and unserviced)
SuburbanSector
Single/Semi Multi Total Total Population Growth Single/Semi Multi Total Total Population Growth
Units Ha Units Ha Units Ha Capacity High Low Units Ha Units Ha Units Ha Capacity High Low
NORTH 27,995 1,621 27,687 372 55,682 1,994 158,899 29 41 10,464 653 6,923 151 17,387 803 55,365 11 15
NORTHEAST 10,166 524 8,948 125 19,114 648 53,233 10 14 74 19 49 17 123 36 352 0 0
EAST 11,869 749 8,137 179 20,006 928 62,429 56 79 9,715 611 4,633 116 14,348 726 47,612 40 57
SOUTHEAST 23,781 1,389 16,207 277 39,989 1,666 114,135 25 35 9,091 536 4,651 102 13,742 638 40,232 9 13
SOUTH 21,877 1,369 19,383 314 41,260 1,683 114,707 22 30 5,723 411 3,215 71 8,938 482 25,958 6 8
WEST 4,461 300 9,601 126 14,062 426 35,843 24 35 2,925 173 2,650 50 5,575 223 15,483 16 23
NORTHWEST 3,631 167 1,649 32 5,280 199 15,610 30 42 1,362 74 907 20 2,269 93 6,490 6 8
TOTAL 103,781 6,119 91,611 1,424 195,393 7,544 554,856 23 32 39,353 2,476 23,028 526 62,382 3,002 191,491 9 12
Funded Land Supply [B] Years of Supply (funded land)
Serviced SupplyYears of
Supply (total planned land)(expected to be serviced by 2022) Subdivided and unsubdivided [C]
SuburbanSector
Single/Semi Multi Total Population Growth Single/Semi Multi Total Population Growth
Units Ha Units Ha Units Ha Capacity High Low Units Ha Units Ha Units Ha Capacity High Low
NORTH 14,510 840 10,954 147 25,464 988 71,983 15 21 3,021 128 9,810 74 12,831 203 31,551 3 4
NORTHEAST 4,306 222 2,441 34 6,747 256 19,580 4 6 5,786 283 6,458 74 12,244 356 33,301 5 8
EAST 1,890 119 2,349 52 4,239 171 11,405 9 13 264 19 1,155 12 1,419 31 3,412 1 2
SOUTHEAST 7,913 462 4,393 75 12,306 537 35,777 8 12 6,778 391 7,163 100 13,941 491 38,126 7 10
SOUTH 9,019 564 7,073 115 16,092 679 45,323 9 13 7,136 393 9,094 128 16,230 521 43,426 7 10
WEST 0 0 0 0 0 0 0 0 0 1,536 127 6,951 76 8,487 203 20,361 8 12
NORTHWEST 1,440 66 430 8 1,870 75 5,698 12 17 829 27 312 4 1,141 31 3,422 7 10
TOTAL 39,078 2,274 27,640 431 66,718 2,705 189,766 9 12 25,350 1,369 40,943 467 66,293 1,836 173,599 6 8

THS
CRM
SGH
LEB
NOL
CPF
HSD
LEG
MAH
SAD
HKS
RVW
ALP
EVN
GLR
SPH
SVO
WAL
LIV
YKV
BVD
WSP
BLM
ASP
HSN
SETCRA
KCA SKR
CSC
CAR
ABT
RSNCNS
PCK
WWO
Legend
Funded Land Supply (GMO Removed Areas)
City Limits
Transportation/Utility Corridor
Serviced Land Supply
! ! ! ! ! !
! ! ! ! ! !
! ! ! ! ! ! New communities
Actively Developing Communities
Unfunded and Unserviced
Note: A community that did not have a house built as of April 2020 is identified as new communities.
1212
Map 3: Land supply in new suburban areas as of April 2020

131212
5.0 Sector profile
Part 5 provides a summary by suburban planning sector, to supplement Part 3 (forecasts) and Part 4 (land supply). It also provides supply information for the 36 actively developing communities and new communities, and Area Structure Plans.
North sector
Historical absorption 2016-2020
Actively developing and recently completed communities in the North sector accounted for an average of 24 per cent of total suburban unit growth between 2016 and 2020, adding 6,700 total units (1,340 units per year average).
Existing supply
The capacity of the North sector’s vacant land is determined by three measures: planned, funded and serviced land supply. The planned land supply has capacity for 55,682 total units (27,995 single/semi and 27,687 multi units) on 1,994 hectares, able to accommodate an estimated 158,899 people. Servicing status and infrastructure requirements as of December 2020 are provided in table below and Map 4 for the planned land. Areas considered funded (GMO removed areas) make up 988 hectares which can hold an estimated 25,464 total units (14,510 single/semi and 10,954 multi units) and 71,983 people. Of the planned land, 203 hectares exist that are considered serviced, which can hold an estimated 12,831 total units (3,021 single/semi and 9,810 multi units) and 31,551 people. The funded and serviced land supply capacity can provide an estimated 18 to 25 years of land supply.
Currently in the North sector there are nine actively developing and new communities: Nolan Hill, Sage Hill, Evanston, Kincora, Livingston, Carrington, Lewisburg, Ambleton and Glacier Ridge. The nine communities are at various stages of build out. Of the nine communities, four communities (Nolan Hill, Sage Hill, Kincora and Evanston) are close to full build-out, two communities (Carrington and Livingston) are actively developing and the remaining three communities are at the early stage of development.
Forecasts for 2021-2025
Forecasts for 2021-2025 are estimating growth of 4,040 single/ semi units (21 per cent) of the new suburban single/semi total, averaging 808 units per year. While multi units are unpredictable to forecast, estimates for the next five years are for 24 per cent or 3,260 units, averaging 652 units per year.
North Sector demand-supply balance sheet
Figure 5: North sector single/semi capacity of new suburban communities and Area Structure Plans (ASP)
Dwelling Type
Serviced land Capacity as of
April 2020
Additional Funded Future Capacity (One Calgary 2019-2022 service
plan and budget)Total Supply
(Serviced + Funded)Forecast
(2021-2025)Surplus (Shortfall) End of April 2025
Supply end of April 2025
Years of Supply End of April 2025
Single/Semi 3,021 14,510 17,531 4,040 13,491 13,491 13 to 20
Multi 9,810 10,954 20,764 3,260 17,504 17,504 22 to 32
0 1000 2000 3000 4000 5000 6000 7000 8000 9000
PARTIALLY / UNSERVICED LAND CAPACITYFUNDED LAND CAPACITYSERVICED LAND CAPACITYEXISTING 2019 UNITS
Nolan Hill
Sage Hill
Kincora
Evanston
Carrington
Livingston
Lewisburg
Ambleton
Glacier Ridge
Glacier Ridge ASP Reminder
Nose Creek ASP Reminder
121,839
2841,814
1,384
1,138
572
1,022
5,091
1,122
8,422
1,977
6,074
1,751648
994
1264,796
771,568

14
North sectorFire, transportation and major utility (water, sanitary, storm) infrastructure requirements
Carrington, Livingston, Ambleton, Lewisburg
Water:
A large majority of the Spy Hill East Pressure Zone can be serviced by the North Ridge Feedermain Phase 1 infrastructure project, which is built and is expected to be in operation by December 2021. The ultimate water servicing solution for the Spy Hill East pressure zone includes the North Ridge Reservoir, the North Ridge Feedermain Phase 2 and the North Ridge West Leg Feedermain, as per the approved Keystone Hills ASP. Carrington and Livingston north of 144 Avenue NW require the North Ridge Feedermain Phase 1 for further development. Lands east of 6 Street NE will be serviced off of the existing Airdrie 900 mm feedermain now that the meter chamber has been relocated to the City limit. Initial low density development in Lewisburg, starting form the south, can proceed with two ties - one south, connecting with Stoney Trail system and one east, through Melcor lands on east side of 11 Street NE (which connects to 900 mm Feedermain). Ultimate development in Lewisburg will require third feed via adjacent development.
Sanitary:Lands north of 152 Ave N in the northeast of the Keystone ASP require additional City-funded infrastructure (East Keystone Sanitary Trunk Extension) for the rest of Keystone to develop. Alignment right-of-ways need to be preserved north of 144 AV N for these future mains. Ambleton will need a sanitary trunk for their ultimate servicing. Limited initial phases can develop with interim servicing.
Storm:The West Basin is serviced by the existing 1200mm North Beddington Storm Trunk along 144 Avenue NW, just east of 14 Street NW, which drains to Beddington Creek. The future 144 Avenue NE Storm Trunk and outfall, located east of 6 Street NE, will service the east basin which drains to Nose Creek. This stormwater infrastructure is to be constructed in this budget cycle, 2019-2022.
Transportation:
Skeletal Road network required to support full development: new interchanges along Stoney Trail at 14 Street NW and 11 Street NE that provide for all movements; upgrade of Centre Street/Harvest Hills Boulevard NE interchange on Stoney Trail to full build-out (partial interchange in-place providing all movement connections to Stoney Trail); upgrade of 160 Avenue NE interchange at QEII Highway (connection to and from the west required, including fly-over); upgrade of Stoney Trail.
Arterial Street network required to support full development: 144 Avenue N, 160 Avenue N, 14 Street NW, Centre Street N, 6 Street NE, 11 Street NE, and 15 Street NE.
Completion of Transit network, including the north central segment of Green Line Light-Rail-Transit
Fire:Previously unserviced areas of the Keystone Hills ASP including, Carrington, Livingston, and Lewisburg will have fire coverage via an Emergency Response Station that has been included in the One Calgary (2019-2022) service plan and budget.
Glacier Ridge ASP
Water:
The Glacier Ridge ASP contains 4 pressure zones. A large majority of the Spy Hill East Pressure Zone will be serviced by the North Ridge Feedermain Phase 1, which is built and is expected to be in operation by December. The ultimate water servicing solution for the Spy Hill East Pressure Zone includes the future North Ridge Reservoir, the North Ridge Feedermain Phase 2 and the North Ridge West Leg Feedermain. The Big Hill East and Top Hill Pressure Zones are currently serviced by The City, and require extensions of the distribution networks from the Shaganappi Feedermain and the Top Hill distribution network. The Nose Hill East Pressure Zone requires a new pump station, to be located near the Big Hill East Reservoir. A 400mm extension from the community of Evanston to create a looped system is required for the areas on the east to develop.
Sanitary:
The Glacier Ridge Sanitary Servicing Study was approved in 2016. The West catchment will be serviced by the future Glacier Ridge West Sanitary Trunk that is an extension of the existing 900mm trunk along Sage Hill Boulevard draining into the Beddington sanitary system. The majority of the East catchment will require the future Glacier Ridge East Sanitary Trunk in place which connects to the existing North Beddington Sanitary Trunk and then discharges into the Panorama Hills sanitary system. Both of these sanitary infrastructures are to be constructed in this budget cycle, 2019-2022. As of October 2020, the upstream portion of the Glacier Ridge East Trunk has been constructed; however, the downstream trunk will still need to be constructed in order for the entire trunk to be functional.
Storm:The Glacier Ridge Master Drainage Plan (MDP) was approved in June 2017, subject to a number of conditions that will be addressed in subsequent stages of the planning process. An outfall structure of the compound pond in the central north area, between the Symons Valley Rd NW and the West Nose Creek, will be required.
Transportation:
Skeletal Road network required to support full development: upgrade of Shaganappi Trail interchange on Stoney Trail to full build-out; new interchange along Stoney Trail at 14 Street NW that provides for all movements.
Arterial Street network required to support full development: 128 Avenue NW, 144 Avenue NW (including West Nose Creek fly-over), 160 Avenue NW; 85 Street NW; 69 Street NW south of 144 Avenue NW; Sarcee Trail NW, Shaganappi Trail NW, Symons Valley Road NW, 14 Street NW, and Center Street N from north City Limit to 144 Avenue N, inclusive; Panorama Road NW; Mountain View Road NW.
Fire: Emergency response station required to service the unserviced part of the Plan area.
1514
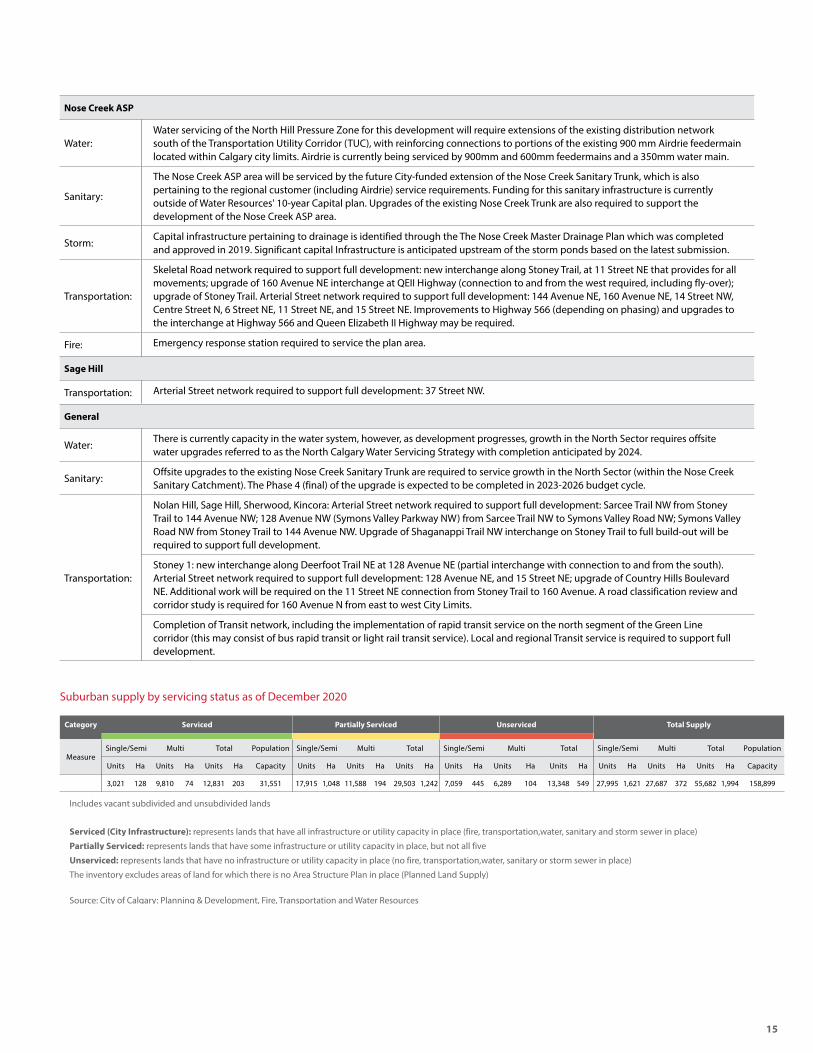
Suburban supply by servicing status as of December 2020
Category Serviced Partially Serviced Unserviced Total Supply
MeasureSingle/Semi Multi Total Population Single/Semi Multi Total Single/Semi Multi Total Single/Semi Multi Total Population
Units Ha Units Ha Units Ha Capacity Units Ha Units Ha Units Ha Units Ha Units Ha Units Ha Units Ha Units Ha Units Ha Capacity
3,021 128 9,810 74 12,831 203 31,551 17,915 1,048 11,588 194 29,503 1,242 7,059 445 6,289 104 13,348 549 27,995 1,621 27,687 372 55,682 1,994 158,899
Includes vacant subdivided and unsubdivided lands
Serviced (City Infrastructure): represents lands that have all infrastructure or utility capacity in place (fire, transportation,water, sanitary and storm sewer in place)
Partially Serviced: represents lands that have some infrastructure or utility capacity in place, but not all five
Unserviced: represents lands that have no infrastructure or utility capacity in place (no fire, transportation,water, sanitary or storm sewer in place)
The inventory excludes areas of land for which there is no Area Structure Plan in place (Planned Land Supply)
Source: City of Calgary: Planning & Development, Fire, Transportation and Water Resources
Nose Creek ASP
Water:Water servicing of the North Hill Pressure Zone for this development will require extensions of the existing distribution network south of the Transportation Utility Corridor (TUC), with reinforcing connections to portions of the existing 900 mm Airdrie feedermain located within Calgary city limits. Airdrie is currently being serviced by 900mm and 600mm feedermains and a 350mm water main.
Sanitary:
The Nose Creek ASP area will be serviced by the future City-funded extension of the Nose Creek Sanitary Trunk, which is also pertaining to the regional customer (including Airdrie) service requirements. Funding for this sanitary infrastructure is currently outside of Water Resources' 10-year Capital plan. Upgrades of the existing Nose Creek Trunk are also required to support the development of the Nose Creek ASP area.
Storm:Capital infrastructure pertaining to drainage is identified through the The Nose Creek Master Drainage Plan which was completed and approved in 2019. Significant capital Infrastructure is anticipated upstream of the storm ponds based on the latest submission.
Transportation:
Skeletal Road network required to support full development: new interchange along Stoney Trail, at 11 Street NE that provides for all movements; upgrade of 160 Avenue NE interchange at QEII Highway (connection to and from the west required, including fly-over); upgrade of Stoney Trail. Arterial Street network required to support full development: 144 Avenue NE, 160 Avenue NE, 14 Street NW, Centre Street N, 6 Street NE, 11 Street NE, and 15 Street NE. Improvements to Highway 566 (depending on phasing) and upgrades to the interchange at Highway 566 and Queen Elizabeth II Highway may be required.
Fire: Emergency response station required to service the plan area.
Sage Hill
Transportation: Arterial Street network required to support full development: 37 Street NW.
General
Water:There is currently capacity in the water system, however, as development progresses, growth in the North Sector requires offsite water upgrades referred to as the North Calgary Water Servicing Strategy with completion anticipated by 2024.
Sanitary:Offsite upgrades to the existing Nose Creek Sanitary Trunk are required to service growth in the North Sector (within the Nose Creek Sanitary Catchment). The Phase 4 (final) of the upgrade is expected to be completed in 2023-2026 budget cycle.
Transportation:
Nolan Hill, Sage Hill, Sherwood, Kincora: Arterial Street network required to support full development: Sarcee Trail NW from Stoney Trail to 144 Avenue NW; 128 Avenue NW (Symons Valley Parkway NW) from Sarcee Trail NW to Symons Valley Road NW; Symons Valley Road NW from Stoney Trail to 144 Avenue NW. Upgrade of Shaganappi Trail NW interchange on Stoney Trail to full build-out will be required to support full development.
Stoney 1: new interchange along Deerfoot Trail NE at 128 Avenue NE (partial interchange with connection to and from the south). Arterial Street network required to support full development: 128 Avenue NE, and 15 Street NE; upgrade of Country Hills Boulevard NE. Additional work will be required on the 11 Street NE connection from Stoney Trail to 160 Avenue. A road classification review and corridor study is required for 160 Avenue N from east to west City Limits.
Completion of Transit network, including the implementation of rapid transit service on the north segment of the Green Line corridor (this may consist of bus rapid transit or light rail transit service). Local and regional Transit service is required to support full development.

ÄÄ
! L
Ä
Ä
Ä
³
³
"
¬
¬
¾̄E¾̄E
¾̄E
NOLANHILL SAGE
HILL
EVANSTON
SHERWOODKINCORA
HIDDEN VALLEY
PANORAMAHILLS
STONEY 4
STONEY 1
COVENTRY HILLS
COUNTRYHILLS
VILLAGE
HARVESTHILLS
AURORA BUSINESSPARK
BEDDINGTON HEIGHTS
HUNTINGTON HILLS
SANDSTONEVALLEYMACEWAN
GLEN
COUNTRY HILLS
CARRINGTONCARRINGTON
LIVINGSTONGLACIER RIDGE ASP
KEYSTONE HILLS ASP
REMAINDER
LIVINGSTON
NOSE CREEKASP
KEYSTONEHILLS
AMBELTON
JOHN LAURIE BV NW
NOSE
HILLDR
SARCEETR
NW
SHAG
ANAP
PITR
NW
STONEY TR NW
W
ES
TN
OS
EC
RE
EK
NO
SE
CR
EE
K
STONE
YTR
NW
BEDDINGTON TR NW
COUNTRY HILLS BV NW
HAR
VEST
HILLSBV
NW
CPRAILW
AY
14 STNW
6 4 AV NW
144 AV NW
DEERFOOT
TRNE
C
CITY LIMITS
CITY LIMITS
FUTUREEMPLOYMENT
DISTRICT
SPYHILLPROVINCIAL
JAIL
SPYHILLLANDFILL
NORTH
NORTHWESTNORTHEAST
Sector BoundaryServiced (all leading City infrastructure in place)
Partially Serviced(Some leading infrastructure in place , but not all five)
Unserviced(No leading infrastructure in place)
Needs FireNeeds TransportationNeeds Water Resources (water, sanitary or storm)
Subject to ASP Approval(Will Include Residential and Non Residential Uses)
Future Water FeedermainFuture Storm TrunkFuture Sanitary Trunk
! Future Sanitary Lift Station¸ Future Pressure Reduction Station" Future Reservoir¬ Future Pump Station
Future Skeletal RoadFuture Arterial Street
³ Future Flyover
!L Future Partial Interchange
Ä Future Full Interchange
¾̄E Future Emergency Response StationTransportation Utility Corridor
1616
Map 4: North sector vacant residential land supply by servicing status as of December 2020
171616
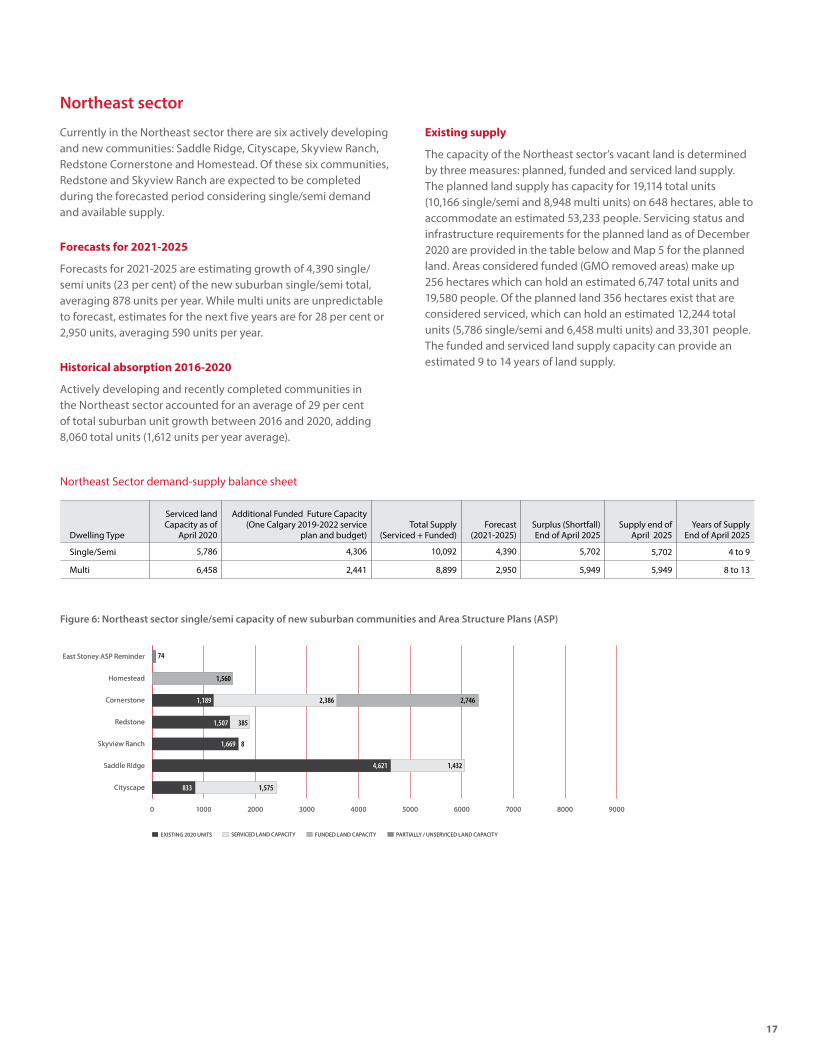
Northeast sector
Currently in the Northeast sector there are six actively developing and new communities: Saddle Ridge, Cityscape, Skyview Ranch, Redstone Cornerstone and Homestead. Of these six communities, Redstone and Skyview Ranch are expected to be completed during the forecasted period considering single/semi demand and available supply.
Forecasts for 2021-2025
Forecasts for 2021-2025 are estimating growth of 4,390 single/ semi units (23 per cent) of the new suburban single/semi total, averaging 878 units per year. While multi units are unpredictable to forecast, estimates for the next five years are for 28 per cent or 2,950 units, averaging 590 units per year.
Historical absorption 2016-2020
Actively developing and recently completed communities in the Northeast sector accounted for an average of 29 per cent of total suburban unit growth between 2016 and 2020, adding 8,060 total units (1,612 units per year average).
Existing supply
The capacity of the Northeast sector’s vacant land is determined by three measures: planned, funded and serviced land supply. The planned land supply has capacity for 19,114 total units (10,166 single/semi and 8,948 multi units) on 648 hectares, able to accommodate an estimated 53,233 people. Servicing status and infrastructure requirements for the planned land as of December 2020 are provided in the table below and Map 5 for the planned land. Areas considered funded (GMO removed areas) make up 256 hectares which can hold an estimated 6,747 total units and 19,580 people. Of the planned land 356 hectares exist that are considered serviced, which can hold an estimated 12,244 total units (5,786 single/semi and 6,458 multi units) and 33,301 people. The funded and serviced land supply capacity can provide an estimated 9 to 14 years of land supply.
Northeast Sector demand-supply balance sheet
Figure 6: Northeast sector single/semi capacity of new suburban communities and Area Structure Plans (ASP)
0 1000 2000 3000 4000 5000 6000 7000 8000 9000
PARTIALLY / UNSERVICED LAND CAPACITYFUNDED LAND CAPACITYSERVICED LAND CAPACITYEXISTING 2020 UNITS
Cityscape
Saddle Ridge
Skyview Ranch
Redstone
Cornerstone
Homestead
East Stoney ASP Reminder
0 1000 2000 3000 4000 5000 6000 7000 8000 9000
PARTIALLY / UNSERVICED LAND CAPACITYFUNDED LAND CAPACITYSERVICED LAND CAPACITYEXISTING 2020 UNITS
Cityscape
Saddle Ridge
Skyview Ranch
Redstone
Cornerstone
Homestead
East Stoney ASP Reminder
1,575833
81,669
3851,507
2,386
1,560
74
2,7461,189
1,4324,621
Dwelling Type
Serviced land Capacity as of
April 2020
Additional Funded Future Capacity (One Calgary 2019-2022 service
plan and budget)Total Supply
(Serviced + Funded)Forecast
(2021-2025)Surplus (Shortfall) End of April 2025
Supply end of April 2025
Years of Supply End of April 2025
Single/Semi 5,786 4,306 10,092 4,390 5,702 5,702 4 to 9
Multi 6,458 2,441 8,899 2,950 5,949 5,949 8 to 13

18
Northeast sectorFire, transportation and major utility (water, sanitary, storm) infrastructure requirements as of December 2020
Suburban supply by servicing status as of December 2020
Cityscape
Transportation:
Skeletal Road network required to support full development: Airport Trail from 36 Street NE to Stoney Trail; new interchanges along Stoney Trail at 60 Street NE; Upgrade of Country Hills Boulevard NE interchange and Airport Trail NE interchanges to ultimate stage / full build-out (partial interchanges only in-place providing select movements only); New interchanges along Airport Trail NE at 60 Street NE, Metis Trail NE, 36 Street NE;
Supporting Arterial road network required to support full development: 60 Street NE, 104 Avenue NE; Upgrade to arterial road network required to support full development: Country Hills Boulevard NE, Metis Trail NE, and 52 Street NE. Widening of Country Hills Boulevard from 36 Street to 60 Street NE
Cornerstone
Transportation:
Skeletal network required to support full development: Airport Trail NE from 36 Street NE to Stoney Trail NE; New interchanges along Stoney Trail at 60 Street NE; Upgrade of Country Hills Boulevard NE interchange to ultimate stage / full build-out (partial interchanges only in-place); New interchanges along Airport Trail NE at 60 Street NE, Metis Trail NE; New interchange along Metis Trail NE at 64 Avenue NE. Supporting arterial road network required to support full development: 128 Avenue NE, Metis Trail NE, 60 Street NE, Airport Trail NE, and upgrade of Country Hills Boulevard NE. Widening of Metis Trail NE from Airport Trail to 80 Avenue NE. Widening of Country Hills Boulevard from 36 Street to 60 Street NE.
Completion of Transit network, including completion of north segment of the Blue Line; Supporting local and regional Transit service.
East Stoney ASP
Transportation:
A flyover across Stoney Trail at 80th Avenue is required to service the Plan area. Connection originally planned as part of the ASP to provide Fire (emergency), Transit, and Active Modes connection only. A transportation planning study (ongoing as of Fall 2020) is reviewing the ultimate function and design of the 80 Avenue N.E. crossing, including whether access should be expanded to include people who drive or remain for emergency, transit, pedestrian and cyclists only.
Fire
The current Council approved response time for the Calgary Fire Department (CFD) is 7 minutes, and presently, the East Stoney ASP / Homestead development falls outside of this 7 minute standard. The initial review of the East Stoney ASP identified that there was a lack of response coverage and this planning area was not large enough to support the capital and operating costs required for a stand alone emergency response station. The solution discussed by Administration would be for an overpass to provide adequate emergency access into the area at 80 Avenue NE and across Stoney Trail. This would allow for 7 minute coverage to be provided to new residents within the East Stoney area. Presently, all development in this area will remain outside the Council approved 7 minute response coverage until the completion of the council approved 80 Avenue overpass.
General
Water:There is currently capacity in the water system, however, as development progresses, growth in the Northeast Sector requires offsite water upgrades referred to as the North Calgary Water Servicing Strategy with completion anticipated by 2024.
Sanitary:Offsite upgrades to the existing Nose Creek Sanitary Trunk are required to service growth in the North Sector (within the Nose Creek Sanitary Catchment). The Phase 4 (final) of the upgrade is expected to be completed in 2023-2026 budget cycle.
Transportation:
Skeletal network required to support full development: Airport Trail NE from 36 Street NE to Stoney Trail NE; New interchanges along Stoney Trail at 60 Street NE; Upgrade of Country Hills Boulevard NE interchange and Airport Trail NE interchanges to ultimate stage / full build-out (partial interchanges only in-place providing select movements only); New interchanges along Airport Trail NE at 60 Street NE, Metis Trail NE, 36 Street NE; New interchange along Metis Trail NE at 64 Avenue NE. Supporting arterial road network required to support full development: Country Hills Boulevard NE, 128 Avenue NE, 88 Avenue NE, 80 Avenue NE, 64 Avenue NE, Barlow Trail NE, 36 Street NE, Metis Trail NE, 84 Street NE, extension of 60 Street NE and 80 Avenue flyover at Stoney Trail NE.
Completion of Transit network, including completion of north segment of the Blue Line Light-Rail-Transit. Local and regional Transit service is required to support full development.
Category Serviced Partially Serviced Unserviced () Total Supply
MeasureSingle/Semi Multi Total Population Single/Semi Multi Total Single/Semi Multi Total Single/Semi Multi Total Population
Units Ha Units Ha Units Ha Capacity Units Ha Units Ha Units Ha Units Ha Units Ha Units Ha Units Ha Units Ha Units Ha Capacity
5,786 283 6,458 74 12,244 356 33,301 4,380 241 2,490 51 6,870 292 0 0 0 0 0 0 10,166 524 8,948 125 19,114 648 53,233
Includes vacant subdivided and unsubdivided lands
Serviced (City Infrastructure): represents lands that have all infrastructure or utility capacity in place (fire, transportation,water, sanitary and storm sewer in place)
Partially Serviced: represents lands that have some infrastructure or utility capacity in place, but not all five
Unserviced: represents lands that have no infrastructure or utility capacity in place (no fire, transportation,water, sanitary or storm sewer in place)
The inventory excludes areas of land for which there is no Area Structure Plan in place (Planned Land Supply)
Source: City of Calgary: Planning & Development, Fire, Transportation and Water Resources

! L
Ä!L
³
¾¾E
REDSTONE
STONEY 2 STO
NEY
3
SKYVIEWRANCHSTONEGATE
LANDING
SADDLE RIDGE
MARTINDALE TARADALE
CASTLERIDGE
SADDLE RIDGE
INDUSTRIAL
FALCON RIDGE
CORALSPRINGS
CALGARYINTERNATIONAL
AIRPORT
CITYSCAPE
CORNERSTONE
EASTSTONEY
ASP
STONEY TR NE
STO
NEY
TRN
E
DEERFOOT TR
NE
128 AV NE
COUNTRY HILLS BV NE
MET
ISTR
NE
MET
ISTR
NE
AIRPORT TR NE
60ST
NE
80 AV NE
64 AV NE
CITY LIMITS
CITY
L IMITS
NORTHEAST
NORTH
Sector BoundaryServiced (all leading City infrastructure in place)
Partially Serviced(Some leading infrastructure in place, but not all five)
Unserviced(No leading infrastructure in place)
Needs Fire
Needs Transportation
Needs Water Resources (water, sanitary or storm)
Subject to ASP Approval(Will Include Residential and Non Residential Uses)
Future Sanitary TrunkFuture Water FeedermainFuture Storm Trunk
! Future Sanitary Lift Station¸ Future Pressure Reduction Station" Future Reservoir¬ Future Pump Station
Future Skeletal Road
Future Arterial Street
³ Future Flyover
!L Future Partial Interchange
Ä Future Full Interchange
¾¾E Relocation of Existing Fire Station
Transportation Utility Corridor
1918
Map 5: Northeast sector vacant residential land supply by servicing status as of December 2020

0 1000 2000 3000 4000 5000 6000 7000 8000 9000
PARTIALLY / UNSERVICED LAND CAPACITYFUNDED LAND CAPACITYSERVICED LAND CAPACITYEXISTING 2020 UNITS
Belvedere ASP Remainder
Belvedere
Twinhills 160 1,370
1,730 457264
8,417
20
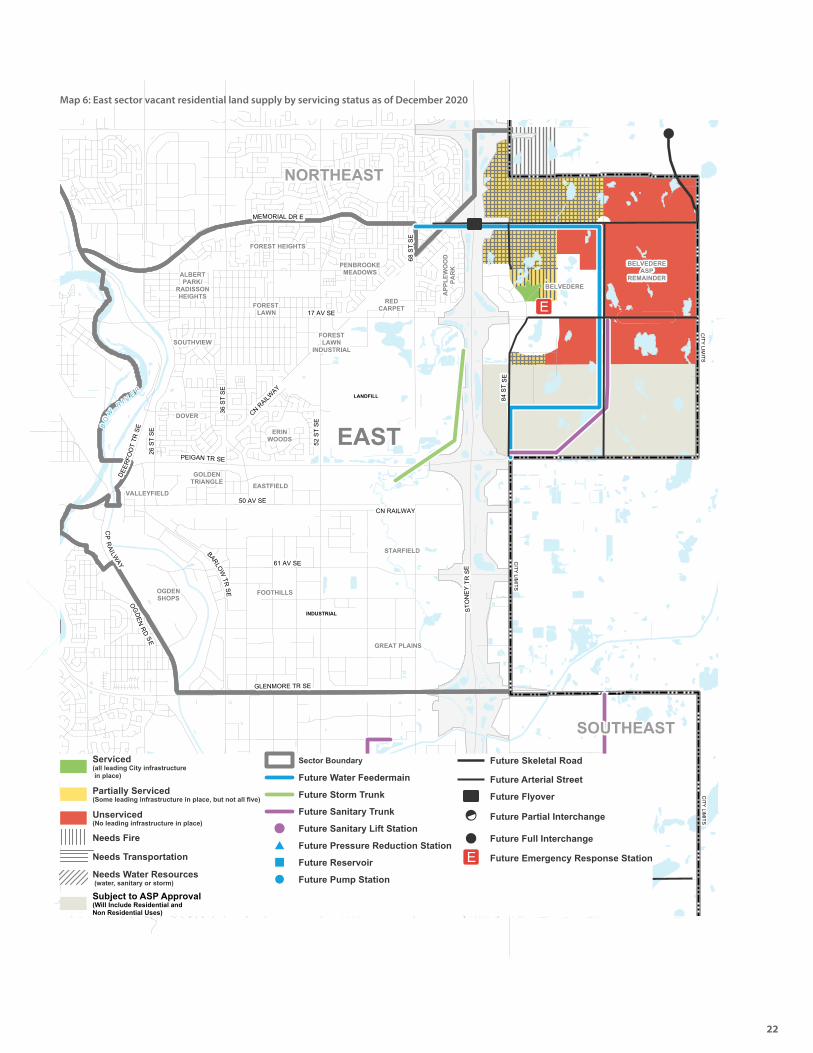
East sector
Currently, the East sector has two new communities: Belvedere and Twinhills.
Forecasts for 2021-2025
Forecasts for 2021-2025 are estimating growth of 880 single/semi units (5 per cent) of the new suburban single/semi total. Multi-units are unpredictable to forecast, however, estimates for the next five years are for 2 per cent or 480 units.
Historical absorption 2016-2020
It has been 25 years since this sector has experienced significant new suburban residential growth. When supply and community development existed in the early 1990s, this sector captured around 3-5 per cent of new suburban growth.
Existing supply
The capacity of the East sector’s vacant land is determined by three measures: planned, funded and serviced land supply. The planned land supply has capacity for 20,006 total units (11,869 single/semi and 8,137 multi units) on 928 hectares, able to accommodate an estimated 62,429 people. Details of servicing status and infrastructure requirements as of December 2020 are provided in the table below and Map 6 for the planned land. Of this a vacant planned land supply of 171 hectares exist that are funded for servicing, which can hold an estimated 4,239 total units (1,890 single/semi and 2,349 multi units) and 11,405 people. Of the planned land, 31 hectares exist that are considered serviced, which can hold an estimated 1419 total units 264 single/semi and 1,155 multi units) and 3,412 people. The funded and serviced land supply capacity can provide an estimated 8 to 9 years of land supply.
East Sector demand-supply balance sheet
Figure 7: East sector single/semi capacity of new suburban communities and Area Structure Plans (ASP)
Dwelling Type
Serviced land Capacity as of
April 2020
Additional Funded Future Capacity (One Calgary 2019-2022 service
plan and budget)Total Supply
(Serviced + Funded)Forecast
(2021-2025)Surplus (Shortfall) End of April 2025
Supply end of April 2025
Years of Supply End of April 2025
Single/Semi 264 1,890 2,154 880 1,274 1,274 5 to 10
Multi 1,155 2,349 3,504 480 3,024 3,024 25 to 38

2120
East sectorFire, transportation and major utility (water, sanitary, storm) infrastructure requirements as of December 2020
Suburban supply by servicing status as of December 2020
Belvedere, Twin Hill and Belvedere ASP Remainder
Water:
Belvedere West is considered serviced by the existing water system. Belvedere East requires the future Belvedere Feedermain Phase 1 (along Memorial Drive SE) up to 100 Street SE and Belvedere Feedermain Phase 2 (along 100 ST SE) from Memorial Drive SE south to 17 Avenue SE. This water infrastructure is to be constructed in this budget cycle, 2019-2022. The Twin Hills Business Case Area requires the construction of a 400mm water main along 17 AV SE with Phases 1 and 2 to complete the water loop. The future Belvedere Feedermain Phase 3 (south of 17 Avenue SE along 100 ST SE and west along 34 Avenue SE between 84 Street SE and 100 Street SE and south along 84 Street to 50 Avenue SE) will be required as the ultimate servicing for Belvedere East. Growth in the East Sector will require future offsite water main upgrades along 17 Avenue S, 28 Street SE and Memorial Drive.
Sanitary:
Belvedere West is considered serviced for sanitary. The majority of Belvedere East requires the future Belvedere Sanitary Trunk (from 17 Avenue SE along 100 Street SE to Peigan Trail and 84 Street SE). This sanitary infrastructure is to be constructed in this budget cycle, 2019-2022. The southeast portion of the Belvedere ASP lands requires a future Belvedere Lift Station and Belvedere Forcemain along Peigan Trail from 92 Street SE to 116 Street SE.
Storm:
The East Belvedere storm catchment will be serviced through a regional drainage solution along the eastern edge of Calgary known as the Cooperative Stormwater Management Initiative (CSMI) currently under negotiation. The Twin Hills Business Case Area has proposed an interim strategy that includes zero release through reuse and irrigation and has been approved under this requirement without the future ultimate storm solution. The West Belvedere storm catchment area is considered serviceable through existing Forest Lawn Creek, although upgrades of Forest Lawn Creek are required to support future development. Development applications in the West Belvedere catchment will need to be reviewed by Water Resources on a case by case basis to ensure that the development can proceed ahead of the upgrades.
Transportation:
Skeletal Road network required to support full development: new flyover structure across Stoney Trail along Memorial Drive E; upgrades to Trans-Canada Highway, including a new interchange 100 Street SE and 116 Street SE; upgrades to Peigan Trail from Stoney Trail to City Limit. Arterial Street network required to support full development: Memorial Drive, 17 Avenue SE, Peigan Trail, 116 Street SE, 100 Street SE, and re-aligned 84 Street SE. Transit network required to support full development: extension of MAX Purple Bus-Rapid-Transit from Stoney Trail through to east City Limit.
Fire:Belvedere West is considered serviced by fire. East Belvedere will have fire service coverage upon the completion of emergency response station 45 (anticipated opening Q3 2021).
General
Sanitary: Growth in the East Sector requires offsite sanitary upgrades further downstream along 52 Street SE and 114 Avenue SE.
Transportation: Local and regional Transit service is required to support full development.
Source: City of Calgary: Planning & Development, Fire, Transportation and Water Resources
Category Serviced Partially Serviced Unserviced Total Supply
MeasureSingle/Semi Multi Total Population Single/Semi Multi Total Single/Semi Multi Total Single/Semi Multi Total Population
Units Ha Units Ha Units Ha Capacity Units Ha Units Ha Units Ha Units Ha Units Ha Units Ha Units Ha Units Ha Units Ha Capacity
264 19 1,155 12 1,419 31 3,412 4,032 260 2,339 57 6,371 318 7,574 470 4,642 110 12,216 579 11,869 749 8,137 179 20,006 928 62,429
Includes vacant subdivided and unsubdivided lands
Serviced (City Infrastructure): represents lands that have all infrastructure or utility capacity in place (fire, transportation,water, sanitary and storm sewer in place)
Partially Serviced: represents lands that have some infrastructure or utility capacity in place, but not all five
Unserviced: represents lands that have no infrastructure or utility capacity in place (no fire, transportation,water, sanitary or storm sewer in place)
The inventory excludes areas of land for which there is no Area Structure Plan in place (Planned Land Supply)
Ä
³
!
ÀÀE
FOREST HEIGHTS
FOREST LAWN
ALBERTPARK/
RADISSONHEIGHTS
SOUTHVIEW
BELVEDERE
REDCARPET
APP
LEW
OO
DPA
RK
FORESTLAWN
INDUSTRIAL
DOVER
ERINWOODS
VALLEYFIELD
GOLDENTRIANGLE EASTFIELD
STARFIELD
OGDENSHOPS
FOOTHILLS
GREAT PLAINS
PENBROOKEMEADOWS
BELVEDEREASP
REMAINDER
BO
W
R I V E
R
DEER
FOOTTR
SE
26ST
SE
36ST
SE
PEIGAN TR SE
CN
RAILW
AY
52ST
S E
50 AV SECN RAILWAY
61 AV SE
STONEY
TRSE
CPRAILW
AY
OGDENRDSE
GLENMORE TR SE
BARLOWTR
SE
CP RAILWAY
114 AV SE
BARLO
WTR
SE
24ST
SE
DEERFOOT TR SE
MEMORIAL DR E
17 AV SE
84ST
SE
68ST
SE
CITY
LIMITS
CITY
LIMIT S
CITY
LIMITS
LANDFILL
INDUSTRIAL
EAST
NORTHEAST
SOUTHEAST
Serviced (all leading City infrastructure in place)
Partially Serviced(Some leading infrastructure in place, but not all five)
Unserviced(No leading infrastructure in place)
Needs Fire
Needs Transportation
Needs Water Resources (water, sanitary or storm)
Subject to ASP Approval(Will Include Residential and Non Residential Uses)
Sector Boundary
Future Water Feedermain
Future Storm Trunk
Future Sanitary Trunk
! Future Sanitary Lift Station
¸ Future Pressure Reduction Station
" Future Reservoir
¬ Future Pump Station
Future Skeletal Road
Future Arterial Street
³ Future Flyover
!L Future Partial Interchange
Ä Future Full Interchange
ÀÀE Future Emergency Response Station
22
Map 6: East sector vacant residential land supply by servicing status as of December 2020
0 1000 2000 3000 4000 5000 6000 7000 8000 9000
PARTIALLY / UNSERVICED LAND CAPACITYFUNDED LAND CAPACITYSERVICED LAND CAPACITYEXISTING 2020 UNITS
Copper�eld
Cranston
Mahogany
Seton
Rangeview
Hotchkiss
Ricardo Ranch ASP Remainder
South Shepard ASP Remainder
2263,125
4415,838
2,272
3,703
5,809136
2,104 673
4,006
4,411
3,557
405
2322
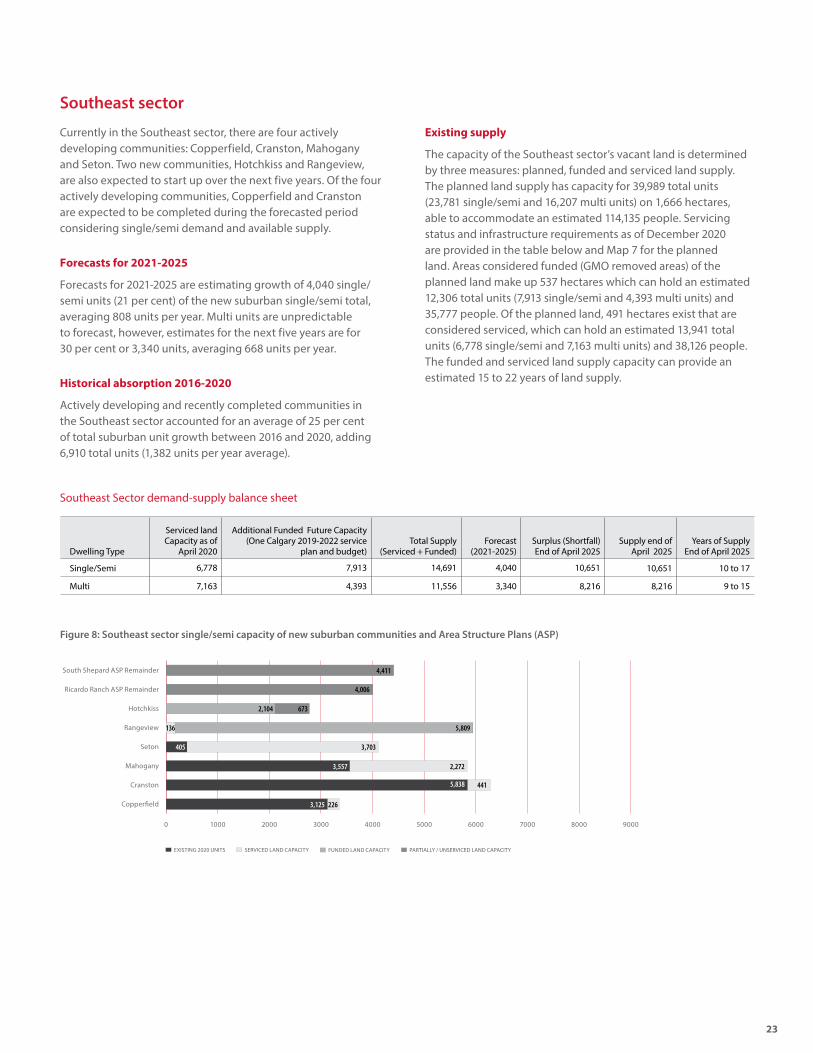
Southeast sector
Currently in the Southeast sector, there are four actively developing communities: Copperfield, Cranston, Mahogany and Seton. Two new communities, Hotchkiss and Rangeview, are also expected to start up over the next five years. Of the four actively developing communities, Copperfield and Cranston are expected to be completed during the forecasted period considering single/semi demand and available supply.
Forecasts for 2021-2025
Forecasts for 2021-2025 are estimating growth of 4,040 single/semi units (21 per cent) of the new suburban single/semi total, averaging 808 units per year. Multi units are unpredictable to forecast, however, estimates for the next five years are for 30 per cent or 3,340 units, averaging 668 units per year.
Historical absorption 2016-2020
Actively developing and recently completed communities in the Southeast sector accounted for an average of 25 per cent of total suburban unit growth between 2016 and 2020, adding 6,910 total units (1,382 units per year average).
Existing supply
The capacity of the Southeast sector’s vacant land is determined by three measures: planned, funded and serviced land supply. The planned land supply has capacity for 39,989 total units (23,781 single/semi and 16,207 multi units) on 1,666 hectares, able to accommodate an estimated 114,135 people. Servicing status and infrastructure requirements as of December 2020 are provided in the table below and Map 7 for the planned land. Areas considered funded (GMO removed areas) of the planned land make up 537 hectares which can hold an estimated 12,306 total units (7,913 single/semi and 4,393 multi units) and 35,777 people. Of the planned land, 491 hectares exist that are considered serviced, which can hold an estimated 13,941 total units (6,778 single/semi and 7,163 multi units) and 38,126 people. The funded and serviced land supply capacity can provide an estimated 15 to 22 years of land supply.
Southeast Sector demand-supply balance sheet
Figure 8: Southeast sector single/semi capacity of new suburban communities and Area Structure Plans (ASP)
Dwelling Type
Serviced land Capacity as of
April 2020
Additional Funded Future Capacity (One Calgary 2019-2022 service
plan and budget)Total Supply
(Serviced + Funded)Forecast
(2021-2025)Surplus (Shortfall) End of April 2025
Supply end of April 2025
Years of Supply End of April 2025
Single/Semi 6,778 7,913 14,691 4,040 10,651 10,651 10 to 17
Multi 7,163 4,393 11,556 3,340 8,216 8,216 9 to 15
24
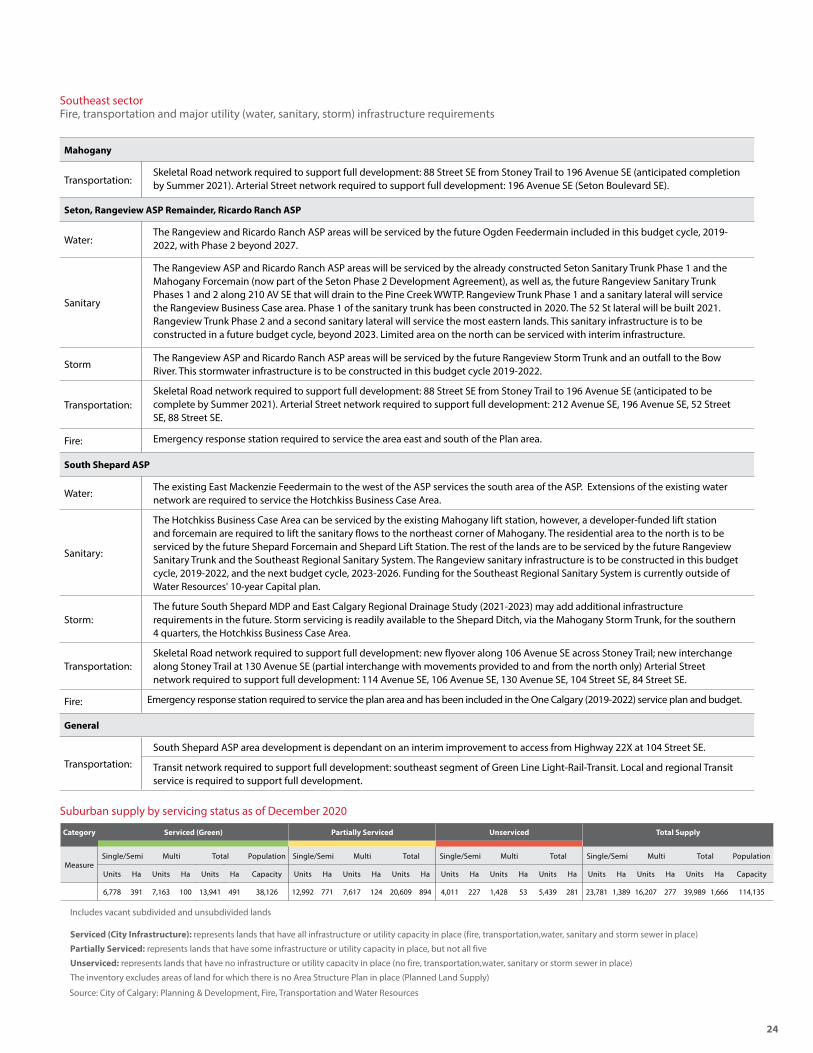
Southeast sectorFire, transportation and major utility (water, sanitary, storm) infrastructure requirements
Suburban supply by servicing status as of December 2020
Source: City of Calgary: Planning & Development, Fire, Transportation and Water Resources
Mahogany
Transportation:Skeletal Road network required to support full development: 88 Street SE from Stoney Trail to 196 Avenue SE (anticipated completion by Summer 2021). Arterial Street network required to support full development: 196 Avenue SE (Seton Boulevard SE).
Seton, Rangeview ASP Remainder, Ricardo Ranch ASP
Water:The Rangeview and Ricardo Ranch ASP areas will be serviced by the future Ogden Feedermain included in this budget cycle, 2019-2022, with Phase 2 beyond 2027.
Sanitary
The Rangeview ASP and Ricardo Ranch ASP areas will be serviced by the already constructed Seton Sanitary Trunk Phase 1 and the Mahogany Forcemain (now part of the Seton Phase 2 Development Agreement), as well as, the future Rangeview Sanitary Trunk Phases 1 and 2 along 210 AV SE that will drain to the Pine Creek WWTP. Rangeview Trunk Phase 1 and a sanitary lateral will service the Rangeview Business Case area. Phase 1 of the sanitary trunk has been constructed in 2020. The 52 St lateral will be built 2021. Rangeview Trunk Phase 2 and a second sanitary lateral will service the most eastern lands. This sanitary infrastructure is to be constructed in a future budget cycle, beyond 2023. Limited area on the north can be serviced with interim infrastructure.
StormThe Rangeview ASP and Ricardo Ranch ASP areas will be serviced by the future Rangeview Storm Trunk and an outfall to the Bow River. This stormwater infrastructure is to be constructed in this budget cycle 2019-2022.
Transportation:Skeletal Road network required to support full development: 88 Street SE from Stoney Trail to 196 Avenue SE (anticipated to be complete by Summer 2021). Arterial Street network required to support full development: 212 Avenue SE, 196 Avenue SE, 52 Street SE, 88 Street SE.
Fire: Emergency response station required to service the area east and south of the Plan area.
South Shepard ASP
Water:The existing East Mackenzie Feedermain to the west of the ASP services the south area of the ASP. Extensions of the existing water network are required to service the Hotchkiss Business Case Area.
Sanitary:
The Hotchkiss Business Case Area can be serviced by the existing Mahogany lift station, however, a developer-funded lift station and forcemain are required to lift the sanitary flows to the northeast corner of Mahogany. The residential area to the north is to be serviced by the future Shepard Forcemain and Shepard Lift Station. The rest of the lands are to be serviced by the future Rangeview Sanitary Trunk and the Southeast Regional Sanitary System. The Rangeview sanitary infrastructure is to be constructed in this budget cycle, 2019-2022, and the next budget cycle, 2023-2026. Funding for the Southeast Regional Sanitary System is currently outside of Water Resources' 10-year Capital plan.
Storm:The future South Shepard MDP and East Calgary Regional Drainage Study (2021-2023) may add additional infrastructure requirements in the future. Storm servicing is readily available to the Shepard Ditch, via the Mahogany Storm Trunk, for the southern 4 quarters, the Hotchkiss Business Case Area.
Transportation:Skeletal Road network required to support full development: new flyover along 106 Avenue SE across Stoney Trail; new interchange along Stoney Trail at 130 Avenue SE (partial interchange with movements provided to and from the north only) Arterial Street network required to support full development: 114 Avenue SE, 106 Avenue SE, 130 Avenue SE, 104 Street SE, 84 Street SE.
Fire: Emergency response station required to service the plan area and has been included in the One Calgary (2019-2022) service plan and budget.
General
Transportation:
South Shepard ASP area development is dependant on an interim improvement to access from Highway 22X at 104 Street SE.
Transit network required to support full development: southeast segment of Green Line Light-Rail-Transit. Local and regional Transit service is required to support full development.
Category Serviced (Green) Partially Serviced Unserviced Total Supply
MeasureSingle/Semi Multi Total Population Single/Semi Multi Total Single/Semi Multi Total Single/Semi Multi Total Population
Units Ha Units Ha Units Ha Capacity Units Ha Units Ha Units Ha Units Ha Units Ha Units Ha Units Ha Units Ha Units Ha Capacity
6,778 391 7,163 100 13,941 491 38,126 12,992 771 7,617 124 20,609 894 4,011 227 1,428 53 5,439 281 23,781 1,389 16,207 277 39,989 1,666 114,135
Includes vacant subdivided and unsubdivided lands
Serviced (City Infrastructure): represents lands that have all infrastructure or utility capacity in place (fire, transportation,water, sanitary and storm sewer in place)
Partially Serviced: represents lands that have some infrastructure or utility capacity in place, but not all five
Unserviced: represents lands that have no infrastructure or utility capacity in place (no fire, transportation,water, sanitary or storm sewer in place)
The inventory excludes areas of land for which there is no Area Structure Plan in place (Planned Land Supply)

!L
Ä
!L
!
¾¾E
¾¾E
SECTION 23
SOUTH FOOTHILLS
EAST SHEPARD INDUSTRIAL
SHEPARDINDUSTRIAL
RIVERBEND
DOUGLASDALE/GLEN
CRANSTON
AUBURN BAY
MAHOGANY
SETON
MCKENZIELAKE
MCKENZIETOWNE
NEWBRIGHTON
COPPERFIELD
RANGEVIEWASP
REMAINDER
GLENMORE TR SE
CP RAILWAY
114 AV SE
1 30 AV SE
52ST
SE
68ST
SE
BAR
LOW
TRSE
24ST
SE
DEERFOOT TR SE
RSE
SETON BV SE
52ST
SE
MARQUIS OF LORNE TR SE
BOW
BOTTOMTR
SE
DEE
RFO
OT
T RS
E
212 AV SE
MACLEO
DTR
SE
B O W R I V E R
B O W
RIV
ER
BO
W
R I V E R
BO
WR
I
MARQUIS OF LORNE TR SE
RD SE
FI S
HC
RE
EK
STON
EY TR SE
CITY LIMITS
CITY
LIMITS
CITY LIMITS
LANDFILLSITE
Pine CreekWastewaterTreatment
Plant
SOUTH SHEPARD ASP
SOUTHEAST
SOUTH
EASTSector Boundary
Serviced (all leading City infrastructure in place)
Partially Serviced(Some leading infrastructure in place, but not all five)
Unserviced(No leading infrastructure in place)
Needs Fire
Needs Transportation
Needs Water Resources (water, sanitary or storm)
Subject to ASP Approval(Will Include Residential and Non Residential Uses)
Future Water FeedermainFuture Storm TrunkFuture Sanitary Trunk
! Future Sanitary Lift Station¸ Future Pressure Reduction Station
" Future Reservoir¬ Future Pump Station
Future Skeletal Road
Future Arterial Street
!L Future Partial Interchange
Ä Future Full Interchange
³ Future Flyover
¾¾E Future Emergency Response Station
Transportation Utility Corridor
2524
Map 7: Southeast sector vacant residential land supply by servicing status as of December 2020

0 1000 2000 3000 4000 5000 6000 7000 8000 9000
PARTIALLY / UNSERVICED LAND CAPACITYFUNDED LAND CAPACITYSERVICED LAND CAPACITYEXISTING 2020 UNITS
Walden
Legacy
Silverado
Belmont
Yorkville
Wolf Willow
Pine Creek
Alpine Park
West Macleod ASP Remainder
Providence ASP Remainder
1,849
709
1,587
1,775
1,187 2531,984
1,169 215202
1,007 1,191190
321 2,24998
196
188 907
842
3,974
510
1,831
3,28081
26
South sector
Currently in the South sector there are seven actively developing communities (Legacy, Walden, Silverado, Belmont, Yorkville, Pine Creek and Wolf Willow) and one new community (Alpine Park). Of the actively developing communities, Walden is expected to be completed during the forecasted period considering single/ semi demand and available supply.
Forecasts for 2021-2025
Forecasts for 2021-2025 are estimating growth of 4,230 single/semi units (22 per cent) of the new suburban single/semi total, averaging 846 units per year. While multi units are unpredictable to forecast, estimates for the next five years are for 16 per cent or 2,640 units, averaging 528 units per year.
Historical absorption 2016-2020
Actively developing communities in the South sector accounted for an average of 16 per cent of total suburban unit growth between 2016 and 2020, adding 4,380 total units (876 units per year average).
Existing supply
The capacity of the South sector’s vacant land is determined by three measures: planned, funded and serviced land supply. The planned land supply has capacity for 41,260 total units (21,877 single/semi and 19,383 multi units) on 1,683 hectares, able to accommodate an estimated 114,707 people. Servicing status and infrastructure requirements as of December 2020 are provided in the table below and Map 8 for the planned land. Areas considered funded (GMO removed areas) of the planned land make up 679 hectares which can hold an estimated 16,092 total units (9,019 single/semi and 7,073 multi units) and 45,323 people. Of the planned land, 521 hectares exist that are considered serviced, which can hold an estimated 16,230 total units (7,136 single/semi and 9,094 multi units) and 43,426 people. The funded and serviced land supply capacity can provide an estimated 16 to 23 years of land supply.
South Sector demand-supply balance sheet
Figure 9: South sector single/semi capacity of new suburban communities and Area Structure Plans (ASP)
Dwelling Type
Serviced land Capacity as of
April 2019
Additional Funded Future Capacity (One Calgary 2019-2022 service
plan and budget)Total Supply
(Serviced + Funded)Forecast
(2021-2025)Surplus (Shortfall) End of April 2025
Supply end of April 2025
Years of Supply End of April 2025
Single/Semi 7,136 9,019 16,155 4,230 11,925 11,925 11 to 18
Multi 9,094 7,073 16,167 2,640 13,527 13,527 21 to 31

2726
South sectorFire, transportation and major utility (water, sanitary, storm) infrastructure requirements as of December 2020
East Silverado
Water: This area can be serviced by the current water system.
Sanitary:A developer-funded lift station and forcemain are required to tie into the already constructed West Pine Creek Sanitary Trunk Phase 2 completed in early 2018.
Storm:
Stormwater will ultimately drain through the existing 194th Ave storm trunk and outfall to the Priddis Slough wetland. The existing storm trunk was pre-built during the M194th Ave Extension project to service the roadway. East Silverado will be allowed to release pre-treated stormwater to Priddis Slough once the Water Act application for the wetland control structures are approved and constructed, the majority of the flow will be released from the wetland to the Bow River with a minor release to Pine Creek. The Priddis Slough water intakes and offsite infrastructure to Bow River and Pine Creek will be constructed and operational in Q2 2021.
Prior to obtaining provincial approvals for Priddis Slough and then constructing the water intakes, a zero release rate to the wetland is in place within the Priddis Slough catchment. Development will be limited to approximately 10 per cent of the developable lands serviced by means of an onsite evaporation pond.
Legacy, Walden, Wolf Willow
Transportation:
Skeletal Road network required to support full development: upgrades to the intersections of 194 Avenue SE and 210 Avenue SE with Macleod Trail SE. Arterial Street network required to support full development: 210 Avenue SE; Wolf Willow Boulevard.
The area east of Macleod Trail has a 7,300 unit cap which reflects the restriction associated with the interim solution.
Providence ASP
Water:
Providence ASP has two pressure zones: Westview and Starlight. To service both pressure zones, the Providence ASP requires a dual zone pumpstation, a single zone pumpstation, the Westview and Starlight Reservoirs, land purchase and acquisition for both reservoir sites, and all associated feedermain extensions to the distribution network. The Starlight Reservoir site has been identified to be located outside of the City limits. The first developments within Providence, the Dream and Qualico Business Case, require the construction of the Starlight East Pump Station, with interim pump station currently under construction. This water infrastructure is to be constructed in this budget cycle, 2019-2022 and 2023-2026. The next phase is the 146 Ave Feedermain and Westview Reservoir which will be triggered by development south of 162 Ave SW in the Providence ASP.
Sanitary:
The Sanitary servicing study was completed and approved in 2016. The northeast catchment requires a developer-constructed extension of the existing 162 AV Sanitary Trunk. The central catchment requires the future Phase 3 construction of the West Pine Creek Sanitary Trunk from the West Macleod ASP. Funding for this sanitary infrastructure is currently outside of Water Resources' 10-year Capital plan. The southwest catchment requires a future, developer-funded lift station and extensions to the future West Pine Creek Sanitary Trunk Phase 3.
Storm:
The Master Drainage Plan (MDP) for the Providence ASP was approved in February 2020. The stormwater servicing will ultimately discharge into Fish Creek, and capital funding for the stormwater infrastructure is required. The Providence Storm Trunk and Outfall are required to service the Dream and Qualico Business Case areas. This stormwater infrastructure is to be constructed in this budget cycle, 2019-2022. The rest of the Providence storm infrastructure is to be built after 2023.
Transportation:
Skeletal Road network required to support full development: completion of the Southwest Calgary Ring Road (SWCRR) between Glenmore Trail SW and Spruce Meadows Trail SW; new interchanges along SWCRR at 146 Avenue SW (anticipated to be open Fall 2020) and 162 Avenue SW (anticipated to be open Fall 2021). Arterial Street network required to support full development: 154 Avenue SW; 162 Avenue SW; segments of 37 Street SW and 53 Street SW. Transit network required to support full development: completion of the 162 Avenue SW Transit Way.
Fire:Both the Dream and Qualica Business Case areas are serviced from the existing Evergreen emergency response station. And additional emergency response station required to service the unserviced part of the plan area.
Silverado
Water:This area can be serviced through a distribution water servicing loop from Somerset across Highway 22X. The future Lower Sarcee Feedermain will need to be extended across highway 22x to develop beyond current capacity thresholds. The Lower Sarcee Feedermain is expected to be completed in 2022.
Storm:
Stormwater will drain through an existing storm trunk and outfall to the Priddis Slough wetland, and then through a future water intake control structures to Bow River with a minor release to Pine Creek. This release to the wetland will be allowed once the provincial approval is obtained. This infrastructure will be built in 2021. Until then, Silverado will continue to pump stormwater via an existing forcemain along the Sheriff King Street to Pine Creek.

28
Suburban supply by servicing status as of December 2020
Category Serviced Partially Serviced Unserviced Total Supply
MeasureSingle/Semi Multi Total Population Single/Semi Multi Total Single/Semi Multi Total Single/Semi Multi Total Population
Units Ha Units Ha Units Ha Capacity Units Ha Units Ha Units Ha Units Ha Units Ha Units Ha Units Ha Units Ha Units Ha Capacity
7,136 393 9,094 128 16,230 521 43,426 13,686 894 9,641 166 23,327 1,061 1,056 81 647 19 1,703 100 21,877 1,369 19,383 314 41,260 1,683 114,707
Includes vacant subdivided and unsubdivided lands
Serviced (City Infrastructure): represents lands that have all infrastructure or utility capacity in place (fire, transportation,water, sanitary and storm sewer in place)
Partially Serviced: represents lands that have some infrastructure or utility capacity in place, but not all five
Unserviced: represents lands that have no infrastructure or utility capacity in place (no fire, transportation,water, sanitary or storm sewer in place)
The inventory excludes areas of land for which there is no Area Structure Plan in place (Planned Land Supply)
Source: City of Calgary: Planning & Development, Fire, Transportation and Water Resources
Belmont, Yorkville, Pine Creek, West Macleod ASP Remainder
Water:
The West Macleod area is to be serviced with the existing 210 Ave Feedermain, the future 210 Ave Pump Station (at the intersection of Sheriff King Street and 210 Ave S) and the future Lower Sarcee Feedermain from the existing connection at 162 Avenue S to 210 Avenue S (north portion is constructed). This infrastructure is expected to be completed by 2022. Lands east of Sheriff King ST SE are considered serviced with extensions required from the already constructed 210 Ave Feedermain. A portion of the Yorkville lands in West Macleod is considered serviced with developer-funded extensions from Silverado until the Lower Sarcee Feedermain is completed in 2022. Yorkville West requires a future privately-funded, public pump station to service the higher elevation, western lands.
Sanitary:
The sanitary servicing for the entire West Macleod ASP was completed in early 2018 with the construction of the West Pine Creek Sanitary Trunk Phase 2 from Macleod Trail and 210 Avenue S to Sheriff King Street and 194 Avenue S and the City-funded sanitary branch that services the lands south of 210 AV S from the West Pine Creek Sanitary Trunk Phase 2 at 210 AV SW. Pine Valley/Creekrise lands require two, developer-funded sanitary lift stations that lift flows to Branch C and north to 210 Ave S in the communities of Creekstone and Creekview.
Storm:
For the lands north of 210 AV S, stormwater will ultimately drain to the Priddis Slough wetland and then the majority of the flow will be released to the Bow River via the existing Midnapore Storm Trunk and Hwy 22X ponds with a minor release to Pine Creek. This stormwater solution requires provincial approvals. The offsite downstream storm infrastructure is expected to be constructed and operational in 2021. The existing storm trunk draining the upland to the wetland was constructed with the 194th Ave Extension project and is currently serving the roadway in compliance with the 194th Ave Water Act approval. For the upland development within the West Macleod ASP lands, zero release rate to the wetland is in place limiting the development to approximately 10 per cent of developable lands serviced by the means of on-site evaporation ponds, until the provincial approvals are obtained.
The lands south of 210 AV S will continue to drain to Pine Creek. Pine Valley/Creekrise lands will require two stormwater lift stations.
Transportation:
Skeletal network required to support full development: upgrade of Macleod Trail SE / Highway 2A; New interchanges along Macleod Trail SE / Highway 2A at 194 Avenue SE (partial interchange with movements provided to and from the north only), and 210 Avenue SE. Upgrade to interchange at Stoney Trail - Macleod Trail SE. Supporting arterial road network to support full development: 194 Avenue SW & SE, 210 Avenue SW & SE, Sheriff King Street SW, and Spruce Meadows Way SW.
West of Macleod has a 7,100 unit cap which reflects the restriction associated with the interim solution.
General
Transportation:
SWCRR to be designed and constructed by the Province within the South Sector (expected completion 2021). New interchanges required to support full development of the South Sector: along the SWCRR at Macleod Trail SE, 6 Street SW (partial interchange with movements provided to and from the west only), James McKevitt Road SW/Spruce Meadows Way SW, and 162 Avenue SW; along Spruce Meadows Trail at 53 Street SW; along Macleod Trail at 194 Avenue S and 210 Avenue S. Local and regional Transit service is required to support full development.
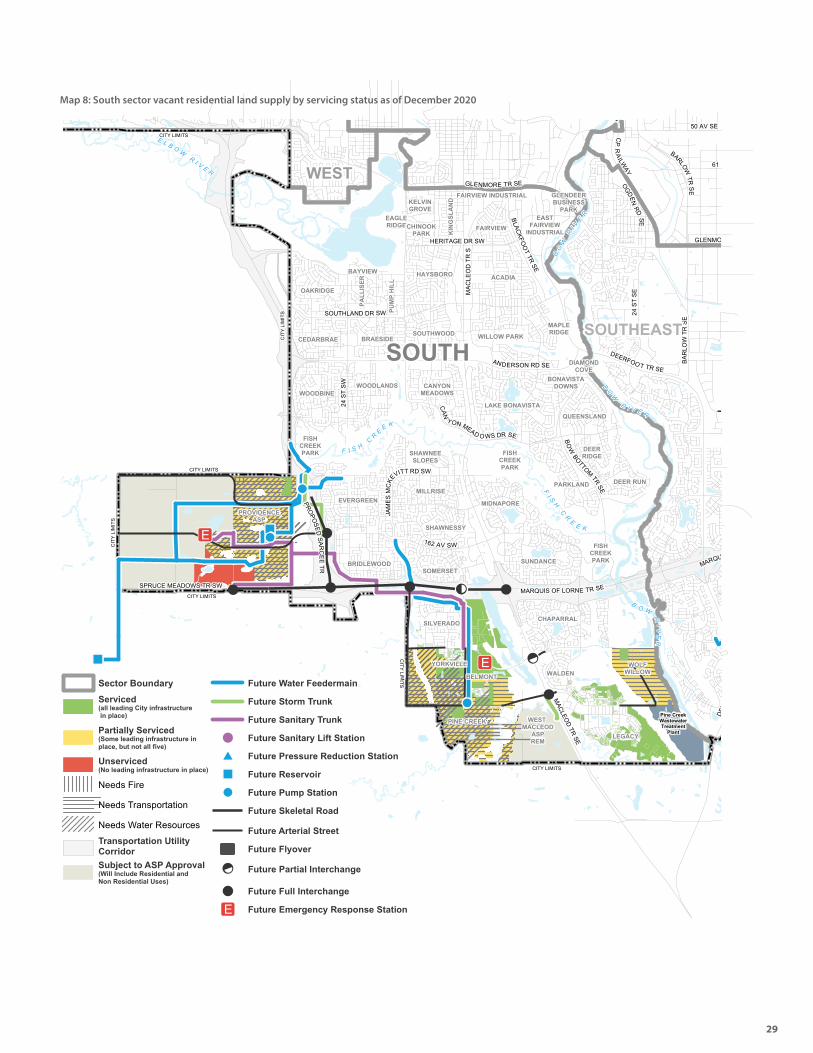
Ä
!L
Ä
!L
ÄÄ Ä
Ä
"
"
¬
¬
¬¾¾E
¾¾E
GLENDEERBUSINESS
PARKEAST
FAIRVIEWINDUSTRIAL
FAIRVIEW INDUSTRIAL
FAIRVIEW
KIN
GSL
AN
DKELVINGROVE
EAGLERIDGECHINOOK
PARK
HAYSBORO ACADIABAYVIEW
OAKRIDGE
PALL
ISER
PUM
P H
ILL
CEDARBRAE BRAESIDE
WOODBINEWOODLANDS CANYON
MEADOWS
SOUTHWOOD WILLOW PARK
MAPLERIDGE
LAKE BONAVISTA
BONAVISTADOWNS
DIAMONDCOVE
QUEENSLAND
FISHCREEKPARK
FISHCREEKPARK
FISHCREEKPARK
EVERGREEN
SHAWNEESLOPES
MILLRISE
SHAWNESSY
BRIDLEWOODSOMERSET
MIDNAPORE
SUNDANCE
SILVERADO
WALDEN
LEGACY
CHAPARRAL
PARKLAND
DEERRIDGE
DEER RUN
WEST MACLEOD
ASPREM
WOLFWILLOW
BELMONT
YORKVILLE
PROVIDENCEASP
PINE CREEK
D
50 AV SE
61 A
CP
RA
ILWAY
OGDENRD
SE
GLENMO
BARLOW
TRSE
BAR
LOW
TRSE
24ST
SE
DEERFOO T TR SE
BLACKFO
OT
TRSE
MAC
LEO
DTR
S
HERITAGE DR SW
GLENMORE TR SE
MARQU
BO
WBOTTOM
TRSE
DEE
MACLEO
DTR
SE
BO W
RI V
ER
BO
W
R I V E R
BO
WR
I V
E
R
E L B O WR I V E R
MARQUIS OF LORNE TR SE
162 AV SW
JAM
ESM
CKE
VITT RD SW
F I S HC
RE
E K
24ST
S W
SOUTHLAND DR SW
CAN
YON MEAD O WS DR SE
ANDERSON RD SE
FI S
HC
R
EE K
SPRUCE MEADOWS TR SW
PROPO
SEDSAR
CEE
TR
CITY LIMITS
CITY
LI MI TS
CIT
YLI
MI T
S
CITY LIMITS
CIT
YLI
MIT
S
CITY LIMITS
CITY LIMITS
Pine CreekWastewaterTreatment
Plant
SOUTHSOUTHEAST
WEST
Sector BoundaryServiced (all leading City infrastructure in place)
Partially Serviced(Some leading infrastructure in place, but not all five)
Unserviced(No leading infrastructure in place)
Needs Fire
Needs Transportation
Needs Water Resources
Transportation Utility CorridorSubject to ASP Approval(Will Include Residential and Non Residential Uses)
Future Water Feedermain
Future Storm Trunk
Future Sanitary Trunk
! Future Sanitary Lift Station
¸ Future Pressure Reduction Station
" Future Reservoir
¬ Future Pump Station
Future Skeletal Road
Future Arterial Street
³ Future Flyover
!L Future Partial Interchange
Ä Future Full Interchange
¾¾E Future Emergency Response Station
2928
Map 8: South sector vacant residential land supply by servicing status as of December 2020

0 1000 2000 3000 4000 5000 6000 7000 8000 9000
PARTIALLY / UNSERVICED LAND CAPACITYFUNDED LAND CAPACITYSERVICED LAND CAPACITYEXISTING 2020 UNITS
Aspen Woods
Calgary West ASP
Crestmont
West Springs
Springbank Hill
West View ASP remainder
395
65518
2,244
193731
2,827
2,811
2,106
164695
234
30
West sector
Currently in the West sector there are four actively developing communities: West Springs, Aspen Woods, Springbank Hill and Crestmont. Of the four actively developing communities, Crestmont is expected to be completed during the forecasted period considering single/semi demand and available supply.
Forecasts for 2021-2025
Forecasts for 2021-2025 are estimating growth of 760 single/semi units (4 per cent) of the new suburban single/semi total. Multi-units are unpredictable to forecast, however, estimates for the next five years are for 4 per cent or 640 units.
Historical absorption 2016-2020
Actively developing communities in the South sector accounted for an average of 6 per cent of total suburban unit growth between 2016 and 2020, adding 1,530 total units (306 units per year average).
Existing supply
The capacity of the West sector’s vacant land is determined by three measures: planned, funded and serviced land supply. The planned land supply in the West sector has capacity for 14,062 total units (4,461 single/semi and 9,601 multi units) on 426 hectares, able to accommodate an estimated 35,843 people. Servicing status and infrastructure requirements as of December 2020 are provided in the servicing table below and Map 9 for the planned land. Of this a vacant land supply of 203 hectares exist that are considered serviced, which can hold an estimated 8,487 total units (1,536 single/semi and 6,951 multi units) and 20,361 people. There is no funded area (GMO removed area) in this sector. The serviced land supply capacity can provide an estimated 8 to 12 years of land supply.
West Sector demand-supply balance sheet
Figure 10: West sector single/semi capacity of new suburban communities and Area Structure Plans (ASP)
Dwelling Type
Serviced land Capacity as of
April 2020
Additional Funded Future Capacity (One Calgary 2019-2022 service
plan and budget)Total Supply (
Serviced + Funded)Forecast
(2021-2025)Surplus (Shortfall) End of April 2025
Supply end of April 2025
Years of Supply End of April 2025
Single/Semi 1,536 0 1,536 760 776 776 3 to 7
Multi 6,951 0 6,951 640 6,311 6,311 40 to 59

3130
West sectorFire, transportation and major utility (water, sanitary, storm) infrastructure requirements as of December 2020
Suburban supply by servicing status as of December 2020
Calgary West ASP
Water: Above 1248 metres is beyond the service level of the Broadcast Hill pressure zone and is therefore not serviceable by The City.
Transportation:Transcanada Highway (TCH) and Valley Ridge Boulevard (VRB) interchange upgrade required for any development. With this improvement and Stoney Tr. South extension up to 70 per cent of proposed land use density of the ASP can be supported. Traffic volume is the determining factor.
Springbank Hill
Water:The Strathcona Flow Control Station is required for pressure reduction on 17 Avenue and 85 Street SW to accommodate growth in the Strathcona Pressure Zone and is expected to be completed by 2020.
Sanitary:
Two regional sanitary servicing strategies were proposed by developers and both were considered acceptable by Water Resources: Option A with a new sanitary extension to the existing 85 Street Sanitary Trunk and minimal upgrades of the existing sanitary mains along Spring Willow Way SW and Option B with all flows to Spring Willow Way SW and substantial required sanitary upgrades. Option A was chosen by developers and design has started in 2019. Developers will design and construct the sanitary mains to the existing connection at 85 ST SW for the west catchment and construct any required upgrades along the Spring Willow Way SW route for the east catchment.
Storm:
The storm servicing strategy shall be based on the Springbank Hill Master Drainage Plan (2017). Lands east of 81 ST SW will be serviced by an existing trunk at Spring Willow Way SW to the 69 Street Storm Trunk and 69 Street/Strathcona pond, whereas, lands west of 81 ST SW will flow from a regional storm pond or from on site storage through the ravine to the Montreux pond. One section of storm pipe may become capital-funded depending on where developers send their stormwater.
General
Transportation:
Stoney Trail to be designed and constructed by the Province within the West Sector. Expected completion date to be determined. New interchanges along Stoney Trail at 69 Street SW, Glenmore Trail - Highway 8, 17 Avenue SW (partial interchange with movements provided to and from the south only), Bow Trail SW, Old Banff Coach Road SW (partial interchange with movements provided to and from the north only). Upgrades to interchanges along Stoney Trail at Trans-Canada Highway; Upgrades to interchange along Trans-Canada Highway at Valley Ridge Boulevard / Crestmont Boulevard SW. Supporting arterial road network required to support full development: 17 Avenue SW, Bow Trail SW, Old Banff Coach Road SW, Crestmont Boulevard SW, 85 Street SW.
Category Serviced Partially Serviced Unserviced Total Supply
MeasureSingle/Semi Multi Total Population Single/Semi Multi Total Single/Semi Multi Total Single/Semi Multi Total Population
Units Ha Units Ha Units Ha Capacity Units Ha Units Ha Units Ha Units Ha Units Ha Units Ha 1 Ha Units Ha Units Ha Capacity
1,536 127 6,951 76 8,487 203 20,361 2,372 137 2,282 42 4,654 179 553 36 368 8 921 44 4,461 300 9,601 126 14,062 426 35,843
Includes vacant subdivided and unsubdivided lands
Serviced (City Infrastructure): represents lands that have all infrastructure or utility capacity in place (fire, transportation,water, sanitary and storm sewer in place)
Partially Serviced: represents lands that have some infrastructure or utility capacity in place, but not all five
Unserviced: represents lands that have no infrastructure or utility capacity in place (no fire, transportation,water, sanitary or storm sewer in place)
The inventory excludes areas of land for which there is no Area Structure Plan in place (Planned Land Supply)
Source: City of Calgary: Planning & Development, Fire, Transportation and Water Resources

32
Ä
Ä
! L
Ä
!L
ÄÄ!L
¬
¬
VALLEY RIDGE
CRESTMONT
CANADAOLYMPIC
PARK
COUGAR RIDGE
PATTERSON
COACH HILL
WEST SPRINGS
ASPEN WOODS
SPRINGBANK HILL
STRATHCONA PARK
CHRISTIE PARK
SIGNAL HILL
DISCOVERY RIDGE
CALGARY WESTASP
MEDICINE HILLS
WEST VIEW ASP
B O W R I V E R
B OW
R I V E R
GLENMORE TR SW
BOW TR SW
SARCEE
TRSW
69STSW
17 AV SW
PROPO
SEDST O
NEY
TR
101ST
SW
8 5ST
SW
OLD BANFF COACH RD SW
16 AV NW
CPRAILW
AY
TRANS CANADA HI W
CITY LIMITS
CITYLIMITS
CITY LIMITS
WEST
NORTHWEST
Sector BoundaryServiced (all leading City infrastructure in place)
Partially Serviced(Some leading infrastructure in place, but not all five)
Unserviced(No leading infrastructure in place)
Needs Fire
Needs Transportation
Needs Water Resources (water, sanitary or storm)
Subject to ASP Approval(Will Include Residential and Non Residential Uses)
Future Water Feedermain
Future Storm Trunk
Future Sanitary Trunk
! Future Sanitary Lift Station
¸ Future Pressure Reduction Station
" Future Reservoir
¬ Future Pump Station
Future Skeletal Road
Future Arterial Street
³ Future Flyover
!L Future Partial Interchange
Ä Future Full Interchange
¾¾E Future Emergency Response Station
Transportation Utility Corridor
Map 9: West sector vacant residential land supply by servicing status as of December 2020
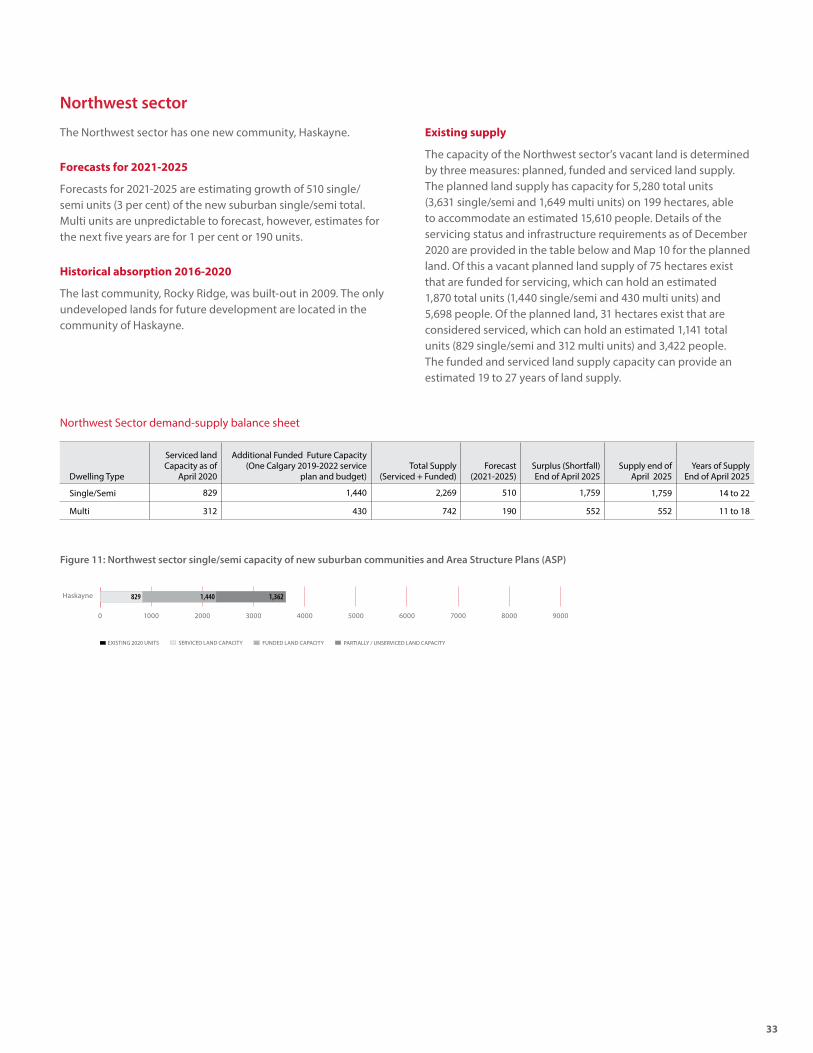
0 1000 2000 3000 4000 5000 6000 7000 8000 9000
PARTIALLY / UNSERVICED LAND CAPACITYFUNDED LAND CAPACITYSERVICED LAND CAPACITYEXISTING 2020 UNITS
Haskayne 829 1,440 1,362
3332
Northwest sector
The Northwest sector has one new community, Haskayne.
Forecasts for 2021-2025
Forecasts for 2021-2025 are estimating growth of 510 single/semi units (3 per cent) of the new suburban single/semi total. Multi units are unpredictable to forecast, however, estimates for the next five years are for 1 per cent or 190 units.
Historical absorption 2016-2020
The last community, Rocky Ridge, was built-out in 2009. The only undeveloped lands for future development are located in the community of Haskayne.
Existing supply
The capacity of the Northwest sector’s vacant land is determined by three measures: planned, funded and serviced land supply. The planned land supply has capacity for 5,280 total units (3,631 single/semi and 1,649 multi units) on 199 hectares, able to accommodate an estimated 15,610 people. Details of the servicing status and infrastructure requirements as of December 2020 are provided in the table below and Map 10 for the planned land. Of this a vacant planned land supply of 75 hectares exist that are funded for servicing, which can hold an estimated 1,870 total units (1,440 single/semi and 430 multi units) and 5,698 people. Of the planned land, 31 hectares exist that are considered serviced, which can hold an estimated 1,141 total units (829 single/semi and 312 multi units) and 3,422 people. The funded and serviced land supply capacity can provide an estimated 19 to 27 years of land supply.
Northwest Sector demand-supply balance sheet
Figure 11: Northwest sector single/semi capacity of new suburban communities and Area Structure Plans (ASP)
Dwelling Type
Serviced land Capacity as of
April 2020
Additional Funded Future Capacity (One Calgary 2019-2022 service
plan and budget)Total Supply
(Serviced + Funded)Forecast
(2021-2025)Surplus (Shortfall) End of April 2025
Supply end of April 2025
Years of Supply End of April 2025
Single/Semi 829 1,440 2,269 510 1,759 1,759 14 to 22
Multi 312 430 742 190 552 552 11 to 18
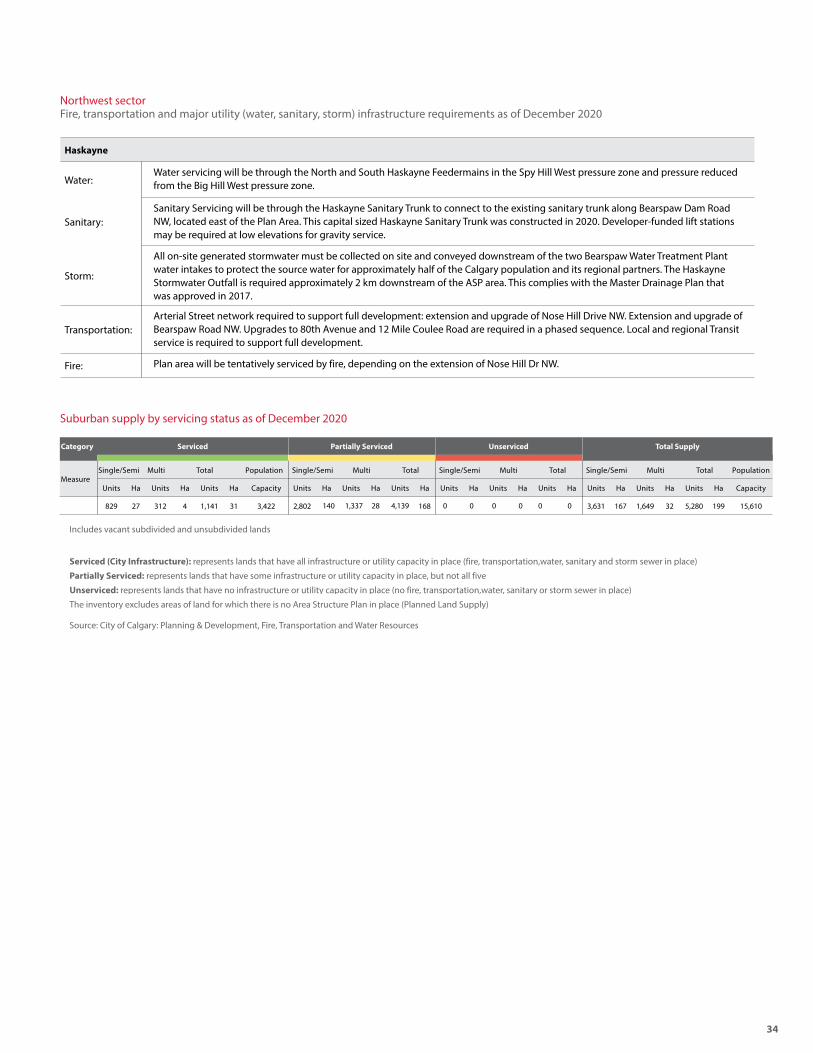
34
Northwest sectorFire, transportation and major utility (water, sanitary, storm) infrastructure requirements as of December 2020
Suburban supply by servicing status as of December 2020
Haskayne
Water:Water servicing will be through the North and South Haskayne Feedermains in the Spy Hill West pressure zone and pressure reduced from the Big Hill West pressure zone.
Sanitary:Sanitary Servicing will be through the Haskayne Sanitary Trunk to connect to the existing sanitary trunk along Bearspaw Dam Road NW, located east of the Plan Area. This capital sized Haskayne Sanitary Trunk was constructed in 2020. Developer-funded lift stations may be required at low elevations for gravity service.
Storm:
All on-site generated stormwater must be collected on site and conveyed downstream of the two Bearspaw Water Treatment Plant water intakes to protect the source water for approximately half of the Calgary population and its regional partners. The Haskayne Stormwater Outfall is required approximately 2 km downstream of the ASP area. This complies with the Master Drainage Plan that was approved in 2017.
Transportation:Arterial Street network required to support full development: extension and upgrade of Nose Hill Drive NW. Extension and upgrade of Bearspaw Road NW. Upgrades to 80th Avenue and 12 Mile Coulee Road are required in a phased sequence. Local and regional Transit service is required to support full development.
Fire: Plan area will be tentatively serviced by fire, depending on the extension of Nose Hill Dr NW.
Category Serviced Partially Serviced Unserviced Total Supply
MeasureSingle/Semi Multi Total Population Single/Semi Multi Total Single/Semi Multi Total Single/Semi Multi Total Population
Units Ha Units Ha Units Ha Capacity Units Ha Units Ha Units Ha Units Ha Units Ha Units Ha Units Ha Units Ha Units Ha Capacity
829 27 312 4 1,141 31 3,422 2,802 140 1,337 28 4,139 168 0 0 0 0 0 0 3,631 167 1,649 32 5,280 199 15,610
Includes vacant subdivided and unsubdivided lands
Serviced (City Infrastructure): represents lands that have all infrastructure or utility capacity in place (fire, transportation,water, sanitary and storm sewer in place)
Partially Serviced: represents lands that have some infrastructure or utility capacity in place, but not all five
Unserviced: represents lands that have no infrastructure or utility capacity in place (no fire, transportation,water, sanitary or storm sewer in place)
The inventory excludes areas of land for which there is no Area Structure Plan in place (Planned Land Supply)
Source: City of Calgary: Planning & Development, Fire, Transportation and Water Resources

ÄÄ!L
¬
¬
¬
¾¾E
¾¾E
ROCKY RIDGE
ROYAL OAK
ARBOUR LAKE
ROYALVISTA
CITADEL
HAWKWOOD
RANCHLANDS
SILVER SPRINGS
TUSCANY
SCENICACRES
BOWNESS
VALLEY RIDGE
CRESTMONT
GREENWOOD/GREENBRIAR
CANADAOLYMPIC
PARK
COUGAR RIDGE
CALGARY WESTASP
GLACIER RIDGE A
HASKAYNE
MEDICINE HILLS
WEST VIEW ASP
B O W R I V E R
B
OW
R I V E R
16 AV
CPRAILW
AY
TRANS CANADA HI W
STO
NEY
TRNW
NOSE
HILLDR
STONEY TR NW
CROWCHILD TR NW
CITY LIMITS
CITYLIM
ITS
CITYL IMITS
CITY LIMITS
FUTURERESEARCH
ANDINDUSTRIAL
PARK
SPYHILLPROVINCIAL
JAIL
SPYHILLLANDFILL
NORTHWEST
NORTH
WEST
Sector BoundaryServiced (all leading City infrastructure in place)
Partially Serviced(Some leading infrastructure in place, but not all five)
Unserviced(No leading infrastructure in place)
Needs Fire
Needs Transportation
Needs Water Resources (water, sanitary or storm)
Subject to ASP Approval(Will Include Residential and Non Residential Uses)
Future Water FeedermainFuture Storm TrunkFuture Sanitary Trunk
! Future Sanitary Lift Station¸ Future Pressure Reduction Station
" Future Reservoir¬ Future Pump Station
Future Skeletal Road
Future Arterial Street
³ Future Flyover
!L Future Partial Interchange
Ä Future Full Interchange
¾¾E Future Emergency Response Station
Transportation Utility Corridor
3534
Map 10: Northwest sector vacant residential land supply by servicing status as of December 2020.

36
6.0 Conclusion
In terms of growth, The City’s long term goal is to strike more of a balance between established areas redevelopment and suburban development, as set out in the Municipal Development Plan. With regards to new suburban areas, two major targets are identified within the plan. The first endeavour aims to maintain up to a 15 year supply of Planned Land (Area Structure Plans in place). As of April 2020, Calgary’s suburban areas have 23-32 years of planed land supply. The supply level should ensure there is no supply constraint in the long term capacity for growth.
The current level of serviced and funded land (approved under the One Calgary 2019-2022 service plan and budget, and expected to be available over the next five years) provides capacity to address the citywide suburban market demand for the next 15-20 years, but capacity varies at sector level.
38
_____________________________________________________________________________________
212 Meridian Road NE • Calgary, AB • T2A 2N6 p: 403.235.1911 • e: [email protected] • w: bildcr.com
November 8, 2021 Calgary Growth Strategies, Planning & Development City of Calgary 800 Macleod Trail South Calgary, AB T2P 3P4 Attention: Nazrul Islam, Senior Planner, Geodemographics, Planning & Development RE: Suburban Residential Growth 2021-2025 Report BILD Calgary Region (BILD) sincerely appreciates the effort of all City of Calgary Management and Staff that contributed to the Suburban Residential Growth 2021 – 2025 Report. We are grateful for the opportunity to collaborate with Nazrul Islam, Carlie Ferguson and team, and commend their hard work and commitment to the Report. BILD would also like to thank our member volunteers who have contributed their time and expertise to review the draft Suburban Residential Growth 2021-2025 Report. Throughout the review process, healthy dialogue has resulted in an improved Report with a number of mutual concerns being addressed. BILD members respectfully highlight the concept of ‘adequate capacity (supply) to meet demand’ as an area where City staff and BILD are not aligned. For example, the Report reads as follows: “The current level of serviced and funded land (approved under the One Calgary 2019-2022 service plan and budget, and expected to be available over the next five years) provides capacity to address the citywide suburban market demand for the next 15-20 years, but capacity varies at sector level.”
BILD suggests both additional infrastructure and communities will be needed to meet demand for the next 15-20 years. BILD would also highlight further considerations such as the challenge of up-to-date data, differing definitions of serviced land supply, impact of disrupters on demand such as the current pandemic, and recognition that in Calgary’s housing market demand is not ‘city-wide’. Defining ‘adequate supply’ must also address supply on a more dispersed community-specific basis. Accordingly, BILD Members and staff are fully committed to further collaboration with the City on refining and improving future suburban residential reporting. Again, we thank the City of Calgary Management and Staff for a positive consultation on this year’s Suburban Residential Growth 2021-2025 Report. We greatly value the spirit of teamwork and partnership reflected in this work. Yours truly, BILD CALGARY REGION
Brian Hahn, CEO