Suburban Nation? Population Growth in Canadian Suburbs…€¦ · · 2014-07-08Suburban Nation?...
70
Suburban Nation? Population Growth in Canadian Suburbs, 2006-2011 Council for Canadian Urbanism Working Paper #1 Derry Road & Thompson Road, Milton ON (Source: SimonP) David L.A. Gordon & Isaac Shirokoff School of Urban and Regional Planning, Queen’s University July, 2014
Transcript of Suburban Nation? Population Growth in Canadian Suburbs…€¦ · · 2014-07-08Suburban Nation?...
Suburban Nation?
Population Growth in Canadian Suburbs, 2006-2011
Council for Canadian Urbanism
Working Paper #1
Derry Road & Thompson Road, Milton ON (Source: SimonP)
David L.A. Gordon & Isaac Shirokoff
School of Urban and Regional Planning, Queen’s University July, 2014

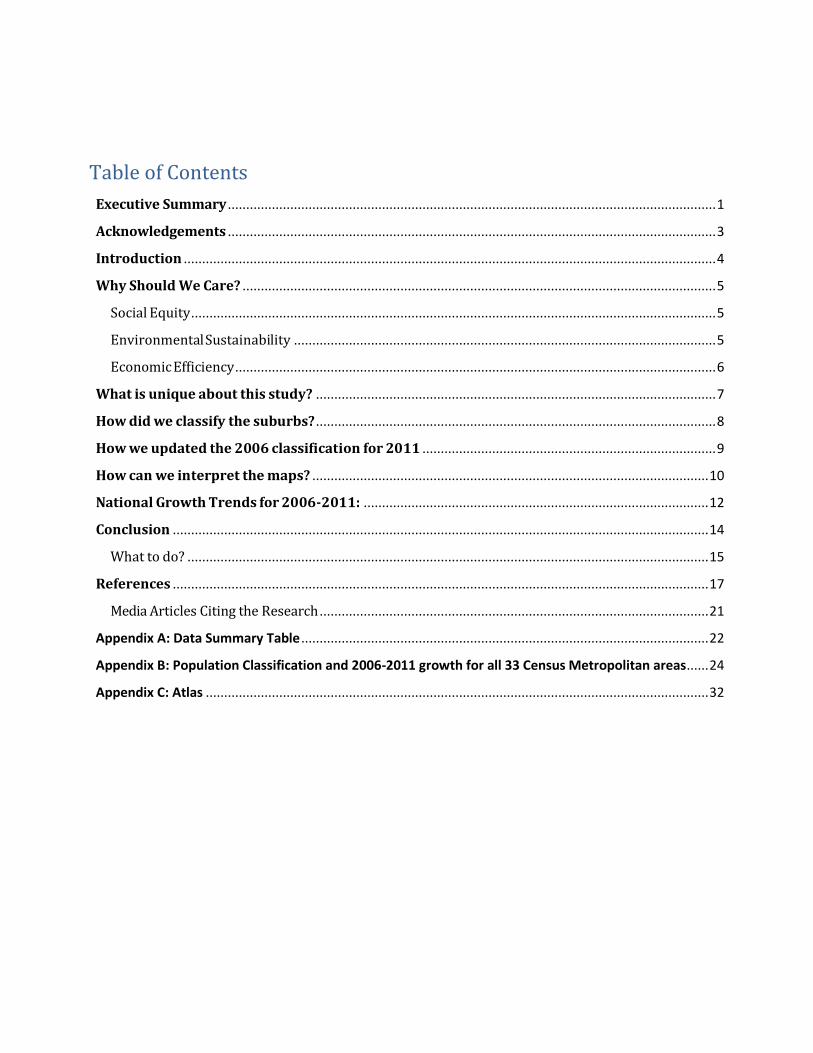
Table of Contents
Executive Summary ..................................................................................................................................... 1
Acknowledgements ..................................................................................................................................... 3
Introduction ................................................................................................................................................. 4
Why Should We Care? ................................................................................................................................. 5
Social Equity ............................................................................................................................................... 5
Environmental Sustainability ................................................................................................................... 5
Economic Efficiency ................................................................................................................................... 6
What is unique about this study? ............................................................................................................. 7
How did we classify the suburbs? ............................................................................................................. 8
How we updated the 2006 classification for 2011 ................................................................................ 9
How can we interpret the maps? ............................................................................................................ 10
National Growth Trends for 2006-2011: .............................................................................................. 12
Conclusion .................................................................................................................................................. 14
What to do? .............................................................................................................................................. 15
References .................................................................................................................................................. 17
Media Articles Citing the Research .......................................................................................................... 21
Appendix A: Data Summary Table ............................................................................................................... 22
Appendix B: Population Classification and 2006-2011 growth for all 33 Census Metropolitan areas ...... 24
Appendix C: Atlas ......................................................................................................................................... 32
1
Executive Summary
Canada is a suburban nation. Two thirds of our country’s population lives in suburbs. In our largest
metropolitan areas, the portion of suburban residents is over 80%, including the Vancouver, Toronto
and Montreal regions (Gordon & Janzen 2013). Their downtowns may be full of new condo towers,
but there is five times as much growth on the suburban edges of the regions.
The purpose of this monograph is to update the article “Suburban Nation? Estimating the size of
Canada’s suburban population”, published in the Journal of Architecture and Planning Research
(JAPR) by David Gordon and Mark Janzen in December 2013. The JAPR article was based upon 1996
and 2006 census data, while this paper updates the research using the 2011 census data that was
released in the summer of 2013.
Our research for the 1996-2006 period estimated that 66% of all Canadians lived in some form of
suburb. In 2006, we found that within our metropolitan areas, 87% of the population lived in
Transit Suburbs, Auto Suburbs or Exurban areas, while only 12% lived in Active Core
neighbourhoods.
Canada’s population growth from 2006-2011 was mapped using the classification method reported in
the JAPR article. Within the Active Cores and Transit Suburbs, both classifications grew by 3%, which
was below the national average population growth of 7%. The Auto Suburbs and the Exurban areas
grew by 9%, exceeding the national average. The net effect of this trend is that 90% of the CMA
population growth from 2006–2011 was in auto suburbs and exurbs. Only 10% of the population
growth was in more sustainable active cores and transit suburbs.
Canadian Metropolitan Neighbourhood Population Distribution for 2006 and 2011
2006 2011
Population Growth 2006-
2011
Population Growth Rate
2006-2011
Share of Population Growth (%) 2006-2011
Population % Population %
Active Core 2,673,222 12.4% 2,762,618 3.3% 89,000 3.3% 5.6%
Transit Suburb 2,364,482 11.0% 2,433,320 2.9% 69,000 2.9% 4.3%
Auto Suburb 14,756,374 68.5% 16,033,565 8.7% 1,277,000 8.7% 80.1%
Exurban 1,717,229 8.0% 1,868,923 8.9% 152,000 8.9% 9.5%
TOTAL CMA 21,529,226 100.0%
23,123,441 7.4% 1,594,000 7.4% 100%
(Source: 2011 Census, Statistics Canada)
2
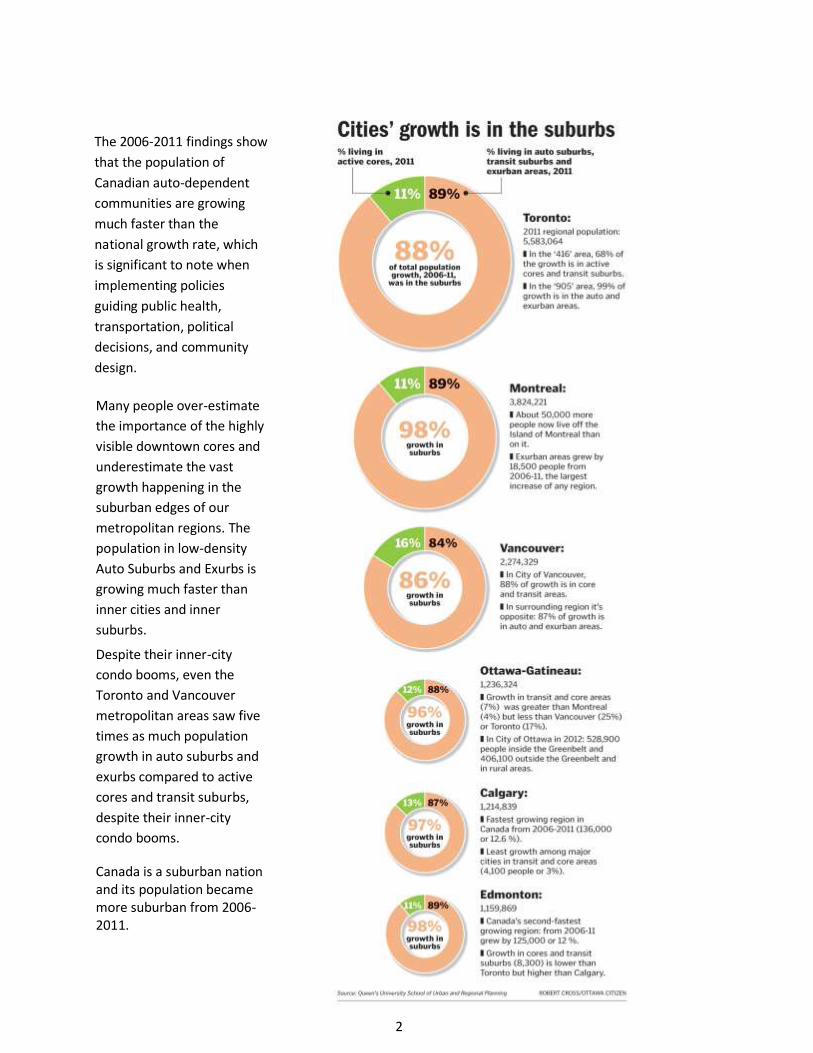
The 2006-2011 findings show
that the population of
Canadian auto-dependent
communities are growing
much faster than the
national growth rate, which
is significant to note when
implementing policies
guiding public health,
transportation, political
decisions, and community
design.
Many people over-estimate
the importance of the highly
visible downtown cores and
underestimate the vast
growth happening in the
suburban edges of our
metropolitan regions. The
population in low-density
Auto Suburbs and Exurbs is
growing much faster than
inner cities and inner
suburbs.
Despite their inner-city
condo booms, even the
Toronto and Vancouver
metropolitan areas saw five
times as much population
growth in auto suburbs and
exurbs compared to active
cores and transit suburbs,
despite their inner-city
condo booms.
Canada is a suburban nation and its population became more suburban from 2006-2011.
3
Acknowledgements
Data Sources: Statistics Canada, 2011 and 2006 Census Tract Data
Funding by Social Sciences and Humanities Research Council of Canada
Principal Investigator:
Dr. David Gordon, Professor and Director, Queen’s University School of Urban and Regional Planning
http://www.queensu.ca/surp/faculty-staff/core-faculty/david-gordon
Contact: [email protected]; 613-533-6000 x 77063
Research collaborators (2007-2012 grant): Dr. Arthur Sweetman (McMaster University); Dr. Betsy
Donald (Queen’s University)
Research assistants included: Angus Beaty, Mehdi Bouhadi, Mathieu Cordary, Anthony Hommik,
Benjamin Jean, Devon Miller, Andrew Morton, Michelle Nicholson, Tyler Nightingale, Thierry Pereira,
Krystal Perepeluk, Julien Sabourault, Jennifer Sandham, Isaac Shirokoff, Amanda Slaunwhite, and Chris
Vandyk.
Peer reviewers included: Ajay Agarwal, Pierre Filion, Jill Grant, Richard Harris, Paul Hess, Nik Luka,
Martin Turcotte, Andrejs Skaburskis and Ian Wight. However, the PI is responsible for any errors or
omissions.
1996 and 2006 data and maps are available at: Canada Suburbs website
Peer-reviewed academic journal reference for methods and 1996-2006 data:
Gordon, David L.A. & Janzen, Mark. Suburban Nation? Estimating the size of Canada’s suburban
population. Journal of Architectural and Planning Research 30:3 (December 2013), pp. 197-220.
Available for no charge at: http://japr.homestead.com/Gordon_FinalVersion131216.pdf
4
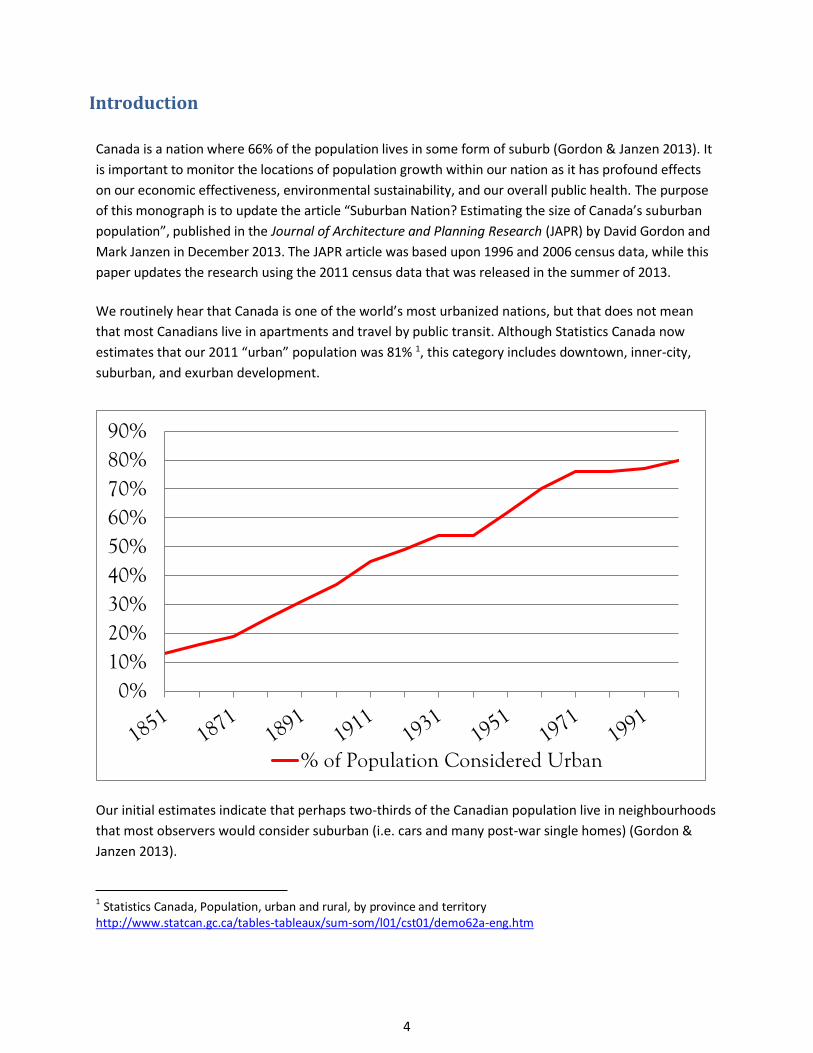
Introduction
Canada is a nation where 66% of the population lives in some form of suburb (Gordon & Janzen 2013). It
is important to monitor the locations of population growth within our nation as it has profound effects
on our economic effectiveness, environmental sustainability, and our overall public health. The purpose
of this monograph is to update the article “Suburban Nation? Estimating the size of Canada’s suburban
population”, published in the Journal of Architecture and Planning Research (JAPR) by David Gordon and
Mark Janzen in December 2013. The JAPR article was based upon 1996 and 2006 census data, while this
paper updates the research using the 2011 census data that was released in the summer of 2013.
We routinely hear that Canada is one of the world’s most urbanized nations, but that does not mean
that most Canadians live in apartments and travel by public transit. Although Statistics Canada now
estimates that our 2011 “urban” population was 81% 1, this category includes downtown, inner-city,
suburban, and exurban development.
Our initial estimates indicate that perhaps two-thirds of the Canadian population live in neighbourhoods
that most observers would consider suburban (i.e. cars and many post-war single homes) (Gordon &
Janzen 2013).
1 Statistics Canada, Population, urban and rural, by province and territory
http://www.statcan.gc.ca/tables-tableaux/sum-som/l01/cst01/demo62a-eng.htm
0%10%20%30%40%50%60%70%80%90%
% of Population Considered Urban
5
Why Should We Care? Social Equity
If the growth trends continue, Canada will become even more suburban in the future, with increased
problems caused by low-density auto-dependent neighbourhoods. For example, there is a growing body
of evidence that suburban lifestyles are correlated with higher obesity rates in children and adults. The
lack of a built environment that promotes physical activity has shown to be a contributing factor to
obese and overweight children and parents (Saelens, et al. 2012; Papas, et al. 2007).
Furthermore, there is evidence that shows a positive association between the frequency of commuting
by transit and physical activity. It was found that frequent and infrequent transit users partake in more
physical activity through active transportation to and from transit stops (Lachapelle et al. 2011). A study
published in the International Journal of Epidemiology investigated the overall reduction in all-cause
mortality through an increase in physical activity. The study concluded that an increase in non-vigorous
physical activity resulted in a reduction of all-cause mortality, particularly found when shifting from
sedentary behaviour to low levels of activity (Woodcock 2010; Arrieta 2008).
Although the suburbs are becoming more socially homogeneous (Moos & Mendez 2014; Hulchanski
2010), the evidence of a political divide between the residents within the inner city and the auto
dependent suburbs creates another social issue (Walks, 2007 & 2013). Politicians who can drive a
wedge between suburban and inner-city voters will have a substantial majority at the polls (Delacourt
2013).
Environmental Sustainability
Suburban areas require different planning techniques to deal with environmental problems such as
resource conservation or auto dependence, which are significantly different from inner-city issues such
as brownfield redevelopment. Sprawling suburban areas are witness to higher rates of automobile use
and vehicle ownership (Ewing et al. 2002). In such areas, people own more cars, drive longer hours, and
commute less by public transit. Extensive automobile use leads to more air pollution and greenhouse gas
emissions compared to commuting by transit, walking, or cycling. The suburban dependence on
automobiles contributes more to climate change emissions, which makes transportation Canada’s
highest sector for contributions to GHG emissions (Environment Canada 2013). As of 2011, cars, trucks,
and motorcycles account for 92% of the GHG emissions produced by passenger transportation in
Canada. Bus, rail, and domestic aviation accounted for the remaining 8% (Environment Canada 2013).
These greenhouse gas emissions stimulate climate change. A study by the National Roundtable on the
Environment and the Economy (NRTEE) in 2011 attempted to assess an economic price tag on climate
change in Canada across three sectors: the BC timber industry, Canada’s coastal regions, and overall
public health with respect to air quality. The report estimated an economic cost on average of $5 billion
per year for each scenario observed as of 2020. The anticipated annual cost increased to $21 billion per
year on the low end and $43 billion on the high end by 2050 (NRTEE 2011).
6
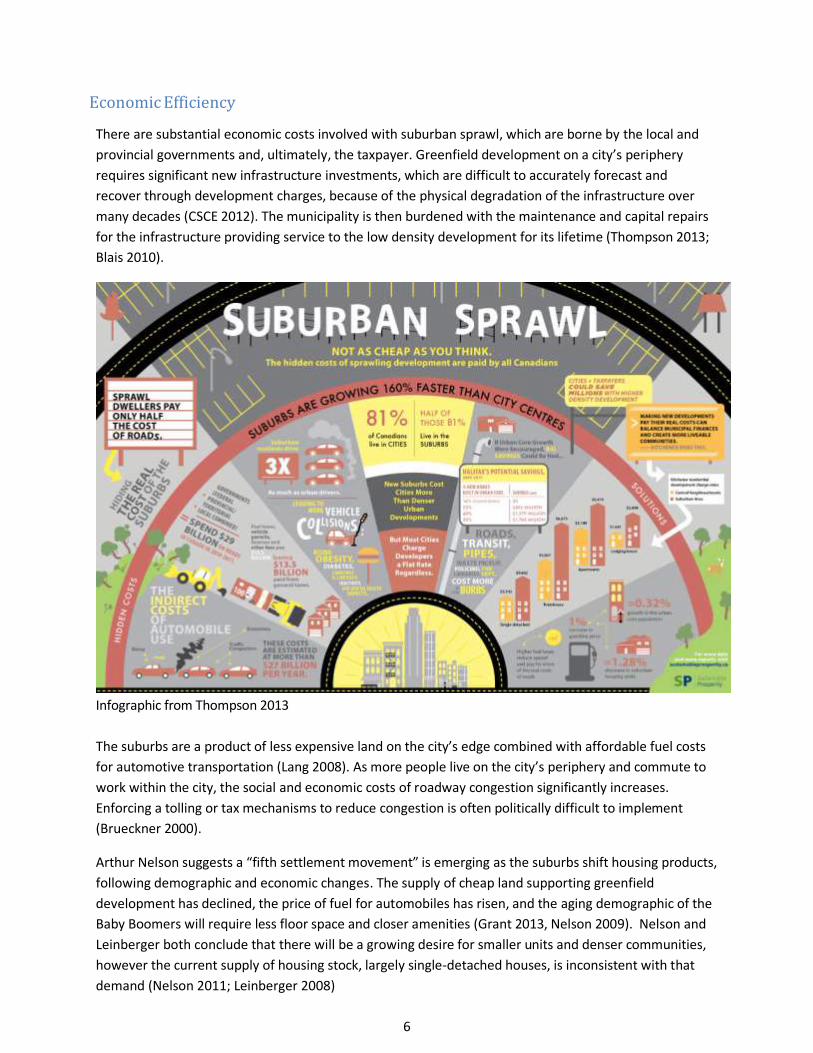
Economic Efficiency
There are substantial economic costs involved with suburban sprawl, which are borne by the local and
provincial governments and, ultimately, the taxpayer. Greenfield development on a city’s periphery
requires significant new infrastructure investments, which are difficult to accurately forecast and
recover through development charges, because of the physical degradation of the infrastructure over
many decades (CSCE 2012). The municipality is then burdened with the maintenance and capital repairs
for the infrastructure providing service to the low density development for its lifetime (Thompson 2013;
Blais 2010).
Infographic from Thompson 2013
The suburbs are a product of less expensive land on the city’s edge combined with affordable fuel costs
for automotive transportation (Lang 2008). As more people live on the city’s periphery and commute to
work within the city, the social and economic costs of roadway congestion significantly increases.
Enforcing a tolling or tax mechanisms to reduce congestion is often politically difficult to implement
(Brueckner 2000).
Arthur Nelson suggests a “fifth settlement movement” is emerging as the suburbs shift housing products,
following demographic and economic changes. The supply of cheap land supporting greenfield
development has declined, the price of fuel for automobiles has risen, and the aging demographic of the
Baby Boomers will require less floor space and closer amenities (Grant 2013, Nelson 2009). Nelson and
Leinberger both conclude that there will be a growing desire for smaller units and denser communities,
however the current supply of housing stock, largely single-detached houses, is inconsistent with that
demand (Nelson 2011; Leinberger 2008)
7
What is unique about this study?
Arthur Nelson describes American suburbs as “low densities spread across vast landscapes, they are
dominated by one land use: the single-detached home on a large lot, dependent on the automobile, and
so inefficiently developed as to rob America of economic vitality.”(Nelson cited in Grant 2013 p. 392)
The term suburb is used with many different definitions. It is important to create a level of consistency
with the description of the suburbs so that comparisons can be made across disciplines and data
sources. Ann Forsyth defined suburbs using descriptions from a number of academic papers. She
grouped the classifications into several types of descriptions: location, built environment characteristics,
transportation, activities, political places, sociocultural, and year of construction (Forsyth 2012). Forsyth
concluded that many definitions of suburbs are really catalogs of their ills. She suggests defining suburbs
by their type or an environmental indicator. For our purposes, we settled upon transportation behaviour
and density as our main suburb indicators, after experimenting with dozens of definitions (Gordon &
Janzen 2013).
There are many research studies of Canadian suburbs, but most only compare a few of the larger cities.
To our knowledge, this is the first study to develop a classification of suburban areas that gives credible
results across Canada, in cities large and small (See comparison tables in Appendices A & B). This allows
us to make nation-wide estimates of the extent of suburbs and compare any or all of the 33
metropolitan areas (CMAs) on a standard basis. We produced an atlas of maps of the metropolitan
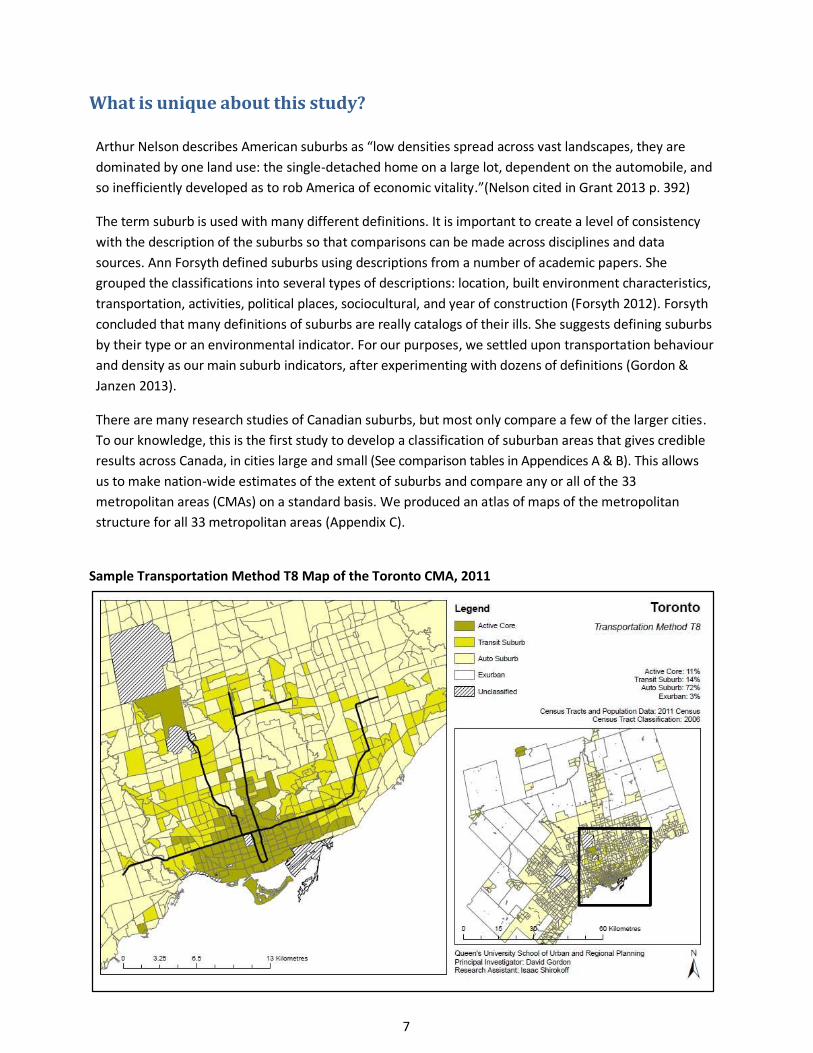
structure for all 33 metropolitan areas (Appendix C). Sample Transportation Method T8 Map of the Toronto CMA, 2011
8
How did we classify the suburbs?
This research program spent five years testing a series of models to estimate the proportion of
Canadians who live in suburban neighbourhoods. Statistics Canada census data was extracted at the
neighbourhood level and classified with basic Geographical Information Systems (GIS)
We tested scores of different definitions of ‘suburbs’ for all 33 big metropolitan areas (CMAs over
100,000 population) and a structured sample of Census Agglomerations (10,000-99,000 people). We
worked at the neighbourhood level, reviewing over 5000 census tracts for each national model.
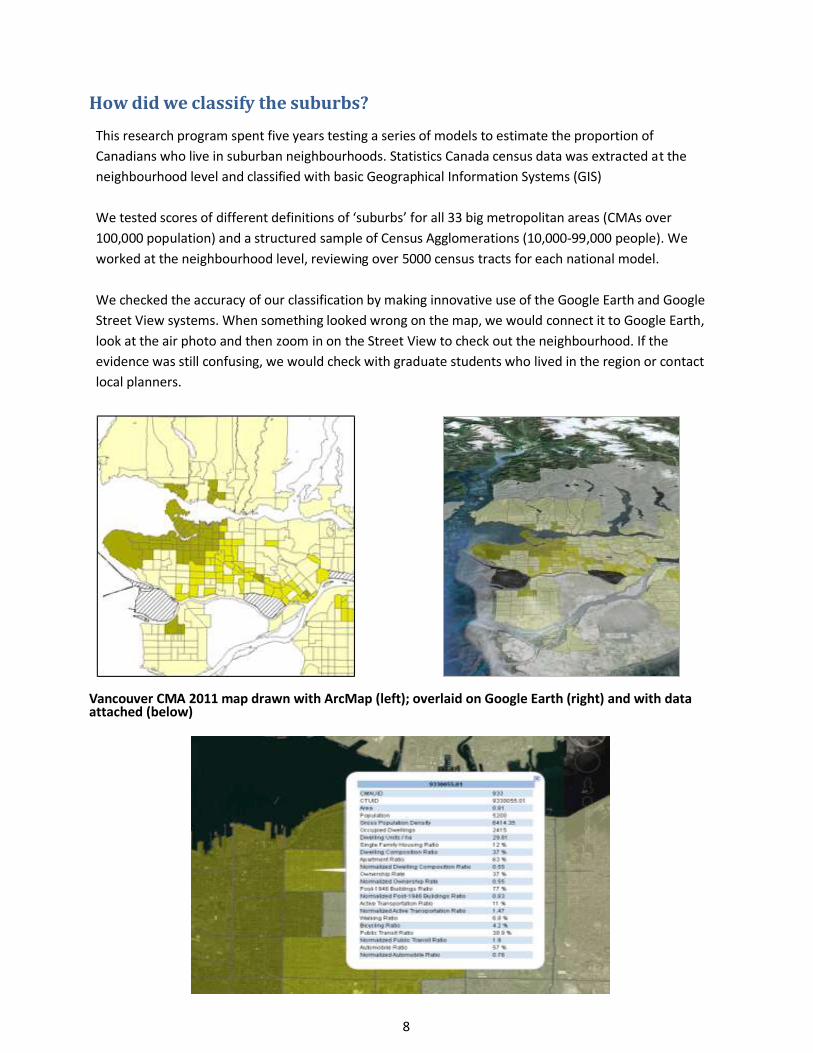
We checked the accuracy of our classification by making innovative use of the Google Earth and Google
Street View systems. When something looked wrong on the map, we would connect it to Google Earth,
look at the air photo and then zoom in on the Street View to check out the neighbourhood. If the
evidence was still confusing, we would check with graduate students who lived in the region or contact
local planners.
Vancouver CMA 2011 map drawn with ArcMap (left); overlaid on Google Earth (right) and with data attached (below)
9
Developing definitions that would give reasonable results across Canada took over five years, because
Canadian cities are quite diverse. Some definitions that seemed reasonable for Vancouver might not
work in Montreal. For example, a definition of the inner-city that was based on many high-rise
apartments might work in Vancouver, but Montreal has several dense, vibrant and walkable urban
neighbourhoods like the Plateau, filled with traditional local triplex (“plex”) townhouses. Conversely,
there are a great deal of townhouses and apartments in many suburban areas across Canada, so we
cannot define a suburb as a neighbourhood of single-detached houses.
We found that Ottawa was a useful pilot study because of its Greenbelt. Few people would suggest that
the neighbourhoods outside the Greenbelt should be considered as inner-city areas. There were many
suburbs inside the Greenbelt, but no inner-city areas outside it (Vandyk 2009). This characteristic proved
useful for calibrating and evaluating models.
Our classification methods were examined by an expert panel of leading geographers and urban
planners as well as anonymous peer reviewers for a refereed journal. Density classifications proved
most useful for classifying exurban and rural areas. The most reliable definitions of inner city and
suburban development emerged from journey-to-work transportation data.
Twelve models for classifying suburbs were tested for the entire nation, with the most credible results
emerging for a classification of Active Cores, Transit Suburbs, Auto Suburbs and Exurban areas. These
classification models estimate that the suburban areas make up approximately 80% of the metropolitan
population and 66% of the national population. (Gordon & Janzen 2013 Table 2; Table 2 Below)
We do not need an exact count of suburban households for practical policy making. However, an
improved estimate of the proportion and the rate of growth of the Canadian suburban population has
proven useful for research shaping an urban infrastructure program or public health research.
How we updated the 2006 classification for 2011
The most recent Canadian census was taken in the summer of 2011 and the data was released in
summer of 2013. Unfortunately, the federal government made the “long-form” questionnaire optional,
rendering its results impossible to compare accurately with previous years on a metropolitan basis
(Hulchanski 2013). The research team used the basic population counts from the 2011 “short-form”
census, which remained mandatory and is comparable to previous years. We used the 2006
classification as a base, and considered where the population growth and decline was, on a
neighbourhood-by-neighbourhood basis. This used all 5070 census tracts in all 33 CMAs. A few new
census tracts were created for 2011 in fast-growing suburbs, but these were all created by splitting
previous tracts, following Statistics Canada standard procedures. We examined every new census tract
in detail using Google Earth, Street View, and local experts, to classify them according to our 2006
method.
10
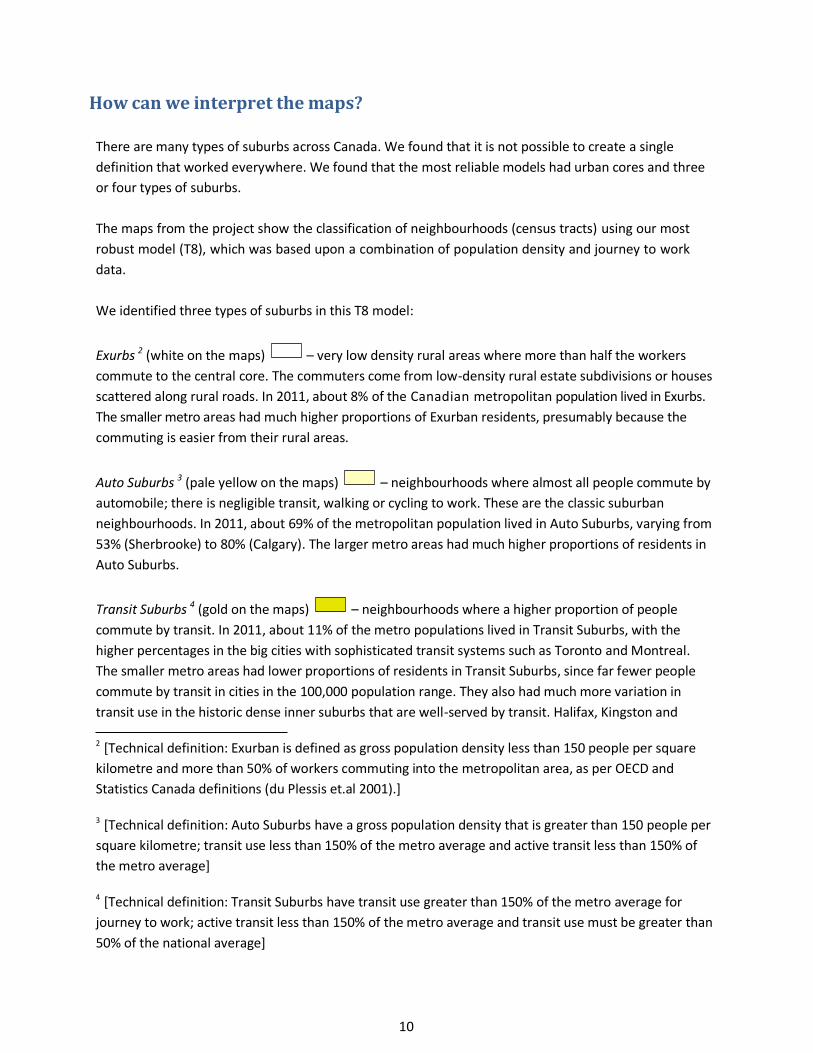
How can we interpret the maps?
There are many types of suburbs across Canada. We found that it is not possible to create a single
definition that worked everywhere. We found that the most reliable models had urban cores and three
or four types of suburbs.
The maps from the project show the classification of neighbourhoods (census tracts) using our most
robust model (T8), which was based upon a combination of population density and journey to work
data.
We identified three types of suburbs in this T8 model:
Exurbs 2 (white on the maps) – very low density rural areas where more than half the workers
commute to the central core. The commuters come from low-density rural estate subdivisions or houses
scattered along rural roads. In 2011, about 8% of the Canadian metropolitan population lived in Exurbs.
The smaller metro areas had much higher proportions of Exurban residents, presumably because the
commuting is easier from their rural areas.
Auto Suburbs 3 (pale yellow on the maps) – neighbourhoods where almost all people commute by
automobile; there is negligible transit, walking or cycling to work. These are the classic suburban
neighbourhoods. In 2011, about 69% of the metropolitan population lived in Auto Suburbs, varying from
53% (Sherbrooke) to 80% (Calgary). The larger metro areas had much higher proportions of residents in
Auto Suburbs.
Transit Suburbs 4 (gold on the maps) – neighbourhoods where a higher proportion of people
commute by transit. In 2011, about 11% of the metro populations lived in Transit Suburbs, with the
higher percentages in the big cities with sophisticated transit systems such as Toronto and Montreal.
The smaller metro areas had lower proportions of residents in Transit Suburbs, since far fewer people
commute by transit in cities in the 100,000 population range. They also had much more variation in
transit use in the historic dense inner suburbs that are well-served by transit. Halifax, Kingston and
2 [Technical definition: Exurban is defined as gross population density less than 150 people per square
kilometre and more than 50% of workers commuting into the metropolitan area, as per OECD and
Statistics Canada definitions (du Plessis et.al 2001).]
3 [Technical definition: Auto Suburbs have a gross population density that is greater than 150 people per
square kilometre; transit use less than 150% of the metro average and active transit less than 150% of
the metro average]
4 [Technical definition: Transit Suburbs have transit use greater than 150% of the metro average for
journey to work; active transit less than 150% of the metro average and transit use must be greater than
50% of the national average]
11
Victoria have relatively high proportions of transit suburbs, while some newer communities such as
Abbotsford, Kelowna and Saguenay have none.
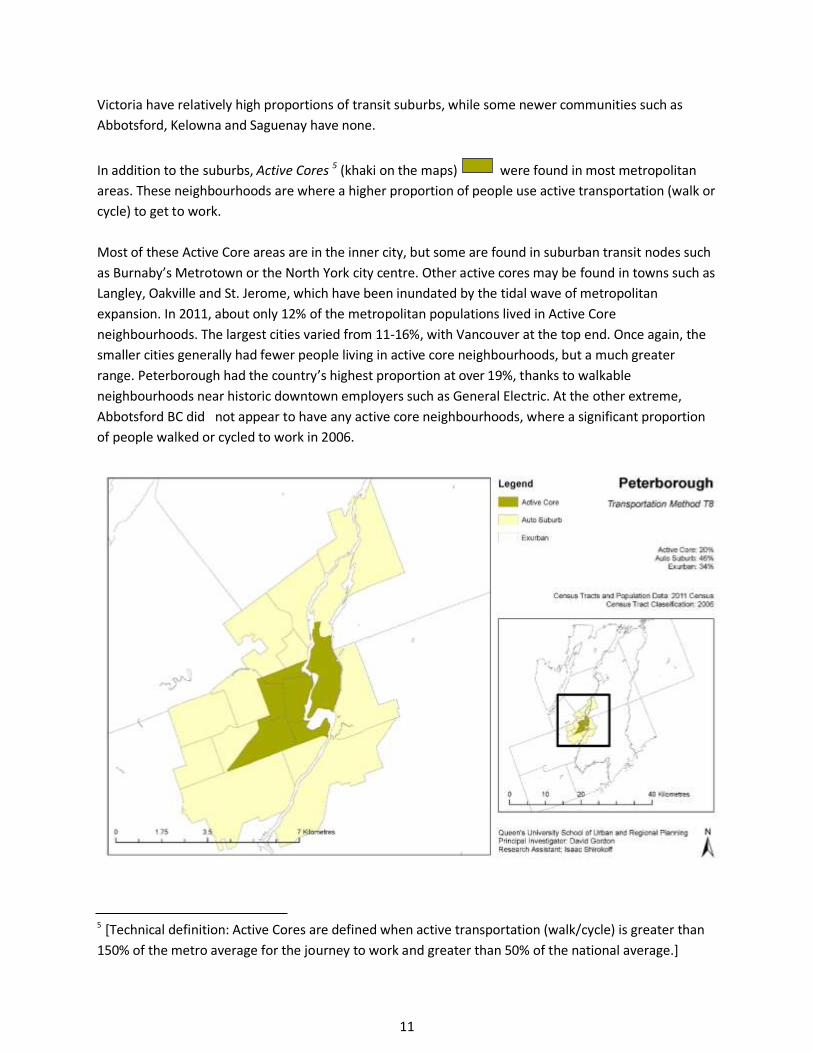
In addition to the suburbs, Active Cores 5 (khaki on the maps) were found in most metropolitan
areas. These neighbourhoods are where a higher proportion of people use active transportation (walk or
cycle) to get to work.
Most of these Active Core areas are in the inner city, but some are found in suburban transit nodes such
as Burnaby’s Metrotown or the North York city centre. Other active cores may be found in towns such as
Langley, Oakville and St. Jerome, which have been inundated by the tidal wave of metropolitan
expansion. In 2011, about only 12% of the metropolitan populations lived in Active Core
neighbourhoods. The largest cities varied from 11-16%, with Vancouver at the top end. Once again, the
smaller cities generally had fewer people living in active core neighbourhoods, but a much greater
range. Peterborough had the country’s highest proportion at over 19%, thanks to walkable
neighbourhoods near historic downtown employers such as General Electric. At the other extreme,
Abbotsford BC did not appear to have any active core neighbourhoods, where a significant proportion
of people walked or cycled to work in 2006.
5 [Technical definition: Active Cores are defined when active transportation (walk/cycle) is greater than
150% of the metro average for the journey to work and greater than 50% of the national average.]
12
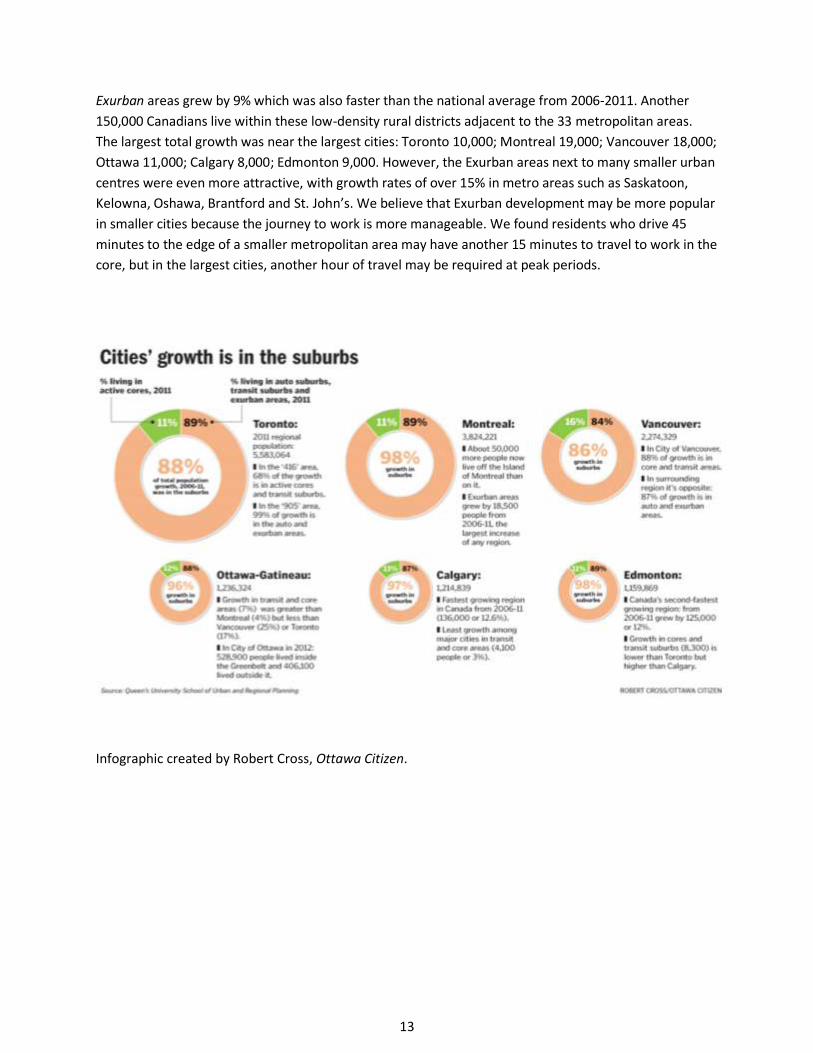
National Growth Trends for 2006-2011:
Low density automobile suburbs and exurbs absorbed the vast majority of the population growth in
Canada’s metropolitan areas from 2006 to 2011.
These areas account for over eight times as many new residents as in the active cores and transit
suburbs. (1.43 million to 160,000)
Table 2: Population growth from 2006-2011 within Canada’s CMAs
Population
in 2006
Population
in 2011
Population
Growth 2006-2011
Population
Growth Rate 2006-2011
Share of Population Growth (%) 2006-2011
Active Core 2,673,222 2,762,618 89,000 3.3% 5.6%
Transit Suburb 2,364,482 2,433,320 69,000 2.9% 4.3%
Auto Suburb 14,756,374 16,033,565 1,277,000 8.7% 80.1%
Exurban 1,717,229 1,868,923 152,000 8.9% 9.5%
TOTAL CMA 21,529,226 23,123,441 1,594,000 7.4% 100%
(Source: Gordon & Janzen 2013 and Statistics Canada 2011 Census)
The good news is that almost 90,000 more Canadians live in Active Core neighbourhoods, mostly in the
inner cities. Toronto (53,000) and Vancouver (27,000) make up most of that growth with their widely-
reported condominium apartment booms. No other city had population growth of over 4000 in the
Active Core neighbourhoods. About half the metro areas saw slight declines in their inner city
populations as the pace of new apartment construction did not keep up with declining household sizes
in central city areas.
The Transit Suburbs also grew slowly from 2006-2011, with another 70,000 people living in these inner
suburban neighbourhoods. Once again, Toronto (26,000) and Vancouver (19,000) led with over half this
growth.
The vast majority of Canada’s population growth from 2006-2011 was in low density Auto Suburbs.
These neighbourhoods grew by over 1,280,000 new people. The large metro areas all saw large
increases in the population of automobile-dependent suburbs: Toronto (380,000); Montreal (163,000);
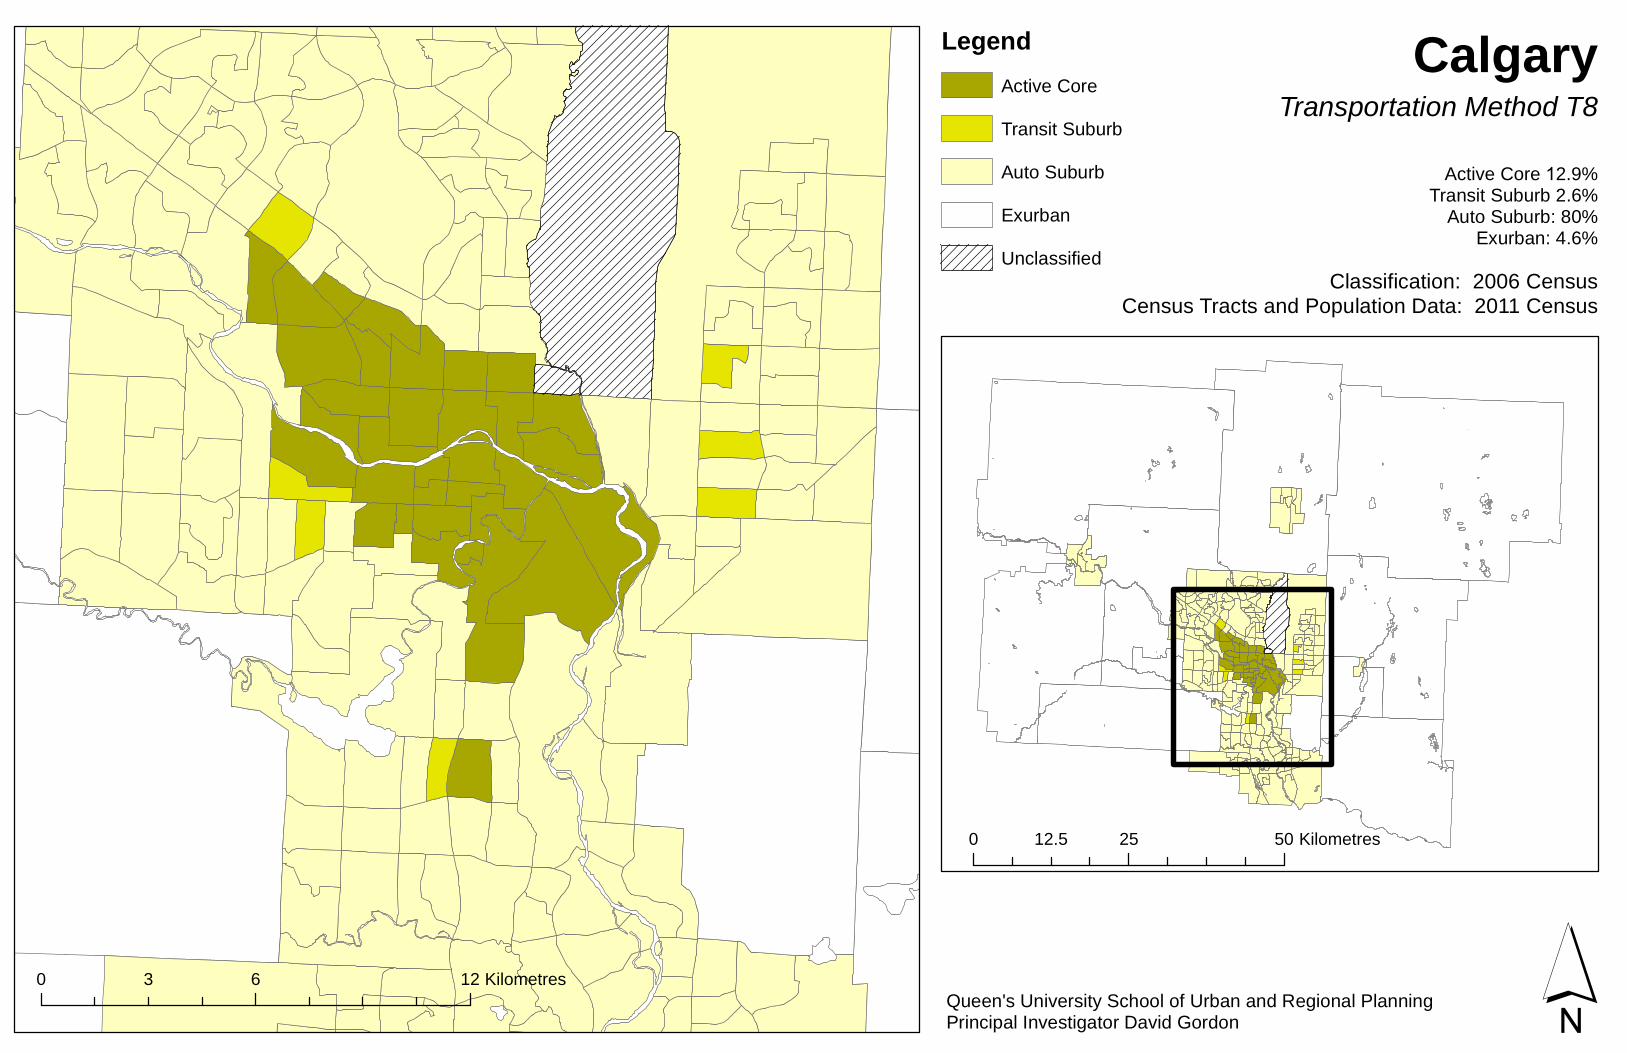
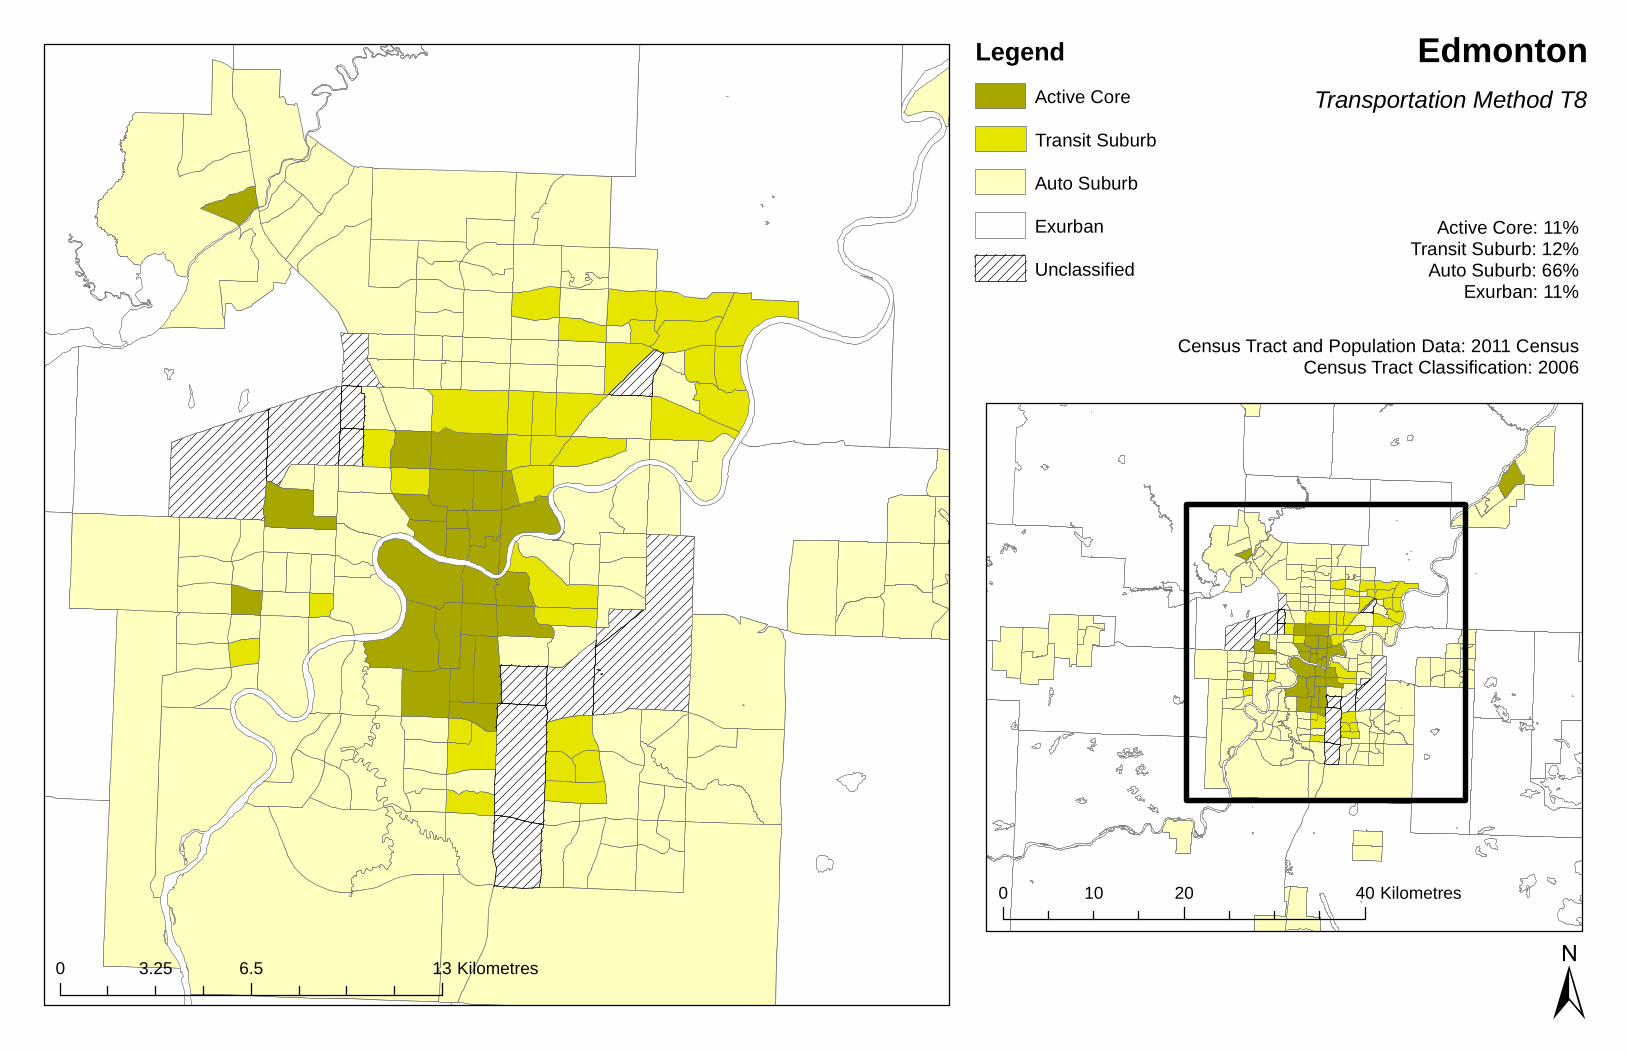
Vancouver (132,000); Ottawa (84,000); Calgary (124,000); Edmonton (107,000). Most of the growth in
the smaller metro areas was also in Auto Suburbs.
13
Exurban areas grew by 9% which was also faster than the national average from 2006-2011. Another
150,000 Canadians live within these low-density rural districts adjacent to the 33 metropolitan areas.
The largest total growth was near the largest cities: Toronto 10,000; Montreal 19,000; Vancouver 18,000;
Ottawa 11,000; Calgary 8,000; Edmonton 9,000. However, the Exurban areas next to many smaller urban
centres were even more attractive, with growth rates of over 15% in metro areas such as Saskatoon,
Kelowna, Oshawa, Brantford and St. John’s. We believe that Exurban development may be more popular
in smaller cities because the journey to work is more manageable. We found residents who drive 45
minutes to the edge of a smaller metropolitan area may have another 15 minutes to travel to work in the
core, but in the largest cities, another hour of travel may be required at peak periods.
Infographic created by Robert Cross, Ottawa Citizen.
14
Conclusion
After five years of developing a method to classify and map the suburban areas of Canada’s 33
metropolitan areas, the results indicate that Canada is a suburban nation with 67% of its population
living in the suburbs in 2011.
When mapping the population growth from 2006-2011 within the active cores and transit suburbs, we
found that both classifications grew by 3%, which was below the national average population growth of
7%. The auto-dependent suburbs and the exurban areas grew by 9%, exceeding the national average.
The net effect of this trend is that 90% of the CMA population growth from 2006 – 2011 was in auto
suburbs and exurbs. Only 10% of the population growth was in more sustainable active cores and transit
suburbs.
The findings show that the population of Canadian auto-dependent communities are growing much
faster than the national growth rate, which is significant to note when implementing policies guiding
public health, transportation, political decisions, and community design.
Across Canada, the more sustainable Active Core and Transit Suburbs grew by 160,000 people, while
Auto Suburb and Exurban areas grew by 1,330,000 people, absorbing over 90% of the nation’s
population growth. Few observers would describe this as a sustainable outcome, or an optimal mix of
locations for Canada’s future population.
Media Coverage of the research is listed in the bibliography
15
What to do?
There is no single magic bullet to deal with the imbalance of urban and suburban growth in Canadian
communities. A multi-pronged planning approach will be needed (Hodge & Gordon 2014, ch. 11)
including:
Rebalancing economic incentives that encourage suburban sprawl and discourage compact
development (Thompson 2013; Blais 2010; Leinberger 2008).
Better intensification in existing urban areas including “invisible density” in secondary suites
and “gentle density” in rear lane housing. (Hess 2008; CMHC 2006a).
Redevelopment of former industrial areas and brownfields on the edges of the inner-city, such
as Brandt’s Creek in Kelowna (former rail yard), Edmonton’s Oliver Village; Wellington Square
in Cambridge (foundry), Spencer Creek Village in Dundas; Toronto’s West Don Lands and
Montréal’s Quai des Éclusiers (DeSousa 2008; CMHC 2006b).
Waterfront redevelopment such as the work of Halifax’s Waterfront Development
Corporation; Canada Lands Corporation on Montréal’s Lachine Canal; Waterfront Toronto;
Edmonton’s Vancouver’s Village at False Creek; and Victoria’s Dockside Green (Grant, Holme
& Pettman 2008; Gordon 2004).
Military base and inner-city airport redevelopment such as Garrison Crossing in Chilliwack, BC;
City Centre airport and Griesbach Village in Edmonton; Garrison Commons in Calgary;
Montréal’s Bois Franc and Pleasantville in St. John’s (Tomalty & Haider 2010).
Transit-Oriented Development including West Vancouver’s SeaBus terminal; The Bridges in
Calgary, Brampton’s Mount Pleasant Village; Oakville’s Port Credit Village; and Village de la
Gare, Mont-Saint-Hilaire QC (CMHC 2010; Dittmar & Ohland 2004).
Street corridor redevelopment plans such as Vancouver’s Cambie Corridor and Toronto’s
Avenues and mid-rise plan (Vancouver 2011; Brook McIlroy 2011).
Retrofitting existing suburbs using “sprawl repair” techniques, such as Burnaby’s Metrotown
and Toronto’s Parkway Forest (Dunham-Jones & Williamson 2011; Tachieva 2010).
Greyfield redevelopment of suburban shopping centres such as Vancouver’s Oakridge Centre;
Markham’s Olde Thornhill Village; and Toronto’s Don Mills Centre (CMHC 2011;
PriceWaterhouseCoopers 2002).
Better design of new suburban development, such as Cornell in Markham, Calgary’s Garrison
Woods and Surrey BC’s City Centre (Tomalty & Haider 2010; Duany, Plater-Zyberk & Speck
2010; Grant 2009; Grant & Perrott 2009, 2011; Duany, Speck and Lydon 2009; Grant 2006;
Gordon & Vipond 2005).
These new strategies to manage the growth of Canada’s booming suburban areas will be demonstrated
at the sixth summit of the Council for Canadian Urbanism (CanU6) “Cities at the Edge” to be held in the
Greater Toronto Area September 18-20, 2014. We hope to see you there.
16
17
References
Arrieta A & Russell LB (2008). Effects of Leisure and Non-Leisure Physical Activity on Mortality in U.S.
Adults over Two Decades. Annals of Epidemiology 18(12): 889-895.
DOI:10.1016/j.annepidem.2008.09.007
Blais, P (2010). Perverse Cities: Hidden Subsidies, Wonky Policy, and Urban Sprawl. Vancouver BC:
UBC Press.
Brook McIlroy and City of Toronto Planning Dept. (2011). Avenues and Mid-Rise Buildings Study.
Toronto: City of Toronto.
Brueckner, J (2000). Urban Sprawl: Diagnosis and Remedies. International Regional Science Review
23(2): 160-171.
Canadian Society of Civil Engineers (CSCE) et al. (2012). The Canadian Infrastructure Report Card.
http://csce.ca/custom-
content/uploads/2012/06/Infrastructure_Report_Card_ENG_Final1.pdf
CMHC Canada Mortgage and Housing Corporation (2011). Olde Thornhill Village, Markham; Lakeshore
Village, Oakville; Greyfield Redevelopment for Housing in Canada — Case Studies, Ottawa: CMHC.
www.cmhc-schl.gc.ca/en/inpr/su/sucopl/
CMHC Canada Mortgage and Housing Corporation (2010). The Bridges, Calgary; Village de la Gare, Mont-
Saint-Hilaire, Quebec; Time, North Vancouver, British Columbia; Transit Oriented Development:
Case Studies. Ottawa: CMHC. www.cmhc-schl.gc.ca/en/inpr/su/sucopl/
CMHC Canada Mortgage and Housing Corporation (2006a). Accessory-Apartments-Policy, Guelph; The
Renaissance at North Hill, Calgary; Harmony, Toronto; Residential Intensification — Case Studies.
Ottawa: CMHC. www.cmhc-schl.gc.ca/en/inpr/su/sucopl/
CMHC Canada Mortgage and Housing Corporation (2006b). Brandt’s Creek Crossing, Oliver Village;
Wellington Square; Spencer Creek Village; Quai des Éclusiers, Brownfield Redevelopment for
Housing: Case Studies. Ottawa: CMHC. www.cmhc-schl.gc.ca/en/inpr/su/sucopl/
De Sousa C (2008). Brownfields Redevelopment and the Quest for Sustainability. London: Emerald Group.
Delacourt S (2013). Shopping for Votes: How Politicians Choose Us and We Choose Them. Vancouver BC:
Douglas & McIntyre.
Dittmar H, Ohland G (2004). The new transit town: Best practices in transit-oriented development.
Washington, DC: Island Press.
du Plessis V, Beshiri R, Bollman RD & Clemenson H (2001). Definitions of rural. Rural and Small Town
Canada Analysis Bulletin 3(3):1-17 (Statistics Canada catalogue no. 21-006-XIE).
http://www.statcan.gc.ca/pub/21-006-x/21-006-x2001003-eng.pdf.
Duany A, Plater-Zyberk E & Speck J (2010). Suburban Nation: The Rise of Sprawl and the Decline of the
American Dream. New York: North Point.
Duany A, Speck J & Lydon M (2009). The Smart Growth Manual. New York: McGraw-Hill.
Environment Canada. (2013). National Inventory Report 1990–2011: Greenhouse Gas Sources and Sinks
in Canada. Ottawa. Environment Canada, pg 72.
Retrieved: http://publications.gc.ca/site/eng/443225/publication.html
Ewing R, Pendall R & Chen D. (2002). Measuring sprawl and Its Impact. Smart Growth America
Retrieved: http://www.smartgrowthamerica.org/research/measuring-sprawl-and-its-impact/
18
Forsyth A (2012). Defining Suburbs. Journal of Planning Literature 27(3): 270-281.
DOI: 10.1177/0885412212448101
Frank LD, Devlin A, Johnstone S & van Loon J (2010). Neighbourhood Design, Travel, and Health in Metro
Vancouver: Using a Walkability Index. Active Transportation Co-laboratory, UBCan
Giles-Corti B, et al. (2013). The Influence of Urban Design on Neighbourhood Walking Following
Residential Relocation: Longitudinal Results from the RESIDE Study. Journal of Social Science &
Medicine Vol. 77, 20–30.
Gordon DLA, Janzen M (2013). Suburban Nation? Estimating the size of Canada’s suburban population.
Journal of Architectural and Planning Research 30 (3): 197-220.
Available at: http://japr.homestead.com/Gordon_FinalVersion131216.pdf Gordon DLA, Vipond S (2005). Gross Density and New Urbanism: Comparing Conventional and New
Urbanist Suburbs in Markham, Ontario. Journal of the American Planning Association 71 (2): 41-
54.
Grant J (2006). Planning the Good Community: new urbanism in theory and practice. New York:
Routledge.
Grant J, Holme R, & Pettman A (2008). Global Theory and Local Practice in Planning in Halifax: The
Seaport Redevelopment. Planning Practice & Research 23 (4): 517-532.
Grant J, Perrott K (2011) Where is the Café? The challenge of making retail uses viable in mixed-use
suburban developments. Urban Studies 48 (1): 177-195.
Grant J, Perrott K (2009) Producing diversity in a new urbanism community: policy and practice. Town
Planning Review 80 (3): 267-289.
Grant J, Nelson AC, Forsyth A, Thompson-Fawcett M, Blais P & Filion P. (2013). The future of the suburbs.
Planning Theory & Practice 14(3): 391-415.
DOI: 10.1080/14649357.2013.808833 Hess P (2008). Fronts and Backs: the use of streets, yards and alleys in Toronto area New Urbanist
neighbourhoods. Journal of Planning Education and Research 28(2) 196-212. Hodge G, Gordon DLA (2014). Planning Canadian Communities, 6th ed. Toronto: Nelson. Hulchanski D (2010) The Three Cities within Toronto: Income Polarization Among Toronto’s
Neighbourhoods, 1970-2005. Toronto: Cities Centre, University of Toronto. Hulchanski D, Murdie R, Walks A & Bourne L. (2013) “Canada’s voluntary census is worthless. Here’s why”
The Globe and Mail, October 4, 2013
http://www.theglobeandmail.com/globe-debate/canadas-voluntary-census-is-worthless-heres-
why/article14674558/
Kerr J, Rosenberg D & Frank LD (2012). The Role of the Built Environment in Healthy Aging:
Community Design, Physical Activity, and Health among Older Adults. Journal of Planning
Literature 27(1) 43-60.
Lachapelle U, Frank LD, Saelens BE, Sallis JF & Conway TL (2011). Commuting by Public Transit and
Physical Activity: Where You Live, Where You Work, and How You Get There. Journal of Physical
Activity and Health 8 (1): 72-82.
Lang RE, Nelson AC & Sohmer RR. (2008). Boomburb downtowns: the next generation of urban centres.
Journal of Urbanism 1(1): 77-90. Leinberger CB (2008). The Option of Urbanism: Investing in a New American Dream. Washington DC:
Island Press.
Lopez-Zetina J, Lee H & Friis R (2006). The Link Between Obesity and the Built Environment: Evidence
From an Ecological Analysis of Obesity and Vehicle Miles of Travel In California. Health & Place
12(4): 656-664.
19
Lupi T, Musterd S (2006). The Suburban ‘Community Question’. Urban Studies 43(4): 801-817. MacDonald JM, Stokes RJ, Cohen DA, Kofner A, & Ridgeway GK (2010). The Effect of Light Rail Transit
on Body Mass Index and Physical Activity. American Journal of Preventive Medicine 39(2): 105-
112.
Moos M, Mendez P (2014) Suburban ways of living and the geography of income: How
homeownership, single-family dwellings and automobile use define the
metropolitan social space. Urban Studies, Vol. 51, forthcoming 2014, DOI:
10.1177/0042098014538679
Mulligan GF, Vias AC. (2006). Growth and change in U.S. micropolitan areas. University of Arizona.
Tucson AZ. DOI 10.1007/s00168-005-0034-6.
National Roundtable on the Environment and the Economy (NRTEE) (2011). Paying the Price: The
Economic Impacts of Climate Change for Canada.
Nelson AC (1993). Disamenity Influences of Edge Cities on Exurban Land Values: A Theory with
Empirical Evidence and Policy Implication. Urban Studies 30(10): 1683-1690.
Nelson AC, Sanchez W (1997). Exurban and Suburban Households: A Departure from Traditional
Location Theory? Journal of Housing Research 8(2): 249-276.
Nelson AC (2009). Catching the Next Wave: Older Adults and the ‘New Urbanism’. Generations 33(4):
37-42.
Nelson AC (2011). The New California Dream: How Demographic and Economic Trends May Shape the
Housing Market. Washington, D.C.: Urban Land Institute.
Papas MA, Alberg AJ, Ewing R et al (2007). The Built Environment and Obesity. Epidemiologic Reviews. 29: 129-143.
DOI: 10.1093/epirev/mxm009 Saelens BE, Sallis JF, Frank LD, et al. (2012). Obesogenic Neighborhood Environments, Child and Parent
Obesity: The Neighborhood Impact on Kids Study. American Journal of Preventive Medicine
42(5): 57-64.
Taylor Z & Van Nostrand J (2008). Shaping the Toronto Region, Past, Present, and Future: An
Exploration of the Potential effectiveness of Changes to Planning policies Governing Greenfield
Development in the greater Golden Horseshoe. Toronto. Neptis Foundation.
Thompson D (2013) Suburban Sprawl: Exposing Hidden Costs, Identifying Innovations. Ottawa:
University of Ottawa, Sustainable Prosperity.
http://thecostofsprawl.com/report/SP_SuburbanSprawl_Oct2013_opt.pdf
Tomalty R, Haider M (2010). Comparing New Urbanist &. Conventional Suburban Developments in
Canada. Ottawa: CMHC. www.cmhc.ca/odpub/pdf/66954.pdf
Vancouver Planning Department (2011). Cambie Corridor Plan. Vancouver BC: City of Vancouver.
Vandyk C (2009). Looking for the Suburbs: A Pilot Study of the Ottawa-Gatineau Census Metropolitan
Area. Kingston ON: Queen’s University School of Urban and Regional Planning, Master’s Report.
van Loon J, Frank LD (2011). Urban Form Relationships with Youth Physical Activity: Implications for
Research and Practice. Journal of Planning Literature 26(3) 280-308.
Walks A (2004) Place of residence, party preferences, and political attitudes in Canadian cities and
suburbs. Journal of Urban Affairs 26(3):269-295.
Walks A (2005) The city-suburban cleavage in Canadian federal politics. Canadian Journal of
Political Science 38(2):383-413.
Walks A (2007) The boundaries of suburban discontent? Urban definitions and neighbourhood
political effects. The Canadian Geographer 51(2):160-185.

20
Walks A (2013) Suburbanism as a Way of Life, Slight Return. Urban Studies 50(8): 1471-1488.
Woodcock J, Franco OH, Orsini N, & Roberts I (2010). Non-Vigorous Physical Activity and All-
Cause Mortality: Systematic Review and Meta-Analysis of Cohort Studies. International
Journal of Epidemiology 40(1): 121-38. DOI:10.1093/ije/dyq104.

21
Media Articles Citing the Research
Cook, Maria, “Suburban nation: An ambitious new study says it’s time for Canadians to dispel our urban
myth” Ottawa Citizen, September 6, 2013, B1-B3,
http://www.ottawacitizen.com/search/Canada+identity+suburban+nation/8880038/story.html
(Story reprinted in Vancouver Sun, Calgary Herald, Edmonton Journal, Saskatoon Star Phoenix,
Montreal Gazette)
Cook, Maria, “In search of the suburban ideal” Ottawa Citizen, September 6, 2013, B2-B3
http://www.ottawacitizen.com/news/ottawa/search+suburban+ideal/8880043/story.html
Cook, Maria, “How your neighbourhood measures up” Ottawa Citizen, September 6, 2013
http://www.ottawacitizen.com/sports/your+neighbourhood+measures/8880047/story.html
Derfel, Aaron, “Exurban growth in Montreal region is worst in country” Montreal Gazette, September 7,
2013, A3-A4
http://www.montrealgazette.com/business/Exurban+growth+Montreal+region+worst+country/
8880348/story.html
Gordon, David, “Condo Boom Masks out-of-control sprawl” Toronto Star, op-ed, September 15, 2013:
http://www.thestar.com/opinion/commentary/2013/09/15/gta_sprawl_out_of_control.html
Howell, Trevor, “Calgary’s top city planner says higher density suburbs strike right balance” Calgary
Herald, September 7, 2013
http://www.calgaryherald.com/news/calgary/Calgary+city+planner+says+higher+density+subur
bs+strike+right+balance/8880991/story.html
Klingbeil, Cailynn, “Edmonton’s love affair with suburbs can’t endure, researcher warns” Edmonton
Journal, September 8, 2013
http://www.edmontonjournal.com/business/Edmonton+love+affair+with+suburbs+endure+res
earcher+warns/8879559/story.html
MacAlpine, Ian, “Kingston’s suburbs growing” Kingston Whig-Standard, September 9, 2013
http://www.thewhig.com/2013/09/09/kingstons-suburbs-growing
Sinoski, Kelly, “Canada: A suburban nation” Vancouver Sun, September 7, 2013
http://www.vancouversun.com/business/Canada+suburban+nation/8879988/story.html
Tank, Phil, “Bedroom communities boom: Growth highest outside Saskatoon city limits” Saskatoon Star
Phoenix, September, 7, 2013
http://www.thestarphoenix.com/news/Bedroom+communities+boom/8882510/story.html
22
Suburban Nation?
Population Growth in Canadian Suburbs, 2006-2011
Council for Canadian Urbanism
Working Paper #1
Appendix A
Data Summary Table for All 33 Census Metropolitan Areas
23
City Total Population in 2006
Total Population in 2011
Population Growth
Active Core Transit Suburb Auto Suburb Exurban
2006 Population
% 2011
Population % Growth
2006 Population
% 2011
Population % Growth
2006 Population
% 2011
Population % Growth
2006 Population %
2011 Population % Growth
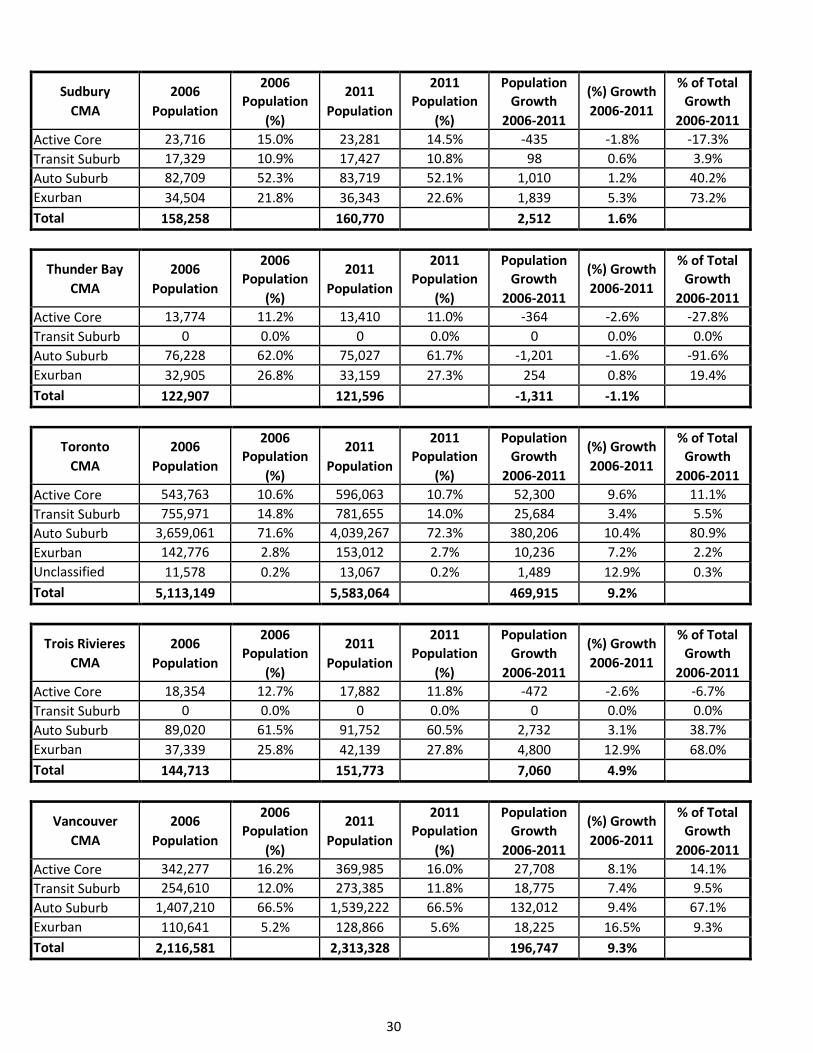
Toronto 5,113,149 5,583,064 9.2% 543,763 10% 596,063 11% 10% 755,971 17% 781,655 16% 3% 3,659,061 83% 4,039,267 84% 10% 142,776 3% 153,012 3% 7%
Montréal 3,635,556 3,824,221 5.2% 404,125 11% 408,014 11% 1% 511,929 16% 514,874 16% 1% 2,586,598 84% 2,749,797 84% 6% 131,085 4% 149,661 4% 14%
Vancouver 2,114,738 2,313,328 7.5% 342,277 16% 369,985 16% 8% 254,610 16% 273,385 15% 7% 1,407,210 84% 1,539,222 85% 9% 110,641 3% 128,866 6% 16%
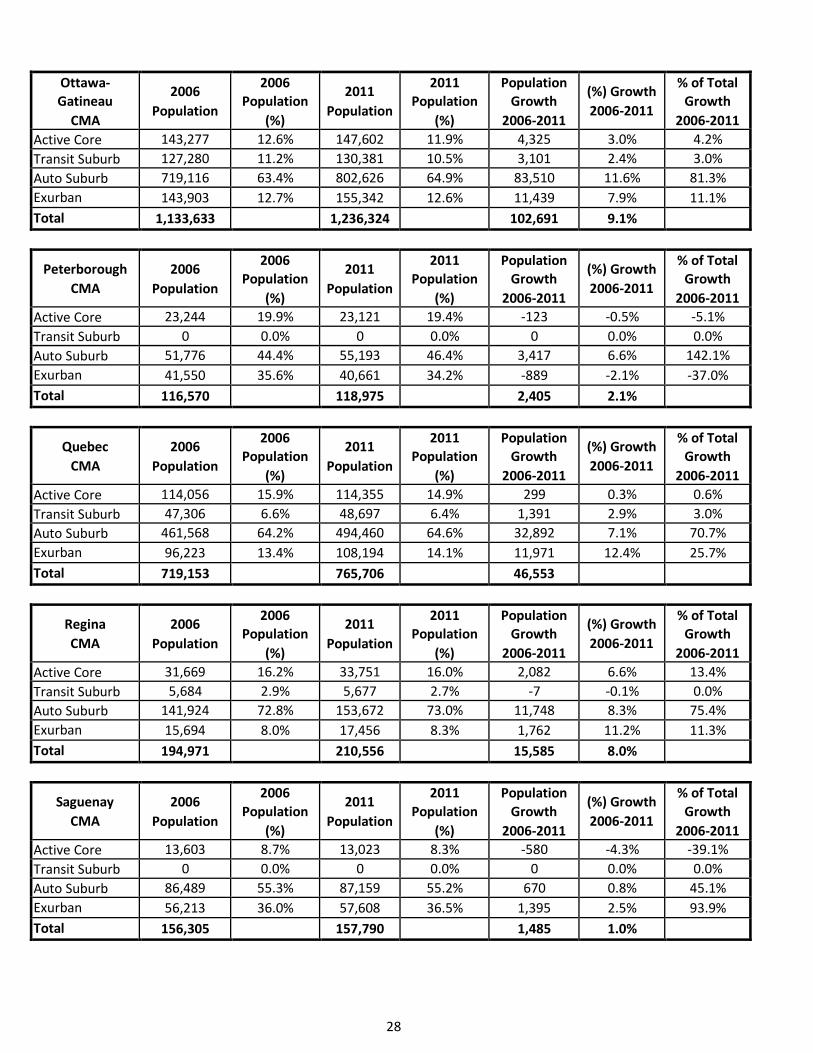
Ottawa 1,133,633 1,236,324 9.4% 143,277 13% 147,602 12% 3% 127,280 14% 130,381 14% 2% 719,116 86% 802,626 86% 12% 143,903 13% 155,342 13% 8%
Calgary 1,079,310 1,214,839 12.6% 152,618 14% 156,547 13% 3% 30,961 4% 31,175 3% 1% 847,745 96% 971,319 97% 15% 44,569 5% 52,369 4% 18%
Edmonton 1,034,945 1,159,869 12.1% 125,004 12% 127,588 11% 2% 136,039 17% 141,736 16% 4% 658,178 83% 765,366 84% 16% 115,173 12% 124,702 11% 8%
Québec 719,153 765,706 7.5% 114,056 16% 114,355 15% 0% 47,306 9% 48,697 9% 3% 461,568 91% 494,460 91% 7% 96,223 12% 108,194 14% 12%
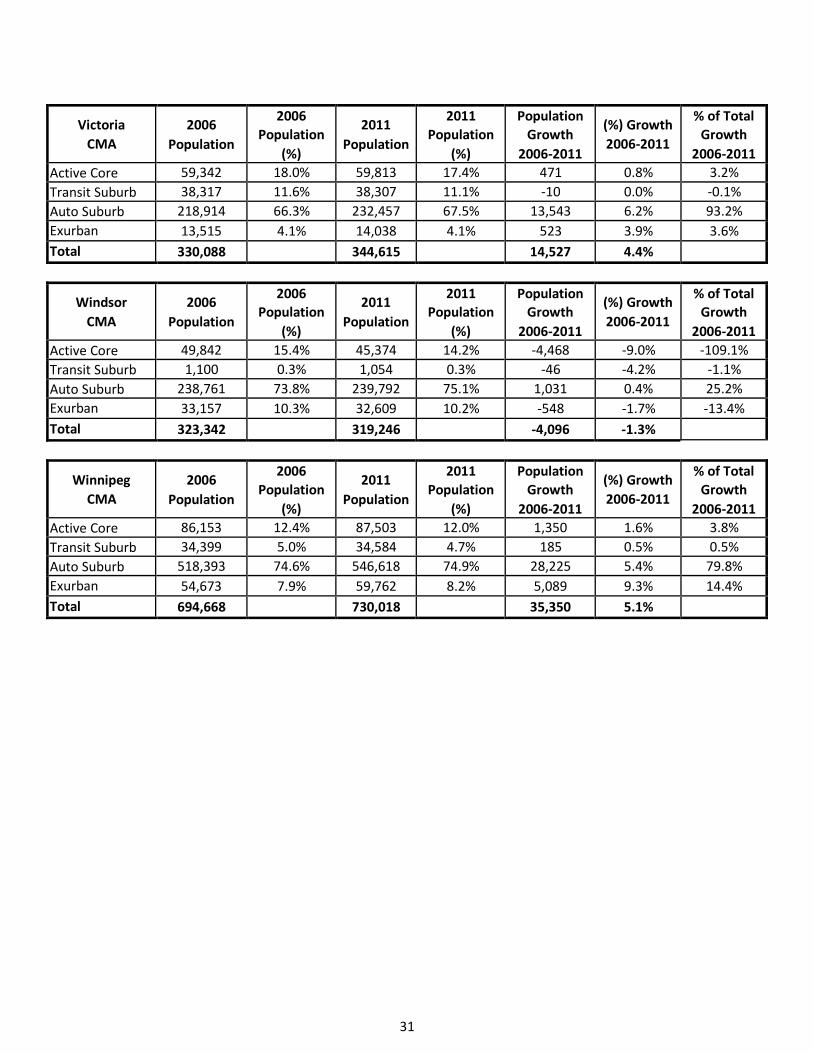
Winnipeg 693,618 730,018 5.1% 86,153 12% 87,503 12% 2% 34,399 7% 34,584 6% 1% 518,393 93% 546,618 94% 5% 54,673 8% 59,762 8% 9%
Hamilton 690,967 721,053 4.0% 82,133 11% 81,708 11% -1% 75,681 13% 74,710 12% -1% 497,205 87% 527,393 88% 6% 35,948 7% 35,296 5% -2%
London 457,720 474,786 3.7% 66,609 15% 64,228 14% -4% 63,472 20% 67,076 20% 6% 263,962 80% 276,381 80% 5% 63,677 15% 67,101 14% 5%
Kitchener 451,235 477,160 6.0% 49,123 11% 48,161 10% -2% 40,956 10% 41,271 10% 1% 341,929 90% 366,858 90% 7% 19,227 5% 20,870 4% 9%
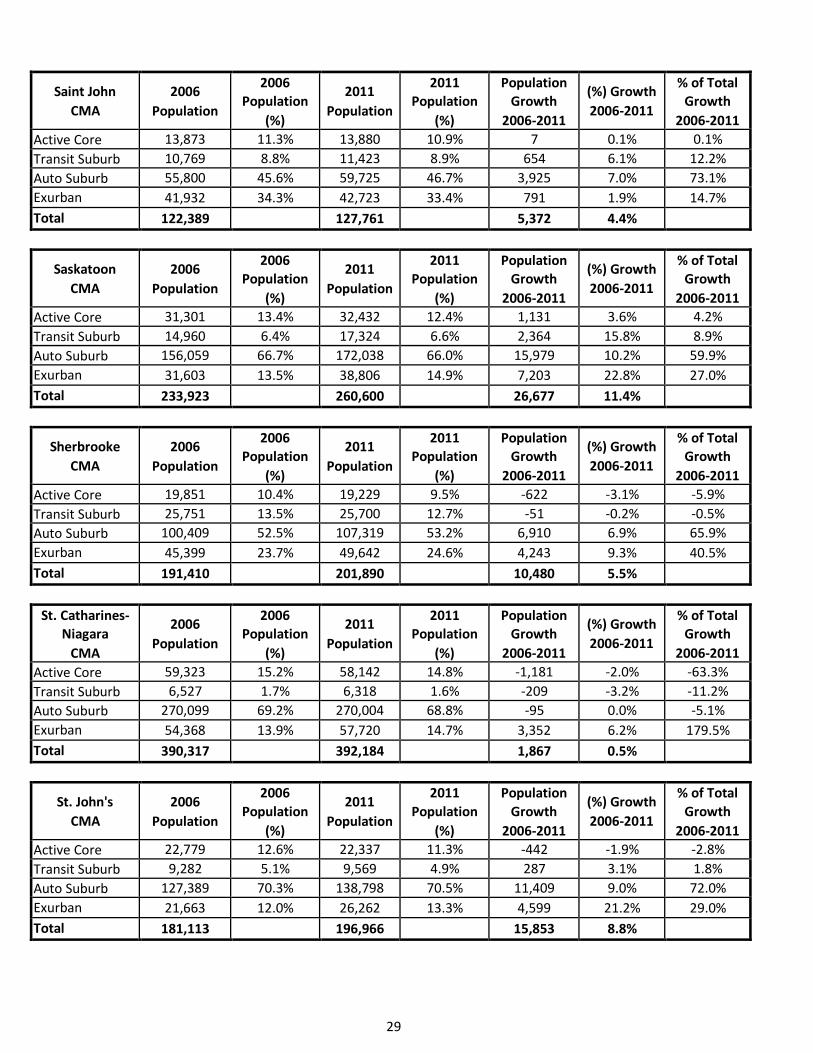
St Catharines 390,317 392,184 0.4% 59,323 15% 58,142 15% -2% 6,527 2% 6,318 2% -3% 270,099 98% 270,004 98% 0% 54,368 14% 57,720 15% 6%
Halifax 372,858 390,328 4.7% 51,497 14% 53,855 14% 5% 69,969 30% 71,788 30% 3% 161,994 70% 170,660 70% 5% 89,398 24% 94,025 24% 5%
Oshawa 330,594 356,177 7.7% 12,856 4% 12,417 3% -3% 43,105 15% 46,513 15% 8% 254,587 85% 274,071 85% 8% 20,046 9% 23,176 7% 16%
Victoria 330,088 344,615 4.4% 59,342 18% 59,813 17% 1% 38,317 15% 38,307 14% 0% 218,914 85% 232,457 86% 6% 13,515 4% 14,038 4% 4%
Windsor 323,342 319,246 -1.3% 49,842 15% 45,374 14% -9% 1,100 0% 1,054 0% -4% 238,761 100% 239,792 100% 0% 33,157 12% 32,609 10% -2%
Saskatoon 233,923 260,600 11.5% 31,301 13% 32,432 12% 4% 14,960 9% 17,324 9% 16% 156,059 91% 172,038 91% 10% 31,603 14% 38,806 15% 23%
Regina 194,971 210,556 8.0% 31,669 16% 33,751 16% 7% 5,684 4% 5,677 4% 0% 141,924 96% 153,672 96% 8% 15,694 9% 17,456 8% 11%
Sherbrooke 191,410 201,890 8.0% 19,851 11% 19,229 10% -3% 25,751 20% 25,700 19% 0% 100,409 80% 107,319 81% 7% 45,399 20% 49,642 25% 9%
St Johns 181,113 196,966 8.8% 22,779 13% 22,337 11% -2% 9,282 7% 9,569 6% 3% 127,389 93% 138,798 94% 9% 21,663 16% 26,262 13% 21%
Barrie 177,061 187,013 5.6% 15,920 9% 15,949 9% 0% 6,333 5% 6,096 4% -4% 127,126 95% 136,818 96% 8% 27,682 16% 28,150 15% 2%
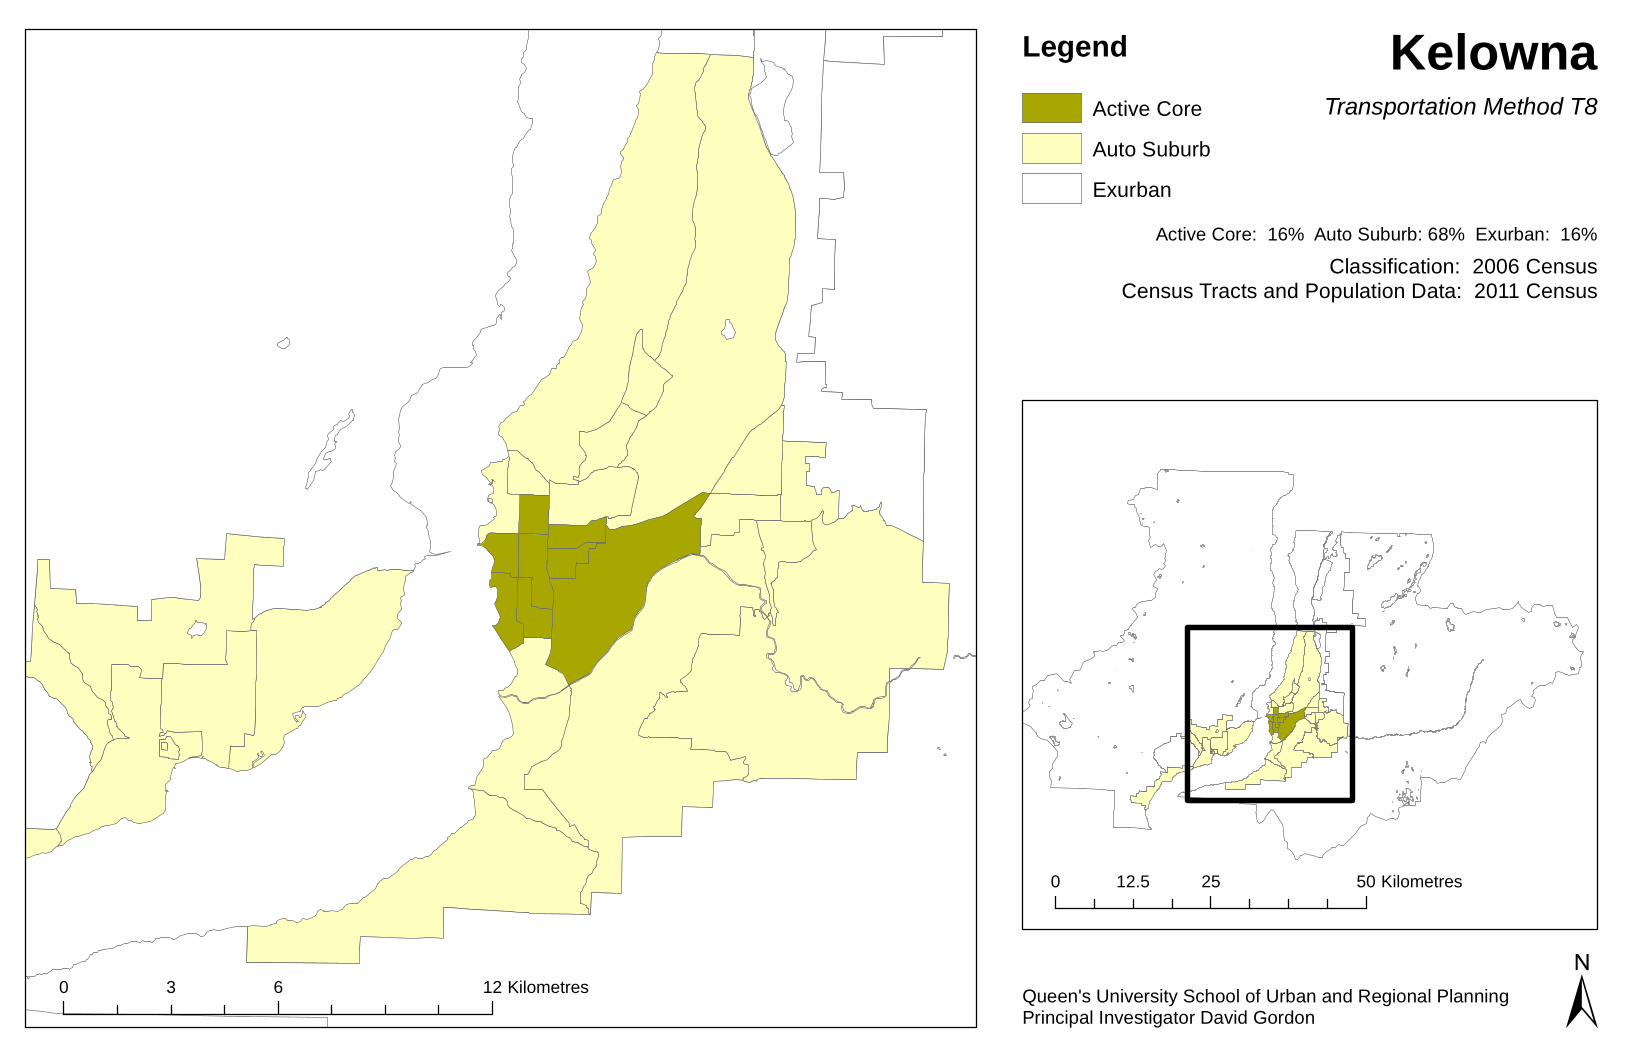
Kelowna 162,276 179,839 10.8% 28,136 17% 28,953 16% 3% - 0% - 0% 0 108,824 100% 121,505 100% 12% 25,316 16% 29,381 16% 16%
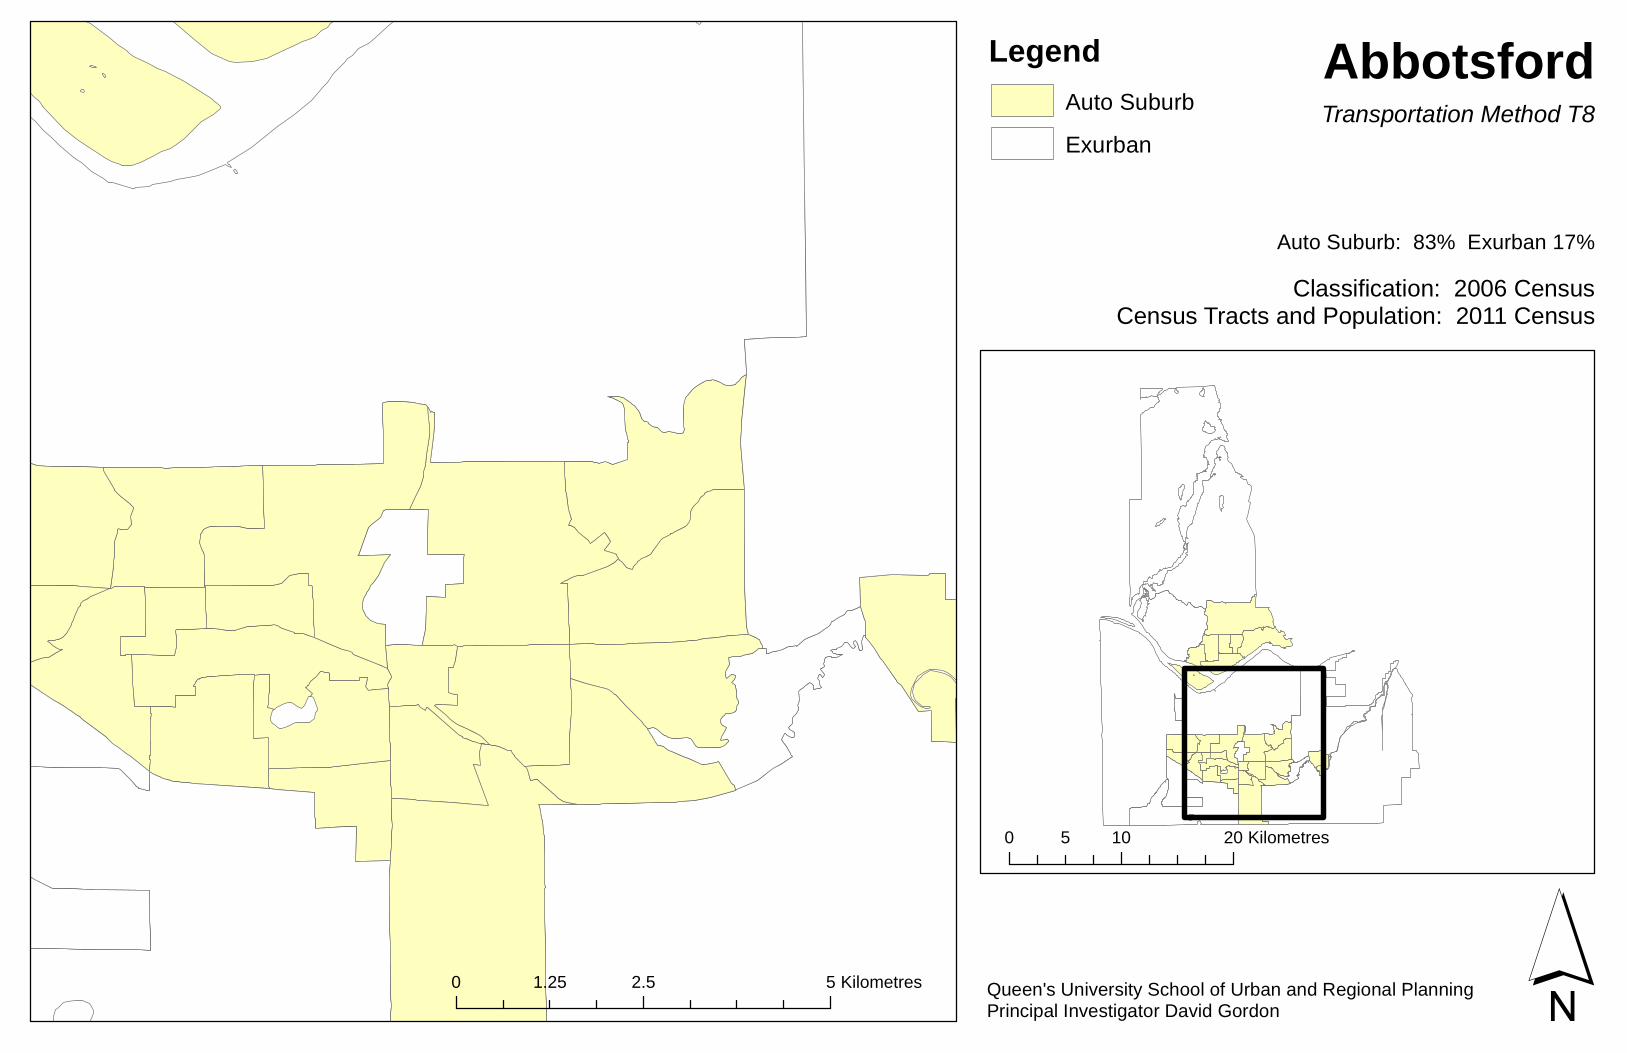
Abbotsford 159,020 170,191 7.1% - 0% - 0% 0 - 0% - 0% 0 133,583 100% 142,027 100% 6% 25,437 15% 28,164 17% 11%
Sudbury 158,258 160,770 1.6% 23,716 15% 23,281 14% -2% 17,329 17% 17,427 17% 1% 82,709 83% 83,719 83% 1% 34,504 22% 36,343 23% 5%
Kingston 152,358 159,561 4.7% 22,386 15% 23,015 14% 3% 25,657 27% 25,740 26% 0% 67,387 73% 73,571 74% 9% 36,928 24% 37,235 23% 1%
Saguenay 156,305 157,790 4.0% 13,603 9% 13,023 8% -4% - 0% - 0% 0 86,489 100% 87,159 100% 1% 56,213 34% 57,608 37% 2%
Trois-Rivières 144,713 151,773 7.3% 18,354 13% 17,882 12% -3% - 0% - 0% 0 89,020 100% 91,752 100% 3% 37,339 24% 42,139 28% 13%
Guelph 133,698 141,097 11.1% 23,088 18% 21,968 16% -5% 11,095 12% 10,840 11% -2% 80,760 88% 88,880 89% 10% 18,755 9% 19,409 14% 3%
Moncton 126,424 138,644 9.7% 18,050 14% 17,910 13% -1% - 0% - 0% 0 76,630 100% 87,062 100% 14% 31,744 25% 33,672 24% 6%
Brantford 124,607 135,501 8.6% 11,480 9% 11,122 8% -3% - 0% - 0% 0 88,941 100% 93,009 100% 5% 24,186 19% 31,370 23% 30%
Thunder Bay 122,907 121,596 -1.0% 13,774 11% 13,410 11% -3% - 0% - 0% 0 76,228 100% 75,027 100% -2% 32,905 27% 33,159 27% 1%
Saint John 122,389 127,761 4.5% 13,873 10% 13,880 11% 0% 10,769 15% 11,423 16% 6% 55,800 85% 59,725 84% 7% 41,932 34% 42,723 33% 2%
Peterborough 116,570 118,975 2.0% 23,244 20% 23,121 19% -1% - 0% - 0% 0 51,776 100% 55,193 100% 7% 41,550 36% 40,661 34% -2%
TOTAL CMA
21,529,226 23,123,441 7% 2,673,222 12% 2,762,618 12% 3% 2,364,482 14% 2,433,320 13% 3% 14,756,374 86% 16,033,565 87% 9% 1,717,229 8% 1,868,923 8% 9%
*Note: Not all 'Population 2011' totals are exact sums of Active Core, Total Suburb and Exurban columns due to 'unclassifiable' census tracts in several CMAs
24
Suburban Nation?
Population Growth in Canadian Suburbs, 2006-2011
Council for Canadian Urbanism
Working Paper #1
APPENDIX B:
Population Classification and 2006-2011 growth
for all 33 Census Metropolitan areas
25
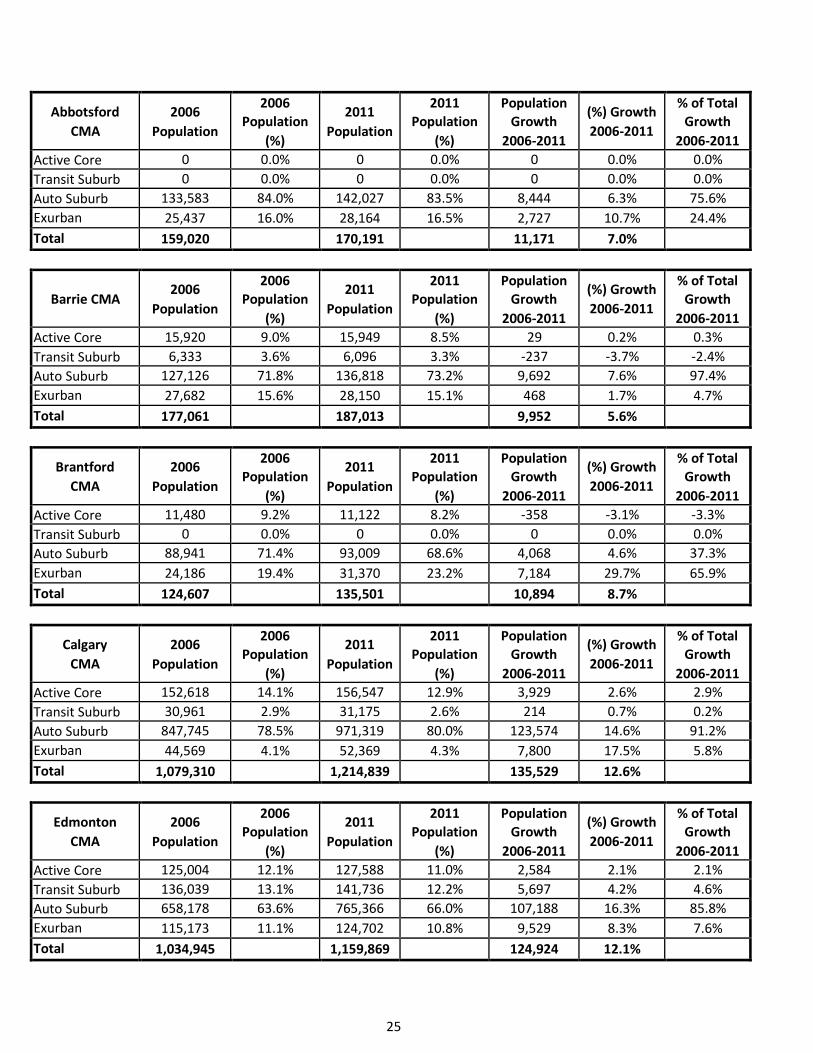
Abbotsford
CMA
2006
Population
2006
Population
(%)
2011
Population
2011
Population
(%)
Population
Growth
2006-2011
(%) Growth
2006-2011
% of Total
Growth
2006-2011
Active Core 0 0.0% 0 0.0% 0 0.0% 0.0%
Transit Suburb 0 0.0% 0 0.0% 0 0.0% 0.0%
Auto Suburb 133,583 84.0% 142,027 83.5% 8,444 6.3% 75.6%
Exurban 25,437 16.0% 28,164 16.5% 2,727 10.7% 24.4%
Total 159,020 170,191 11,171 7.0%
Barrie CMA
2006
Population
2006
Population
(%)
2011
Population
2011
Population
(%)
Population
Growth
2006-2011
(%) Growth
2006-2011
% of Total
Growth
2006-2011
Active Core 15,920 9.0% 15,949 8.5% 29 0.2% 0.3%
Transit Suburb 6,333 3.6% 6,096 3.3% -237 -3.7% -2.4%
Auto Suburb 127,126 71.8% 136,818 73.2% 9,692 7.6% 97.4%
Exurban 27,682 15.6% 28,150 15.1% 468 1.7% 4.7%
Total 177,061 187,013 9,952 5.6%
Brantford
CMA
2006
Population
2006
Population
(%)
2011
Population
2011
Population
(%)
Population
Growth
2006-2011
(%) Growth
2006-2011
% of Total
Growth
2006-2011
Active Core 11,480 9.2% 11,122 8.2% -358 -3.1% -3.3%
Transit Suburb 0 0.0% 0 0.0% 0 0.0% 0.0%
Auto Suburb 88,941 71.4% 93,009 68.6% 4,068 4.6% 37.3%
Exurban 24,186 19.4% 31,370 23.2% 7,184 29.7% 65.9%
Total 124,607 135,501 10,894 8.7%
Calgary
CMA
2006
Population
2006
Population
(%)
2011
Population
2011
Population
(%)
Population
Growth
2006-2011
(%) Growth
2006-2011
% of Total
Growth
2006-2011
Active Core 152,618 14.1% 156,547 12.9% 3,929 2.6% 2.9%
Transit Suburb 30,961 2.9% 31,175 2.6% 214 0.7% 0.2%
Auto Suburb 847,745 78.5% 971,319 80.0% 123,574 14.6% 91.2%
Exurban 44,569 4.1% 52,369 4.3% 7,800 17.5% 5.8%
Total 1,079,310 1,214,839 135,529 12.6%
Edmonton
CMA
2006
Population
2006
Population
(%)
2011
Population
2011
Population
(%)
Population
Growth
2006-2011
(%) Growth
2006-2011
% of Total
Growth
2006-2011
Active Core 125,004 12.1% 127,588 11.0% 2,584 2.1% 2.1%
Transit Suburb 136,039 13.1% 141,736 12.2% 5,697 4.2% 4.6%
Auto Suburb 658,178 63.6% 765,366 66.0% 107,188 16.3% 85.8%
Exurban 115,173 11.1% 124,702 10.8% 9,529 8.3% 7.6%
Total 1,034,945 1,159,869 124,924 12.1%
26
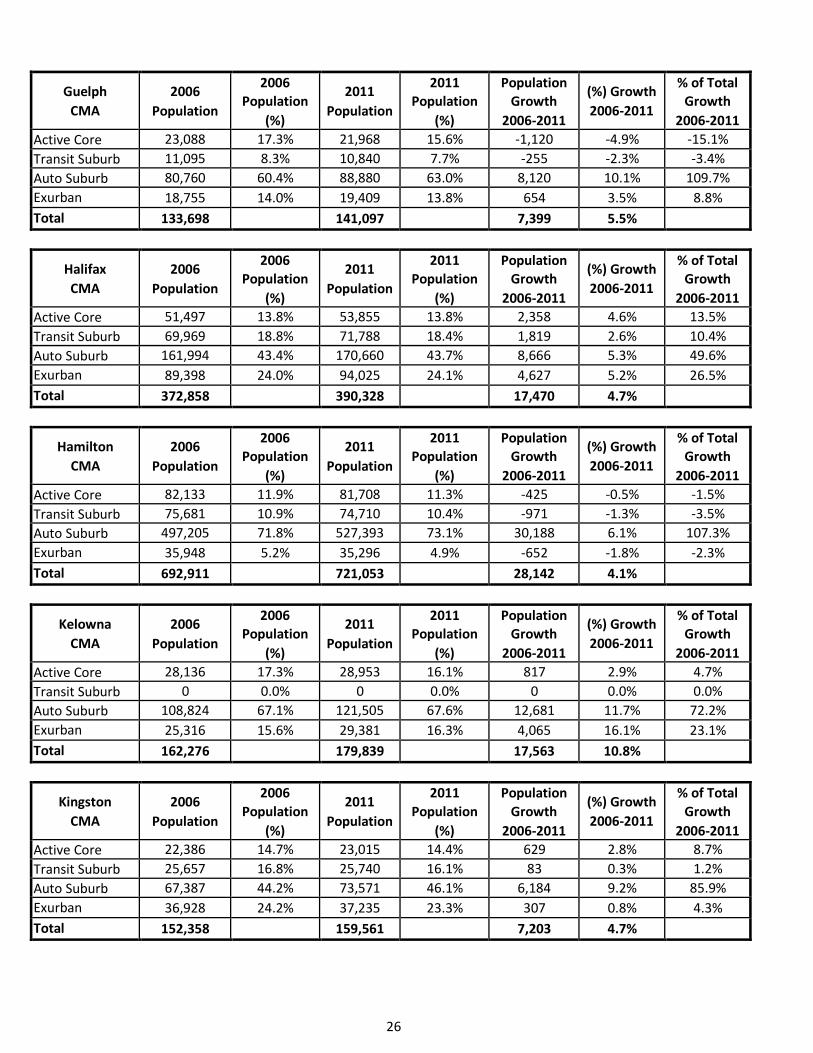
Guelph
CMA
2006
Population
2006
Population
(%)
2011
Population
2011
Population
(%)
Population
Growth
2006-2011
(%) Growth
2006-2011
% of Total
Growth
2006-2011
Active Core 23,088 17.3% 21,968 15.6% -1,120 -4.9% -15.1%
Transit Suburb 11,095 8.3% 10,840 7.7% -255 -2.3% -3.4%
Auto Suburb 80,760 60.4% 88,880 63.0% 8,120 10.1% 109.7%
Exurban 18,755 14.0% 19,409 13.8% 654 3.5% 8.8%
Total 133,698 141,097 7,399 5.5%
Halifax
CMA
2006
Population
2006
Population
(%)
2011
Population
2011
Population
(%)
Population
Growth
2006-2011
(%) Growth
2006-2011
% of Total
Growth
2006-2011
Active Core 51,497 13.8% 53,855 13.8% 2,358 4.6% 13.5%
Transit Suburb 69,969 18.8% 71,788 18.4% 1,819 2.6% 10.4%
Auto Suburb 161,994 43.4% 170,660 43.7% 8,666 5.3% 49.6%
Exurban 89,398 24.0% 94,025 24.1% 4,627 5.2% 26.5%
Total 372,858 390,328 17,470 4.7%
Hamilton
CMA
2006
Population
2006
Population
(%)
2011
Population
2011
Population
(%)
Population
Growth
2006-2011
(%) Growth
2006-2011
% of Total
Growth
2006-2011
Active Core 82,133 11.9% 81,708 11.3% -425 -0.5% -1.5%
Transit Suburb 75,681 10.9% 74,710 10.4% -971 -1.3% -3.5%
Auto Suburb 497,205 71.8% 527,393 73.1% 30,188 6.1% 107.3%
Exurban 35,948 5.2% 35,296 4.9% -652 -1.8% -2.3%
Total 692,911 721,053 28,142 4.1%
Kelowna
CMA
2006
Population
2006
Population
(%)
2011
Population
2011
Population
(%)
Population
Growth
2006-2011
(%) Growth
2006-2011
% of Total
Growth
2006-2011
Active Core 28,136 17.3% 28,953 16.1% 817 2.9% 4.7%
Transit Suburb 0 0.0% 0 0.0% 0 0.0% 0.0%
Auto Suburb 108,824 67.1% 121,505 67.6% 12,681 11.7% 72.2%
Exurban 25,316 15.6% 29,381 16.3% 4,065 16.1% 23.1%
Total 162,276 179,839 17,563 10.8%
Kingston
CMA
2006
Population
2006
Population
(%)
2011
Population
2011
Population
(%)
Population
Growth
2006-2011
(%) Growth
2006-2011
% of Total
Growth
2006-2011
Active Core 22,386 14.7% 23,015 14.4% 629 2.8% 8.7%
Transit Suburb 25,657 16.8% 25,740 16.1% 83 0.3% 1.2%
Auto Suburb 67,387 44.2% 73,571 46.1% 6,184 9.2% 85.9%
Exurban 36,928 24.2% 37,235 23.3% 307 0.8% 4.3%
Total 152,358 159,561 7,203 4.7%
27
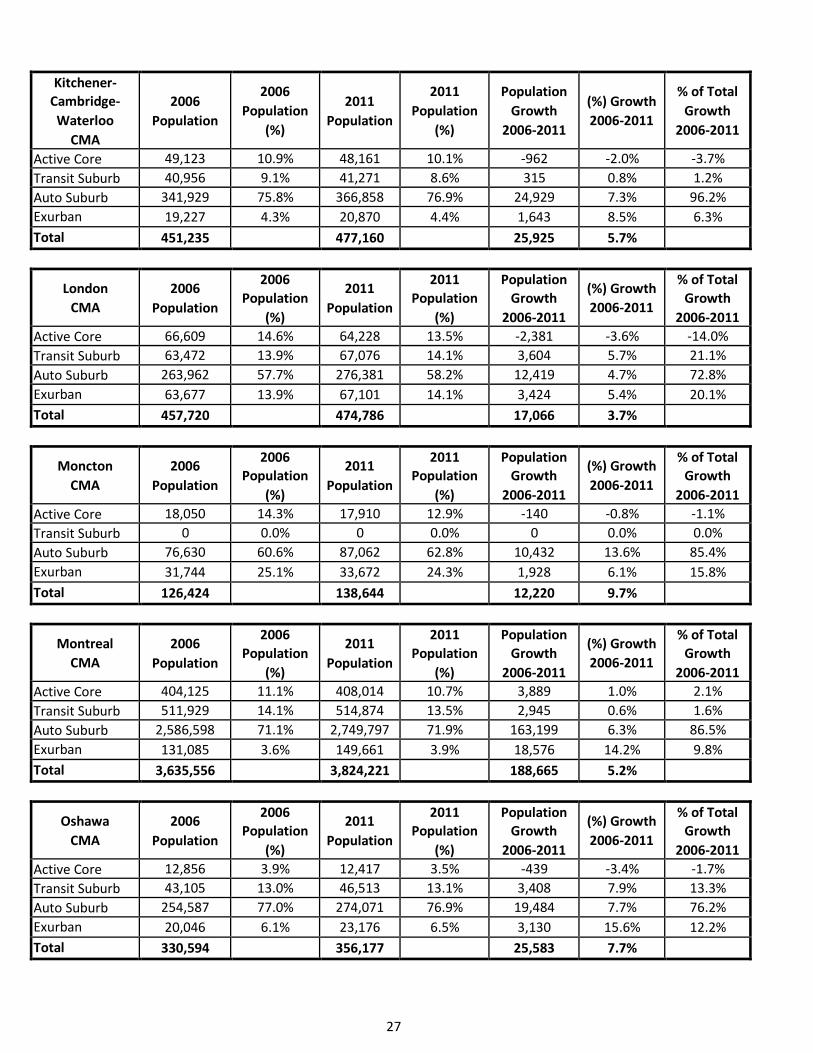
Kitchener-
Cambridge-
Waterloo
CMA
2006
Population
2006
Population
(%)
2011
Population
2011
Population
(%)
Population
Growth
2006-2011
(%) Growth
2006-2011
% of Total
Growth
2006-2011
Active Core 49,123 10.9% 48,161 10.1% -962 -2.0% -3.7%
Transit Suburb 40,956 9.1% 41,271 8.6% 315 0.8% 1.2%
Auto Suburb 341,929 75.8% 366,858 76.9% 24,929 7.3% 96.2%
Exurban 19,227 4.3% 20,870 4.4% 1,643 8.5% 6.3%
Total 451,235 477,160 25,925 5.7%
London
CMA
2006
Population
2006
Population
(%)
2011
Population
2011
Population
(%)
Population
Growth
2006-2011
(%) Growth
2006-2011
% of Total
Growth
2006-2011
Active Core 66,609 14.6% 64,228 13.5% -2,381 -3.6% -14.0%
Transit Suburb 63,472 13.9% 67,076 14.1% 3,604 5.7% 21.1%
Auto Suburb 263,962 57.7% 276,381 58.2% 12,419 4.7% 72.8%
Exurban 63,677 13.9% 67,101 14.1% 3,424 5.4% 20.1%
Total 457,720 474,786 17,066 3.7%
Moncton
CMA
2006
Population
2006
Population
(%)
2011
Population
2011
Population
(%)
Population
Growth
2006-2011
(%) Growth
2006-2011
% of Total
Growth
2006-2011
Active Core 18,050 14.3% 17,910 12.9% -140 -0.8% -1.1%
Transit Suburb 0 0.0% 0 0.0% 0 0.0% 0.0%
Auto Suburb 76,630 60.6% 87,062 62.8% 10,432 13.6% 85.4%
Exurban 31,744 25.1% 33,672 24.3% 1,928 6.1% 15.8%
Total 126,424 138,644 12,220 9.7%
Montreal
CMA
2006
Population
2006
Population
(%)
2011
Population
2011
Population
(%)
Population
Growth
2006-2011
(%) Growth
2006-2011
% of Total
Growth
2006-2011
Active Core 404,125 11.1% 408,014 10.7% 3,889 1.0% 2.1%
Transit Suburb 511,929 14.1% 514,874 13.5% 2,945 0.6% 1.6%
Auto Suburb 2,586,598 71.1% 2,749,797 71.9% 163,199 6.3% 86.5%
Exurban 131,085 3.6% 149,661 3.9% 18,576 14.2% 9.8%
Total 3,635,556 3,824,221 188,665 5.2%
Oshawa
CMA
2006
Population
2006
Population
(%)
2011
Population
2011
Population
(%)
Population
Growth
2006-2011
(%) Growth
2006-2011
% of Total
Growth
2006-2011
Active Core 12,856 3.9% 12,417 3.5% -439 -3.4% -1.7%
Transit Suburb 43,105 13.0% 46,513 13.1% 3,408 7.9% 13.3%
Auto Suburb 254,587 77.0% 274,071 76.9% 19,484 7.7% 76.2%
Exurban 20,046 6.1% 23,176 6.5% 3,130 15.6% 12.2%
Total 330,594 356,177 25,583 7.7%
28
Ottawa-
Gatineau
CMA
2006
Population
2006
Population
(%)
2011
Population
2011
Population
(%)
Population
Growth
2006-2011
(%) Growth
2006-2011
% of Total
Growth
2006-2011
Active Core 143,277 12.6% 147,602 11.9% 4,325 3.0% 4.2%
Transit Suburb 127,280 11.2% 130,381 10.5% 3,101 2.4% 3.0%
Auto Suburb 719,116 63.4% 802,626 64.9% 83,510 11.6% 81.3%
Exurban 143,903 12.7% 155,342 12.6% 11,439 7.9% 11.1%
Total 1,133,633 1,236,324 102,691 9.1%
Peterborough
CMA
2006
Population
2006
Population
(%)
2011
Population
2011
Population
(%)
Population
Growth
2006-2011
(%) Growth
2006-2011
% of Total
Growth
2006-2011
Active Core 23,244 19.9% 23,121 19.4% -123 -0.5% -5.1%
Transit Suburb 0 0.0% 0 0.0% 0 0.0% 0.0%
Auto Suburb 51,776 44.4% 55,193 46.4% 3,417 6.6% 142.1%
Exurban 41,550 35.6% 40,661 34.2% -889 -2.1% -37.0%
Total 116,570 118,975 2,405 2.1%
Quebec
CMA
2006
Population
2006
Population
(%)
2011
Population
2011
Population
(%)
Population
Growth
2006-2011
(%) Growth
2006-2011
% of Total
Growth
2006-2011
Active Core 114,056 15.9% 114,355 14.9% 299 0.3% 0.6%
Transit Suburb 47,306 6.6% 48,697 6.4% 1,391 2.9% 3.0%
Auto Suburb 461,568 64.2% 494,460 64.6% 32,892 7.1% 70.7%
Exurban 96,223 13.4% 108,194 14.1% 11,971 12.4% 25.7%
Total 719,153 765,706 46,553
Regina
CMA
2006
Population
2006
Population
(%)
2011
Population
2011
Population
(%)
Population
Growth
2006-2011
(%) Growth
2006-2011
% of Total
Growth
2006-2011
Active Core 31,669 16.2% 33,751 16.0% 2,082 6.6% 13.4%
Transit Suburb 5,684 2.9% 5,677 2.7% -7 -0.1% 0.0%
Auto Suburb 141,924 72.8% 153,672 73.0% 11,748 8.3% 75.4%
Exurban 15,694 8.0% 17,456 8.3% 1,762 11.2% 11.3%
Total 194,971 210,556 15,585 8.0%
Saguenay
CMA
2006
Population
2006
Population
(%)
2011
Population
2011
Population
(%)
Population
Growth
2006-2011
(%) Growth
2006-2011
% of Total
Growth
2006-2011
Active Core 13,603 8.7% 13,023 8.3% -580 -4.3% -39.1%
Transit Suburb 0 0.0% 0 0.0% 0 0.0% 0.0%
Auto Suburb 86,489 55.3% 87,159 55.2% 670 0.8% 45.1%
Exurban 56,213 36.0% 57,608 36.5% 1,395 2.5% 93.9%
Total 156,305 157,790 1,485 1.0%
29
Saint John
CMA
2006
Population
2006
Population
(%)
2011
Population
2011
Population
(%)
Population
Growth
2006-2011
(%) Growth
2006-2011
% of Total
Growth
2006-2011
Active Core 13,873 11.3% 13,880 10.9% 7 0.1% 0.1%
Transit Suburb 10,769 8.8% 11,423 8.9% 654 6.1% 12.2%
Auto Suburb 55,800 45.6% 59,725 46.7% 3,925 7.0% 73.1%
Exurban 41,932 34.3% 42,723 33.4% 791 1.9% 14.7%
Total 122,389 127,761 5,372 4.4%
Saskatoon
CMA
2006
Population
2006
Population
(%)
2011
Population
2011
Population
(%)
Population
Growth
2006-2011
(%) Growth
2006-2011
% of Total
Growth
2006-2011
Active Core 31,301 13.4% 32,432 12.4% 1,131 3.6% 4.2%
Transit Suburb 14,960 6.4% 17,324 6.6% 2,364 15.8% 8.9%
Auto Suburb 156,059 66.7% 172,038 66.0% 15,979 10.2% 59.9%
Exurban 31,603 13.5% 38,806 14.9% 7,203 22.8% 27.0%
Total 233,923 260,600 26,677 11.4%
Sherbrooke
CMA
2006
Population
2006
Population
(%)
2011
Population
2011
Population
(%)
Population
Growth
2006-2011
(%) Growth
2006-2011
% of Total
Growth
2006-2011
Active Core 19,851 10.4% 19,229 9.5% -622 -3.1% -5.9%
Transit Suburb 25,751 13.5% 25,700 12.7% -51 -0.2% -0.5%
Auto Suburb 100,409 52.5% 107,319 53.2% 6,910 6.9% 65.9%
Exurban 45,399 23.7% 49,642 24.6% 4,243 9.3% 40.5%
Total 191,410 201,890 10,480 5.5%
St. Catharines-
Niagara
CMA
2006
Population
2006
Population
(%)
2011
Population
2011
Population
(%)
Population
Growth
2006-2011
(%) Growth
2006-2011
% of Total
Growth
2006-2011
Active Core 59,323 15.2% 58,142 14.8% -1,181 -2.0% -63.3%
Transit Suburb 6,527 1.7% 6,318 1.6% -209 -3.2% -11.2%
Auto Suburb 270,099 69.2% 270,004 68.8% -95 0.0% -5.1%
Exurban 54,368 13.9% 57,720 14.7% 3,352 6.2% 179.5%
Total 390,317 392,184 1,867 0.5%
St. John's
CMA
2006
Population
2006
Population
(%)
2011
Population
2011
Population
(%)
Population
Growth
2006-2011
(%) Growth
2006-2011
% of Total
Growth
2006-2011
Active Core 22,779 12.6% 22,337 11.3% -442 -1.9% -2.8%
Transit Suburb 9,282 5.1% 9,569 4.9% 287 3.1% 1.8%
Auto Suburb 127,389 70.3% 138,798 70.5% 11,409 9.0% 72.0%
Exurban 21,663 12.0% 26,262 13.3% 4,599 21.2% 29.0%
Total 181,113 196,966 15,853 8.8%
30
Sudbury
CMA
2006
Population
2006
Population
(%)
2011
Population
2011
Population
(%)
Population
Growth
2006-2011
(%) Growth
2006-2011
% of Total
Growth
2006-2011
Active Core 23,716 15.0% 23,281 14.5% -435 -1.8% -17.3%
Transit Suburb 17,329 10.9% 17,427 10.8% 98 0.6% 3.9%
Auto Suburb 82,709 52.3% 83,719 52.1% 1,010 1.2% 40.2%
Exurban 34,504 21.8% 36,343 22.6% 1,839 5.3% 73.2%
Total 158,258 160,770 2,512 1.6%
Thunder Bay
CMA
2006
Population
2006
Population
(%)
2011
Population
2011
Population
(%)
Population
Growth
2006-2011
(%) Growth
2006-2011
% of Total
Growth
2006-2011
Active Core 13,774 11.2% 13,410 11.0% -364 -2.6% -27.8%
Transit Suburb 0 0.0% 0 0.0% 0 0.0% 0.0%
Auto Suburb 76,228 62.0% 75,027 61.7% -1,201 -1.6% -91.6%
Exurban 32,905 26.8% 33,159 27.3% 254 0.8% 19.4%
Total 122,907 121,596 -1,311 -1.1%
Toronto
CMA
2006
Population
2006
Population
(%)
2011
Population
2011
Population
(%)
Population
Growth
2006-2011
(%) Growth
2006-2011
% of Total
Growth
2006-2011
Active Core 543,763 10.6% 596,063 10.7% 52,300 9.6% 11.1%
Transit Suburb 755,971 14.8% 781,655 14.0% 25,684 3.4% 5.5%
Auto Suburb 3,659,061 71.6% 4,039,267 72.3% 380,206 10.4% 80.9%
Exurban 142,776 2.8% 153,012 2.7% 10,236 7.2% 2.2%
Unclassified 11,578 0.2% 13,067 0.2% 1,489 12.9% 0.3%
Total 5,113,149 5,583,064 469,915 9.2%
Trois Rivieres
CMA
2006
Population
2006
Population
(%)
2011
Population
2011
Population
(%)
Population
Growth
2006-2011
(%) Growth
2006-2011
% of Total
Growth
2006-2011
Active Core 18,354 12.7% 17,882 11.8% -472 -2.6% -6.7%
Transit Suburb 0 0.0% 0 0.0% 0 0.0% 0.0%
Auto Suburb 89,020 61.5% 91,752 60.5% 2,732 3.1% 38.7%
Exurban 37,339 25.8% 42,139 27.8% 4,800 12.9% 68.0%
Total 144,713 151,773 7,060 4.9%
Vancouver
CMA
2006
Population
2006
Population
(%)
2011
Population
2011
Population
(%)
Population
Growth
2006-2011
(%) Growth
2006-2011
% of Total
Growth
2006-2011
Active Core 342,277 16.2% 369,985 16.0% 27,708 8.1% 14.1%
Transit Suburb 254,610 12.0% 273,385 11.8% 18,775 7.4% 9.5%
Auto Suburb 1,407,210 66.5% 1,539,222 66.5% 132,012 9.4% 67.1%
Exurban 110,641 5.2% 128,866 5.6% 18,225 16.5% 9.3%
Total 2,116,581 2,313,328 196,747 9.3%
31
Victoria
CMA
2006
Population
2006
Population
(%)
2011
Population
2011
Population
(%)
Population
Growth
2006-2011
(%) Growth
2006-2011
% of Total
Growth
2006-2011
Active Core 59,342 18.0% 59,813 17.4% 471 0.8% 3.2%
Transit Suburb 38,317 11.6% 38,307 11.1% -10 0.0% -0.1%
Auto Suburb 218,914 66.3% 232,457 67.5% 13,543 6.2% 93.2%
Exurban 13,515 4.1% 14,038 4.1% 523 3.9% 3.6%
Total 330,088 344,615 14,527 4.4%
Windsor
CMA
2006
Population
2006
Population
(%)
2011
Population
2011
Population
(%)
Population
Growth
2006-2011
(%) Growth
2006-2011
% of Total
Growth
2006-2011
Active Core 49,842 15.4% 45,374 14.2% -4,468 -9.0% -109.1%
Transit Suburb 1,100 0.3% 1,054 0.3% -46 -4.2% -1.1%
Auto Suburb 238,761 73.8% 239,792 75.1% 1,031 0.4% 25.2%
Exurban 33,157 10.3% 32,609 10.2% -548 -1.7% -13.4%
Total 323,342 319,246 -4,096 -1.3%
Winnipeg
CMA
2006
Population
2006
Population
(%)
2011
Population
2011
Population
(%)
Population
Growth
2006-2011
(%) Growth
2006-2011
% of Total
Growth
2006-2011
Active Core 86,153 12.4% 87,503 12.0% 1,350 1.6% 3.8%
Transit Suburb 34,399 5.0% 34,584 4.7% 185 0.5% 0.5%
Auto Suburb 518,393 74.6% 546,618 74.9% 28,225 5.4% 79.8%
Exurban 54,673 7.9% 59,762 8.2% 5,089 9.3% 14.4%
Total 694,668 730,018 35,350 5.1%
32
Suburban Nation?
Population Growth in Canadian Suburbs, 2006-2011
Council for Canadian Urbanism
Working Paper #1
APPENDIX C:
ATLAS
Maps Showing 2011 Neighbourhood Classification for All 33 Census Metropolitan Areas
Principal Investigator: David L.A. Gordon
Research Assistants: Angus Beaty and Isaac Shirokoff
School of Urban and Regional Planning, Queen’s University

33
List of Cities
Victoria…………………………………………………………………………………………………………………………….2
Vancouver………………………………………………………………………………………………………………………..3
Abbotsford……………………………………………………………………………………………………………………….4
Kelowna…………………………………………………………………………………………………………………………..5
Calgary…………………………………………………………………………………………………………………………….6
Edmonton………………………………………………………………………………………………………………………..7
Saskatoon………………………………………………………………………………………………………………………..8
Regina……………………………………………………………………………………………………………………………..9
Winnipeg…………………………………………………………………………………………………………………………10
Thunder Bay……………………………………………………………………………………………………………………11
Windsor………………………………………………………………………………………………………………………….12
London…………………………………………………………………………………………………………………………...13
Sudbury………………………………………………………………………………………………..………………………..14
Kitchener-Waterloo………………………………………………………………………………………………..……….15
Brantford…………………………………………………………………………………………………..…………………...16
Guelph…………………………………………………………………………………………………………….……………..17
Hamilton……………………………………………………………………………………………………………….……….18
Barrie……………………………………………………………………………………………………………………….…….19
Toronto…………………………………………………………………………..……………………………………….…….20
St. Catharines-Niagara Falls……………………………………………..………………………………….…………21
Oshawa………………………………………………………………………………………………………………………….22
Peterborough…………………………………………………………………………………………………………..…….23
Kingston………………………………………………………………………………………………………………………...24
Ottawa-Gatineau……………………………………………………………………………………………………………25
Montreal………………………………………………………………………………………………………………………..26
Trois Rivieres………………………………………………………………………………………………………………….27
Sherbrooke…………………………………………………………………………………………………………………….28
Quebec City…………………………………………………..…………………………………………………………..….29
Saguenay…………………………………………………………………………..…………………………………………..30
Saint John………………………………………………………..…………………………………………………………….31
Moncton………………………………………………………………………………………………………………………..32
Halifax………………………………………………………………………………………………………………..………….33
St. John’s………………………………………..…………………………………………………………………….……….34
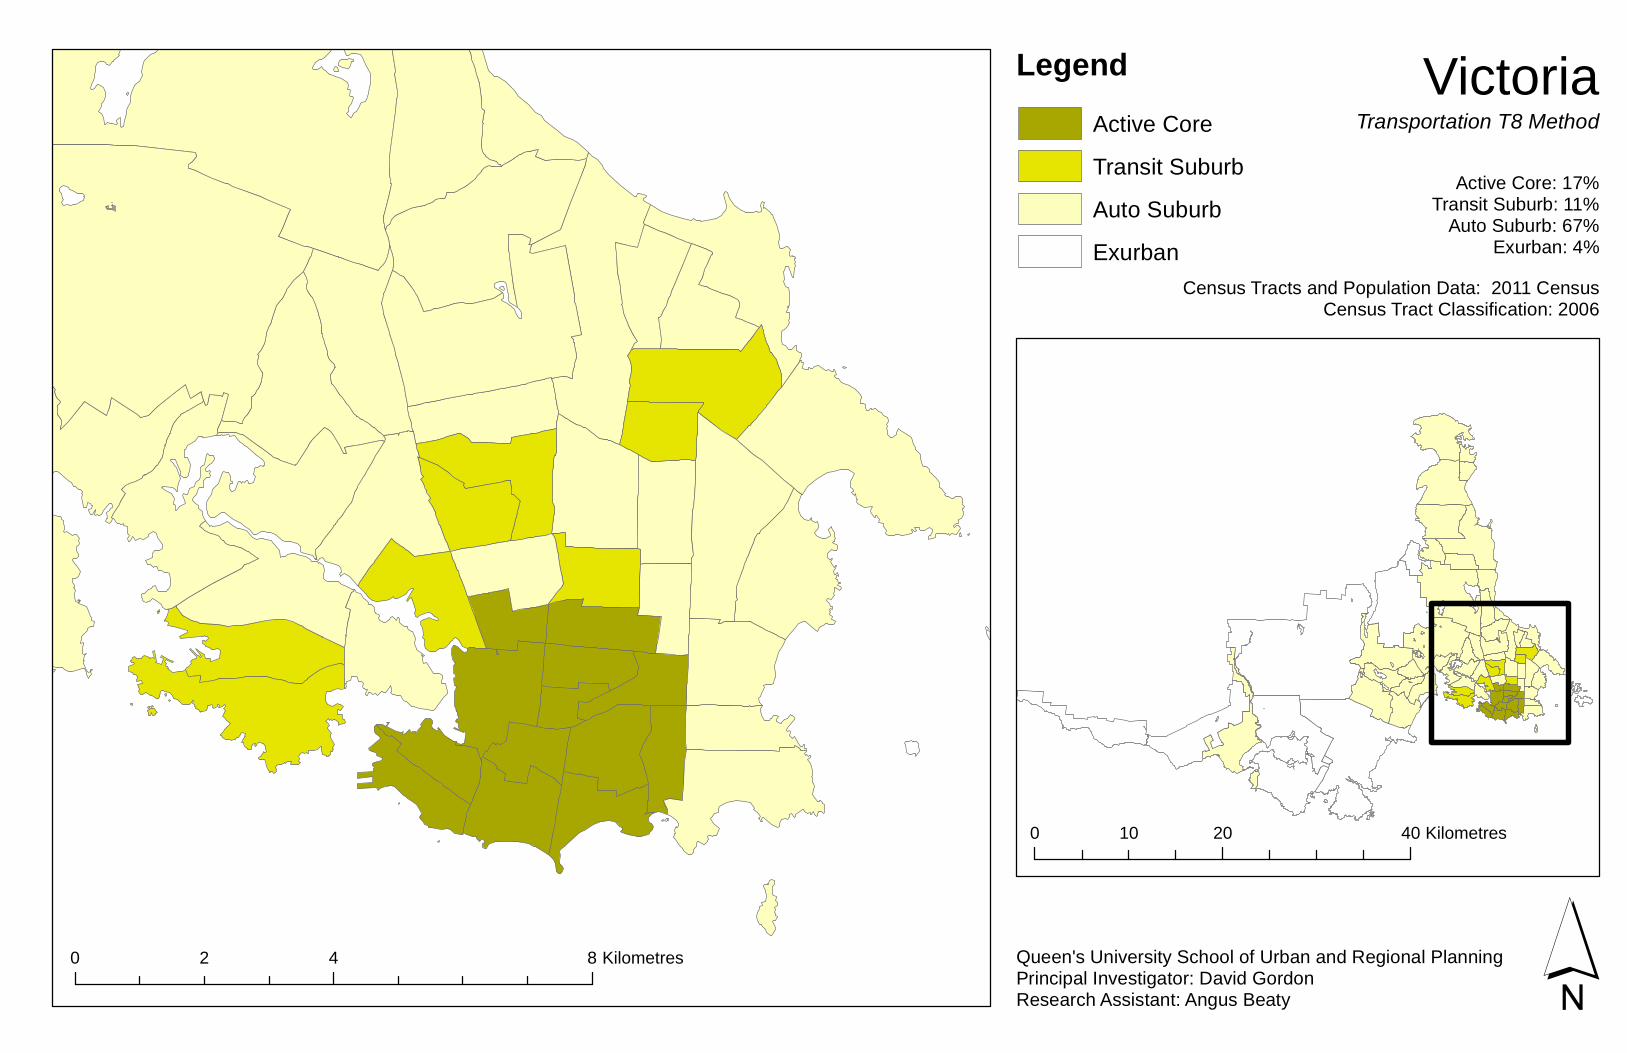
VictoriaLegendActive CoreTransit SuburbAuto SuburbExurban
Transportation T8 Method
Census Tracts and Population Data: 2011 CensusCensus Tract Classification: 2006
´
Active Core: 17%Transit Suburb: 11%
Auto Suburb: 67%Exurban: 4%
Queen's University School of Urban and Regional PlanningPrincipal Investigator: David GordonResearch Assistant: Angus Beaty
0 4 82 Kilometres
0 20 4010 Kilometres
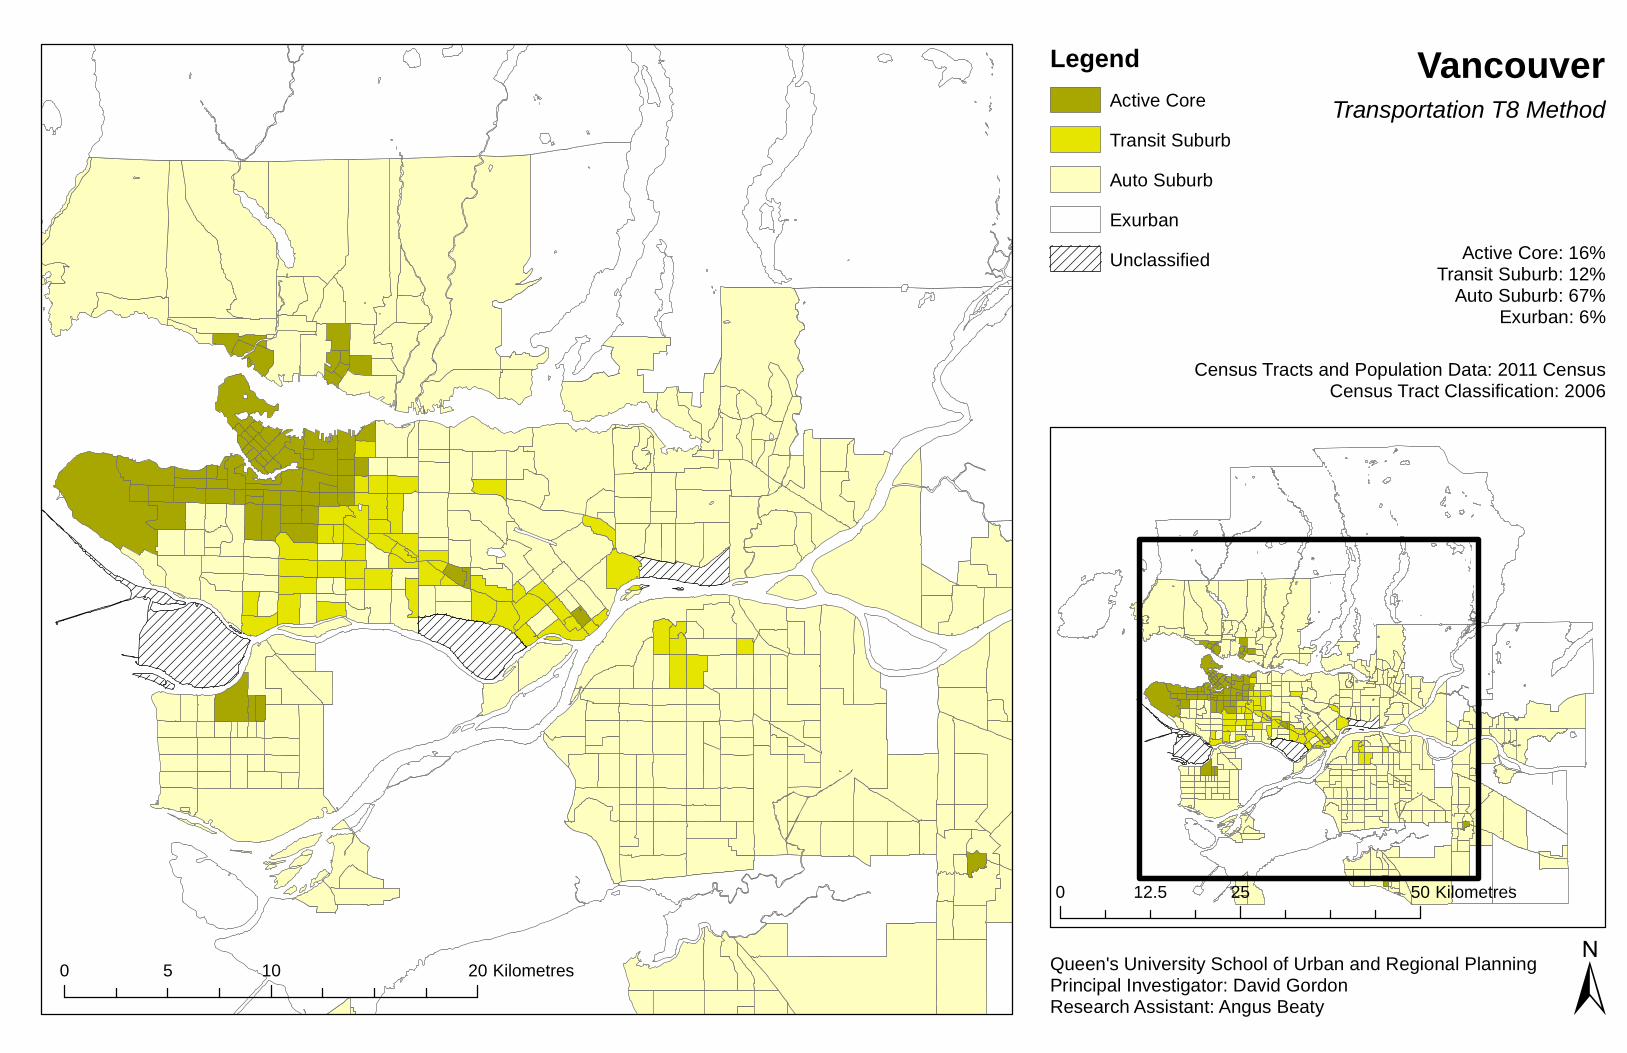
VancouverTransportation T8 Method
Active Core: 16%Transit Suburb: 12%
Auto Suburb: 67%Exurban: 6%
Census Tracts and Population Data: 2011 CensusCensus Tract Classification: 2006
±0 10 205 Kilometres
0 25 5012.5 Kilometres
Queen's University School of Urban and Regional PlanningPrincipal Investigator: David GordonResearch Assistant: Angus Beaty
LegendActive Core
Auto SuburbExurban
Transit Suburb
Unclassified
AbbotsfordTransportation Method T8
0 2.5 51.25 Kilometres
LegendAuto SuburbExurban
Queen's University School of Urban and Regional PlanningPrincipal Investigator David Gordon ´
0 10 205 Kilometres
Classification: 2006 CensusCensus Tracts and Population: 2011 Census
Auto Suburb: 83% Exurban 17%
LegendActive CoreAuto SuburbExurban
KelownaTransportation Method T8
Classification: 2006 CensusCensus Tracts and Population Data: 2011 Census
Queen's University School of Urban and Regional PlanningPrincipal Investigator David Gordon
Active Core: 16% Auto Suburb: 68% Exurban: 16%
0 25 5012.5 Kilometres
0 6 123 Kilometres ±
CalgaryTransportation Method T8
´
Classification: 2006 CensusCensus Tracts and Population Data: 2011 Census
Queen's University School of Urban and Regional PlanningPrincipal Investigator David Gordon
Active Core 12.9%Transit Suburb 2.6%
Auto Suburb: 80%Exurban: 4.6%
0 6 123 Kilometres
0 25 5012.5 Kilometres
LegendActive Core
Auto SuburbExurban
Transit Suburb
Unclassified
0 6.5 133.25 Kilometres
0 20 4010 Kilometres
±
EdmontonTransportation Method T8
Census Tract and Population Data: 2011 CensusCensus Tract Classification: 2006
Active Core: 11%Transit Suburb: 12%
Auto Suburb: 66%Exurban: 11%
LegendActive Core
Auto SuburbExurban
Transit Suburb
Unclassified
SaskatoonTransportation Method T8
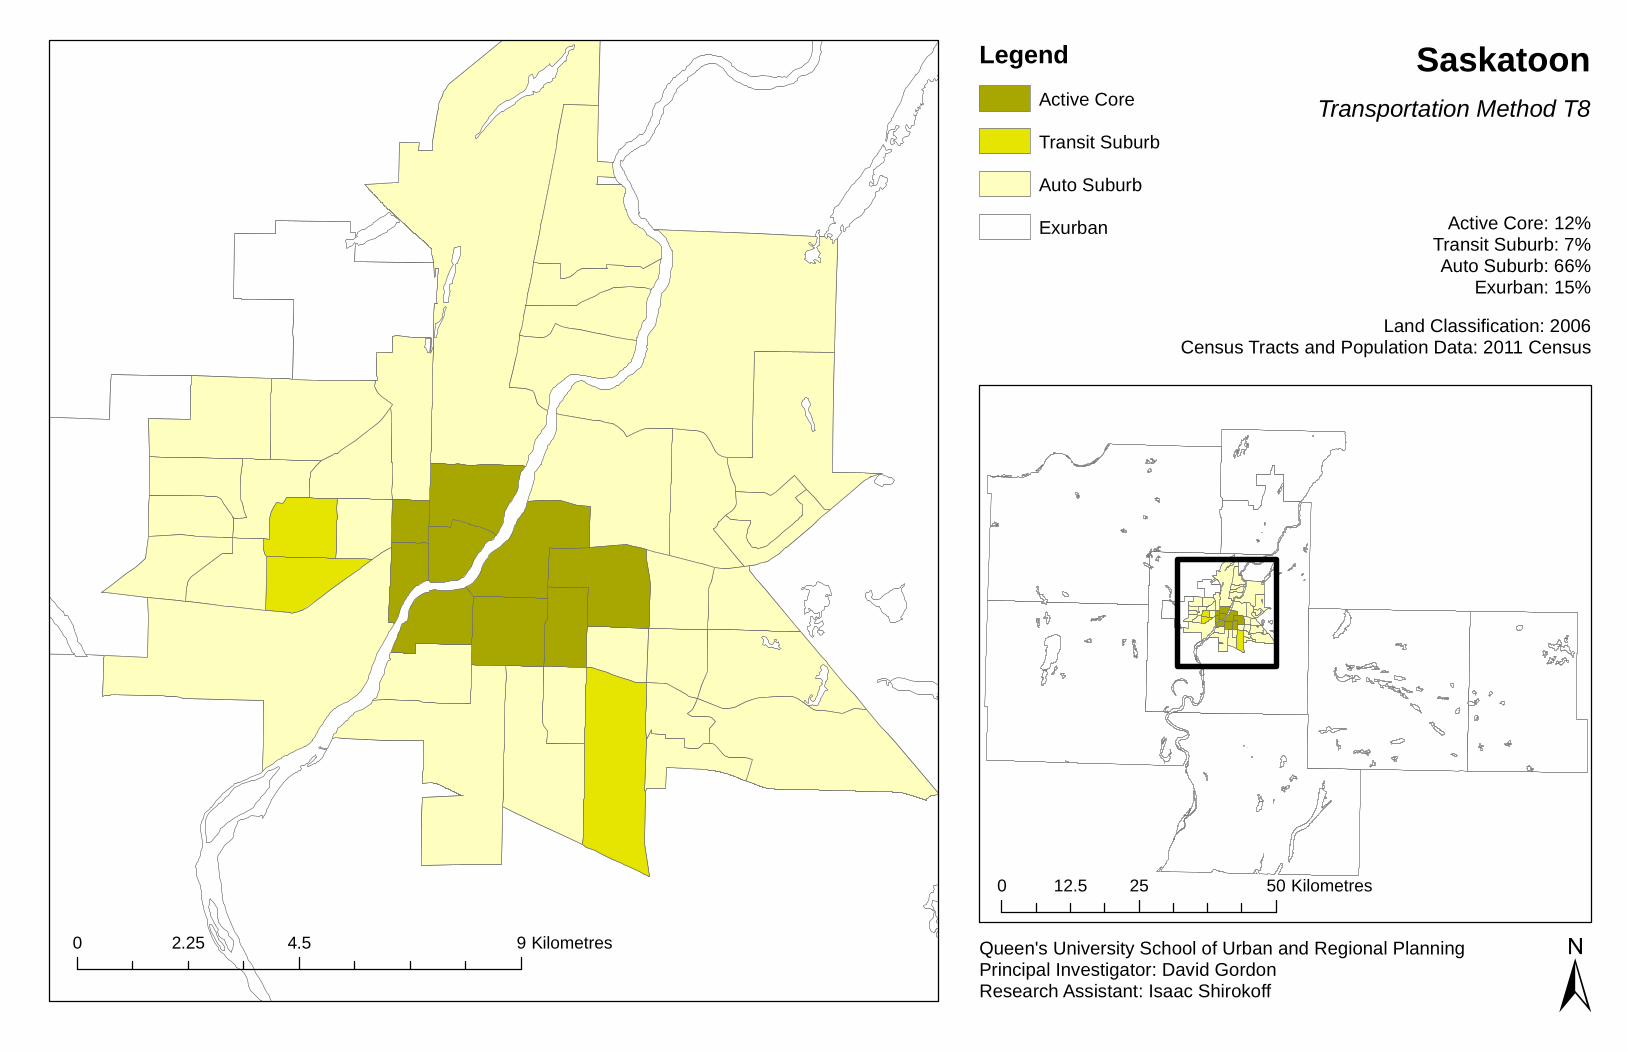
Active Core: 12%Transit Suburb: 7%Auto Suburb: 66%
Exurban: 15%Land Classification: 2006
Census Tracts and Population Data: 2011 Census
Queen's University School of Urban and Regional PlanningPrincipal Investigator: David GordonResearch Assistant: Isaac Shirokoff
LegendActive Core
Auto SuburbExurban
Transit Suburb
0 4.5 92.25 Kilometres
0 25 5012.5 Kilometres
±
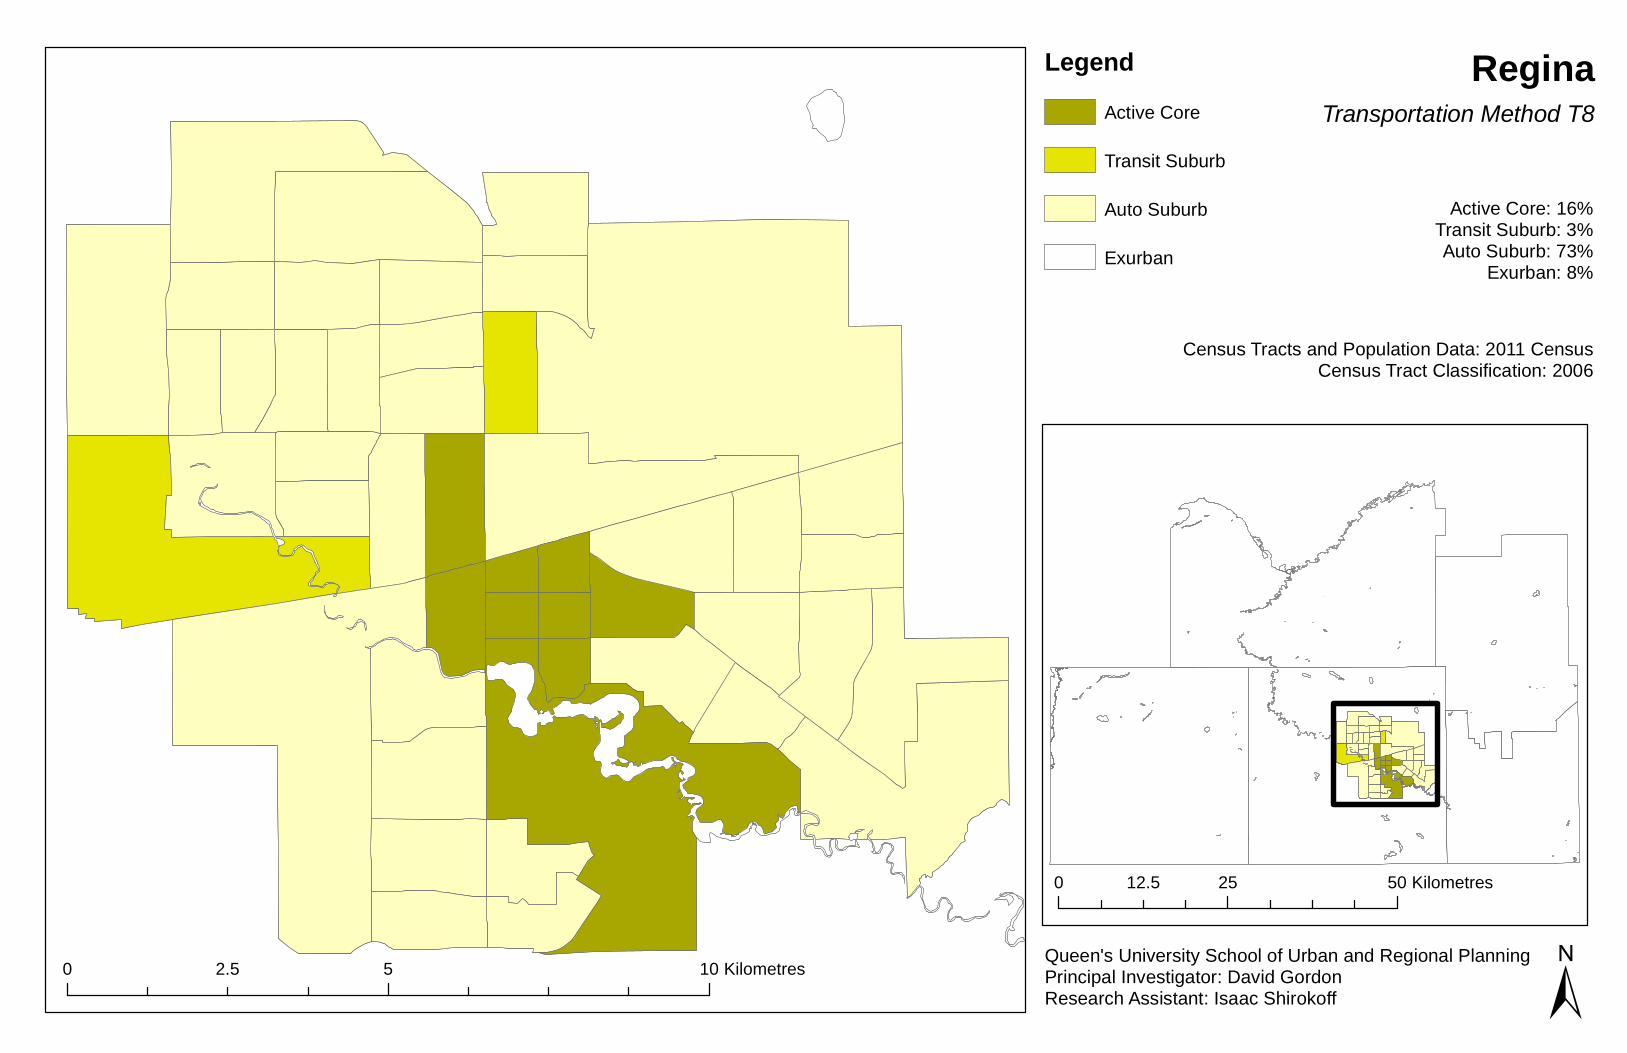
ReginaTransportation Method T8
Active Core: 16%Transit Suburb: 3%Auto Suburb: 73%
Exurban: 8%
Census Tracts and Population Data: 2011 CensusCensus Tract Classification: 2006
Queen's University School of Urban and Regional PlanningPrincipal Investigator: David GordonResearch Assistant: Isaac Shirokoff ±
LegendActive Core
Auto Suburb
Exurban
Transit Suburb
0 25 5012.5 Kilometres
0 5 102.5 Kilometres
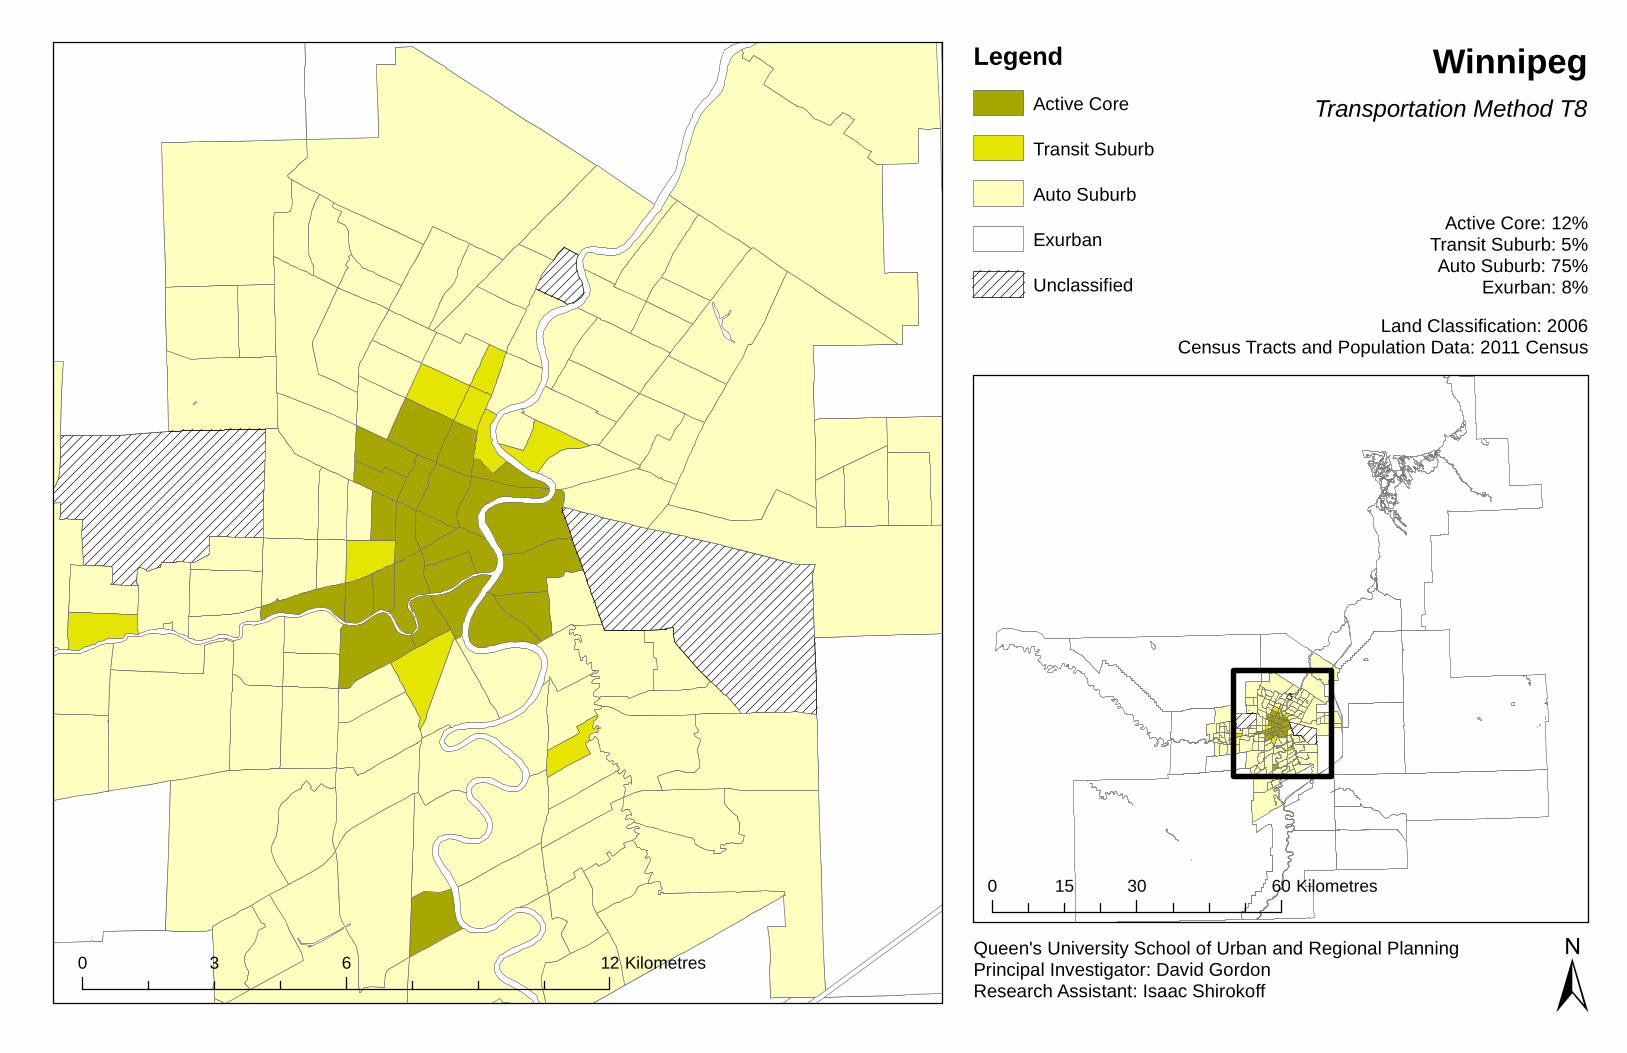
WinnipegTransportation Method T8
Active Core: 12%Transit Suburb: 5%Auto Suburb: 75%
Exurban: 8%Land Classification: 2006
Census Tracts and Population Data: 2011 Census
Queen's University School of Urban and Regional PlanningPrincipal Investigator: David GordonResearch Assistant: Isaac Shirokoff ±0 6 123 Kilometres
0 30 6015 Kilometres
LegendActive Core
Auto Suburb
Exurban
Transit Suburb
Unclassified
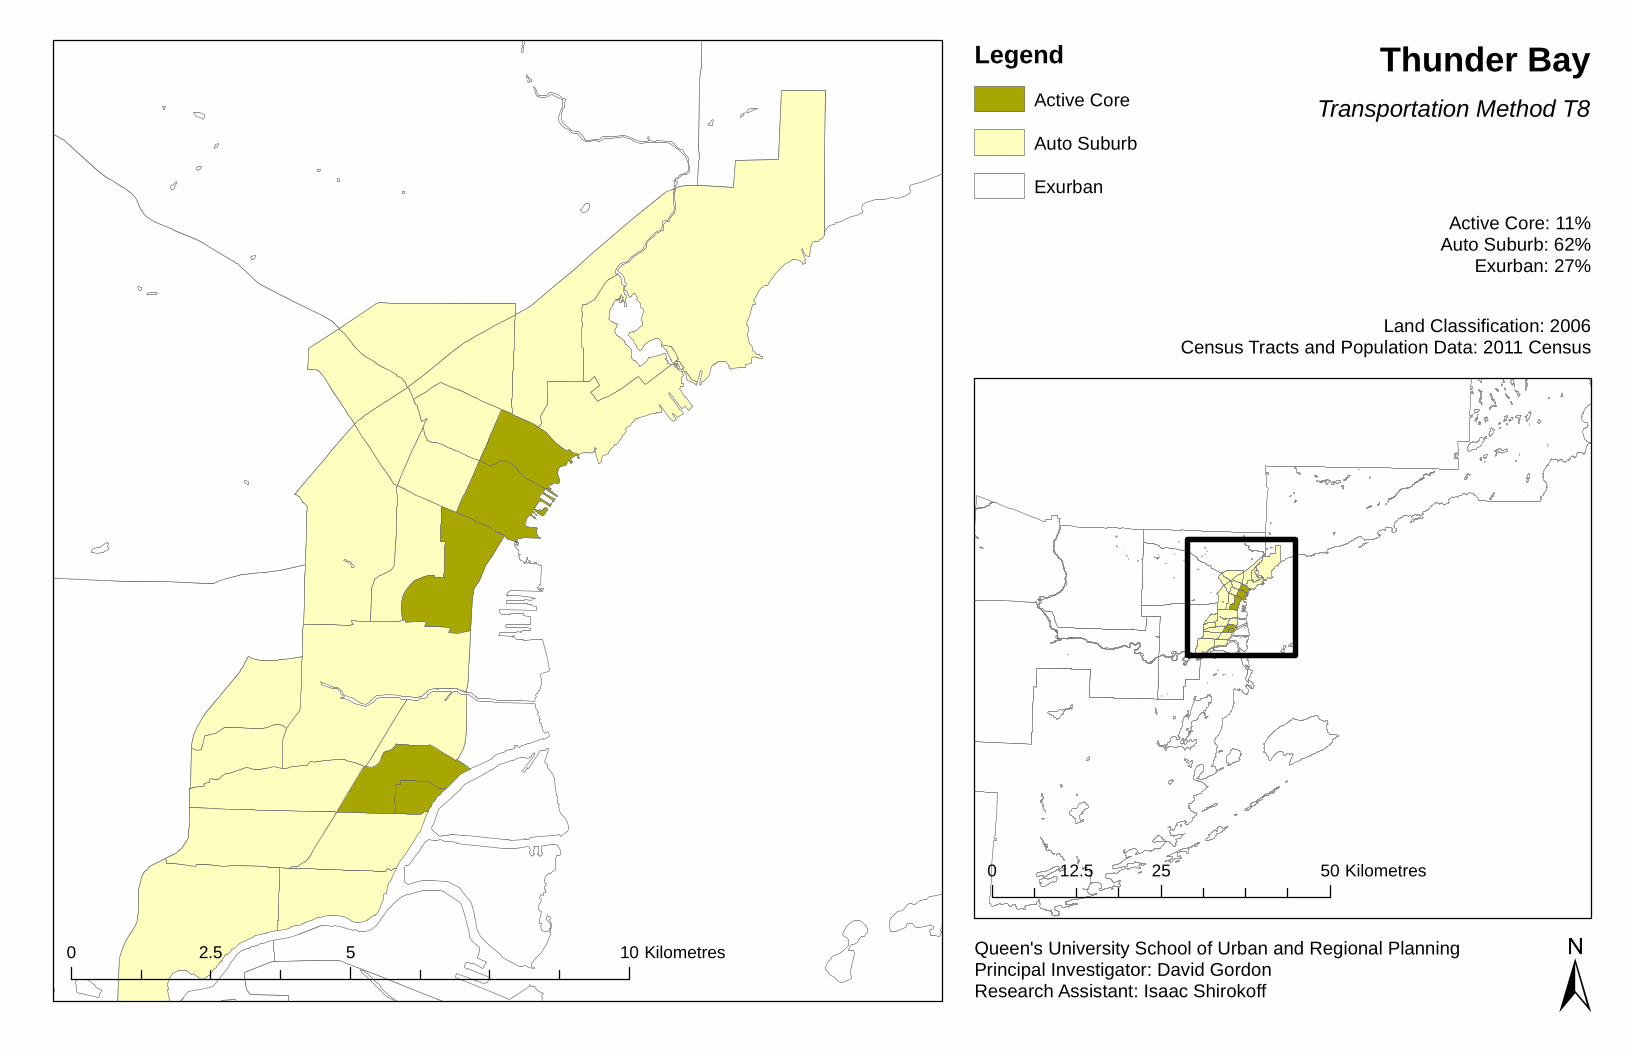
Thunder BayTransportation Method T8
Active Core: 11%Auto Suburb: 62%
Exurban: 27%
Land Classification: 2006Census Tracts and Population Data: 2011 Census
Queen's University School of Urban and Regional PlanningPrincipal Investigator: David GordonResearch Assistant: Isaac Shirokoff ±
LegendActive CoreAuto SuburbExurban
0 5 102.5 Kilometres
0 25 5012.5 Kilometres
WindsorTransportation Method T8
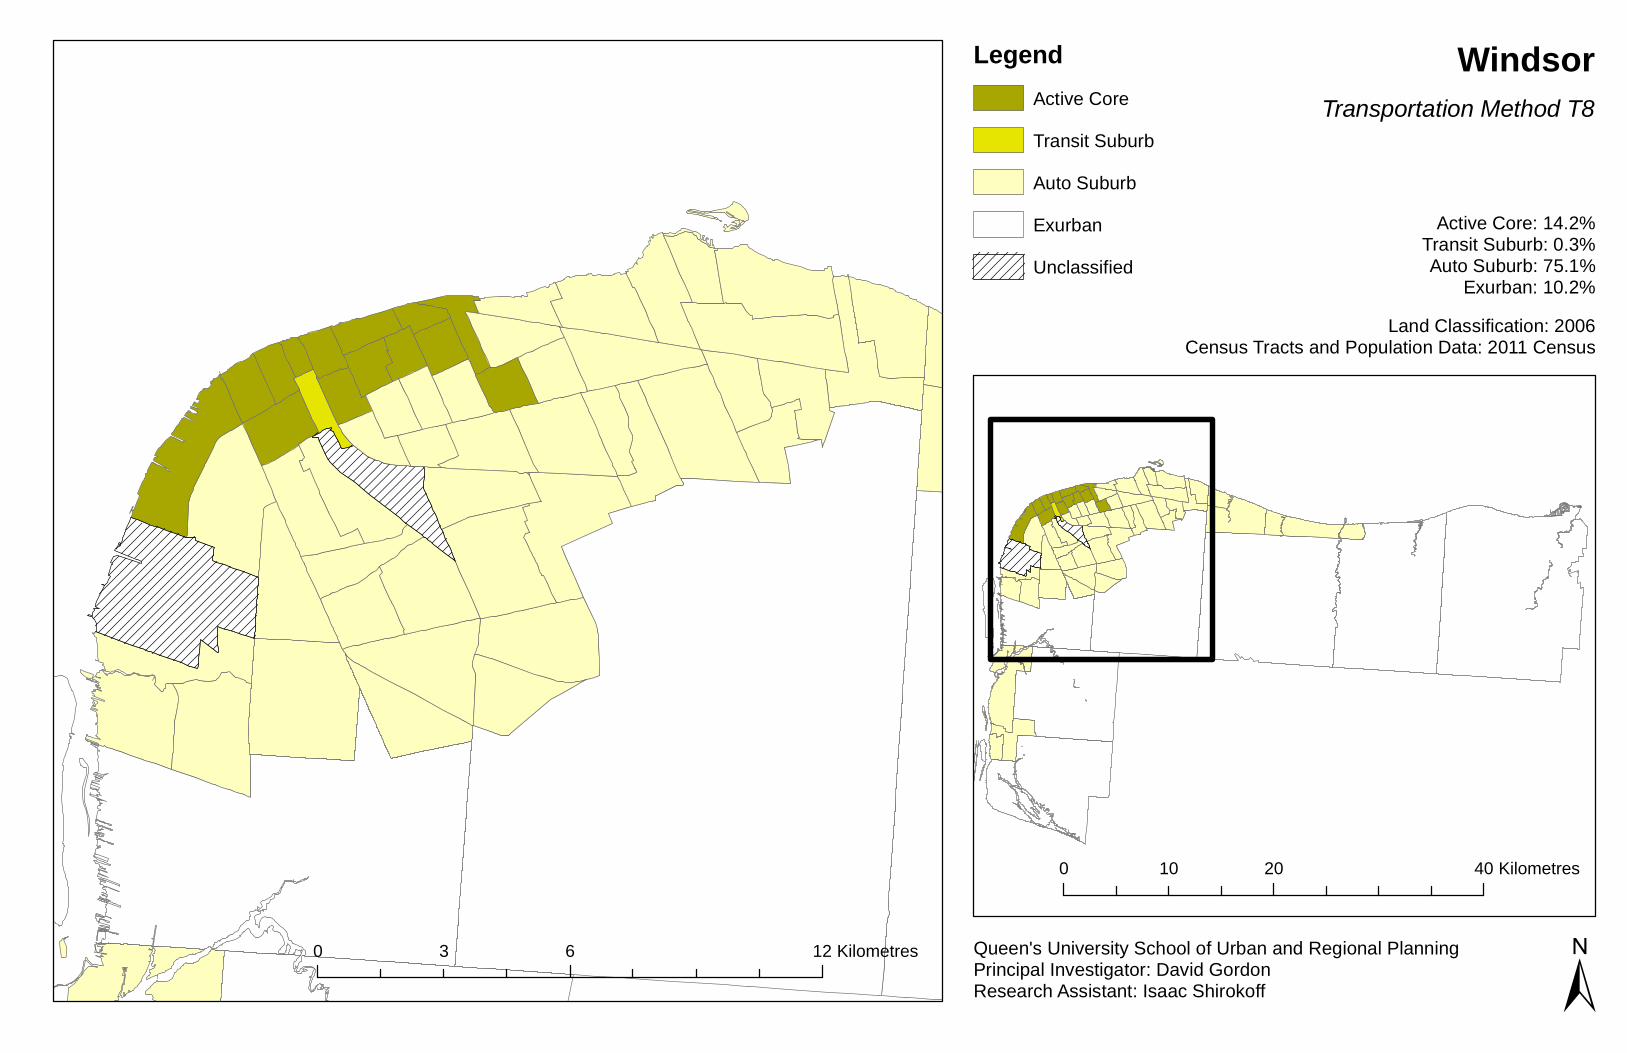
Active Core: 14.2%Transit Suburb: 0.3%Auto Suburb: 75.1%
Exurban: 10.2%Land Classification: 2006
Census Tracts and Population Data: 2011 Census
Queen's University School of Urban and Regional PlanningPrincipal Investigator: David GordonResearch Assistant: Isaac Shirokoff ±
0 6 123 Kilometres
0 20 4010 Kilometres
LegendActive Core
Auto SuburbExurban
Transit Suburb
Unclassified
0 5 102.5 Kilometres
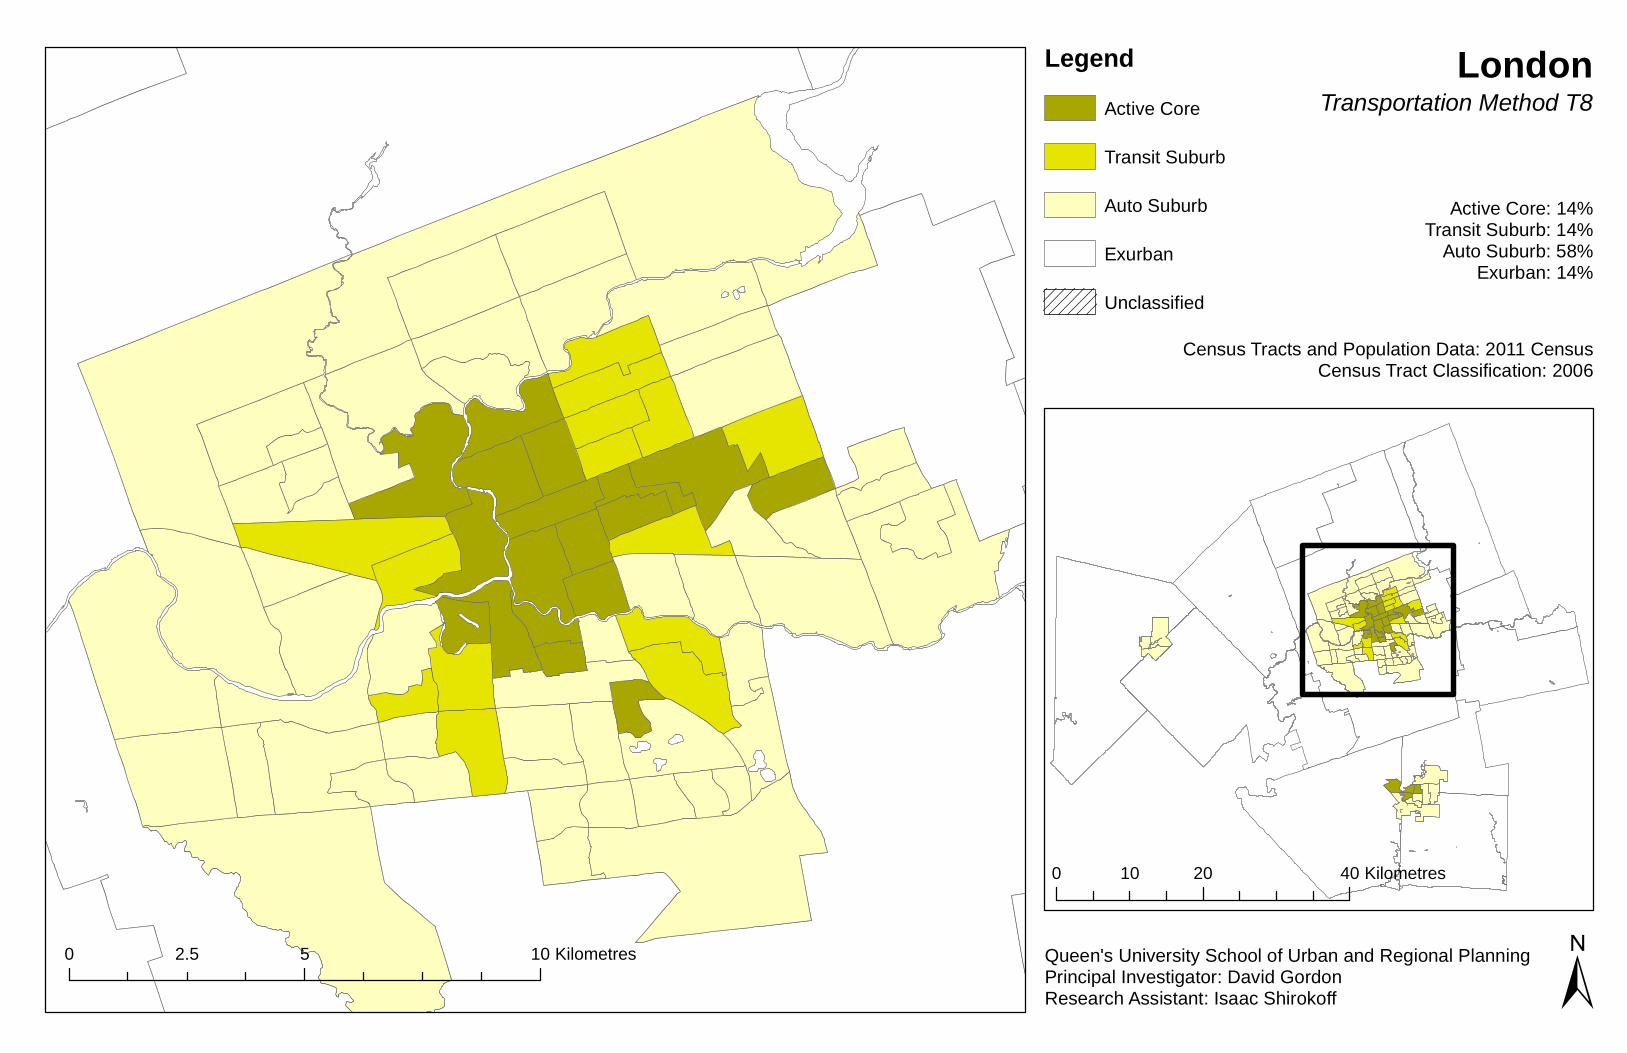
LondonTransportation Method T8
Active Core: 14%Transit Suburb: 14%
Auto Suburb: 58%Exurban: 14%
Census Tracts and Population Data: 2011 CensusCensus Tract Classification: 2006
Queen's University School of Urban and Regional PlanningPrincipal Investigator: David GordonResearch Assistant: Isaac Shirokoff
0 20 4010 Kilometres
±
LegendActive Core
Auto Suburb
Exurban
Transit Suburb
Unclassified
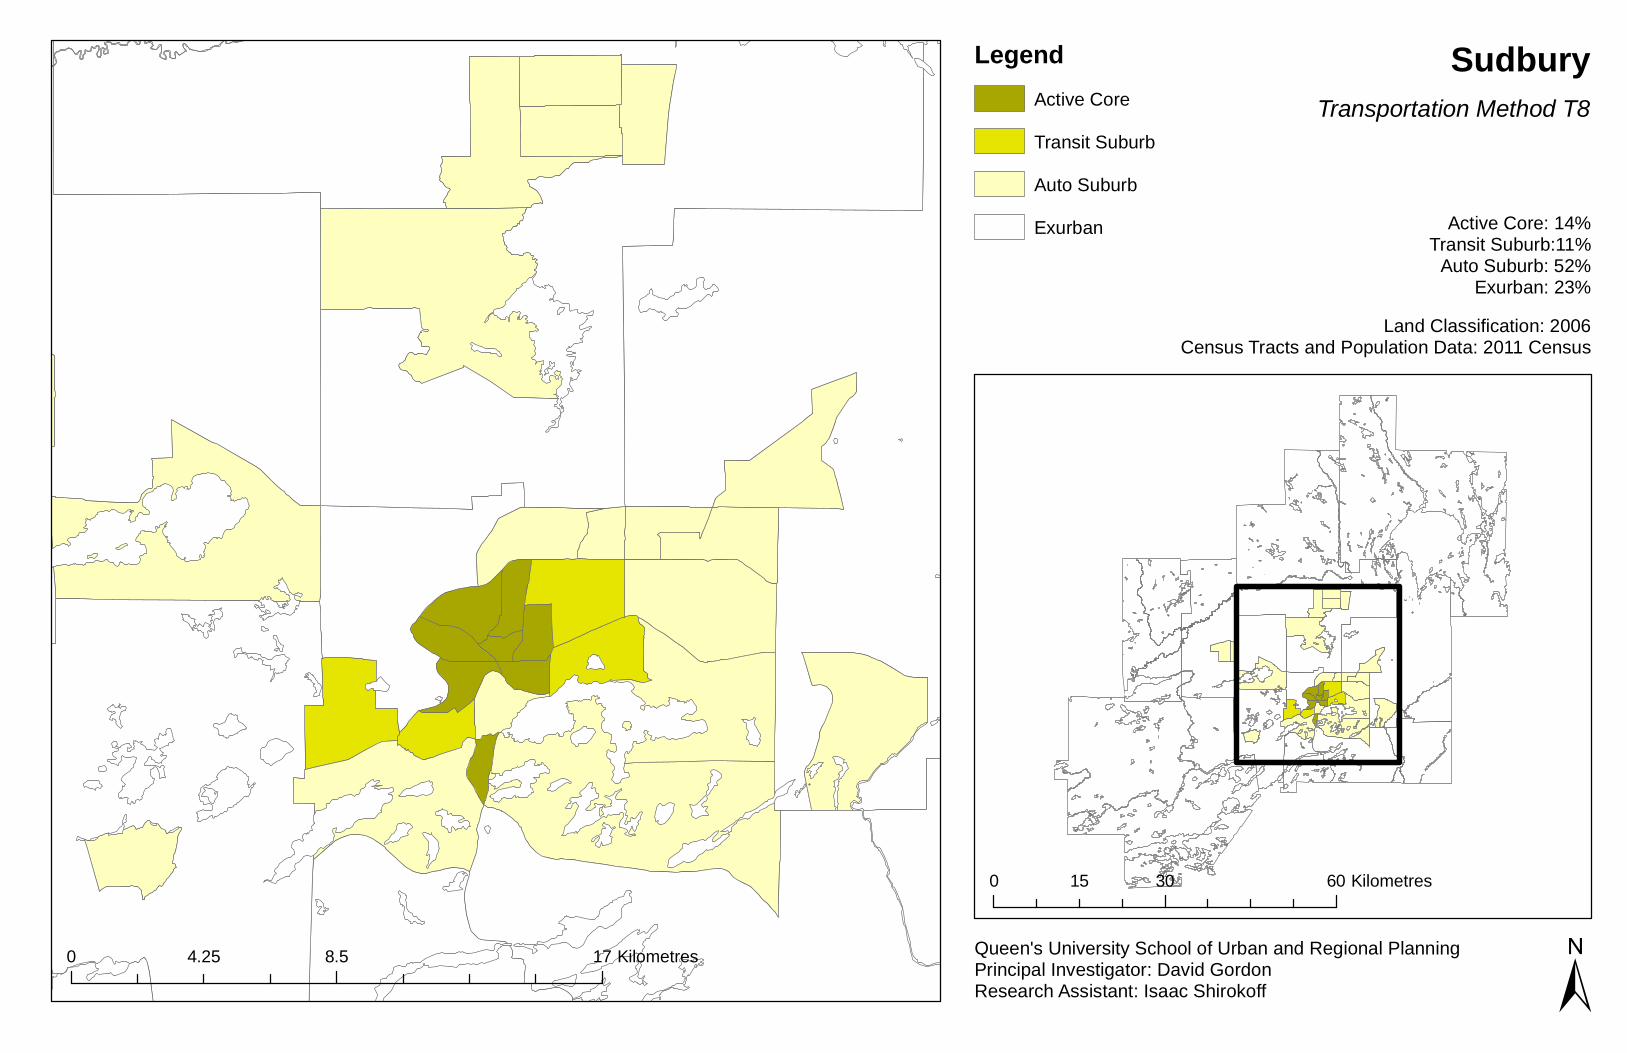
SudburyTransportation Method T8
Active Core: 14%Transit Suburb:11%
Auto Suburb: 52%Exurban: 23%
Land Classification: 2006Census Tracts and Population Data: 2011 Census
Queen's University School of Urban and Regional PlanningPrincipal Investigator: David GordonResearch Assistant: Isaac Shirokoff
LegendActive Core
Auto SuburbExurban
Transit Suburb
±0 8.5 174.25 Kilometres
0 30 6015 Kilometres
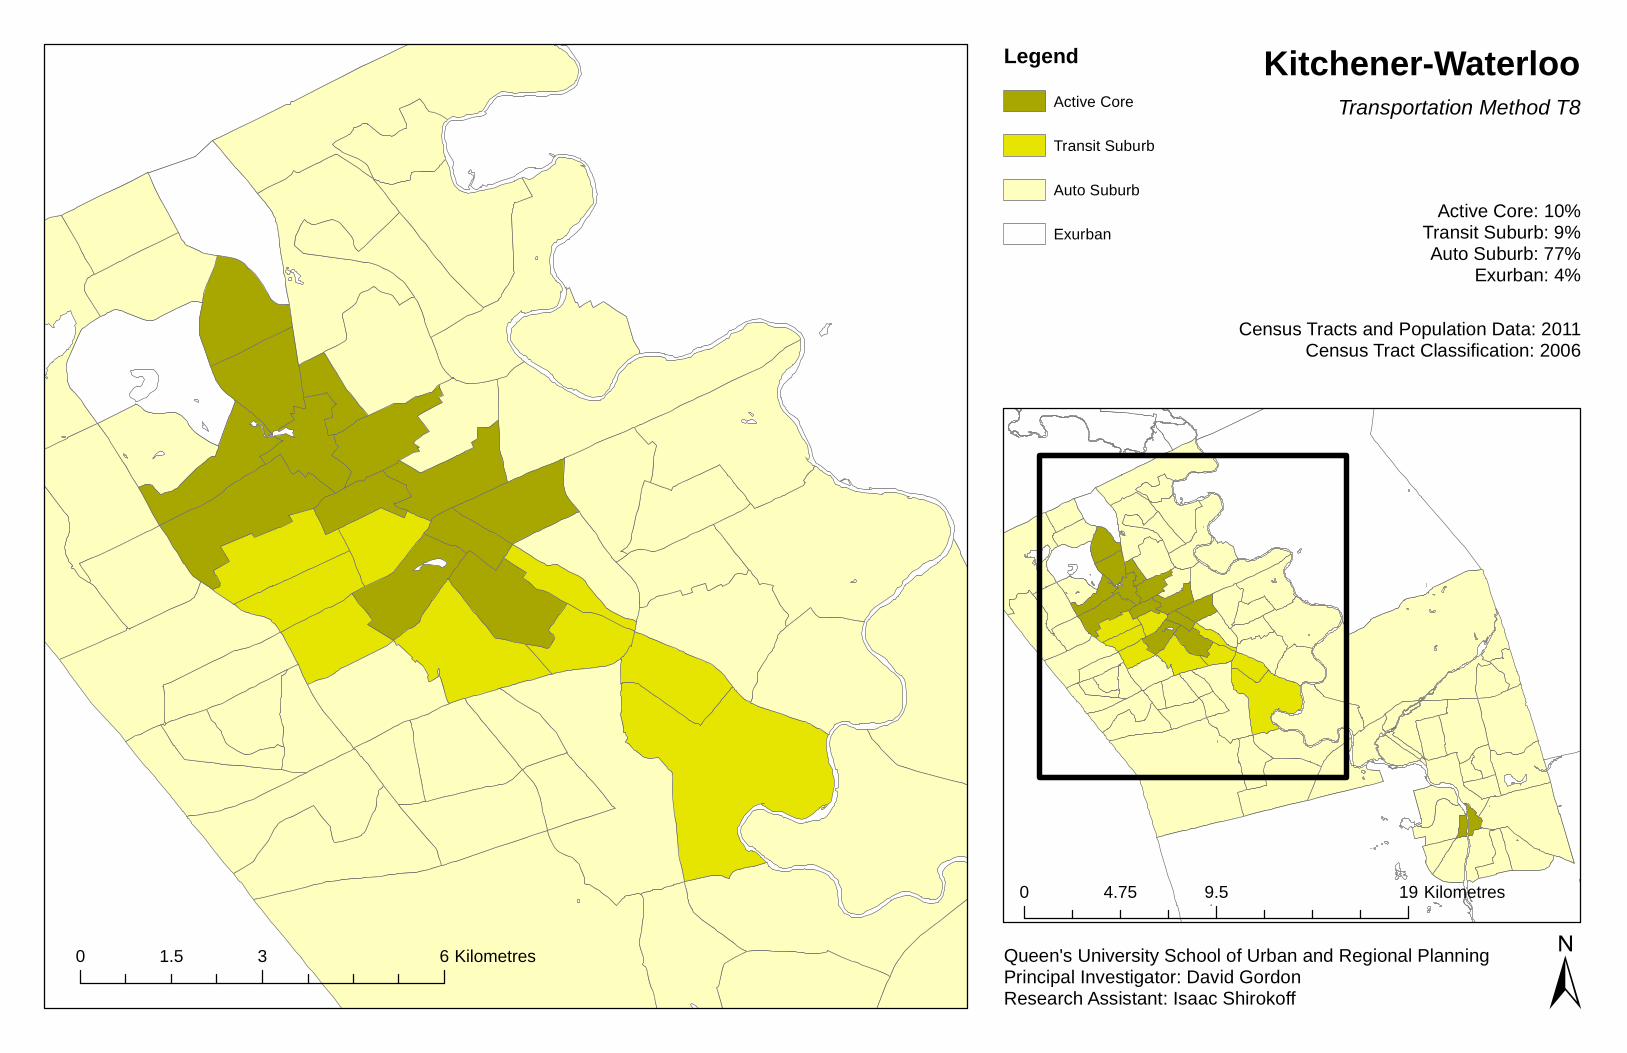
0 3 61.5 Kilometres
0 9.5 194.75 Kilometres
±
LegendActive Core
Auto Suburb
Exurban
Transit Suburb
Kitchener-WaterlooTransportation Method T8
Active Core: 10%Transit Suburb: 9%Auto Suburb: 77%
Exurban: 4%
Census Tracts and Population Data: 2011Census Tract Classification: 2006
Queen's University School of Urban and Regional PlanningPrincipal Investigator: David GordonResearch Assistant: Isaac Shirokoff
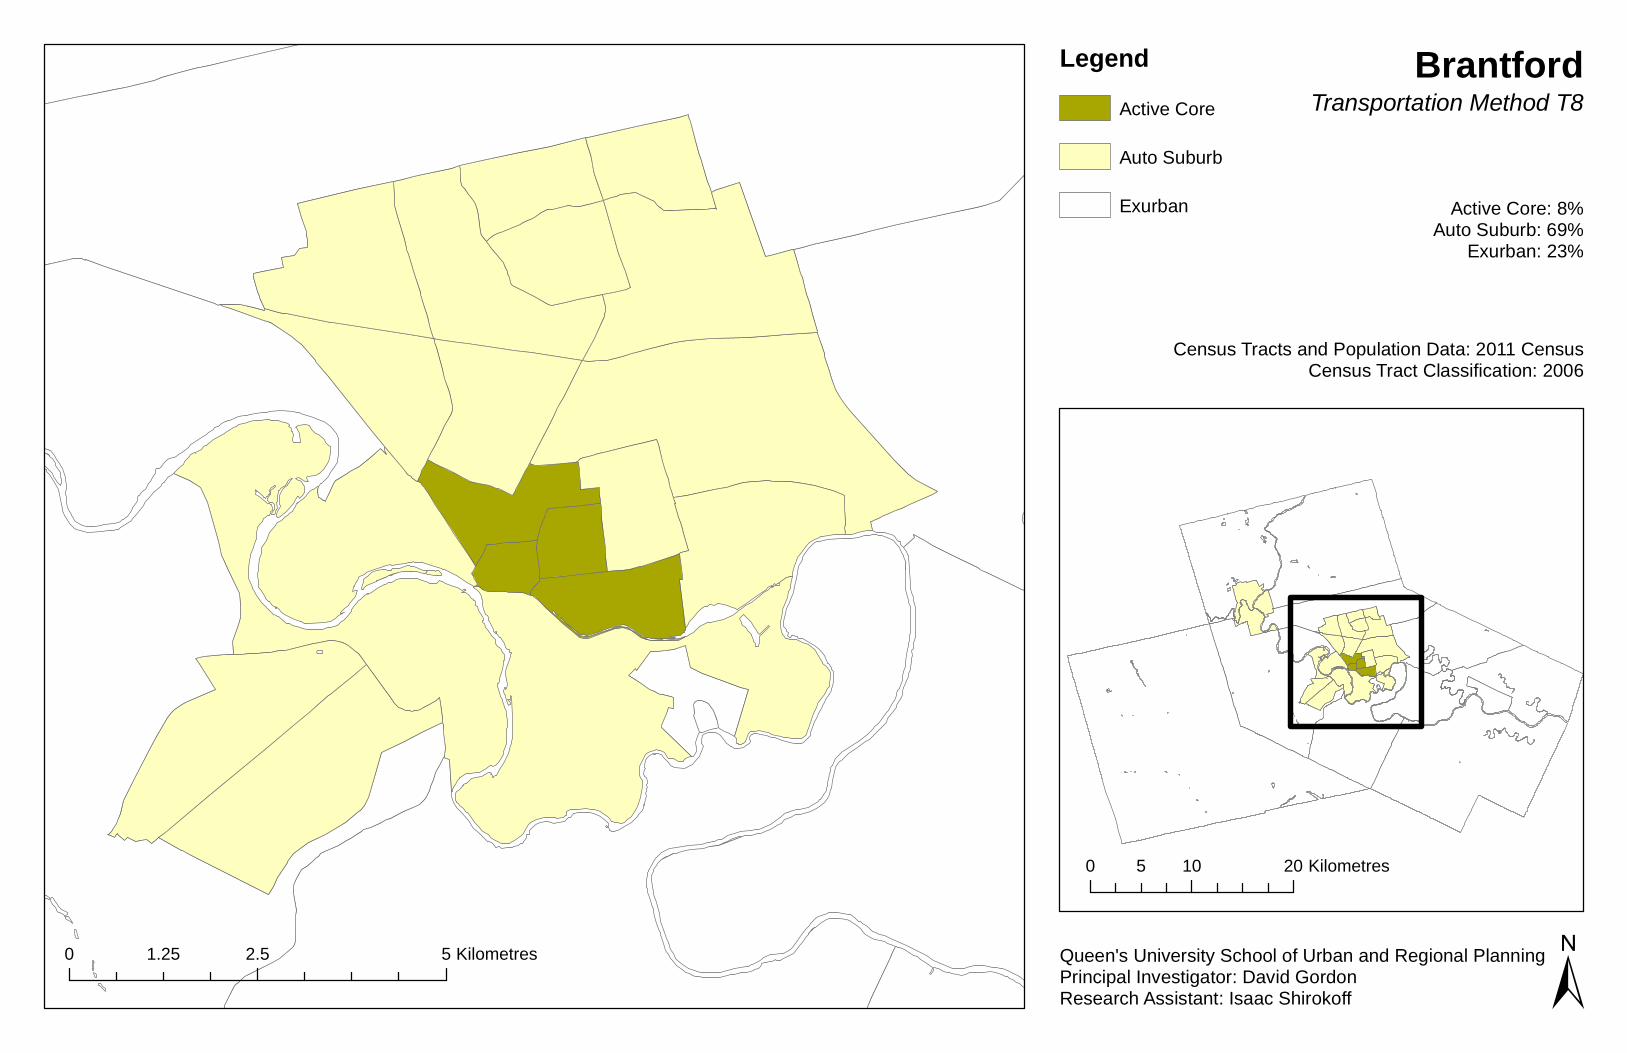
0 2.5 51.25 Kilometres
BrantfordTransportation Method T8
Active Core: 8%Auto Suburb: 69%
Exurban: 23%
Census Tracts and Population Data: 2011 CensusCensus Tract Classification: 2006
Queen's University School of Urban and Regional PlanningPrincipal Investigator: David GordonResearch Assistant: Isaac Shirokoff
LegendActive Core
Auto Suburb
Exurban
±
0 10 205 Kilometres
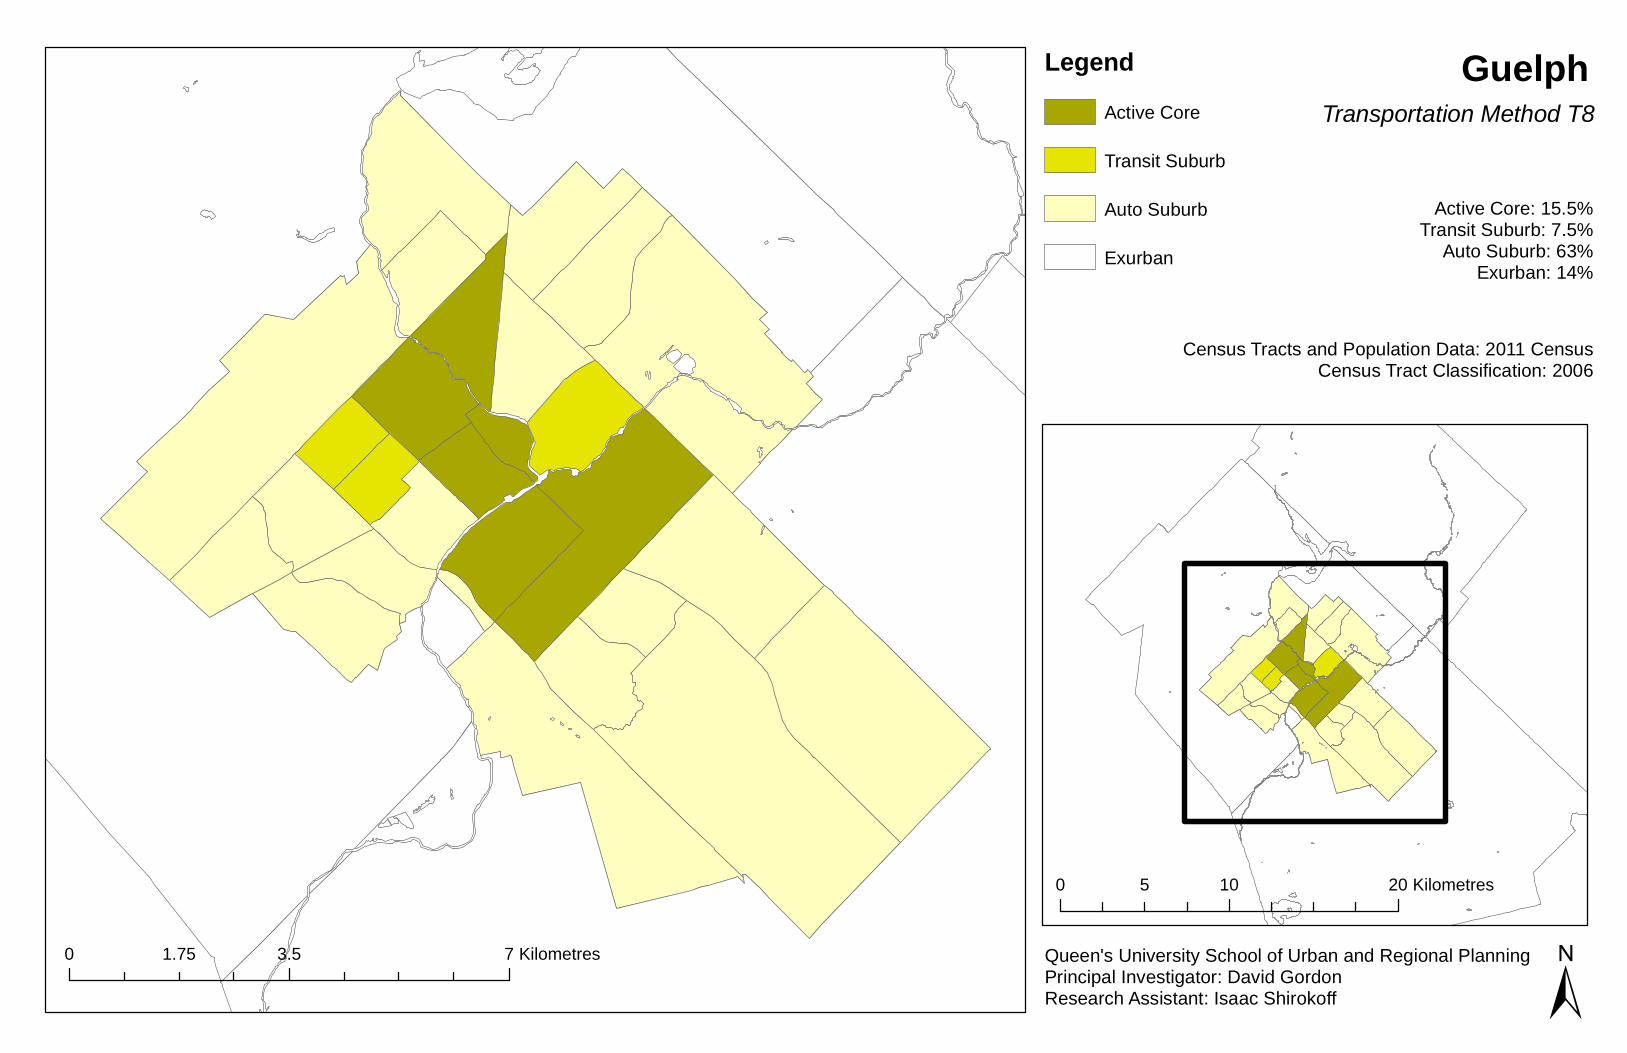
0 3.5 71.75 Kilometres
GuelphTransportation Method T8
Active Core: 15.5%Transit Suburb: 7.5%
Auto Suburb: 63%Exurban: 14%
Census Tracts and Population Data: 2011 CensusCensus Tract Classification: 2006
Queen's University School of Urban and Regional PlanningPrincipal Investigator: David GordonResearch Assistant: Isaac Shirokoff
0 10 205 Kilometres
±
LegendActive Core
Auto Suburb
Exurban
Transit Suburb
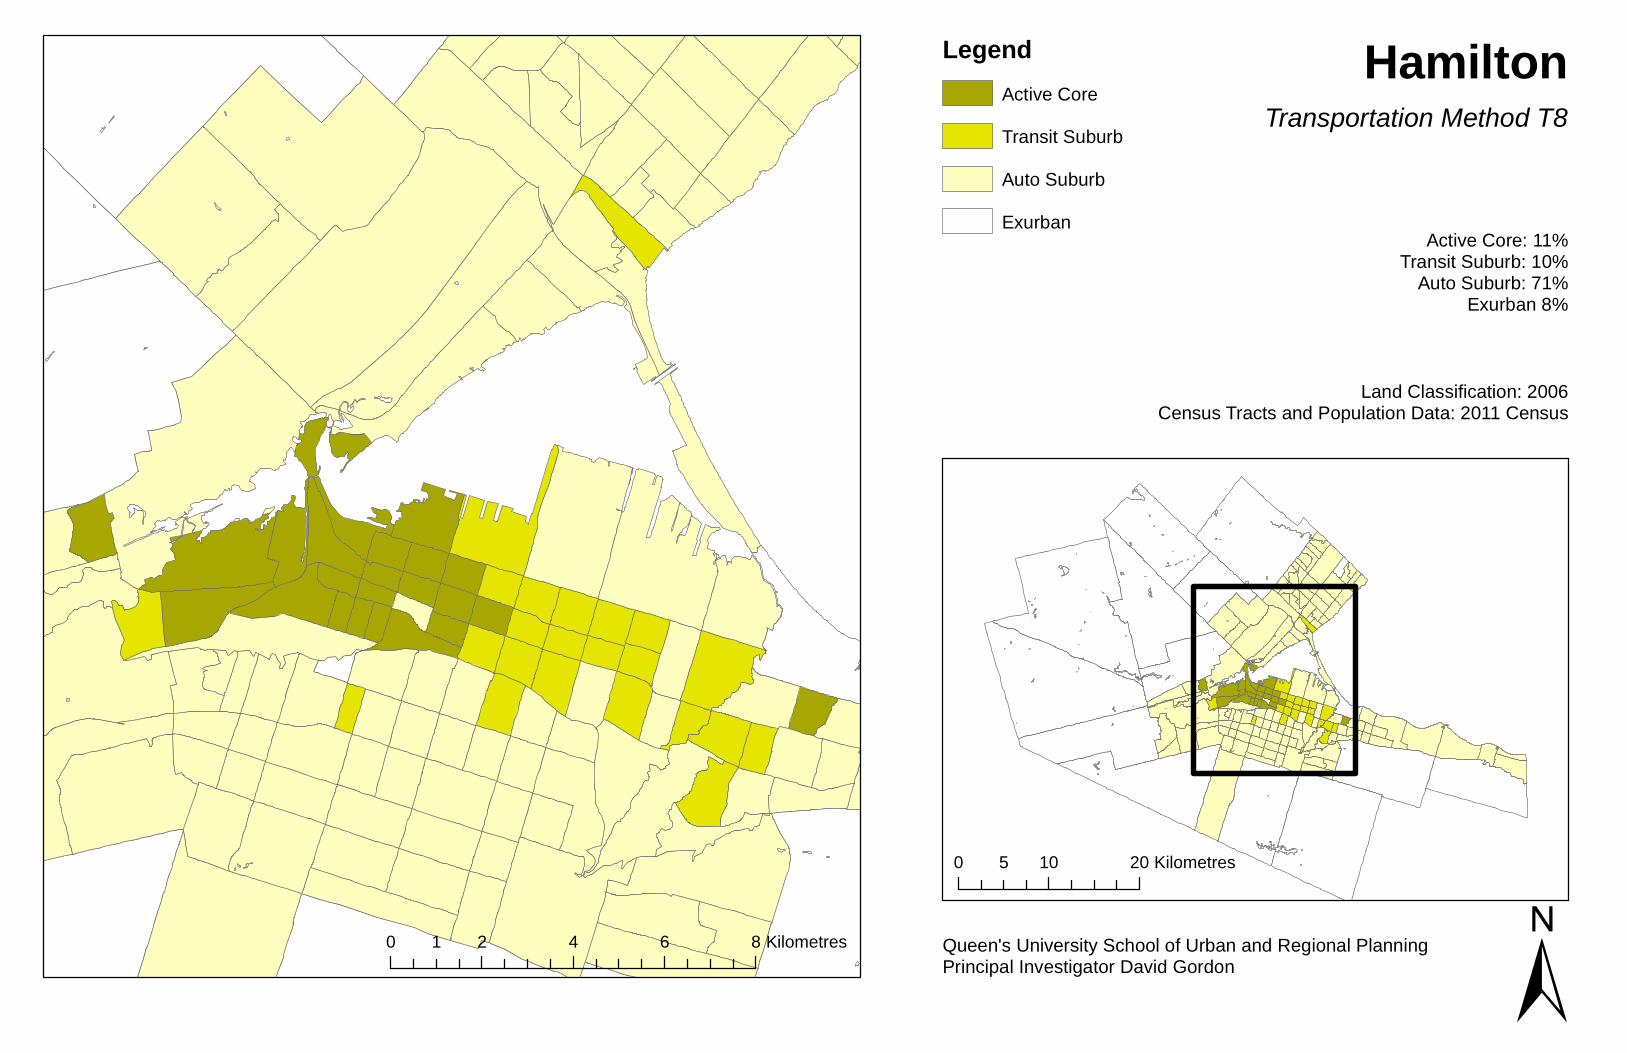
0 2 4 6 81 Kilometres
0 10 205 Kilometres
±
HamiltonTransportation Method T8
Active Core: 11%Transit Suburb: 10%
Auto Suburb: 71%Exurban 8%
Land Classification: 2006Census Tracts and Population Data: 2011 Census
LegendActive Core
Auto SuburbExurban
Transit Suburb
Queen's University School of Urban and Regional PlanningPrincipal Investigator David Gordon
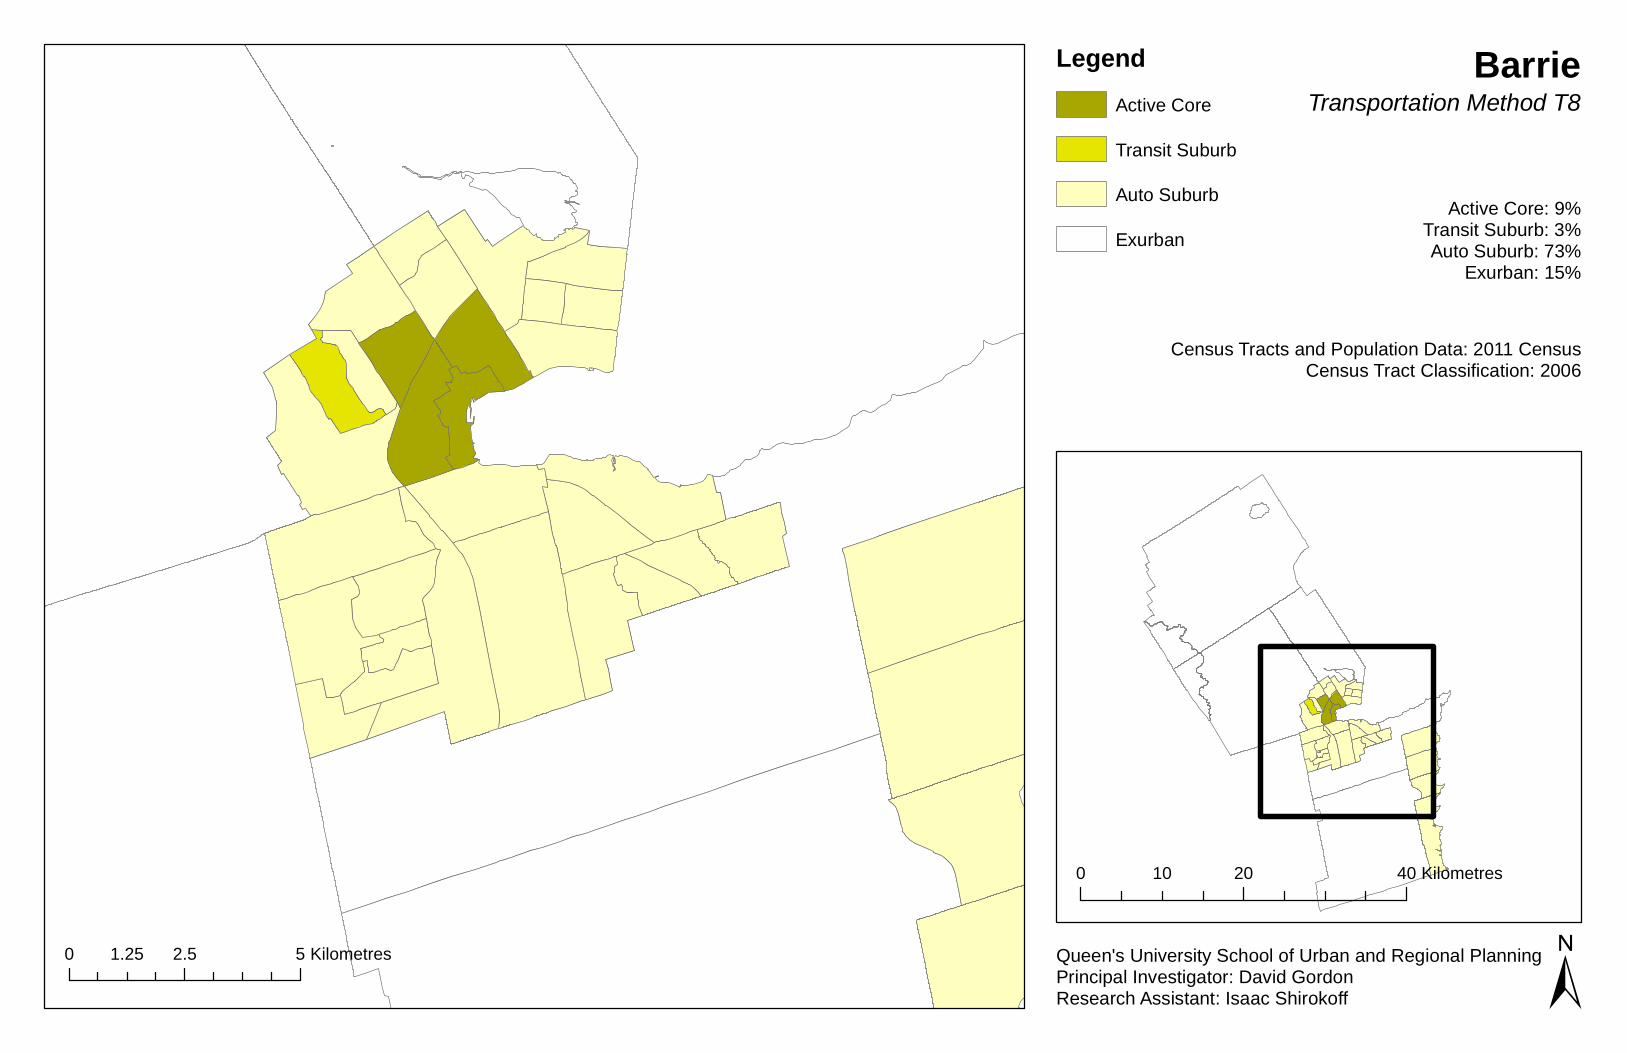
0 20 4010 Kilometres
0 2.5 51.25 Kilometres ±
LegendActive Core
Auto Suburb
Exurban
Transit Suburb
BarrieTransportation Method T8
Active Core: 9%Transit Suburb: 3%Auto Suburb: 73%
Exurban: 15%
Census Tracts and Population Data: 2011 CensusCensus Tract Classification: 2006
Queen's University School of Urban and Regional PlanningPrincipal Investigator: David GordonResearch Assistant: Isaac Shirokoff
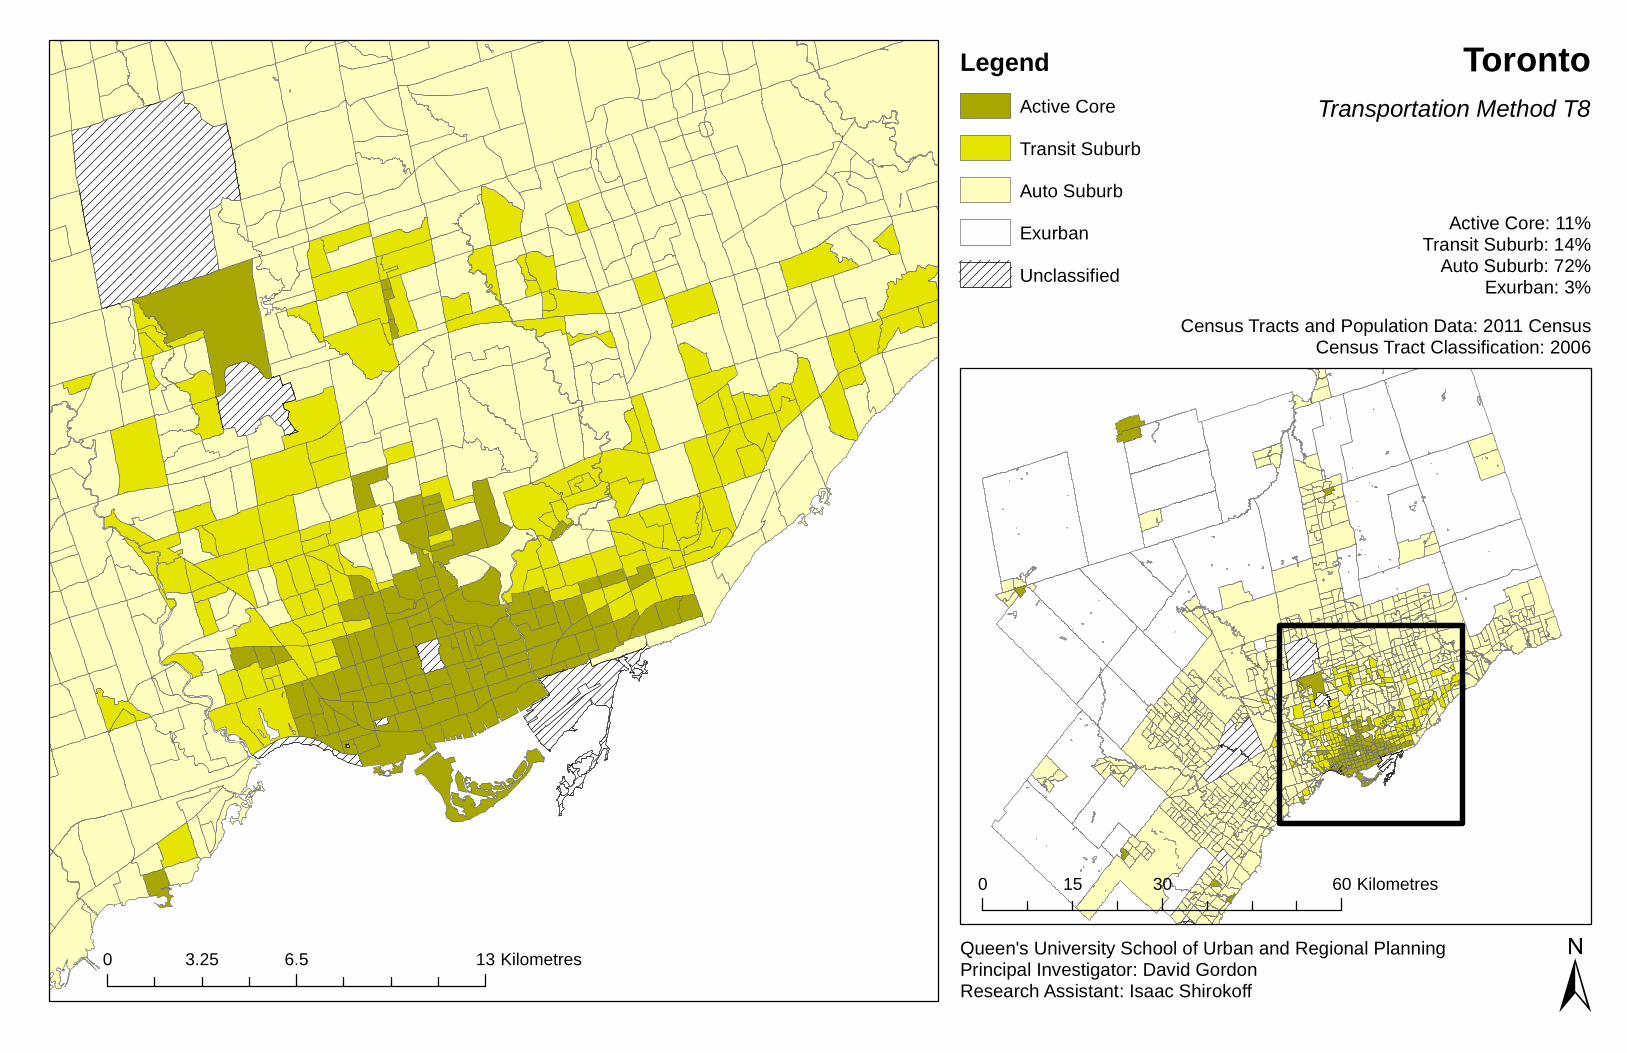
TorontoTransportation Method T8
Active Core: 11%Transit Suburb: 14%
Auto Suburb: 72%Exurban: 3%
Census Tracts and Population Data: 2011 CensusCensus Tract Classification: 2006
Queen's University School of Urban and Regional PlanningPrincipal Investigator: David GordonResearch Assistant: Isaac Shirokoff ±0 6.5 133.25 Kilometres
0 30 6015 Kilometres
LegendActive Core
Auto SuburbExurban
Transit Suburb
Unclassified
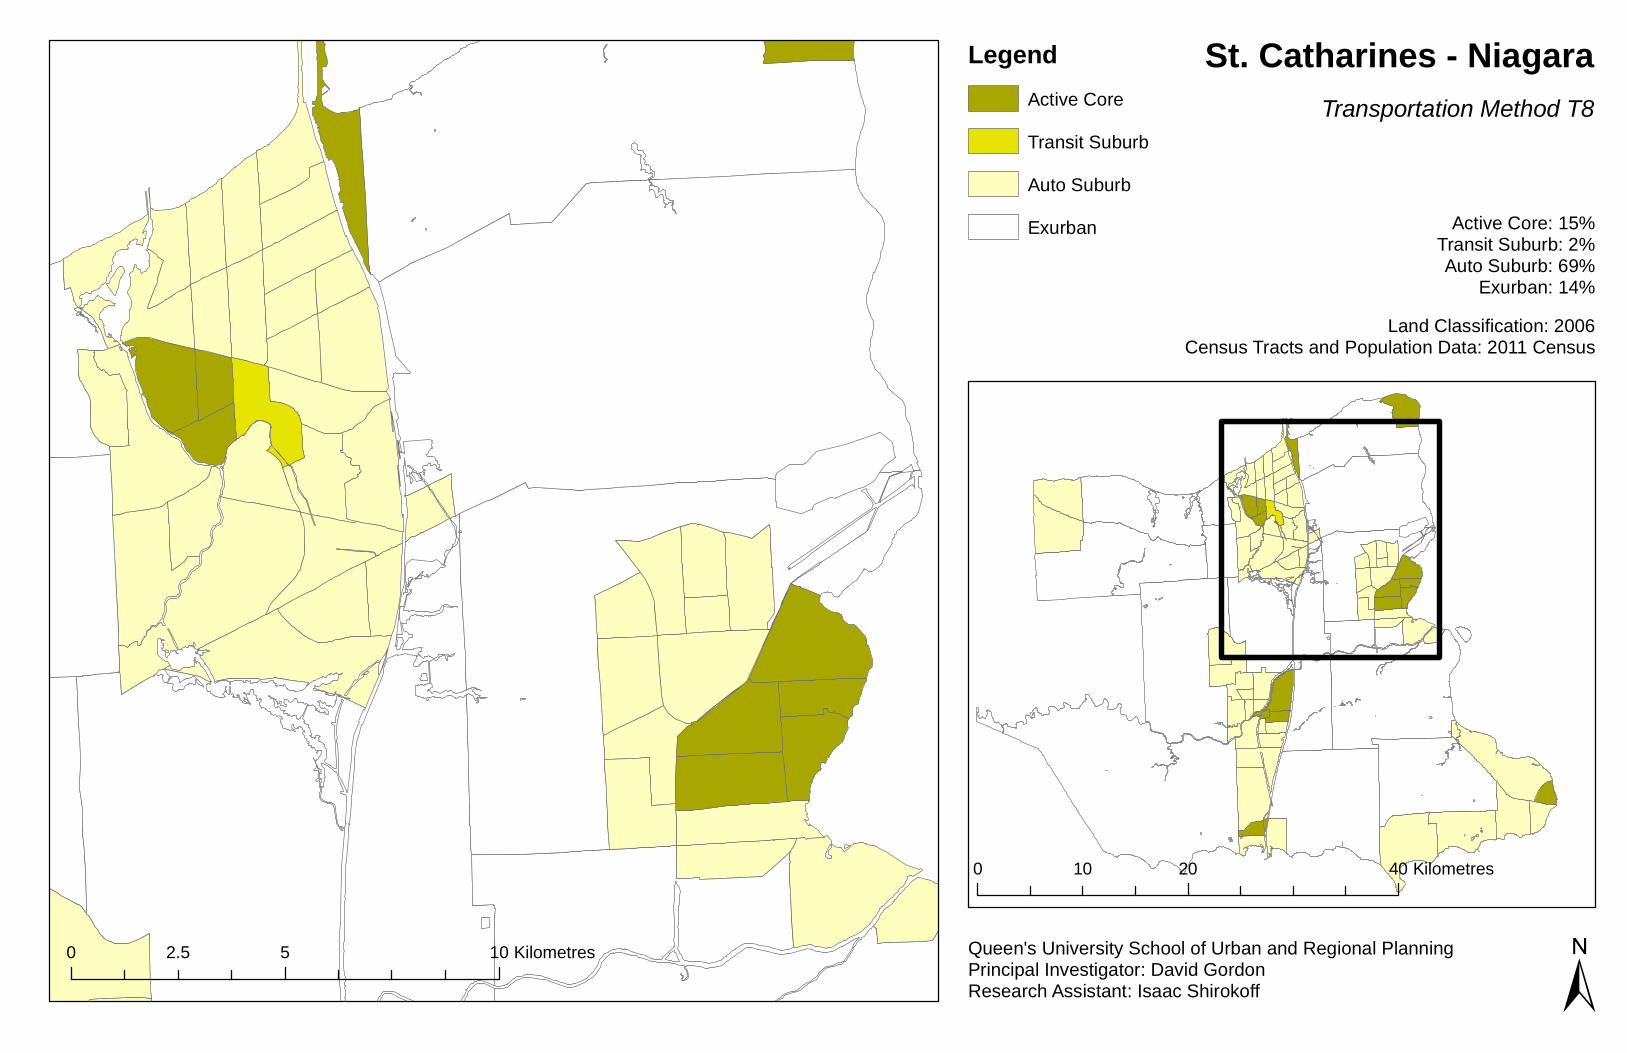
St. Catharines - NiagaraTransportation Method T8
Active Core: 15%Transit Suburb: 2%Auto Suburb: 69%
Exurban: 14%Land Classification: 2006
Census Tracts and Population Data: 2011 Census
Queen's University School of Urban and Regional PlanningPrincipal Investigator: David GordonResearch Assistant: Isaac Shirokoff
LegendActive Core
Auto SuburbExurban
Transit Suburb
±0 5 102.5 Kilometres
0 20 4010 Kilometres
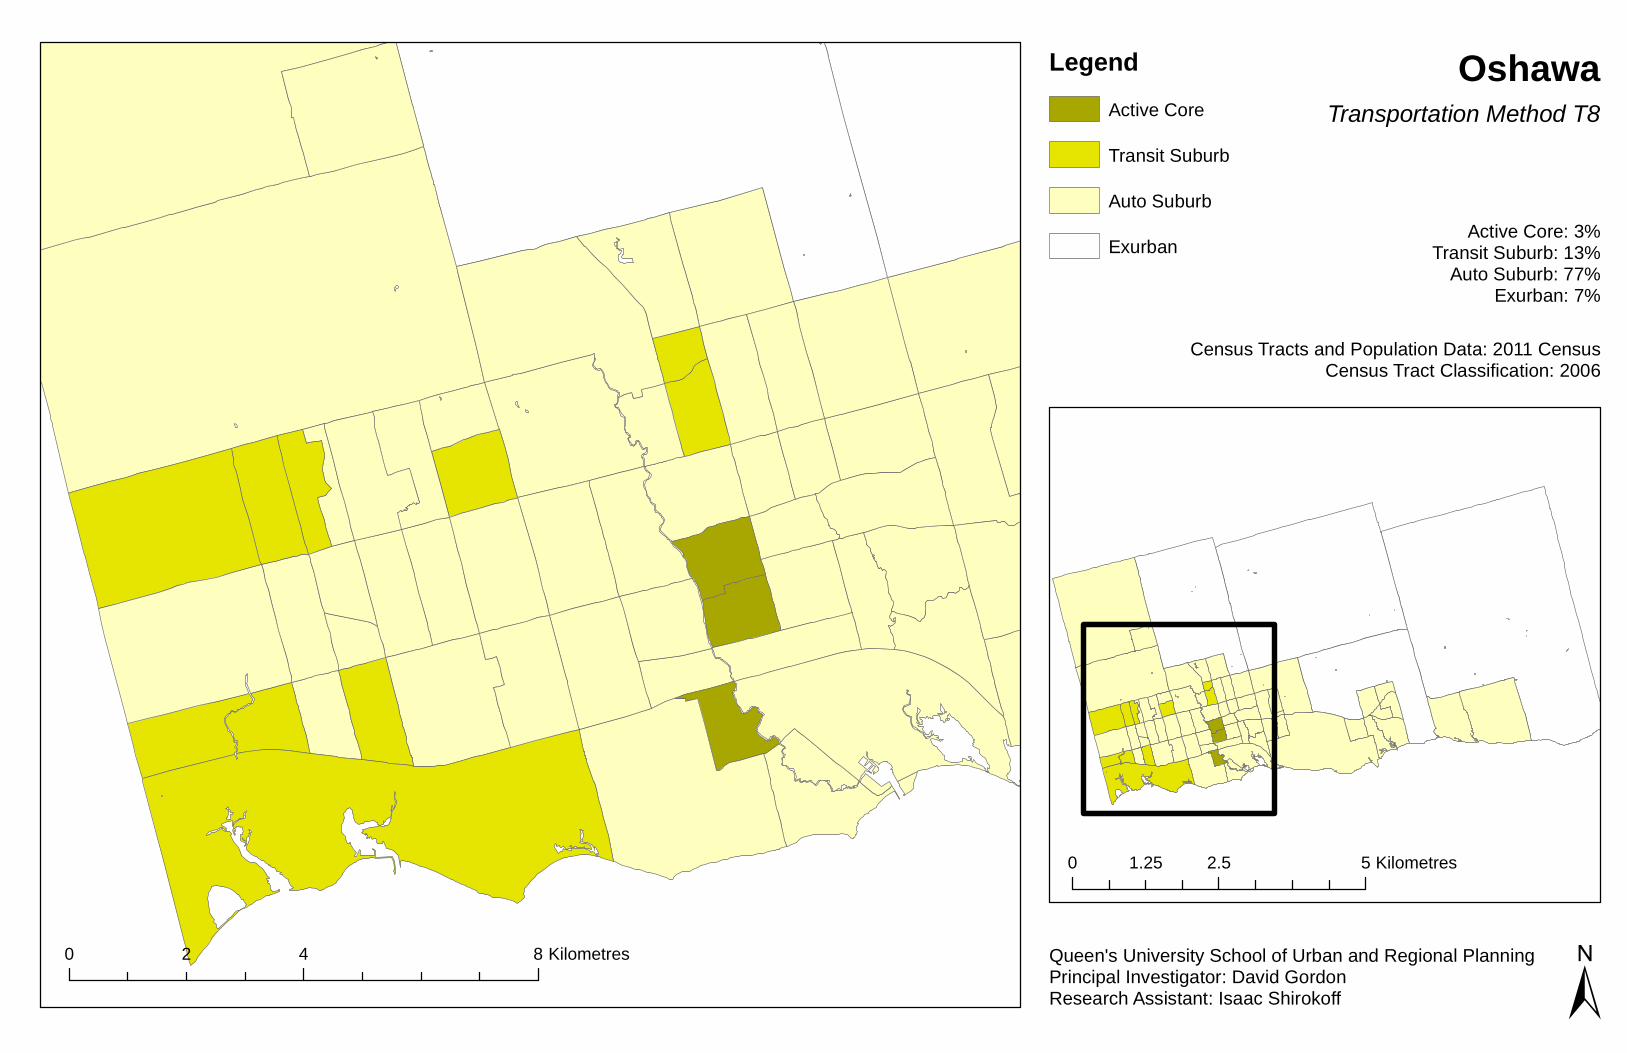
0 4 82 Kilometres
OshawaTransportation Method T8
Active Core: 3%Transit Suburb: 13%
Auto Suburb: 77%Exurban: 7%
Census Tracts and Population Data: 2011 CensusCensus Tract Classification: 2006
Queen's University School of Urban and Regional PlanningPrincipal Investigator: David GordonResearch Assistant: Isaac Shirokoff ±
0 2.5 51.25 Kilometres
LegendActive Core
Auto Suburb
Exurban
Transit Suburb
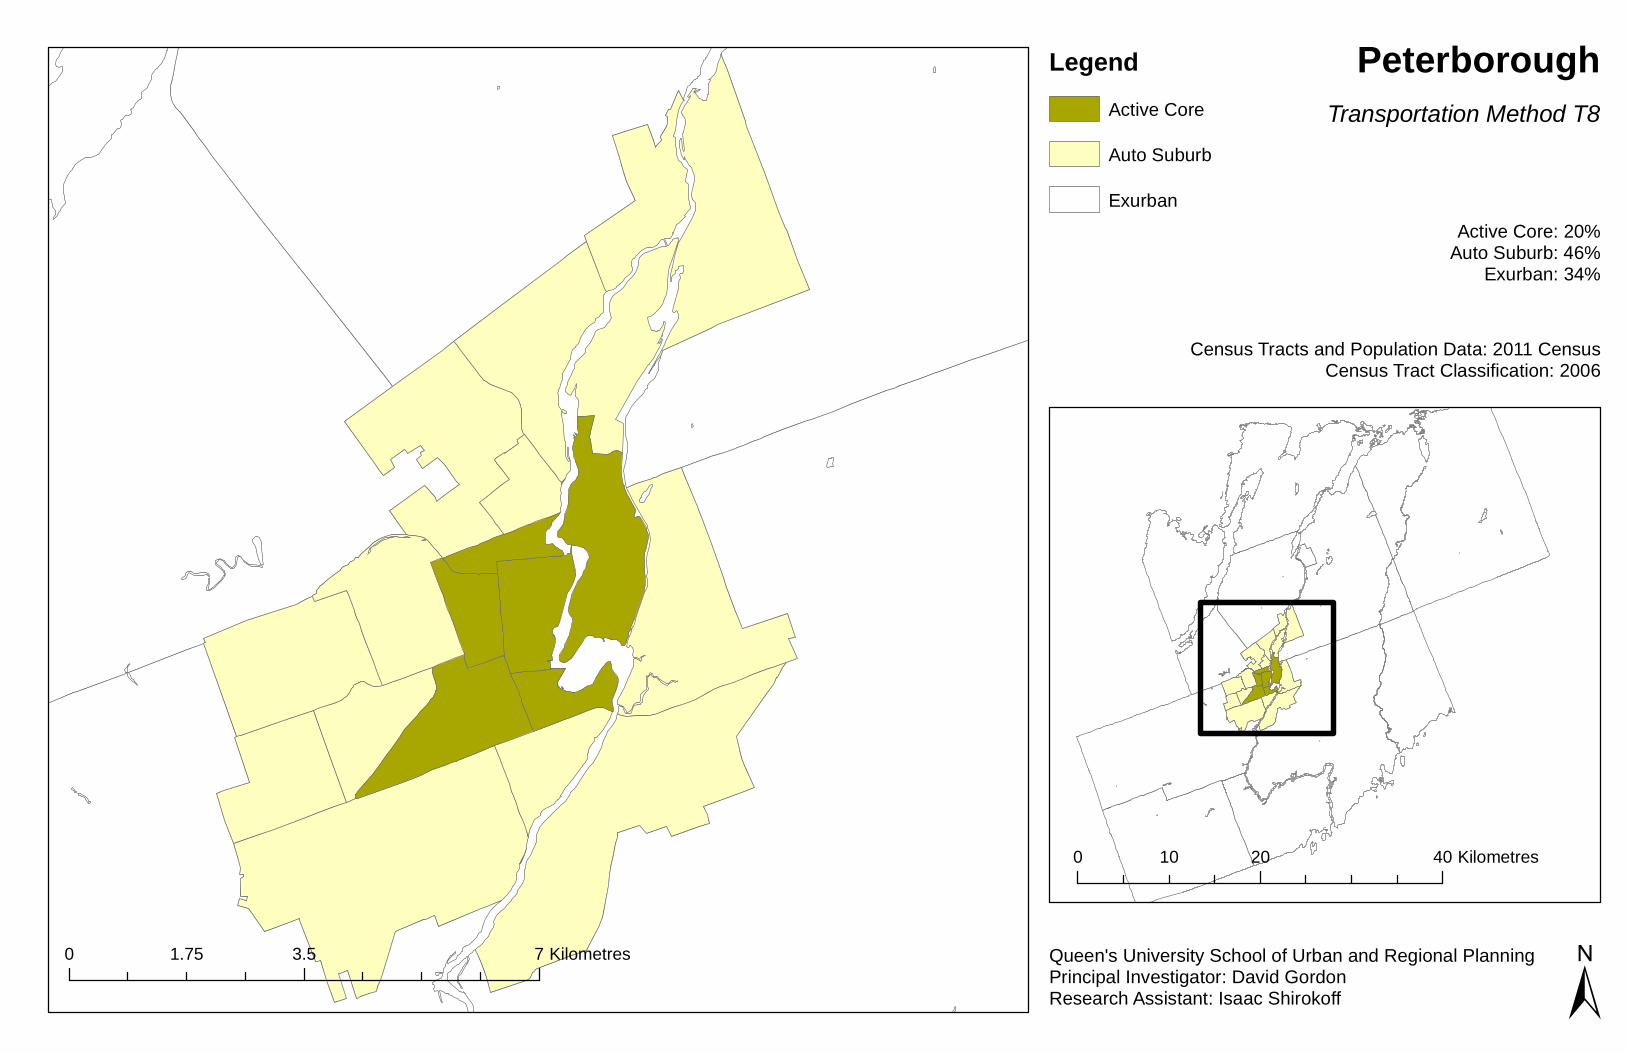
0 3.5 71.75 Kilometres
PeterboroughTransportation Method T8
Active Core: 20%Auto Suburb: 46%
Exurban: 34%
Census Tracts and Population Data: 2011 CensusCensus Tract Classification: 2006
Queen's University School of Urban and Regional PlanningPrincipal Investigator: David GordonResearch Assistant: Isaac Shirokoff ±
0 20 4010 Kilometres
LegendActive Core
Auto Suburb
Exurban
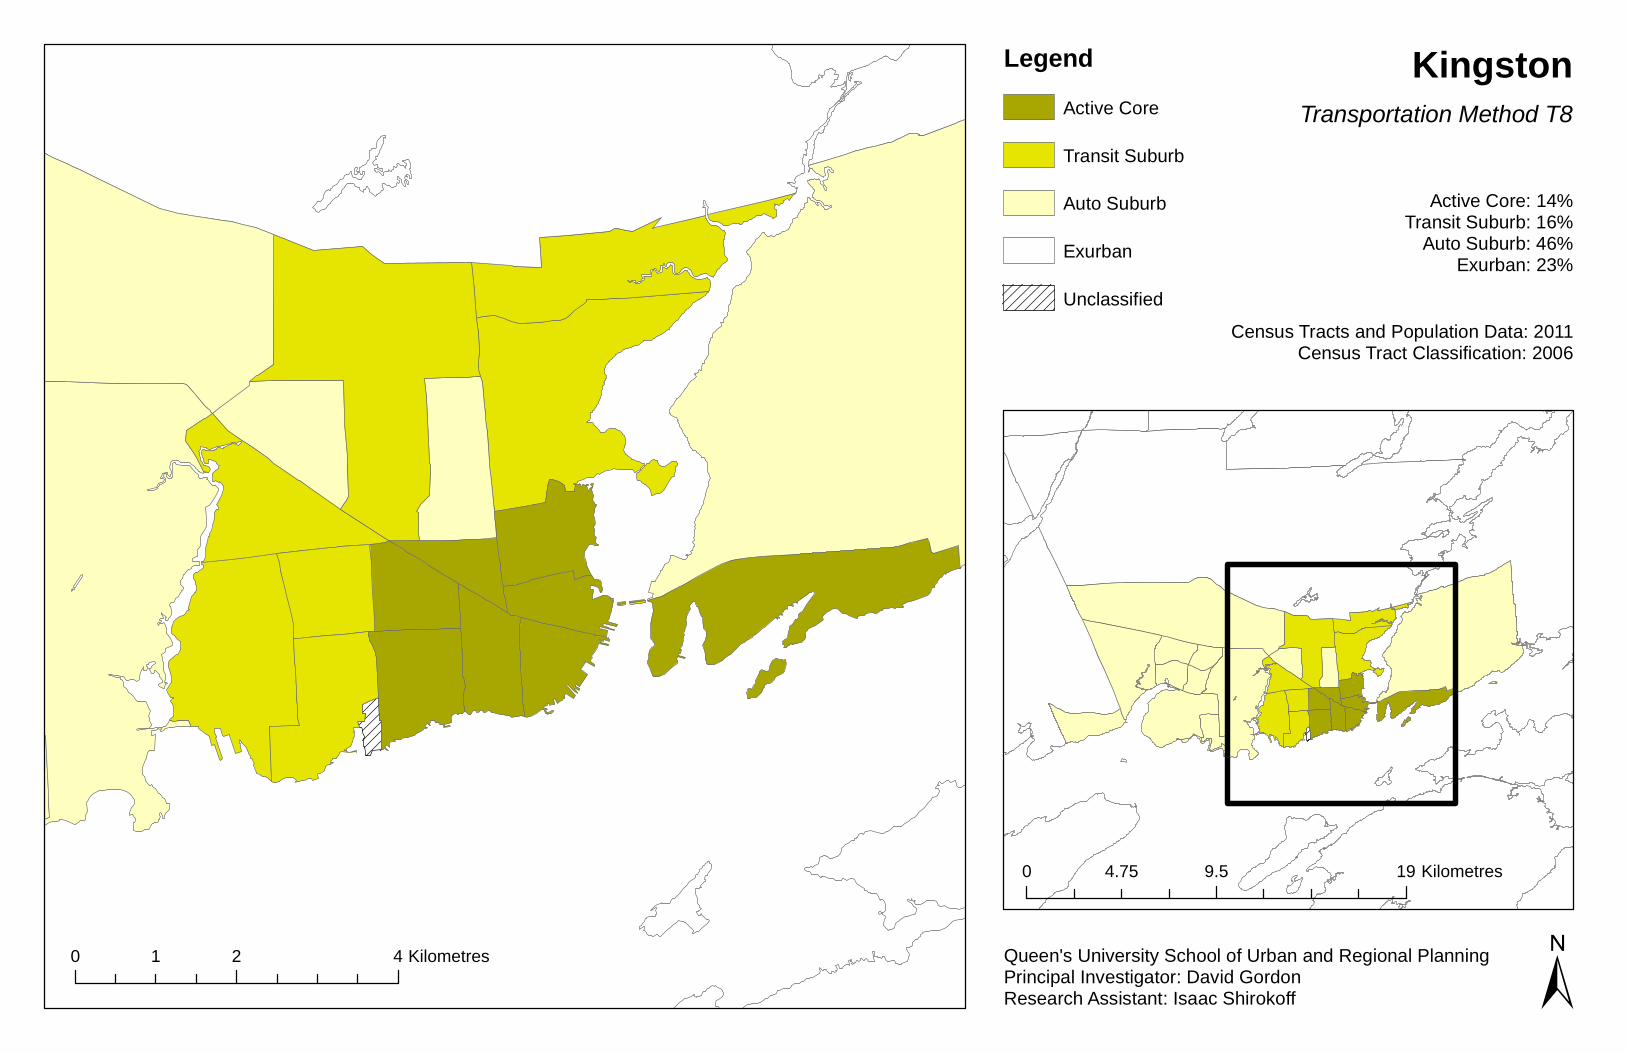
0 2 41 Kilometres
0 9.5 194.75 Kilometres
±
KingstonTransportation Method T8
Active Core: 14%Transit Suburb: 16%
Auto Suburb: 46%Exurban: 23%
Census Tracts and Population Data: 2011Census Tract Classification: 2006
LegendActive Core
Auto Suburb
Exurban
Transit Suburb
Unclassified
Queen's University School of Urban and Regional PlanningPrincipal Investigator: David GordonResearch Assistant: Isaac Shirokoff
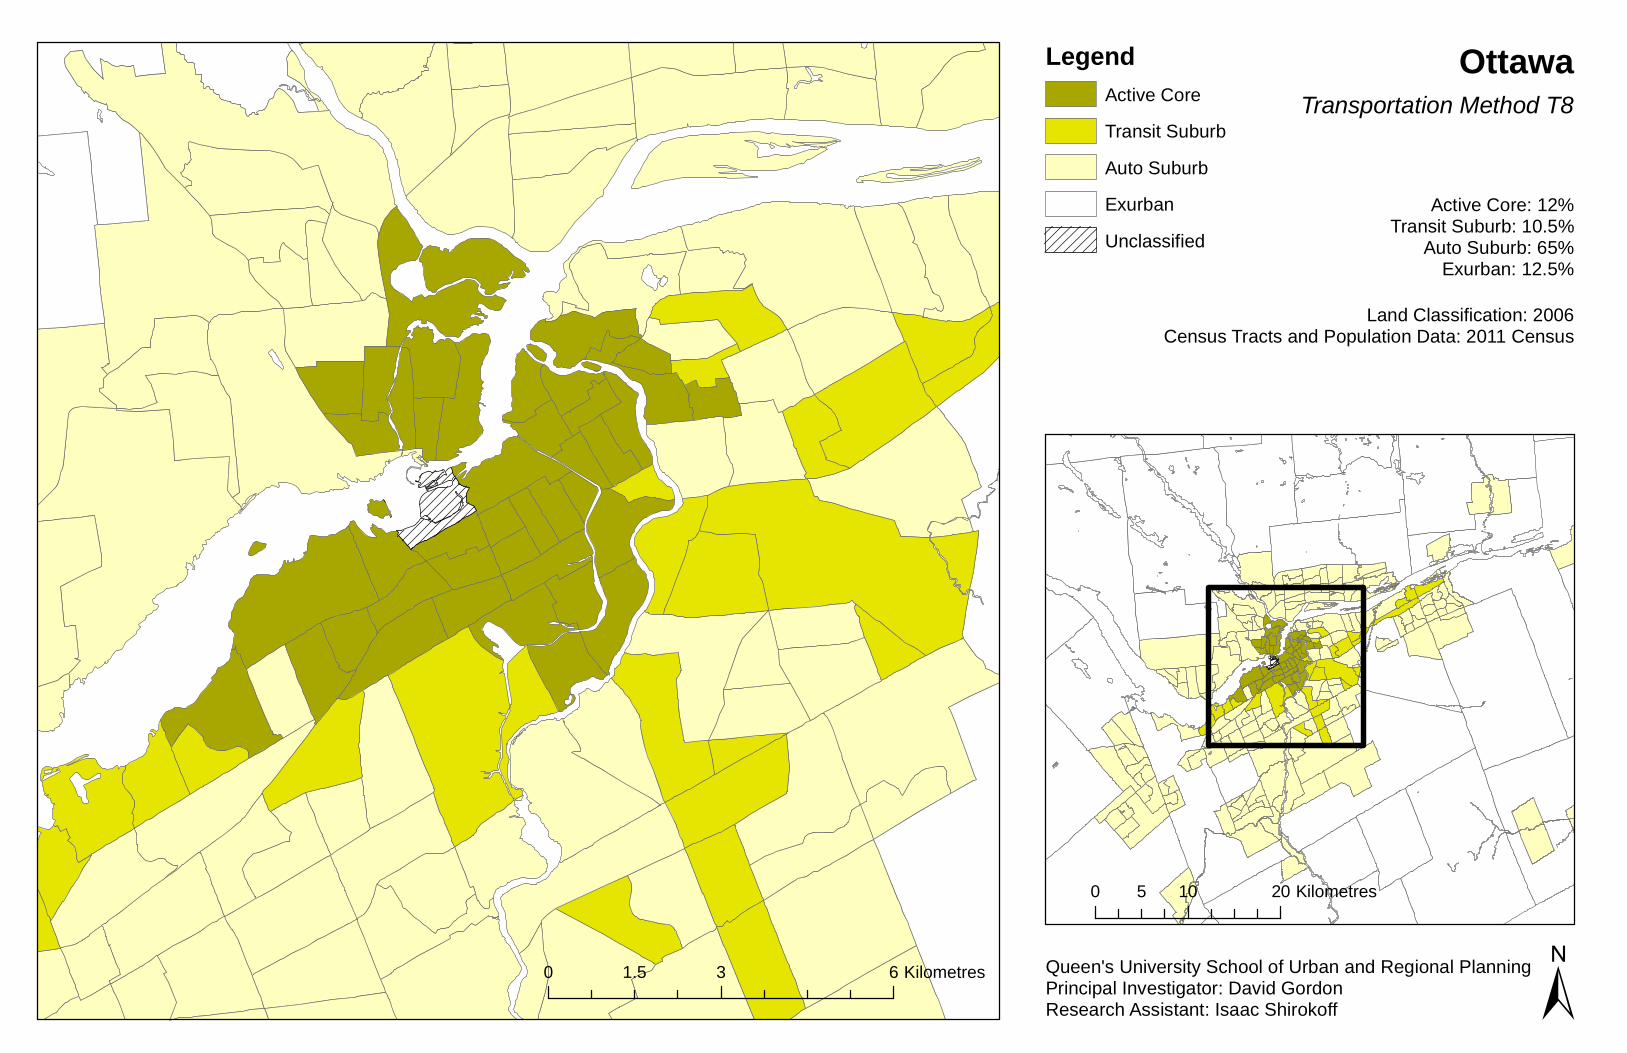
OttawaTransportation Method T8
Active Core: 12%Transit Suburb: 10.5%
Auto Suburb: 65%Exurban: 12.5%
Land Classification: 2006Census Tracts and Population Data: 2011 Census
0 3 61.5 Kilometres
0 10 205 Kilometres
±Queen's University School of Urban and Regional PlanningPrincipal Investigator: David GordonResearch Assistant: Isaac Shirokoff
LegendActive Core
Auto SuburbExurban
Transit Suburb
Unclassified
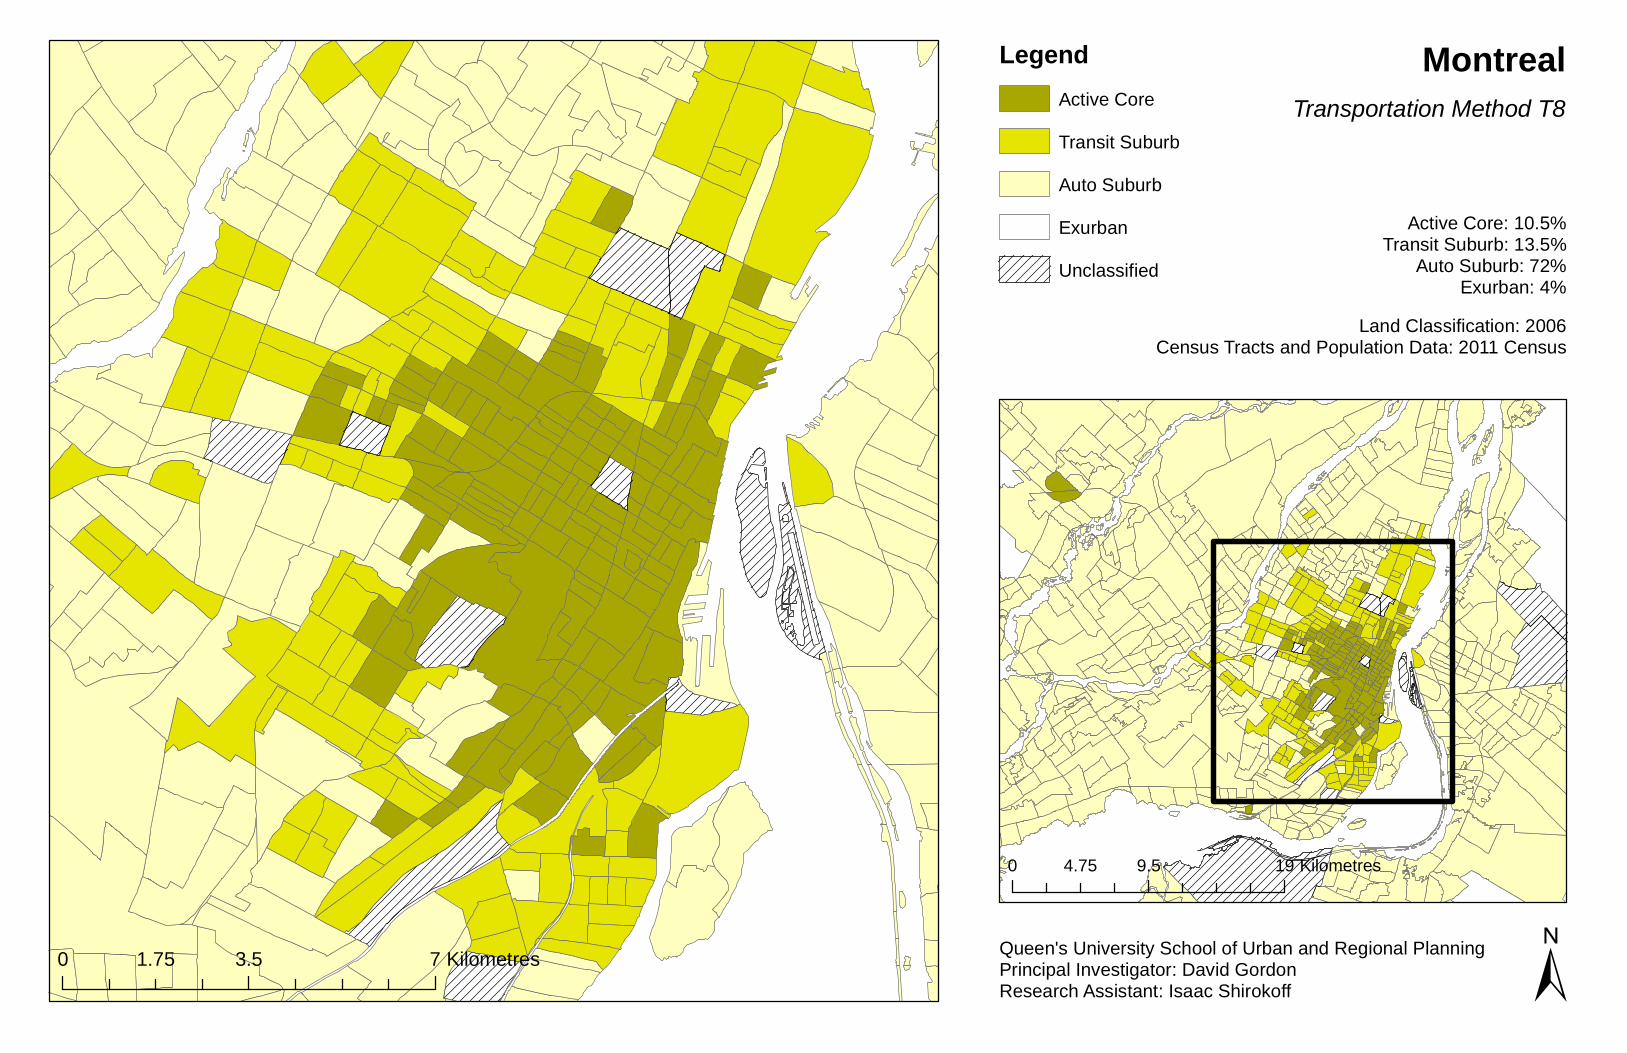
LegendActive Core
Auto SuburbExurban
Transit Suburb
Unclassified
0 3.5 71.75 Kilometres
0 9.5 194.75 Kilometres
±
MontrealTransportation Method T8
Active Core: 10.5%Transit Suburb: 13.5%
Auto Suburb: 72%Exurban: 4%
Land Classification: 2006Census Tracts and Population Data: 2011 Census
Queen's University School of Urban and Regional PlanningPrincipal Investigator: David GordonResearch Assistant: Isaac Shirokoff
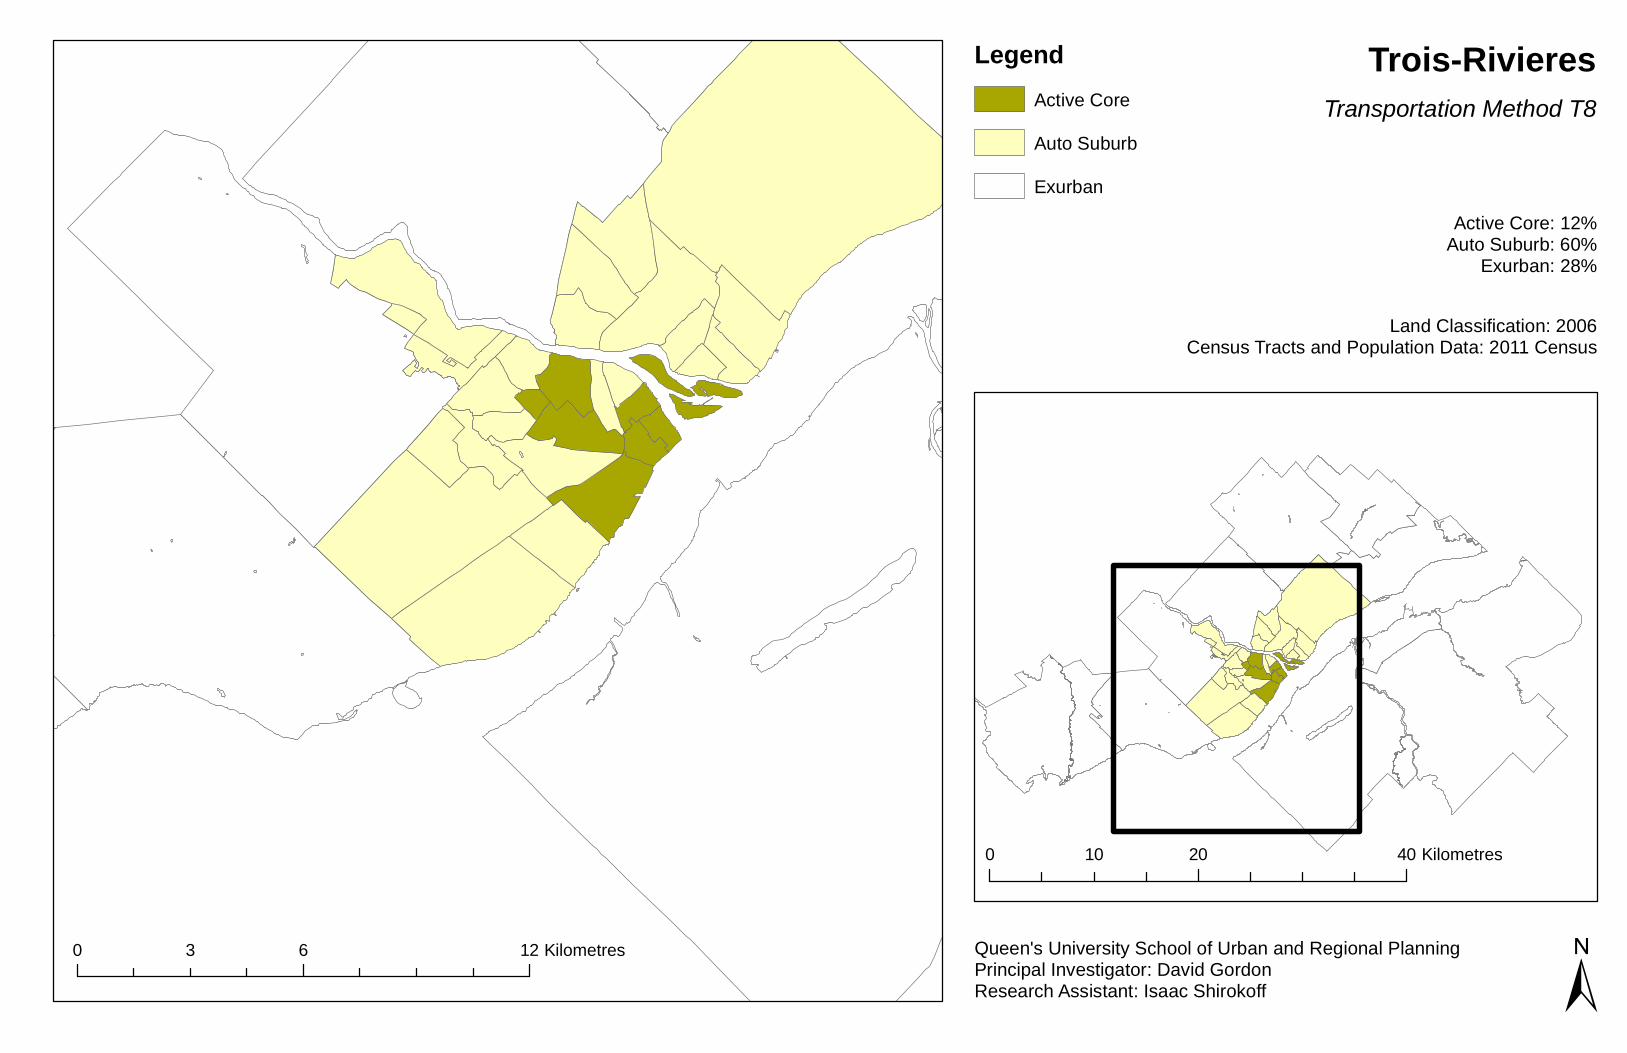
Trois-RivieresTransportation Method T8
Active Core: 12%Auto Suburb: 60%
Exurban: 28%
Land Classification: 2006Census Tracts and Population Data: 2011 Census
Queen's University School of Urban and Regional PlanningPrincipal Investigator: David GordonResearch Assistant: Isaac Shirokoff ±
LegendActive CoreAuto SuburbExurban
0 6 123 Kilometres
0 20 4010 Kilometres
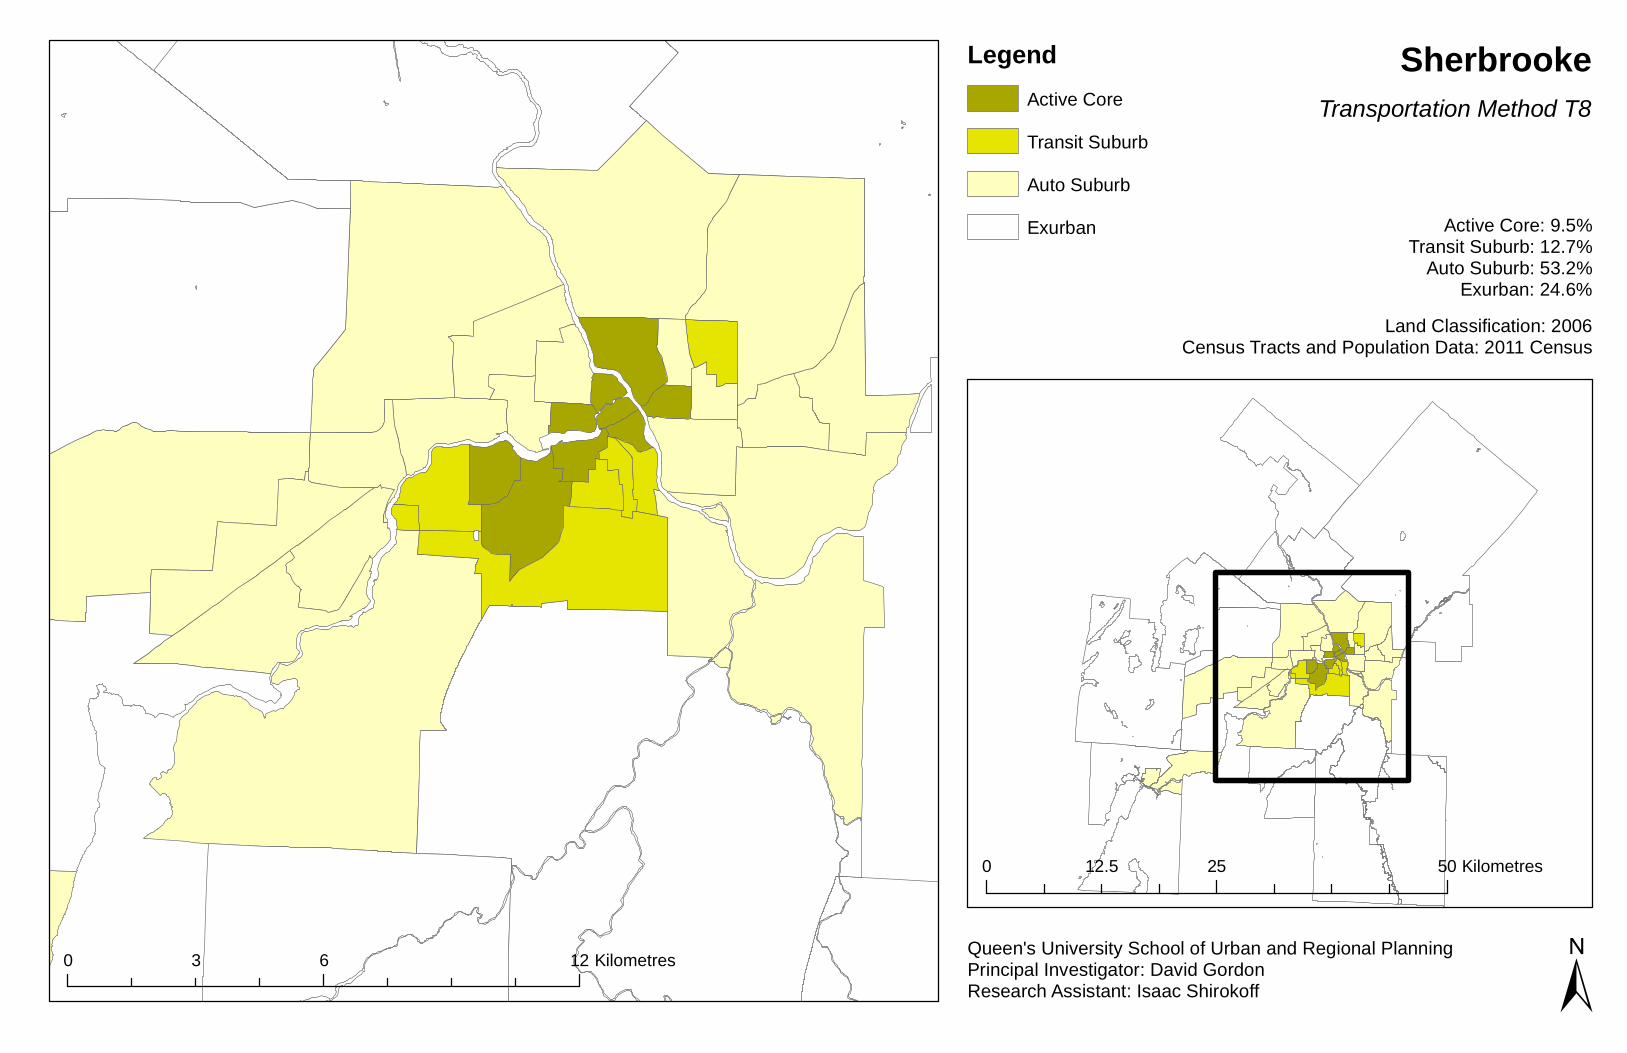
SherbrookeTransportation Method T8
Active Core: 9.5%Transit Suburb: 12.7%
Auto Suburb: 53.2%Exurban: 24.6%
Land Classification: 2006Census Tracts and Population Data: 2011 Census
Queen's University School of Urban and Regional PlanningPrincipal Investigator: David GordonResearch Assistant: Isaac Shirokoff
LegendActive Core
Auto SuburbExurban
Transit Suburb
±
0 25 5012.5 Kilometres
0 6 123 Kilometres
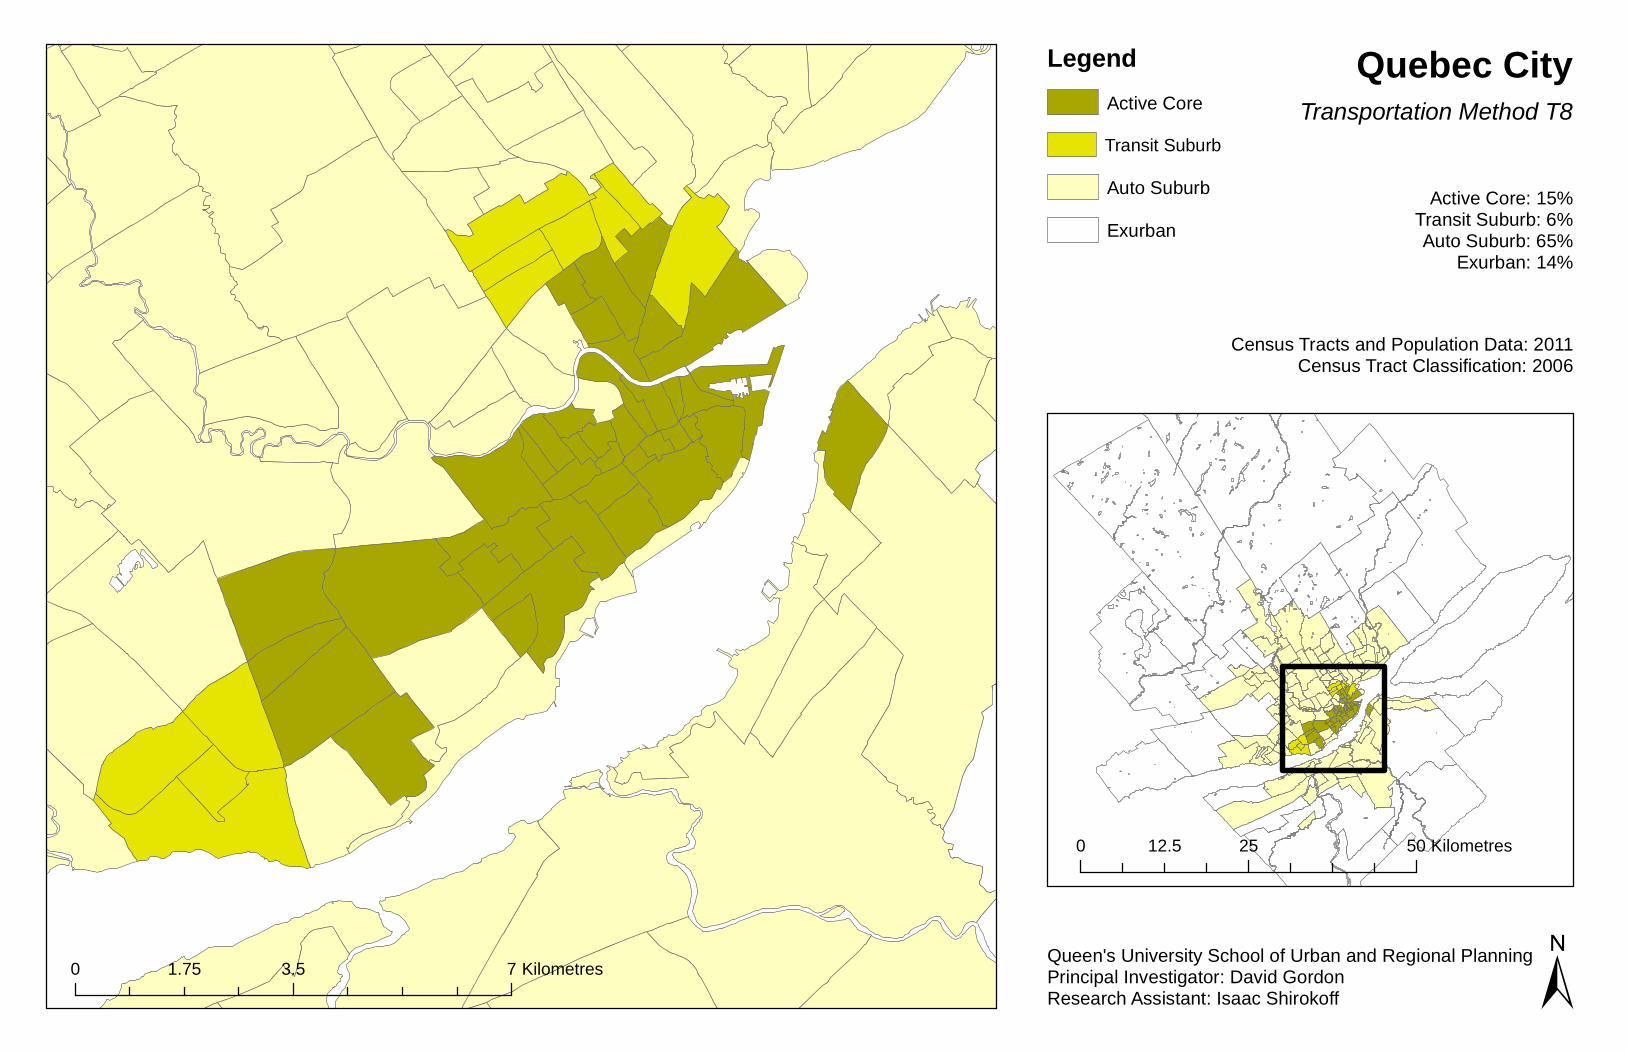
0 3.5 71.75 Kilometres
0 25 5012.5 Kilometres
±
Quebec CityTransportation Method T8
Active Core: 15%Transit Suburb: 6%Auto Suburb: 65%
Exurban: 14%
Census Tracts and Population Data: 2011Census Tract Classification: 2006
LegendActive Core
Auto SuburbExurban
Transit Suburb
Queen's University School of Urban and Regional PlanningPrincipal Investigator: David GordonResearch Assistant: Isaac Shirokoff
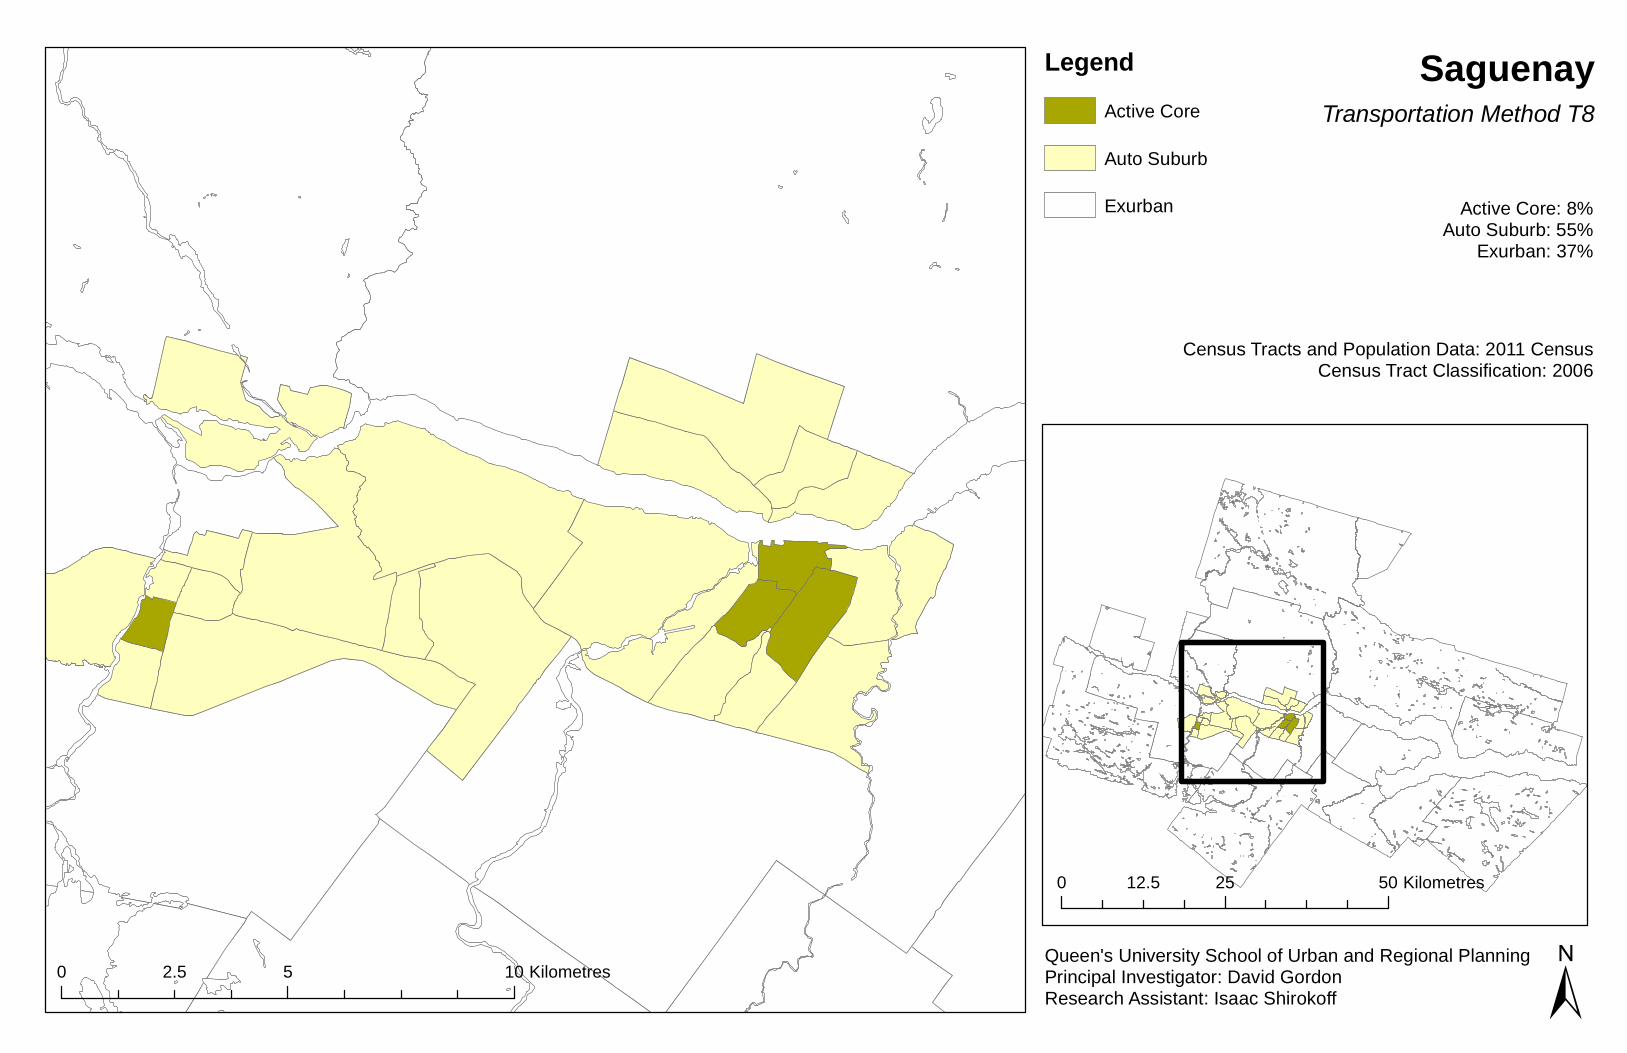
SaguenayTransportation Method T8
Active Core: 8%Auto Suburb: 55%
Exurban: 37%
Census Tracts and Population Data: 2011 CensusCensus Tract Classification: 2006
Queen's University School of Urban and Regional PlanningPrincipal Investigator: David GordonResearch Assistant: Isaac Shirokoff ±
LegendActive Core
Auto Suburb
Exurban
0 5 102.5 Kilometres
0 25 5012.5 Kilometres
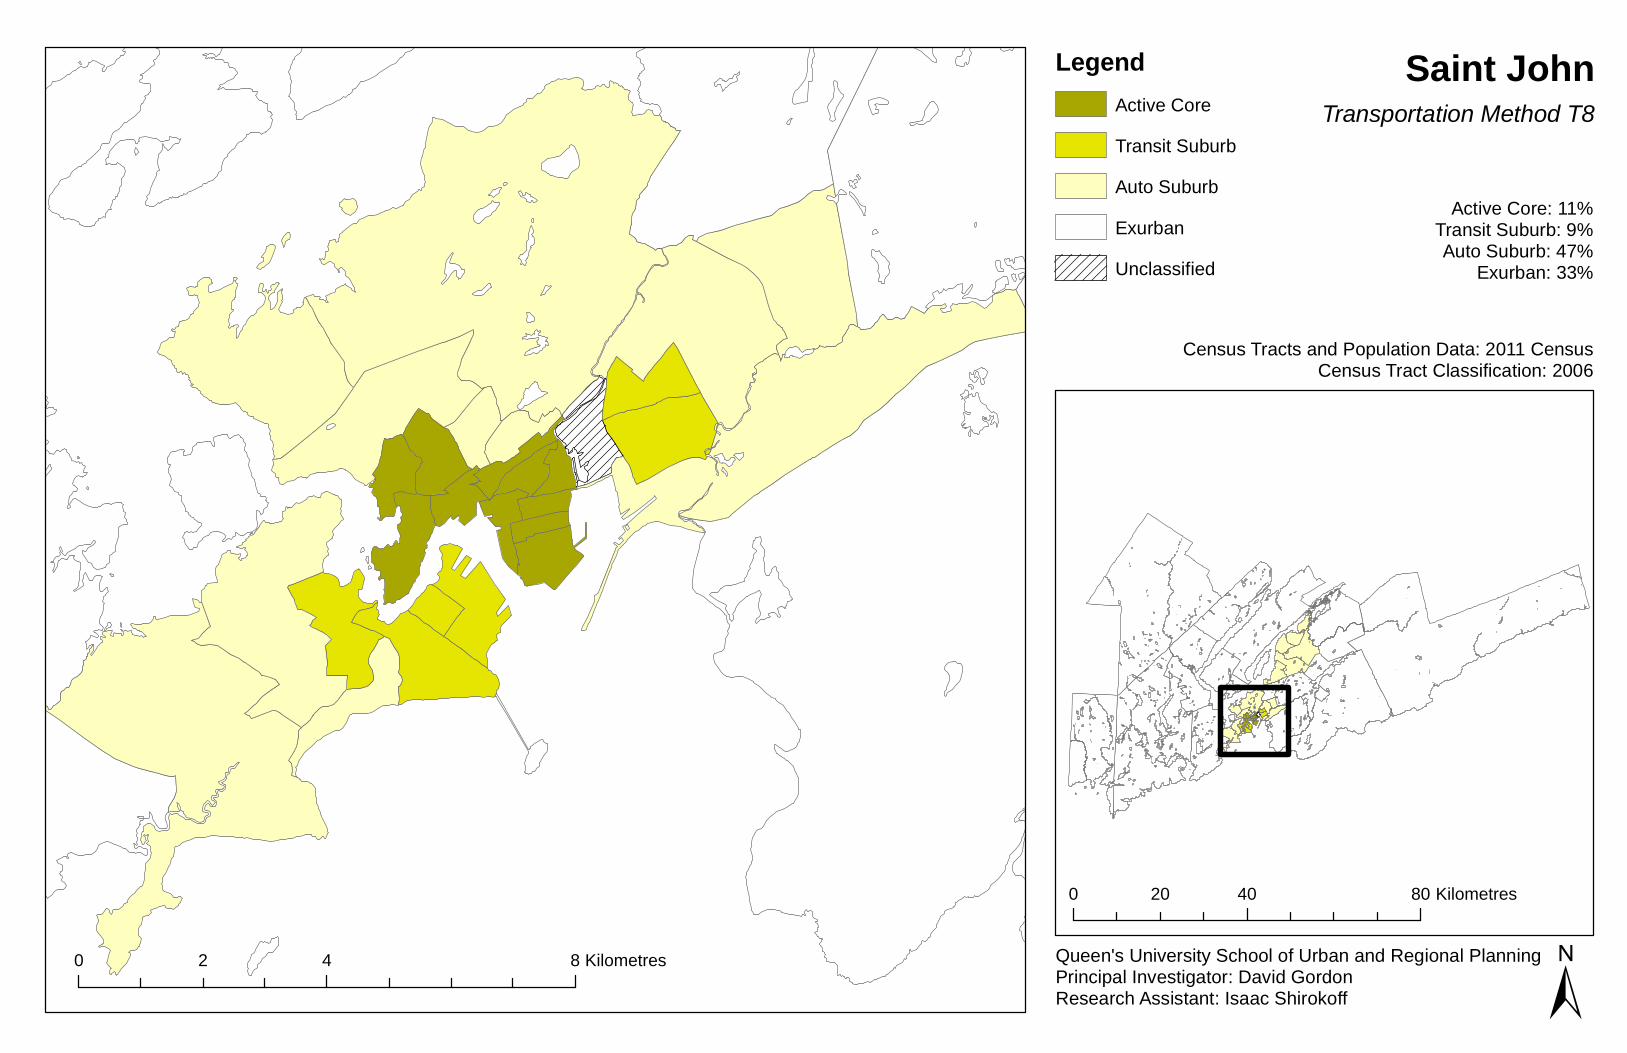
Saint JohnTransportation Method T8
Active Core: 11%Transit Suburb: 9%Auto Suburb: 47%
Exurban: 33%
Census Tracts and Population Data: 2011 CensusCensus Tract Classification: 2006
Queen's University School of Urban and Regional PlanningPrincipal Investigator: David GordonResearch Assistant: Isaac Shirokoff ±
0 40 8020 Kilometres
0 4 82 Kilometres
LegendActive Core
Auto SuburbExurban
Transit Suburb
Unclassified
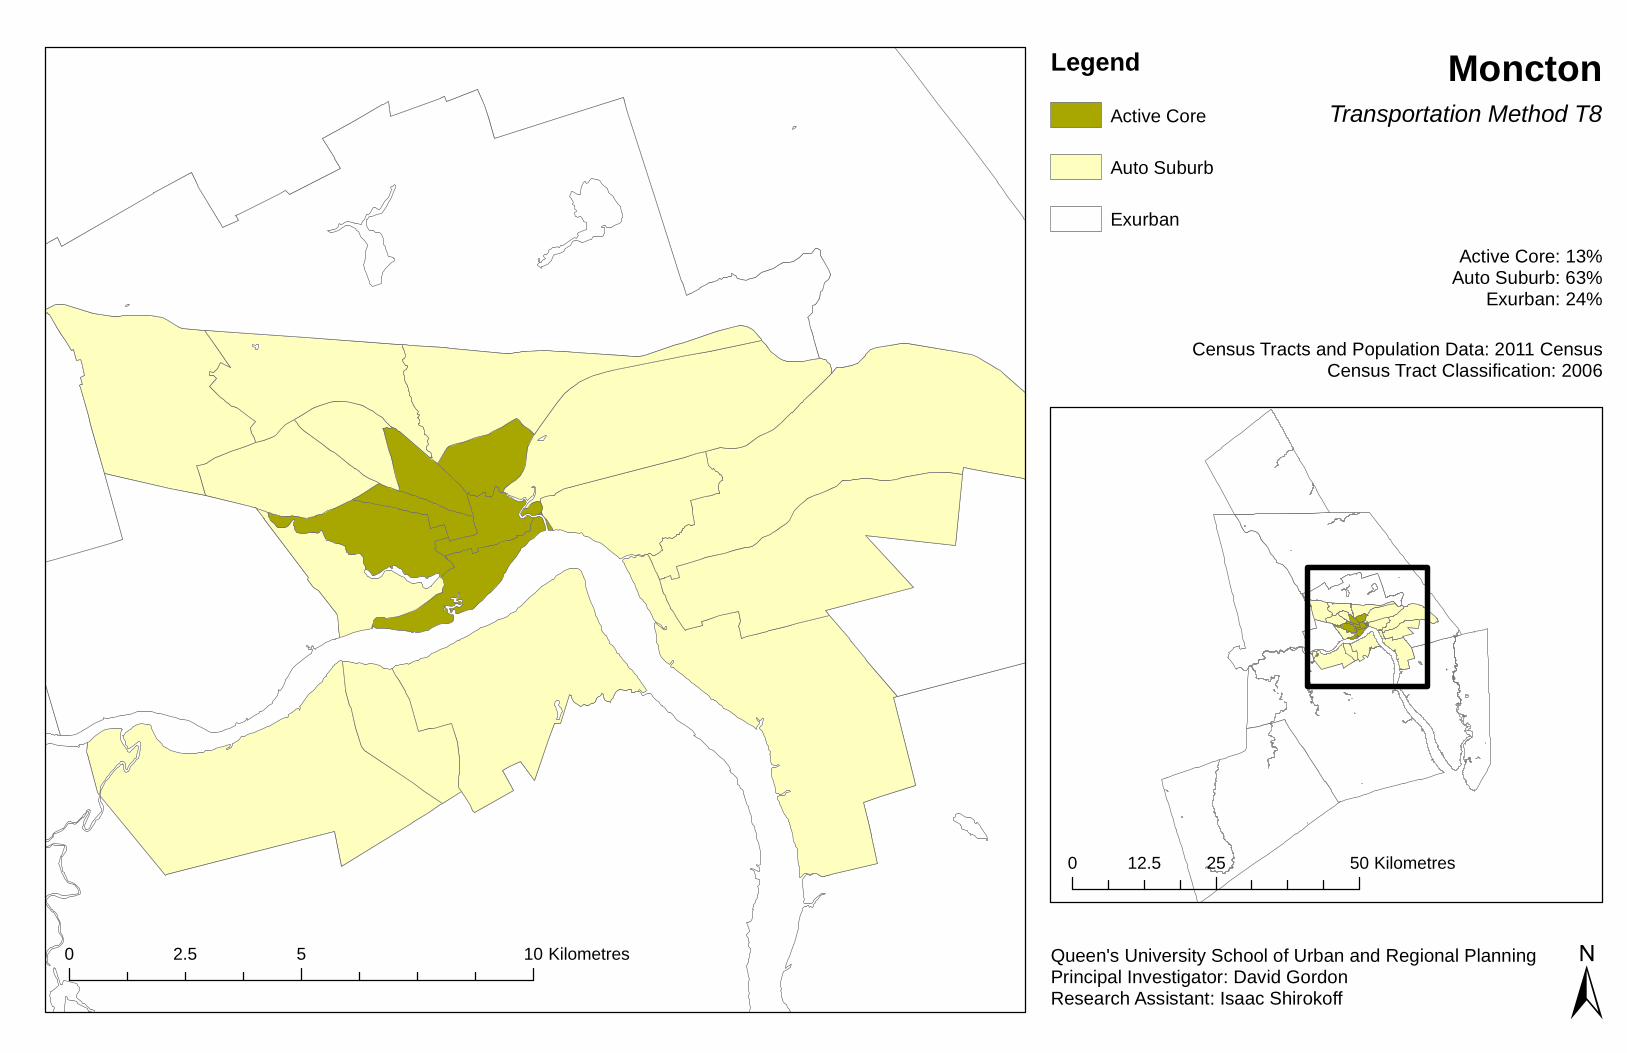
0 5 102.5 Kilometres
MonctonTransportation Method T8
Active Core: 13%Auto Suburb: 63%
Exurban: 24%
Census Tracts and Population Data: 2011 CensusCensus Tract Classification: 2006
Queen's University School of Urban and Regional PlanningPrincipal Investigator: David GordonResearch Assistant: Isaac Shirokoff ±
LegendActive Core
Auto Suburb
Exurban
0 25 5012.5 Kilometres
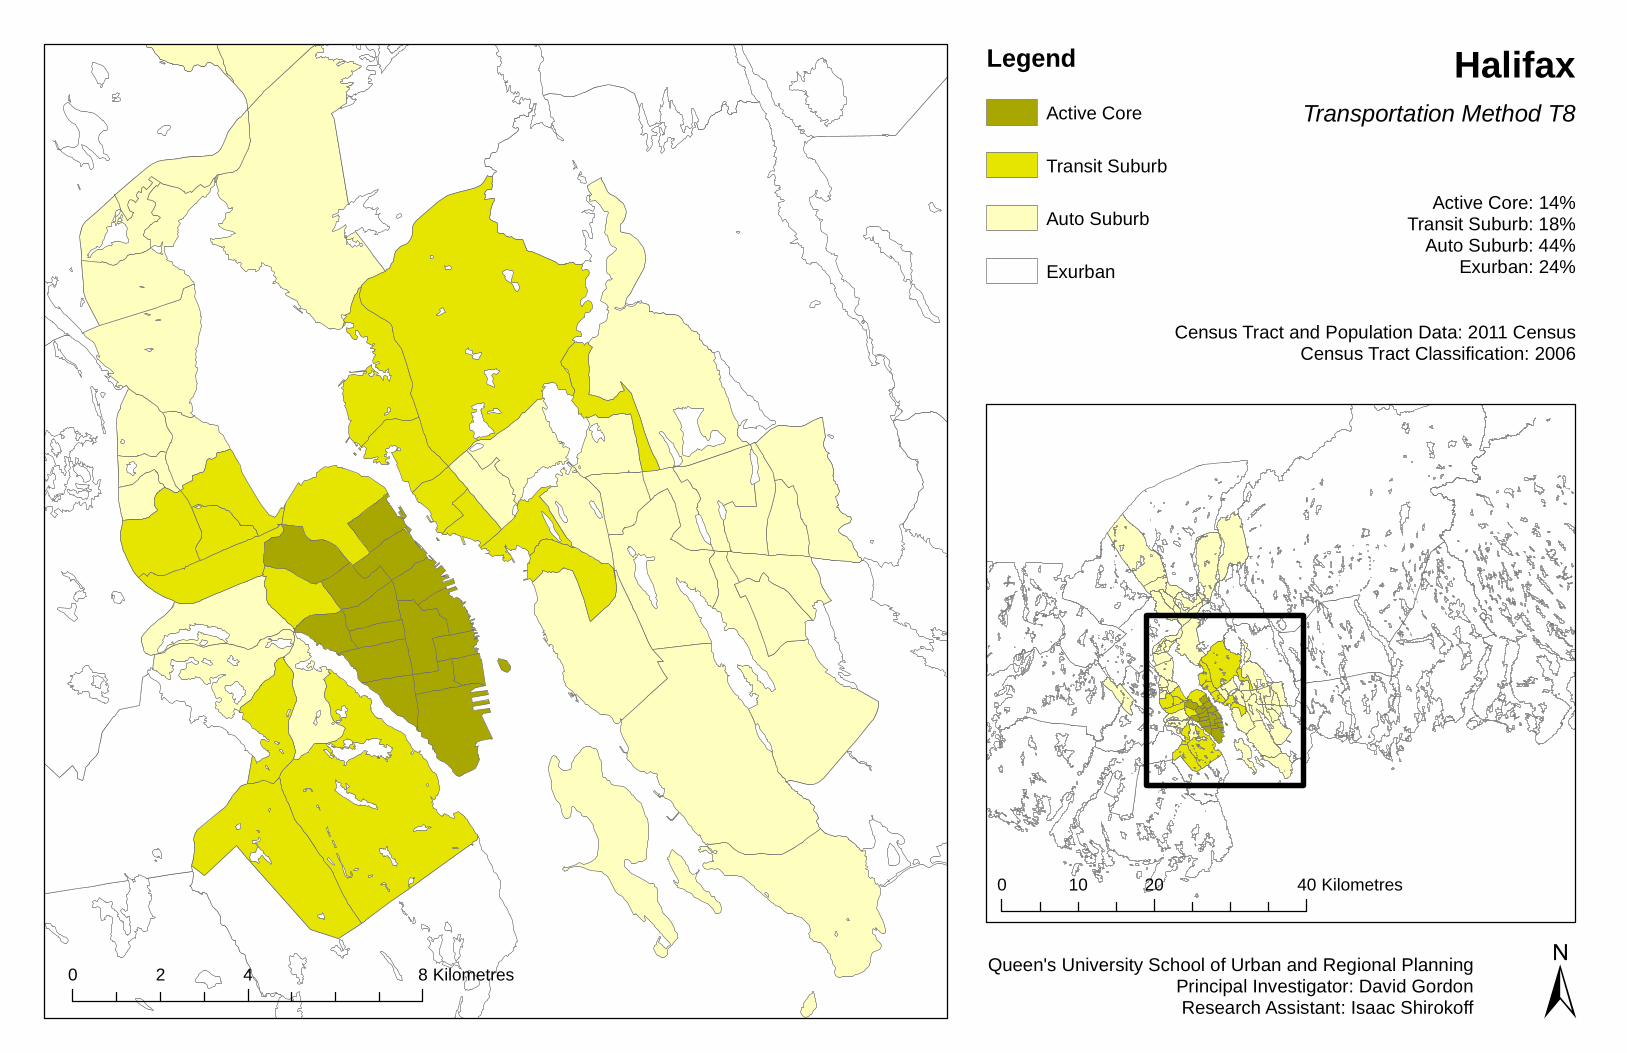
HalifaxTransportation Method T8
Active Core: 14%Transit Suburb: 18%
Auto Suburb: 44%Exurban: 24%
Census Tract and Population Data: 2011 CensusCensus Tract Classification: 2006
Queen's University School of Urban and Regional PlanningPrincipal Investigator: David GordonResearch Assistant: Isaac Shirokoff
LegendActive Core
Auto Suburb
Exurban
Transit Suburb
±0 4 82 Kilometres
0 20 4010 Kilometres
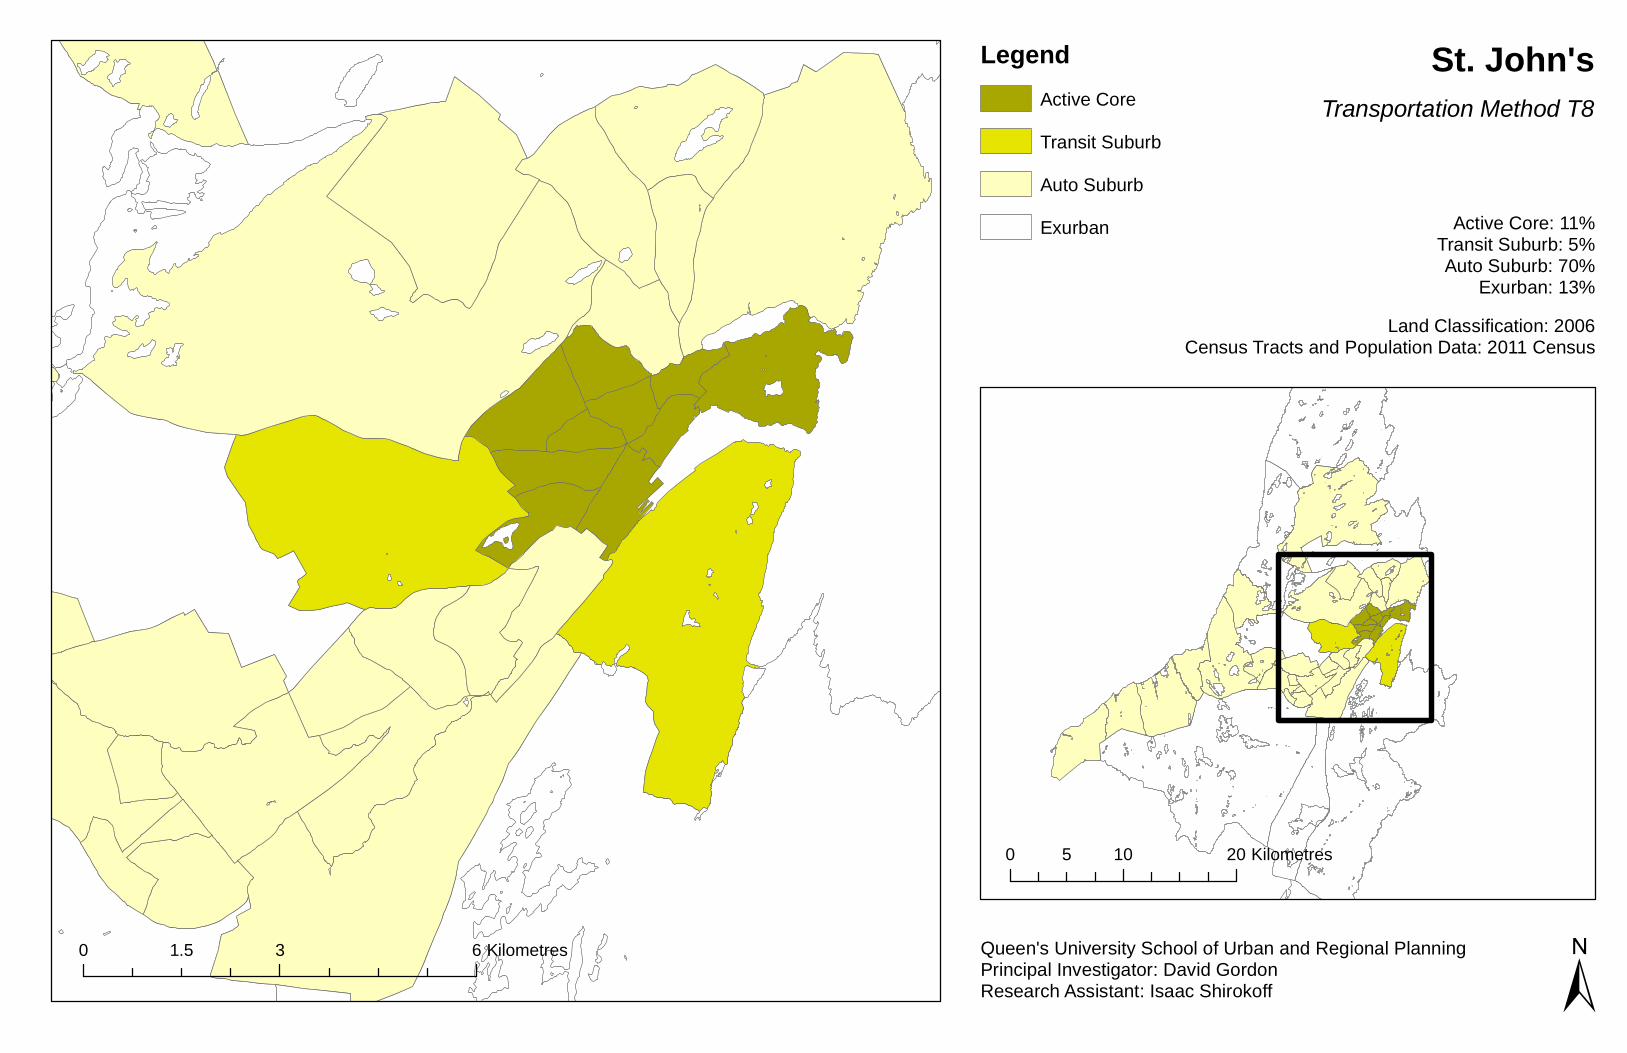
St. John'sTransportation Method T8
Active Core: 11%Transit Suburb: 5%Auto Suburb: 70%
Exurban: 13%Land Classification: 2006
Census Tracts and Population Data: 2011 Census
Queen's University School of Urban and Regional PlanningPrincipal Investigator: David GordonResearch Assistant: Isaac Shirokoff
LegendActive Core
Auto SuburbExurban
Transit Suburb
±0 3 61.5 Kilometres
0 10 205 Kilometres