
Subsurface Interpretation Approach Gravity Metode In...
12
Hidartan, Ildrem, Eko .W, Suci. S/ICG 2015 193 Subsurface Interpretation Approach Gravity Metode In Hidrocarbon Exploration: Study Subsurface Geology East Java Basin Cepu-Bojonegoro Area for reference study in Jambi Basin at South Sumatera. Hidartan 1,2 , Ildrem.S. 1 , Eko.W 2 , Suci.S 2 . 1 Padjadjaran University, Dipati Ukur Street Bandung Indonesia,Phone: +62 811160573, 2 Trisakti University , Kiyai Tapa Street Jakarta 11440 Indonesia Email: [email protected] Abstract Survey of subsurface geology at Bojonegoro area has been done with gravity method. This study will contributes to obtain a picture of the possibility of a new hydrocarbon exploration targets in the central part of East Java. This study show that Bouguer anomalies can be divided into two groups, the first anomaly between 26 to 30 mGal as high anomaly at South- Central area. The second anomaly, is between 26 to 20.5mGal as lows anomaly at Central-Northern part. Analysis was done by spectral analysis, stage filtering to separate the residual anomaly and regional anomalies from the Complete Bouguer Anomaly . Two-dimensional modeling of the “Bojonegoro” area has a trend of the structural configuration from North - South shows the normal fault relative trending northeast - southwest, which is formed as a result of extensional forces during the Tertiary to Early Oligocene. Residual anomalies ,at eastern of Kasiman area shows the contour pattern of protruding to the south the possibility of hydrocarbon trap. The picture that illustrated in the 2-D subsurface model, showing bedrock in the study area is relatively shallow, so that the target of exploration for the Kujung or Ngimbang Formation is still possible. Integrated of the geological data, seismic models , suggesting that appears on the Kujung Formation assumed or suspected to be carbonate build-up results from the major transgressive at Oligo – Miocene and Ngimbang Formation as anticline. Keywords: Bouguer anomaly, residual anomaly, 2-D Subsurface model, Carbonat Build up, hydrocarbon trap. Preface The Central East Java Basin has been proven to be a hydrocarbon basin-rich area, since the late 19 th century began the production of petroleum at the oil fields around Cepu area (Kawengan, Ledok, Nglobo, etc.), as well as regions around Surabaya (Lidah, Kruka, etc.). The discoveries of new oil fields are still ongoing, as the discovery of new fields in the end of 1990 and early 2000; Mudi (Petrochina), Sukowati, Banyuurip, and Jambaran (Exxon), Kedungtuban and Randublatung (Pertamina). The exploration targets in Central East Java Basin including Ngimbang Formation, Kujung Formation and Tuban Formation. Considering the distribution of the oil fields, it can be inferred that the whole area of the Central East Java Basin, including the central part of the Island of Java, between the Central Java and East Java is the area of petroleum province( Fig 1.). It is also supported by the fact that a number of seismic acquisition has been conducted in almost this entire area in order to enhance the hydrocarbon exploration activity. Nonetheless, the eastern part of Cepu with an approximately 50 km square width which covered by the carbonate sediments. This can cause difficulties in conventional seismic method, either in the operational section or the interpretation. Despite of the difficulties, considering this area is a potential area for hydrocarbon prospect, it is necessary to attempt an alternative geophysical method in order to get the subsurface information i.e. gravity method. The area of Central East Java Basin is a hydrocarbon prospective area. In the Oligo- Miocene, the central part of East Java was an open marine, and the carbonates of which become nowadays exploration target grow at the high. There are several recognizable highs
Transcript of Subsurface Interpretation Approach Gravity Metode In...
Hidartan, Ildrem, Eko .W, Suci. S/ICG 2015
193
Subsurface Interpretation Approach Gravity Metode InHidrocarbon Exploration:
Study Subsurface Geology East Java Basin Cepu-Bojonegoro Area for referencestudy in Jambi Basin at South Sumatera.
Hidartan1,2
, Ildrem.S.1, Eko.W
2, Suci.S
2.1
Padjadjaran University, Dipati Ukur Street Bandung Indonesia,Phone: +62 811160573,2
Trisakti University , Kiyai Tapa Street Jakarta 11440 IndonesiaEmail: [email protected]
AbstractSurvey of subsurface geology at Bojonegoro area has been done with gravity method. This study willcontributes to obtain a picture of the possibility of a new hydrocarbon exploration targets in thecentral part of East Java.This study show that Bouguer anomalies can be divided into two groups, the first anomaly between 26to 30 mGal as high anomaly at South- Central area. The second anomaly, is between 26 to 20.5mGalas lows anomaly at Central-Northern part. Analysis was done by spectral analysis, stage filtering toseparate the residual anomaly and regional anomalies from the Complete Bouguer Anomaly .Two-dimensional modeling of the “Bojonegoro” area has a trend of the structural configurationfrom North - South shows the normal fault relative trending northeast - southwest, which is formed asa result of extensional forces during the Tertiary to Early Oligocene.Residual anomalies ,at eastern of Kasiman area shows the contour pattern of protruding to the souththe possibility of hydrocarbon trap. The picture that illustrated in the 2-D subsurface model, showingbedrock in the study area is relatively shallow, so that the target of exploration for the Kujung orNgimbang Formation is still possible.Integrated of the geological data, seismic models , suggesting that appears on the Kujung Formationassumed or suspected to be carbonate build-up results from the major transgressive at Oligo –Miocene and Ngimbang Formation as anticline.Keywords: Bouguer anomaly, residual anomaly, 2-D Subsurface model, Carbonat Build up,hydrocarbon trap.
PrefaceThe Central East Java Basin has been provento be a hydrocarbon basin-rich area, since thelate 19th century began the production ofpetroleum at the oil fields around Cepu area(Kawengan, Ledok, Nglobo, etc.), as well asregions around Surabaya (Lidah, Kruka, etc.).The discoveries of new oil fields are stillongoing, as the discovery of new fields in theend of 1990 and early 2000; Mudi(Petrochina), Sukowati, Banyuurip, andJambaran (Exxon), Kedungtuban andRandublatung (Pertamina). The explorationtargets in Central East Java Basin includingNgimbang Formation, Kujung Formation andTuban Formation.Considering the distribution of the oil fields, itcan be inferred that the whole area of theCentral East Java Basin, including the centralpart of the Island of Java, between the CentralJava and East Java is the area of petroleum
province( Fig 1.). It is also supported by thefact that a number of seismic acquisition hasbeen conducted in almost this entire area inorder to enhance the hydrocarbon explorationactivity. Nonetheless, the eastern part of Cepuwith an approximately 50 km square widthwhich covered by the carbonate sediments.This can cause difficulties in conventionalseismic method, either in the operationalsection or the interpretation. Despite of thedifficulties, considering this area is a potentialarea for hydrocarbon prospect, it is necessaryto attempt an alternative geophysical methodin order to get the subsurface information i.e.gravity method.The area of Central East Java Basin is ahydrocarbon prospective area. In the Oligo-Miocene, the central part of East Java was anopen marine, and the carbonates of whichbecome nowadays exploration target grow atthe high. There are several recognizable highs

Hidartan, Ildrem, Eko .W, Suci. S/ICG 2015
194
i.e. West Cepu High, East Cepu High, andKemandung Ridges. The Carbonate Reef inthe Kedung Tuban Field, Banyuurip Field,Mudi Field, Sukowati Field, andKembangbaru Field which located at the EastCepu high area the examples of thathydrocarbon generally occurred at the highs(Satyana, 2005).Again, considering this is a hydrocarbonprospective area, it is necessary to conduct astudy of subsurface geology in order tounderstand the subsurface structuralcharacteristic and its relationship with thepresence of hydrocarbon trap. The informationabout subsurface configuration is anadvantageous data in order to determine thepresence of hydrocarbon trap, which oftenexhibited by the presence of high structure inthe subsurface.
II.GeologyPhysiographically the studied area is includedinto the Rembang Zone at the central part,which is predominantly composed ofcarbonates, and into the Randublatung in thesouthern part which is mostly covered by thealluvial sediments.Elongated ridges occupy the northern part ofthe area which characterized by the appearanceof rough morphology, whereas in the southernpart which occupied by the lowlandmorphology, a number of swampy and wetarea can be found(Fig.2). (Bemmelen, 1949).According to the map (Fig.3), the stratigraphicunit order found in the studied area inascending order (oldest – youngest) are asfollows: the oldest rock unit is the KujungFormation (Oligo-Miocene in age) whichconsist of four member i.e. Marl member(Tomkm), Prupuh limestone member (Tomp),Claystone member (Tomkc), and the Siltstonemember (Tomks). The Kujung Formationconformably overlain by Early-MiddleMiocene Tuban Formation (Tmtl), which isconsist of siltstone with intercalated sandymarly limestone. The Mundu Formation andthe Paciran Formation unconformablyoverlies the Tuban Formation, with the age ofPliocene. Mundu Formation (Tpm) consist ofsandy marl and chalky limestone, whereas thePaciran Formationconsist of limestone which composed by anumber of fragments, such as algae, corals,large forams and molluscs, dolomiticlimestone and dolostone.
On the top of this formation lies conformablythe Pleistocene of Lidah Formation (Qtl) andKabuh Formation (Qpk) . The youngeststratigraphic unit is the alluvium which consistof pebbles, gravels, sand, silt, and mud whichform in the fluvial and swamp environment(figure 4).East Java Basin, including those in the landpart there is microcontinent (East Javamicrocontinent) of which dynamicsconsiderably affects the formation of East JavaBasin configuration. There are two differenttrend of basin configuration in the East JavaBasin, i.e. Luk Ulo – Meratus trendingconfiguration (SW-NE) and West – Easttrending configuration which is a pull apartbasin, where the Eocene Ngimbang Formationwas found in the EJ-1 well, and now becomethe exploration target in the East Java Basin.The West – East trending structures are themicrocontinent basement structure whichreactivated into transform fault along theSakala Fault (Sribudiyani, et al., 2003). TheSakala Fault Zone develops to the Westthrough the Kangean, Madura, as far asRembang area (RMKS fault zone) this faultzone form at the age of Upper Early Miocene-Middle Miocene, marked by the presence offlower structure, indicating a very stronginversion deformation (Satyana, A. H., 2004).
III.Methodology Study
The contribution of the earth crust massdensity in the surface only as much as 0,3% ofthe earth gravitational field and the massdensity as below as 5 km or in the placeswhere geological phenomenon contributeabout 0,5% of the earth gravitational field.This small amount of contribution holds animportant role because the variation of thegravitational field can be mapped. Thevariation of the gravitational field is basicallya variation of mass density, then by knowingthe variation of mass density in the subsurfaceas measured by the gravity method, thesubsurface setting can be interpreted (Grant &West, 1965). (figure 5).
The principle of the gravity method is toobtain the anomaly value which caused by thedifference of mass density of the objects thatcausing the anomaly. The calculation ofcomplete Bouguer Anomaly (gB) done byusing the equation (Telford et al, 1990)

Hidartan, Ildrem, Eko .W, Suci. S/ICG 2015
195
gB = gobs - gn + dgFA - dgB + dgT…………………………………….(1)
where gB is the Bouguer gravity anomaly,gobs is measurement result after tidal and driftcorrection, gn is the normal force at themeasuring point, dgFA is the free aircorrection, 0,3086 mGal/meter, dgB is TheBouguer correction and dgT is the terraincorrection.
Residual anomaly map derived from theseparation of Bouguer Anomaly and RegionalAnomaly by using Moving Average, while 2Dsubsurface modeling is done by using Grav 2D software.
Using quantitative and qualitative analysis ofgravity data and assumes that a hydrocarbontrap occurred somewhere in the highs, then thepossibility of the trap position can be expectedbased on its lithological orientation. Fieldstudies conducted are the measurement ofgravity and rock sampling. Laboratory analysisis done in order to determine the the massdensity of the rock which represent the rock inthe gravity measurement point. The gravitydata processing includes: Workstation studyactivity includes data processing, theconstruction of Bouguer anomaly map,residual anomaly map, and study of 2Dsubsurface model approach.
IV. Field Work and Data Processing
1. Mass Density
To determine the mass density of the rockfrom the study area the Nettleton method isapllied, by minimize the correlation betweentopography and gravity anomaly.
2. Gravity Anomaly
The data used to construct the BouguerAnomaly map is the complete Bougueranomaly. From the CBA map (Fig10) authorderives appearances as follows:
In this study, author conducted a spectralanalysis to ascertain the approximate depth ofthe Regional Anomaly and Residual Anomaly,and estimate the width of the window used for
data filtering process. Filtering process is doneby using Moving Average method, whichseparate the regional anomaly and the residualanomaly, where the residual anomaly isderived from Bouguer anomaly minus regionalanomaly.
The next step, author conducted a modelingprocess based on the geological information ordata (lithological distribution andstratigraphy). From the Nettleton profile themass density value obtained around 2,5gr/cm3.
Wavenumbers (k) and gravity anomalyamplitude (ln A) relationship chart:
3. Anomalies Depth Estimation andFilter Window
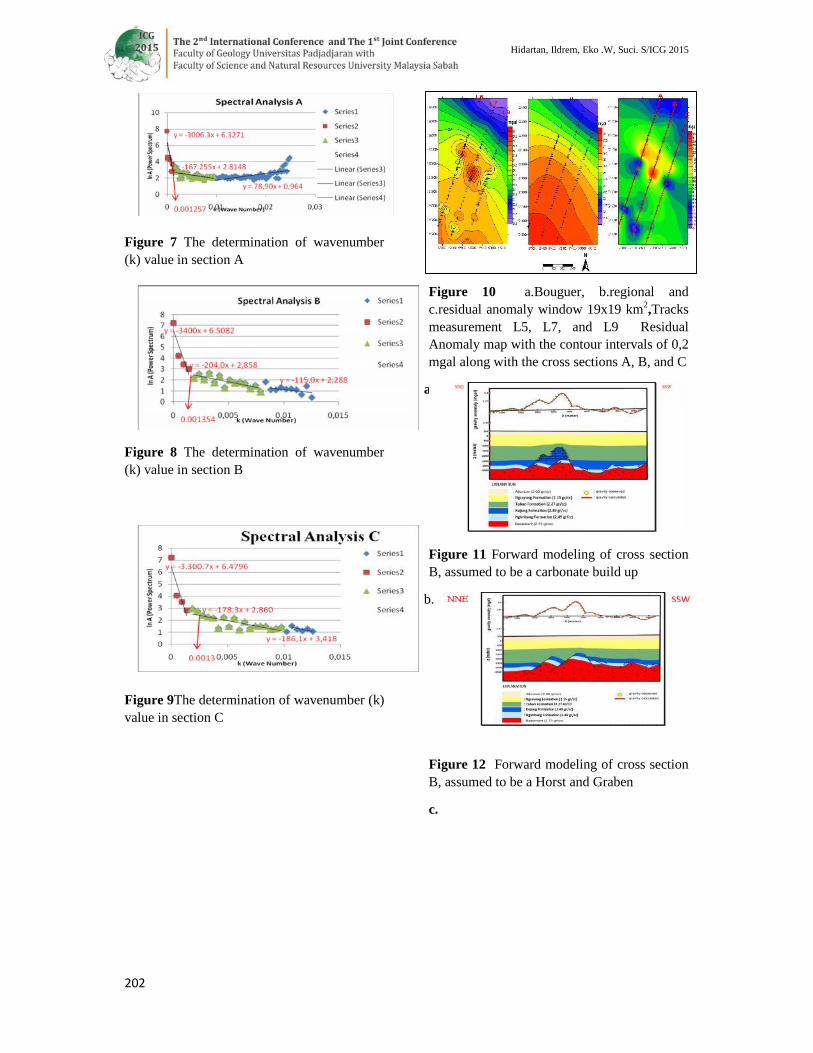
By calculating the average of window from theanomaly separation above resulting filterwindow as much as 19 or 19 x 19 km2 with thegrid spacing 250 (Figure 7,8,9), (Table 1).Filter window 19 will be used to separate theregional and residual anomaly which later usedin 2D modeling
The result of spectral analysis used toestimated the depth of the anomaly and thefilter window calculation:
Table 1 The Result of Spectral Analysiscalculation
Hidartan, Ildrem, Eko .W, Suci. S/ICG 2015
196
V.Mapping and The Separation ofBouguer,Regional and ResidualAnomaly
High frequency wave anomaly can be removedusing the Moving Average method. ThisTechnique is basically done by averaging thegravity anomaly data (CBA) where the resultof this method is the value of regionalanomaly. The residual anomaly is calculatedby lessen the value of CBA with the regionalanomaly (Figure 10).
VI.Result / Discussion
Quantitative interpretation
The interpretation is done quantitatively, aimto recognize the geological model ofsubsurface which comprises dimension of themodel, the type of the composer lithologywhich made based on the physical parameterof rock density on the model. From thisquantitative interpretation, it is expected toobtained the subsurface geological structure.To perform such quantitative interpretation a2D Talwani forward modeling is conductedusing the Grav-2 DC software.
1. Bouguer, Regional and ResidualAnomaly Map
Based on the spectrum analysis result from thethree track line, it is shown that the averagedepth of the regional anomaly source in thestudy area located at the depth ofapproximately 3,2 km. Regional anomaly mapderived from the filtering process shown infigure 6.
Overall, the value of the Bouguer anomaly inthe regional anomaly map ranges between 21-28 mgal (purple – red color index) where itbecomes more deep to northeast.
Bouguer Anomaly is a total amount ofRegional Anomaly and Residual Anomaly, sothe residual anomaly value is derived by thesubstraction between Bouguer Anomaly valueand the Regional Anomaly.
Lower anomaly occupied the northernpart of the study area map, with an open
contour pattern and higher anomalyoccupied the southern part with a small,closed contour pattern (short wavelength)in the center part, and slightly spread inthe southern part.
In the center part of the map, with theanticlinal pattern and yellow-red colorindex (1-3,2 mgal) indicates that the areais a high which expectedly containedcarbonate buildup structure. Therefore itis necessary to perform a 2D Talwanimodeling.
From the South-Southwest towardsNorth-Northeast is towards the deeperarea with dominant green color index (-0,2 to – 0,8 mgal) up to blue color index(-0,8 to -1 mgal)
VII.Forward Modeling
2-Dimension modeling in gravity, one of itsdirection is defined as infinite. The modelingmethod that used is forward modeling, wherethe model is determined along with its densityvalue, which then its gravity field is calculatedusing the Grav2-DC software.
Gravity value from the calculation result(calculated gravity) is compared with the onederived from the field measurement. Themodeling is done by varying the parameter(trial and error), such as its density, its depth,and the shape of the structure to obtain thesimilarity of gravity observed and gravitycalculated value in the profile. This wayshows that the result of field measurementsgravity is used as a comparator in interpretingthe subsurface structure geometry. Thismethod allows the obtainment of similargravity responses. The result earned byinserting the geological interpretation inside.Forward modeling of residual anomaly with19x19 km2 filter used to model what isexpected to be a carbonate buildup. Themodeling process needs the information aboutgeological condition in that area and othersupporting data that is references from seismicdata, along with the interpretation (source:Pertamina, 2007). Density background that is

Hidartan, Ildrem, Eko .W, Suci. S/ICG 2015
197
applied in the construction of the model is asmuch 2.67 gr/cc, while the amount of densityis expected by comparing the lithology andlaboratory result with the density table fromTelford et al, 1976 (Table 2). The amount ofestimated density can be seen as follows:
Table 2. Rocks Mass Density(Telford et al.,1976), Lab Analysis
3 cross section are made (A, B, and C) fromthe residual map for the 2D subsurfacestructure modeling, by using the Grav 2-DCsoftware (figure 10). This 3 cross sections isselected based on the variation of densitycontrast fluctuation which is very prominent,perpendicular to the strike, and assumed to beat different types of lithology
The cross section B modeling is chosen andconsidered as the best model and can be usedto represent the subsurface structural andlithological condition in this study, because itscenter part exhibits the anticlinal pattern withyellow – red color index (1 – 3,2 mgal),indicates that the area constitutes a high area,which expected to be a carbonate buildupstructure. Another modeling process alsocarried on in this study which can be used asone means to validate that model by creating acomparison where there is another assumptionto be considered that the structure can beexpected as a carbonate build up, horst,magma intrusion, or shale diapir.
The Modeling of Subsurface Structure forStudied Area.
1 Section B Interpretation
Tabel 3 Section B Interpretation
a. Carbonate buildup assumptions1. This model is formed by the distribution of
density (using gravity method andgeological survey) which develops thesubsurface geological structures. The G-calculated value corresponds well with theG-observed value at 2,06 % of error point.(Figure 11).In this model, all gravity anomalies
happen because of the anomalous thingscontribution at ± 3400 m depth up until thesurface. The deepest bed that resides at depthof 3400 m is a Pre-Tertiary basement whichbecome the base of all sedimentary basins inJava, that later on, was filled by densitydistribution from Ngimbang Formation (2.30gr/cc) that is dominated by sandstone whichis relatively thin-distributed. On top of thatwas distributed a density value of 2.49 gr/ccor so called Kujung Formation which isdominated by limestone, where selectivelythickening to form an undulation structureswith a thickness of 1000-1250meters. Thisthickening of the Kujung Formation isassumed as carbonate buildup whichgeologically grew and distributed very well atbasement high. This thing happened becauseof the basement’s own configuration fromtectonics activities (basement which isdominated by both Late Cretaceousmetamorphic rocks {such as Slate andPhylite} and igneous rocks) and a relativelymajor transgressive environment at Oligo -Miocene. On top of that was distributed adensity value from Tuban Formation,Ngrayong Formation and a thinner andyounger Wonocolo Formation.

Hidartan, Ildrem, Eko .W, Suci. S/ICG 2015
198
2. Based on 2-D Seismic ModelInterpretation, it is seen that the pattern of theseismic data intensively varies; therefore aproper distinguishing technique between dataand its noises is vital. In this case suchproblem can surely be solved by well data topredict the response of the lithologies or thefluid contents. Below is a figure that shows a2-D seismic model from the PT. Pertaminafinal report, 2007.Based on that reference, it is concluded that
there is an undulation structure (red box area,Figure 16) which is indicating a carbonatebuildup.
From Figure 16, it can be seen that thestructures pattern in the studied area are thrustfaults, with a relatively reside at southwest –northeast and southeast – northwest. From theoldest to youngest formations are Kujung,Tuban, Ngrayong, Wonocolo and LedokFormation. In Kujung Formation there is anundulation structure as seen at
b. Horst assumptions1. Based on gravity method, the curves matching
method shows a model that holds a 2.38 %value of error, which is bigger than thecarbonate buildup. This result convinces thatthe horst assumption is not well-matched inapproaching the subsurface of geologicalconditions in section B.
2. Based on geological survey, there was tectonicactivities in the first phase (Tertiary – earlyOligocene) of the studied area, basement is atPre – Tertiary which shows accretion patternin northeast – southwest, that is clearly shownby the fault orientations in the basement andhorst or graben in control of the extensionalforce.
3. Based on Seismic model shows a negativevalue.c. Intrusion assumptions1. Based on gravity method, the intrusion
assumptions model can’t show a morerepresentative result in approaching thesubsurface geological condition, becauseof its error count which is 2,89 %, even
bigger than the previous assumptions..(figure 13)
2. Based on geological survey, the model thatshow an undulation structure as intrusionis not possible because there are no suchintrusions in the regional geology ofstudied studied area.
d. Shale diapir assumptions1. Based on gravity value , the model from
this assumptions has an error value of 3,14% which is the highest of all previousassumptions.(figure 14)
Cross section A and C interpretation model
Based on the cross section A and C modelingit appears that there is a an undulation / moundstructure which relatively similar to the one incross section B, where the structure is assumedto be a carbonate buildup. Formasi KujungFormation was precipitated on the highs(basement highs). This is because there arebasement configuration effects as aconsequence of tectonic activity (the basementis dominated by Late Cretaceous Metamorphicrock, such as slate, and phyllite, and alsoigneous rocks) and the sea level setting wastend to be transgressive relatively in that time.
This cross section modeling (A and C) isshown to emphasize assumption about thepresence of carbonate buildup. KujungFormation in the study area Kasiman whichhas been shown in the cross section Bmodeling ( Figure 17, 18)
Cross Section A, B, and C Model andInterpretation
Gravity model interpretation in the form oflithological distribution, the structure thatformed in the study area Kasiman which is themanifestation of the quantitative interpretationwhich is done by constructing the 2D model,in this case the cross section A, B, and C.
Modeling result of the cross section A, B, andC exhibits a similarity, that is the presence ofmounded structure which appears in theKujung Formation assumed as carbonatebuildup which occupied the depth of ± 2.5 kmwith the density value of ± 2.49 gr/cc and is

Hidartan, Ildrem, Eko .W, Suci. S/ICG 2015
199
the result of major transgressive during Oligo-Miocene, and distribute very well at the higharea (basement high)
By the presence of carbonate buildup it isstated that at the North East Java Offshore,especially at the west Madura working area thehydrocarbon found in the carbonate reefs(carbonate buildup) of Kujung Formation, thisreefs are relatively small, but intenselyproductive and contain hydrocarbon almostentirely. At the same reef complex at theregion of Cepu (including the study areaKasiman), a huge amount of hydrocarbon hasbeen found. This evidence reinforce theassumption of the presence of the KujungFormation carbonate reef (carbonate buildup)in the study area yang distributes from the NW– SE at the center part of the map.Meanwhile, the Pre-Tertiary basementshowing NE-SW trending accretional pattern,which is shown by the orientation of the faultsin the basement, horst or thrust faults andgraben or step fault. This evidence match withthe order of regional structure of the NorthEast Java Basin at the first tectonic phasewhich occurred during the Early Tertiary untilEarly Oligocene when the organic-richNgimbang Formation and Kujung Formationprecipitated on the basement (syn rift – postrift) with the dominant force that occurred isextensional force. The diapir itself is anintrusion caused by the difference of pressureand buoyancy (gases that trapped inside theshale). The term diapir is used more often atthe sedimentary rock, although in someoccasion used in igneous rock. It is calledshale diapir if the material that intrude is shale.During the intrusion process, the intrusion willcause the formation of folds (anticline) ordome at the top. This Diapir gives affect to theformation of a number of reservoir trap at itstop or its side. Because of its massive natureand it incapability to pass through fluids, itacts as the seal. The diapir formation can becaused by the tectonic process or rapiddeposition, or both
CONCLUSION
Based on the discussion above, there areseveral conclusion as follows;
1. Low anomaly Complete Bouguer Analysismap distributed in the northern part of thestudy with an open contour pattern and thehigh anomaly distributed along thesouthern part with a small, closed contourpattern (short wave length), in the centerpart and slightly spread in the southernpart. Gravity anomaly in the cross sectionA, B, and C indicates a sloping anomalyfrom the south towards the north, with ananticlinal pattern in the center part.
2. Spectral Analysis results in the depth ofthe anomaly zone and the wavenumbers(k) which derived by Fourier-transforming the gravity anomaly usingthe Numeri software which generates 19filter with spacing of 250 m. This 19 filterwindow is used to split the regional andresidual anomaly Based on the filteringresult it is known that the regionalanomaly located at the depth of ± 3.2 kmand residual anomaly located at the depthof ± 183 m
3. Residual anomaly map in the center partwith the anticlinal pattern and (1 mgal –32 mgal) indicates the area as a high area.
4. Normal fault structure with NE-SWrelative trending which formed as theresult of extensional force during theTertiary until the Late Oligocene, is thepathway of hydrocarbon migration fromthe Ngimbang Formation below.
5. Integration of geological data, seismicmodel assumes that the mound that appearin the Kujung Formation was a carbonatebuildup (Kujung Reef) as a result of majortransgressive during the Oligo-Miocene, atthe depth ± 2.5 km, which is a goodreservoir.
References
Blakely, R.J, 1996, Potential Theory inGravity and Magnetic Application,Cambridge University Press,Cambridge.
Hall, R., 2005, Cenozoic Tectonics ofIndonesia Problem and Models, ShortCourse Indonesian PetroleumAssociation.
Reynolds, J.M., 1997, An Introduction toApplied and Environmental

Hidartan, Ildrem, Eko .W, Suci. S/ICG 2015
200
Geophysics, John Wiley & Sons.,England.
Robinson, E, and Cruch C., 1988, BasicExplorationGeophysic, John Wileyand Sons Inc., Canada
Satyana, A.H., Erwanto, E., and Prasetyadi, C.,2004. Rembang-Madura-Kangean-Sakala (RMKS) Fault Zone, East JavaBasin : The Origin and Nature of aGeologic Border, Proc. IAGI, 33rd.Ann. Conv. And Exh., Bandung.
Satyana, A.H., 2005, Oligocene Carbonates ofJava, Indonesia : Tectonic – Volcanicsetting and petroleum implications.Indonesian Petroleum Association andExhibition, Jakarta.
Telford, M.W., Geldart, L.P. Sheriff, R.E. andKeys, D.A., 1976, AppliedGeophysics, Cambridge Univ. Press,Cambridge.
Van Bemmelen, R.W., 1949, The Geology ofIndonesia, Vol. 1A, Govt. Print. Off.Martinus Nijhoff, The Hague.
Widianto, E., 2008, Penentuan KonfigurasiStruktur Batuan Dasar dan JenisCekungan Dengan Data Gayaberat SertaImplikasinya Pada Target EksplorasiMinyak dan Gas Bumi di Pulau Jawa.Disertasi ITB Bandung.
Yudantoro, R.P., 2005, Review G&G terhadapFormasi Ngimbang, Sembulankarbonat Kujung-Tuban dan batupasirNgrayong, Laporan task force DOH-JBT daerah rendahan Kening troughdan tinggian Cepu Cekungan JawaTimur, Pertamina Internal Report.

Hidartan, Ildrem, Eko .W, Suci. S/ICG 2015
201
Figure 1 The Location of Study Area and TheTectonic Zone of North East Java (VanBammelen, 1949).
Figure 2 The Physiography of Java andMadura (Bemmelen, V., 1949 modified bySatyana, A. H., 2005)
Figure 3 Geological Map of study area(Hartono dan Suharsono, 1997)
Figure 4.Stratigraphic coloumn of NortheastJava.( Pertamina 2005)
Figure 5 Regional gravity of studied area(Eko.W. 2005)
Figure 6 Flow Chart Gravity Analysis
STUDIED AREA
CBA(Complete BouguerAnomaly)
Gridding- Contouring
Spektral Analysis
ResidualAnomaly
Regional geology dataand, seismic data2-D(Forward
Modeling)
Interpretation
Spreding Anomaly
RegionalAnomaly
Hidartan, Ildrem, Eko .W, Suci. S/ICG 2015
202
Figure 7 The determination of wavenumber(k) value in section A
Figure 8 The determination of wavenumber(k) value in section B
Figure 9The determination of wavenumber (k)value in section C
Figure 10 a.Bouguer, b.regional andc.residual anomaly window 19x19 km2,Tracksmeasurement L5, L7, and L9 ResidualAnomaly map with the contour intervals of 0,2mgal along with the cross sections A, B, and C
a.
Figure 11 Forward modeling of cross sectionB, assumed to be a carbonate build up
b.
Figure 12 Forward modeling of cross sectionB, assumed to be a Horst and Graben
c.

Hidartan, Ildrem, Eko .W, Suci. S/ICG 2015
203
Figure 13 Forward modeling of cross sectionB, assumed to be an intrusion
d.
Figure 14 Forward modeling of cross sectionB, assumed to be a shale diapir
Note:
1. Early Miocene Carbonate buildups of theKujung and Tuban Formation
2. Middle Miocene to Pleistocene clasticreservoirs within late Miocene toPleistocene inversion anticlines
3. Eocene Lower Ngimbang Formationsandstone drape and pinchout ontobasement highs/horst bloks
4. Eocene to Early Oligocene NgimbangCarbonate buildups
Figure 15 Subsurface geological model fromEast Java exploration( Pertamina 1998).
Figure 16 Section B model interpretationbased on gravity and seismic data.
Figure 17 Forward modeling of cross sectionA
Figure 18 Forward modeling of cross sectionC
SR

Hidartan, Ildrem, Eko .W, Suci. S/ICG 2015
204
Figure 19 Cross Section A, B, and C ModelInterpretation