
Substitution between Online and Offline Advertising...
21
Substitution between Online and Offline Advertising: Evidence from the Carbonated Soft Drink Industry Xi He, Rigoberto A. Lopez, and Yizao Liu* University of Connecticut Selected paper presented at The Agricultural and Applied Economics Association Meetings July 26 – 28, 2015, San Francisco, California *The authors are, respectively, Ph.D. student, professor and assistant professor in the Department of Agricultural and Resource Economics at the University of Connecticut, Storrs, CT, 06269. Contact: [email protected]. Comments by Professor Christopher O’Donnell and funding from the Zwick Center for Food and Resource Policy are gratefully acknowledged.
Transcript of Substitution between Online and Offline Advertising...
Substitution between Online and Offline Advertising:
Evidence from the Carbonated Soft Drink Industry
Xi He, Rigoberto A. Lopez, and Yizao Liu*
University of Connecticut
Selected paper presented at
The Agricultural and Applied Economics Association Meetings
July 26 – 28, 2015, San Francisco, California
*The authors are, respectively, Ph.D. student, professor and assistant professor in the
Department of Agricultural and Resource Economics at the University of Connecticut,
Storrs, CT, 06269. Contact: [email protected]. Comments by Professor
Christopher O’Donnell and funding from the Zwick Center for Food and Resource Policy
are gratefully acknowledged.
Substitution between Online and Offline Advertising:
Evidence from the Carbonated Soft Drink Industry
Xi He, Rigoberto A. Lopez, and Yizao Liu
University of Connecticut
Abstract
As in previous studies on traditional media, previous work has assumed that online and
offline advertising are substitutes. However, empirical evidence for this premise is lacking.
This paper investigates the substitution between online advertising and offline
advertising as well as the impact of the introduction of new media technology on the cost
of advertising. Using a rich dataset of monthly observations for 52 carbonated soft drink
brands between 2005 and 2011, we estimate a translog cost function that considers the
mix of on/off line advertising and online advertising adoption at the brand level. As in
previous work, we find that TV and print media are close substitutes. Surprisingly,
however, we find that online advertising is a complement to rather than a substitute for
both TV and print media advertising. This might be explained by online advertising’s
targeting younger market segments and acting as a reinforcement of TV and print media
advertising exposure. Further results show that the adoption of online advertising has
lowered the cost of advertising for achieving a sales target but that its role as a
complement rather than a substitute is weakening.
Keywords: Online advertising; media substitution; translog cost function; CSDs
JEL classification: L13; M37; D12
1
1. Introduction
Ever since online advertising started in 1994, when the website magazine HotWired sold
a banner ad to AT&T and displayed the ad on its webpage (Kaye and Medoff, 2001), online
advertising revenue has increased both in absolute terms and as a fraction of all
advertising revenues. The fast rise of internet advertising has transformed the advertising
industry landscape, with both internet penetration and internet advertising revenues
continuing to climb, reaching a historical high of $12.4 billion in the third quarter of 2014
in the U.S. (Interactive Advertising Bureau, 2014), while traditional media (offline)
advertising, newspapers in particular, lost audience to online advertising.
The most notable difference between online advertising and offline advertising
(ONLA and OFFLA, respectively) is that online advertising has a more precise targeting
ability than traditional media (Evans, 2009; Bergemann and Bonatti, 2011; Athey,
Calvano and Gans, 2013), and that online advertising has a much lower cost per viewer
(Gentzkow, 2014). In spite of the lack of empirical studies focused on the potential
substitution between ONLA and OFFLA, the conventional wisdom is that they are
substitutes. Previous work either offers a descriptive perspective (Goldfarb, 2014;
Goldfarb and Tucker, 2011a; Goldfarb and Tucker, 2011b; Gentzkow, 2014)1 or has only
focused on traditional offline media platforms (Seldon, Jewell, and O’Brien, 2000; Frank,
2008; Giannakas, Karagiannis, and Tzouvelekas, 2012). To our knowledge, no empirical
studies have explicitly investigated cross-substitution possibilities between ONLA and
OFFLA. The absence of studies on substitution possibilities between them becomes
particularly apparent nowadays as firms aggressively increase their ONLA.
Determining the direction and quantifying the substitution or complementarity
between ONLA and OFFLA in the food industries is of interest for at least two reasons.
First, the effectiveness of any ban on TV advertising, as proposed by some to promote
1 The study by Goldfarb and Tucker (2011a) uses a lab experiment to elicit the effects of a ban on TV advertising by comparing those who have been exposed to those who have not been exposed to internet advertising. The paper by Gentzkow (2014) presents a simple theory and then descriptive evidence to support the theoretical claims at the national level aggregated over products and services.
2
healthier food and beverage choices, critically depends on how easily such a ban might be
offset by increasing advertising in other media (Frank, 2008; Seldon, Jewell, and O’Brien,
2000). Second, from an industry perspective, the cost of advertising to achieve target sales
might be optimized by the right mix of ONLA and OFFLA platforms, so understanding
their inter-relationship is critical for managerial decisions.
The goal of this paper is to empirically examine the degree of substitution between
ONLA and OFFLA, using the carbonated soft drink (CSD) industry as a case study.
Specifically, the questions raised by conventional wisdom are: Are ONLA and traditional
OFFLA substitutes or complements? How price elastic is the demand for these media in
the carbonated soft drink industry? What is the extent of cost reduction brought about
by ONLA adoption? To answer these questions, we estimate an advertising translog cost
function with 2005-2011 data for 52 CSD brands purchased at U.S. supermarkets.
As in previous work, we find that TV and print media advertising are close
substitutes and that ONLA is a complement to OFFLA, although its complementary role
weakens over time. Further results confirm that ONLA has lowered the cost of advertising
for achieving a sales target and that there are economies of size in advertising in the CSD
industry.
2. Empirical model
Following Seldon, Jewell and O’Brien (2000), we assume separability between production
and advertising, and use a translog cost function to estimate media substitution. The cost
function is represented by a translog second-order approximation of the following form:2
𝑙𝑛𝐶𝑘𝑡 = 𝛼0 + 𝜙𝑞𝑙𝑛𝑄𝑘𝑡 + (1/2)𝜙𝑞𝑞(𝑙𝑛𝑄𝑘𝑡)2 + ∑ 𝛼𝑖𝑙𝑛𝑃𝑖𝑡𝑖 + (1/2) ∑ ∑ 𝛽𝑖𝑗𝑙𝑛𝑃𝑖𝑡𝑙𝑛𝑃𝑗𝑡 𝑗 +𝑖
∑ 𝛾𝑞𝑖𝑙𝑛𝑄𝑘𝑡𝑙𝑛𝑃𝑖𝑡 + 𝑏𝑡𝑙𝑛𝑇 + (1/2)𝑏𝑡𝑡(𝑙𝑛𝑇)2 + ∑ 𝑏𝑡𝑖𝑙𝑛𝑃𝑖𝑡𝑙𝑛𝑇𝑖 + 𝑏𝑞𝑡𝑙𝑛𝑄𝑘𝑡𝑙𝑛𝑇 + 𝑢𝑘𝑡 ,𝑖 (1)
where 𝑘 is the brand index; 𝑡 is the time index; 𝑖, 𝑗 𝑖𝑠 the media type; 𝐶𝑘𝑡 is the total
advertising cost for brand 𝑘 at time 𝑡; 𝑄𝑘𝑡 is the total quantity sales units of brand 𝑘
2 In fact, a cost function cannot be a translog function. A translog cost function can be used as an approximating function, but then the coefficients no longer need to satisfy the homogeneity constraints. In this study, however, the likelihood ratio test for homogeneity restrictions suggests homogeneity restrictions cannot be rejected. Therefore, we still add homogeneity restrictions in the estimation.
3
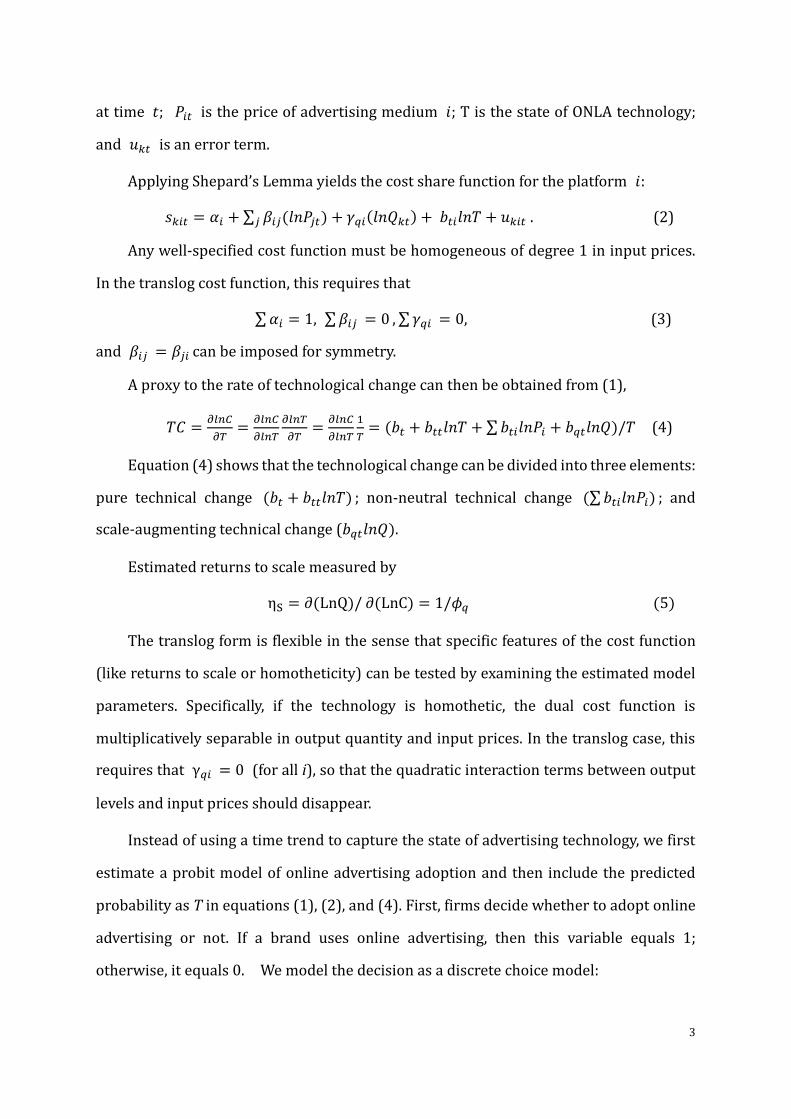
at time 𝑡; 𝑃𝑖𝑡 is the price of advertising medium 𝑖; T is the state of ONLA technology;
and 𝑢𝑘𝑡 is an error term.
Applying Shepard’s Lemma yields the cost share function for the platform 𝑖:
𝑠𝑘𝑖𝑡 = 𝛼𝑖 + ∑ 𝛽𝑖𝑗(𝑙𝑛𝑃𝑗𝑡)𝑗 + 𝛾𝑞𝑖(𝑙𝑛𝑄𝑘𝑡) + 𝑏𝑡𝑖𝑙𝑛𝑇 + 𝑢𝑘𝑖𝑡 . (2)
Any well-specified cost function must be homogeneous of degree 1 in input prices.
In the translog cost function, this requires that
∑ 𝛼𝑖 = 1, ∑ 𝛽𝑖𝑗 = 0 , ∑ 𝛾𝑞𝑖 = 0, (3)
and 𝛽𝑖𝑗 = 𝛽𝑗𝑖 can be imposed for symmetry.
A proxy to the rate of technological change can then be obtained from (1),
𝑇𝐶 =𝜕𝑙𝑛𝐶
𝜕𝑇=
𝜕𝑙𝑛𝐶
𝜕𝑙𝑛𝑇
𝜕𝑙𝑛𝑇
𝜕𝑇=
𝜕𝑙𝑛𝐶
𝜕𝑙𝑛𝑇
1
𝑇= (𝑏𝑡 + 𝑏𝑡𝑡𝑙𝑛𝑇 + ∑ 𝑏𝑡𝑖𝑙𝑛𝑃𝑖 + 𝑏𝑞𝑡𝑙𝑛𝑄)/𝑇 (4)
Equation (4) shows that the technological change can be divided into three elements:
pure technical change (𝑏𝑡 + 𝑏𝑡𝑡𝑙𝑛𝑇) ; non-neutral technical change (∑ 𝑏𝑡𝑖𝑙𝑛𝑃𝑖) ; and
scale-augmenting technical change (𝑏𝑞𝑡𝑙𝑛𝑄).
Estimated returns to scale measured by
ηS = ∂(LnQ)/ ∂(LnC) = 1/𝜙𝑞 (5)
The translog form is flexible in the sense that specific features of the cost function
(like returns to scale or homotheticity) can be tested by examining the estimated model
parameters. Specifically, if the technology is homothetic, the dual cost function is
multiplicatively separable in output quantity and input prices. In the translog case, this
requires that γ𝑞𝑖 = 0 (for all i), so that the quadratic interaction terms between output
levels and input prices should disappear.
Instead of using a time trend to capture the state of advertising technology, we first
estimate a probit model of online advertising adoption and then include the predicted
probability as T in equations (1), (2), and (4). First, firms decide whether to adopt online
advertising or not. If a brand uses online advertising, then this variable equals 1;
otherwise, it equals 0. We model the decision as a discrete choice model:
4
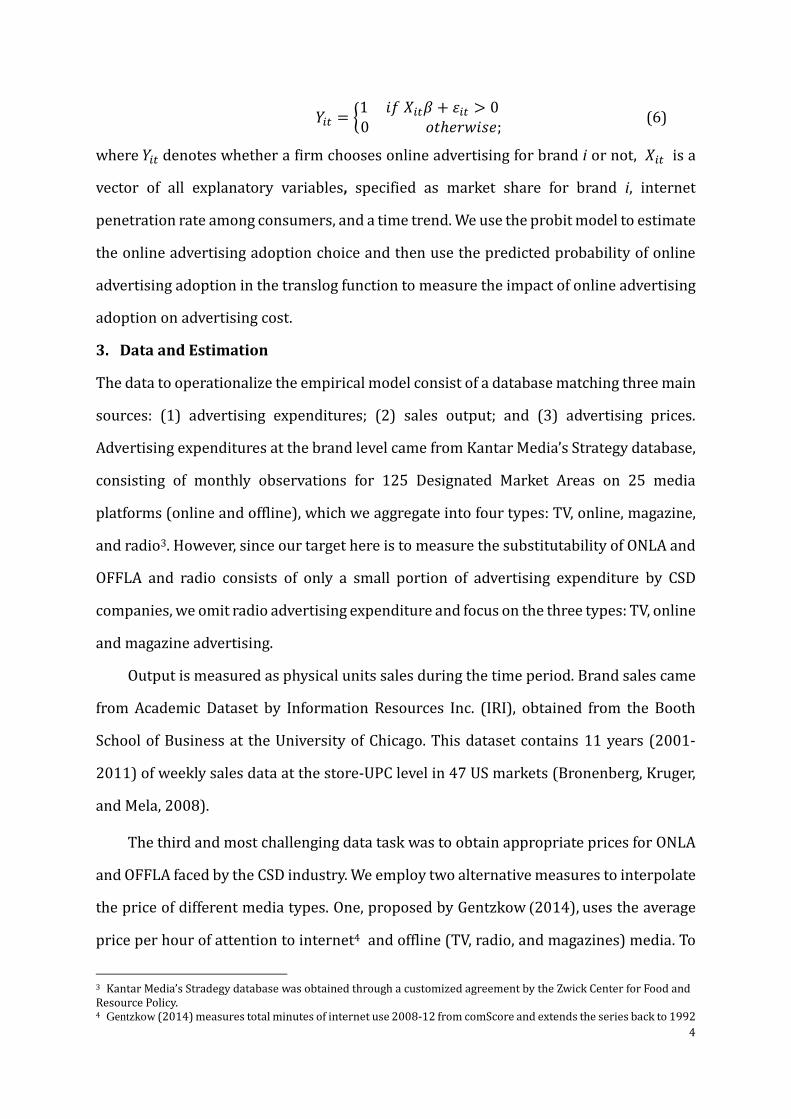
𝑌𝑖𝑡 = {1 𝑖𝑓 𝑋𝑖𝑡𝛽 + 𝜀𝑖𝑡 > 0 0 𝑜𝑡ℎ𝑒𝑟𝑤𝑖𝑠𝑒;
(6)
where 𝑌𝑖𝑡 denotes whether a firm chooses online advertising for brand i or not, 𝑋𝑖𝑡 is a
vector of all explanatory variables, specified as market share for brand i, internet
penetration rate among consumers, and a time trend. We use the probit model to estimate
the online advertising adoption choice and then use the predicted probability of online
advertising adoption in the translog function to measure the impact of online advertising
adoption on advertising cost.
3. Data and Estimation
The data to operationalize the empirical model consist of a database matching three main
sources: (1) advertising expenditures; (2) sales output; and (3) advertising prices.
Advertising expenditures at the brand level came from Kantar Media’s Strategy database,
consisting of monthly observations for 125 Designated Market Areas on 25 media
platforms (online and offline), which we aggregate into four types: TV, online, magazine,
and radio3. However, since our target here is to measure the substitutability of ONLA and
OFFLA and radio consists of only a small portion of advertising expenditure by CSD
companies, we omit radio advertising expenditure and focus on the three types: TV, online
and magazine advertising.
Output is measured as physical units sales during the time period. Brand sales came
from Academic Dataset by Information Resources Inc. (IRI), obtained from the Booth
School of Business at the University of Chicago. This dataset contains 11 years (2001-
2011) of weekly sales data at the store-UPC level in 47 US markets (Bronenberg, Kruger,
and Mela, 2008).
The third and most challenging data task was to obtain appropriate prices for ONLA
and OFFLA faced by the CSD industry. We employ two alternative measures to interpolate
the price of different media types. One, proposed by Gentzkow (2014), uses the average
price per hour of attention to internet4 and offline (TV, radio, and magazines) media. To
3 Kantar Media’s Stradegy database was obtained through a customized agreement by the Zwick Center for Food and Resource Policy. 4 Gentzkow (2014) measures total minutes of internet use 2008-12 from comScore and extends the series back to 1992
5
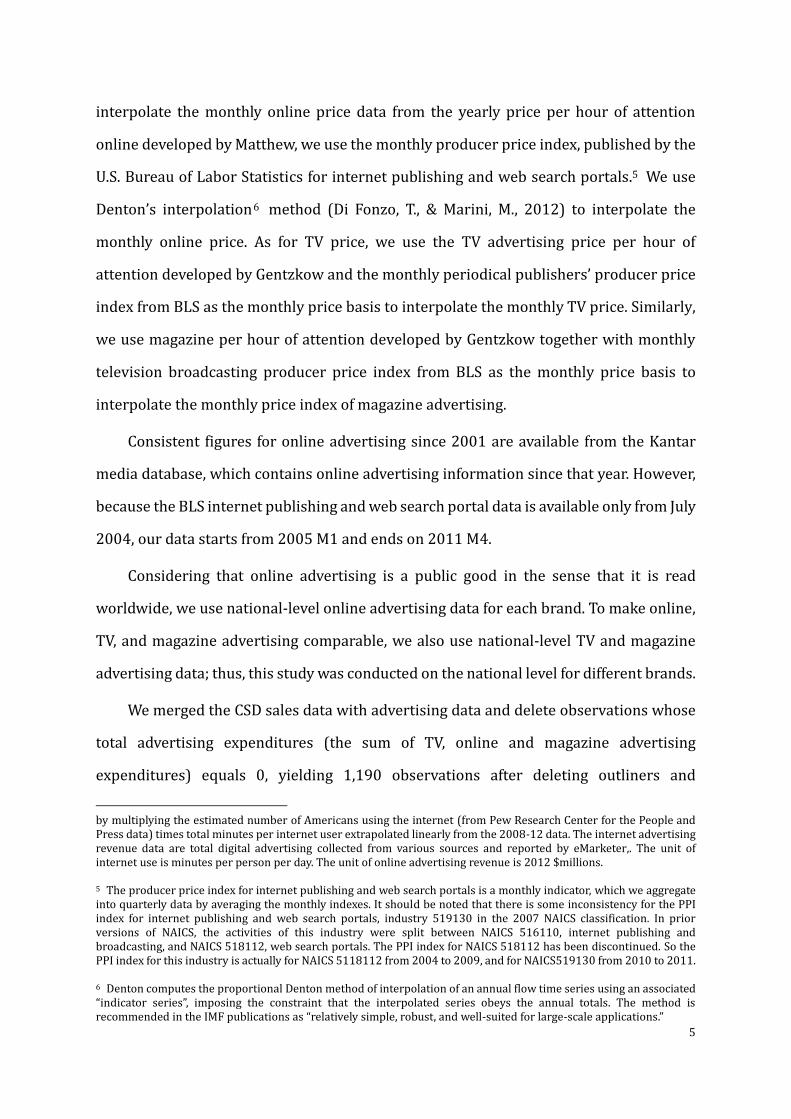
interpolate the monthly online price data from the yearly price per hour of attention
online developed by Matthew, we use the monthly producer price index, published by the
U.S. Bureau of Labor Statistics for internet publishing and web search portals.5 We use
Denton’s interpolation6 method (Di Fonzo, T., & Marini, M., 2012) to interpolate the
monthly online price. As for TV price, we use the TV advertising price per hour of
attention developed by Gentzkow and the monthly periodical publishers’ producer price
index from BLS as the monthly price basis to interpolate the monthly TV price. Similarly,
we use magazine per hour of attention developed by Gentzkow together with monthly
television broadcasting producer price index from BLS as the monthly price basis to
interpolate the monthly price index of magazine advertising.
Consistent figures for online advertising since 2001 are available from the Kantar
media database, which contains online advertising information since that year. However,
because the BLS internet publishing and web search portal data is available only from July
2004, our data starts from 2005 M1 and ends on 2011 M4.
Considering that online advertising is a public good in the sense that it is read
worldwide, we use national-level online advertising data for each brand. To make online,
TV, and magazine advertising comparable, we also use national-level TV and magazine
advertising data; thus, this study was conducted on the national level for different brands.
We merged the CSD sales data with advertising data and delete observations whose
total advertising expenditures (the sum of TV, online and magazine advertising
expenditures) equals 0, yielding 1,190 observations after deleting outliners and
by multiplying the estimated number of Americans using the internet (from Pew Research Center for the People and Press data) times total minutes per internet user extrapolated linearly from the 2008-12 data. The internet advertising revenue data are total digital advertising collected from various sources and reported by eMarketer,. The unit of internet use is minutes per person per day. The unit of online advertising revenue is 2012 $millions. 5 The producer price index for internet publishing and web search portals is a monthly indicator, which we aggregate into quarterly data by averaging the monthly indexes. It should be noted that there is some inconsistency for the PPI index for internet publishing and web search portals, industry 519130 in the 2007 NAICS classification. In prior versions of NAICS, the activities of this industry were split between NAICS 516110, internet publishing and broadcasting, and NAICS 518112, web search portals. The PPI index for NAICS 518112 has been discontinued. So the PPI index for this industry is actually for NAICS 5118112 from 2004 to 2009, and for NAICS519130 from 2010 to 2011. 6 Denton computes the proportional Denton method of interpolation of an annual flow time series using an associated “indicator series”, imposing the constraint that the interpolated series obeys the annual totals. The method is recommended in the IMF publications as “relatively simple, robust, and well-suited for large-scale applications.”
6
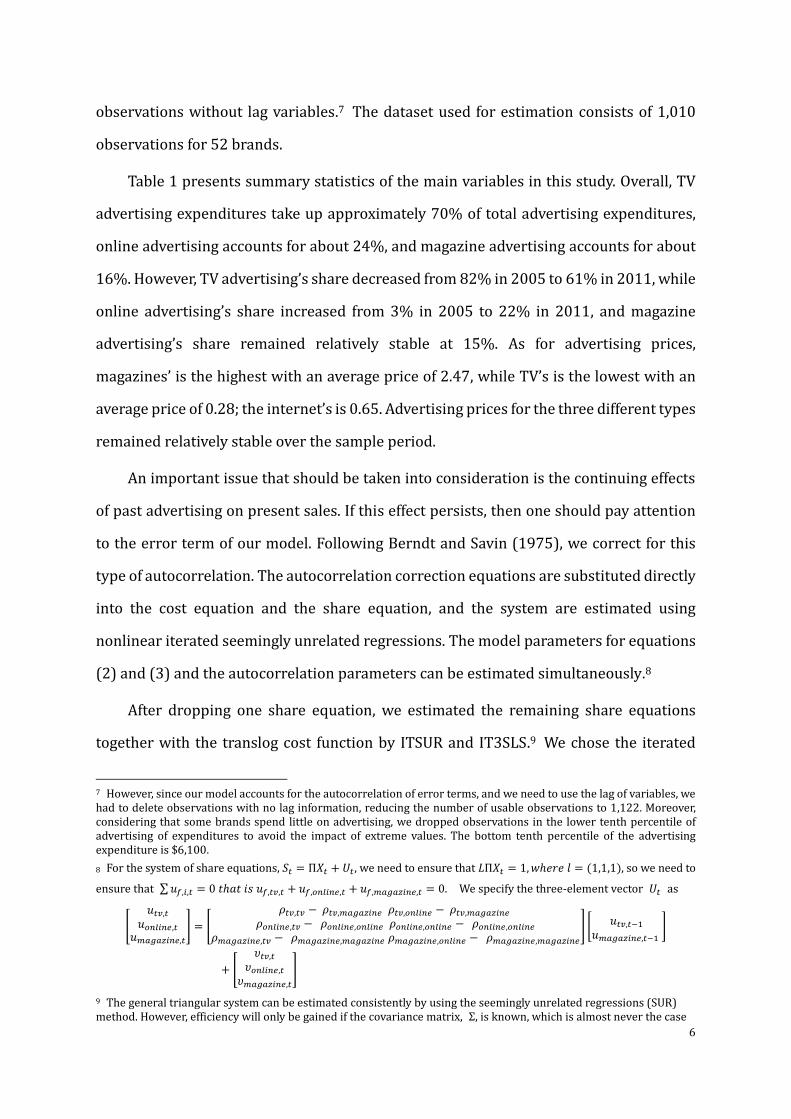
observations without lag variables.7 The dataset used for estimation consists of 1,010
observations for 52 brands.
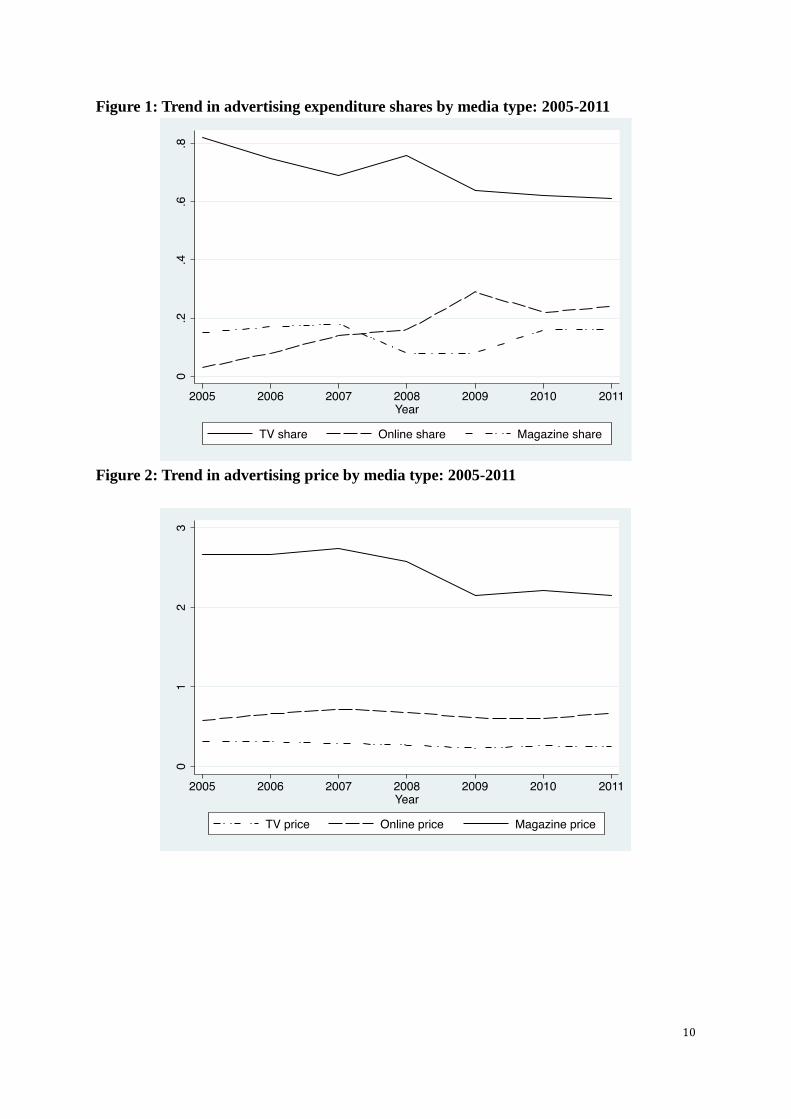
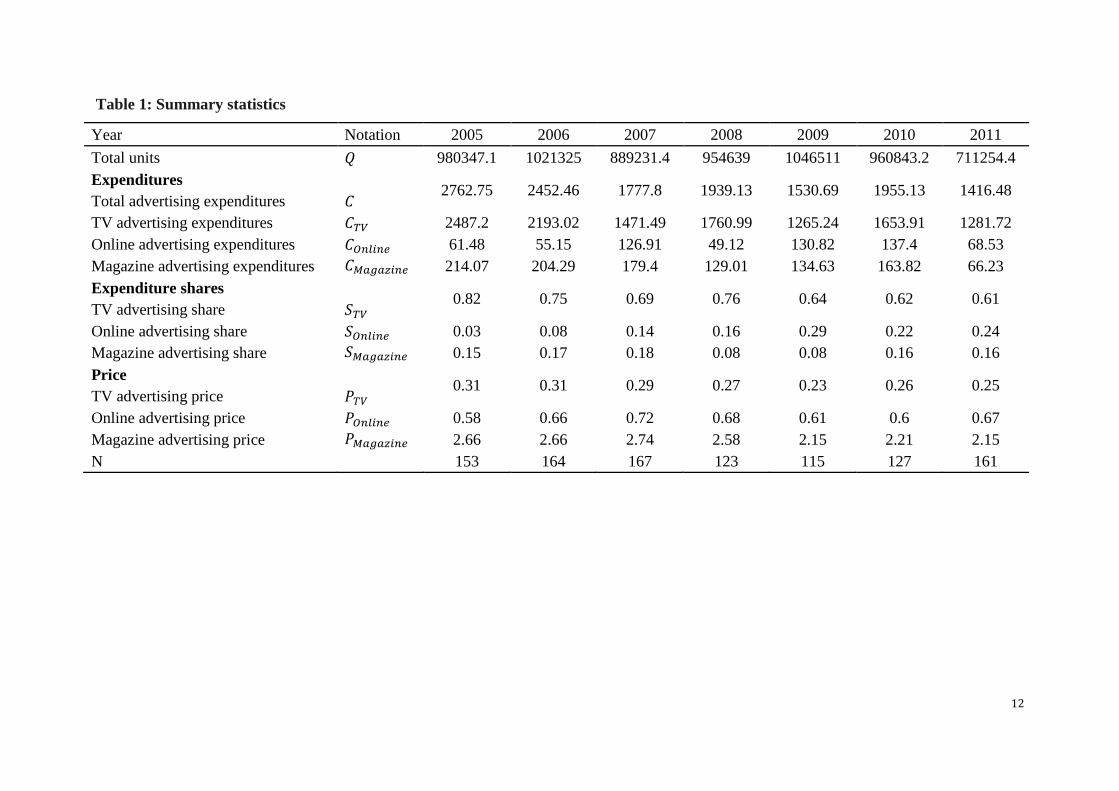
Table 1 presents summary statistics of the main variables in this study. Overall, TV
advertising expenditures take up approximately 70% of total advertising expenditures,
online advertising accounts for about 24%, and magazine advertising accounts for about
16%. However, TV advertising’s share decreased from 82% in 2005 to 61% in 2011, while
online advertising’s share increased from 3% in 2005 to 22% in 2011, and magazine
advertising’s share remained relatively stable at 15%. As for advertising prices,
magazines’ is the highest with an average price of 2.47, while TV’s is the lowest with an
average price of 0.28; the internet’s is 0.65. Advertising prices for the three different types
remained relatively stable over the sample period.
An important issue that should be taken into consideration is the continuing effects
of past advertising on present sales. If this effect persists, then one should pay attention
to the error term of our model. Following Berndt and Savin (1975), we correct for this
type of autocorrelation. The autocorrelation correction equations are substituted directly
into the cost equation and the share equation, and the system are estimated using
nonlinear iterated seemingly unrelated regressions. The model parameters for equations
(2) and (3) and the autocorrelation parameters can be estimated simultaneously.8
After dropping one share equation, we estimated the remaining share equations
together with the translog cost function by ITSUR and IT3SLS.9 We chose the iterated
7 However, since our model accounts for the autocorrelation of error terms, and we need to use the lag of variables, we had to delete observations with no lag information, reducing the number of usable observations to 1,122. Moreover, considering that some brands spend little on advertising, we dropped observations in the lower tenth percentile of advertising of expenditures to avoid the impact of extreme values. The bottom tenth percentile of the advertising expenditure is $6,100.
8 For the system of share equations, 𝑆𝑡 = Π𝑋𝑡 + 𝑈𝑡, we need to ensure that 𝐿Π𝑋𝑡 = 1, 𝑤ℎ𝑒𝑟𝑒 𝑙 = (1,1,1), so we need to
ensure that ∑ 𝑢𝑓,𝑖,𝑡 = 0 𝑡ℎ𝑎𝑡 𝑖𝑠 𝑢𝑓,𝑡𝑣,𝑡 + 𝑢𝑓,𝑜𝑛𝑙𝑖𝑛𝑒,𝑡 + 𝑢𝑓,𝑚𝑎𝑔𝑎𝑧𝑖𝑛𝑒,𝑡 = 0. We specify the three-element vector 𝑈𝑡 as
[
𝑢𝑡𝑣,𝑡
𝑢𝑜𝑛𝑙𝑖𝑛𝑒,𝑡𝑢𝑚𝑎𝑔𝑎𝑧𝑖𝑛𝑒,𝑡
] = [
𝜌𝑡𝑣,𝑡𝑣 − 𝜌𝑡𝑣,𝑚𝑎𝑔𝑎𝑧𝑖𝑛𝑒 𝜌𝑡𝑣,𝑜𝑛𝑙𝑖𝑛𝑒 − 𝜌𝑡𝑣,𝑚𝑎𝑔𝑎𝑧𝑖𝑛𝑒 𝜌𝑜𝑛𝑙𝑖𝑛𝑒,𝑡𝑣 − 𝜌𝑜𝑛𝑙𝑖𝑛𝑒,𝑜𝑛𝑙𝑖𝑛𝑒 𝜌𝑜𝑛𝑙𝑖𝑛𝑒,𝑜𝑛𝑙𝑖𝑛𝑒 − 𝜌𝑜𝑛𝑙𝑖𝑛𝑒,𝑜𝑛𝑙𝑖𝑛𝑒
𝜌𝑚𝑎𝑔𝑎𝑧𝑖𝑛𝑒,𝑡𝑣 − 𝜌𝑚𝑎𝑔𝑎𝑧𝑖𝑛𝑒,𝑚𝑎𝑔𝑎𝑧𝑖𝑛𝑒 𝜌𝑚𝑎𝑔𝑎𝑧𝑖𝑛𝑒,𝑜𝑛𝑙𝑖𝑛𝑒 − 𝜌𝑚𝑎𝑔𝑎𝑧𝑖𝑛𝑒,𝑚𝑎𝑔𝑎𝑧𝑖𝑛𝑒
] [
𝑢𝑡𝑣,𝑡−1
𝑢𝑚𝑎𝑔𝑎𝑧𝑖𝑛𝑒,𝑡−1 ]
+ [
𝜐𝑡𝑣,𝑡
𝜐𝑜𝑛𝑙𝑖𝑛𝑒,𝑡
𝜐𝑚𝑎𝑔𝑎𝑧𝑖𝑛𝑒,𝑡
]
9 The general triangular system can be estimated consistently by using the seemingly unrelated regressions (SUR) method. However, efficiency will only be gained if the covariance matrix, Σ, is known, which is almost never the case
7
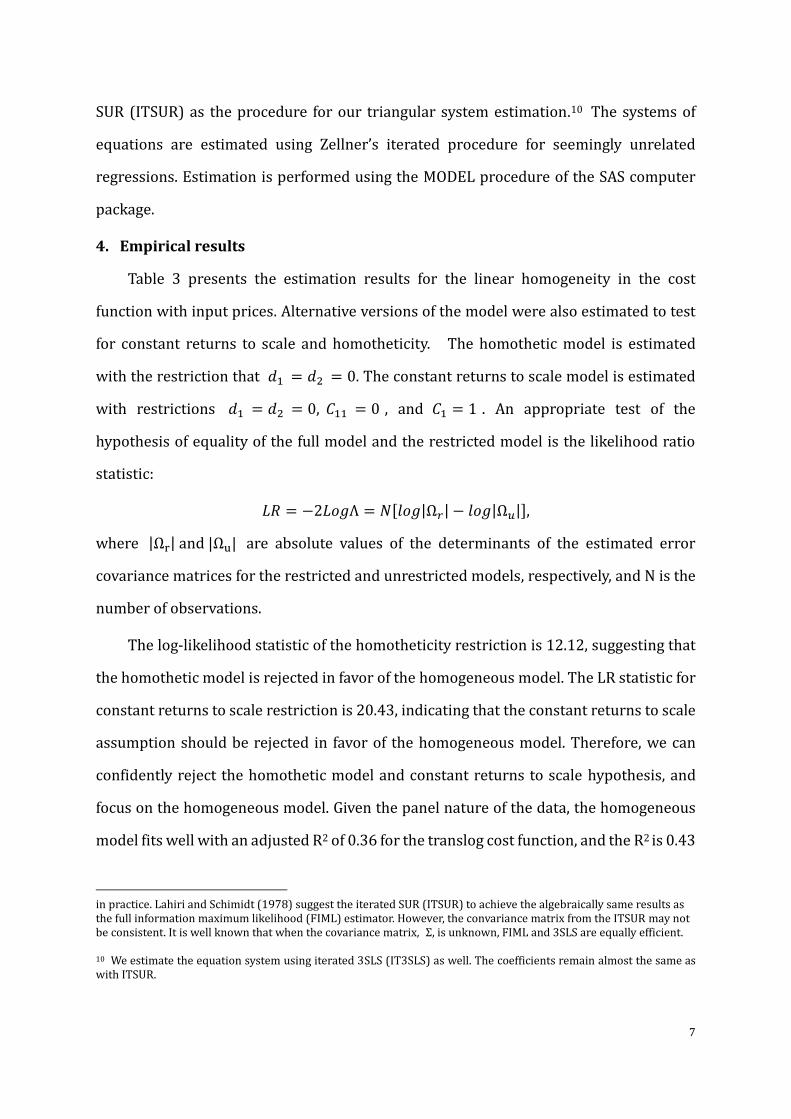
SUR (ITSUR) as the procedure for our triangular system estimation.10 The systems of
equations are estimated using Zellner’s iterated procedure for seemingly unrelated
regressions. Estimation is performed using the MODEL procedure of the SAS computer
package.
4. Empirical results
Table 3 presents the estimation results for the linear homogeneity in the cost
function with input prices. Alternative versions of the model were also estimated to test
for constant returns to scale and homotheticity. The homothetic model is estimated
with the restriction that 𝑑1 = 𝑑2 = 0. The constant returns to scale model is estimated
with restrictions 𝑑1 = 𝑑2 = 0, 𝐶11 = 0 , and 𝐶1 = 1 . An appropriate test of the
hypothesis of equality of the full model and the restricted model is the likelihood ratio
statistic:
𝐿𝑅 = −2𝐿𝑜𝑔Λ = 𝑁[𝑙𝑜𝑔|Ω𝑟| − 𝑙𝑜𝑔|Ω𝑢|],
where |Ωr| and |Ωu| are absolute values of the determinants of the estimated error
covariance matrices for the restricted and unrestricted models, respectively, and N is the
number of observations.
The log-likelihood statistic of the homotheticity restriction is 12.12, suggesting that
the homothetic model is rejected in favor of the homogeneous model. The LR statistic for
constant returns to scale restriction is 20.43, indicating that the constant returns to scale
assumption should be rejected in favor of the homogeneous model. Therefore, we can
confidently reject the homothetic model and constant returns to scale hypothesis, and
focus on the homogeneous model. Given the panel nature of the data, the homogeneous
model fits well with an adjusted R2 of 0.36 for the translog cost function, and the R2 is 0.43
in practice. Lahiri and Schimidt (1978) suggest the iterated SUR (ITSUR) to achieve the algebraically same results as the full information maximum likelihood (FIML) estimator. However, the convariance matrix from the ITSUR may not be consistent. It is well known that when the covariance matrix, Σ, is unknown, FIML and 3SLS are equally efficient. 10 We estimate the equation system using iterated 3SLS (IT3SLS) as well. The coefficients remain almost the same as with ITSUR.
8
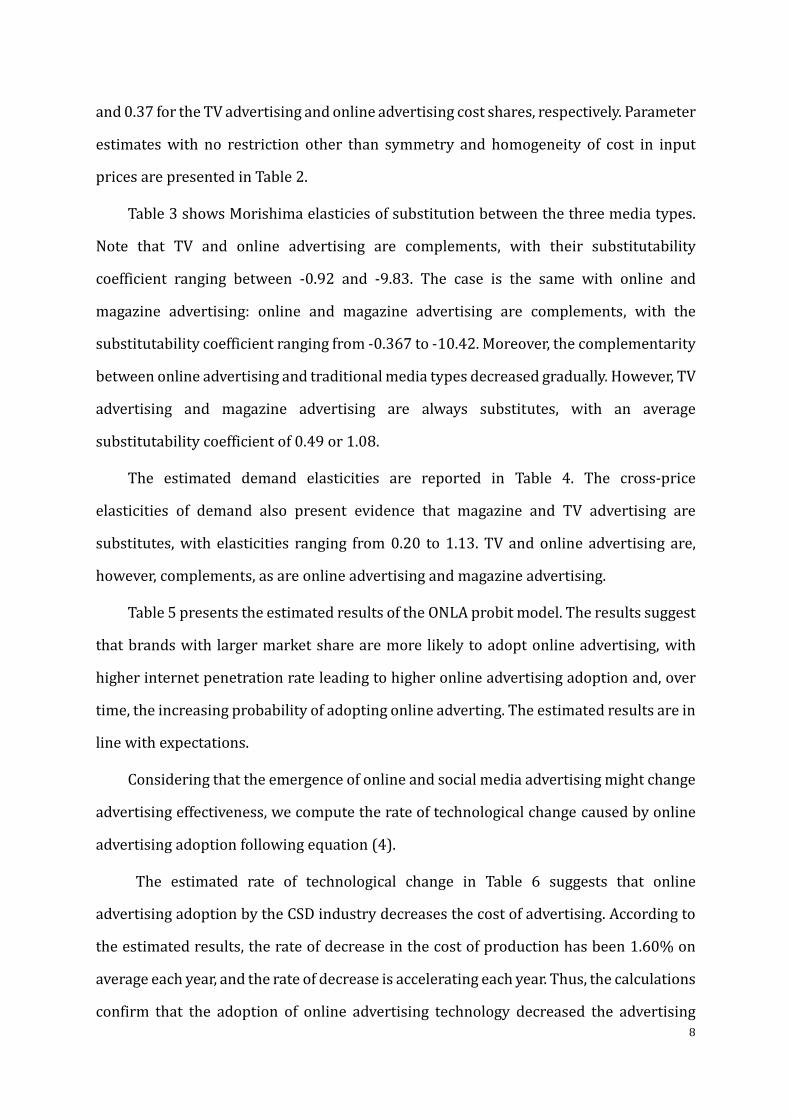
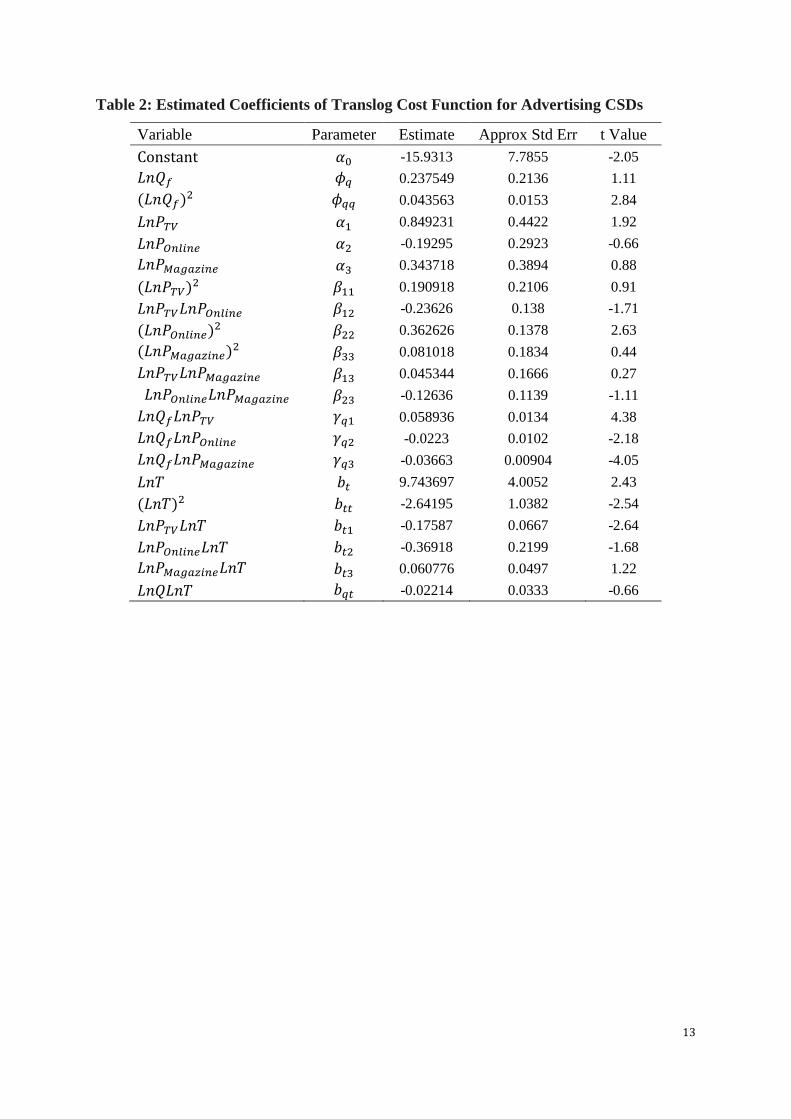
and 0.37 for the TV advertising and online advertising cost shares, respectively. Parameter
estimates with no restriction other than symmetry and homogeneity of cost in input
prices are presented in Table 2.
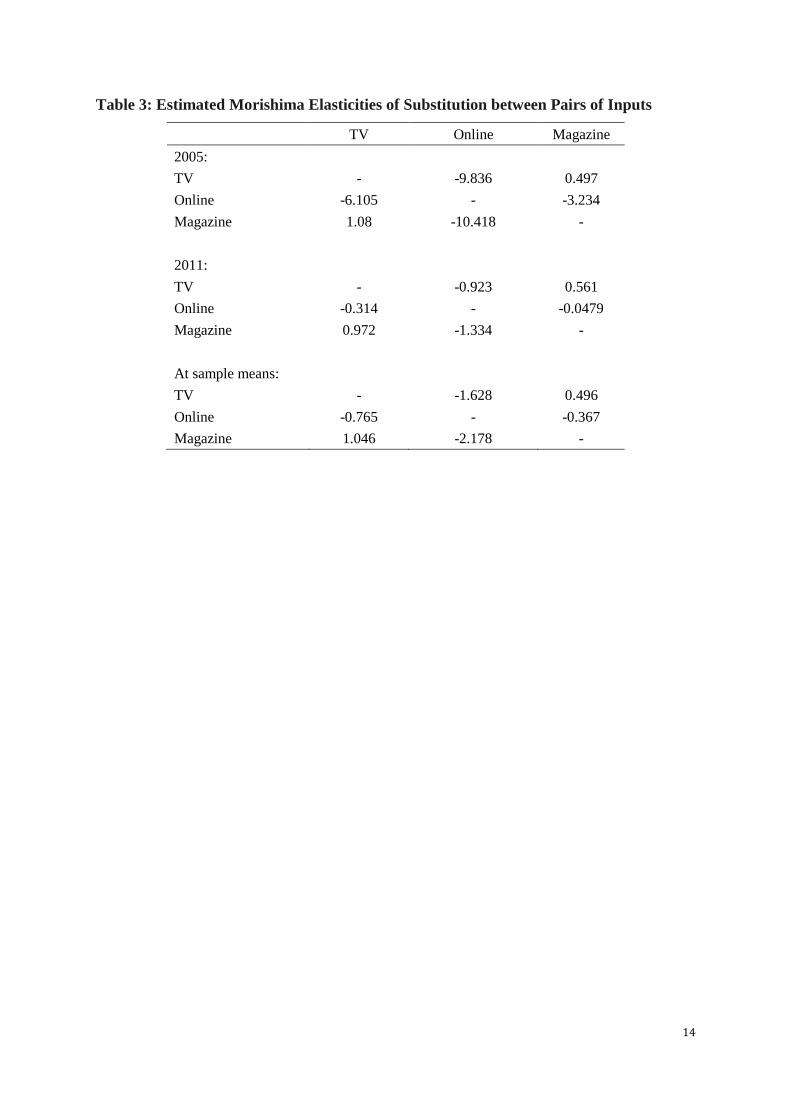
Table 3 shows Morishima elasticies of substitution between the three media types.
Note that TV and online advertising are complements, with their substitutability
coefficient ranging between -0.92 and -9.83. The case is the same with online and
magazine advertising: online and magazine advertising are complements, with the
substitutability coefficient ranging from -0.367 to -10.42. Moreover, the complementarity
between online advertising and traditional media types decreased gradually. However, TV
advertising and magazine advertising are always substitutes, with an average
substitutability coefficient of 0.49 or 1.08.
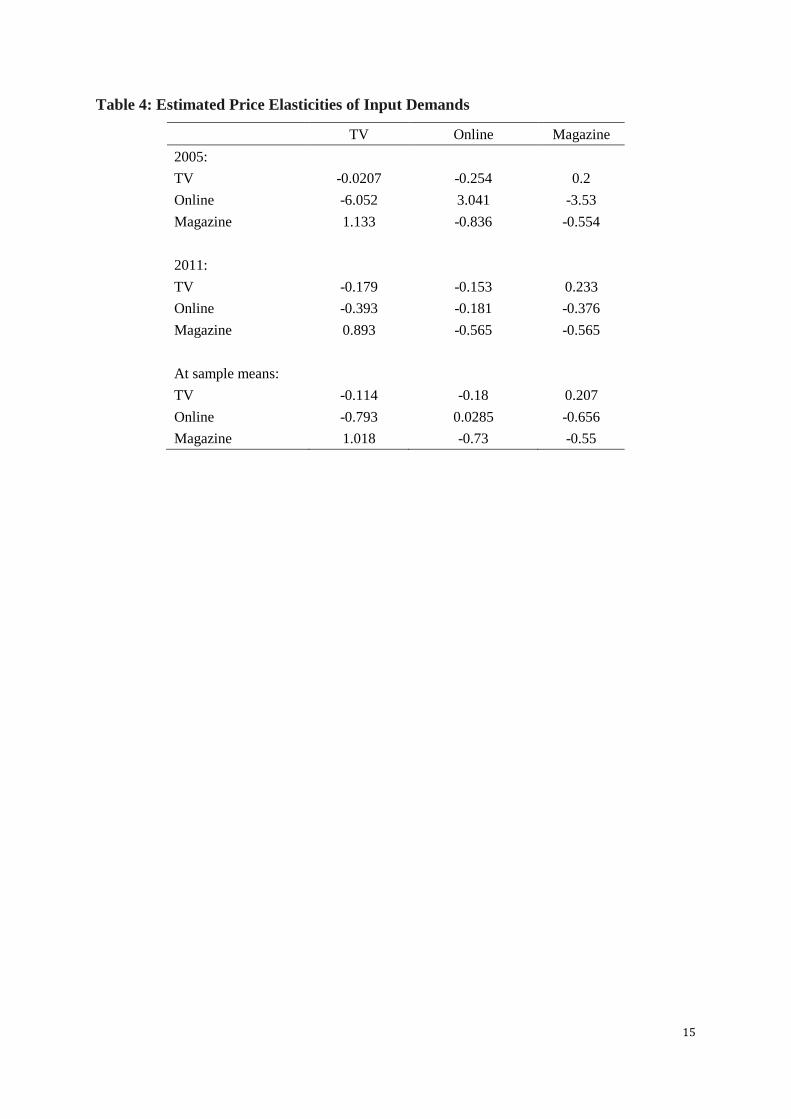
The estimated demand elasticities are reported in Table 4. The cross-price
elasticities of demand also present evidence that magazine and TV advertising are
substitutes, with elasticities ranging from 0.20 to 1.13. TV and online advertising are,
however, complements, as are online advertising and magazine advertising.
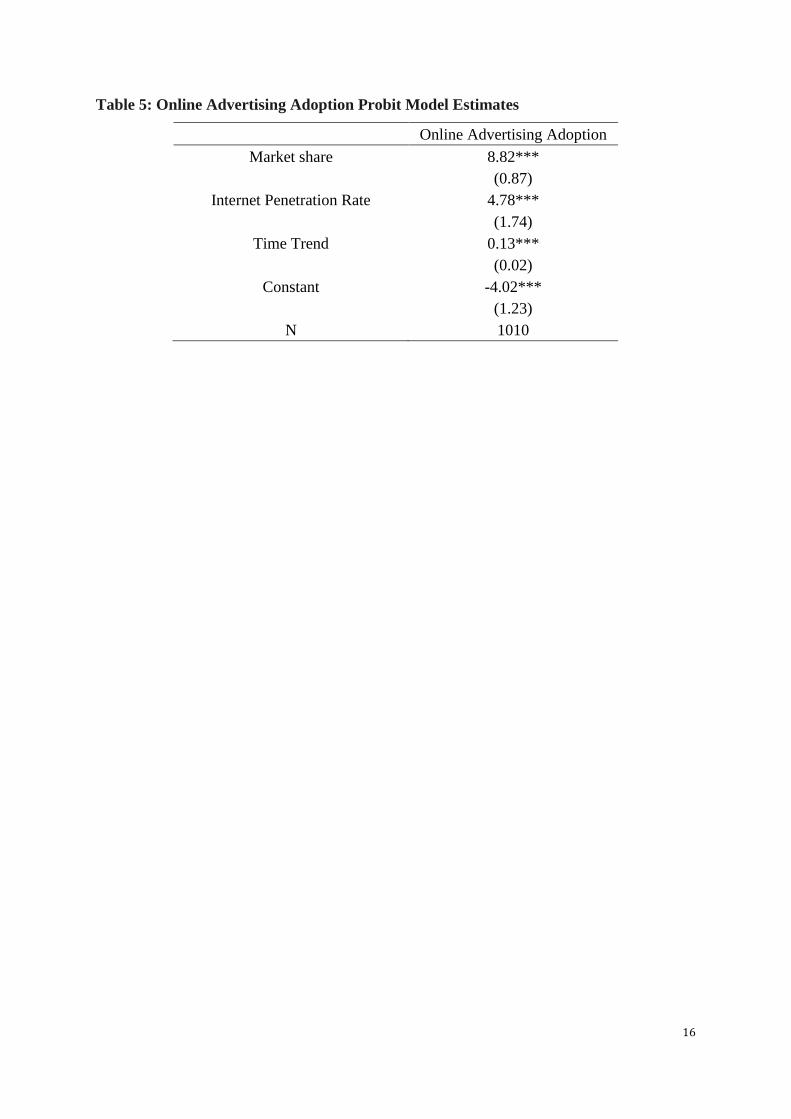
Table 5 presents the estimated results of the ONLA probit model. The results suggest
that brands with larger market share are more likely to adopt online advertising, with
higher internet penetration rate leading to higher online advertising adoption and, over
time, the increasing probability of adopting online adverting. The estimated results are in
line with expectations.
Considering that the emergence of online and social media advertising might change
advertising effectiveness, we compute the rate of technological change caused by online
advertising adoption following equation (4).
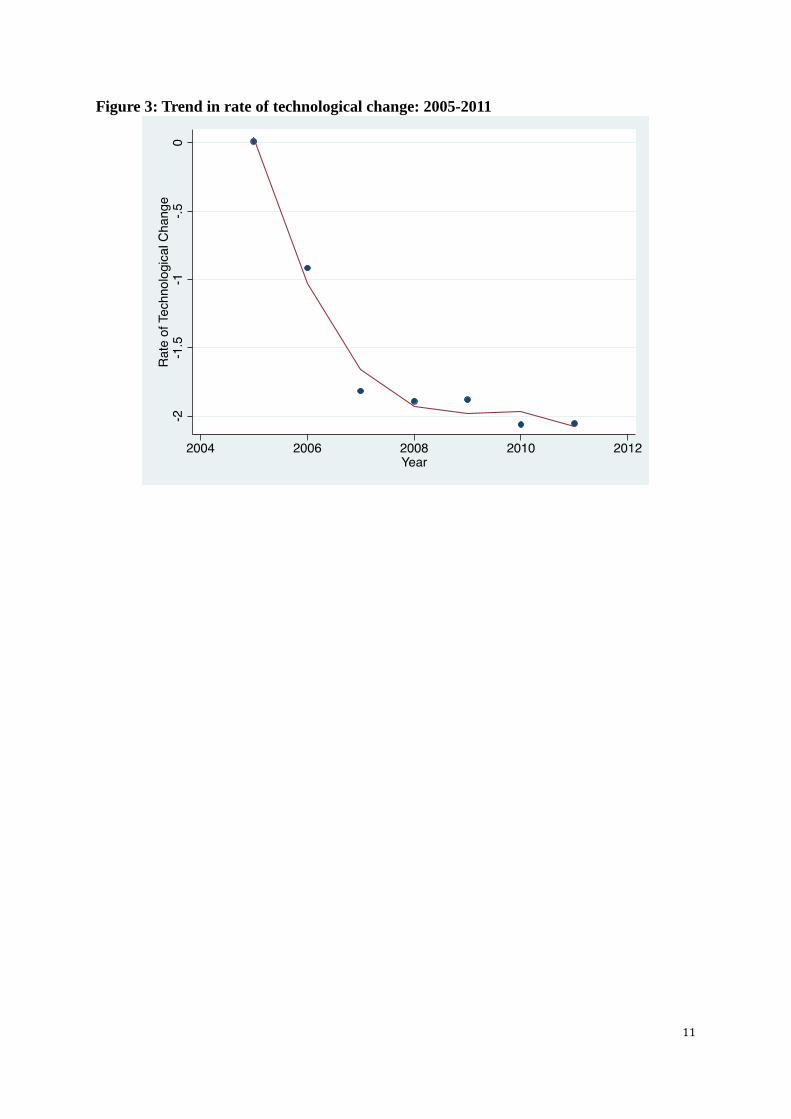
The estimated rate of technological change in Table 6 suggests that online
advertising adoption by the CSD industry decreases the cost of advertising. According to
the estimated results, the rate of decrease in the cost of production has been 1.60% on
average each year, and the rate of decrease is accelerating each year. Thus, the calculations
confirm that the adoption of online advertising technology decreased the advertising
9
costs of CSD industry..
The estimated average degree of economies of size reported in Table 6 is 1.65,
indicating that advertising in the CSD industry exhibits economies of size. That is,
advertising costs decrease with output sales.
5. Conclusions
This paper investigates the substitutability of ONLA and OFFLA. Based on monthly data
spanning 2005 to 2011 for the carbonated soft drinks (CSD) industry, we estimate a
translog cost function of advertising.
First, the online advertising adoption model suggests that CSD brands with higher
market share are more likely to adopt online advertising. In addition, a higher internet
penetration rate and the passage of time increase the probability of a brand’s adopting
online advertising. Empirical results point out that online advertising and traditional
offline media are complements rather than substitutes based on estimated cross-price
elasticities as well as Morishima elasticies. Moreover, the estimated rates of technological
change indicate that the adoption of online advertising decreases the cost of achieving a
sales target but cost-reducing and complementary roles are weakening. Furthermore, this
is a preliminary empirical study of the substitutability between ONLA and OFFLA. Future
studies can be extended to other industries to see if our findings also hold in other
industries.
10
Figure 1: Trend in advertising expenditure shares by media type: 2005-2011
Figure 2: Trend in advertising price by media type: 2005-2011
11
Figure 3: Trend in rate of technological change: 2005-2011
12
Table 1: Summary statistics
Year Notation 2005 2006 2007 2008 2009 2010 2011
Total units 𝑄 980347.1 1021325 889231.4 954639 1046511 960843.2 711254.4
Expenditures 2762.75 2452.46 1777.8 1939.13 1530.69 1955.13 1416.48
Total advertising expenditures 𝐶
TV advertising expenditures 𝐶𝑇𝑉 2487.2 2193.02 1471.49 1760.99 1265.24 1653.91 1281.72
Online advertising expenditures 𝐶𝑂𝑛𝑙𝑖𝑛𝑒 61.48 55.15 126.91 49.12 130.82 137.4 68.53
Magazine advertising expenditures 𝐶𝑀𝑎𝑔𝑎𝑧𝑖𝑛𝑒 214.07 204.29 179.4 129.01 134.63 163.82 66.23
Expenditure shares 0.82 0.75 0.69 0.76 0.64 0.62 0.61
TV advertising share 𝑆𝑇𝑉
Online advertising share 𝑆𝑂𝑛𝑙𝑖𝑛𝑒 0.03 0.08 0.14 0.16 0.29 0.22 0.24
Magazine advertising share 𝑆𝑀𝑎𝑔𝑎𝑧𝑖𝑛𝑒 0.15 0.17 0.18 0.08 0.08 0.16 0.16
Price 0.31 0.31 0.29 0.27 0.23 0.26 0.25
TV advertising price 𝑃𝑇𝑉
Online advertising price 𝑃𝑂𝑛𝑙𝑖𝑛𝑒 0.58 0.66 0.72 0.68 0.61 0.6 0.67
Magazine advertising price 𝑃𝑀𝑎𝑔𝑎𝑧𝑖𝑛𝑒 2.66 2.66 2.74 2.58 2.15 2.21 2.15
N 153 164 167 123 115 127 161
13
Table 2: Estimated Coefficients of Translog Cost Function for Advertising CSDs
Variable Parameter Estimate Approx Std Err t Value
Constant 𝛼0 -15.9313 7.7855 -2.05
𝐿𝑛𝑄𝑓 𝜙𝑞 0.237549 0.2136 1.11
(𝐿𝑛𝑄𝑓)2 𝜙𝑞𝑞 0.043563 0.0153 2.84
𝐿𝑛𝑃𝑇𝑉 𝛼1 0.849231 0.4422 1.92
𝐿𝑛𝑃𝑂𝑛𝑙𝑖𝑛𝑒 𝛼2 -0.19295 0.2923 -0.66
𝐿𝑛𝑃𝑀𝑎𝑔𝑎𝑧𝑖𝑛𝑒 𝛼3 0.343718 0.3894 0.88
(𝐿𝑛𝑃𝑇𝑉)2 𝛽11 0.190918 0.2106 0.91
𝐿𝑛𝑃𝑇𝑉𝐿𝑛𝑃𝑂𝑛𝑙𝑖𝑛𝑒 𝛽12 -0.23626 0.138 -1.71
(𝐿𝑛𝑃𝑂𝑛𝑙𝑖𝑛𝑒)2 𝛽22 0.362626 0.1378 2.63
(𝐿𝑛𝑃𝑀𝑎𝑔𝑎𝑧𝑖𝑛𝑒)2 𝛽33 0.081018 0.1834 0.44
𝐿𝑛𝑃𝑇𝑉𝐿𝑛𝑃𝑀𝑎𝑔𝑎𝑧𝑖𝑛𝑒 𝛽13 0.045344 0.1666 0.27
𝐿𝑛𝑃𝑂𝑛𝑙𝑖𝑛𝑒𝐿𝑛𝑃𝑀𝑎𝑔𝑎𝑧𝑖𝑛𝑒 𝛽23 -0.12636 0.1139 -1.11
𝐿𝑛𝑄𝑓𝐿𝑛𝑃𝑇𝑉 𝛾𝑞1 0.058936 0.0134 4.38
𝐿𝑛𝑄𝑓𝐿𝑛𝑃𝑂𝑛𝑙𝑖𝑛𝑒 𝛾𝑞2 -0.0223 0.0102 -2.18
𝐿𝑛𝑄𝑓𝐿𝑛𝑃𝑀𝑎𝑔𝑎𝑧𝑖𝑛𝑒 𝛾𝑞3 -0.03663 0.00904 -4.05
𝐿𝑛𝑇 𝑏𝑡 9.743697 4.0052 2.43
(𝐿𝑛𝑇)2 𝑏𝑡𝑡 -2.64195 1.0382 -2.54
𝐿𝑛𝑃𝑇𝑉𝐿𝑛𝑇 𝑏𝑡1 -0.17587 0.0667 -2.64
𝐿𝑛𝑃𝑂𝑛𝑙𝑖𝑛𝑒𝐿𝑛𝑇 𝑏𝑡2 -0.36918 0.2199 -1.68
𝐿𝑛𝑃𝑀𝑎𝑔𝑎𝑧𝑖𝑛𝑒𝐿𝑛𝑇 𝑏𝑡3 0.060776 0.0497 1.22
𝐿𝑛𝑄𝐿𝑛𝑇 𝑏𝑞𝑡 -0.02214 0.0333 -0.66
14
Table 3: Estimated Morishima Elasticities of Substitution between Pairs of Inputs
TV Online Magazine
2005:
TV - -9.836 0.497
Online -6.105 - -3.234
Magazine 1.08 -10.418 -
2011:
TV - -0.923 0.561
Online -0.314 - -0.0479
Magazine 0.972 -1.334 -
At sample means:
TV - -1.628 0.496
Online -0.765 - -0.367
Magazine 1.046 -2.178 -
15
Table 4: Estimated Price Elasticities of Input Demands
TV Online Magazine
2005:
TV -0.0207 -0.254 0.2
Online -6.052 3.041 -3.53
Magazine 1.133 -0.836 -0.554
2011:
TV -0.179 -0.153 0.233
Online -0.393 -0.181 -0.376
Magazine 0.893 -0.565 -0.565
At sample means:
TV -0.114 -0.18 0.207
Online -0.793 0.0285 -0.656
Magazine 1.018 -0.73 -0.55
16
Table 5: Online Advertising Adoption Probit Model Estimates
Online Advertising Adoption
Market share 8.82***
(0.87)
Internet Penetration Rate 4.78***
(1.74)
Time Trend 0.13***
(0.02)
Constant -4.02***
(1.23)
N 1010

17
Table 6: Rate of Technological Change and Economies of Size in CSD Advertising
Year Rate of Technological Change Economies of size
2005 0.009555389 1.6141253
2006 -0.916881212 1.6080923
2007 -1.816732516 1.6736785
2008 -1.890295303 1.7085842
2009 -1.881733989 1.6435057
2010 -2.062293809 1.6238553
2011 -2.054648085 1.7173954
Sample mean -1.600675716 1.6544631
18
References
Athey, S., Calvano, E., & Gans, J. (2013). The impact of the internet on advertising markets
for news media. National Bureau of Economic Research (No. w19419).
Bergemann, D., & Bonatti, A. (2011). Targeting in advertising markets: Implications for offline
versus online media. The RAND Journal of Economics, 42(3), 417-443.
Berndt, E. R., & Savin, N. E. (1975). Estimation and hypothesis testing in singular equation
systems with autoregressive disturbances. Econometrica: Journal of the Econometric Society,
43 (5/6), 937-957.
Bronnenberg, Bart J., Michael W. Kruger, Carl F. Mela. (2008). The IRI marketing dataset.
Marketing Science, 27(4) 745-748.
Bureau of Labor Statistics, U.S. Department of Labor. Producer price index for internet
publishing and web search portals—NAICS 519130. Available online from:
http://data.bls.gov/timeseries/PCU519130519130.
Di Fonzo, T., & Marini, M. (2012). On the extrapolation with the denton proportional
benchmarking method. IMF Working Paper. Available online from:
https://www.imf.org/external/pubs/ft/wp/2012/wp12169.pdf.
Evans, D. S. (2009). The online advertising industry: Economics, evolution, and privacy.
Journal of Economic Perspectives, 23(3), 37-60.
Frank, M. W. (2008). Media substitution in advertising: A spirited case study. International
Journal of Industrial Organization, 26(1), 308-326.
Gentzkow, M. (2014). Trading dollars for dollars: The price of attention online and offline.
American Economic Review, 104(5), 481-488.
Giannakas, K., G. Karagiannis, and V. Tzouvelekas, V. (2012). Spillovers, efficiency and
productivity growth in advertising. American Journal of Agricultural Economics, 94(5), 1154-
1170.
Goldfarb, A. (2014). What is different about online advertising? Review of Industrial
Organization, 44(2), 115-129.
Goldfarb, A., & Tucker, C. (2011a). Advertising bans and the substitutability of online and
offline advertising. Journal of Marketing Research, 48(2), 207-227.
Goldfarb, A., & Tucker, C. (2011b). Substitution between offline and online advertising
markets. Journal of Competition Law and Economics, 7(1), 37-44.
Interactive Advertising Bureau. (2014). Q3 2014 Internet advertising revenues hit $12.4 billion,
making it the highest quarter on record. December 18. Available online from:
http://www.iab.net/about_the_iab/recent_press_releases

19
Kaye, B. K., & Medoff, N. J. (2001). World Wide Web: a mass communication perspective.
McGraw-Hill Higher Education.
Lahiri, K., & Schmidt, P. (1978). On the estimation of triangular structural systems.
Econometrica: Journal of the Econometric Society, 1217-1221.
Seldon, B. J., Jewell, R. T., & O’Brien, D. M. (2000). Media substitution and economies of
scale in advertising. International Journal of Industrial Organization, 18(8), 1153-1180.