Substituent Effects on Reactivity and Allergenicity of ... filePortland State University PDXScholar...
126
Portland State University PDXScholar Dissertations and eses Dissertations and eses Summer 8-13-2013 Substituent Effects on Reactivity and Allergenicity of Benzoquinone Wilbes Mbiya Portland State University Let us know how access to this document benefits you. Follow this and additional works at: hp://pdxscholar.library.pdx.edu/open_access_etds Part of the Chemistry Commons is Dissertation is brought to you for free and open access. It has been accepted for inclusion in Dissertations and eses by an authorized administrator of PDXScholar. For more information, please contact [email protected]. Recommended Citation Mbiya, Wilbes, "Substituent Effects on Reactivity and Allergenicity of Benzoquinone" (2013). Dissertations and eses. Paper 1406. 10.15760/etd.1406
-
Upload
phungnguyet -
Category
Documents
-
view
219 -
download
0
Transcript of Substituent Effects on Reactivity and Allergenicity of ... filePortland State University PDXScholar...

Portland State UniversityPDXScholar
Dissertations and Theses Dissertations and Theses
Summer 8-13-2013
Substituent Effects on Reactivity and Allergenicity ofBenzoquinoneWilbes MbiyaPortland State University
Let us know how access to this document benefits you.Follow this and additional works at: http://pdxscholar.library.pdx.edu/open_access_etds
Part of the Chemistry Commons
This Dissertation is brought to you for free and open access. It has been accepted for inclusion in Dissertations and Theses by an authorizedadministrator of PDXScholar. For more information, please contact [email protected].
Recommended CitationMbiya, Wilbes, "Substituent Effects on Reactivity and Allergenicity of Benzoquinone" (2013). Dissertations and Theses. Paper 1406.
10.15760/etd.1406

Substituent Effects on Reactivity and Allergenicity of Benzoquinone
by
Wilbes Mbiya
A dissertation submitted in partial fulfillment of the
requirements for the degree of
Doctor of Philosophy
in
Chemistry
Dissertation Committee:
Reuben H. Simoyi, Chair
Paul D. Siegel
Itai Chipinda
Andrea M. Goforth
Bradley A. Buckley
Robert M. Strongin
Shankar Rananavare
Portland State University
2013

© 2013 Wilbes Mbiya
i
ABSTRACT
Benzoquinone (BQ) is an extremely potent electrophilic contact allergen that
haptenates endogenous proteins through Michael addition (MA). It is also hypothesized
that BQ may haptenate proteins via free radical formation. The objective of this study
was to assess the inductive effects (activating and deactivating) of substituents on BQ
reactivity and the mechanistic pathway of covalent binding to nucleophilic thiols. The
BQ binding by Cys34 on human serum albumin was studied, and for reactivity studies,
nitrobenzenethiol (NBT) was used as a surrogate for protein binding of the BQ and
benzoquinone derivatives (BQD). Stopped flow techniques were used to determine
pseudo-first order rate constants (k) of methyl-, t-butyl-, and chlorine-substituted BQD
reactions with NBT, whereas electron pair resonance (EPR) studies were performed to
investigate the possible free radical mediated binding mechanism of BQD.
Characterization of adducts was performed using mass spectrometry (MS) and nuclear
magnetic resonance spectroscopy (NMR). The rate constant values demonstrated the
chlorine substituted (activated) BQD to be more reactive toward NBT, than the methyl
and t-butyl-substituted (deactivated) BQD, and this correlated with the respective EPR
intensities. The EPR signal, however, was quenched in the presence of NBT suggesting
MA as the dominant reaction pathway. MS and NMR results confirmed adduct formation
to be a result of MA of NBT onto the BQ ring with vinylic substitution also occurring for
chlorine-substituted derivatives. The binding positions on BQ and NBT/BQD
stoichiometric ratios were affected by whether the inductive effects of the substituents on

ii
the ring were positive or negative. The reactivity of BQ and BQD is discussed in terms of
the potential relationship to allergenic potency. Hammett and Taft (HT) constants were
then used to estimate the influence of these substituents on chemical reactivity. HT values
demonstrated chlorine substituted BQD to be more reactive than methyl substituted BQD.
BQ and BQD dermal allergenicity, as evaluated in the murine local lymph node assay,
(LLNA) was consistent with that predicted by reactivity and HT parameters. These
results demonstrate the effect of substituents on BQ reactivity and dermal allergic
sensitization, and suggest the potential utility of chemical reactivity data and HT values
for electrophilic allergen identification and potency ranking.

iii
DEDICATION
This thesis is dedicated to my treasure:
My Lord and Savior Jesus Christ

iv
ACKNOWLEDGEMENTS
First and foremost I would like to thank my graduate advisor Prof. Reuben H.
Simoyi and my two co-advisors and mentors, Dr. Paul D. Siegel and Dr. Itai Chipinda,
for their guidance and invaluable support throughout my studies at Portland State
University. Your comments were fruitful, stimulating and enriching.
I would like to thank the members of my dissertation committee: Drs. Bradley A.
Buckley, Shankar B. Rananavare, Robert M. Strongin and Andrea M. Goforth for all of
their contributions toward the completion of my Ph.D work and requirements. I say a big
thank you to the faculty, staff and members of the PSU Chemistry Department for the
support I got during studies.
I would also like to express my sincere gratitude to the department for the
uninterrupted financial support, to the National Science and Foundation (Grant Number
CHE 1056311) and to the NIEHS/NIOSH Inter Agency Agreement (Y1-ES-0001)
support in part, all through the years of my study. I finally say a big thank you to Simoyi
research group (SRG) members present and past for their advice and support.
To my “best friend” and son Ariel MacWilbes Mbiya, I joined your company when
writing my dissertation. My profound gratitude goes to my parents (Ephta Mbiya and
Tsitsi Mbiya) and my sisters (Primrose, Linda and Judith) for their trust and for believing
in my success.

v
Finally and above all, I give all the glory and honor to my Lord and Savior; the
King of Kings and the Lord of Lords, Jesus Christ.

vi
TABLE OF CONTENTS
ABSTRACT ........................................................................................................................ i
DEDICATION.................................................................................................................. iii
ACKNOWLEDGEMENTS ............................................................................................ iv
LIST OF TABLES ........................................................................................................... ix
LIST OF FIGURES .......................................................................................................... x
LIST OF SCHEMES ...................................................................................................... xii
LIST OF ABBREVIATIONS ....................................................................................... xiii
CHAPTER ONE: INTRODUCTION AND RATIONALE .......................................... 1
1.1 Use of Quinones ........................................................................................................ 2
1.2 Development of Allergic Contact Dermatitis............................................................ 3
1.3 Develop Non-animal Based Assays .......................................................................... 5
1.4 Reaction Mechanisms of Protein Binding ................................................................. 7
1.5 Benzoquinone Chemistry .......................................................................................... 8
1.5.1 Michael Addition Reactions ............................................................................. 10
1.5.2 Free Radicals in Biology .................................................................................. 12
1.5.3 Conjugation via MA versus Free Radical Mechanism ..................................... 12
1.6 BQ Reactivity and SS Potency ................................................................................ 13
CHAPTER TWO: INSTRUMENTATION, MATERIALS AND METHODS ........ 16
2.1 INSTRUMENTATION ......................................................................................... 16
2.1.1 Conventional UV/Vis Spectrophotometry ........................................................ 16
2.1.2 Stopped Flow Spectrophotometry .................................................................... 16
2.1.3 Nuclear Magnetic Resonance Spectrometry (NMR) Spectroscopy ................. 18
2.1.4 Electron Paramagnetic Resonance (EPR) Spectroscopy .................................. 21
2.1.5 Electrospray-Ionization Mass Spectrometry (ESI-MS) .................................... 23
2.2. MATERIALS AND METHODS......................................................................... 25
2.2.1 Chemicals ......................................................................................................... 25

vii
2.2.2 Thiol Binding Determination............................................................................ 25
2.2.3 Preparation of Reduced Thiols ......................................................................... 27
2.2.4 Extent of BQ Binding to Cys34 in HSA........................................................... 27
2.2.5 Extent of BQ Binding to Primary Amines in HSA .......................................... 28
2.2.6 Whole Human Fresh Blood Collection and Serum Separation ........................ 28
2.2.7 BQ and BQD Binding Kinetic Studies ............................................................. 29
2.2.8 Sample preparations and solvents used in Electron Paramagnetic Resonance
(EPR) Spectroscopy ................................................................................................... 30
2.2.9 Sample Purification Methods for Samples used for Mass Spectroscopy and
Nuclear Magnetic Resonance .................................................................................... 30
2.2.10 Approach for QSAR Analysis ........................................................................ 31
2.2.11 Local lymph node assay ................................................................................. 32
2.2.12 Statistical Analysis ......................................................................................... 34
CHAPTER THREE: REACTIVITY AND FREE RADICAL FORMATION ......... 35
3.1 INTRODUCTION ................................................................................................. 35
3.2 RESULTS ............................................................................................................... 36
3.2.1 HSA Thiol-BQ Reactions ................................................................................. 36
3.2.2 BQ reactivity to Primary Amines in HSA ........................................................ 37
3.2.3 Serum Thiol – BQ Reactivity ........................................................................... 38
3.2.4 NBT-BQ/BQD Reactions ................................................................................. 39
3.2.5 Benzoquinone Derivatives and Free Radical Formation .................................. 47
3.2.6 The Effect of pH on Radical formation ............................................................ 49
3.2.7 EPR Spectrum Simulations .............................................................................. 52
3.2.8 NBT Effect on SQ Radical Formation ............................................................. 53
3.3 DISCUSSION ........................................................................................................ 54
3.4 CONCLUSION ...................................................................................................... 61
CHAPTER FOUR: CHARACTERISATION OF ADDUCTS AND REACTION
MECHANISMS............................................................................................................... 62
viii
4.1 INTRODUCTION ................................................................................................. 62
4.2 RESULTS AND DISCUSION .............................................................................. 63
4.2.1 Characterization of BQD-NBT Adducts .......................................................... 64
4.2.2 Reaction Mechanisms ....................................................................................... 68
4.3 CONCLUSION ...................................................................................................... 69
CHAPTER FIVE: LOCAL LYMPH NODE ASSAY AND QUALITATIVE
MECHANISTIC MODELS ........................................................................................... 70
5.1 INTRODUCTION ................................................................................................. 70
5.1.1 Local Lymph Node Assay ................................................................................ 70
5.2 RESULTS ............................................................................................................... 72
5.2.1 LLNA: Allegenicity Assessment ...................................................................... 72
5.2.2 Correlation Analysis of Reactivity Data with LLNA EC3 Values ................... 77
5.2.4 NBT-BQ/BQD Reactions ................................................................................. 78
5.2.5 Prediction of EC3 Values from Reactivity Data .............................................. 79
5.2.6 Quantitative Mechanistic Modeling (QMM) .................................................... 80
5.3 DISCUSSION ........................................................................................................ 85
5.4 CONCLUSION ......................................................................................................... 89
REFERENCE LIST ........................................................................................................ 91

ix
LIST OF TABLES
Table 1.1: Common Mechanistic Domains (Nu is nucleophile and Pr is for protein) ....... 8
Table 3.1: Rate Constants Derived from the Initial Rate Methods for NBT-BQ/BQD
Reactions. .................................................................................................................. 46
Table 3.2: Rate Constants and Half Lives for BQ and BQD at pH 7.4 and 5.5............... 47
Table 3.3: Summary of Peak shift and g-factor Values. .................................................. 49
Table 5.1: Potency rating of skin sensitizers.................................................................... 71
Table 5.2: Predicted EC3 Values from Reactivity Data .................................................. 78
Table 5.3: Substituent Constants, σ- and σ* Used to Calculate Values in Table 5.3 ...... 80
Table 5.4: Calculated Σσ- and σ* Values Used to Plot Figures 5.5 and 5.6 .................... 80

x
LIST OF FIGURES
Figure 1.1: Sensitization and elicitation phases of ACD. .................................................. 5
Figure 1.2: Shows the uneven distribution of π-electrons. ................................................ 9
Figure 1.3: Alkylation(by R)and redox cycling of quinone, generating adducts and ROS.
................................................................................................................................... 10
Figure 1.4: Examples of Michael acceptor compounds. .................................................. 11
Figure 1.5: Benzoquinone and methyl or t-tert-butyl substituted benzoquinone
derivatives and Chlorine substituted benzoquinone derivatives used in this study. .. 14
Figure 2.1: Sample Handling Unit (SHU) ....................................................................... 18
Figure 2.2: Zeeman splitting of the two spin Eigenstates of an electron in an external
magnetic field. ........................................................................................................... 21
Figure 2. 3: Schematic representation of the electrospray ionization(ESI) process. ....... 23
Figure 3.1: Measurement of BQ binding to HSA Cys34 by loss of DTNB reactivity. . 37
Figure 3.2: Measurement of BQ binding to Serum thiol by loss of DTNB reactivity..... 38
Figure 3.3: Reaction of MBQ with NBT in 50% acetonitrile in a pH 7.4 ....................... 40
Figure 3.4: Initial rate vs. [2-MBQ] . ............................................................................... 41
Figure 3.5: Reaction of 2-CBQ with NBT in 50% acetonitrile in a pH 7.4 .................... 42
Figure 3.6: Initial rate vs. [2-CBQ].................................................................................. 43
Figure 3.7: Effects of chlorine substitution on BQ on EPR signal intensity ................... 48
Figure 3.8: The relationship between EPR signal intensity and rate constants ............... 50

xi
Figure 3.9: Schematic routes which lead to DMPO-SQ and DMPO-OH EPR active
adduct formation. ....................................................................................................... 51
Figure 3.10: Computer simulations ................................................................................. 52
Figure 3.11: Plot of depletion of DMPO-SQ signal versus [NBT] ................................. 54
Figure 4.1: Negative ESI-MS spectra of p-nitrobenzenethiol adduct(s) formation with
CBQ. .......................................................................................................................... 65
Figure 4.2: Negative ESI-MS spectra of p-nitrobenzenethiol adduct(s) formation with
MBQ. ......................................................................................................................... 67
Figure 5.1: Murine local lymph node assay (LLNA) for BQ and its derivatives (a): BQ,
2-CBQ, 2,5-DCBQ and 2,6-DCBQ, .......................................................................... 74
Figure 5.2:Murine local lymph node assay (LLNA) for BQ and its derivatives :2-MBQ,
2,6-DMBQ and tBBQ . ............................................................................................. 75
Figure 5.3: Stimulation index against concentration of CBQ. ......................................... 76
Figure 5.4: Plot of pEC 3 vs log ka.................................................................................. 77
Figure 5.5: Plot of pEC3 vs Taft Constant (Σσ*). ........................................................... 83
Figure 5.6: Plot of pEC3 vs Hammett Constant (σ-). ...................................................... 85

xii
LIST OF SCHEMES
Scheme 4.1: Reaction mechanisms for electron withdrawing and electron donating
substituted benzoquinones with NBT ........................................................................ 66
Scheme 4.2: The proposed MA reaction between MBQ and p-nitrobenzenethiol .......... 68
Scheme 4.3: The proposed reaction between CBQ and p-nitrobenzenethiol ................... 68
Scheme 5.1: Michael addition reaction mechanism for methyl/tert-butyl substituted
benzoquinone derivatives with thiol containing proteins .......................................... 82
Scheme 5.2: Nucleophilic vinylic substitution reaction mechanism for chlorine
substituted benzoquinone derivatives with thiol containing proteins ........................ 82

xiii
LIST OF ABBREVIATIONS
2,5-DCBQ 2,5-dichloro-p-benzoquinone
2,5-DMBQ 2,5-dimethyl-p-benzoquinone
2,6-DCBQ 2,6-dichloro-p-benzoquinone
2-CBQ
2-chloro-benzoquinone
2-MBQ 2-methyl-p-benzoquinone
2-tBBQ 2-tertbutyl benzoquinone
ACD
allergic contact dermatitis
BQ
1,4-benzoquinone (p-benzoquinone)
BQD
benzoquinone derivatives
DI
di-imine
DPM
disintegrations per minute
DTH
delayed-type hypersensitivity
DTNB
5,5'-dithiobis-(2-nitrobenzoic acid)
DTT
Dithiothreitol
EC3
effective concentration inducing a 3 fold stimulation index over
vehicle control
EDG
electron donating group
EPR
electron paramagnetic resonance
EWG
electron withdrawing group
HSA
human serum albumin
ICD
irritant contact dermatitis
LCAOMO linear combination of atomic orbital –molecular orbital

xiv
LLNA
local lymph node assay
MA
Michael Acceptor
MHC II Major histocompatibility complex 2
NBT
4-nitrobenzenethiol
NEM
N-ethylmaleimide
PBS
phosphate buffered saline
PPD
para-phenylenediamine
SQ
semiquinone
SS
skin sensitization

1
CHAPTER ONE
INTRODUCTION AND RATIONALE
Allergic contact dermatitis (ACD) is caused by a wide range of chemicals after
prolonged or repeated contact with the skin. Dermal exposure to chemicals can either be
intentional (drugs and cosmetics), or unintentional (environmental pollutants and
occupational exposure) resulting in ACD and other skin disorders which include irritant
contact dermatitis (ICD) and in some cases immediate (Type I) allergic reactions
(urticarial reactions). In developed countries, 15–20% of the population is allergic to one
or more chemicals in their environment.1 Contact allergies are relevant in 20–50% of
recognized occupational contact dermatitis cases and it is estimated that ACD accounts
for 7% of all occupation related diseases.2,3
Several hundreds of chemicals have been
shown to possess the ability to induce skin sensitization and ACD remains an important
occupational and environmental health problem.4 There is no cure for ACD, and the
pharmacological treatment still only targets the symptoms (e.g., anti-inflammatory
corticosteroids). As an acquired disease, ACD is episodic and only avoidance of the
offending agent can prevent elicitation of an ACD reaction.5 Over 13 million workers in
the US are believed to be at risk from exposure to chemicals that are potential skin
sensitizers and the level of compensation due to occupational contact dermatitis has been
estimated to be greater than $1 billion/yr.6 The main causes of ACD in the USA are the
members of the Rhus genus (poison ivy, poison oak, and poison sumac),

2
paraphenylenediamine, nickel, rubber compounds and ethylenediamine hydrochloride.3,5
Quinones and quinone derivatives are another large group of chemicals that are widely
used and amongst the most common contact allergens. ACD can develop anywhere on
the body depending on exposure, but the hands are the sites most commonly exposed to
chemicals and are thus most affected.
1.1 Use of Quinones
The use of quinone has traditionally been limited to dye production. More
recently the utility of quinones has increased and become widespread. Quinones have
been reportedly used as analytical reagents,7 polymer modifiers,
8 photoresistors,
9 and
catalysts.10
In agriculture they are being used as herbicides, fungicides, and plant-growth
regulators. BQ and BQD are broadly used in tanning, dyes, production of chemicals (e.g.,
hydrogen peroxide), cosmetics and nonprescription forms of skin lightening cosmetics.11-
13 BQ is also used in hydroquinone production and as an intermediate in the production of
a variety of substances, including rubber accelerators and oxidizing agents.14-16
To date,
pharmaceutical applications of quinones have developed enormously, not only with the
discovery of the vitamin Κ group, but also as the basic subunit which has found
prominent applications in drugs such as antibiotics,11
antitumor compounds,17,18
and as
antimalarial agents.19
Quinones are also used extensively in temporary tattoo and hair dyes. The use of
temporary tattoos and hair dyeing has become more fashionable, not only among adult
women but also among adult men, teenagers, and children.20
Adverse skin reactions to

3
hair dyes also were reported in about 5% of individuals who have ever used hair dye and
many of the hair dyes contain potent haptens such as para-phenylenediamine (PPD) and
related substances.21
PPD is believed to be a pro-electrophilic sensitizer (prohapten)
which can be oxidized either abiotically or enzymatically to a di-imine (DI), the nitrogen
analogue of BQ, which can either act as a Michael acceptor electrophile or undergo
hydrolysis to form BQ. Some BQDs, such as 2-tert-butyl-1,4-benzoquinone, are
commercially available for use in cosmetics and as insect feeding deterrents on plants.22
Quinones are a large class of compounds endowed with rich and fascinating chemistry.23
Environmentally, quinones are conserved among living organisms2 as they are found in
arthropods, bacteria and plants. Quinones also play a pivotal role in biological functions,
such as oxidative phosphorylation and electron transfer. Their role as electron transfer
agents in primary metabolic processes like photosynthesis and respiration is vital to life.
Quinones and quinine derivatives are most widely used as chemical defensive agents by
arthropods, millipedes, beetles, arachnids and termites. Due to their industrial utility and
natural abundance, it is most likely that the commercial use of quinones is going to
persist and become more prominent. A larger percent of the world population will be thus
exposed to BQ and BQD due to this widespread use of BQ and its products from homes
to agriculture to industries.
1.2 Development of Allergic Contact Dermatitis
Development of ACD occurs in two steps (Figure 1.1); the first phase, termed induction
or sensitization phase, occurs during the initial exposure to the offending chemical. Upon
chemical absorption into the skin, this induction phase involves protein haptenation

4
(reactivity), antigen presentation and development of antigen-specific T cells in draining
lymph nodes. The second phase, termed elicitation, occurs with re-exposure to the
chemical allergen (hapten) resulting in migration of activated antigen-specific T cells to
the site of exposure. Macrophages are recruited to the site of secondary contact, where
interactions between T-cells and antigen-presenting cells can take place directly in the
epidermis, thus initiating the inflammatory process, as shown in the elicitation stage in
Figure 1.1. The allergic reaction is manifested as skin inflammation, edema and eczema.
In both phases of ACD, the reaction of a low molecular weight chemical (<5000 Da) with
epidermal protein/s resulting in an immunogenic adduct is the molecular initiating event
(MIE) leading to immunological induction and elicitation of the allergic pathology.
As such, the chemicals are too small to cause an immune response thus the need
to haptenate endogenous proteins or peptides of the skin epidermis.25
Lipophilicity (logP
∼2) to enable the chemical to pass through the skin epidermis26
is a helpful aspect
distinguishing skin sensitizers from non-sensitizers. ACD is regarded as a delayed
hypersensitivity reaction (type IV hypersensitivity), because the mechanism requires 24-
72 hours from exposure to full development, where development is mediated by antigen-
specific T-lymphocytes.26
A number of reviews have discussed the pathogenesis of ACD
in greater detail.27-29

5
Figure 1.1: (Adapted from Basketter, et al. 2000) 24
Sensitization and elicitation phases
of ACD. (1) Binding of haptens to epidermal proteins and other macromolecules. (2)
Internalization of hapten-modified protein by Langerhans cells (LC)s. (3) Hapten-
induced activation of LCs that migrate to the lymphatic system and process hapten–
protein complexes as they mature into dendritic cells (DC)s. (4) Presentation of the
hapten-protein complex (antigen) by DCs to naive T-cells. (5) Proliferation of antigen
specific T-cells resulting in formation of memory T-cells. (6) Antigen-specific memory T-
cells leave the lymph node and enter the circulation. (7) Re-exposure to the hapten. (8)
Release of cytokines and chemokines attracting cells to the skin from the circulation. (9)
Inflammatory response within 24–72 hours with resultant symptoms of ACD.
1.3 Develop Non-animal Based Assays
It is very important that the safety of all chemicals encountered in occupational
settings and as ingredients in consumer products be tested with respect to skin
sensitization. Existing animal based assays such as the LLNA,30
which is based on the

6
proliferation of lymph node cells in the induction phase or the mouse ear swelling test
(MEST)30
and the Guinea Pig Maximization Test (GPMT)31
which is based on the
observation of the allergic responses in the elicitation phase of ACD, are widely used to
screen for allergenic chemicals. Recent mandates in the US and Europe, under which
committees such as the Interagency Coordinating Committee for the Validation of
Alternative Methods (ICCVAM)32
and the European Centre for Validation of Alternative
Methods (ECVAM),33
respectively, function, have increased emphasis on the
development of non-animal methods for skin sensitization testing. Elsewhere, the
Canadian Domestic Substance List, the European Union’s Registration, Evaluation,
Authorisation and Restriction of Chemicals (REACH) and Cosmetics regulations, the
Japanese Chemical Substance Control Law are other legislations that have necessitated
the need for alternative methods that are anchored on robust science.34
In vitro cellular
assays35-37
and peptide binding assays38
have been reported as potential replacements for
animal based assays. The human Cell Line Activation Test (h-CLAT) and the Direct
Peptide Reactivity Assay (DPRA) are notable examples of non-animal based assays that
have been nominated to ICCVAM and ECVAM, and are undergoing validation before
they can be adopted as alternative methods.39
Other reactivity assays utilizing cysteine,
lysine, glutathione, and several model peptides have been developed and efforts are
underway to validate them as alternative in chemico methods for screening skin
sensitizers.40-42
Despite the headway that some of the current alternative assays have
made in providing data that can be utilized to screen sensitizing chemicals with sufficient
confidence there are challenges that these current methods have not been able to address
including an in-depth understanding of the chemistry behind the reactivity assays. This

7
expertise is required to produce qualitative and quantitative data and also for
determination of appropriate solvent systems for reactivity assessment. All aspects of
reactivity such as selectivity (i.e., toward a particular amino acid target), reaction rate and
the stability of the conjugate need to be considered in developing in chemico assays as it
is often difficult to determine which aspect is relevant for in vivo potency. While most
chemicals with reactive electrophilic centers will form covalent adducts with proteins,
mechanistic pathways are different for different chemicals and this may determine the
type and strength of adduct formed. The major limitation of the existing models in
predicting or screening is their failure to predict the effects that substituents may have on
the parent hapten. Do inductive effects result in lack of/decreased or increased skin
sensitization potency of the derivative? Can these effects be included in developing an
alternative model that can accurately predict potency as shown in the LLNA? The current
alternative methods also lack the distinctive categorization of chemicals into their
respective mechanistic domains.
1.4 Reaction Mechanisms of Protein Binding
Mechanistic domains are functional reaction groups that are targeted as alerting
pointers to a chemical’s possible reaction with a protein and thus allow classification of
chemicals based on their reaction chemistry. There are about 50 specific reactive protein
binding mechanisms,43
which can be clustered under the general mechanisms shown in
Table 1.1, illustrating the common mechanistic domains and the electrophilic centers
amenable to nucleophilic attack. More extensive analysis of mechanistic domains, their
subcategories and ‘special cases (domain not clearly defined or >1 domain for a single

8
chemical)’ have been discussed in recent reviews40,44,45
and need to be utilized in
categorization of test chemicals.
Table 1.1: Common Mechanistic Domains (Nu is nucleophile and Pr is for protein)
Mechanistic Domain
Michael
Acceptors
Acylating
Agents
Schiff Base
Formers
SNAr
Electrophiles
SN1/SN2
Electrophiles
Nu -P
r
X
X = electron
withdrawing
group.
Nu -P
r
O
X
X = electron
withdrawing
and a good
leaving group.
Nu
-Pr
O
Attacking
nucleophile is
an amine (NH2-
) group.
Nu -Pr
X
...Y2,Y1
X = usually a
halogen or
pseudohalogen.
Y1,Y2 = electron
withdrawing group.
X = usually
electron
withdrawing
and a good
leaving group.
1.5 Benzoquinone Chemistry
BQ (which was first synthesized in 1838)46
and BQD present an attractive model
to study in terms of nucleophile reactivity and the contribution of substituents on the ring
to BQ reactivity and potency. Quinones are conjugated cyclic diketones rather than
aromatic compounds. Linear Combination Atomic Orbital-Molecular Orbital (LCAO-
MO) calculations for BQ have shown that the distribution of π-electron density is very
uneven, as depicted in Figure 1.2.
9
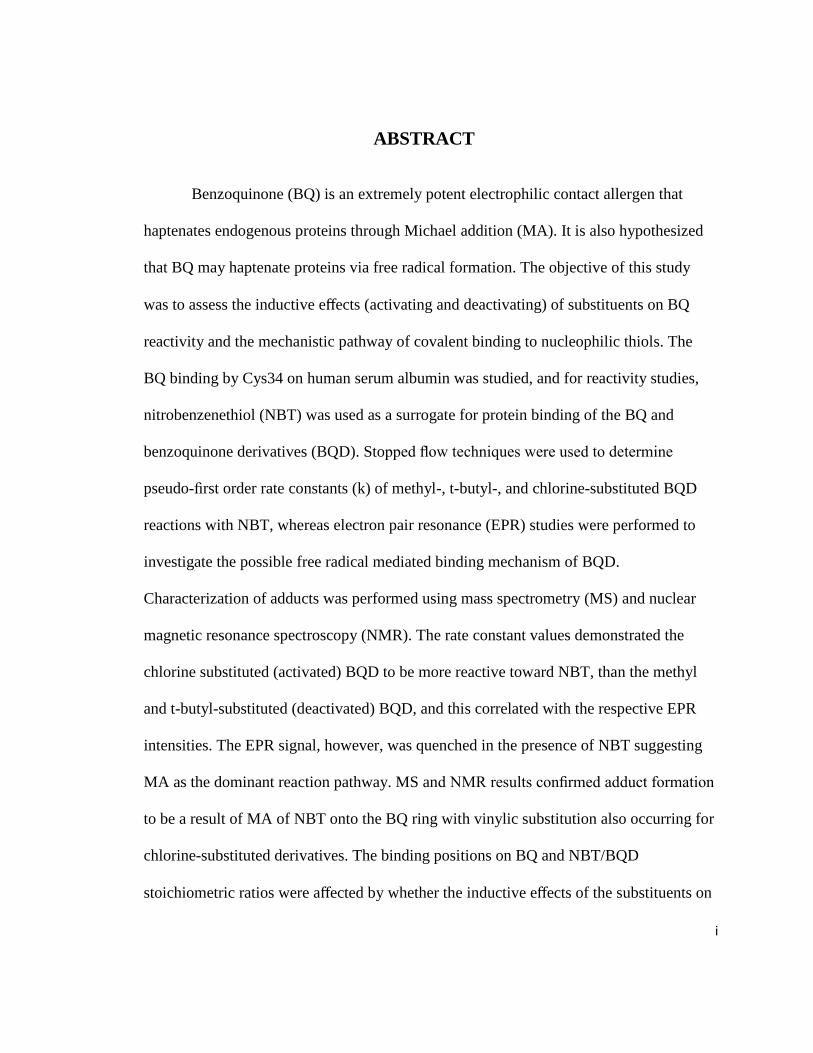
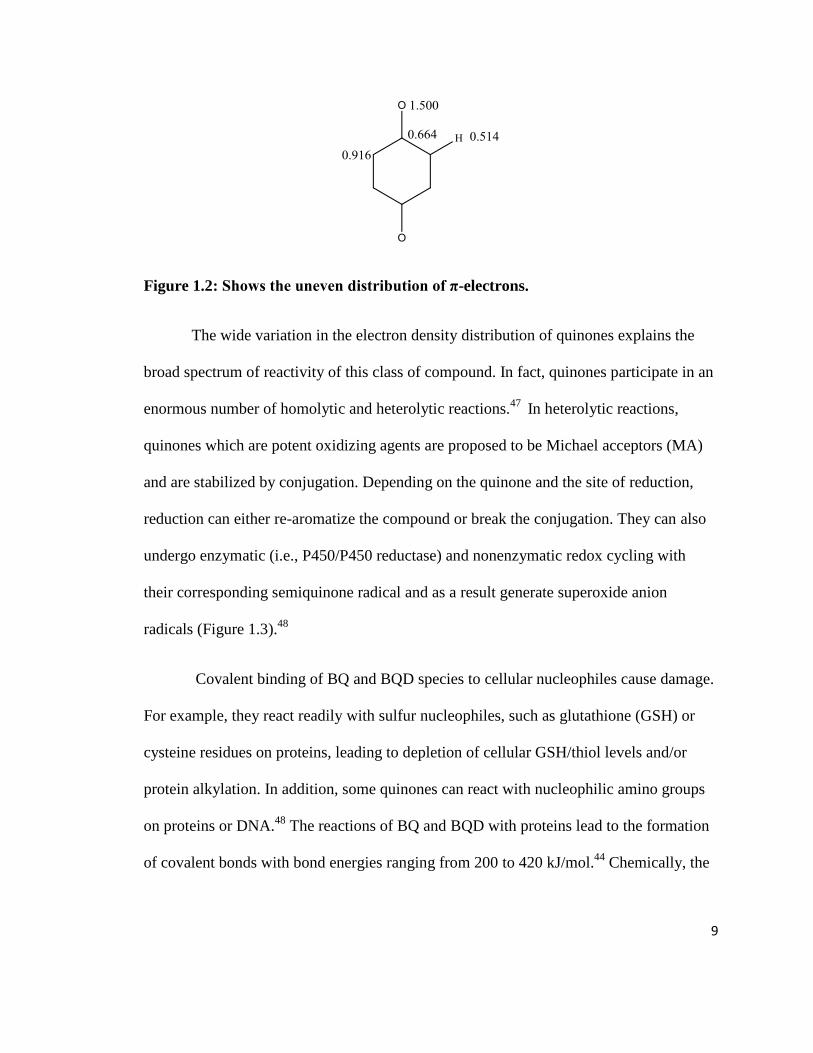
Figure 1.2: Shows the uneven distribution of π-electrons.
The wide variation in the electron density distribution of quinones explains the
broad spectrum of reactivity of this class of compound. In fact, quinones participate in an
enormous number of homolytic and heterolytic reactions.47
In heterolytic reactions,
quinones which are potent oxidizing agents are proposed to be Michael acceptors (MA)
and are stabilized by conjugation. Depending on the quinone and the site of reduction,
reduction can either re-aromatize the compound or break the conjugation. They can also
undergo enzymatic (i.e., P450/P450 reductase) and nonenzymatic redox cycling with
their corresponding semiquinone radical and as a result generate superoxide anion
radicals (Figure 1.3).48
Covalent binding of BQ and BQD species to cellular nucleophiles cause damage.
For example, they react readily with sulfur nucleophiles, such as glutathione (GSH) or
cysteine residues on proteins, leading to depletion of cellular GSH/thiol levels and/or
protein alkylation. In addition, some quinones can react with nucleophilic amino groups
on proteins or DNA.48
The reactions of BQ and BQD with proteins lead to the formation
of covalent bonds with bond energies ranging from 200 to 420 kJ/mol.44
Chemically, the

10
skin can best be described as a nucleophilic environment, rich in water and lipids with
electron-rich nucleophilic functional groups present on the proteins.
Figure 1.3: Alkylation(by R)and redox cycling of quinone, generating adducts and ROS.
Asterisk indicates that this reaction only occurs for quinones with autoxidase.48
1.5.1 Michael Addition Reactions
Among the molecular mechanisms that lead to the molecular initiating events of
protein alteration is Michael addition, which results in the formation of covalent adducts
at a soft electro(nucleo)philic centers without expulsion of leaving groups from the
molecules. Electrophiles acting in this manner are typically organic materials that contain
olefinic π-bonds polarized by a neighboring electron-withdrawing substituent.
Electro(nucleo)philic interactions of Michael acceptors include the addition of an -SH

11
group to the β–carbon atom (β-C atom) of a carbon–carbon double (C=C) or triple (C C)
bond. Having a polarized R group and an unsaturated configuration results in a relatively
diffuse and polarizable electron density of the olefinic π-bond, placing Michael acceptors
among the softest electrophiles.49
Benzoquinone (BQ) is thus chemically reactive as a
Michael acceptor electrophile. Identification characteristics of a Michael acceptor include
a double or triple bond with an electron-withdrawing substituent X, such as –CHO, -
COR, -CO2R, -CN, -SO2R, or -NO2,50
where R is a hydrocarbon as shown by examples in
Figure 1.4.
Figure 1.4: Examples of Michael acceptor compounds.

12
1.5.2 Free Radicals in Biology
Free radicals are reactive atoms, ions or molecules that have an odd number of
electrons in one of their orbitals and have the ability of independent existence.50
The
presence of unpaired electrons makes radicals readily react with a wide range of
molecules in a way as to fill their half empty orbitals with electrons.51
The mechanism of
free radical production is an endless chain, which produces many free radicals that are
responsible for oxidative stress in the biological systems.
It has long been known that electron acceptors such as quinine(Q) and its
derivatives are reduced in the presence of an electron donor like hydroxide ion (OH-) to
yield the corresponding one-electron reduced radical species and semiquinone radical
(SQ•-)52
anions. The semiquinone radicals are strong reducing agents in aqueous solution
at physiological pHs and reduce dissolved oxygen to form superoxide and other
biologically active reactive oxygen species (ROS).53
In relation to ACD, free radical
mechanism may be one of the mechanisms through which contact allergens bind proteins
even though evidence implicating free radical formation in ACD is scant.
1.5.3 Conjugation via MA versus Free Radical Mechanism
The hyperfine coupling constant, An, is directly proportional to the probability of
finding the unpaired electron at the nucleus, n. Hyperfine couplings observed in EPR
spectra of the radical anion of a molecule are also related to the site of reaction of
nucleophiles on the neutral molecule. When the unpaired electron is in a conjugated π

13
molecular orbital consisting of aromatic carbons or hetero atoms, the McConnell equation
(equation 1.1) predicts the 1H hyperfine coupling constant, AH:
AH = Qρ (1.1)
where Q is 25 + 5 G for carbon, and ρ is the unpaired π-electron density at the aromatic
carbon nucleus to which the H atom is bonded. This means that the hyperfine couplings
are related to the spin densities at a given site through the McConnell equation.54
The
singly occupied orbital of the radical anion is the lowest unoccupied molecular orbital
(LUMO) of the neutral molecule. Thus, the site of largest hyperfine coupling in the
radical anion is also the site of attack of a nucleophile on the neutral molecule. This
means that there is a relationship between MA and radical anions,55
and the studies herein
investigate this link.
1.6 BQ Reactivity and SS Potency
The use of in vivo methods to screen allergenic chemicals requires a large number
of animals. Thus, the goal of these reactivity studies is to enable screening of chemicals
for skin sensitizing potential without or with minimal use of animals. Epidermal
absorption of a chemical and its subsequent reactivity is influenced by physicochemical
parameters, such as octanol-water partition co-efficients and substituent effects.
Measuring reactivity rates is a direct way of quantifying the contribution of
physicochemical parameters, which could otherwise be estimated mathematically from
the known mechanism of action, applying established principles of chemistry.56
In this
study, the derived reactivity constants were correlated with skin sensitization potency,

14
quantified by the murine LLNA data on BQ and BQD electrophiles. Another set of
predicted EC3 values from a quantitative mechanistic model (QMM) was based on the
Hammett (σ-) values for the activating and deactivating groups and the Taft (σ*) values
for the leaving group. These values were integrated into the QMM equations for Michael
acceptors to predict the EC3 values for the BQD. Thus the other aim in this study is to
gather further evidence regarding the role of reaction chemistry in determining skin
sensitization potency, by developing a targeted QMM for LLNA data on BQD which are
in MA domain.
Figure 1.5: Benzoquinone and methyl or t-tert-butyl substituted benzoquinone derivatives
and Chlorine substituted benzoquinone derivatives used in this study.

15
In order to analyze how chemical reactivity and sensitizing capability depend on
the structure of the contact allergen BQ, a series of structural derivatives of BQ (Figure
1.5) was used. Their reactivity was evaluated via experiments with a thiol (NBT) and
changes in absorbance due to depletion of thiol were monitored. To investigate if the
sensitizing potency of these analogues is related to their reactivity an animal model
(LLNA) was used.
The goal of this project was to investigate and determine the inductive effects of
substituents on benzoquinone reactivity and subsequent skin sensitizing potency. The
inductive effects on BQD were used to develop a chemical reactivity based predictive
model for skin sensitization, which was evaluated using the murine local lymph node
assay (LLNA), a well accepted assay for allergen identification. The aims of this thesis
were; (i) to determine the potential reaction mechanisms and the relative rate constants of
BQ and BQD binding to NBT as a surrogate for protein haptenation and (ii) to perform
LLNA for BQ and BQD to test the predictive power of the reactivity data and the
potential utility of the reactivity approach as an alternative method for identification of
skin sensitizers and potency assessment. The reactivity constants determined in (i) were
used to predict the LLNA EC3 (threshold dose) values for the BQD. Using BQ as a
positive control, the LLNA for six BQD (3 with electron withdrawing groups + 3 with
electron donating groups) was performed and the determined EC3 values compared with
the predicted EC3 values from a previously published reactivity assay.57
Finally the BQD
were ranked according to their skin sensitization potency was performed.

16
CHAPTER TWO
INSTRUMENTATION, MATERIALS AND METHODS
2.1 INSTRUMENTATION
2.1.1 Conventional UV/Vis Spectrophotometry
Reactions which occur in minutes were measured using either a Perkin Elmer
Lambda 25 UV/Vis spectrophotometer or a Beckman DU800 both featuring a double-
beam, total reflection system within the range 200 to 800 nm. For instruments,
holographic grating was used as the monochromator and two radiation sources, a
deuterium lamp (UV) and a halogen lamp (visible range) were used in sequence as the
polychromator light sources. The Perkin Elmer spectrophotometer was interfaced to a
Pentium III computer and uses the UV WinLab Software for data collection and analyses
while the Beckman spectrophotometer is interfaced to an IBM PC computer and used the
DU Series 800 Software. Path length of the cuvette was 1 cm. The Beckman spectrometer
gave the option of using either a single cell holder or a multi-cell holder (maximum of 6),
depending on the experiment. Constant temperature was maintained by use of a
circulating water bath attached to the cell holders.
2.1.2 Stopped Flow Spectrophotometry
All rapid reactions (with time scales as short as 2-10 seconds) were measured
using the stopped-flow technique, which can follow reactions with time scales as short as

17
milliseconds. The Hi-Tech Scientific SF61 – DX2 Double mixing stopped-flow
spectrophotometer was used for the acquisition of absorbance data. The instrument was
interfaced to a Pentium III computer via a 413 kHz 16 bit A/D converter to enable the
conversion of data to digital form. A high efficiency mixer mix small volumes of
solutions, which were driven into it from high performance syringes. Small volumes of
solutions are driven from high performance syringes through high efficiency mixer(s).
The sample handling unit (Figure 2.1) facilitates both the single mixing of two reagents,
using only one of the drives, and double mixing of three reactants by a push-push mode
of operation. Double mixing mode enables transient species formed by mixing reactants
in A and B to be subsequently mixed with a third reactant, C, after a delay period.
Reactant reservoir D is reserved for the buffer and this will push the premixed solutions
A and B (from mixer 1) to a second mixer (mixer 2) where it reacts further with reactant
C. The resultant mixture passes through a measurement flow cell and into a stopping
syringe where the flow is stopped. Just prior to stopping, a steady state flow is achieved.
The solution entering the flow cell is only milliseconds old. The age of this reaction
mixture is also known as the dead time of the stopped-flow system. As the solution fills
the stopping syringe, the plunger hits a block, causing the flow to be stopped
instantaneously. Reactions in which three or more reactants that require separate mixing
prior to introduction into the observation chamber are analyzed using the double mixing
feature of the SF61- DX2. The kinetics of the reaction can be measured in the cell using
the appropriate techniques.58

18
Figure 2.1: Sample Handling Unit (SHU) flow circuit diagram for the SF61-DX2 Hi-
Tech KinetAsyst stopped-flow spectrometer. [Courtesy of Hi-Tech Scientific operator’s
Manual]58
2.1.3 Nuclear Magnetic Resonance Spectrometry (NMR) Spectroscopy
Structural characterization and verification of products and intermediates were
conducted using a Bruker AMX-400 MHz Nuclear Magnetic Resonance (NMR)
spectrometer. Each atom possesses a nucleus surrounded by an electron cloud. For the

19
hydrogen atom, the nucleus is composed of a single proton which possesses a property
called spin. Nuclei such as the hydrogen nucleus, with unpaired spins of protons and
neutrons, will possess an overall nuclear spin, thus creating a nuclear magnetic dipole
moment, where the inherent magnitude of the dipole is a nuclear property commonly
referred to as the dipole moment, μ. Thus, if the nucleus is placed in a magnetic field, the
nuclear dipole moment will proceed about the magnetic field. The z component of the
nuclear magnetic moment of the nucleus can either be aligned parallel to the external
field (low energy) or can be anti-parallel to the external field (high energy). A particle in
the low energy state can be excited to the higher energy state, when it absorbs a photon of
frequency , where the energy of the photon is the difference in energy between the
two states given by
E = h (2.1)
The variable is also known as the Larmor frequency or resonance frequency.59
Hence it is the nuclei of atoms that are involved in the absorption process in NMR, unlike
in UV/Vis and IR absorption. The signal in NMR spectroscopy is due to the disparities in
the energy absorbed by the nuclei as they are excited from the lower energy state to the
higher energy state, and the energy emitted by the nuclei as they relax from the higher
energy state to the lower energy state.59
The intensity of the signal is proportional to the
population difference between the two states and the area under a given peak is directly
proportional to the number of that type of protons in the molecule. The frequency of
electromagnetic radiation necessary for resonance to occur depends on both the strength

20
of the external magnetic field, and on the characteristics of the nucleus being studied.59
The electron cloud surrounding the nucleus tends to shield it from the full strength of the
applied magnetic field. The greater the electron density, the greater the shielding, thus
nuclei which are in electron-rich environments will undergo transition at a higher applied
field than nuclei in electron-poor environments.
Similarly, nuclei that are adjacent to electronegative atoms, are deshielded and
undergo transitions at a lower applied filed. The resulting shift in the NMR signal for the
given nuclei is referred to as the chemical shift.59
Spin-spin coupling59
occurs between
chemically inequivalent nuclei that are close enough to each other to exert an influence
on each other’s effective magnetic field, giving rise to the various splitting patterns
observed in an NMR spectrum. Such an effect is observable if the distance between the
chemically inequivalent nuclei is less than or equal to three bond lengths.59
In some
molecules, certain protons may appear to be inequivalent to other protons in a particular
rotamer, although they become equivalent if rapid rotation occurs. In some instances, this
does not remove the inequivalence and the protons can be interchanged via symmetry
operations. This inherent asymmetry may result in observable differences in the chemical
shifts.60
1H-NMR spectra were recorded with a Bruker AMX-400MHz spectrometer
using CDCl3 and D2O as solvents. Chemical shifts were reported as values in ppm
relative to CHCl3 (7.26) in CDCl3 and TMS which was used as an internal standard(0).61

21
2.1.4 Electron Paramagnetic Resonance (EPR) Spectroscopy
Electron Paramagnetic Resonance (EPR) was discovered in 1944 by E.K.
Zavoisky.62
The principles of EPR are quite analogous to those of NMR. Thus the
electron has an intrinsic magnetic moment (𝜇e = gβeS). Where g =2.0023, βe =
((eh)/(4πmc) = 9.27 x 10⁻²⁴
J T-1
(Bohr magneton, where e is the elementary charge, h is
the reduced Planck constant, m is the electron rest mass and is the speed of light) and S
= (1/2). The first order Zeeman Effect splits the two ms states of the unpaired electrons in
a paramagnetic material.
Figure 2.2: Zeeman splitting of the two spin Eigenstates of an electron in an external
magnetic field. The classical analogue to bar magnets is indicated on the right.

22
In EPR spectroscopy the energy differences, ΔE, due to interaction of unpaired
electrons in the sample with a magnetic field produced by a magnet are studied.
Absorption occurs when ΔE equals the microwave energy, hν.
Equation 2.2 and Figure 2.2 describe the general principle of EPR.
ΔE = hν = gβeH 2.2
where h is Planck’s constant, ν is microwave frequency, β is Bohr magneton (a constant
related to electron charge and mass), H is magnetic field at which resonance occurs and g
is a spectroscopic factor, which is a characteristic of a given paramagnetic center. The
shape and width of the spectral line as well as the hyperfine (splitting) and area under the
absorption curve are other important parameters in EPR spectroscopy. The area which is
the double integral of the 1st derivation curve is proportional to the amount of a given
paramagnetic center (spin) present in the resonator cavity of the EPR instrument.
EPR spectroscopy was carried out using a Bruker (Fremont, CA) EMX
spectrometer equipped with a high-sensitivity cavity and an Aqua-X sample holder.
Spectra were obtained at room temperature. Typical EPR parameters were as follows:
100 G sweep width (for the spin trapping experiments with 5,5-dimethyl-1-pyrroline N-
oxide, (DMPO)); 9.77 GHz microwave frequency; 32 mW power; 2×10⁵ receiver gain;
modulation frequency of 86 kHz; modulation amplitude of 2 G; with the conversion time
5 ms and time constant being 10 ms with 200 X-scans for each 512 point spectrum.
23
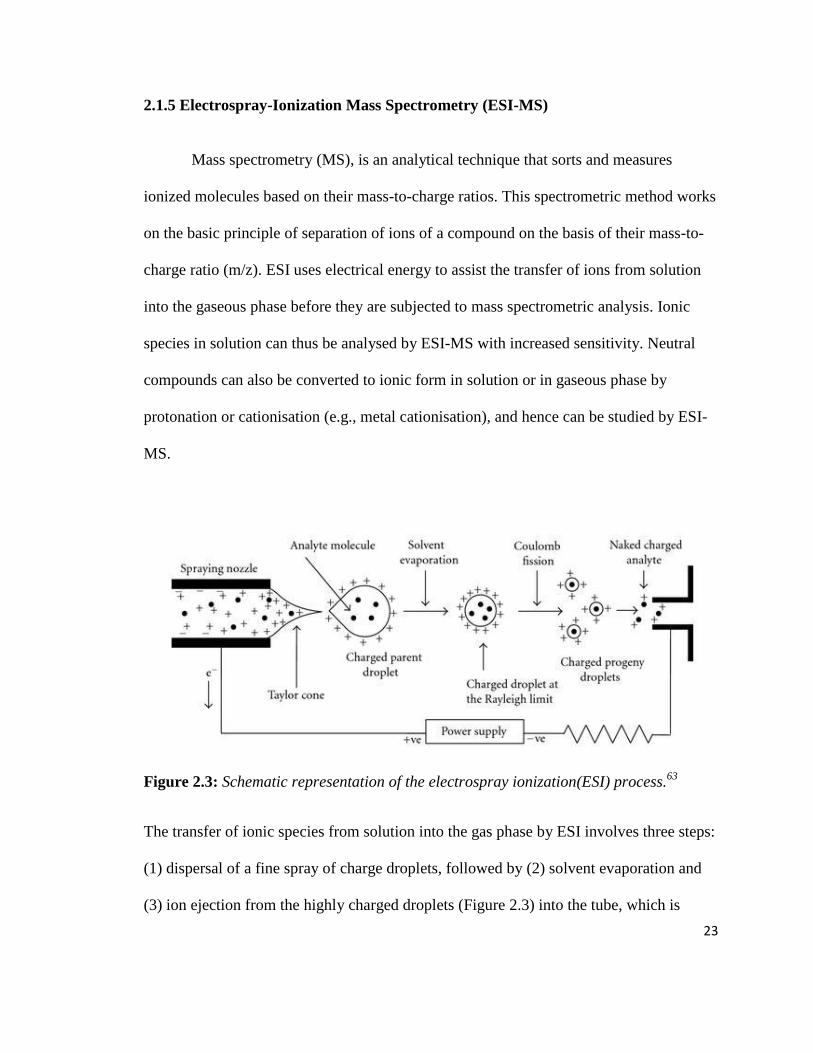
2.1.5 Electrospray-Ionization Mass Spectrometry (ESI-MS)
Mass spectrometry (MS), is an analytical technique that sorts and measures
ionized molecules based on their mass-to-charge ratios. This spectrometric method works
on the basic principle of separation of ions of a compound on the basis of their mass-to-
charge ratio (m/z). ESI uses electrical energy to assist the transfer of ions from solution
into the gaseous phase before they are subjected to mass spectrometric analysis. Ionic
species in solution can thus be analysed by ESI-MS with increased sensitivity. Neutral
compounds can also be converted to ionic form in solution or in gaseous phase by
protonation or cationisation (e.g., metal cationisation), and hence can be studied by ESI-
MS.
Figure 2.3: Schematic representation of the electrospray ionization(ESI) process.63
The transfer of ionic species from solution into the gas phase by ESI involves three steps:
(1) dispersal of a fine spray of charge droplets, followed by (2) solvent evaporation and
(3) ion ejection from the highly charged droplets (Figure 2.3) into the tube, which is

24
maintained at a high voltage (e.g., 2.5 - 6.0 kV) relative to the wall of the surrounding
chamber.
A mist of highly charged droplets with the same polarity as the capillary voltage
is generated. The application of a nebulizing gas (e.g. nitrogen), which shears around the
eluted sample solution, enhances a higher sample flow rate. The charged droplets,
generated at the exit of the electrospray tip, pass down a pressure and potential gradient
toward the analyzer region of the mass spectrometer. With the aid of an elevated ESI-
source temperature and/or another stream of nitrogen drying gas, the charged droplets are
continuously reduced in size by evaporation of the solvent, leading to an increase of
surface charge density and a decrease of the droplet radius. Finally, the electric field
strength within the charged droplet reaches a critical point at which it is kinetically and
energetically possible for ions at the surface of the droplets to be ejected into the gaseous
phase. The emitted ions are sampled by a sampling skimmer cone and are then
accelerated into the mass analyzer for subsequent analysis of molecular mass and
measurement of ion intensity. The mass spectrum is a graphical display of the relative
abundance of ion signals against the m/z ratios. It is a common practice that the highest
signal is taken as 100% abundance and all the other signals are expressed as a percentage
of this.64
Mass spectra of products from reaction mixtures were taken on a high-resolution
(m/∆m = 30 000) Thermo Scientific LTQ-Orbitrap Discovery mass spectrometer (San
Jose, CA) equipped with an electrospray ionization source. All mass spectrometer

25
samples were dissolved in MeOH/H2O (1:1) mixture. The ESI-MS source parameters
were set as follows: spray voltage of 2.5 kV, spray current of 1.96 µA, sheath gas flow
rate of 20, auxiliary gas flow rate of 0.01, capillary voltage of -16 V, capillary
temperature of 300 oC and tube lens of -115 V. Detection was carried out in the negative
ionization mode (-ESI) for 2 minutes in mass range m/z of 100-1000. The detection
parameters were set up as follows: Analyzer was fourier transform mass spectrometry
(FTMS), negative polarity; mass range was normal with resolution of 30 000 and scan
type was centroid.
2.2. MATERIALS AND METHODS
2.2.1 Chemicals
All chemicals were purchased from Sigma Chemical Co. (St. Louis, MO) and were used
without further purification unless otherwise noted.
2.2.2 Thiol Binding Determination
The method reported by Schultz et al.41
was used with slight modification.
Briefly, Ellman’s reagent (5,5'-dithiobis-(2-nitrobenzoic acid; DTNB)) and cysteine (5
mM) stock solutions were prepared in a 50 mM ammonium carbonate buffer (NH4)2CO3;
pH 7.4) buffer. Cysteine (Cys) standards from 50 to 250 μM were reacted with 1 mM
DTNB at room temperature in a total volume of 2 mL. Absorbance readings taken at 412
nm (𝝐412 nm = 14,150 M-1
cm-1
) after 15 min were plotted against the final cysteine
concentration to give the standard curve (Figure 2.4). This calibration curve was used to
26
determine Cys and glutathione (GSH) binding to BQ following reaction of 0.125 mM
Cys/GSH with 0.625 mM BQ for 2 h with subsequent addition of 0.625 mM DTNB for
15 min. The calibration curve was also used to determine human serum albumin (HSA)
reduced sulfhydryl concentration ([SH]/[HSA]) following reaction of 0.8 mg/mL (≈ 11.9
µM) HSA with 0.625 mM DTNB for 15 min with subsequent absorbance readings at 412
nm. BQ (0.625 mM) was incubated with 0.8 mg/mL (≈ 11.9 µM) HSA for 2 h with
subsequent addition of 0.625 mM DTNB to measure the loss of Cys34 reactivity.
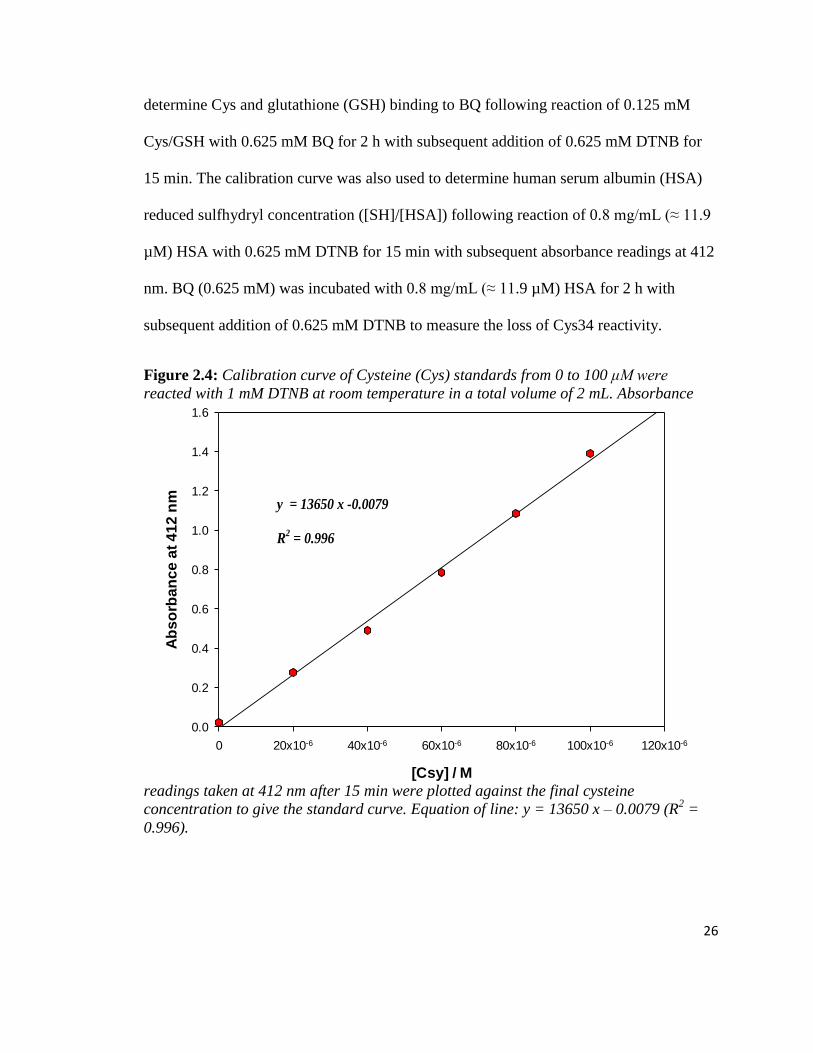
Figure 2.4: Calibration curve of Cysteine (Cys) standards from 0 to 100 μM were
reacted with 1 mM DTNB at room temperature in a total volume of 2 mL. Absorbance
readings taken at 412 nm after 15 min were plotted against the final cysteine
concentration to give the standard curve. Equation of line: y = 13650 x – 0.0079 (R2 =
0.996).
2D Graph 1
[Csy] / M
0 20x10-6 40x10-6 60x10-6 80x10-6 100x10-6 120x10-6
Ab
so
rba
nc
e a
t 4
12
nm
0.0
0.2
0.4
0.6
0.8
1.0
1.2
1.4
1.6
y = 13650 x -0.0079
R2 = 0.996

27
2.2.3 Preparation of Reduced Thiols
The reconversion of the Cys34 residue on HSA to the free sulfhydryl form was
performed by incubating equal volumes of 4 mg/mL HSA with 4 mM dithiothreitol
(DTT) in (NH4)2CO3 buffer (50 mM) at room temperature for 3 h, followed by dialysis
(molecular mass cutoff of 3500 Da) in 2 L of 50 mM (NH4)2CO3 for 48 h with three
buffer changes during that period to ensure complete removal of DTT. The post-dialysis
HSA concentrations were determined using the Bradford assay65
with human serum
albumin (HSA) as the standard protein. HSA thiol concentrations were determined using
Ellman’s reagent as outlined above and the extent of thiol blocking with BQ was
measured with Ellman’s reagent and compared with blocking performed with the thiol
specific reagent, N-ethylmaleimide (NEM).
2.2.4 Extent of BQ Binding to Cys34 in HSA
A stock solution consisting of 4 mg/mL HSA was prepared in 50 mM (NH4)2CO3.
Then, 0.8 mg/mL (≈ 11.9 µM) HSA was incubated with 250 µM BQ for 1 h on a shaker
at 37 °C followed by dialysis for 48 h. Loss of DTNB reactivity (as described above) was
used to determine loss of thiol reactivity as a result of BQ covalent binding. As controls,
HSA thiol concentrations were determined for (i) fresh HSA in buffer that was not
incubated or dialyzed, (ii) HSA (in the absence of BQ) that had been incubated under the
same conditions (as the BQ-treated HSA) and dialyzed, and (iii) HSA which had been
reduced by dithiothreitol (DTT) and dialyzed. A comparison of the kinetics of the
reaction of DTNB with (i) reduced HSA, (ii) reduced and dialyzed HSA, and (iii) reduced

28
HSA incubated with BQ with subsequent dialysis was performed. Human albumin has
only one free thiol, Cys34. To ascertain the Cys34 as the BQ-targeted residue, the thiol
specific blocking reagent N-ethylmaleimide (NEM) was reacted with reduced HSA (as a
positive control) prior to reactions with DTNB. DTT-reduced HSA (0.8 mg/mL, 11.9
μM) was reacted with 250 µM NEM for 30 min in a pH 7.4 (NH4)2CO3 buffer at room
temperature with subsequent dialysis. Aliquots were taken for [SH]/[HSA] determination
with DTNB. HSA pretreated with BQ and incubated with DTNB was also subjected to
the same analysis.
2.2.5 Extent of BQ Binding to Primary Amines in HSA
A stock solution consisting of 0.8 mg/ml HSA prepared in PBS (pH 7.4) was
incubated with 250 µM BQ for 1 h at room temperature followed by dialysis for 48 h
against PBS buffer. The trinitrobenzene sulfonic acid (TNBS) amine specific probe assay
was performed on HSA and HSA-BQ conjugates. HSA (500, 400, 200, 100, 50 µg/mL)
were prepared in PBS buffer (pH 7.4). TNBS (5% w/v) was diluted 1: 5.48 with 0.1 M
borate buffer (pH 9.3). To 500 µL of HSA and HSA-BQ, 12.5 µL of TNBS was added,
mixed well and left to react for 30 minutes and absorbance was measured at 420 nm.
2.2.6 Whole Human Fresh Blood Collection and Serum Separation
Whole blood was drawn into 10 mL BD Vacutainer Serum Separation Tubes
containing gel and clot activator transport and inverted four times for the blood to mix
with the tube additives. The blood was allowed to sit for 30 min at room temperature for
clotting to occur. Serum was separated by centrifugation of the tubes at 1000 g for 10 min

29
at 4°C. The serum was transferred into plastic tubes using glass pasteur pipettes and
aliquoted before determination of protein concentration. The aliquoted samples were
stored at -20°C. The Cys-DTNB calibration curve was used to determine serum total
sulfhydryl concentration ([SHT]) following reaction of 0.1 ml of 0.1 mg/mL serum
protein with 0.4 ml of 0.5 mM DTNB for 15 min with subsequent absorbance readings at
412 nm. The calibration curve was also used to determine loss of [SHT] and the ratio
[SHr]/[SHT] (SHr = blocked thiol) when serum was incubated with BQ prior to DTNB
reactivity. To measure binding of BQ and NEM to high molecular weight thiols dialysis
of the serum samples was performed for 48 h against PBS to remove low molecular
weight thiols prior to incubation with BQ/NEM and subsequent determination of thiol
binding with DTNB. The ratio of blocked thiol post dialysis (SHd) to total thiol of the
control post dialysis SHTd (= [SHd]/[SHTd]) was also determined.
2.2.7 BQ and BQD Binding Kinetic Studies
Reaction kinetics were measured on a Hitech Scientific (Bradford-on-Avon, UK) SF-
61DX2 double-mixing stopped-flow spectrophotometer with an F/4 Czerny-Turner MG-
60 monochromator and a spectra scan control unit. The signal from the
spectrophotometer was amplified and digitized via an Omega Engineering DAS-50/1 16-
bit A/D board interfaced to a computer for storage and data analysis. Reaction progress
was followed by monitoring the loss of free thiol on NBT at 412 nm, where it has its
highest molar absorptivity coefficient (ε) as previously described.66

30
Test chemicals listed in table 2.1 were dissolved in acetonitrile at concentrations
ranging from 0.01 to 10 mM. These solutions (5 μL) were combined with 5 μL of 0.1 mM
NBT in phosphate buffer (pH 7.4) in a sealed reaction cell with rapid mixing. Absorbance
readings were collected after a dead time of 1 ms. Control experiments contained test
chemical in acetonitrile/phosphate buffer to determine background absorbance. Five
replicates were performed for each chemical at each concentration. The temperature was
maintained at 25°C in the observation cell with a VWR International (Radnor, PA)
circulating water bath.
2.2.8 Sample preparations and solvents used in Electron Paramagnetic Resonance
(EPR) Spectroscopy
The final concentrations of BQD derivatives were 50 μM and DMPO was 100
mM unless specifically mentioned. Buffer solutions were prepared by adjusting with 5 M
sodium hydroxide solution or 1 M hydrochloric acid. The effect of NBT on the
generation of free radicals was studied by incubating 0.1 mM NBT with 1 mM BQD +
100 mM DMPO. Spectral simulations of EPR spectra were performed using WinEPR
program developed by Bruker and the coefficients of simulated spectra were > 0.96.
2.2.9 Sample Purification Methods for Samples used for Mass Spectroscopy and
Nuclear Magnetic Resonance
Reagents were from Sigma Aldrich and used as supplied. The reaction mixture of
six-fold molar excess of NBT samples were incubated in phosphate buffer pH 7.4 for 24
hours. The reaction mixture was purified by preparative TLC (10-20% EtOAc/80-90% n-

31
hexane) for samples of compounds 3-7 to obtain the products in a pure state whilst
compound 8 was separated using Teledyne Isco Combflash Rf 200 PSI. After
completion, solvents were evaporated using a rotor evaporator, and the products were
dissolved in appropriate solvent for spectroscopy analysis.
2.2.10 Approach for QSAR Analysis
Hammett and Taft substituent constants were taken from Perrin et al.67
The
structures are given in Figure 2.5. The reaction sites are indicated by the arrows. For
Hammett constants compounds 2-MBQ, 2,5-DMBQ, 2,6-DMBQ, 2-CBQ, 2,5-DCBQ
and 2,6-DCBQ were used whilst for Taft constants test compounds BQ, 2-CBQ, 2,5-
DCBQ and 2,6-DCBQ were used.
* 2-tBBQ produced clinical signs of systemic toxicity including weight loss, lethargy and
ruffled fur that gave poor dose-dependent proliferative responses and preventing a
reliable EC3 determination.
Figure 2.5: Benzoquinone and its derivatives. The arrows are the sites of nucleophilic
attack.

32
2.2.11 Local lymph node assay
Figure 2.6: Overview of the LLNA and the dose response curve.
The Interagency Coordinating Committee on the Validation of Alternative
Methods ( ICCVAM) validated LLNA protocol68
(NIOSH Local Lymph Node Assay
Procedure (SOP # ACI00043) was used to determine the EC3 values of BQ and BQD,
with the exception that Balb/C mice were used.
Female BALB/c mice were purchased from Taconic (Hudson, NY, USA). Animals were
6–8 weeks old upon arrival and allowed to acclimate for a minimum of 10 days. Animals
were housed in the Association for Assessment and Accreditation of Laboratory Animal
Care International-accredited animal facility at National Institute for Occupational Safety
and Health (NIOSH), Morgantown, WV, USA. Animals were housed under controlled
33
environmental conditions in High Efficiency Particulate Act (HEPA)-filtered ventilated
polycarbonate cages on autoclaved hardwood beta-chip bedding and provided food and
autoclaved tap water ad libitum. All animal procedures were reviewed and approved by
the NIOSH Animal Care and Use Committee.
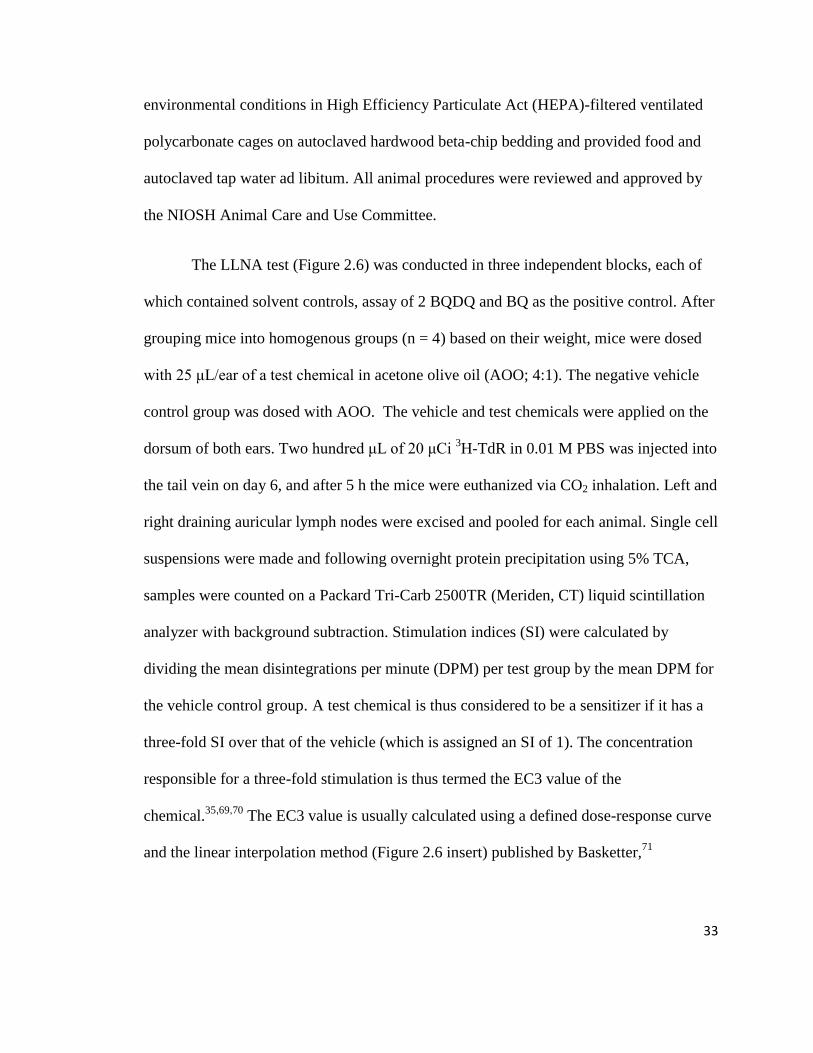
The LLNA test (Figure 2.6) was conducted in three independent blocks, each of
which contained solvent controls, assay of 2 BQDQ and BQ as the positive control. After
grouping mice into homogenous groups (n = 4) based on their weight, mice were dosed
with 25 μL/ear of a test chemical in acetone olive oil (AOO; 4:1). The negative vehicle
control group was dosed with AOO. The vehicle and test chemicals were applied on the
dorsum of both ears. Two hundred μL of 20 μCi 3H-TdR in 0.01 M PBS was injected into
the tail vein on day 6, and after 5 h the mice were euthanized via CO2 inhalation. Left and
right draining auricular lymph nodes were excised and pooled for each animal. Single cell
suspensions were made and following overnight protein precipitation using 5% TCA,
samples were counted on a Packard Tri-Carb 2500TR (Meriden, CT) liquid scintillation
analyzer with background subtraction. Stimulation indices (SI) were calculated by
dividing the mean disintegrations per minute (DPM) per test group by the mean DPM for
the vehicle control group. A test chemical is thus considered to be a sensitizer if it has a
three-fold SI over that of the vehicle (which is assigned an SI of 1). The concentration
responsible for a three-fold stimulation is thus termed the EC3 value of the
chemical.35,69,70
The EC3 value is usually calculated using a defined dose-response curve
and the linear interpolation method (Figure 2.6 insert) published by Basketter,71
34
EC3 = c + [(3 – d)/(b – d)] x (a – c) (2.3)
where a = the lowest concentration giving stimulation >3; b = the actual stimulation
index caused by a; c = the concentration with a stimulation index of < 3; and d = the
stimulation index caused by c. The values represent stimulation indexes below and above
the 3-fold stimulation index.
In our case the EC3 was estimated by the benchmark approach, by fitting a nonlinear
regression model to the data of all individual animals.
2.2.12 Statistical Analysis
LLNA: The structure of these experiments was a nested design. Mice were
randomly placed into treatment groups, which included solvent control, positive control,
+ hapten groups. Lymph node cell proliferation was measured as described above. A
sample size of four per treatment group provides greater than 95% power to find a change
in lymphocyte proliferative activity of at least 50%, based on a treatment variance of
20%, which iwas based on previous studies. Analysis was performed using the Mixed
Procedure on an SAS platform to perform a hierarchical analysis of variance. Results will
be considered significant if p < 0.05.
The log P values were calculated from structure using ADMET® (MedChem-Designer)
software72
and the values are given as mean ± SD. SigmaPlot (Version 12.0 Systat
Software Inc.) was used for statistical analysis and graphical presentation.73

35
CHAPTER THREE
REACTIVITY AND FREE RADICAL FORMATION
3.1 INTRODUCTION
The interaction of skin sensitizers with proteins, peptides, and model nucleophiles
representing cutaneously available proteins has been reported to be predominantly
covalent bonding between electrophiles (E+) and nucleophiles. It is generally agreed that
low-molecular mass xenobiotics such as BQD (<500 Da) do not have a sufficient
molecular volume, once they have penetrated the stratum corneum into the epidermis, to
stimulate a cellular and/or antibody immune response. Therefore, the xenobiotic has to
bind to a protein to form a macromolecular immunogen in the form of a hapten–carrier
complex, a postulation which has come to be commonly termed the “hapten hypothesis.”
Reactivity of BQ to thiols (e.g., Cys34 on HSA) and to primary amines (on HSA) was
tested. The kinetic spectrophotometric chemoassay for the assessment of skin sensitizers
by reactivity toward 4-nitrobenzenethiol (NBT) as a surrogate protein binding was
utilized with BQ and BQD. Stopped-flow techniques were used to monitor the depletion
of NBT at 412 nm from which NBT depletion rate constants of reaction were obtained
and ranged from seconds to minutes to reach completion. It was previously suggested by
Christensson et al. (2006),74
that semiquinone radicals may act as a hapten. The
relationship between semiquinone radicals and reactivity was examined. Semiquinone
radicals were detected using EPR, spectroscopy. EPR spectroscopy is a technique that

36
provides unique insight into the redox biochemistry, due to its ability to distinguish and
quantify different reactive species, such as SQ radicals, and to provide information on
other important parameters of biological systems.75
3.2 RESULTS
3.2.1 HSA Thiol-BQ Reactions
Loss of thiol reactivity of DTNB was observed with both fresh HSA and DTT
reduced HSA when they were incubated with BQ before reacting with DTNB. In order to
confirm the thiol residue as the target for BQ, the thiol blocking reagent N-
ethylmaleimide (NEM) was incubated with DTT-reduced HSA followed by dialysis
before addition of DTNB. Figure 3.1 shows that BQ and NEM resulted in 72.3 ± 2.6%
and 90.4 ± 2.3% loss, respectively, of HSA thiol-DTNB reactivity after 5 min at 21:1
molar ratios of BQ:HSA and NEM:HSA. A paired t-test of the thiol losses demonstrated
a significant difference (p < 0.05) between BQ and NEM induced thiol loss. Dialysis of
both the HSA-BQ and HSA-NEM adducts did not result in recovery of Cys34 reactivity,
confirming that both BQ and NEM bind irreversibly to Cys34 on HSA. There was,
however, a slight dilution of the protein concentration after dialysis. Preincubation of
HSA for 30 min with BQ or NEM with subsequent DTNB reactivity assay resulted in
85.4 ± 3.7% and 91.5 ± 4.2% thiol loss, respectively (Figure 3.1). The thiol reactivity loss
between BQ and NEM were not statistically significant (p = 0.16) after 30 min.

37
HSA+DTNB DTNB
5 min blocking
30 min blocking
0
2
4
6
8
(HSA+BQ)
+ DTNB
(HSA+NEM)
+ DTNB
[HS
A-C
ys3
4]
M
Incubations
Figure 3.1: Measurement of BQ binding to HSA Cys34 by loss of DTNB reactivity. HSA
was treated with DTT, dialyzed and reacted with BQ. NEM was used as a positive
control. (a) 0.8 mg/mL HSA reacted with 1 mM DTNB, (b) 0.8 mg/mL HSA
preincubated with 1 mM BQ reacted with 1 mM DTNB, (c) 0.8 mg/mL HSA preincubated
with 1 mM NEM reacted with 1 mM DTNB, (d) 1 mM DTNB.
3.2.2 BQ reactivity to Primary Amines in HSA
Trinitrobenzene sulfonic acid (TNBS) reactivity of accessible primary amines on
non-conjugated HSA was compared to HSA that had been conjugated with BQ. There
was 18.4 ± 2.9% loss of TNBS amine reactivity when BQ was incubated with HSA in 50
mM (NH4)2CO3, pH 7.4 buffer. Interestingly, BQ amine binding was enhanced to 35.6 ±
6.6 % of TNBS reactive HSA amines when BQ conjugation was performed in PBS (pH
(a)
(b)
(c) (d)

38
7.4). Dialysis of the HSA-BQ adduct did not result in recovery of primary amine
reactivity confirming that BQ also binds irreversibly to primary amines on HSA.
3.2.3 Serum Thiol – BQ Reactivity
Time (min)
0 2 4 6 8
Ab
so
rba
nc
e @
41
2 n
m
0.00
0.02
0.04
0.06
0.08
0.10
0.12
Figure 3.2: Measurement of BQ binding to Serum thiol by loss of DTNB reactivity. (a)
25𝜇L plasma protein stock in 500 𝜇L reacted with 0.1 mM DTNB, (b) 25𝜇L plasma
protein stock in 500 𝜇L preincubated with 0.1 mM BQ reacted with 0.1 mM DTNB, (c)
25𝜇L plasma protein stock control in 500 𝜇L preincubated with 0.1 mM NEM reacted
with 0.1 mM DTNB, (d) 25 uL Plasma protein control into 500 uL and (e) 0. 1 mM DTNB
control into 500 uL.
The serum total sulfhydryl concentration ([SHT]) following reaction with DTNB
for 15 min was 221 µM. Dialysis of the serum samples removed low molecular weight
(a)
(b)
(c)
(d, e)
And
e)

39
thiols with resultant [SHTd] being 117 µM. For the undialysized serum BQ and NEM
thiol loss ([SHr]/[SHT]) after 5 min was 74.4 ± 5.6 and 89.2 ± 3.7%, respectively,
showing significant difference (p < 0.05) between BQ and NEM. Preincubation for 30
min resulted in 90.7 ± 6.7 and 93.5 ± 5.9% thiol loss, respectively, which was not
statistically significant (p > 0.05). Dialysis of the serum samples incubated with BQ and
NEM resulted in reduced DTNB reactivity for the control serum sample and all other
samples even though the post-dialysis thiol loss [SHd] per total serum thiol of the control
post dialysis [SHTd] did not change. The thiol loss was reduced to 67.9 ± 4.7 for BQ and
70.1 ± 3.9% for NEM 5 min preincubations. When the BQ and NEM preincubation
period with the dialyzed serum samples was extended to 30 min the thiol losses were 76.9
± 5.3% and 82.6 ± 7.1%, respectively (Figure 3.2).
3.2.4 NBT-BQ/BQD Reactions
The previously reported nitrobenzenethiol assay for screening thiol reactive
haptens76
was used in this study to determine the reactivity of BQD electrophilic species
(E). The decrease in absorption of NBT at 412 nm (ε412nm = 11068 ± 126 M−1
cm−1
) was
measured after rapid mixing with BQD. As an example, Figure 3.3 and Figure 3.5 show
the consumption of NBT with MBQ and CBQ respectively.

40
Figure 3.3: Reaction of MBQ with NBT in 50% acetonitrile in a pH 7.4 phosphate buffer
at 25 oC. Absorbance readings were performed at 412 nm. Using [NBT]0 = 0.1 mM BQ
concentrations were varied from (a) 0.0 mM, (b) 0.0125 mM, (c) 0.025 mM, (d) 0.05 mM,
(e) 0.1 mM, (f) 0.2 mM, (g) 0.4 mM and (h) 0.8 mM.
2D Graph 2
Time (s)
0 2 4 6 8
[NB
T]/
M
0
20x10-6
40x10-6
60x10-6
80x10-6
100x10-6
(a)
(b)
(c)
(d)
(e)
(f)
(g and h)

41
Figure 3.4: Initial rate vs. [2-MBQ] for results taken from Figure 3.3. Rate constants are
calculated from the slope of the [E] vs. initial rate for NBT depletion.
[2-MBQ] (mM)
0.0 0.2 0.4 0.6 0.8 1.0 1.2 1.4 1.6 1.8
-d[N
BT
]/d
t (x
10
-4 M
s-1)
0.00
0.02
0.04
0.06
0.08
0.10
0.12
0.14
ko = (7.75 +/- 0.267) x10-3
s-1
R2 = 0.997

42
2D Graph 1
Time (s)
0.0 0.5 1.0 1.5 2.0
[NB
T]/
M
0
20x10-6
40x10-6
60x10-6
80x10-6
100x10-6
120x10-6
(b)(c)
(d)
(e)
(f)
(g)
(h and i)
(a)
Figure 3.5: Reaction of 2-CBQ with NBT in 50% acetonitrile in a pH 7.4 phosphate
buffer at 25 oC. Absorbance readings were performed at 412 nm. Using [NBT]0 = 0.1
mM BQ concentrations were varied from (a) 0.0 mM, (b) 0.025 mM, (c) 0.05 mM, (d) 0.1
mM, (e) 0.2 mM, (f) 0.4 mM, (g) 0.8 mM, (h) 1.6 mM and (h) 3.2 mM.

43
Initial rate against concentration of 2 Chlorobenzoquinone
[2-ClBQ] /(mM)
0.0 0.2 0.4 0.6 0.8 1.0 1.2 1.4 1.6 1.8
-d[N
BT
]/d
t (x
10
-3 M
s-1
)
0.0
0.2
0.4
0.6
0.8
1.0
1.2
1.4
1.6
1.8
ko =1.02 +/- 0.03 s-1
R2 = 0.995
R
Figure 3.6: Initial rate vs. [2-CBQ] for results taken from Figure 3.5. Rate constants are
calculated from the slope of the [E] vs. initial rate for NBT depletion.

44
The NBT-E reactions were measured at different time intervals from 0.1 s to 10
min under pseudo-first order conditions ([NBT) « [E]).
NBT0 + E0 → NBT0-E0 + NBTt (3.1)
The absorbance of the remaining free thiol at time t, was used to calculate [NBT]t using
the molar absorptivity of NBT.
[NBT0] = ( ANBTt )/(ε) (3.2)
Figure 3.4 and Figure 3.6 show how the apparent rate constant (k = -ka[NBT]0) and order
of reactions with respect to electrophile were determined from the slope of the at least
five initial rates (Ri) against five concentration variations of E for a fixed [NBT]. Linear
plots which were obtained with all NBT- E reactions (e.g., Figure 3.4, r2 = 0.997)
confirmed that the reactions were pseudo first order with respect to BQD. The order of
reactions of BQD and the apparent rate constants (k) are listed in Table 3.2. Equation 3.3
for initial rates, derived from Equation 3.1, was integrated to give Equation 3.4 for the
overall reaction where k’ = ka[E]0;
Ri = d[NBT]/dt = -ka[NBT]0[E]0 (3.3)
ln{[NBT] – [NBT]∞} = -k’t + ln[NBT]0 (3.4)
The NBT depletion data for all initial concentrations of the BQD electrophiles (E)
were fitted into the integrated rate law (Equation 3.4) and the k values given in Table 3
45
calculated for the given [E] variations for all BQD. NBT is amenable to oxidative
reactions such as disulfide formation which can compete with NBT reactions with the
BQD. The side reactions for NBT were minimized by varying initial [E]0 and plotting the
slopes, (-ks[E]0), obtained from plots of data fitted into Equation 3.4 against [E]0. By
assuming that the ki « ks within the overall reaction time, where ki is the rate of loss of
NBT due side reactions and ks is the rate of NBT reaction with E the Equation 3.5 is
reduced to Equation 3.6;
R = - d[NBT]/dt = -ka[NBT]0[E]0 +ki[NBT] (3.5)
R = - d[NBT]/dt = -ka[NBT]0[E]0 (3.6)
Pseudo-first-order rate constants were calculated as the slopes of the resultant
linear curves ([E] vs -ka[E]0 and intercept gave the pseudo-first-order rate constant ki for
the side reaction. The rate constants ka, ks and ki, are listed in Table 3.2.
The rate constant values for ka and ks were not significantly different for all BQD. There
was an increase in the disulfide formation or loss of NBT for chlorine substituted BQ as
indicated by higher ki values (ranging from 2.98 s-1
for CBQ to 0.387s-1
for 2,6-DCBQ).
The rate constants in Tables 3.1-3.2 demonstrate that reactivity of BQ decreased
significantly when electron donating groups were added with the observed order (CH3)3C
< CH3 < H. The reaction half-lives (t1/2) ranged from 0.4 ms (BQ) to 0.95 s (tBBQ).
In comparison, the rate constants for electron withdrawing substituents (EWG)
substituents were much higher than those of electron donating substituents (EDG) at pH
7.4. For example the rate constant for CBQ was 132 fold higher than that for MBQ and

46
that of 2,5- DCBQ was 2.5x10⁶
higher than that of DMBQ. The kinetics at pH 5.5 for
BQD with EWG were too fast to be measured on the stopped-flow spectrophotometer.
Table 3.1: Rate Constants Derived from the Initial Rate Methods for NBT-BQ/BQD
Reactions.
Chemical
k (s-1
)
r2
Order
BQ (pH 7.4) (6.96 ± 0.02)x 10-1
0.996 1
BQ (pH 5.5) 1.622 ± 1.09 0.989 1
(EDG) pH 7.4
MBQ (7.75 ± 0.03) x 10-3
0.994 1
tBBQ (1.91 ± 0.08) x 10-3
0.991 1
2,5-DMBQ (7.22 ± 0.24) x 10-5
0.994 1
(EWG) pH 7.4
CBQ 1.023 ± 0.03 0.996 1
2,6-DCBQ (8.72 ± 5.07) x 101 0.987 1
2,5-DCBQ (1.97± 0.12) x102 0.989 1
(EDG) pH 5.5
MBQ (1.31 ± 0.34) x 10-1
0.997 1
tBBQ (3.32 ± 0.04) x 10-2
0.999 1
2,5-DMBQ (2.30 ± 0.07) x 10-3
0.995 1
The reactivity of BQ was enhanced significantly when the substituents were electron
withdrawing. The order of reactivity was BQ < CBQ < 2,6-DCBQ < 2,5-DCBQ as
demonstrated by the k values in Table 3.2 and Table 3.2.

47
Table 3.2: Rate Constants and Half Lives for BQ and BQD at pH 7.4 and 5.5.
Chemical
k a(s-1
)
ks (s-1
)
t ½(s)
ki (s-1
)
BQ (pH 7.4) 1.66 x 10³ (1.50 ± 0.22) x10
3 4.44 x 10
-4 1.06 x 10
-2
BQ (pH 5.5)
2.61 x 10⁴
(2.26 ± 0.08) x 104
3.07 x 10⁻⁵
6.94 x10⁻¹
(EDG) pH 7.4
MBQ 3.87 x 10² (3.23 ± 0.01) x 10
2 2.14 x 10
-3 5.74 x 10
-3
tBBQ 2.39 x 101 (2.31 ± 0.03) x 10
1 3.00 x 10
-2 8.06 x 10
-4
DMBQ
7.47 x 10⁻¹
(7.27 ± 0.21) x 10-1
9.54 x 10⁻¹
2.93 x 10⁻⁴
(EWG) pH 7.4
CBQ 2.18 x 10⁵ (2.62 ± 0.01) x 10
5 2.64 x 10
-6 3.78 x 10
-1
2,6-DCBQ 1.60 x 10⁶ (1.21 ± 0.04) x 10
6 5.74 x 10
-7 2.98
2,5-DCBQ
2.92 x 10⁶
(2.83 ± 0.09) x 106
2.45 x 10⁻⁷
2.99 x 10⁻¹
(EDG) pH 5.5
MBQ 1.51 x 10³ (1.60 ± 0.07) x 10
3 4.34 x 10
-4 1.71 x 10
-3
tBBQ 3.60 x 10² (3.37 ± 0.06) x 10
2 2.06 x 10
-3 3.33 x 10
-2
DMBQ 1.05 x 101 (1.25 ± 0.03) x 10
1 5.56 x 10
-2 1.48 x 10
-3
3.2.5 Benzoquinone Derivatives and Free Radical Formation
Figures 3.7(a-e) show the EPR signals that were observed with EWG substituted BQD.
No EPR signals were observed with free DMPO and all EDG substituted BQD. The EPR
signal intensity was in the order; 2,5-DCBQ > 2,6-DCBQ > CBQ > BQ. This trend in
EPR intensity signal was the same trend which was observed with pseudo-first order rate
constants. Reduction of the BQ resulted in a weak signal of approximate 1:2:1, triplet line
spectrum (aH2
= aH3
= aH5
= aH6
= 2.4 G at pH 7.4). Under the same conditions (50 mM
DMPO and pH 7.4) there was a 5 fold increase in SQ. yield from reduced CBQ compared
to the reduced BQ radical.
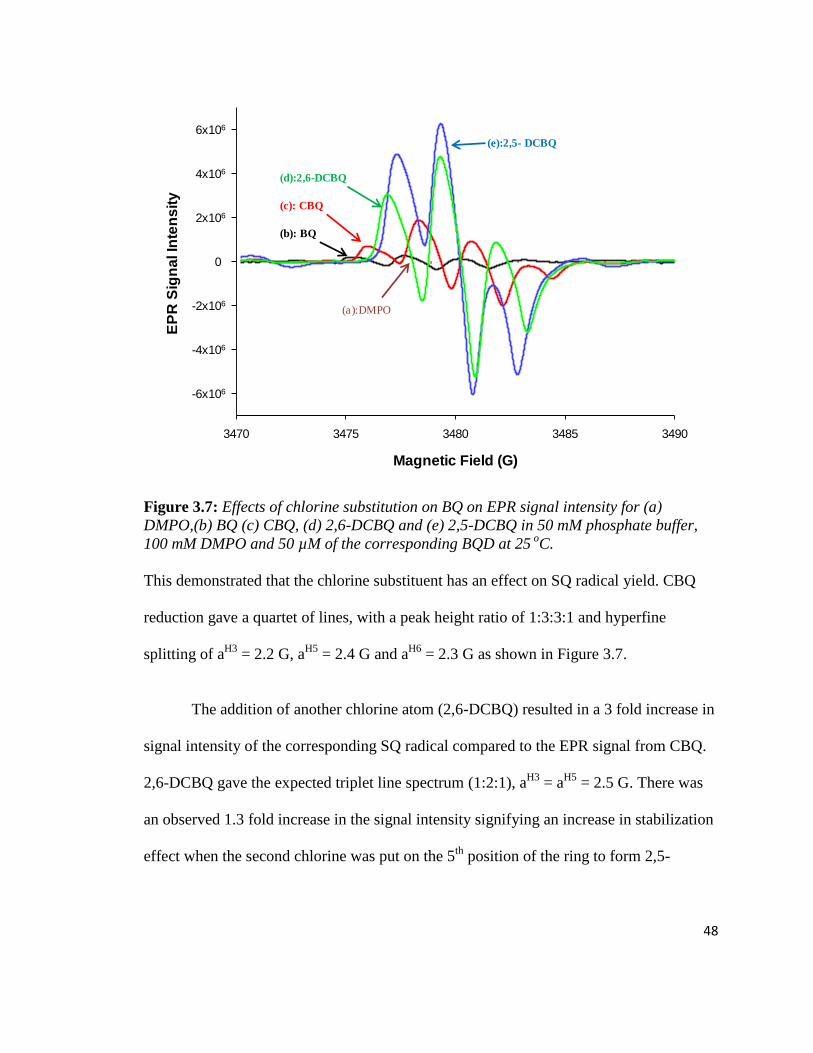
48
Figure 3.7: Effects of chlorine substitution on BQ on EPR signal intensity for (a)
DMPO,(b) BQ (c) CBQ, (d) 2,6-DCBQ and (e) 2,5-DCBQ in 50 mM phosphate buffer,
100 mM DMPO and 50 µM of the corresponding BQD at 25 o
C.
This demonstrated that the chlorine substituent has an effect on SQ radical yield. CBQ
reduction gave a quartet of lines, with a peak height ratio of 1:3:3:1 and hyperfine
splitting of aH3
= 2.2 G, aH5
= 2.4 G and aH6
= 2.3 G as shown in Figure 3.7.
The addition of another chlorine atom (2,6-DCBQ) resulted in a 3 fold increase in
signal intensity of the corresponding SQ radical compared to the EPR signal from CBQ.
2,6-DCBQ gave the expected triplet line spectrum (1:2:1), aH3
= aH5
= 2.5 G. There was
an observed 1.3 fold increase in the signal intensity signifying an increase in stabilization
effect when the second chlorine was put on the 5th
position of the ring to form 2,5-
Magnetic Field (G)
3470 3475 3480 3485 3490
EP
R S
ign
al In
ten
sit
y
-6x10⁶
-4x10⁶
-2x10⁶
0
2x10⁶
4x10⁶
6x10⁶
(e):2,5- DCBQ
(d):2,6-DCBQ
(a):DMPO
(b): BQ
(c): CBQ

49
DCBQ. A triplet line spectrum (1:2:1) was also observed with 2,5-DCBQ, with aH3
= aH6
= 2.2 G.
There was an observed shift in peaks to higher magnetic field and g-value
whenever a chlorine atom was added or changed positions on the BQ and the same trend
of increase (depending on number and position of chlorine atom) was observed on EPR
signal intensity (Table 3.3.
Table 3.3: Summary of Peak shift and g-factor Values.
Chemical Peak shift (mT) g-factor
BQ 0 (Standard) 2.001382
CBQ 0.0782 2.001534
2,6-DCBQ 0.176 2.001585
2,5-DCBQ 0.215 2.002077
3.2.6 The Effect of pH on Radical formation
The determination of the effect of pH on radical formation was done using
phosphate buffer from pH 5.5 to pH 8.6. Using 2,6-DCBQ as an example, Figure 3.8
shows that there was no EPR signal detected when pH was below 6.5. The increase in pH
from 6.5 introduces more OH- ions into the system which act as a reducing agent to
quinones giving semiquinone radicals.77
The peak signal intensity went up from pH 6.5 to
7.6 and then down after pH 7.6.

50
Figure 3.8: The relationship between EPR signal intensity and rate constants due to pH
variation for [2,6-DCBQ]0 = 50 µM in 50 mM of phosphate buffer and 100 mM DMPO
at 25 o
C. (a) EPR signal due to DMPO-SQ adduct formation (b) EPR signal due to
DMPO-OH and trace (c) shows the effect of pH on the rate of reaction between 2,6-
DCBQ and NBT. There is an inverse relationship between the rate constant and EPR
DMPO-SQ signal.
Under the aerobic conditions of these experiments the oxygen acts as a fast and
efficient radical quencher whilst forming a superoxide or peroxy radical (ROO.).
77 The
decrease in signal intensity peak after pH 7.4 is attributed to the peroxy radicals which
are reported to form from dissolved oxygen78
The spectrum was composed of a quartet of
lines, with a peak height ratio of 1:2:2:1, with parameters including hyperfine constants,
aH = 14.8 G and was attributed to the DMPO-OH. These parameters are typical of a
DMPO-OH adduct EPR signal generated by the reaction of OH with DMPO.79
The peaks
Relationship between semiquinone radical formation and rate constants with pH
pH
5.0 5.5 6.0 6.5 7.0 7.5 8.0 8.5 9.0
EP
R S
ign
al
Inte
ns
ity
0
2x10⁶
4x10⁶
6x10⁶
8x10⁶
10x106
k (
s-1
)
0.0
0.2
0.4
0.6
0.8
1.0
1.2
1.4
1.6
1.8
(a)
(b)
(c)
EPR signal intensity for the effect of pH variation on (a) DMPO-SQ and (b) DMPO-OH adduct for 2,6-DCBQ.
50 mM of phosphate buffer, 100 mM DMPO and 50 µM of 2,6-DCBQ at 25 0C. Trace (c) shows the effect of
pH on the rate constant of the reaction between BQ and NBT.

51
at pHs > 7.6 increased in intensity then went down as the DMPO-OH adduct peaks
appeared and increased in intensity. A proposed scheme leading to DMPO-OH
formation is shown in Figure 3.9. The electron g-factors of BQD radicals changed with
increasing number of chlorine atoms and position(s) of the chlorine substituents on the
BQ ring (Table 3.3). Compared to BQ radical (g = 2.001382) the CBQ (g = 2.001534, Δg
= 0.000152) and the 2,6-DCBQ (g = 2.001585, Δg = 0.000203) and changing chlorine
position to 2,5-DCBQ (2.002077, Δg = 0.000695). This increase in g-value was
harmonious with the increased spin orbit coupling that is expected with increasing
number of chlorine atoms.
Figure 3.9: Schematic routes which lead to DMPO-SQ and DMPO-OH EPR active
adduct formation.

52
3.2.7 EPR Spectrum Simulations
Magnetic Field (G)
3460 3470 3480 3490 3500
Figure 3.10: Computer simulations on the effects of chlorine substitution on BQ on EPR
signal intensity data shown in Figure 5(c) CBQ and (d) 2,6-DCBQ. This model gave a
reasonably good fit to the experimental data in both hyperfine splitting constants and the
signal intensity.
The main objective with respect to spectrum simulations was to obtain a
satisfactory simulation of the room-temperature EPR spectrum for BQ with EWG using
CBQ and 2,6-DCBQ as examples (see Figure 3.10). The fitting of the data were simple
and the best fit values were obtained with hyperfine splitting constant, aH3
= aH5
= 2.5 G
for 2,6-DCBQ and aH3
= 2.2 G, aH5
= 2.4 G and aH6
= 2.3 G for CBQ. The adopted values
50 µM CBQ
50 µM 2,6- DCBQ
Simulation
Simulation

53
for hyperfine splitting constant are most likely valid for the BQD radical formation at
physiological pH.
3.2.8 NBT Effect on SQ Radical Formation
Figure 3.11 shows that the addition of NBT to a DMPO and 2,6-DCBQ mixture
decreased the amount of EPR signal formed even when the DMPO was in excess over
both the NBT and the 2,6-DCBQ. Control experiments showed no reactivity between
DMPO and NBT. Figure 3.9 shows that mixing NBT and 2,6-DCBQ in equimolar
quantities resulted in about 50% loss of EPR signal. When NBT was 3-fold in excess
over 2,6-DCBQ the EPR signal loss was > 90% in agreement with the NBT-2,6-DCBQ
reactivity that was observed. The loss of EPR signal is due to NBT-BQ adduct formation
overpowering the production of DMPO-SQ adduct formation. This shows that the rate of
production of free radicals from 2,6-DCBQ is much slower than the rate of adduct
formation between NBT and the 2,6-DCBQ. The NBT quenches the system of any
available 2,6-DCBQ thus no radicals are produced. This suggests that the free radical
mechanism is overshadowed by the MA and therefore has minimal contribution to the
rate constants obtained for the rapid depletion of NBT.

54
[NBT]/(mM)
0.0 0.1 0.2 0.3 0.4 0.5 0.6
DM
PO
-SQ
EP
R S
ign
al
(No
rma
liz
ed
Pe
ak
He
igh
t)
0
20
40
60
80
100 (a)
(g)
(f)
(e)
(d)
(c)
(b)
Figure 3.11: Plot of depletion of DMPO-SQ signal versus [NBT] at 25 oC. [DMPO]0
=100 mM, [2,6- DCBQ]0 = 0.05 mM, and varied [NBT]= (a) 0 mM, (b) 0.02 mM, (c)
0.04 mM, (d) 0.08 mM, (e) 0.16 mM, (f) 0.32 mM and 0.6 mM in 100 mM phosphate
buffer of pH 7.4.
3.3 DISCUSSION
Murine local lymph node (LLNA) studies rank BQ as an extreme dermal
sensitizer with an EC3 (threshold) value of 0.013%.80
BQ covalent binding to proteins
resulting in immunogenic complexes has been attributed to BQ’s reactivity as a Michael
acceptor. New evidence81,82
on both the quinone’s unique electrophilic chemistry and
high reactivity, however, provides alternative hypothesis on the possible contributory role
of other reaction pathways to BQ’s overall reactivity towards nucleophiles such as

55
cysteinyl amino acids on proteins.83
The impact of substituents on BQ’s reactivity and
ultimate in vivo allergenicity had not been previously assessed.
Binding experiments with HSA demonstrated that Cys34 (the only reduced thiol
in HSA) on the protein is the preferred target for BQ binding and the bond formed is an
irreversible covalent bond. BQ was shown to have high affinity for thiols when serum
was used as the source for thiols. Comparison of BQ and NEM blocked thiols pre- and
post-dialysis showed that the ratios [SHr]/[SHT] and [SHd]/[SHTd] were equal
demonstrating the binding of BQ to both high and low molecular weight thiols such as
cysteine and glutathione. The binding of BQ to cysteine and glutathione may result in
reduced BQ available for protein binding, but its extreme potency80
in the LLNA assay
shows that the concentrations absorbed through the skin during the in vivo assay are high
enough to overcome any clearance which may result from low molecular weight thiol
binding. The observed 85.5 % loss of reactivity to thiols compared to 18 % loss of
reactivity to primary amines under identical conjugation conditions, demonstrates that
BQ is much more reactive to thiols than amines, in agreement with previously reported
observations.84
The thiol nucleophile, NBT, was used to measure reactivity of six BQD. NBT has
previously been utilized as a model nucleophile where relative reactivity of electrophilic
allergens to NBT was highly correlated to LLNA EC3 values.76
All the BQD tested
rapidly reacted with NBT. There was, however, a 90 fold decrease in reactivity of the BQ
ring when MBQ was reacted with NBT. The methyl group donates electrons into the BQ
π system leading to an increase in electron density on the π system with consequent

56
reduction of the partial positive charges on the electrophilic carbons on BQ. The π
electrons also repelled the electrons on the –SH group on NBT thus slowing down the
reaction. The positive inductive effect became more apparent when the methyl group was
replaced with the tert-butyl group. The reaction dropped by approximately 4 fold from
MBQ to tBBQ. This was due to more electron donating ability of tert-butyl compared to
methyl group. The steric hindrance offered by tert-butyl, to the incoming NBT, compared
to the methyl group could also have contributed the decreased reactivity of tBBQ. For
NBT-DMBQ reactions, the further 26-fold loss of reactivity relative to tBBQ can be
attributed to the increased positive inductive effect of two methyl groups in close
proximity to the reacting β carbocations. The repulsive force of π electron cloud around
the electrophilic carbon was increased by having two methyl groups on the ring.
For activated BQD the pseudo-first order rate constants for NBT reactivity at pH
7.4 increased in the following order BQ < CBQ < 2,6-DCBQ < 2,5-DCBQ (Table 3.2).
The effect of the increased negative inductive effect on the rate constants is apparent
from CBQ to the dichloro-substituted BQD. When 2,6-DCBQ was reacted with NBT
there was an 85-fold increase in NBT reactivity compared to CBQ. There was an
observed increase in rate constants by 2 fold between 2,6-DCBQ and 2,5-DCBQ with the
latter being faster. The difference in reactivity between the dichloro substituted
derivatives may be attributed to the fact the 2,5-DCBQ has its chlorine atoms in para
positions to each other which makes the carbon atoms on which the chlorine atoms are
attached more partially positive due to inductive withdrawal of electrons, unlike the 2,6-
DCBQ which has chlorine atoms on meta positions to each other and do not influence

57
each other by inductive electron withdrawal. This makes 2,5-DCBQ more reactive than
2,6-DCBQ. This strongly agrees with the findings of Enoch et al. 85
in which a direct
relationship between electrophilic effects of a chemical and rate reaction by Michael
addition reaction were observed and used in an electrophilicity index for prediction of
skin sensitization potential. For both 2,6-DCBQ and 2,5-DCBQ, the –SH on NBT adds
on to position on which the chlorine atom is attached by MA and then nucleophilic
elimination of the chlorine atoms (reaction of 1st mole on Scheme 4.3).
O
O
Cl Cl
O
O
Cl
Cl1
2
3
4
5
6
1
2
34
5
6
2,5-DCBQ 2,6-DCBQ
The structure for 2,5-DCBQ is such that it will undergo MA and then nucleophilic
substitution onto position 2 and 5 which have the higher electrophilicity. 2,6-DCBQ
where positions 2 and 6 are not influenced by the negative inductive effect of the chlorine
atoms possess a lesser partial positive charge on these positions This makes 2,5-DCBQ
more reactive than 2,6-DCBQ. Increased rate constants increased several-fold for MBQ,
DMBQ and tBBQ when NBT reactivity was measured at pH 5.5 suggesting that the MA
reactions are acid catalyzed, Figure 3:6 shows an inverse relationship between rate
constant and pH. The acid catalysis is more pronounced for CBQ, 2,5-DCBQ and 2,6-

58
DCBQ reactions performed at pH 5.5 which could not be measured using the stopped
flow technique. The fact that rate constants for MBQ, DMBQ and tBBQ had increased
several-fold under pH 5.5 but were still lower than those of CBQ, 2,5-DCBQ and 2,6-
DCBQ at pH 7.4 demonstrates the agreement on the effect of electron donating versus
electron withdrawing substituents on BQ reactivity under pH’s 7.4 and 5.5.
BQ has been hypothesized to haptenate proteins via MA. The production of
semiquinone (SQ) radicals as a mechanism of BQD protein haptenation was investigated
and EPR signal intensity was of the order; 2,5-DCBQ > 2,6-DCBQ > CBQ > BQ. No
EPR signals were observed with methyl- and tert-butyl-substituted BQD. BQ generated
radicals are known to form through the one electron reduction of BQ, followed by
hemolytic cleavage of the O-O bonds on the carbonyl functional group. The resulting SQ
radical may potentially bind directly to a protein.86
Thus the presence of the SQ radical
indicated the potential of free radical mechanisms as another mechanism of BQD
covalent modification of proteins. Increased production of free radicals from chloro-
substituted BQD (Figure 3.7) is a result of the high negative inductive effect arising from
the highly electronegative chlorines. This activates the BQ in contrast to the positive
inductive effect of the electron donating groups. The increase in g-values from the mono-
chloro-substituted to the dichloro-substituted BQD is harmonious with the increased spin
orbit coupling that was expected with increasing number of chlorine atoms. Halogenation
of BQ has been known to increase the persistence of SQ radicals.87
The EPR results show
that the yield of the SQ radicals resulting from chlorine substituted BQD depend on pH
and on the position and number of chlorines on the SQ ring.

59
The trend in EPR intensity signal agreed with the observed order of reactivity
indicating that inductive effects have a dominant influence on the chemistry of the BQD
compared with other factors such as steric hindrance. The effect of pH on radical
formation (Figure 3.8) highlights the sensitivity of the SQ radicals to either acidic or
basic conditions. The increase in pH from 6.5 to 7.6 might have introduced more OH-
ions into the system which act as a reducing agent to quinones giving semiquinone
radicals.77
Beyond pH 7.6 the OH- effect might have been overcome by the presence of
produced oxygen which has been reported to act as a fast and efficient SQ radical
quencher, forming a superoxide radical or peroxy radical (ROO.)77
in the process (Figure
3.9). Peroxy radicals have been shown to produce dissolved oxygen in alkaline conditions
thus availing more oxygen which quenches the SQ radical. The observed decrease in SQ
radical peaks intensity at pH > 7.6 (Figure 3.8) as the peaks of DMPO-OH adduct
simultaneously started appearing can explain the minimum or no role of OH- and oxygen
quenching in the temporary increase in SQ radical intensity at pHs 7.6 and below
followed by oxygen quenching at pHs beyond 7.6.
The contribution of a free radical pathway to protein haptenation may not be
significant because of lack of production of SQ radicals at acidic pH, in contrast with the
increased NBT reactivity which was observed at pH 5.5. Skin pH is around 5.5 and lack
of formation of radicals shown herein means that BQ and BQD binding to proteins will
occur via MA with additional vinylic substitution where the substituents such as chlorine
are good leaving groups. The dominance MA versus free radical formation was also
demonstrated with the inclusion of NBT to (DMPO + BQ) mixture (pH 7.4) which

60
resulted in quenching of the EPR signal even when the DMPO >> NBT and the BQD.
The loss of EPR signal was due to NBT-BQ adduct formation (Figure 3.11) which
formed at rate that was faster than the production of DMPO-SQ adduct formation. It may
have been possible that NBT quenching of the EPR signal was due to the SQ radical
forming quickly and then reacting with NBT to form an EPR silent adduct. This
argument was, however, dismissed when MS and NMR characterization of adducts
formed in the reaction mixture showed no presence of NBT-SQ adducts. NBT mops the
system of any available BQD thus no radicals are produced. This aspect proves that the
free radical mechanism plays a minimal role, at best, in BQD binding. The dominance of
MA as a pathway is further supported by quantitative mechanistic read-across based
estimation of BQ EC3 values which utilized known potency data for sensitizers in the
MA domain. A theoretical EC3 value of 0.013% was obtained in agreement with actual
LLNA EC3 value of 0.01%.80
The inclusion of substituents on BQ has been shown to have a profound effect on
the overall chemistry of BQ. This is manifested in an increased or decreased reactivity of
BQD toward NBT and the emergence of other mechanistic pathways such as free radical
mechanism and vinylic substitution. From the hapten hypothesis88
perspective the effect
of vinylic substitution for the chloro-substituted BQD would not lead to any
immunogenic adducts that are different from those formed with BQ as this step is
subsequent to MA which results in adduct formation. The substituted chlorine leaves as a
salt which would not be expected to modify any proteins.

61
3.4 CONCLUSION
It can be concluded that the order of reactivity of BQD to NBT was 2,5-DMBQ <
tBBQ < 2-MBQ < BQ < CBQ < 2,6-DCBQ < 2,5-DCBQ as demonstrated by the k
values. MA is the dominant mechanism for BQ and methyl-BQD haptenation of proteins
and that MA followed by vinylic substitution is dominant for chlorine-BQD. Based on
the findings in these studies SQ radical induced binding of proteins may play a minimal
to no role in the development of BQD sensitization.

62
CHAPTER FOUR
CHARACTERISATION OF ADDUCTS AND REACTION
MECHANISMS
4.1 INTRODUCTION
Chemically induced modification of proteins by natural toxins and synthetic
toxicants can alter protein function, disrupt signal transduction, and interfere with
subcellular protein localization. This section gives an outline of the reaction mechanisms
between BQD and NBT as well as identifying the corresponding adducts formed in the
process. Chemical characterization is important to determine whether conjugation has
been achieved and to quantitate the ratio of chemical ligands bound per molecule of
carrier protein. Conjugate addition of one molecule of various sulfur nucleophiles to p-
benzoquinones is well known. However, double conjugate additions of sulfur
nucleophiles to p-benzoquinones are rare and only one such example was found in the
literature.14
The BQD-NBT products formed in phosphate buffer (pH 7.4) were characterized.
All reactions and products were separated using reversed-phase liquid chromatography
(LC) with ultraviolet absorbance (UV), and mass spectrometric (MS) detection. It was
very important that only reagent grade chemicals with a high degree of purity be used for
the preparation of samples. The section serves to determine the stoichiometric binding
ratio between NBT and BQD, identification of adducts formed and relative abundance of

63
reaction products observed using ESI-MS and identify the specific binding site(s) of NBT
on BQD using 1HNMR.
4.2 RESULTS AND DISCUSION
2-((4-nitrophenyl) thiol) benzene-1, 4-diol(2a and 5a), was a product of both
BQ and CBQ reaction with NBT. 2a was recovered by solvent extraction using n-hexane
which was evaporated using a rotor evaporator. 1
H NMR(CDCl3, 400 MHz) δ 8.10 (d, J =
9.0 Hz, 2H), 7.14 (d, J = 9.0 Hz, 2H), 7.05 – 6.94 (m,3H). ESI-MS exact mass calculated
for [M–H]- requires m/z 262.01795, found 262.01779 2a and 262.01746 for 5a and ESI-
MS data was recorded using a scan range of m/z 100-600.
2-methyl-6-((4-nitrophenyl)thio)benzene-1,4-diol (3a) was a produced as
yellow crystals from the reaction of MBQ with NBT. The reaction mixture was purified
by preparative TLC with the eluent ethyl acetate/n-hexane (1.5:8.5 ratio). 1H NMR
(CDCl3, 400 MHz) δ (ppm) 8.32 (d, J = 8.9 Hz, 9H), 7.71 (d, J = 8.9 Hz, 11H), 6.56 (s,
1H), 5.90 (s, 2H), 2.12 (s, 7H). For MS analysis ESI-MS solvent was 50:50 water:
methanol which resulted in the m/z 276.03259, against the exact mass m/z = 276.03360
calculated for [M–H]-.
2,5-bis((4-nitrophenyl)thio)benzene-1,4-diol (7a), The reaction mixture was
purified by preparative TLC, eluent ethyl acetate/n-hexane (1:9 ratio) and orange crystals
were obtained. 1H NMR (CDCl3, 400 MHz) δ (ppm) 8.13 (d, J = 9.1 Hz, 2H), 7.30 (s,
1H), 7.17 (d, J = 9.1 Hz, 2H).

64
2,5-dimethyl-3-((4-nitrophenyl)thio)benzene-1,4-diol (8), Flash
chromatography eluent, n-hexane =100% with reaction time of 1 min, then ethyl
acetate/n-hexane = 1:1 for 12 min. Fine yellow crystals after drying the solvent on a rotor
vapor. 1H NMR (CDCl3, 400 MHz) δ (ppm) 8.08 (d, J = 8.7 Hz, 2H), 7.09 (d, J = 8.7 Hz,
2H), 6.82 (s, 1H), 4.77 (s, 2H), 2.35 – 2.15 (m, 6H). 13
C NMR (CDCl3, 100 MHz) δ
(ppm) 125.76 (d, J = 7.3 Hz), 124.30, 121.14, 77.34, 16.39, 13.79.
4.2.1 Characterization of BQD-NBT Adducts
Based on NMR and MS characterization of the NBT-BQD reaction products,
NBT was shown to react with BQ 2 to give a 1:1 ratio product 2-((4-nitrophenyl) thiol)
benzene-1, 4-diol 2a in phosphate buffer at pH 5.5 after 1 h. The electron-donating group
substituted benzoquinones reacted through MA (Scheme 4.2) giving a 1:1 ratio with
NBT; MBQ 3 gave 2-methyl-6-((4-nitrophenyl)thio)benzene-1,4-diol 3a, tBBQ 4 gave 2-
(tert-butyl)-6-((4-nitrophenyl)thio)benzene-1,4-diol 4a and DMBQ 8 gave 2,5-dimethyl-
3-((4-nitrophenyl)thio)benzene-1,4-diol 8a. The reaction between CBQ 5 and NBT was
involved two reaction mechanisms in the following order; MA reaction followed by
vinylic substitution (Scheme 4.3). Reaction between NBT and CBQ gave 2 products as
confirmed by ESI-MS (Figure 4.1); a monosubstituted benzoquinone, 2-((4-
nitrophenyl)thio)benzene-1,4-diol 5a, and disubstituted benzoquinone; 2,6-bis((4-
nitrophenyl)thio)benzene-1,4-diol 5b. The reaction between the di-substituted chloro-
benzoquinones 2,5-DCBQ and 2,6-DCBQ gave corresponding di-substituted
benzoquinone with chlorines being substituted by NBT in 1:2 ratios (BQD:NBT).

65
Figure 4.1: Negative ESI-MS spectra of p-nitrobenzenethiol adduct(s) formation with
CBQ giving a mono-NBT-hydroxyl BQ adduct (m/z 415.00540) and a di-NBT-hydroxyl
BQ adduct (m/z 262.01746) and spectrum.
Reaction between 2,5-DCBQ 6 and NBT gave 2,5-bis((4-nitrophenyl)thio)benzene-1,4-
diol 6a whilst 2,6-DCBQ 7 gave a corresponding di-substituted benzoquinone ,2, 5-
bis((4-nitrophenyl)thio)benzene-1,4-diol 7a.
The BQD-NBT reaction is acid catalyzed as shown by the faster reaction rate at
lower pH. Acid facilitated the creation of a carbocation center on which the nucleophile
attacks (Schemes 4.2 and 4.3). The reactions between electron donating substituted
benzoquinone and NBT were direct 1:1 ratio MA reactions (Scheme 4.2).
data03_120417150131 #16 RT: 0.25 AV: 1 NL: 5.22E5T: FTMS - p ESI Full ms [100.00-1005.99]
100 200 300 400 500 600 700 800 900 1000
m/z
0
5
10
15
20
25
30
35
40
45
50
55
60
65
70
75
80
85
90
95
100
Re
lative
Ab
un
da
nce
262.01746
415.00540
275.99661
141.01659 216.92805358.86862
525.04236
320.91302
478.82736567.99280 985.70551678.02869 802.03278 890.69031

66
Scheme 4.1: Reaction mechanisms for electron withdrawing and electron donating
substituted benzoquinones with NBT
NBT went onto position 6 for mono-substituted BQ and position 3 for di-
substituted BQ (Scheme 4.1), and this was confirmed by ESI-MS (Figure 4.2).

67
Figure 4.2: Negative ESI-MS spectra of p-nitrobenzenethiol adduct(s) formation with
MBQ giving a mono-NBT-hydroxyl MBQ adduct (m/z 276.03259).
For electron withdrawing substituted benzoquinones, the carbocation center
created on the carbon on which chlorine atom was attached and this was the target for the
–SH group on NBT followed by the substitution of the chlorine atom. In contrast to the
methyl and tert-butyl substituted BQ the mechanism for the chlorine substituted BQs the
reaction mechanism was direct nucleophilic vinylic substitution (SNV) with subsequent
Michael addition (MA) reaction. As a result of the electron withdrawing substituents
2mbq_120505144207 #10 RT: 0.15 AV: 1 NL: 1.89E6T: FTMS - p ESI Full ms [100.00-600.00]
100 150 200 250 300 350 400 450 500 550 600
m/z
0
5
10
15
20
25
30
35
40
45
50
55
60
65
70
75
80
85
90
95
100
Re
lative
Ab
un
da
nce
276.03259
201.05469
153.99617290.01135
126.90447 399.10666243.05264 312.00870 553.07202429.01996
217.04965
367.08057185.05991 325.18259262.01709489.11646 520.06787465.39780 563.01862
168.99550

68
CBQ gave 2-((4-nitrophenyl)thio)benzene-1,4-diol 5a as a product and 2,5-DCBQ gave
2, 5-bis((4-nitrophenyl)thio)benzene-1,4-diol 7a.
4.2.2 Reaction Mechanisms
Scheme 4.2: The proposed MA reaction between MBQ and p-nitrobenzenethiol
Scheme 4.3: The proposed reaction between CBQ and p-nitrobenzenethiol

69
4.3 CONCLUSION
It can be concluded that EDG BQD (e.g. 2-MBQ) react with thiols by MA
mechanism whilst EWG BQD haptenate to thiol proteins by vinylic substitution. These
studies show that mono-substituted CBQ covalently binds to NBT to give 2 adducts (a
mono-substituted BQ and a disubstituted BQ), while DCBQ give out 1 major adduct (1:2
ration BQ: thiol). NMR results also demonstrate the variations in the stoichiometry of the
NBT-BQD reactions as well as the shifting of positions for nucleophilic addition.

70
CHAPTER FIVE
LOCAL LYMPH NODE ASSAY AND QUALITATIVE
MECHANISTIC MODELS
5.1 INTRODUCTION
Existing animal based assays such as the murine local lymph node assay
(LLNA),89
which is based on the proliferation of lymph node cells in the induction phase
or the MEST30
and Guinea Pig Maximization Test (GPMT)90
which are based on the
observation of the allergic responses in the elicitation phase of ACD are widely used to
screen for allergenic chemicals. Mandated reduction/elimination of animals used in
cosmetics testing in Europe has led to an increased need for alternatives to animal testing
in the prediction of skin sensitization potential.91 Published datasets consisting of
quantitative reactivity test results for compounds tested in the LLNA are being used to
develop and evaluate (validating or invalidating) alternative approaches.92
Hundreds of
chemicals belonging to different mechanistic domains have been shown to possess the
ability to induce skin sensitization. Of these, BQ is an extreme skin sensitizer (EC3 =
0.013)93
which has been well recognized over the years. The effect of inserting
substituents on the BQ ring has not been studied in animal assays.
5.1.1 Local Lymph Node Assay
The EC3 for BQ has been published by Roberts et al.56
Since this EC3 for BQ
was calculated from BQ doses that resulted in SI values that were all >> SI = 3, the

71
accuracy of the EC3 was overestimated. This study performed a preliminary LLNA to
establish a measured EC3 for BQ that was subsequently adopted and informed the BQ
dose to be used as a positive control for all other LLNA experiments with BQD. A wide
range of doses was used ensuring that one dose is below the predicted EC3 and two doses
are above those predicted to be greater than 10-fold (over vehicle) lymph node cell
proliferation (Figure 5.1 and Figure 5.2).
After performing the LLNA for the BQD as outlined above dose response curves were
utilized to calculate EC3 values for all BQD tested. Comparison of predicted EC3 values
with reactivity data was performed to test the predictive power of the reactivity assay.
The following criteria (Table 5.1) adopted from the European Center for Ecotoxicology
and Toxicology of Chemicals (ECETOC)94
was be used for potency classes:
Table 5.1: Potency rating of skin sensitizers
Potency Rating Concentration Threshold
(EC3; %)
Extreme <0.1
Strong >0.1 - <1.0
Moderate >1.0 - <10
Weak >10
Non-sensitizer >100
In the present study, allergenic potency of BQ and BQD were assessed in the LLNA to
test the predictive power of previously reported reactivity data95
on skin sensitization. To
check if the effect of substituents on the concentration required producing a threshold

72
positive response, the candidate chemicals were placed into the categories in Table 2.5
based on their reaction chemistry and LLNA potency. The 7 test chemicals which make
the basis of this study with expected sites of nucleophilic attack on the ring are shown in
Figure 5.2.
The reported95
reactivity constants(ka) were used to predict the LLNA EC3 values
for the BQD. LLNA studies were then performed for BQ and BQD to determine the
actual EC3 values and test the predictive power of the reactivity data as a way of
validating the potential utility of the reactivity approach as an alternative method for skin
sensitization testing. In this article, we also present skin sensitization quantitative
structure-activity relationships (QSARs) analysis for the Michael addition (MA) and
nucleophilic vinylic substitution (SVN) mechanistic applicability domains, in which
BQD possess either X or Y substituents (X and Y) on different positions.
5.2 RESULTS
5.2.1 LLNA: Allegenicity Assessment
The LLNA was performed for BQ to derive a more accurate EC3 estimate rather
than use the literature EC3 value for BQ which was exptrapolated from doses that
produced high stimulation indexes (SI) well above three fold threshold. Figures 5.1 and
5.2 show the doses of each BQD and the stimulation indexes. The LLNA EC3 values
derived from these SI values using linear interpolation provided in the Figure 5.3. BQ and
chlorine substituted BQ allergenic potency increased in the following order: BQ (EC3 =

73
0.043 %) < CBQ (EC3 = 0.039) < 2,6-DCBQ (EC3 = 0.028 %) < 2,5-DCBQ (EC3 =
0.013%) in agreement with the trend predicted by rate constants (listed in Table 5.2).
Methyl substituted BQ EC3 values which ranged from < 0.1% to 0.238 % were higher
than those of chloro BQD. The predicted LLNA by reactivity of 2-MBQ and 2,5-DMBQ
were different, with the EC3 of 2,5-DMBQ being 18 fold higher than the EC3 value of
2-MBQ. The actual EC3 values of 2-MBQ and 2,5-DMBQ from the LLNA were very
similar to each other, but in the reverse order than predicted. However, Figure 5.2
demonstrate that 10% 2-MBQ produced a significantly higher SI than 10% 2,5-DMBQ
(SI = 31.7% vs. 11.5%, respectively) suggesting that it may actually be a more potent
allergen than 2,5-DMBQ as predicted from the reactivity data. The difference in the mean
SI values of 2-MBQ and 2,5-DMBQ is greater than would be expected by chance; there
is a statistically significant difference between the input test chemicals (P <0.001).

74
Figure 5.1: Murine local lymph node assay (LLNA) for BQ and its derivatives (a): BQ,
2-CBQ, 2,5-DCBQ and 2,6-DCBQ,
AOO BQ 2-CBQ 2,5-DCBQ 2,6-DCBQ
2D Graph 1
Sti
mu
lati
on
In
de
x
0
5
10
15
20
25
0.0
01
0.0
10
0.1
00
0.5
00
0.0
01
0.0
10
0.1
00
1.0
00
0.0
0005
0.0
005
0.0
05
0.0
10
0.0
01
0.0
10
0.0
50
0.1
00

75
Figure 5.2:Murine local lymph node assay (LLNA) for BQ and its derivatives :2-MBQ,
2,6-DMBQ and tBBQ produced clinical signs of systemic toxicity including weight loss,
lethargy and ruffled fur that gave poor dose-dependent proliferative responses and
preventing a reliable EC3 determination.
2-tBBQ EC3 could not be estimated using the LLNA due to systemic toxicity
observed and lack of dose-dependency of the lymph node cell proliferation in dosed
mice. In general, the predictive equation of Chipinda et al.57
that was generated from data
for multiple structurally diverse chemicals in the MA domain consistently overestimated
Dose (%)
AOO 2-MBQ 2,5-DMBQ 2-tBBQ BQ
Sti
mu
lati
on
In
de
x
0
10
20
30
40
0.0
10
0.1
00
1.0
010.0
0
0.1
00
0.5
00
1.0
00
10.0
0
0.1
00
0.5
00
1.0
00
10.0
0
0.5
00

76
the potency of the BQD series.
[CBQ]/(%)
0.0 0.2 0.4 0.6 0.8 1.0
Sti
mu
lati
on
In
de
x (
SI)
0
2
4
6
8
10
12
14
16
18
20
Figure 5.3: Stimulation index against concentration of CBQ.
Figure 5.3 is a dose response curve for shows the same results as Figure 5.1 for
CBQ results. The vehicle used to dissolve or suspend the test agent can influence the
results of the LLNA. When acetone olive oil (AOO; 4:1; v/v) was used as the vehicle,
3H-thymidine incorporation into proliferating mouse lymph node cells resulted in the
proliferative response shown in Figure 5.1 and 5.1 for BQD. There was a direct
relationship between SI and the concentrations of BQD. From this graph equation of the
y = 1.5 + 38.3x -21.3x2

77
graph was used to calculate the LLNA EC3 values which are listed on test compounds
listed in Table 5.2.
5.2.2 Correlation Analysis of Reactivity Data with LLNA EC3 Values
The pEC3 values for the test chemicals listed in Table 5.2 were plotted against
values to determine the relationship of the reactivity to the chemicals’ potency as
skin sensitizers. A plot of pEC3 values for 6 test chemicals is shown in Figure 2.5.
Figure 5.4: Plot of pEC 3 vs log ka of the 6 test chemicals in the Michael addition and
nucleophilic vinylic substitution reactivity domains. pEC3 was estimated using the LLNA
and log ka derived from reactivity toward NBT as previously reported.20
pEC 3 against log Ka
log (ka)
2 4 6 8
pE
C 3
0
2
4
6
BQ
2,5-DCBQ
2,6-DCBQ
2-CBQ
2-MBQ
2,5-DMBQ
pEC 3 = 0.20log(ka) + 0.18
95% Conf idence Band
95% Prediction Band
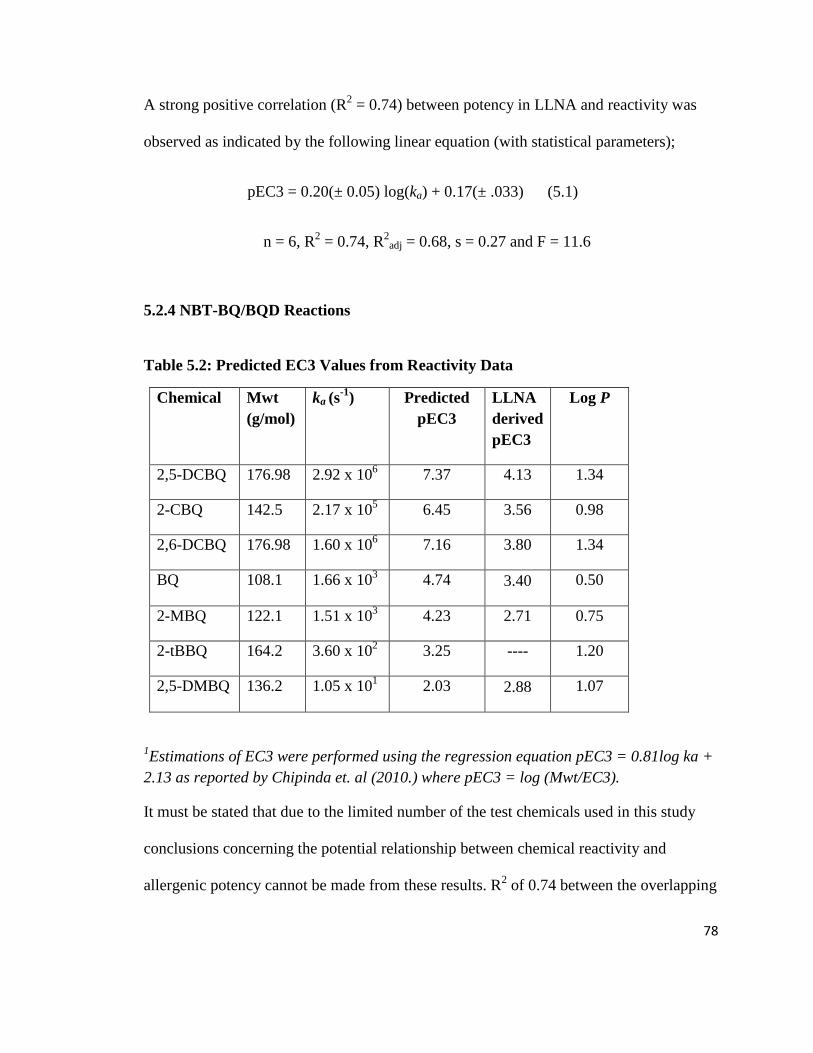
78
A strong positive correlation (R2 = 0.74) between potency in LLNA and reactivity was
observed as indicated by the following linear equation (with statistical parameters);
pEC3 = 0.20(± 0.05) log(ka) + 0.17(± .033) (5.1)
n = 6, R2 = 0.74, R
2adj = 0.68, s = 0.27 and F = 11.6
5.2.4 NBT-BQ/BQD Reactions
Table 5.2: Predicted EC3 Values from Reactivity Data
Chemical Mwt
(g/mol)
ka (s-1
) Predicted
pEC3
LLNA
derived
pEC3
Log P
2,5-DCBQ 176.98 2.92 x 10⁶ 7.37 4.13 1.34
2-CBQ 142.5 2.17 x 10⁵ 6.45 3.56 0.98
2,6-DCBQ 176.98 1.60 x 10⁶ 7.16 3.80 1.34
BQ 108.1 1.66 x 10³ 4.74 3.40 0.50
2-MBQ 122.1 1.51 x 10³ 4.23 2.71 0.75
2-tBBQ 164.2 3.60 x 10² 3.25 ---- 1.20
2,5-DMBQ 136.2 1.05 x 101 2.03 2.88 1.07
1Estimations of EC3 were performed using the regression equation pEC3 = 0.81log ka +
2.13 as reported by Chipinda et. al (2010.) where pEC3 = log (Mwt/EC3).
It must be stated that due to the limited number of the test chemicals used in this study
conclusions concerning the potential relationship between chemical reactivity and
allergenic potency cannot be made from these results. R2 of 0.74 between the overlapping

79
data of MA and SVN domains suggests that reactivity rate has greater influence than
chemical mechanistic domain toward a chemical’s allergenic potency.
Reaction rate constants of BQ and BQD toward NBT that were previously
determined,95
along with predicted EC3 values derived from equations reported by
Chipinda et al.21
correlating electrophilic allergen reactivity to NBT (ka(s-1
)) to pEC3 are
shown in Table 5.2. There was no observable relationship between solubility (log P) and
EC3 predicted by chemical reactivity across the entire set of test chemicals.
5.2.5 Prediction of EC3 Values from Reactivity Data
The ka values taken from Table 5.2 were used to predict EC3 values using linear
equation 5.2 which was derived by Chipinda et. al.57
utilizing a structurally diverse MA
domain data set where pEC3 is obtained by dividing the molecular weight (Mwt) of the
chemical by EC3 value and calculating the log. The results were compared with EC3
values obtained from the LLNA performed for these BQD.
pEC3 = 0.81 log(ka) + 2.13 (5.2)
pEC3 = log ((Mwt/EC3)) (5.3)
From the predicted EC3 values it was observed that the presence of the EDG on the BQ
reduces the LLNA potency of BQ (EC3; 0.002%) from an extreme sensitizer to a strong
sensitizer (2,5-DMBQ; EC3 = 1.28%). EWG were observed to increase the potency
rating of BQ by reducing the threshold that is needed to cause skin sensitization as shown
in Table 5.2.

80
5.2.6 Quantitative Mechanistic Modeling (QMM)
Hammett and Taft substituent constants were taken from Perrin et al.96
The
Hammett and Taft substituents and their constants are listed in Table 5.2, whilst the
structures of test compounds are given in Figure 5.2. The reaction sites are indicated by
the arrows.
Table 5.3: Substituent Constants, σ- and σ* Used to Calculate Values in Table 5.3
Chemical Hammett Constant
(σ-)
Taft Constant
(σ*)
Reference
p-Cl 0.24 2.96 96
m-Cl 0.37 2.96 96
o-Cl 0.68 2.96 96
H 0 0.49 96
p-CH3 -0.14 0.00 96
m-CH3 -0.06 0.00 96
o-CH3 -0.13 0.00 96
The calculated Hammett constants (∑σ-), for test compounds 2, 3, 5, 6 and 7 were
used whilst the calculated Taft constants (σ*) for test compounds 1, 5, 6 and 7 were used,
and these are listed in Table 5.3.
Table 5.4: Calculated Σσ- and σ* Values Used to Plot Figures 5.5 and 5.6
Chemical pEC 3 Hammett Constant
(Σσ-)
Taft Constant
(σ*)
BQ 1.36 0 0.49
2,5-DCBQ 1.88 -0.89 10.95*
2,6-DCBQ 1.55 -1.33 5.92
2-CBQ 1.41 -1.57 2.96
2-MBQ 0.62 -1.63 -
2,5-DMBQ 0.74 -1.77 -

81
Quantitative mechanistic modeling that correlates skin sensitization potency and
quantified by murine local lymph node assay (LLNA) EC3 data on a range of MA and
SVN domain electrophiles was used. The model takes the form pEC3 = a∑σ- + c for
Hammett constants or pEC3 = bσ*+ c for Taft constants (a, b, c and d being constants).97
This model is based on the Hammett σ- constant of the activating groups (Y) and the Taft
σ* constants of the leaving groups (X). Figure 5.2 shows the test chemicals used with
compounds 2, 3 and 4 having the deactivating groups (methyl and tert-butyl groups),
compounds 5, 6 and 7 with leaving groups (chlorine atom(s)) and compound 1 (with
hydrogen) which is the standard. The arrows on the compounds in Figure 5.2 indicate the
point of attack by soft nucleophile. Schemes 5.1 show the MA reaction mechanisms for Y
substituents and scheme 5.2 shows the SVN reaction mechanism for X substituents.
The MA reaction shown in Scheme 5.1 depends on the effectiveness of the Y
group to stabilize a negative charge on the carbon atom to which it is bound. Substituents
on the α- and β-carbon atoms can have strong influences on Michael reactivity. Electron-
donating substituents such as methyl groups reduce reactivity of compounds in the MA
domain, by an electronic effect and at times by steric effect depending on the size of the
substituent.98

82
Scheme 5.1: Michael addition reaction mechanism for methyl/tert-butyl substituted
benzoquinone derivatives with thiol containing proteins
Scheme 5.2: Nucleophilic vinylic substitution reaction mechanism for chlorine
substituted benzoquinone derivatives with thiol containing proteins
For present purposes, we define a strong activating group as an electronegative
substituent (X), ortho or para to the leaving group that is able to stabilize a negative
charge both by resonance and inductive effects. We also used ortho or para chloro group
as an example of a strong activating group. The ability of X to stabilize the negative
charge created in the transition state, when the bond between the attacking nucleophile in

83
not fully formed depends on its inductive effect which is modeled by Taft constant.99
If
this was the only effect to be considered, then we expected 2,6-DCBQ and 2,5-DCBQ to
have different Taft constants because difference in inductive effects of meta and para
chloro substituent(s).
Figure 5.5: Plot of pEC3 vs Taft Constant (Σσ*) for test compounds 1, 5, 6 and 7.
We got an equation of the linear plot of pEC3 against σ* for test compounds 1, 5, 6 and 7
as shown in Figure 5.6. The equation A4 is as follows,
pEC3 = 0.07(± 0.04) σ* + 1.28(0.18) (5.4)
n = 4, R2 = 0.60, R
2adj = 0.40, s = 0.18, F = 3.08
2D Graph 1
f = y0+a*x
0 2 4 6
pE
C3
0
1
2
3
4
5 pEC3(LLNA) = 0.07BQ
2-CBQ
2,5-DCBQ
2,6-DCBQ
95% Confidence Band 95% Prediction Band

84
Equation 5.4 is a QMM for LLNA skin sensitization potency of MA nucleophiles. Figure
5.5 shows the how equation 5.4 was obtained from the Taft constants of BQ and chloro
BQD. Equation 5.4 had R2 value of 0.60, and this lower correlation constant is due to the
fact that 2,5-DCBQ and 2,6-DCBQ are treated as if they have the same reactity by Taft
constants and yet LLNA EC3 values and the reactivity constants suggest that 2,5-DCBQ
is more reactive than 2,6-DCBQ. The order of the influence of the leaving group was 2,5-
DCBQ = 2,6-DCBQ> 2-CBD >BQ and this agreed with the order of reactivity of the
EWG BQD to NBT.
In the other model a different combination of activating groups (test compound 2,
3, 5, 6 and 7) were used. Regression analysis for the plot in Figure 5.6 using pEC3
against Σσ- gave the following equation:
pEC3 = 1.34(± 0.37)∑σ- + 3.18(± 0.56) (5.5)
n = 5, R2 = 0.76, R
2adj = 0.70, s = 0.26, F = 12.83
This equation (5.5) is a QMM for LLNA skin sensitization potency for SVN and MA
nucleophiles. Equations 5.4 and 5.5 together with equation 5.1 should act as the first
screening line for skin sensitizers which belong to MA and SVN domains, without the in-
chemico studies.

85
Figure 5.6: Plot of pEC3 vs Hammett Constant (σ-) for test compounds 2, 3, 5, 6 and 7.
5.3 DISCUSSION
The BQ moiety common to all test chemicals within this series was considered
important to allow an accurate comparison of the reactivity to NBT as well as allergenic
potency in the LLNA while avoiding potential confounders that may arise from structural
differences. From the LLNA data and prediction of EC3 values using rate constants, we
observed that BQD with electron withdrawing groups had the highest chemical potency
followed by unsubstituted BQ and the least potent were the BQD with electron donating
groups. This trend agreed well with what was expected because electron-donating
2D Graph 1
f = y0+a*x
-
-2.0 -1.8 -1.6 -1.4 -1.2 -1.0 -0.8
pE
C 3
(LL
NA
)
0
2
4
6
8
pEC 3(LLNA) = 1.34-+ 3.18
2,5-DMBQ
2-MBQ
2-CBQ
2,6-DCBQ
2,5-DCBQ
95% Confidence Band
95% Prediction Band
86
substituents such as methyl groups reduce reactivity while electron withdrawing
substituents such as halogens increase reactivity of compounds in the MA domain.98
It is
particularly striking that a relatively small changes in the BQ structure have a dramatic
impact on the LLNA EC3. This is observed when the LLNA EC3 decreases with
increasing number of chlorine atoms added to BQ (BQ > CBQ>DCBQ). The effect of
different positions on reactivity is observed between 2,5-DCBQ and 2,6-DCBQ in which
2,5-DCBQ (EC3= 0.013 %) was 2.15 times more reactive than the 2,6-DCBQ (EC3=
0.028 %). This is because the para- substituted EWG inductive influence on the leaving
group is greater than the meta substituted EWG.
The mono-BQD was less reactive than the DCBQ because BQD both EWGs on DCBQ
contribute to and thus increases the inductive effect over the mono-chloro BQD. The
other reason why DCBQs are apparently more reactive than mono-BQD is because of the
DCBQs bind at a 1:2 ratio with protein thiols versus the 1:1 protein thiol binding of
mono-BQD.95
As pointed out by Roberts and Aptula ( 2008),100
if kp and kr are the rate
constants for penetration and reaction with carrier protein respectively, and (D) is the
concentration of sensitizer applied at the skin surface, then the extent of carrier protein
binding PB after time (t) is given by:
PB = D{1 + [kr exp(-kpt) – kp exp( -krt)]/(kp – kr)} (1)
Since both penetration rates and reaction rates for sensitizers can range over several
orders of magnitude, in the vast majority of cases either kp » kr or kp « kr will apply.
87
Where penetration is faster than protein reactivity, i.e. kp » kr , the expression is simplified
to:
PB = D{1 + exp(-kpt)]} (2)
i.e. the extent of protein binding is dependent on the reaction rate but not on the
penetration rate.98
The weakest allergen in this study 2,5-DMBQ has an EC3 of 0.181 %
which could be considered an extreme sensitizer and would fall in the situation where kp
» kr . The reported order of reactivity of chlorine substituted BQs to NBT matched the
chemical potency in LLNA and partition coefficient (log P), i.e. BQ (log P = 0.497),
CBQ (log P = 0.980), 2,6-DCBQ (log P = 1.338) and then 2,5-DCBQ (log P = 1.341).
For the situation where the reaction is faster than penetration, i.e. kp « kr , the expression
is simplified to:
PB = D{1 - exp(-kpt)]} (3)
i.e. the extent of protein binding in the skin has greater dependence on the penetration
rate than the reaction rate. 100
We also observed the following trend in electron magnetic
resonance signal, BQ < CBQ < 2,6-DCBQ < 2,5-DCBQ, and this is the same trend that
LLNA EC3 values a following. We concluded that BQ radical may be playing a minor
role in haptenation of protens.101
This agrees well with what was previously suggested by
Christensson et al. (2006),74
that semiquinone radicals may act as a hapten.
From the predicted pEC3 values listed in Table 5.2, equation 5.1 over estimates
the chemical potency of the BQ and EWG BQD by 30 to 2000 fold. Potential reasons
for the limited accuracy of equation 5.1 in predicting EC3 values include a potential error

88
introduced by inclusion of multiple mechanistic domains, the influence multiple
intermediate species, and chemicals with multiple electrophilic moieties. The published
predictive equation also covered a wider range of chemical solubility’s, reactivities and
allergenic potencies. It must also be noted that BQ was the most reactive allergen in the
data set reported by Chipinda et. al.71
and the predicted values for the chloro-
benzoquinones were extrapolated beyond the tested data set. This assumed log-log
linearity of pEC3 vs. log Ka at the fastest reaction rates and this assumption may not have
been correct.
Figure 5.4 and equation 5.1 shows that LLNA of these benzoquinone derivatives
are dependent on reactivity alone, and no hydrophobicity parameter is needed to model
the data. This has been previously observed that the same applies for the Michael
acceptor domain: LLNA is dependent on reactivity but not on hydrophobicity.102
The low
value on log k coefficients suggests that the biological nucleophiles are 6 times less
selective than NBT which was used in this model. Another possibility is that the relevant
in vivo nucleophile is based on the selenocysteine, which is known to be present in the
skin protein subunit.103
The ionized SeH functional group is even softer nucleophile than
ionized SH group.92
The good correlation(R2 = 0.74) of equation 5.1 to the in vivo data
shows that it is not to use nucleophiles designed to closely resemble the in vivo
nucleophiles for models.
The influence of the activating groups was modeled by the sum of their (σ-)
values, (∑σ-). The calculated sum of the Hammett constants (∑σ-), predicted that the
order of influence of the substituents on BQ will follow the order, 2,5-DCBQ > 2,6-

89
DCBQ > 2-CBQ > 2-MBQ > 2,5-DMBQ and this agrees well the order of reactivity
constants listed in Table 3.2. When pEC3 (LLNA) were plotted against Hammett
constants (∑σ-), equation 5.5 was observed whose R2 = 0.76, and this is close the R
2
(0.74) obtained in equation 5.1. These correlation coefficients were lower than what we
obtained from equation 5.4 (Taft constants) because Taft constants treats 2,5-DCBQ and
2,6-DCBQ as if have the same reactivity and yet LLNA EC3 values and reaction rate
constants suggests that they are have different reactivities. The good correlation between
reactivity predictions using Hammett constants, NBT reactivity rate constants and EC3
estimates suggests that Hammett constants, where available, may provide good estimates
of chemicals’ relative skin sensitization potency.
5.4 CONCLUSION
It is generally accepted that chemical allergens must first bind to a protein to be
allergenic. The high correlation between chemical reactivity as demonstrated empirically
using the NBT assay, or through modeling using Hammett constants and the LLNA
threshold EC3 estimates of the BQ and BQD series suggest that the rate of chemical-to-
protein binding is a major determinant of skin sensitization potency. Influence of other
factors physical-chemical factors such as log P, mechanistic domain, and haptenated
protein stability on a chemical’s skin sensitization potency remains to be determined and
may vary between chemical classes. Skin sensitization to chemicals present in consumer
products and the workplace continues to be a major concern. The accuracy of the
prediction model proposed exceeded that of the LLNA for set of substances tested. EC3

90
measurements are reproducible in both intra- and inter-laboratory evaluations and are
stable over time which make reactivity model reliable for to determine relative potency,
so that potential skin sensitizers may be ranked and to provide a key input for skin
sensitization risk assessment. These models are very promising results point to a possible
future replacement of animal testing while maintaining the same degree of accuracy and
predictivity for human skin sensitizers.104

91
REFERENCE LIST
1. Nielsen, N. H.; Linneberg, A.; Menne, T.; Madsen, F.; Frolund, L.; Dirksen, A.;
Jorgensen, T. Allergic contact sensitization in an adult Danish population:
Two cross-sectional surveys eight years apart (The Copenhagen Allergy
Study). Acta Dermato-Venereologica 2001, 81 (1), 31-34.
2. Andersen, K. E. Occupational issues of allergic contact dermatitis. International
Archives of Occupational and Environmental Health 2003, 76 (5), 347-
350.
3. Jost, B. C. Allergic Contact Dermatitis. In The Washington Manual Allergy,
Asthma, and Immunology, 1 ed.; Jost, B. C., Abdel-Hamid, M. K.,
Friedman, E., Jani, A., Eds.; Lippincott Williams and Wilkins: Missouri,
2003; pp 74-76.
4. Kimber, I.; Maurer, T. Toxicology of Contact hypersensitivity; First ed.; Taylor &
Francis: London, 1996.
5. Karlberg, A. T.; Bergstrom, M. A.; Borge, A.; Luthman, K.; Nilsson, J. L. G.
Allergic Contact Dermatitis––Formation, Structural Requirements, and
Reactivity of Skin Sensitizers. 21 1, 53-69. Chemical research in
Toxicology. 2008.

92
6. Mathias, C. G.; Morrison, J. H. Occupational skin diseases, United States. Results
from the Bureau of Labor Statistics Annual Survey of Occupational
Injuries and Illnesses, 1973 through 1984. Arch. Dermatol. 1988, 124 (10),
1519-1524.
7. Al-Tamrah, S. A. Colorimeteric Determination of p-Benzoquinone,
Hydroquinone and Paracetamol. Arab Gulf J. Scient Res. , Math, Phys, Sci
1988, A6 (3), 363-375.
8. Cenas, N. K.; Pocius, A. K.; Kulys, J. J. Bioelectrocatalytic Conversion of
Substances on Polymer-Modified Electrodes. Bioelectrochemistry and
Bioenergetics 1984, 12 (5-6), 583-591.
9. Samsonova, L. V.; Nikiforov, G. A. Direct and Sensitized Photolysis of 1,4-
Benzoquinone Diazides in Organic-Solvents. Bulletin of the Academy of
Sciences of the Ussr Division of Chemical Science 1984, 33 (5), 943-947.
10. Kim, S. B.; Cai, C.; Faust, M. D.; Trenkle, W. C.; Sweigart, D. A. A Water-Stable
Organometallic Rhodium Quinone Catalyst and Its Recyclability.
Organometallics 2009, 28 (8), 2625-2628.
11. Wester, R. C.; Melendres, J.; Hui, X. Y.; Cox, R.; Serranzana, S.; Zhai, H. B.;
Quan, D. Y.; Maibach, H. I. Human in vivo and in vitro hydroquinone
topical bioavailability, metabolism, and disposition. Journal of Toxicology
and Environmental Health-Part A 1998, 54 (4), 301-317.

93
12. De Capitani, E. M.; Vieira, R. J.; Bucaretchi, F.; Fernandes, L. C. R.; Toledo, A.
S.; Camargo, A. C. Human accidents involving Rhinocricus spp., a
common millipede genus observed in urban areas of Brazil. Clinical
Toxicology 2011, 49 (3), 187-190.
13. Zhang, X. C.; Zwanziger, J. W. Design and applications of an in situ
electrochemical NMR cell. Journal of Magnetic Resonance 2011, 208 (1),
136-147.
14. Katritzky, A. R.; Odens, H. H.; Voronkov, M. V. Rubber chemicals derived from
conjugate addition. II. Synthesis of a novel class of benzoquinone
diimines. Rubber Chemistry and Technology 2001, 74 (5), 927-945.
15. Li, L.; Lee, L. J. Effects of inhibitors and retarders on low temperature free
radical crosslinking polymerization between styrene and vinyl ester resin.
Polymer Engineering and Science 2001, 41 (1), 53-65.
16. Neeraja, V.; Nadh, R. V.; Sundar, B. S.; Radhakrishnamurti, P. S. Kinetic studies
of thiocyanate and iodide oxidation with 2,6-dichloroquinone-4-chloro-
imide. A novel and a new oxidizing agent. Oxidation Communications
1998, 21 (3), 369-375.
17. Reszka, K.; Hartley, J. A.; Lown, J. W. Photosensitization by Selected Anticancer
Agents. Biophysical Chemistry 1990, 35 (2-3), 313-323.

94
18. Nguyen, B.; Gutierrez, P. L. Free-Radicals in Quinone-Containing Antitumor
Agents - Enzymatic Redox Reactions of Mitoxantrone. Abstracts of
Papers of the American Chemical Society 1989, 198, 15-MEDI.
19. Kwiek, J. J.; Haystead, T. A. J.; Rudolph, J. Kinetic mechanism of quinone
oxidoreductase 2 and its inhibition by the antimalarial quinolines.
Biochemistry 2004, 43 (15), 4538-4547.
20. Hansen, H. S.; Johansen, J. D.; Thyssen, J. P.; Linneberg, A.; Sosted, H. Personal
use of Hair Dyes and Temporary Black Tattoos in Copenhagen
Hairdressers. Annals of Occupational Hygiene 2010, 54 (4), 453-458.
21. Kneilling, M.; Caroli, U.; Grimmel, C.; Fischer, J.; Eichner, M.; Wieder, T.;
Maier, F. C.; Rocken, M.; Biedermann, T. Para-phenylenediamine-specific
lymphocyte activation test: a sensitive in vitro assay to detect para-
phenylenediamine sensitization in patients with severe allergic reactions.
Experimental Dermatology 2010, 19 (5), 435-441.
22. Gibbs; E.Don. Benzoquinone and hydroquinone derivatives for use as insect
feeding deterrents. 5780515, Jul 1, 1998.
23. Abraham, I.; Joshi, R.; Pardasani, P.; Pardasani, R. T. Recent Advances in 1,4-
Benzoquinone Chemistry. Journal of the Brazilian Chemical Society 2011,
22 (3), 385-421.

95
24. Basketter, D. A.; Blaikie, L.; Dearman, R. J.; Kimber, I.; Ryan, C. A.; Gerberick,
G. F.; Harvey, P.; Evans, P.; White, I. R.; Rycroft, R. J. G. Use of the local
lymph node assay for the estimation of relative contact allergenic potency.
Contact Dermatitis 2000, 42 (6), 344-348.
25. Holmdahl, M.; Ahlfors, S. R.; Holmdahl, R.; Hansson, C. Structure-immune
response relationships of hapten-modified collagen II peptides in a T-cell
model of allergic contact dermatitis. Chemical Research in Toxicology
2008, 21 (8), 1514-1523.
26. Field, S.; O'Sullivan, C.; Bourke, J. F. Allergic Contact Dermatitis from N,N-
Methylenebismorpholine in a Cutting Oil. Dermatitis 2010, 21 (5), 292-
293.
27. Cruz, M. T.; Neves, B. M.; Goncalo, M.; Figueiredo, A.; Duarte, C. B.; Lopes, C.
Effect of skin sensitizers on inducible nitric oxide synthase expression and
nitric oxide production in skin dendritic cells: Role of different
immunosuppressive drugs. Immunopharmacology and Immunotoxicology
2007, 29 (2), 225-241.
28. Fan, W.; Guo, L.; Tang, A.; Wan, Y. The pathogenesis role of Th1 and Th2 in
ACD mouse models induced by DNFB and FITC. Journal of Investigative
Dermatology 2005, 124 (4), A7.

96
29. Riis, J. L.; Johansen, C.; Vestergaard, C.; Bech, R.; Kragballe, K.; Iversen, L.
Kinetics and differential expression of the skin-related chemokines CCL27
and CCL17 in psoriasis, atopic dermatitis and allergic contact dermatitis.
Experimental Dermatology 2011, 20 (10), 789-794.
30. Gad, S. C. The mouse ear swelling test (MEST) in the 1990s. Toxicology 1994, 93
(1), 33-46.
31. Magnusson, B.; Kligman, A. M. The identification of contact allergens by animal
assay. The guinea pig maximization test. The Journal of investigative
dermatology 1969, 52 (3), 268-276.
32. About the Interagency Coordinating Committee on the Validation of Alternative
Methods (ICCVAM). http://iccvam. niehs. nih.
gov/about/about_ICCVAM. htm 2011.
33. About ECVAM. http://ecvam. jrc. it/ 2011.
34. Worth, A. P.; Bassan, A.; De, B. J.; Gallegos, S. A.; Netzeva, T.; Patlewicz, G.;
Pavan, M.; Tsakovska, I.; Eisenreich, S. The role of the European
Chemicals Bureau in promoting the regulatory use of (Q)SAR methods.
SAR QSAR Environ Res 2007, 18 (1-2), 111-125.
35. Herouet, C.; Cottin, M.; LeClaire, J.; Enk, A.; Rousset, F. Contact sensitizers
specifically increase MHC class II expression on murine immature
dendritic cells. In Vitr. Mol Toxicol 2000, 13 (2), 113-123.

97
36. Ashikaga, T.; Hoya, M.; Itagaki, H.; Katsumura, Y.; Aiba, S. Evaluation of CD86
expression and MHC class II molecule internalization in THP-1 human
monocyte cells as predictive endpoints for contact sensitizers. Toxicol In
Vitro 2002, 16 (6), 711-716.
37. Vandebriel, R. J.; Van Och, F. M.; van, L. H. In vitro assessment of sensitizing
activity of low molecular weight compounds. Toxicol Appl Pharmacol.
2005, 207 (2 Suppl), 142-148.
38. Gerberick, G. F.; Vassallo, J. D.; Bailey, R. E.; Chaney, J. G.; Morrall, S. W.;
Lepoittevin, J. P. Development of a peptide reactivity assay for screening
contact allergens. Toxicol. Sci. 2004, 81 (2), 332-343.
39. Maxwell, G.; Aeby, P.; Ashikaga, T.; Bessou-Touya, S.; Diembeck, W.;
Gerberick, F.; Kern, P.; Marrec-Fairley, M.; Ovigne, J. M.; Sakaguchi, H.;
Schroeder, K.; Tailhardat, M.; Teissier, S.; Winkler, P. Skin sensitisation:
the Colipa strategy for developing and evaluating non-animal test methods
for risk assessment. ALTEX. 2011, 28 (1), 50-55.
40. Aptula, A. O.; Roberts, D. W. Mechanistic applicability domains for nonanimal-
based prediction of toxicological end points: general principles and
application to reactive toxicity. Chem. Res. Toxicol. 2006, 19 (8), 1097-
1105.

98
41. Schultz, T. W.; Yarbrough, J. W.; Johnson, E. L. Structure-activity relationships
for reactivity of carbonyl-containing compounds with glutathione. SAR
QSAR Environ. Res. 2005, 16 (4), 313-322.
42. Schultz, T. W.; Carlson, R. E.; Cronin, M. T.; Hermens, J. L.; Johnson, R.;
O'Brien, P. J.; Roberts, D. W.; Siraki, A.; Wallace, K. B.; Veith, G. D. A
conceptual framework for predicting the toxicity of reactive chemicals:
modeling soft electrophilicity. SAR QSAR Environ. Res. 2006, 17 (4), 413-
428.
43. Schwobel, J. A. H.; Koleva, Y. K.; Enoch, S. J.; Bajot, F.; Hewitt, M.; Madden, J.
C.; Roberts, D. W.; Schutz, T. W.; Cronin, M. T. D. Measurement and
Estimation of Electrophilic Reactivity for Predictive Toxicology.
Chemical Reviews 2011, 111 (4), 2562-2596.
44. Divkovic, M.; Pease, C. K.; Gerberick, G. F.; Basketter, D. A. Hapten-protein
binding: from theory to practical application in the in vitro prediction of
skin sensitization. Contact Dermatitis 2005, 53 (4), 189-200.
45. Roberts, D. W.; Patlewicz, G.; Kern, P. S.; Gerberick, F.; Kimber, I.; Dearman, R.
J.; Ryan, C. A.; Basketter, D. A.; Aptula, A. O. Mechanistic applicability
domain classification of a local lymph node assay dataset for skin
sensitization. Chem. Res. Toxicol. 2007, 20 (7), 1019-1030.

99
46. Finley, K. T. Quinones. In Kirk-Othmer Encyclopedia of Chemical Technology, 4
th ed.; Kroschwitz, J. I., Ed.; John Wiley & Sons: New York, 1996; Vol.
20, pp 799-830.
47. Kutyrev, A. A. Nucleophilic Reactions of Quinones. Tetrahedron 1991, 47 (38),
8043-8065.
48. Bolton, J. L.; Trush, M. A.; Penning, T. M.; Dryhurst, G.; Monks, T. J. Role of
quinones in toxicology. Chemical Research in Toxicology 2000, 13 (3),
135-160.
49. Schultz, T. W.; Yarbrough, J. W.; Hunter, R. S.; Aptula, A. O. Verification of the
structural alerts for Michael acceptors. Chemical Research in Toxicology
2007, 20 (9), 1359-1363.
50. Davies, K. J. A.; Pryor, W. A. The evolution of Free radical biology & medicine:
A 20-year history. Free Radical Biology and Medicine 2005, 39 (10),
1263-1264.
51. Talupula, B. K. Cytotoxicity of PBN spin trap on A204 cells. Journal of
Advanced Pharmaceutical Research 2011, 2 (1), 9-17.
52. Fukuzumi, S.; Nakanishi, I.; Maruta, J.; Yorisue, T.; Suenobu, T.; Itoh, S.;
Arakawa, R.; Kadish, K. M. Formation of radical anions in the reaction of
p-benzoquinone and C-60 with alkoxide ions. Journal of the American
Chemical Society 1998, 120 (27), 6673-6680.

100
53. Joshi, R.; Ghanty, T. K.; Mukherjee, T. Formation of semiquinone radical in the
reaction of embelin (2,5-dihydroxy-3-undecyl-1,4-benzoquinone) with
reductants as well as oxidants. Characterization by pulse radiolysis and
structure investigation by quantum chemical study. Journal of Molecular
Structure 2009, 928 (1-3), 46-53.
54. Mcconnell, H. M. Indirect Hyperfine Interactions in the Paramagnetic Resonance
Spectra of Aromatic Free Radicals. Journal of Chemical Physics 1956, 24
(4), 764-766.
55. Rozeboom, M. D.; Tegmolarsson, I. M.; Houk, K. N. Frontier Molecular-Orbital
Theory of Substituent Effects on Regioselectivities of Nucleophilic
Additions and Cyclo-Additions to Benzoquinones and Naphthoquinones.
Journal of Organic Chemistry 1981, 46 (11), 2338-2345.
56. Roberts, D. W.; Aptula, A. O.; Patlewicz, G. Electrophilic chemistry related to
skin sensitization. Reaction mechanistic applicability domain
classification for a published data set of 106 chemicals tested in the mouse
local lymph node assay. Chem. Res. Toxicol. 2007, 20 (1), 44-60.
57. Chipinda, I.; Ajibola, R. O.; Morakinyo, M. K.; Ruwona, T. B.; Simoyi, R. H.;
Siegel, P. D. Rapid and Simple Kinetics Screening Assay for Electrophilic
Dermal Sensitizers Using Nitrobenzenethiol. Chem. Res. Toxicol. 2010, 23
(5), 918-925.

101
58. Hi-Tech Scientific Operator's Manual for the SF-61 DX2 Double-Mixing
Stopped-Flow Spectroflourimeter. 1997. Salisbury, UK, Hi-Tech Limited.
59. Mclauchlan, K. A. A Handbook of Nuclear Magnetic-Resonance - Freeman,R.
Nature 1988, 331 (6153), 221.
60. Mills, N. S.; Shanklin, M. Access to NMR Spectroscopy for Two-Year College
Students: The NMR Site at Trinity University. Journal of Chemical
Education 2011, 88 (6), 835-839.
61. Gottlieb, H. E.; Kotlyar, V.; Nudelman, A. NMR chemical shifts of common
laboratory solvents as trace impurities. Journal of Organic Chemistry
1997, 62 (21), 7512-7515.
62. Kleschyov, A. L.; Wenzel, P.; Munzel, T.; Analysis of the Electron paramagnetic
resonance (EPR) spin trapping of biological nitric oxide. Journal of
Chromatography B 2007, 851 (1-2), 12-20.
63. Banerjee, S.; Mazumdar, S. Electrospray Ionization Mass Spectrometry: A
Technique to Access the Information beyond the Molecular Weight of the
Analyte. International Journal of Analytical Chemistry 2011, 2012, 1-40.
64. Ho, C. S.; Lam, C. W.; Chan, M. H.; Cheung, R. C.; Law, L. K.; Lit, L. C.; Ng, K.
F.; Suen, M. W.; Tai, H. L. Electrospray ionisation mass spectrometry:

102
principles and clinical applications. The Clinical biochemist. Reviews /
Australian Association of Clinical Biochemists 2003, 24 (1), 3-12.
65. Cronin, M. T.; Bajot, F.; Enoch, S. J.; Madden, J. C.; Roberts, D. W.; Schwobel,
J. The in chemico-in silico interface: challenges for integrating
experimental and computational chemistry to identify toxicity. Altern. Lab
Anim 2009, 37 (5), 513-521.
66. Schultz, T. W.; Rogers, K.; Aptula, A. O. Read-across to rank skin sensitization
potential: subcategories for the Michael acceptor domain. Contact
Dermatitis 2009, 60 (1), 21-31.
67. Perrin, D. D.; Dempsey, B.; Serjent.E.P. pKa Prediction for Organic Acids and
Bases; First Edition ed.; Chapman and Hall, London and New York, 1981.
68. Haneke, K. E.; Tice, R. R.; Carson, B. L.; Margolin, B. H.; Stokes, W. S.
ICCVAM evaluation of the murine local lymph node assay. Data analyses
completed by the National Toxicology Program Interagency Center for the
Evaluation of Alternative Toxicological Methods. Regul. Toxicol
Pharmacol. 2001, 34 (3), 274-286.
69. Basketter, D. A.; Balikie, L.; Dearman, R. J.; Kimber, I.; Ryan, C. A.; Gerberick,
G. F.; Harvey, P.; Evans, P.; White, I. R.; Rycroft, R. J. Use of the local
lymph node assay for the estimation of relative contact allergenic potency.
Contact Dermatitis 2000, 42 (6), 344-348.

103
70. Kimber, I.; Dearman, R. J.; Basketter, D. A.; Ryan, C. A.; Gerberick, G. F. The
local lymph node assay: past, present and future. Contact Dermatitis 2002,
47 (6), 315-328.
71. Basketter, D. A.; Lea, L. J.; Dickens, A.; Briggs, D.; Pate, I.; Dearman, R. J.;
Kimber, I. A comparison of statistical approaches to the derivation of EC3
values from local lymph node assay dose responses. J. Appl. Toxicol.
1999, 19 (4), 261-266.
72. Dearden, J. C. In silico prediction of ADMET properties How far have we come?
Expert Opinion on Drug Metabolism & Toxicology 2007, 3 (5), 635-639.
73. Gurevitch, J. Sigma-Plot - Scientific Graphing Software. Quarterly Review of
Biology 1991, 66 (1), 115-116.
74. Christensson, J. B.; Matura, M.; Backtorp, C.; Borje, A.; Nilsson, J. L. G.;
Karlberg, A. T. Hydroperoxides form specific antigens in contact allergy.
Contact Dermatitis 2006, 55 (4), 230-237.
75. Spasojevic, I. Electron Paramagnetic Resonance - A Powerful Tool of Medical
Biochemistry in Discovering Mechanisms of Disease and Treatment
Prospects. Journal of Medical Biochemistry 2010, 29 (3), 175-188.
76. Chipinda, I.; Ajibola, R. O.; Morakinyo, M. K.; Ruwona, T. B.; Simoyi, R. H.;
Siegel, P. D. Rapid and Simple Kinetics Screening Assay for Electrophilic

104
Dermal Sensitizers Using Nitrobenzenethiol. Chemical Research in
Toxicology 2010, 23 (5), 918-925.
77. Davies, K. J. A. The evolution of Free Radical Biology & Medicine Still radical
after a quarter of a century. Free Radical Biology and Medicine 2010, 49
(12), 1825-1833.
78. Valgimigli, L.; Amorati, R.; Fumo, M. G.; DiLabio, G. A.; Pedulli, G. F.; Ingold,
K. U.; Pratt, D. A. The unusual reaction of semiquinone radicals with
molecular oxygen. Journal of Organic Chemistry 2008, 73 (5), 1830-
1841.
79. Shinde, S. S.; Hay, M. P.; Patterson, A. V.; Denny, W. A.; Anderson, R. F. Spin
Trapping of Radicals Other Than the (center dot)OH Radical upon
Reduction of the Anticancer Agent Tirapazamine by Cytochrome P(450)
Reductase. Journal of the American Chemical Society 2009, 131 (40),
14220-+.
80. Roberts, D. W.; Patlewicz, G.; Kern, P. S.; Gerberick, F.; Kimber, I.; Dearman, R.
J.; Ryan, C. A.; Basketter, D. A.; Aptula, A. O. Mechanistic applicability
domain classification of a local lymph node assay dataset for skin
sensitization. Chemical Research in Toxicology 2007, 20 (7), 1019-1030.
81. Yu, P.; Strug, I.; Cafarella, T. R.; Seaton, B. A.; Krantz, A. Site-specific
crosslinking of annexin proteins by 1,4-benzoquinone: a novel crosslinker

105
for the formation of protein dimers and diverse protein conjugates. Org.
Biomol. Chem. 2012, 10 (23), 4500-4504.
82. Chan, K.; Jensen, N.; O'Brien, P. J. Structure-activity relationships for thiol
reactivity and rat or human hepatocyte toxicity induced by substituted p-
benzoquinone compounds. J. Appl. Toxicol. 2008, 28 (5), 608-620.
83. Smith, P. A.; Bowerbank, C. R.; Savage, P. B.; Drown, D. B.; Lee, M. L.;
Alexander, W.; Jederberg, W. W.; Still, K. Conjugation of 7-
oxodehydroabietic acid to lysine, a haptenation mechanism for an oxidized
resin acid with dermal sensitizing properties. Applied Occupational and
Environmental Hygiene 1999, 3, 171-176.
84. Gerberick, G. F.; Vassallo, J. D.; Foertsch, L. M.; Price, B. B.; Chaney, J. G.;
Lepoittevin, J. P. Quantification of chemical peptide reactivity for
screening contact allergens: A classification tree lmodel approach.
Toxicological Sciences 2007, 97 (2), 417-427.
85. Enoch, S. J.; Cronin, M. T. D.; Schultz, T. W.; Madden, J. C. Quantitative and
mechanistic read across for predicting the skin sensitization potential of
alkenes acting via Michael addition. Chemical research in toxicology
2008, 21 (2), 513-520.

106
86. Karlberg, A. T.; Bergstrom, M. A.; Borje, A.; Luthman, K.; Nilsson, J. L. G.
Allergic contact dermatitis-formation, structural requirements, and
reactivity of skin sensitizers. Chem. Res. Toxicol. 2008, 21 (1), 53-69.
87. Song, Y.; Buettner, G. R.; Parkin, S.; Wagner, B. A.; Robertson, L. W.; Lehmler,
H. J. Chlorination Increases the Persistence of Semiquinone Free Radicals
Derived from Polychlorinated Biphenyl Hydroquinones and Quinones.
Journal of Organic Chemistry 2008, 73 (21), 8296-8304.
88. Landsteiner, K.; Jacobs, J. STUDIES ON THE SENSITIZATION OF ANIMALS
WITH SIMPLE CHEMICAL COMPOUNDS. II. J. Exp. Med. 1936, 64
(4), 625-639.
89. Basketter, D. A.; Balikie, L.; Dearman, R. J.; Kimber, I.; Ryan, C. A.; Gerberick,
G. F.; Harvey, P.; Evans, P.; White, I. R.; Rycroft, R. J. Use of the local
lymph node assay for the estimation of relative contact allergenic potency.
Contact Dermatitis 2000, 42 (6), 344-348.
90. Standard Practice for Testing Guinea Pigs for Contact Allergens: Guinea Pig
Maximization Test. F 720 - 81. 2002. West Conshohocken, American Society for Testing
and Materials.
91. Roberts, D. W.; Aptula, A. O.; Patlewicz, G. Electrophilic chemistry related to
skin sensitization. Reaction mechanistic applicability domain
classification for a published data set of 106 chemicals tested in the mouse
local lymph node assay. Chem. Res. Toxicol. 2007, 20 (1), 44-60.

107
92. Roberts, D. W.; Aptula, A. O.; Patlewicz, G. Y. Chemistry-Based Risk
Assessment for Skin Sensitization: Quantitative Mechanistic Modeling for
the SNAr Domain. Chem. Res. Toxicol. 2011, 24 (7), 1003-1011.
93. Roberts, D. W.; Aptula, A. O. Does the extreme skin sensitization potency of
benzoquinone result from special chemistry? Contact Dermatitis 2009, 61
(6), 332-336.
94. ECETOC . Contact sensitisation: classification according to potency: a
commentary. Document No. 43. 2003. Brussels, Belgium, European
Centre for Ecotoxicology and Toxicology of Chemicals.
95. Mbiya, W.; Chipinda, I.; Siegel, P. D.; Mhike, M.; Simoyi, R. H. Substituent
Effects on the Reactivity of Benzoquinone Derivatives with Thiols. Chem.
Res. Toxicol. 2012, 26 (1), 112-123.
96. Perrin, D. D.; Dempsey, B.; Serjent.E.P. pKa Prediction for Organic Acids and
Bases; First Edition ed.; Chapman and Hall, London and New York, 1981.
97. Roberts, D. W.; Aptula, A. O.; Patlewicz, G. Y. Chemistry-Based Risk
Assessment for Skin Sensitization: Quantitative Mechanistic Modeling for
the SNAr Domain. Chemical Research in Toxicology 2011, 24 (7), 1003-
1011.
98. Aptula, A. O.; Roberts, D. W. Mechanistic applicability domains for nonanimal-
based prediction of toxicological end points: General principles and

108
application to reactive toxicity. Chem. Res. Toxicol. 2006, 19 (8), 1097-
1105.
99. Roberts, D. W. Linear Free-Energy Relationships for Reactions of Electrophilic
Halobenzenes and Pseudohalobenzenes, and Their Application in
Prediction of Skin Sensitization Potential for Snar Electrophiles. Chem.
Res. Toxicol. 1995, 8 (4), 545-551.
100. Roberts, D. W.; Aptula, A. O. Determinants of skin sensitisation potential.
Journal of Applied Toxicology 2008, 28 (3), 377-387.
101. Kapungu, G. P.; Rukweza, G.; Tran, T.; Mbiya, W.; Adigun, R.; Ndungu, P.;
Martincigh, B.; Simoyi, R. H. OxyhalogenGÇôSulfur Chemistry: Kinetics
and Mechanism of Oxidation of Captopril by Acidified Bromate and
Aqueous Bromine. J. Phys. Chem. A 2013.
102. Roberts, D. W.; Natsch, A. High Throughput Kinetic Profiling Approach for
Covalent Binding to Peptides: Application to Skin Sensitization Potency
of Michael Acceptor Electrophiles. Chem. Res. Toxicol. 2009, 22 (3), 592-
603.
103. Lee, B. J.; Park, S. I.; Park, J. M.; Chittum, H. S.; Hatfield, D. L. Molecular
biology of selenium and its role in human health. Molecules and Cells
1996, 6 (5), 509-520.

109
104. Bauch, C.; Kolle, S. N.; Ramirez, T.; Eltze, T.; Fabian, E.; Mehling, A.; Teubner,
W.; van Ravenzwaay, B.; Landsiedel, R. Putting the parts together:
Combining in vitro methods to test for skin sensitizing potentials.
Regulatory Toxicology and Pharmacology 2012, 63 (3), 489-504.

![Guide to Theses Dissertations[1]](https://static.fdocuments.us/doc/165x107/577d21661a28ab4e1e952720/guide-to-theses-dissertations1.jpg)