Substantial Reduction in Boiler Steam and Oil Costs at ... · 2006 Forum on Energy: Immediate...
31
2006 Forum on Energy: Immediate Solutions, Emerging Technologies May 15-17 Appleton, WI Substantial Reduction in Boiler Steam and Oil Costs at Brazilian VCP-LA Mill through Six Sigma Thiago Alexandre Gazoni Votorantim Celulose e Papel
Transcript of Substantial Reduction in Boiler Steam and Oil Costs at ... · 2006 Forum on Energy: Immediate...

2006 Forum on Energy: Immediate Solutions,
Emerging TechnologiesMay 15-17
Appleton, WI
Substantial Reduction in Boiler Steam
and Oil Costs at Brazilian VCP-LA Mill
through Six Sigma
Thiago Alexandre GazoniVotorantim Celulose e Papel

Agenda
• Background of VCP-LA
• Objective
• Introduction
• Development
• Results
• Activities in development
• Conclusion

Background of VCP - LA
SÃO PAULO
VCP - L.A.

Background of VCP - LA
• Single pulp production line, 750 adt/d, started up in 1991
• Production capacity increased to 1000 adt/d in 1996
• Currently produces 1200 adt/d pulp and 950 ton/d paper
• Recovery boiler is the major bottleneck

Objective
• Mill 2004 target called for a 5%
reduction in steam production costs
of auxiliary boilers

Steam Production
Introduction
Boilers Steam Pressure Fuels Origin
Black Liquor Process of Pulp Production
3A Oil Mediator
Biomass Process of Pulp Production
Energetic Chip Florest / MediatorFirewood Florest / Mediator3A Oil Mediator
Auxiliary Boiler 3 4,5 Kgf/cm2 3A Oil Mediator
Recovery Boiler 67 Kgf/cm2
Auxiliary Boilers 1 and 2 67 Kgf/cm2

Steam and Energy Generation and Distribution
Introduction

Introduction
Production and Steam average cost of montly steam evolution produced by auxiliary boilers
65,0
67,0
69,0
71,0
73,0
75,0
77,0
79,0
Year 2000 Year 2001 Year 2002
ton/
h
100.000,0
150.000,0
200.000,0
250.000,0
300.000,0
350.000,0
400.000,0
450.000,0
500.000,0
US$/m
onth
Steam production Steam total cost (US$/mês)

Introduction
Evolution of specific oil consumption and steam cost
12,0
14,0
16,0
18,0
20,0
22,0
24,0
Year 2000 Year 2001 Year 2002
oil K
g / s
team
ton
1,0
3,0
5,0
7,0
US$ / steam
ton
Especific oil consumption Steam Cost

DevelopmentSteam Cost Components of Auxiliary Boilers
• Oil 3A • Firewood• Wood waste• Cane Trash• Energetic Chip• Diesel• Water• Boilers Feedwater• Electrical Energy• Ash Transportation• Operation materials
Fuels
Water
Electrical EnergyTransportationOperation Materials

Development
Biomass / Energ. Chip
Screw 1 e 2
Silo 1 Silo 1Silo 2 Silo 2
LST 20 BLST 22 BLST 29 B
LST 27 B
Boiler 1 Boiler 2
Furnace
Screw1 and 2
Screw 3 and 4
1 2 3 4
Furnace1 2 3 4
Grate Grate
AFF IAF AFF IAF
StackStack
Air FlowAir Flow
Gases
outlet
Gases Outlet
Biomass StockSupplyLegend:
LST: leather strap transporterAFF: Air Forced FanIAF: Induced Air fan
LST 28 B
Ilustrative Fluxogram for Fuels Feed System to Auxiliary Boilers 1 and 2
Screw1 and 2 Screw 3
and 4

Development
Pareto´s Graph for Steam Cost Macro Factors
3,05 2,34 1,47 0,00
93,15
020406080
100
Fuel
s
Ope
ratio
nM
ater
ials
Tran
spor
tatio
n
Wat
er
Ele
ctric
alE
nerg
y
(%)

Fuels Pareto´s Graph
52,78%
29,09%9,01% 8,75%
0,37% 0,00% 0,00%0%
20%
40%
60%
80%
100%
120%
Oil
3A
Fire
woo
d
Can
eTr
ash
Ene
rget
icC
hip
Die
sel
Was
teW
ood
GLP
Development

Development
Steam Cost for different fuels
$0,00
$27,52
$10,79
$13,62
$11,50
Oil 3A Firewood Waste Wood Cane Trash Energetic Chip

Development
Pareto´s Graph: Auxiliary Boilers Oil Consumption Reasons
33,04% 32,60%
22,35%
7,28%2,63% 1,90% 0,21%
0,0%
25,0%
50,0%
75,0%
100,0%
Ope
raci
onal
Mai
nten
ance
Lac
kof
Woo
d
Prog
ram
edSh
utdo
wn
Rec
over
yPr
oble
ms
Lac
kof
Bio
mas
s
Oth
ers

Development
61,03%
14,74% 11,96%5,80% 5,62%
0,53% 0,17% 0,12% 0,02%0,0%
20,0%
40,0%
60,0%
80,0%
100,0%
Stea
mD
eman
d
Bus
hes
AB
Pl
uggi
ng
Bio
mas
sU
mid
ity
Shar
p H
our
Ahs
Plug
ging
Com
unic
atio
nsPr
oble
ms
Flap
Bur
ners
Pareto´s Graph: Operation Oil Consumption Reasons

Development
Pareto´s Graph: Maintenance Oil Consumption Reasons
39,58%
16,98%11,97% 11,19% 8,26% 5,18% 3,26% 1,82% 1,11% 0,34% 0,32%
0,0%
25,0%
50,0%
75,0%
100,0%
Gri
ll
Bio
mas
sSy
stem
Fans
Bio
mas
sPr
even
tive
Silo
s
Bio
mas
sSr
ew
Flap
Pr
oble
ms
Ash
Syst
em
Ele
tros
tatic
Prec
ipita
tor
Cab
leB
urn
No
Bre
ak

Development
53,8
51,9
54,3
52,5
49,9
47,048,049,050,051,052,053,054,055,0
(%)
2000 2001 2002 2003 2004
Biomass Average Dry Content Evolution

Goal: 5,0% / steam ton
84.386US$ 11,24
US$ 569.123 US$ 10,68
Since April Reduction Goal Oil Reduction (ton) Oil 3A Cost Gain with reduction2.869,44 90,0% 382,59 3443,33 US$ 292,54 US$ 1.007.323,63.825,92
5.144,91 14,0% 4.424,62 720,29 US$ 210.715,52.343,65 21,3% 4.047,91 1097,00 Projeto BB US$ 531.635,82.801,26 3.327,62 US$ 320.920,3
5.213,57 5,2% 4.942,47 271,11 US$ 79.310,2768,72 35,3% 497,61 271,11
5.213,57 Oil consumption enlargement Loss with the Enlargement3.583,25 25,0% 6.516,96 1.303,39 US$ 381.299,31.630,32 6245,85
1.596,92 0,0% 0,00 0,00 US$ 0,001.596,92
4.228,33 Tons / year50.739,99 Steam tons21.141,66 Chip tons
15.781,32 US$ 1.236.971,711.552,99 US$ 25,634.228,33 US$ 541.940,93
US$ 695.030,75US$ 0,69US$ 10,55
Programed shut down,
Recovery Boiler problemsand others
Steam Cost reduction / ton: Final Steam Cost Price:
Real oil Consunmption in 2003:Oil consumption forecast to 2004:
Oil economy forecast to 2004:
Total gain with oil reduction:
Oil Substitution Costs by Energetic Chip / Firewood:
January to MarchApril to December
April to December
Total Oil Economy:Production that would be reached with oil:
Oil Substitution by Chip:
Estimated project real gain :
Firewood + Energetic Chip costs:
Specifics and General Goals
tons/monthAverage Steam Production expected to 2004:Average Steam cost expected to 2004:
Operation Reduction:
Bushes
Economy to be reached:
Lack of Biomass Reduction:
Maintenance Reduction:
Increase by Operating:
Others factors whose consumed oil:Oil Consumption (ton):
January to MarchIncrease Forecast
Gain with reduction
Gain with reduction
Gain with reduction
Oil 3A Cost
Oil 3A Cost
Oil 3A Cost
Oil 3A Cost
Oil Reduction (ton)
Oil Reduction (ton)
Oil Reduction (ton)
Reduction Goal
Reduction Goal
Reduction Goal
Oil Consumption (ton):
Oil Consumption (ton):
Oil Consumption (ton):
Oil Consumption (ton):
US$ 292,54
US$ 292,54
US$ 292,54
US$ 292,54

DevelopmentProcess Map
Legend: y: products parametersR: noise process (R* = critical)C: control process parameters ( C*= critical)Y: final parameter
Monitorate thefuels quality (firewood,
energetic chip, biomass, cane trash)
Produce Steam 1
y: fuels umidityy: fuels sizing
R* : Fuels heat powerR* : fuels umidityC*: fuels quantity
PP: Fuel to BurnPP: Steam to distribution
C*: biomass system disponibilityC*: ash system disponibilityC*: brun system disponibilityC*: oxygen concentration in the gasesç
C*: air flow to grateC*: fules quantity
Distribute the Steam1
Y: Steam Cost (TARGET)Y: Steam TemperatureY: Steam Pressure
PF: Steam to Consumers
C*: Steam to AtmosphereC*: basis weight / machines stabilityC*: pulp production / consumptionçC*: Weak Black Liquor ConcentrationçC*: black Liquor to another mill (Jacarei)í
R* : produção de vapor da Caldeira de Recuperação
y: high steam temperaturey: high steam pressure
R*: condensate flowR*: condensate temperatureR: condensate condutivityR: condensate pH
PP: Condensate to steam production
Steam to Consumers
y: fuels umidityy: fuels sizing
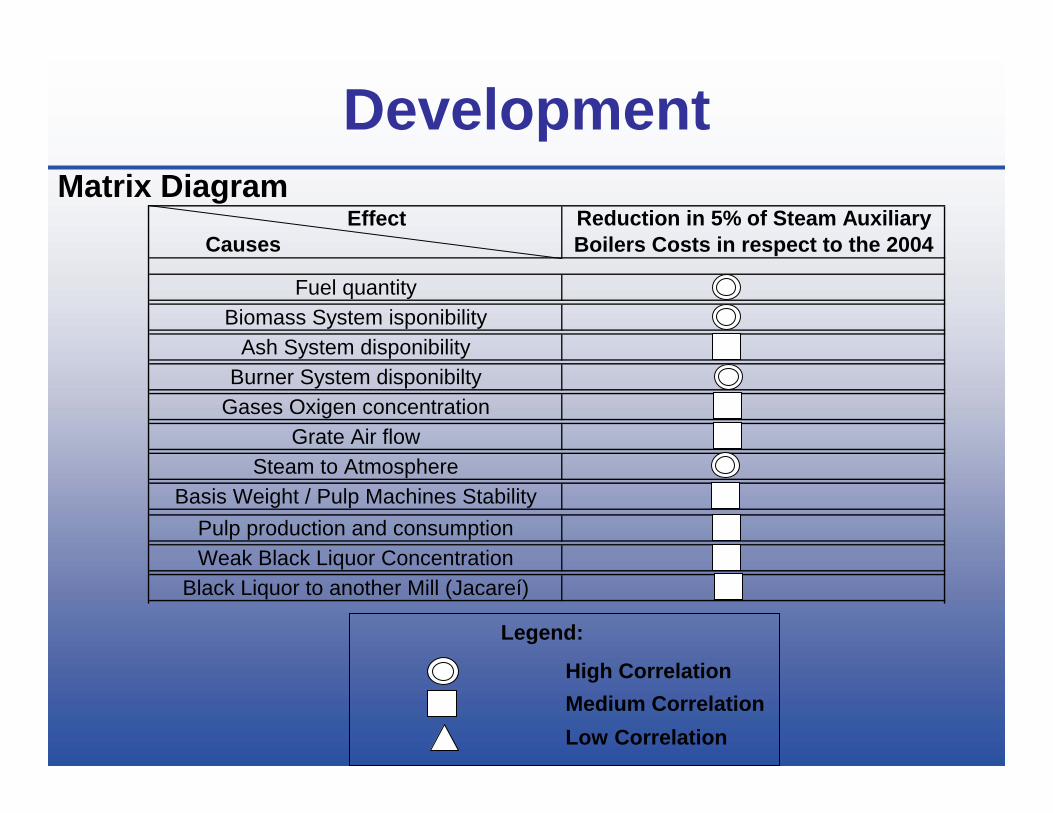
DevelopmentMatrix Diagram
Effect Causes
Fuel quantityBiomass System isponibility
Ash System disponibilityBurner System disponibilty
Gases Oxigen concentrationGrate Air flow
Steam to AtmosphereBasis Weight / Pulp Machines Stability
Pulp production and consumptionWeak Black Liquor Concentration
Black Liquor to another Mill (Jacareí)
Legend:
High CorrelationMedium CorrelationLow Correlation
Reduction in 5% of Steam Auxiliary Boilers Costs in respect to the 2004

Development
Action Plan
5 W
WhatWhoWhenWhyWhere
HowHow Much2 H

Development
LogicImplementation General
Shut down

Development
Logic was implementedin 2003 November
Logicimprovements
Logicimprovements
Electrical EnergyLogic Increase

Development
Control ChartImplantationIncrease
the high collectorpressure

Development
Goal implementationto recovery the efficiency
Increase of the work averagepressure of the high
pressure collector
Logic of improvementimplementation

Results
ItemOil
Consumption(ton)
GoalReduction
Real Reduction
Real OilConsumption
(ton)
Gain / LossWith
ReductionLach of Biomass 3.825,92 90,00% 95,2% 183,64 US$ 1.065.525,8
MaintenanceReduction 5.144,91 35,32% 52,1% 2.678,57 US$ 721.512,02
Operation Reduction(Bushes) 768,72 35,27% 61,7% 294,1 US$ 138.855,83
Increase byOperating 5.213,57 -25,00% -35,8% 7.027,50 US$ 530.653,18
Others factorswhose consumed
oil 2.617,76 0,00% 0,0% 0 US$ 0,00
US$ 731.643,69
US$ 11,24US$ 10,68
US$ 10,51
US$ 695.030,75
Average Steam Cost Expected to 2004:Economy to be Reached:Final Price of Steam Cost
(based on 2003 real oil consumption):Project Estimated Gain:
Project Real Gain:
Examination of Specific and General Goals

Results
Year:Steam
Production (ton)
Economy Goal
2004 Steam Cost Estimated
Real Steam Cost
Real Goal Reached
2004 1.012.632 5,00% $11,24 $8,16$569.122,73
Real payback reached by the project compared to the budget of
2004
Total estimated by the project
Real Payback reached by the project based on oil consumption
in 2003$731.643,69
$3.124.087,47
27,45%
US
US

Conclusion
• The cost of steam production by oil-fired boilers was
lowered by 27,5%;
• The oil consumption was lowered by 43,8%;
• The power generation was increased by 2,8%;
• The project led to development of a new energy
management concept;
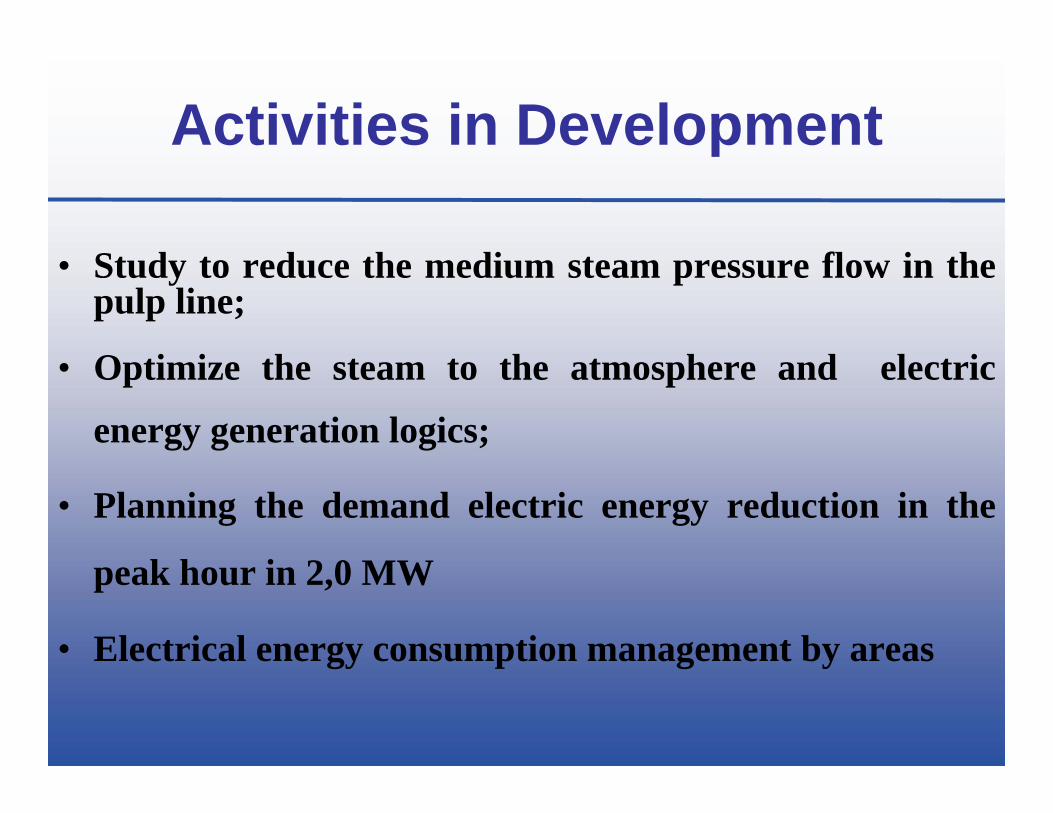
Activities in Development
• Study to reduce the medium steam pressure flow in thepulp line;
• Optimize the steam to the atmosphere and electric
energy generation logics;
• Planning the demand electric energy reduction in the
peak hour in 2,0 MW
• Electrical energy consumption management by areas