Market Regulation1 MARKET REGULATION Economics 2023 Principles of Microeconomics Dr. McCaleb.

Substance Name: Di-butyl phthalate
EC Number(s): 201-557-4
CAS Number(s): 84-74-2
Vienna, October 2013
ROHS ANNEX II DOSSIER FOR DBP
Proposal for restriction of a substance in electrical and electronic
substances under RoHS


ROHS Annex II Dossier for DBP
Vienna, October 2013 3
CONTENTS
CONTENTS ........................................................................................... 3
1 IDENTIFICATION, CLASSIFICATION AND LABELLING ............................................................................... 5
1.1 Identification .......................................................................................... 5
1.1.1 Name, other identifiers and composition of the substance ..................... 5
1.1.2 Physico-chemical properties ................................................................... 6
1.2 Classification and Labelling Status .................................................... 6
1.3 Legal status and use restriction .......................................................... 8
2 USE OF THE SUBSTANCE ....................................................... 9
2.1 Use and function of DBP in general .................................................... 9
2.2 Use of DBP in EEE ................................................................................ 9
2.3 Quantities of DBP used in EEE ............................................................ 9
3 HUMAN HEALTH ..................................................................... 10
3.1 Human health hazard assessments .................................................. 10
3.1.1 Endpoints of concern ............................................................................ 10
3.1.2 Existing guidance values ....................................................................... 11
4 ENVIRONMENT ....................................................................... 14
4.1 Environmental fate properties ........................................................... 14
4.2 Environmental hazard ......................................................................... 15
4.2.1 Eco-toxicity studies ............................................................................... 15
4.2.2 Potential for secondary poisoning ......................................................... 16
4.2.3 Existing guidance values ....................................................................... 17
5 WASTE MANAGEMENT OF ELECTRICAL AND ELECTRONIC EQUIPMENT .................................................... 18
5.1.1 WEEE categories containing DBP ........................................................ 18
5.1.2 Relevant waste materials/components containing DBP ....................... 18
5.2 Waste treatment processes applied to WEEE containing DBP ....................................................................................................... 18
5.2.1 Treatment processes applied ................................................................ 18
5.2.2 DBP flows during treatment of WEEE ................................................... 19
5.2.3 Treatment processes selected for assessment under RoHS ............... 22
5.3 Releases from the relevant WEEE treatment processes ................ 22
5.3.1 Shredding of WEEE .............................................................................. 22
5.3.2 Summary of releases from WEEE treatment ........................................ 26
6 EXPOSURE ESTIMATION ....................................................... 27
6.1 Human exposure assessment ........................................................... 27

ROHS Annex II Dossier for DBP
4 Vienna, October 2013
6.1.1 Exposure estimates of workers of EEE waste processing plants Exposure estimates of workers of EEE waste processing plants ..................................................................................27
6.1.2 Monitoring of human exposure at EEE waste processing plants .....................................................................................................29
6.2 Environmental exposure ....................................................................29
6.2.1 Exposure estimates for the environment due to WEEE treatment ...............................................................................................30
6.2.2 Exposure estimates: Shredding ............................................................31
6.2.3 Monitoring data: WEEE treatment sites/locations .................................31
7 IMPACT AND RISK ESTIMATION ........................................... 33
7.1 Impacts on WEEE management as specified by Article 6 (1) a .......................................................................................................33
7.2 Risks estimation for workers and neighbouring residents ............33
7.3 Risks estimation for the environment ...............................................34
8 ALTERNATIVES ...................................................................... 35
8.1 Availability of alternatives ..................................................................35
8.2 Hazardous properties of alternatives ................................................35
8.3 Conclusion on alternatives ................................................................36
9 SOCIO-ECONOMIC IMPACT ON THE PRODUCERS OF THE SUBSTANCE ............................................................. 38
9.1 Approach and assumptions ...............................................................38
9.2 Impact on producers of plasticisers and plastics ...........................39
9.3 Impact on EEE producers ..................................................................40
9.4 Impact on EEE users ..........................................................................40
9.5 Impact on waste management ...........................................................40
9.6 Impact on administration ...................................................................41
9.7 Total socio-economic impact .............................................................41
10 RATIONALE FOR INCLUSION OF THE SUBSTANCE IN ANNEX II OF ROHS ............................................................ 43
11 REFERENCES ......................................................................... 47
12 ABBREVIATIONS .................................................................... 50
13 LIST OF TABLES ..................................................................... 52
14 LIST OF FIGURES ................................................................... 53

ROHS Annex II Dossier for DBP
Vienna, October 2013 5
1 IDENTIFICATION, CLASSIFICATION AND LABELLING
1.1 Identification
1.1.1 Name, other identifiers and composition of the substance
Table 1: Substance identity and composition (Source: ECHA, 2008)
CHEMICAL NAME Dibutyl phthalate
EC NUMBER 201-557-4
CAS NUMBER 84-74-2
IUPAC NAME Dibutyl phthalate
INDEX NUMBER IN ANNEX VI OF THE CLP REGULATION
607-318-00-4
MOLECULAR FORMULA C16H22O4
MOLECULAR WEIGHT RANGE
278,34 g/mol
SYNONYMS di-n-butylphthalat, 1,2-Benzenedicarboxylic acid, dibutyl ester (9CI), Phthalic acid, dibutyl ester (6CI, 8CI), Bis-n-butyl phthalate, Butyl phthalate, DBP, DBP (ester), Dibu-tyl o-phthalate, Di(n-butyl) 1,2-benzenedicarboxylate, n-Butyl phthalate, Palatinol C, Phthalic acid di-n-butyl ester
Structural formula
Degree of purity ≥ 99%
Remarks --

ROHS Annex II Dossier for DBP
6 Vienna, October 2013
1.1.2 Physico-chemical properties
The physical chemical properties of DBP are summarised in Table 2.
Table 2: Physico-chemical properties of DBP (Source: ECHA, 2008)
Property Value
Physical state at 20°C and 101.3 kPa oily liquid
Melting/freezing point -69°C
Boiling point 340°C at 1,013 hPa
Vapour pressure 9.7 ± 3.3 x 10⁻⁵ hPa at 25°C
Water solubility 10 mg/L at 20°C
Relative density 1.045 g/cm3 at 20°C
Partition coefficient n-octanol/water (log POW)
log Kow 4.57 at 20°C
Henry´s law constant 0.27 Pa.m3/mol
Granulometry Not applicable
Flammability negative
Explosive properties negative
Oxidising properties negative
1.2 Classification and Labelling Status
The Classification, Labelling and Packaging (CLP) Regulation1 requires com-panies to classify, label and package their substances and mixtures before plac-ing them on the market. The regulation aims to protect human health and the environment by means of labelling to indicate possible hazardous effects of a particular substance. It should therefore ensure a proper handling, including manufacture, use and transport of hazardous substances.
DBP is listed in Annex VI of the CLP Regulation No 1272/2008 and is harmo-nised classified as depicted in Table 3.
In accordance with Directive 67/548/EEC DBP is classified as Repr. Cat. 2; R61 (may cause harm to the unborn child); Repr. Cat. 3; R62 (possible risk of im-paired fertility); N; R50 (very toxic to aquatic organisms) and labelled with sym-bols T,N and R 61/50/62; S53/45/61.
Additionally to the harmonised classification DBP is self-classified as Aquatic Chronic 1 and 2 by few manufacturers and/or importers. This information has been obtained from the C&L inventory provided by ECHA.2.
1 Regulation (EC) No 1272/2008 of the European Parliament and of the Council on classification,
labelling and packaging of substances and mixtures, amending and repealing Directives 67/548/EEC and 1999/45/EC, and amending Regulation (EC) No 1907/2006
2 for details see: http://echa.europa.eu/web/guest/information-on-chemicals/cl-inventory-database

RO
HS
Annex II D
ossier for DB
P
Vienna, O
ctober 2013 7
Table 3: Harmonised classification of DBP1
Index No
International Chemical Identifi-cation
EC No CAS No
Classification Labelling Spec. Conc. Limits, M-factors
Notes
Hazard Class and Category Code(s)
Hazard state-ment code(s)
Pictogram, Signal Word Code(s)
Hazard statement code(s)
Suppl. Hazard state-ment code(s)
607-318-00-4
DBP
dibutyl phthalate
201-557-4
84-74-2
Repr. 1B
Aquatic Acute 1
H360Df
H400
GHS09
GHS08
Dgr
H360Df
H400
-- -- --
1 Classification according to part 3 of Annex VI, Table 3.1 (list of harmonized classification and labelling of hazardous substances) of the CLP Regulation (EC) No 1272/2008 of the European
Parliament and of the Council of 16 December 2008 on classification, labelling and packaging of substances and mixtures, amending and repealing Directives 67/548/EEC and 1999/45/EC,
and amending Regulation (EC) No 1907/2006

ROHS Annex II Dossier for DBP
8 Vienna, October 2013
1.3 Legal status and use restriction
REACH Regulation3,4
DBP is included in Annex XIV - list of substances subject for authorisation - of the Regulation No. 1907/2006. Specific authorisation for DBP will be required for a manufacturer, importer or downstream user to place the substance on the market, use it in preparations or for the production of articles. DBP cannot be placed on the market or used after 21st of February 2015, unless an authorisa-tion is granted for the specific use or the use (e.g., medical devices) is exempt-ed for authorisation.
Furthermore, there are specific restrictions for certain phthalates in toys and childcare articles. DBP is included in Annex XVII (restrictions on the manufac-ture, placing on the market and use of certain dangerous substances, prepara-tion and articles) of the Regulation No. 1907/2006 (Annex XVII, group 51).
Following restriction conditions have to be taken into consideration for three phthalates, including DBP:
� in toys and childcare articles DBP, Benzyl butyl phthalate (BBP) and Bis(2-ethylhexyl)phthalate (DEHP) shall not be used as substance or in mixtures in concentrations greater than 0.1 % by weight of plasticised material;
� toys and childcare articles containing DBP, BBP and DEHP in a con-centration greater than 0.1 % by weight of plasticised ma-terial shall not be placed on the market.
Food Contact Material Regulation5
In the European Union certain restrictions on the use of DBP in food contact materials are implemented.
DBP can be used as plasticiser in repeated use materials and for articles con-taining non-fatty foods provided the migration of the plasticiser does not exceed the Substance Migration Limit (SML) of 1.5 mg/kg food.
Furthermore it can be used as technical support agent in concentrations up to 0.1% in the final product.
Cosmetic regulation6
DBP is prohibited to be used for the production of cosmetic products. It is listed in Annex II – list of substances prohibited in cosmetic substances to the Cos-metic Regulation.
3 Commission Regulation (EU) No 143/2011 of 17 February 2011 amending Annex XIV to Regula-
tion (EC) No 1907/2006 of the European Parliament and of the Council on the Registration, Eval-uation, Authorisation and Restriction of Chemicals ( ‘REACH’ )
4 Corrigendum to Commission Regulation (EU) No 143/2011 of 17 February 2011 amending Annex XIV to Regulation (EC) No 1907/2006 of the European Parliament and of the Council on the Reg-istration, Evaluation, Authorisation and Restriction of Chemicals ( ‘REACH’ )
5 Commission Regulation (EC) No 10/2011 of 14th January 2011 on plastic materials and articles intended to come into contact with food
6 Regulation (EC) No 1223/2009 OF THE EUROPEAN PARLIAMENT AND OF THE COUNCIL of 30 November 2009 on cosmetic products

ROHS Annex II Dossier for DBP
Vienna, October 2013 9
2 USE OF THE SUBSTANCE
2.1 Use and function of DBP in general
DBP is used as special plasticiser in minor concentrations in flexible PVC appli-cations as well as in non-polymers such as in paints, adhesives, sealants and printing inks.
Phthalates are not bound chemically in the polymer matrix (external plasticis-ers). The substance group can therefore migrate from the plasticised polymer by e.g. extraction with soapy water/oils, by evaporation and by diffusion (DEPA, 2010).
2.2 Use of DBP in EEE
Consumption of DBP has decreased because it is already substituted. Explicit use of DBP in EEE was not identified in a study carried out by the Danish minis-try of the environment (DEPA, 2010). There is limited information on the actual use of DBP in polymers.
The most likely applications are in PVC parts together with other plasticiser.
Based on the general knowledge of the application of DBP it is assumed that DBP can be part of following components in EEE: cables, plugs, “rubber” feet, tubes, coated baskets, sealing lists, glues and sealants, anti-slip coating, keys, decoration/printing, coated baskets, glues and sealants, shock absorbers
2.3 Quantities of DBP used in EEE
According to COWI (2009) the overall production of DBP in the EU was less than 10.000 tonnes in 2007. About 8.200 tonnes thereof were used for formula-tions within the EU. DBP represents about 1% of the total phthalate production in Europe.
It is assumed that DBP today is used by relatively few companies for different niche purposes. Detailed information on the use of DBP in the production of parts used in EEE is not available.
DBP quantity in European EEE
Thus for the purpose of the present assessment the DBP quantity entering the European market via EEE was estimated as follows:
DEPA (2010) estimates the amount of DBP used in EEE produced within the EU to be 50 to 500 tonnes per year. When assuming that ten times as much of DBP containing EEE is imported than produced domestically the total amount of DBP coming into use annually within EEE would be some 5,000 tonnes.

ROHS Annex II Dossier for DBP
10 Vienna, October 2013
3 HUMAN HEALTH
3.1 Human health hazard assessments
Hazard assessment in brief
An in-depth evaluation of potential risks of DBP to human health and/or envi-ronment has been performed within the EU Risk assessment report series (ECB, 2003).
Following conclusions have been drawn:
Data indicate low acute toxicity (oral LD50 rat ≥ 6.3 g/kg bw; inhalative LC50 rat ≥ 15.68 mg/L, dermal LD50>20g/kg bw). The outcome of toxicological studies revealed that the compound does not have irrtitative, corrosive or sensitising potential.
Based on the present information DBP can be considered as a non-genotoxic
and non-carcinogenic substance.
DBP exposure revealed adverse effects on the liver and kidney. A NOAEL for oral exposure of 152 mg/kg bw and a NOAEC for the inhalative route of 509 mg/m3 have been deduced from 13-week studies.
In developmental toxicity study DBP showed adverse effects on the reproduc-tive tract which can affect the fertility. The developmental toxicity in offspring in-dicate malformations of the reproductive tract and embroytoxic effects. Results of experimental animal studies are indicative that DBP possess anti-androgen like properties. Based on all available data an oral LOAEL of 52 mg/kg bw has been established for DBP within the EU risk assessment report series.
New available data indicate that the LOAEL for reprotoxic effects is lower as previously identified. The study of Lee et al. (2004) demonstrates delayed germ cell development in pre-pubertal rats and mammary gland changes in adult male rates exposed to 20 mg DBP/kg feed (corresponding to 1.5-3 mg/kg bw/day).
3.1.1 Endpoints of concern
The present assessment takes into cognisance the previous evaluation (ECB, 2003) carried out inter alia in order to determine the most sensitive and there-fore most relevant toxicological endpoint to be used for risk assessment. Detail findings of individual studies are not discussed in the present report.
Adverse effects on reproductive and developmental system
Several studies indicate that DBP has toxic effects on the reproductive and de-velopmental system (ECB, 2003; EFSA, 2005, ECHA, 2008).
These findings indicate that the most sensitive target organ system for DBP tox-icity is the male reproductive system.
A recent study in which DBP has been applied at dietary concentrations of 0, 20, 200, 2000 and 10000 mg/kg to maternal rats revealed toxic effects at the lowest dose applied (corresponding to 2 mg/kg bw/day) and is therefore re-garded as the most relevant study to deduce guidance values (EFSA, 2005;

ROHS Annex II Dossier for DBP
Vienna, October 2013 11
RAC, 2013). A NOAEL could not be established and a LOAEL based on loss of germ cell development and mammary gland change at 20 mg/kg in the diet was observed.
Endocrine disruption
DPB is in the EU EDS database listed as one of the 66 potentially endocrine substances with classification of high exposure concern (Annex 15).7 DBP has been classified as cat. 3 for wildlife, cat. 1 for Humans and Combined as cat. 1 (cat.1: Evidence for endocrine disruption in living organisms; cat. 2: Evidence of potential to cause endocrine disruption; cat.3: No evident scientific basis).
The developmental studies are indicative for its antiandrogenic effect (ECHA, 2008).
3.1.2 Existing guidance values
Occupational exposure limits (OELs)
An overview of national occupational exposure limits (OELs) within the Euro-pean member states as well as non-member states is provided by the European Agency for Health and Safety at work (EU-OSHA website8).OELs and guideline values in different countries are between 0.58-5 mg/m3 (GESTIS9).
The OEL derivation by the European Scientific Committee on Occupational Ex-posure limits (SCOEL) for DBP is currently on-going10.
Tolerable daily intake
According to the opinion of the Scientific Panel on food additives, flavourings, processing aids and material in contact with food (AFC) on a request from the Commission related to DBP for use in food contact materials a TDI of 0.01 mg/kg bw based on a LOAEL of 2 mg/kg bw/day (allocating an uncertainty fac-tor of 200) was established. The LOAEL was derived from a recent develop-mental toxicity study in rats carried out by Lee et al. (2004) showing develop-mental effects at 20 mg/kg bw.
Derived no effect level for DBP
For the present assessment Derived No Effect Levels (DNELs), which have been critically deduced and reviewed within the European Risk assessment Committee (RAC, 2013) are going to be used for further risk characterisation.
7 List of 66 identified EDS substances with high, medium and low exposure concern:
http://ec.europa.eu/environment/archives/docum/pdf/bkh_annex_15.pdf 8 EU-OSHA: https://osha.europa.eu/en/topics/ds/oel/nomembers.stm 9 GESTIS-GefahrenSToffInformationsSystem – database of hazardous substances provided by In-
stitute for Occupational Safety and Health of the German Social Accident Insurance (IFA); http://limitvalue.ifa.dguv.de/Webform_gw.aspx
10 SCOEL: http://ec.europa.eu/social/main.jsp?catId=148&langId=en&intPageId=684

ROHS Annex II Dossier for DBP
12 Vienna, October 2013
Point of departure
The point of departure for the DNEL derivation of DBP has been derived from the developmental toxicity study conducted by Lee et al., 2004, in which de-layed germ cell development in pre-pubertal rats and mammary gland changes in adult male rats exposed prenatally to ≥ 20 mg DBP/kg feed were observed. A LOAEL of 2 mg/kg bw/day has been identified.
Assessment factors
Assessment factors have been applied for inter- and intra-species difference. There are too many uncertainties to draw a conclusion whether humans are more, less or equal sensitive than rats, therefore default values for interspecies (default: 4x2.5) were used (RAC, 2013). Furthermore, a LOAEL – NOAEL ex-trapolation factor of 3 has been considered.
Oral DNEL
Applying the overall assessment factor of 300 an oral DNEL of 0.007 mg/kg/day was derived by the RAC for the general population.
Dermal DNEL
The oral NOAEL rat was converted into a dermal corrected NOAEL by correct-ing for differences in absorption between routes (10% absorption is considered for the dermal route). Further correction for exposure during 5 days a week in-stead of 7 days a week has been applied to derive a dermal DNEL for workers.
DNEL inhalation
The oral NOAEL in rat (in mg/kg bw/day) was converted into an inhalatory cor-rected NOAEC (in mg/m3) by using a default respiratory volume for the rat cor-responding to the daily duration of human exposure (RAC, 2013). For the gen-eral population the exposure is considered to be 24 hrs/per day and for workers 8 hrs. Furthermore, for workers light work was considered for the estimation of the respiratory volume.
In Table 4 the different determined DNELs for oral, inhalative and dermal expo-sure, as well as the assumed assessment factors for workers, general popula-tion (adults and children) are depicted.

ROHS Annex II Dossier for DBP
Vienna, October 2013 13
Table 4: Overview of the deduced derived no effect levels (DNELs) for DBP (Source:
RAC, 2013)11
Assessment Factors
Workers General population
(Adults& Children)
Interspecies, AF* 4 4
Interspecies, remaining differences 2,5 2,5
Intraspecies 5 10
Dose response (LOEAL to NAEL) 3 3
Quality of database 1 1
Applied Factor* 150 300
ORAL
Absorption (%) 100% 100%
LOAEL corrected (not relevant) 2
DNELs ORAL in mg/kg/d (not relevant) 0.007
DERMAL
Absorption (%) 10% 10%
LOAEL (corrected) 28 20
DNELs DERMAL in mg/kg/d 0.19 0.07
INHALATION
Absorption (%) 100% 100%
Standard respiratory volume in m3/kg bw per day
0.38 1.15
LOAEC (corrected)1 4.94 1.74
DNECs INHALATION in mg/m3 0.13 0.02
*interspecies AF was not applied when calculation inhalation DNECs
11 for details see:
http://echa.europa.eu/documents/10162/13579/rac_24_dnel_dbp_comments_en.pdf

ROHS Annex II Dossier for DBP
14 Vienna, October 2013
4 ENVIRONMENT
In the year 2003/04, beside the human health hazard assessment an in-depth evaluation of DBP and its effect on the environment has been published within the frame of the European risk assessment reports (ECB, 2003). In the follow-ing section the main conclusions and summaries of this assessment are de-picted.
4.1 Environmental fate properties
Biodegradation
There are evidences that DBP is ready biodegradable under aerobic conditions. Data indicate that biodegradation is slower under anaerobic conditions (sedi-ments, deeper soils or ground-waters). The hydrolysis of phthalate esters, such as DBP, is due to their structural characteristics rather low. In the atmosphere photo-oxidation contributes to the elimination of DBP.
There are two important steps in the metabolic pathway of aerobic or anaerobic biodegradation of phthalates, including DBP:
(1) the di-ester is hydrolysed into mono-esters (monobutyl phthalate and monobenzyl phthalate) by esterases with low substrate specificity
(2) the mono-esters are converted into phthalic acid
Experimental data indicate a half-life for DBP in the atmosphere of approxi-mately 1.8 days. Due to its intrinsic properties, DBP is not suspected to be per-sistent in water, air, or any other environmental compartments.
Bioaccumulation
The relatively high Kow of 4.57 of DBP indicates that the substance has a po-tential for bioaccumulation. However, the available BCF data demonstrate a relatively low bio-concentration potential. Studies carried out with 14C-labelled material result in higher BCF values (e.g., 5,000 and 6,700 for Daphnia magna and Gammarus pseudolimnaeus, respectively). However, these BCFs might lead to an overestimation due to the fact that beside the 14C-labelled DBP also its 14C-labelled metabolites are captured. Recently a guideline study under GLP conditions has been conducted determining a BCF of 1.8l/kg for carp. This study has been further considered by the assessor for the secondary poisoning estimation (ECB, 2003).
Persistence

ROHS Annex II Dossier for DBP
Vienna, October 2013 15
Table 5: Summary of selected environmental parameters of DBP and comparison
with PBT and POPs criteria
Parameter Outcome PBT criteria
(according REACH, Annex XIII)
POPs criteria (Stockholm Con-vention)
Atmosphere (half-life)
1.8 ds -- --
Log Kow 4.57 -- >5
Log Koc 6,340 l/kg
Bio-concentration factor
1,8 l/kg (carp) higher BCFs with 14C-labelled mate-rial
>2000 l/kg >5000 l/kg
T Reprotoxic 1B substance meets the criteria for classification for CMR substances (categories 1A-1B)
toxicity or ecotoxicity data indicating po-tential to damage human health or the environment
DBP does not fulfil all Persistence, Bioaccumulative and Toxic (PBT- criteria) criteria stipulated in Annex XIII of the REACH regulation nor all criteria of Annex d of the international Stockholm Convention (Annex D).
4.2 Environmental hazard
4.2.1 Eco-toxicity studies
Main conclusions on eco-toxicity studies
To determine the possible adverse effects of DBP in the aquatic environment numerous short as well as long-term aquatic toxicity studies are available and summarised in the European Risk assessment report (ECB, 2003).
An evaluation of test results revealed that the NOAEC of 100 µg/l achieved from a 99-day study carried out with Onchorhynchus mykiss is suitable as starting point for derivation of guidance values (see chapter 4.2.3) for the aquatic com-
partments.
To determine the adverse effects on organisms in the aquatic sediments no ex-perimental data have been available, the equilibrium method has been used to estimate possible toxic effects and guidance values.
For the determination of possible adverse effects of DBP on the terrestrial
compartment studies with invertebrates and plants have been carried out. Data evaluation revealed that the experiment in which seeds of corn Zea Mays were planted in sanded oil containing various levels of DBP could be used to derive a meaningful guidance value. The deduced NOEC in which no effect has oc-curred was 200 mg/kg.

ROHS Annex II Dossier for DBP
16 Vienna, October 2013
Numerous studies to determine the toxicity of butyl phthalates in the atmos-
pheric compartment have been conducted. Therefore, plants have been ex-posed to DBP vapour originating from plastics or from substrates contaminated with DBP. The study outcomes show a wide range of effect levels from 1.2 µg/m3 to 1000 µg/m3, which might be partly explained due to shortcomings of study designs. However, there is a common effect seen in most of the studies. The observed chlorosis (i.e., absence of or diminishing of chlorophylls) in the green parts of the plants resulted in inhibition of photosynthesis. There is a large difference in sensitivity among individual varieties. The most sensivitve plant species are cruciferae varieties, followed by tomato and spinach. Whereas relatively resistant to dibutyl phthalate exposure are for example lettuce, pea, grasses and nettle. Evaluation of data revealed an estimated NOEC of 0.1 µg/m3. A provisional PNEC of 0.01 has been derived; and the conclusion: there is a need for further testing has been driven. In the Addendum 2004 the results of a series of chronic plant toxicity studies were discussed. The tested species were representative of the European flora and included plant species represen-tative for crops, trees and natural vegetation (Phaseolus vulgaris (bean), Bras-sicacampestris var. chinensis (cabbage), Picea abies (Norway spruce), Tri-folium repens (white clover), Plantago major (plantain) and Holcus lanatus (common velvet grass. Visual injury was observed on all species, varying from chlorosis and necrosis, leaf crinkling to a total loss of colour in the leaves and needles. The EC10 (effect concentration measured as 10% effect) varied be-tween 0.12 (white clover) to 4.48 (bean). The mean EC10 in clover was 0.33 µg/m3, leading to a PNEC of 0.03. However due to pragmatic reasons the RAR defined a PNEC of 0.1µg/m3 (ECB, 2004) and the risk assessment for this end-point had been refined.
4.2.2 Potential for secondary poisoning
Secondary poisoning is a phenomenon related to toxic effects which might oc-cur in higher members of the food chain resulting from ingestion of organisms from lower trophic levels that contain accumulated substances. Thus, chemicals which have bioaccumulation and bio-magnification properties within the food chain may pose an additional threat.
An important factor to enter the food chain is the uptake of the substance by plants. However, there is evidence that phthalates are not up-taken by agricul-tural plants and thus uptake of phthalates via the soil path is negligible. Data in-dicate that a more important route for phthalates contamination is the air-plant route.
A study determining the egg shell characteristics of ring doves exposed to DBP (10 mg/kg) in the diet has been conducted. The egg shell thickness was found to be decreased by 10%, whereas the water permeability capacity increased (23%).
Within the EU risk assessment series (ECB, 2003) a LOAEL of 52 mg/kg bw from a rat reproduction toxicity study is used for the derivation of the predicted no effect concentration (PNEC) for secondary poisoning (see chapter 4.2.3).
ROHS Annex II Dossier for DBP
Vienna, October 2013 17
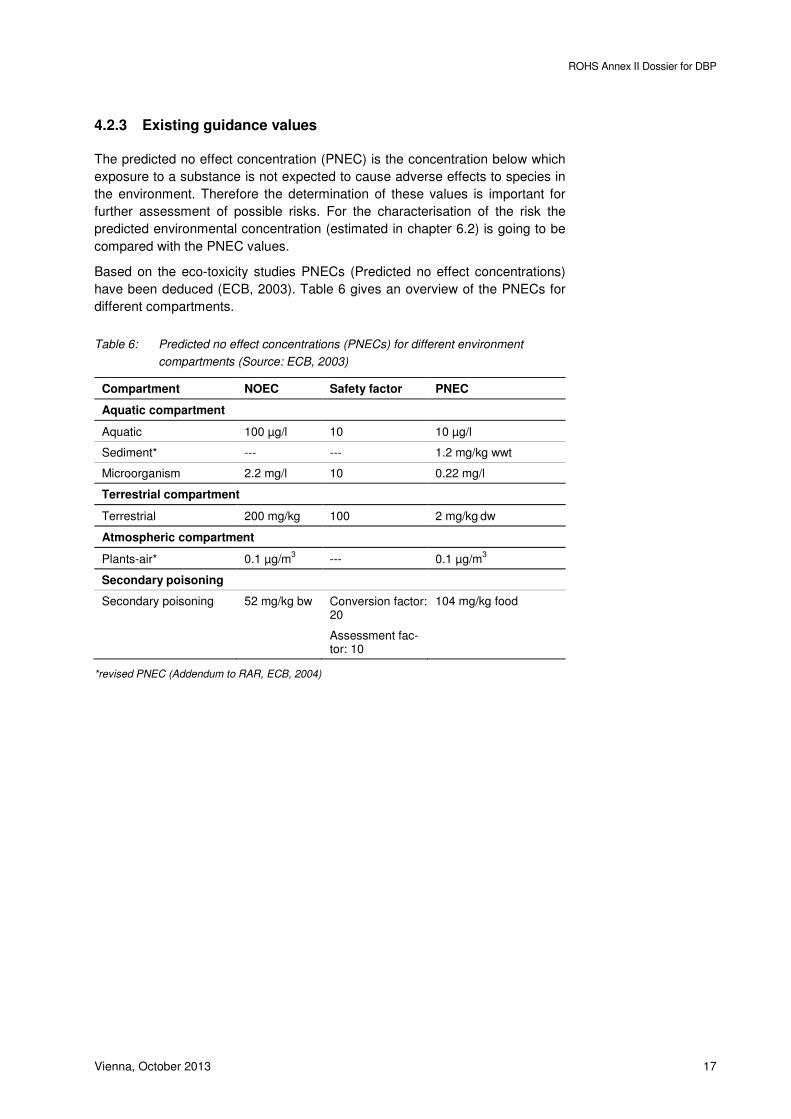
4.2.3 Existing guidance values
The predicted no effect concentration (PNEC) is the concentration below which exposure to a substance is not expected to cause adverse effects to species in the environment. Therefore the determination of these values is important for further assessment of possible risks. For the characterisation of the risk the predicted environmental concentration (estimated in chapter 6.2) is going to be compared with the PNEC values.
Based on the eco-toxicity studies PNECs (Predicted no effect concentrations) have been deduced (ECB, 2003). Table 6 gives an overview of the PNECs for different compartments.
Table 6: Predicted no effect concentrations (PNECs) for different environment
compartments (Source: ECB, 2003)
Compartment NOEC Safety factor PNEC
Aquatic compartment
Aquatic 100 µg/l 10 10 µg/l
Sediment* --- --- 1.2 mg/kg wwt
Microorganism 2.2 mg/l 10 0.22 mg/l
Terrestrial compartment
Terrestrial 200 mg/kg 100 2 mg/kg dw
Atmospheric compartment
Plants-air* 0.1 µg/m3 --- 0.1 µg/m3
Secondary poisoning
Secondary poisoning 52 mg/kg bw Conversion factor: 20
Assessment fac-tor: 10
104 mg/kg food
*revised PNEC (Addendum to RAR, ECB, 2004)
ROHS Annex II Dossier for DBP
18 Vienna, October 2013
5 WASTE MANAGEMENT OF ELECTRICAL AND ELECTRONIC EQUIPMENT
5.1.1 WEEE categories containing DBP
According to DEPA (2010) no information on the use of DBP in individual EEE categories is available.
As explained in Chapter 2 DBP may be used in any type of EEE as a plasticiser in minor concentrations in flexible PVC applications as well as in non-polymer applications such as in paints, adhesives, sealants and printing inks.
5.1.2 Relevant waste materials/components containing DBP
Main materials/components
Given the information on the use of DBP it is assumed that this amount, i.e. 5,000 t/a, will be contained in mixed “plastics” streams.
5.2 Waste treatment processes applied to WEEE containing DBP
5.2.1 Treatment processes applied
Initial treatment processes
Treatment of separately collected WEEE
Those WEEE, which are separately collected, are either manually dismantled or shredded. These may be performed in large-scale metal shredders, in many cases combined with automated material sorting, or specific shredders (e.g. horizontal cross-flow shredders, plants for treatment of screens etc.).
In shredding processes DBP will end-up most probably in mixed plastics en-riched fractions.
Given the fact that DBP cannot be allocated to any parts easily to remove it is assumed that also by manual dismantling of WEEE DBP is transferred to an unspecific mixed fraction.
Treatment of WEEE ending up in unsorted MSW
WEEE ending up in unsorted municipal waste are either incinerated or land-filled. Especially small appliances, which are easily thrown into a waste bin, are found in MSW.

ROHS Annex II Dossier for DBP
Vienna, October 2013 19
Treatment of WEEE exported
A relevant share of the potential WEEE arising – be it as waste or as “used goods” - are supposed to be shipped to third countries. These WEEE may un-dergo dismantling, dumping or any kind of combustions process.
Subsequent treatment processes
Treatment of shredder residues
Plastics containing fractions resulting from shredding of WEEE as well as from dismantling as the initial treatment are usually either:
� landfilled
� incinerated (incineration or co-incineration) in the form of mixed plastics en-riched fractions
� For the production of solid recovered fuels required for co-incineration, PVC has to be removed to comply with limit values for Chlorine. Thus it is as-sumed that DBP is predominantly treated in waste incineration plants.
� or treated in further treatment processes for separation of materials, e.g. in so called post-shredder processes
Treatment of plastics in third
Subsequent treatment of mixed plastics in third countries will be in many cases open burning or dumping.
5.2.2 DBP flows during treatment of WEEE
Waste management scenario for DBP containing WEEE
To evaluate which waste treatment processes are of relevance with regard to potential DBP releases and to estimate these releases, the following scenario for the treatment of DBP containing WEEE under current operational conditions was established:
It is assumed that the DBP-input into waste management by WEEE corre-sponds to the total quantity of DBP put on the European market via EEE12, i.e. 5,000 tonnes annually. Actual WEEE generation at a given time, e.g. based on models taking into account the life-time of particular equipment, was not con-sidered for the present assessment.
To estimate the flows of DBP entering individual treatment processes in particu-lar the following aspects were taken into account.
� the rate of separate collection of WEEE
� the rate of (illegal) shipment to third countries
� share of individual treatment processes applied to the relevant waste streams
12 Based on 9.4 Mio EEE put on the market 2010

ROHS Annex II Dossier for DBP
20 Vienna, October 2013
The treatment scenario was established on the basis of European WEEE statis-tics (Eurostat, WEEE data for 2010), assumptions made by EC (2008b) and own estimations.
Assumptions
WEEE treated in WEEE treatment plants in the EU
44 %13 of the overall WEEE arising14 are treated in WEEE treatment plants in
the EU (i.e. 4.1 Mio t/a).
Taking into account also the composition of WEEE that are reported to be sepa-rately collected (Eurostat, WEEE- statistics15) it is assumed that this amount is composed of:
� 61% (2.5 Mio t/a) large household appliances (assumption treatment: 80% shredder process; 20% manual dismantling)
� 7% (0.29 Mio t/a) small household appliances (assumption treatment: 100% shredder)
� 17% (0.7 Mio t/a) IT&T appliances incl screens (assumption treatment: 70% dismantling, 30% shredder)
� 15% (0.65 Mio t) thereof are consumer electronics incl. screens (assumption 30% dismantling, 70% shredder)
Thus for separately collected WEEE an overall share of 71% of shredding and a 29% of dismantling are assumed.
WEEE contained in unsorted MSW
13 % of the overall WEEE arising is not separately collected but ends up with unsorted MSW (i.e. 1.2 Mio t/a).
It is assumed that two thirds of MSW in the EU are landfilled, one third inciner-ated16.
WEEE shipped out of the EU
41 % of the overall WEEE arising (3.9 Mio t/a) are assumed to be shipped to third countries.
It is assumed that these are dumped or subjected to combustion.
Re-use of WEEE
A small share of an estimated 2% of WEEE being re-used is neglected within the present assessment.
13 WEEE reported to be collected separately, including also 11% of WEEE (particularly large house-
hold appliances) not reported to be separately collected but treated by the same processes as the comparable appliances reported as being separately collected.
14 For the purpose of the present assessment the WEEE arising is seen equal to the amounts put on the market
15 The shares of individual categories in the amounts reported tob e separately collected were used 16 See for example EEA (2013)

ROHS Annex II Dossier for DBP
Vienna, October 2013 21
Treatment of shredder residues / mixed plastics fractions
It is assumed that the total quantity of DBP entering WEEE shredder processes is transferred to shredder residues.
It is assumed that 2/3 of shredder residues resp. mixed plastics enriched frac-tions are landfilled and one third 1/3 is incinerated.
Treatment of mixed plastics fractions from dismantling
It is assumed that the total quantity of DBP entering WEEE dismantling is trans-ferred to any mixed fraction.
It is assumed that 2/3 of these fractions are landfilled and one third 1/3 is incin-erated. There is little indication that such mixed fractions are furhter seperated for recycling of particular polymers.
DBP input into WEEE treatment processes
Taking into consideration the material composition of WEEE and the estimates described in Chapter Fehler! Verweisquelle konnte nicht gefunden werden. “Quantities of DBP used in EEE” an average DBP content of 0.053 % in WEEE is assumed.
Based on these assumptions the following DBP quantities entering the individu-al treatment processes were estimated (see Table 7 below).
Table 8: Estimated quantities of DBP entering the main treatment processes for WEEE and secondary wastes
derived thereof (in tonnes per year)
WEEE Secondary wastes
Separately collected
WEEE
WEEE in unsorted wastes
WEEE shipped out
of the EU
Mixed plastics derived from dismantling
Shredder residues
Secondary wastes from uncontrolled WEEE treat-ment in third
countries (incl. )
Re-Use 100
Manual dismantling 638
Shredding (and auto-mated sorting)
1,563
Landfilling (EU) 430 423 1,033
Incineration (EU) 215 210 515
Uncontrolled WEEE treatment in third countries (disman-tling, dumping, burn-ing)
2,050

ROHS Annex II Dossier for DBP
22 Vienna, October 2013
5.2.3 Treatment processes selected for assessment under RoHS
In order to focus on those processes, where risks for workers or the environ-ment are most likely to be expected, the following treatment processes were se-lected for the present evaluation of potential risks:
� Mechanical treatment of WEEE in shredders, because it is applied to DBP containing parts of WEEE at several stages in the overall treatment chain at a large number of installations/locations.
The following treatment processes were NOT selected for a quantitative risk de-termination within this assessment:
� Manual dismantling, because - as there is neither a mechanical nor a ther-mal treatment releases to air, water and soil are assumed to be low (specific information on releases from / exposure through manual dismantling is not available)
� Land-filling, because WEEE or materials derived thereof are not the main source for DBP in wastes usually.
� Incineration under controlled conditions, because WEEE or materials de-rived thereof are not the main source for DBP in wastes usually. Furthermore a well-functioning emission control is assumed.
� Treatment processes under uncontrolled conditions, because WEEE and materials derived thereof are not the main source for DBP usually.
5.3 Releases from the relevant WEEE treatment processes
In the following information on and estimates of DEHP releases from the se-lected processes are summarized.
5.3.1 Shredding of WEEE
The most important route of BBP from shredding of WEEE or plastics materials thereof is considered to be via emissions of dust.
Emissions from shredders are typically abated by dust removal in a cyclone and a wet scrubber. According to the BREF WTI (EC, 2006) generic emission levels for dust (PM) associated to the use of BAT are in the range of 5-20 mg/Nm3. However, treatment of metal wastes, including WEEE, in shredders has been included into the scope of IED-Directive recently. Information on the actual dust emissions from shredders under current operational conditions is scarce17.
From EC (2007) estimates of the quantities of diffuse emissions of dust are available. They estimate an overall annual release of PM10 from European car shredders of 2,100 tonnes resulting from manipulation of fluff and fines18.
17 Dust concentrations between 1.3 and 18.7 mg/Nm3 for German shredders have been reported
(BDSV, 2012) 18 based on an assumption of 18% generation of fines/dust from materials treated in a shredder and
an emission factor of the dry material (g/kg) of 1 g/kg
Relevant processes
Less relevant
processes
Info on releases

ROHS Annex II Dossier for DBP
Vienna, October 2013 23
In order to estimate DBP releases via diffuse emissions of dust during manipu-lating material streams at sites where WEEE are shredded, the following as-sumptions were made:
� The total input of DBP into WEEE shredders was estimated to account for 1,563 t/a (compare DBP flows in Table 7)
� 90% of the DBP input into a shredder are transferred to fluff/fines/dust19
� 0.1% of fluff/fines/dust are emitted diffusely via PM10 (under dry conditions, watering of the material and other measures for prevention of diffuse emis-sions will reduce the percentage by one order of magnitude)
The total quantity of DBP emissions via diffuse dust emissions from sites, where WEEE are shredded, is estimated to range from 140 kg/a
20 to 1,400
kg/a21
.. The actual order of magnitude will depend on the degree to which BAT for preventing diffuse emissions from handling of shredded materials including e.g. encapsulation of aggregates or wettening of materials is applied.
Having in mind that not all shredders in the EU apply BAT, the estimation of DBP being emitted with residual emissions of dust is based on the upper value for BAT-AELs, i.e. 20 mg/Nm3. Furthermore an exhaust air flow of 20,000 m3/h22 and a treatment quantity of 60 t WEEE per hour23 was assumed. Fur-thermore, it was assumed that the DBP concentration in dust is the same than in the processed EEE.
Based on these assumptions24 the DBP via residual dust emissions is estimat-ed to account for 5.15 kg/a.
In order to estimate the DBP emissions per installation25
and day processing of WEEE in large-scale metal shredders was used as a reference. The follow-ing assumption was made:
� Typical daily WEEE throughput in a large-scale metal shredder is 250 tonnes26
Based on the resulting daily DBP input per installation of 133 kg and using the release factors for DBP as illustrated above the following DBP releases per in-stallation and day are estimated:
� 11.6 to 116 g of DBP are emitted diffusely via particulates
� 0.43 g of DBP are emitted after de-dusting.
19 Assumption based on Morf et al. (2004) 20 RFair…0.09 g/kg 21 RFair…0.9 g/kg 22 E.g. described by Ortner (2012) 23 Umweltbundesamt (2008) 24 RFair…0.0033 g/kg 25 According to EC (2007) there are 220 large scale shredders in the EU-25 26 Capacities of Austrian ELV-shredders: 25 – 60 t/h, assumption 7 working hours per day
Assumptions
concerning diffuse
emissions
Estimates of diffuse
emissions
Assumptions
channelled
emissions
Estimates
channelled
emissions
Releases per
installation and day

ROHS Annex II Dossier for DBP
24
In general there is a tendency to further process mixed shredder residues with the aim to recover valuable meals and also to achieve legally binding recycling targets. In order to obtain recyclable metaltechniques are used. These include also various types of mechanical treaments, such as shredding, milling, etc., where dust is generated. It is athat not all of those installations are equipped with effictechniques. Additional DBP releases via dust from processing of shredder resdues in such installations are likely.
Emissions to water and soil from shredding are considered to be negligi
Treatment of WEEE in largecess, where workers primarily manipulate the material outdoors using various work machines, partly sitting in closed cabins.
Figure 1:
Other mechanical processes where WEEE are treated cross flow shredders or special drums may be completedthe disintegrated appliances along a convplaces may be sucked or not. Usually workers are required to use masks for prevention of dust inhalation, however, the practical implementation is consiered improvable.
Workplace
description
mechanical
treatment of WEEE
In general there is a tendency to further process mixed shredder residues with the aim to recover valuable met-als and also to achieve legally binding recycling targets. In order to obtain recyclable metal-rich concentrates, several automatechniques are used. These include also various types of mechanical treaments, such as shredding, milling, etc., where dust is generated. It is athat not all of those installations are equipped with effictechniques. Additional DBP releases via dust from processing of shredder resdues in such installations are likely.
Emissions to water and soil from shredding are considered to be negligi
Treatment of WEEE in large-scale metal shredders is a highly automated prcess, where workers primarily manipulate the material outdoors using various work machines, partly sitting in closed cabins.
Large-scale metal shredder plant (Source: Umweltbundesamt, 2008)
Other mechanical processes where WEEE are treated including cross flow shredders or special drums may be completed the disintegrated appliances along a conveyer belt. The air at these indoor work places may be sucked or not. Usually workers are required to use masks for prevention of dust inhalation, however, the practical implementation is consiered improvable.
Vienna, October 2013
ich concentrates, several automated sorting techniques are used. These include also various types of mechanical treat-ments, such as shredding, milling, etc., where dust is generated. It is assumed that not all of those installations are equipped with efficient dust prevention techniques. Additional DBP releases via dust from processing of shredder resi-
Emissions to water and soil from shredding are considered to be negligible.
shredders is a highly automated pro-cess, where workers primarily manipulate the material outdoors using various
shredder plant (Source: Umweltbundesamt, 2008)
including e.g. horizontal by manual sorting of
eyer belt. The air at these indoor work places may be sucked or not. Usually workers are required to use masks for prevention of dust inhalation, however, the practical implementation is consid-
Further
considerations

ROHS Annex II Dossier for DBP
Vienna, October 2013 25
Figure 2: Manual sorting of disintegrated WEEE (Source: Umweltbundesamt, 2008)
For the further mechanical treatment of mixed shredder residues different op-tions are realized. Installations exist where the – mostly encapsulated – aggre-gates are operated outdoors or partly encased. Thus material manipulation by workers is carried out outdoors or in partly encased places with natural ventila-tion.
Figure 3: Installation for further treatment of mixed shredder fractions (Source:
Umweltbundesamt, 2008)
Other installations have fully encapsulated grinding and sorting aggregates sit-uated in a closed building with indoor air extraction. The manipulation of the ma-terial is carried out both, indoors and outdoors.

ROHS Annex II Dossier for DBP
26 Vienna, October 2013
5.3.2 Summary of releases from WEEE treatment
Table 7: Estimated total DBP releases from WEEE treatment processes in the EU (in
kg per year)
Air (particulates) diffuse Air (particulates) chan-nelled
Shredding (and automated sorting) of WEEE
140 – 1,400 5.15
Total 145 – 1,405
Table 8: Estimated local DBP releases from WEEE treatment processes in the EU (in
g per installation and day)
Air (particulates) diffuse Air (particulates) chan-nelled
Shredding (and automated sorting) of WEEE
11.6 - 116 0.43

ROHS Annex II Dossier for DBP
Vienna, October 2013 27
6 EXPOSURE ESTIMATION
6.1 Human exposure assessment
Humans are exposed to DBP via use of consumer products, indirect envi-ronmental exposure and/or due to occupational exposure. DBP has been found in air, water and soil and dietary products. Thus, human exposure can be through contaminated air, water, soil and food.
General population
The maximum dietary intake of DBP is estimated to be 1.9 mg/day with a calcu-lated average intake of 0.23 mg DBP/day based on a study carried out in Eng-land (MAFF, 1987, cited in ECB, 2003). In a Dutch review the average daily in-take was estimated to be 0.5-1.5 mg/person/day (RIVM, 1991; cited in ECB, 2003).
Additionally, to the oral intake the general population might be exposed through inhalation or dermal contact.
Human breast milk
A recently conducted study with 30 volunteers in Germany median DBP con-centrations of 0.6 ng/g were identified (Zimmermann, 2012).
Within the EU risk assessment report a range of DBP levels in human breast milk 10 to 51 µg/kg (ECB, 2003) was identified.
6.1.1 Exposure estimates of workers of EEE waste processing plants Exposure estimates of workers of EEE waste proc-essing plants
The exposure estimation performed within this assessment is based on the as-sumptions and calculations provided in the chapter waste treatment and re-leases of DBP.
Within the frame of the process of registration of substances under REACH several guidance documents and supporting tools for exposure estimation have been introduced.
One of these tools, the TRA (Targeted Risk Assessment) tool has been estab-lished and developed by ECETOC to align with the expectations contained in Chapters R12-R16 of the Technical Guidance on Information Requirements and Chemicals Safety Assessment by ECHA and is frequently used by industry and also integrated in the Chesar tool, which is provided by ECHA.
Within this assessment the TRA tool 3.0. has been used to estimate exposure of workers.
Two scenarios have been selected as relevant regarding exposure due to waste management operations (see chapter 5.2.).
� shredding of WEEE containing DBP, where exposure mainly occurs through dermal uptake and inhalation of dust (see chapter 5.3)
ECETOC TRA

ROHS Annex II Dossier for DBP
28 Vienna, October 2013
One limitation of the TRA model is that waste treatment processes are not indi-cated explicitly by the uses and processes which can be selected, as the TRA tool is intended for industrial processes like manufacture or formulation.
Therefore the most appropriate processes to describe the exposure conditions of waste treatment processes have been chosen.
6.1.1.1 Exposure estimates: Shredding
As described above no process category for shredding is available. In order to select exposure conditions which are comparable with shredding- processes the process category 24: “high (mechanical) energy work-up of substances bound in materials and/or articles” has been selected. Further description of these pro-cesses is given in the REACH guidance document R.12: “substantial thermal or kinetic energy applied to substance by hot rolling/forming, grinding, mechanical cutting, drilling or sanding. Exposure is predominantly expected to be to dust” (ECHA, 2010).
No explanation on the differences of the subcategories 24 a, b, c is given in the R12 guidance nor in the ECETOC guidance (ECETOC, 2012); therefore all three subcategories have been selected.
Further selected input parameters: professional use of solid substance with high dustiness, 8 hours activity (>than 4 hours), outdoors, no respiratory protection or gloves (dermal PPE - personal protective equipment). Further 100% of sub-stance in the preparation (>25%) has been applied. The results were then cor-rected taking into account the calculated average DBP content of EEE (Chapter 2.3) and information on transfer of DBP to dusts from WEEE shredding (see Chapter 5.3.1). Thus the estimate of an average content of DBP in the dust of WEEE shredders is 0.053%. In table 9 the results of the assessment are summarized.
Table 9: Results of the ECETOC-TRA model for exposure and risk of shredding
Parameter PROC
Process
category
Long-term Inhalative Exposure Estimate (ppm for volatiles) / (µg/m3 for solids)
Long-term Inhalative Exposure Es-timate (µg/m3)
Long-term Dermal Ex-posure Esti-mate (µg/kg/day)
conc. solid 24a 2100 2100 2830
conc. solid 24b 3500 3500 2830
conc. solid 24c 14000 14000 2830
DBP 24a 0.11 0.11 0.15
DBP 24b 0.19 0.19 0.15
DBP 24c 0.74 0.74 0.15
DNEC/DNEL 4940 4940 190
*RCR 24a 0.00002 0.00002 0.001
*RCR 24b 0.00004 0.00000 0.001
*RCR 24c 0.00015 0.00015 0.001
*RCR: Risk Characterization Ratio
Limitations

ROHS Annex II Dossier for DBP
Vienna, October 2013 29
The comparison of exposure levels with hazard thresholds lead to the risk char-acterization. Dividing the exposure concentration by the derived hazard value (here: DNEC or DNEL) gives the risk characterization ratio (RCR): a RCR above 1 indicates a risk for human health for the mentioned concentration and route of exposure. By comparison of the derived exposure concentrations with the DNELs respectively DNECs derived by the RAC committee it can be seen that no risk is expected.
6.1.2 Monitoring of human exposure at EEE waste processing plants
Due to our knowledge there is no human bio-monitoring study investigating phthalate and/or phthalate metabolite concentrations in biological matrices of workers or neighbouring residents of WEEE plants.
6.2 Environmental exposure
DBP might be released to the environment during its whole production and sub-sequent life-cyle, including its disposal. Monitoring studies indicate that DBP is widespread in the environment (ECB, 2003, ECHA, 2008).
The studies summarised in the EU RAR as well as those depicted in the Annex XV document (Identification of SVHC-DBP) (ECHA, 2008) have been consid-ered in the following section (for details see ECB, 2003, ECHA, 2008).
Few monitoring studies are summarised in the EU RAR in which DBP concen-tration levels have been determined in the air. The DBP concentration levels measured in European countries are in the range of 0.23-77 ng/m3.
Numerous studies have been conducted determining concentration levels of DBP in surface water samples. The values of most samples are below or slightly higher than 1 µg/l. Higher DBP concentration levels might be attributed to industrial activities and urbanisation. DBP concentrations measured in influ-ents and effluents of sewage treatment plants vary between the studies. The concentration levels in influents ranged from < 0.09-200 µg/l (ECB, 2003). The DBP exposure levels in effluents were up to 100 fold lower indicating that DBP is adsorbed. Concentrations levels in effluents are in the range of <0.09-6 µg/l.
DBP concentration measured in various sediment (lake, river, seawater) sam-ples range from 0.001 to 2.4 mg/kg. The highest value of DBP exposure levels in soils was detected in topsoil (43 µg/kg dwt), followed by compost (ECHA, 2008). Concentration levels in DBP positive samples are in the range of 9.0 – 43.00 µg/kg dwt (ECHA, 2008). No results of DBP concentrations measure-ments in European soils are described in the EU RAR (ECB, 2003). Concentra-tion levels in of < 0.1 to 1.4 mg DBP/kg soil are reported in Canada and values up to 29.39 mg/kg were found in agricultural used soils in China (ECHA, 2008).
Concentration levels in DBP positive sludge samples of sewage treatment plants are in the range of 0.135-0.69 mg/kg dwt.
Air samples
Water
Sediment/soil

ROHS Annex II Dossier for DBP
30 Vienna, October 2013
Table 10: Summary of monitoring levels of DBP in different environmental
compartments (Source: ECB, 2003; ECHA, 2008)
Compartment Concentration levels
Air
Air samples (no point sources described)
0.23-77 ng/m3
Aquatic compartment
Surface water Sewage treatment plant: � - influents � - effluents
1 µg/l – 8.8 µg/l < <0.09-200 µg/l <0.09-6 µg/l
Sediment
Lake, river, marine sediments 0.001 to 2.4 mg/kg
Soil/sludge
Soil Sludge of sewage treatment plants
< 0.1 – 0.43 mg/kg dwt1 0.135 – 0.69 mg/kg dwt
1 values detected in EU monitoring studies
6.2.1 Exposure estimates for the environment due to WEEE treatment
EUSES 2.0 has been designed to be a decision-support system for the evalua-tion of the risks of substances to man and the environment of new and existing substances and biocides. Within this assessment EUSES 2.1. was used to cal-culate predicted environmental concentrations, the so called “PECs” for the scenarios shredding, which has been identified as most relevant.
In contrary to the ECETOC-TRA system described previously it is possible to select the scenario “waste treatment”. However, no applicable emission tables and no special scenario to be selected are integrated in EUSES so far, giving some limitations. The calculated releases (chapter 5.3) were used as input for local emissions. In order to ensure transparency are the selected input parame-ters summarized in Table 11.
Table 11: Selected EUSES input parameters
Descriptor input
Assessment mode Interactive
Assessment type Local scale
Additional: Predators exposed via the environment
Physical chemical properties Physical chemical parameters
Chemical class for Koc -QSAR Ester
Biodegradability readily-biodegradable
Industry category 4: Electrical/Electronic engineering industry
Use category 47: Softeners
Use pattern Waste treatment
Fraction of the main local source 0.02
EUSES
Limitations
EUSES Input
parameters

ROHS Annex II Dossier for DBP
Vienna, October 2013 31
Number of emission days per year 220
6.2.2 Exposure estimates: Shredding
Additional input parameters for the shredder scenario are given in table 12. As a worst case scenario in total 0.116 g were taken as local emissions to the air as presented in table in chapter 5.3.3. 1563 t/a as total input of DEHP in WEEE shredders was taken as production volume.
Table 12: Selected EUSES input parameters: overall shredding
Descriptor input
Production volume 1563
Fraction of the EU production volume in the region 10
Fraction of tonnage released to air 1 (~100%)
Local emissions to air during episode 0.116 kg (max.)
Local STP input Bypass STP
The derived local PECs are given in Table 13 below.
Table 13: Results of environmental assessment using EUSES: overall shredding
DBP concentrations and PECs result unit
Concentration in air during emission episode 32.2 ng/m3
Annual average concentration in air, 100 m from point source 19.4 ng/m3
Local PEC in surface water during emission episode (dis-solved)
0,05 ng/l
Annual average local PEC in surface water (dissolved) 0.05 ng/l
Local PEC in fresh-water sediment during emission episode 1.95 ng/kg wwt
Local PEC in seawater during emission episode (dissolved) 0.017 ng/l
Annual average local PEC in seawater (dissolved) 0.017 ng/l
Local PEC in marine sediment during emission episode 0.74 ng/kg wwt
Local PEC in agric. soil (total) averaged over 30 days 5.44 ng/kg wwt
Local PEC in agric. soil (total) averaged over 180 days 5.44 ng/kg wwt
Local PEC in grassland (total) averaged over 180 days 8.8 ng/kg wwt
Local PEC in groundwater under agricultural soil 0.15 ng/l
Table 14: Results of PECs for secondary poisoning: overall shredding
DBP concentrations and secondary poisoning result unit
Concentration in fish for secondary poisoning (freshwater) 0,08 ng/kg wwt
Concentration in fish for secondary poisoning (marine) 0,03 ng/kg wwt
Concentration in fish-eating marine top-predators 0,03 ng/kg wwt
Concentration in earthworms from agricultural soil 40,60 ng/kg
6.2.3 Monitoring data: WEEE treatment sites/locations
No monitoring data to determine DBP exposure levels are present in European countries near WEEE plants.
Overall Shredding:
Input parameters

ROHS Annex II Dossier for DBP
32 Vienna, October 2013
Only three monitoring studies measuring phthalate acid ester (PAE) levels in different environmental compartments have been carried out in China.
The monitoring studies indicate overall higher burden of phthalic acid esters (PAEs) of electronic waste recycling sites in China. Beside of other phthalates also DBP was measured, however, due to limitation of data presentation and that one study is only available in Chinese language, no DBP concentrations levels could be deviated from the study carried out by Ma et al., 2012 and Liu et al. 2009).
The total phthalic acid ester levels (PAE) (DEHP, DMP, DEP, DnBP, BBP, DnOP) in different environmental samples from an electronic waste recycling site in east China ranged from 0.31 – 2.39 mg/kg and 1.81-5.77 mg/kg in soil
and plant samples, respectively (Ma et al., 2012). Data presentation do not al-low to derive exact DBP values. It has to be considered, that DEHP is the most abundant PAE found in these samples (approximately up to 90%) and DBP is detected at much lower expo-sure levels.
Results demonstrate that PAEs concentration in soil samples are depended on the kind of vegetables (e.g., combination of carrot, soybean, cauliflower, radish and pak choi or alfalfa), soil used for cultivation and indicate that PAEs are re-moved by plants in a different order of magnitude. Thus, highest concentration levels (2.39 mg/kg) of PAEs were found in fallow plots with no growing plants.
The measurement of PAEs in plant samples revealed very high loadings. The con-centrations ranged from about 1.81-5.60 mg/kg dw. The results demon-strate that leafy vegetables have lower capacities to accumulate PAEs than root or stem vegetables. The highest concentration has been observed in edible parts of radish roots.
A further study carried out by Liu et al. (2009) determined phthalic acid esters (PAE) in soil samples from e-waste recycling cites in China. The total PAEs concentration found in the soil samples were even higher than those detected in the study of Ma et al. (2012) and were in the range of 12.5 to 46.6 mg/kg (article only available in Chinese language). DBP concentration levels were not de-picted in the available abstract.
Total PAEs measured in particular matter in air samples are twice higher com-pared to urban areas as demonstrated in the study of Gu et al. (2010). Total phthalate concentrations were 216.41 ng/m3 at summertime and 326.6 ng/m3 at wintertime. Compared to 106.16 ng/m3 at summertime and 197.08 ng/m3 at reference site. The most abundant PAE was DEHP. Mean DBP concentrations in air samples of e-waste dismantling sites are 13.74 ng/m3 at summertime and 45.71 ng/m3 at wintertime. In comparison, mean DBP concentrations at the ref-erence site were 7.99 ng/m3 at summertime and 52.54 ng/m3 at wintertime.

ROHS Annex II Dossier for DBP
Vienna, October 2013 33
7 IMPACT AND RISK ESTIMATION
7.1 Impacts on WEEE management as specified by Article 6 (1) a
Taking into account restrictions of DBP (e.g. according to REACH) it is as-sumed that recycling possibilities for plastics containing DBP may be reduced due to the presence of DBP in plastics derived from WEEE.
Under current operational conditions PVC is used for the production of low val-ue articles (shoe soles, hoses etc.). Thus it is not assumed that DBP contained in PVC would stay in the recycling loop for many cycles. A closed loop recycling of PVC from cables and wires is technically not possible due to metal contami-nations.
Wastes with a DBP content of 0.5% are considered hazardous in accordance to the European list of waste (fulfillment of criterion H10, reprotoxic27
).
As information on amounts of DBP actually contained in particular material streams resulting from the treatment of WEEE no estimation can be drawn on the degree of prevention of hazardous wastes due to restriction of DBP in EEE.
7.2 Risks estimation for workers and neighbouring residents
Shredding of WEEE has been identified as most relevant treatment procedure regarding DBP exposure. Exposure estimates using the ECETOC TRA model show that under the assumptions taken no risk for workers from shredder plants are expected.
The RAR 2003 concluded that there are concerns for general systemic toxicity as a consequence of repeated dermal exposure arising from aerosol forming activities, concerns for adverse local effects in the respiratory tract as a conse-quence of repeated inhalation exposure in all occupational exposure scenarios.
From third countries phthalic ester pollution has been reported leading to con-tamination of food stuff and it is to be expected that workers and neighbouring residents of WEEE treatment sites are exposed to considerable levels of DBP and other toxic phthalates. There is cause of concern due to reprotoxicity and endocrine disrupting effects for neighbouring residents. Furthermore it can be expected that there is a risk for workers and neighbouring residents due to un-controlled combustion. Symptoms from vapours from very hot material are eye irritation, headache, drowsiness, and convulsions. Long term effects due to ex-posure to hazardous incineration products can be expected.
27 According to 2000/532/EC one or more substances toxic for reproduction of category 1 or 2 clas-
sified as R60, R61 at a total concentration ≥ 0,5 % mean that H10 is fulfilled
Recycling
possibilities
DBP remaining in
the recycling loop
Generation of
hazardous waste
ROHS Annex II Dossier for DBP
34 Vienna, October 2013
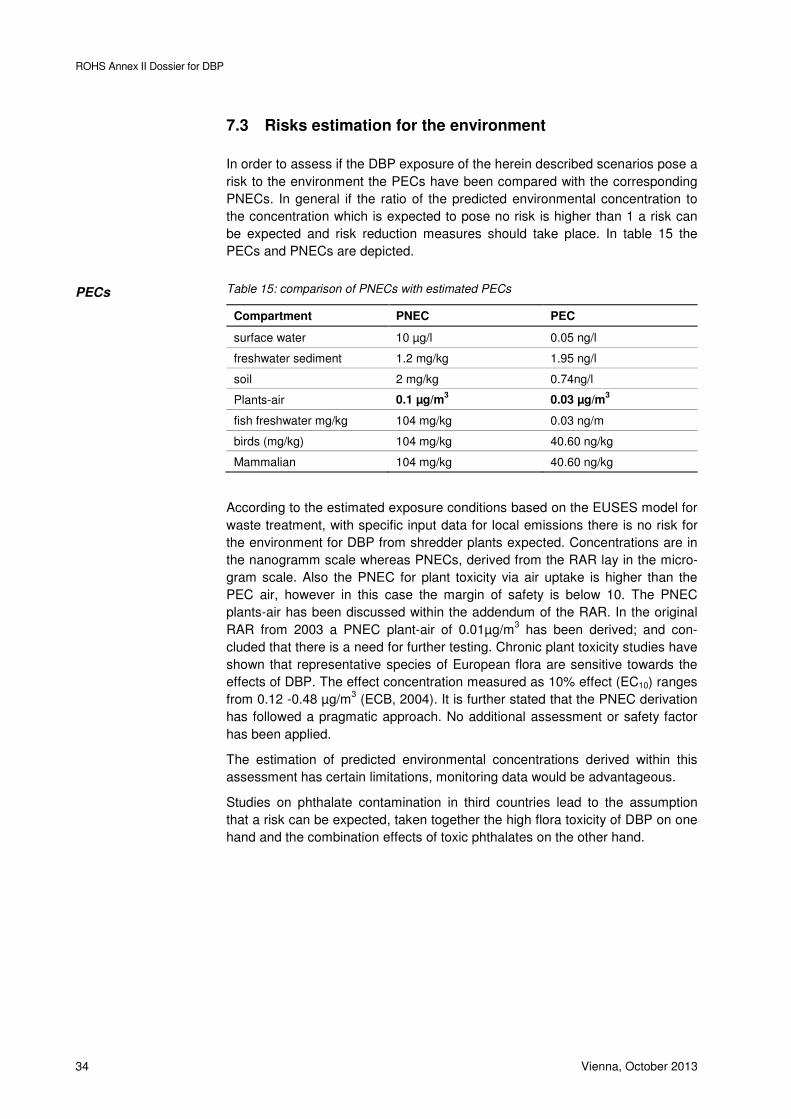
7.3 Risks estimation for the environment
In order to assess if the DBP exposure of the herein described scenarios pose a risk to the environment the PECs have been compared with the corresponding PNECs. In general if the ratio of the predicted environmental concentration to the concentration which is expected to pose no risk is higher than 1 a risk can be expected and risk reduction measures should take place. In table 15 the PECs and PNECs are depicted.
Table 15: comparison of PNECs with estimated PECs
Compartment PNEC PEC
surface water 10 µg/l 0.05 ng/l
freshwater sediment 1.2 mg/kg 1.95 ng/l
soil 2 mg/kg 0.74ng/l
Plants-air 0.1 µg/m3 0.03 µg/m
3
fish freshwater mg/kg 104 mg/kg 0.03 ng/m
birds (mg/kg) 104 mg/kg 40.60 ng/kg
Mammalian 104 mg/kg 40.60 ng/kg
According to the estimated exposure conditions based on the EUSES model for waste treatment, with specific input data for local emissions there is no risk for the environment for DBP from shredder plants expected. Concentrations are in the nanogramm scale whereas PNECs, derived from the RAR lay in the micro-gram scale. Also the PNEC for plant toxicity via air uptake is higher than the PEC air, however in this case the margin of safety is below 10. The PNEC plants-air has been discussed within the addendum of the RAR. In the original RAR from 2003 a PNEC plant-air of 0.01µg/m3 has been derived; and con-cluded that there is a need for further testing. Chronic plant toxicity studies have shown that representative species of European flora are sensitive towards the effects of DBP. The effect concentration measured as 10% effect (EC10) ranges from 0.12 -0.48 µg/m3 (ECB, 2004). It is further stated that the PNEC derivation has followed a pragmatic approach. No additional assessment or safety factor has been applied.
The estimation of predicted environmental concentrations derived within this assessment has certain limitations, monitoring data would be advantageous.
Studies on phthalate contamination in third countries lead to the assumption that a risk can be expected, taken together the high flora toxicity of DBP on one hand and the combination effects of toxic phthalates on the other hand.
PECs

ROHS Annex II Dossier for DBP
Vienna, October 2013 35
8 ALTERNATIVES
8.1 Availability of alternatives
Recently, several alternative assessments for DEHP, DBP and DBP have been conducted summarizing potential alternatives and its possible hazardous ad-verse effects, as well as its technical properties in order to determine feasible substitutes. Beside other supposed less hazardous phthalate compounds, non-phthalate alternatives (e.g., Di-isononyl-cyclo-hexane-1,2dicarboxylate – DINCH; Alkylsulphonic phenylester - ASE), other petroleum based materials and bio-based plastics (for details see Lowell Center, 2011; Maag et al., 2010, DEPA; 2011, COWI, 2009) are summarized. However, still there is lack of data for some alternatives regarding specific aspects of hazardous potential to hu-man health and environment.
The outcome of alternative assessments for application of DBP in EEEs re-vealed that: “The use of DBP in EEE is not deemed essential as technically suitable alternatives are available and already used today, however it cannot be ruled out forsome specific non-polymer applications substitution may be particu-lar difficult” (DEPA, 2010).
Based on the evaluation of DEPA 2010 available alternatives to DBP appear to be dibenzoates such as dipropylene glycol dibenzoate (DGD), the mixed diben-zoates product Benzoflex 2088 and dibutyl terephthalate (DBT).
These alternative plasticisers are technically suitably as alternatives to DBP based producers information. Some other alternatives to DBP exist, but some of these are currently expected to have relatively high prices compared to DBP (COWI, 2009).
Furthermore, the use of alkylsulfonic phenylester (ASE) as primary plasticiser may reduce the need for adding a gelling aid like DBP. However, ASE is cur-rently more expensive than DBP (COWI, 2009).
There might be further other alternatives for DBP, such as the from a toxici-cological view point very suitable substitute Di-isononyl-cyclohexane-1,2dicarboxylate (DINCH) (for details see COWI, 2009).
8.2 Hazardous properties of alternatives
In the following some key characteristics for some selected possible alternatives used in EEE applications are summarised.
Dipropylene glycol di-benzoate (DGD) has been reviewed within the alterna-tive assessment carried out by COWI in the year 2009 (COWI, 2009). The as-sessment of the hazardous properties is based on the information from manu-facturers of Benzoflex ® 9-88 containing up to 100% DGD. Benzoflex ® 9-88 has low acute toxicity potential. Also the data of the repeated dose toxicity stud-ies indicate a low toxic potential (deduced NOAEL 1000 mg/kg bw/day based on decreased body weight, effects on liver, spleen, caecum). Data of two-generation studies suggest a NOAEL of 500 mg/kg bw/day.
Alternative
assessments
DBP in EEE
Examples of
alternatives

ROHS Annex II Dossier for DBP
36 Vienna, October 2013
Based on the currently available data a low toxic potential of DGD can be as-sumed, which indicates that DGD is a suitable alternative for DBP.
Alkylsulphonic phenylester (ASE): Data of the developmental toxicity study did not indicate any adverse effects up to doses of 530 mg/kg bw. However, the study dates back to 1956 and lacks good reporting. Therefore a clear conclu-sion might not be drawn. ASE possess low acute toxicity and no irritating, sensi-tising or mutagenic potential has been identified (DEPA, 2011). Based on the evaluation of COWI (2009) the most critical endpoint is the liver toxicity LOAEL 55.4 mg/kg bw/day.
Di-isononyl-cyclohexane-1,2-dicarboxylate (DINCH) has not shown any ad-verse effects in reprotoxicity studies in concentrations up to 1000 mg/kg bw/day (animal species: rat and rabbits). The most critical endpoint of DINCH has been observed to be kidney with a LOAEL of 107.1 mg/kg bw/ day (COWI, 2009).
Table 16: Summary of most relevant concerns for identified alternatives, which might be used in the EEE sector (for
details see COWI, 2009)
Substance name CAS number Human health concerns Environmental health concerns
Harmonised (HC) and/or self-classification (SC)*
Dipropylene glycol dibenzoate (DGD)
27138-31-4 Data indicate low acute toxic-ity. NOAEL of 1000 mg/kg bw/day observed in repeated dose toxicity studies indicate low repeated dose toxicity.
Data do not allow to draw firm conclusion on biodegradable pro-perties. DGD possess moderately bioaccu-mulative properties. Ecotoxicity data indi-cates toxic effects to aquatic organism.
no HC; SC: Aquat-ic Chronic 2; Aquatic Chronic 3; Eye Irrit. 2;
Repr. 2
Alkylsulphonic phenylester (ASE)
91082-17-6 Has not comprehensively studied for toxic effects.
Not readily bio-degradable and poten-tial for bioaccumula-tion Data on aquatic organism indicate low toxicity.
no HC; SC: aquat-ic chronic 4
Di-isononyl-cyclohexane-1,2dicarboxylate (DINCH)
166412-78-8 No effects on fertility or devel-opment have been observed in doses up to 1000 mg/kg bw/day(rat)
Not readily bio-degradable. Data indi-cate moderate bioac-cumulation potential.
no HC; no SC
* indicated in the Classification and Labelling (C&L) inventory from ECHA (avail-able at:
http://echa.europa.eu/web/guest/information-on-chemicals/cl-inventory-database)
8.3 Conclusion on alternatives
Detailed assessments on possible alternatives have been carried out previously (Maag et al.; 2010, COWI; 2009, DEPA; 2010). Beside the hazard profile also the use and technical feasibility of possible substitutes has been determined.
The conclusion on alternatives is based on recently published alternative as-sessments of DEHP; DBP, and BBP by COWI (Denmark) carried out for ECHA for possible inclusion into Annex XIV and the assessment of DEPA (2010) in order to determine socioeconomic impacts, when DEHP, DBP and DPB is con-

ROHS Annex II Dossier for DBP
Vienna, October 2013 37
sidered to be amended to Annex IV of the Comission´s recast proposal of the RoHs Directive.
Based on these assessments, it can be concluded that the use of less harmful alternatives to the hazardous DBP is possible and already in place. The use of DBP in EEE is not deemed essential, however, some niche application cannot be ruled out.

ROHS Annex II Dossier for DBP
38 Vienna, October 2013
9 SOCIO-ECONOMIC IMPACT ON THE PRODUCERS OF THE SUBSTANCE
9.1 Approach and assumptions
The socio-economic analysis is based on two scenarios:
� In Scenario A the present legislation is not changed and DBP may continue to be used in electrical/electronic equipment.
� In Scenario B the use of DBP in EEE is restricted. For the purpose of the socio-economic analysis DBP is replaced in PVC (and other plastics) by the plasticiser DINCH (Di-isononyl-cyclohexane-1,2dicarboxylate). While DINCH may not be the most appropriate alternative in all cases, it at least can re-place DBP in some applications and serve here as a basis for estimating the orders of magnitude of the costs of replacing DBP in EEE by an available non-phthalate-substitute.
The data used in this socio-economic analysis are mainly derived from DEPA (2010).
Some of the assumptions used in the socio-economic analysis are valid for both scenarios and thus for the frame assumptions of this analysis. Following as-sumptions are taken:
1) The selection of DBP or of DINCH as its alternative does not have an effect on the life time of the EEE or its usability.
2) DEPA (2010) estimates the amount of DBP used in EEE produced within the EU to be 50 to 500 tonnes per year. When assuming that ten times as much of DBP containing EEE is imported than produced domestically the total amount of DBP coming into use annually within EEE would be some 5,000 t/y. Thus for the scenario-analysis it is assumed that 5,000 t/y of DBP are put on the market in the EU as part of EEE.
Table 17 summarises the described frame assumptions.
Table 17: Frame assumptions of the Socio Economic Analysis regarding a ban of DBP
as plasticiser of plastics used in EEE (electrical and electronic equipment)
Parameter Assumption
Effect on life time of EEE Negligible effect
Consumption of plasticiser in t/y 5,000
In the following the impact of Scenario B (ban of DBP) is compared to Scenario A (no ban of DBP) from the point of view of the different stakeholders along the life cycle before summing up the difference of the 2 scenarios’ socio-economic impacts.

ROHS Annex II Dossier for DBP
Vienna, October 2013 39
9.2 Impact on producers of plasticisers and plastics
The DBP substitution costs will mainly fall at the processors and formulators of PVC and other potentially DBP containing materials such as sealants or glues. For coatings and other integrated parts, the EEE manufacturers may act as PVC processors themselves, and may need to be involved in reformulation of the PVC plastisols (suspension of PVC particles in a plasticiser) or compounds used. The plasticiser producers will normally be involved in the substitution, be-cause they act as advisors for the processors and formulators in the formulation of the polymer/plasticiser system. The alternative plasticisers are already devel-oped and marketed, but costs for increasing the production volume may be im-plied. One of the alternatives to using DBP is to simply omit its use. This may result in increased production time and thereby potentially increased production prices. All substitution costs are expected to ultimately be furthered to the end customers (DEPA, 2010).
Both DBP and DINCH are examples of plasticisers produced by relatively large/multinational European based companies.
Production of EEE is substantial in the EU. However, a large part of the total end-user consumption of EEE is imported as finished goods from outside the EU. This is notably the case for small household appliances, consumer elec-tronics, IT equipment, and toys etc., but also for other EEE groups.
For EU based EEE producers, DBP containing parts may be produced by themselves or by subcontracting PVC processing or non-polymer formulator companies in the EU as well as on the world market.
More than 400 manufacturers in the EU produce plasticised PVC products/parts of types, which may be of relevance for EEE. It is, however, not known how many of these actually produce EEE parts and how many are small or medium sized enterprises (SMEs).
For most applications of DBP a one-to-one replacement of DBP with DINCH will be possible and it is not expected that small and medium sized enterprises (SMEs) will be affected more than the general industry in the sectors in question with respect to the technical compliance. The plasticiser companies offering the alternatives are large companies, and they serve as general customer advisers when it comes to adjusting polymer formulations and production setup.
Previous studies have clearly indicated that SMEs are affected to a greater de-gree by compliance with the RoHS legislation compared to their larger competi-tors, mainly due to the additional administrative burden (DEPA 2010).
DEPA (2010) estimates that the material price of DEHP is about 1 €/kg. As the costs of other phthalate plasticisers reported by DEPA (2010) are also 1 €/kg, it is assumed that also DBP costs 1 €/kg. The price of DINCH is 1.3 €/kg (DEPA 2010), so that by a DBP ban additional material costs of 0.3 €/kg of plasticiser would occur. In addition DEPA (2010) estimates investment costs to be small. As no number is given by DEPA (2010) for the investment costs when switching from DBP to an alternative, it is assumed that the same material cost to invest-ment cost ratio applies as with the substitution of HBCDD that is 85 to 15. This results in investment costs of 0.05 €/ per kg replaced DBP.
In sum the material and investment costs for replacing 1 kg of DBP by DINCH are estimated to be 0.35 €. For the 5,000 tonne of DBP at a maximum to be re-

ROHS Annex II Dossier for DBP
40 Vienna, October 2013
placed in European EEE this gives 1.8 million € per year in additional material and investment costs.
With respect to jobs it is expected that the higher turnover of the plasticiser and plastic industry in Scenario B will create some additional jobs in this sector.
In scenario B (ban of DBP) the health impact on the workers of the plasticiser and plastics industry are expected to recede, in the EU but also abroad.
9.3 Impact on EEE producers
Production of EEE is substantial in the EU. However, a large part of the total end-user consumption of EEE is imported as finished goods from outside the EU. This is notably the case for small household appliances, consumer elec-tronics, IT equipment, and toys etc., but also for other EEE groups.
As the service of the plastic used in EEE does not change when switching from DBP as plasticiser to DINCH, for example, no major effect is expected for the EEE producers. Only when they are also plastic producers, they are affected as described above.
The higher costs of the plastics occur for all EEE producers selling to the EU market. Thus no change in the relative competitive position of the different EEE producers is to be expected from a DBP ban.
As compared to the turnover of the EU electrical engineering industry of 411 bil-lion € in 2008, the additional costs of 2 million € (+0.0005 %) is so small that no influence on the market needs to be feared.
9.4 Impact on EEE users
The major impact on EEE users is the additional costs which are to be borne by the EU industrial and private consumers. It is to be expected that a little higher price of the EEE draws on the competitive position of the European industry as a whole causing very few jobs to be lost, if at all. On the other hand, jobs are created as an essential part of the additional costs are spent for the benefit of European plastic producers and environmental industry.
The main consumer benefit lies in the lower health risk of alternative plasticis-ers.
9.5 Impact on waste management
For details on impacts of DBP in EEE on waste management refer to Chapter 7.1.
The most likely benefit for the waste management sector of banning DBP in EEE would be a possibly increased PVC recycling potential

ROHS Annex II Dossier for DBP
Vienna, October 2013 41
For the waste management sector no substitution costs occur, as with the exist-ing equipment DENCH containing plastics can be treated as well as DBP con-taining plastics.
9.6 Impact on administration
According to DEPA (2010) extra compliance costs are related to the addition of one new substance under RoHS are expected to be minimal for companies which have already implemented RoHS, that is, most relevant companies.
The main extra costs are estimated to be related to control; both by the manu-facturers / importers and the authorities. The presence of DBP cannot be de-termined by simple XRF screening, therefore sampling, extraction and labora-tory analysis (gas chromatography followed by mass spectroscopy) is required.
The additional costs of a DBP analysis of in flexible PVC in addition to a DEHP analysis in Denmark is reported to be about 30 € (DEPA 2010).
For non-polymers parts like adhesives and paints, it may be necessary to take extra samples – if possible at all – in order to analyse for the presence of DBP (and eventually other regulated phthalates). There is at the moment no simple “rule-of-thump” telling where the substances could most likely be found and they are probably present at a very low frequency (DEPA 2010).
The administrative costs for Scenario B (ban of DBP) are estimated as follows:
� Assuming that DEHP will be banned, too, and that DEHP-freeness needs to be tested as frequently as DBP-freeness, DEPA (2010) estimates that the additional costs for proving that the produced plastics is DBP free is 30 €.
� When assuming that for the EU as a whole 7,000 test per year (that is 250 tests per EU Member State and year) are sufficient to control a DBP ban, the costs for the EU as a whole would be 210,000 € annually.
The administrative costs, however, are not lost costs, as they increase the turn-over of the EU chemical analysis industry.
9.7 Total socio-economic impact
It is not clear if DBP is used in EEE in Europe at all. Therefore this socio-economic analysis is a kind of a “worst-case” analysis, showing the costs of re-placing DBP, if substantial amounts of DBP happen to be used in European EEE.
The total economic costs of a DBP ban and replacement by DINCH (Scenario B) are estimated to lie with 2 million € annually (see Table 18)
The total effect on jobs is expected to be very small. While few jobs may be lost in the industries using EEE (caused by the marginally increased prices of EEE), some jobs are created with producers of the alternative plasticisers and the en-vironmental (chemical analysis) industry.
With respect to the benefits, however, the impact of the DBP ban may be big (as compared to a scenario in which considerable amounts of DBP are still used in EEE):

ROHS Annex II Dossier for DBP
42 Vienna, October 2013
� Increase in the competitive position of environmentally friendly industry
� Globally reduced environmental and health impacts during DBP and plastics production
� Reduced environmental and health impacts during use and especially during the waste and recycling phase.
In total the ban of DBP creates limited additional costs while creating additional benefits for health, environment and economy.
Table 18: Scenario Management Tableau of the Socio Economic Analysis regarding a ban of DBP as plasticiser for materials in EEE
(electrical and electronic equipment)
Scenario A – no ban of DBP
Scenario B –
ban of DBP
Plasticiser used in EEE plastics DBP DINCH
Additional raw material costs of plasticiser in €/kg 0 0.3
Additional investment costs for changing to other plasti-ciser in €/kg
0 0.05
Additional raw material + investment costs for DBP or its alternative in €/kg
0 0.35
Additional raw material + investment costs for DBP or its alternative in €/y
0 1,800,000
Additional costs for EEE producer in €/y 0 0
Additional costs for waste treatment in €/y 0 0
Additional administrative costs in €/a 210,000
Total additional costs for final consumers 0 2,010,000
Benefits Increase in the competitive position of environmentally friendly industry
Reduced environmental and health impacts during plasticiser and plas-tics production in the EU and abroad
Reduced environmental and health impacts during the use and espe-cially the waste phase
As the ban becomes effective only gradually due to an adequate transition period and as plastics containing DBP will stay in the
system due to the lifetime of the products and plastics recycling, the benefits for environment and health during the use and
phase will materialise only gradually.

ROHS Annex II Dossier for DBP
Vienna, October 2013 43
10 RATIONALE FOR INCLUSION OF THE SUBSTANCE IN ANNEX II OF ROHS
Hazardous potential
Nature and reversibility of the adverse effect:
DBP is a substance of very high concern and classified as toxic to reproduction on the evidence of adverse effects on the reproductive organs in rodents, which are attributed to an anti-androgenic mode of action. A risk of workers for general systemic toxicity as a consequence of repeated dermal exposure arising from aerosol forming activities as well as concerns for adverse local effects in the respiratory tract as a consequence of repeated inhalation exposure has been identified for DBP for industrial processes in Europe 2003.
DBP releases from WEEE treatment:
The bigger part of environmental releases of DBP from relevant WEEE treat-ment processes28 are releases to air. The total annual releases are estimated to account for 0.15 to 1.4 tonnes.
COWI (2009) presents release estimates for incineration and landfilling of solid waste:
Table 19: Releases of DBP from main solid waste operations (Source: COWI, 2009,
Table 2-12)
In a scenario where emissions of particulates at shredder plants and cable shredders are successfully prevented, DBP releases to air from WEEE treat-ment (0.15 t /a) are lower compared to releases to air from waste incineration. However, in a scenario where little measures for preventing dust emissions from shredders are taken, the releases from WEEE treatment (1.4 t/a) are even higher than the releases to air by waste treatments (0.9 t/a)
Taking into account that material streams derived from WEEE may be sub-jected to mechanical treatment processes several times during the overall treatment chain, it is expected that the actual releases might even be higher.
In addition releases of DBP are also expected from landfills, incineration plants and uncontrolled treatments of WEEE.
28 i.e. treatment of WEEE in shredders
Substance of very
high concern
WEEE treatment
compared to other
waste treatment
processes

ROHS Annex II Dossier for DBP
44 Vienna, October 2013
Exposure of workers
The exposure of workers to DBP at WEEE shredders to is expected to be low. However, monitoring data are missing. The number of potentially exposed workers in the EU is estimated to be about 7,000 workers. (Based on an esti-mated number of 450 installations in the EU where WEEE and materials de-rived thereof are treated mechanically and assuming 5 to 15 workers per instal-lation29, the estimated range of workers exposed to DBP releases ranges be-tween 2,250 to 6,750).
Risk for human health
Under the assumptions taken within this assessment it is expected that there is no risk for human health of workers at WEEE shredding plants due to DBP ex-posure.
The EU-RAR identified a risk for workers for general systemic toxicity as a con-sequence of repeated dermal exposure arising from aerosol forming activities, concerns for adverse local effects in the respiratory tract as a consequence of repeated inhalation exposure in all occupational exposure scenarios.
In third countries, due to unsafe working conditions a risk from DBP exposure can be expected. Also neighboring residents are presumable exposed and at risk.
The assessment of endocrine disruptors in the regulatory context in the Euro-pean Union is currently under discussion. As it is not possible to establish a threshold for adverse effects of genotoxic carcinogens it is under debate if this is possible for endocrine disrupters. Taking this into consideration release and exposure towards endocrine disrupters such as DBP should be minimized.
Environmental Exposure
The exposure of the environment to DBP caused by handling of materials at WEEE shredder plants is expected to be low. However, monitoring data are missing.
Risk for the environment
Under the assumptions taken within this assessment it is expected that there is no risk for the environment due to DBP exposure from sites for WEEE shred-ding..
Within the EU-RAR a PNEC plant-air of 0.1 µg/m3 was defined. The calculated PEC for the air is 0.03 µg/m3; the derived PEC/PNEC is 0.3.
Under uncontrolled handling conditions a risk for the environment can be ex-pected.
29 Estimation based on Umweltbundesamt (2008)

ROHS Annex II Dossier for DBP
Vienna, October 2013 45
Main influencing factors within the risk assessment
Regarding the establishment of the waste management scenario and determi-nation of environmental releases there are 2 major factors:
� The annual quantities of DBP actually contained in the collected WEEE are influenced by various factors, including the actual DBP put on the European market via EEE, the lifespan of EEE, the actual WEEE collection.
� The degree of applying measures for preventing dust emissions when han-dling materials derived from shredded WEEE affects the estimated DBP re-leases considerably. However, there is no information available on the actual implementation of such measures.
The environmental exposure estimation is based on EUSES, which does not address waste treatment specifically yet. Thus, appropriate scenarios were de-fined, emissions and releases calculated and then used as input parameters.
Impact on waste management
The extent to which material recycling/recovery is affected
Taking into account restrictions of DBP (e.g. according to REACH) it is ex-pected that recycling possibilities for plastics containing DBP may be reduced due to the presence of DBP in plastics derived from WEEE.
The extent to which DBP remains in the recycling loop
Under current operational conditions PVC is used for the production of low val-ue articles (shoe soles, hoses etc.). Thus it is not expected that DBP contained in PVC would stay in the recycling loop for many cycles. A closed loop recycling of PVC from cables and wires is technically not possible due to metal contami-nations.
The amount of hazardous waste which is generated in the course of
processing WEEE
Wastes with a DBP content of 0.5% are considered hazardous in accordance to the European list of waste (fulfillment of criterion H10, reprotoxic30
).
As information on amounts of DBP actually contained in individual material streams resulting from the treatment of WEEE no estimation can be drawn on the degree of prevention of hazardous wastes due to a restriction of DBP in EEE.
Available Alternatives
Detailed assessments on possible alternatives were carried out recently (Maag et al.; 2010, COWI; 2009, ECHA; 2013, DEPA, 2010). Beside the hazard profile also the use and technical feasibility of possible substitutes were determined. The mentioned pieces of work come to the conclusion that substitution of DBP by less harmful substances (e.g. ASE, DINCH) is possible and already in place.
30 According to 2000/532/EC one or more substances toxic for reproduction of category 1 or 2 clas-
sified as R60, R61 at a total concentration ≥ 0,5 % mean that H10 is fulfilled

ROHS Annex II Dossier for DBP
46 Vienna, October 2013
The use of DEHP in EEE is not deemed essential, however, some niche appli-cation cannot be ruled out.
Socio-economic impact analysis
In total the ban of DBP in EEE would create limited additional costs (2 million € annually) while creating additional benefits for health, environment and econ-omy.
The total effect on jobs is expected to be very small. While few jobs may be lost in the industries using EEE (caused by the marginally increased prices of EEE), some jobs are created with producers of the alternative plasticisers and the en-vironmental (chemical analysis) industry.
With respect to the benefits, however, the impact of the DBP ban may be big (as compared to a scenario in which considerable amounts of DBP are still used in EEE):
� Increase in the competitive position of environmentally friendly industry
� Globally reduced environmental and health impacts during DBP and plastics production
� Reduced environmental and health impacts during use and especially during the waste and recycling phase.
Draft Conclusion:
It is recommended to include DBP in Annex II to the RoHS-Directive because:
� a risk for workers and neighboring residents in third countries is expected
� a risk for the environment in third countries is expected
� the releases from sites where WEEE are shredded are relevant contributors to the overall DBP releases from processing solid waste, when measures for preventing dust emissions are insufficient
� There are negative impacts on the waste management, including reduced re-cycling possibilities due to the generic restriction of the use and manufacture of DBP in the EU.
� Alternatives with less negative properties are available and technically and economically feasible (e.b. ASE or DINCH)
� The socio-economic analysis revealed limited additional costs but considera-ble additional benefits when restricting DBP in EEE.
For the maximum concentration of DBP per homogenous material to be tolerated in EEE a value of 0.1 weight % is proposed.

ROHS Annex II Dossier for DBP
Vienna, October 2013 47
11 REFERENCES
COWI, IOM & Entec (2009): Data on manufacture, import, export, uses and releases of
Dibutyl phthalate (DBP) as well as information on potential alternatives to its use.
Report prepared for ECHA. pp. 76
BDSV (2012): BVT-Merkblatt, BREF für Großshredderanlagen
DEPA - Danish Environmental Protection Agency (2010): Inclusion of HBCDD, DEHP,
DBP, DBP and additive use of TDBPA in annex IV of the Com-mission’s recast
proposal of the RoHS Directive, COWI A/S. Danish Min-istry of Environment, En-
vironmental Project No. 13172010. Authors Maag J, Brandt K, Mikkelsen S, Las-
sen C. 87 p
DEPA - Danish Environmental Protection Agency (2011): Annex XV Restriction Report.
Proposal for a restriction. Substance name: Bis(2-Ethylhexyl)phthalate (DEHP);
Benzyl butyl phthalate (DBP); Dibutyl phthalate (DBP); Diisobutyl phthalate
(DIBP). pp. 503
EC – European Commission (2006): Integrated Pollution Prevention and Control Refer-
ence Document on Best Available Techniques for the Waste Treatments Indus-
tries
EC – European Commission (2007): Data gathering and impact assessment for a review
and possible widening of the scope of the IPPC Directive in relation to waste
treatment activities. Study N° 07010401/2006/445820/FRA/G1.
EC – European Commission (2008b): Commission staff working paper accompanying
the Proposal for a Directive on waste electrical and electronic equipment (WEEE)
(recast) - Impact Assessment
ECB - European Chemical Bureau (2003): European Union risk assessment re-port.
Dibutyl phthalate CAS-No.: 84-74-2, EINECSNo.: 201-557-4. 1st priority list. Vol-
ume 29; 139 pp.
ECB - European Chemical Bureau (2004): European Union Risk Assessment Report.,
Dibutyl phthalate CAS-No.: 84-74-2, Risk assessment Addendum to the Environ-
mental Section – 2004.
ECETOC (2012): ECETOC TRA version 3: Background and Rationale for the Improve-
ments. Technical Report No. 114. Brussels, July 2012. ISSN-0773-8072-114
(print). ISSN-2079-1526-114 (online).
ECHA - European Chemicals Agency (2008): Annex XV dossier. Proposal for identifica-
tion of a substance as a CMR Cat. 1 or 2, PBT, vPvB or a sub-stance of an
equivalent level of concern. Proposal for identification of Dibutyl phthalate as an
SVHC; pp. 43
ECHA – European Chemical Agency (2009): Background document for dibutyl phthalate
(DBP). http://echa.europa.eu/documents/.
ECHA - European Chemicals Agency: (2010): Guidance on information requirements
and chemical safety assessment. Chapter R. 12: Use descriptor system. ECHA-
2010-G-05-ENEuropean Chemicals Agency 2010.
ECHA - European Chemicals Agency (2011): Guidance on the preparation of socio-
economic analysis as part of an application for authorisation. ECHA-11-G-02-EN.
http://echa.europa.eu/home

ROHS Annex II Dossier for DBP
48 Vienna, October 2013
ECHA - European Chemicals Agency (2012a): Guidance on information requirements
and chemical safety assessment. Chapter R.16: Environmental Exposure estima-
tion. ECHA-10-G-06-EN. http://echa.europa.eu/home
ECHA - European Chemicals Agency (2012b): Guidance on information requirements
and chemical safety assessment. Chapter R.18: Exposure scenario building and
environmental release estimation for the waste life stage. ECHA-2010-G-20-EN.
http://echa.europa.eu/home
EEA – European Environment Agency (2013): Managing municipal solid waste.
EFSA – European Food Safety Agency (2005): Opinion of the Scientific Panel on Food
Additives, Flavourings, Processing Aids and Materials in Contact with Food (AFC)
on a request from the Commission related to ---- for use in food contact materials.
The EFSA Journal (2005) 242, 1-17
Groß, R., Bunke, D., Gensch, C.O., Zangl, S., Manhart, A. (2008): Study on Hazardous
Substances in Electical and Electronic Equipment, Not Regu-lated by the RoHS
Directive. Öko-Institut e-V. Freiburg.
http://ec.europa.eu/environment/waste/weee/pdf/hazardous_substances_re
port.pdf
Gu Z, Feng J, Han W, Wu M, Fu J, Sheng G. (2010): Characteristics of organic matter in
PM2.5 from an e-waste dismantling area in Taizhou, China. Chemosphere
80(7):800-6.
Huisman, J. et al. (2007): 008 Review of Directive 2002/96 on Waste Electrical and Elec-
tronic Equipment (WEEE)
IPTS (2007): Assessment of the Environmental Advantages and Drawbacks of Existing
and Emerging Polymers Recovery Process.
IPTS (2013): End-of-waste criteria for waste plastic for conversion, Technical proposals,
Final Draft Report, March 2013
Lee KY, Shibutani M, Takagi H, Kato N, Takigami S, Uneyama C, Hirose M. (2004): Di-
verse developmental toxicity of di-n-butyl phthalate in both sexes of rat offspring
after maternal exposure during the period from late gestation through lactation.
Toxicology; 203(1-3):221-23 (cited in EFSA, 2005)
Lowell Center - Lowel Center for Sustainable Production; University of Massa-chusetts
(2011): Phthalates and their alternatives: Health and Environment. pp. 22
Maag, J., Lassen, C., Brandt, U.K., Kjølholt, J., Molander, L. & Mikkelsen, S.H. (2010):
Identification and Assessment of Alternatives to Selected Phthalates, Danish En-
vironmental Protection Agency, 2010.
MAFF (1987). Survey of plasticizer levels in food contact material and in food. Food Sur-
veillance paper No 21. Ministry of Agriculture, Fisheries and Food. London, Her
Majesty's Stationary Office.
MORF, L. & TAVERNA, R. (2004): Metallische und nichtmetallische Stoffe im Elektro-
schrott., Stoffflussanalyse.
RAC – Committee for Risk Assessment (2012): Opinion on an Annex XV dos-sier pro-
posing restrictions on four phthalates. ECHA/RAC/RES-O-0000001412-86-07/F.
RAC – Committee for Risk Assessment (2013): 24th meeting of the committee for risk
assessment. 5-8 March, Helsinki Finland; RAC/24/2013/09_rev 2, Agenda Point:
DNEL setting (DBP)

ROHS Annex II Dossier for DBP
Vienna, October 2013 49
RIVM (1991). Update of the exploratory report phthalates. Report no 7104010 08. Na-
tional Institute of Public Health and Environmental Protection, Bilthoven, May
1991. (cited in ECB, 2003)
Umweltbundesamt (2008): Elektroaltgerätebehandlung in Österreich. Zustandsbericht
2008
VKE - Verband Kunststofferzeugende Industrie (VKE) (2003): Kunststoffe in Elektro- und
Elektronikgeräten.
www.plasticseurope.de/cust/documentrequest.aspx?DocID=46028
Zimmermann S, Gruber L, Schlummer M, Smolic S, Fromme H. Determination of
phthalic acid diesters in human milk at low ppb levels. Food Addit Contam Part A
Chem Anal Control Expo Risk Assess. 2012;29(11):1780-90.

ROHS Annex II Dossier for DBP
50 Vienna, October 2013
12 ABBREVIATIONS
ASE ................... Alkylsulphonic phenylester
BAT .................... best available technique
BBP .................... Bis (2-ethylhexyl) phthalate
BCF .................... Bio-concentration factor
BREF WTI .......... Reference Document on Best Available Techniques for the Waste
Treatments Industries
bw ...................... Body weight
CAS .................... Chemical Abstract Service
CMR ................... Carcinogenic, Mutagenic and toxic to Reproduction
DBP .................... Dibutyl phthalate
DBT .................... Dibutyl terephthalate
DEHP ................ Bis(2-ethylhexyl)phthalat
DGD ................... Dipropylene glycol dibenzoate
DIDP .................. Di-disodecyl phthalate
DINCH ............... Di-isononyl-cyclohexane-1,2dicarboxylate
DINP .................. Di-isononyl phthalate
DNEL ................. Derived no effect level
dw ...................... Dry weight
EEE .................... Electrical and electronic equipment
GTA .................... Glycerol Triacetate
HDPE ................. high density Polyethylene
LD ...................... Lethal dose
MOS ................... Margin of safety
MSW .................. Municipal solid waste
NOAEC .............. No observed adverse effect concentration
NOAEL ............... No observed adverse effect level
PAE .................... Phthalic acid esters
PBT .................... Persistent, bio accumulative, toxic
PE ...................... Polyetyhlene
PM ...................... Particular matter
PNEC ................. Predicted no effect concentration
POD ................... Point of departure
PVC .................... Polyvinyl chloride
RAR ................... Risk assessment report

ROHS Annex II Dossier for DBP
Vienna, October 2013 51
REACH ............... Registration, Evaluation, Authorisation and Restriction of Chemical
Substances
RoHS .................. Restriction of hazardous substances
SVHC ................. Substance of Very High Concern
vPvB ................... Very persistent and very bioaccumulative
WEEE ................. Waste of electrical and electronic equipment

ROHS Annex II Dossier for DBP
52 Vienna, October 2013
13 LIST OF TABLES
Table 1: Substance identity and composition (Source: ECHA, 2008) ............. 5
Table 2: Physico-chemical properties of DBP (Source: ECHA, 2008) ............. 6
Table 3: Harmonised classification of DBP1..................................................... 7
Table 4: Overview of the deduced derived no effect levels (DNELs) for DBP (Source: RAC, 2013) ............................................................... 13
Table 5: Summary of selected environmental parameters of DBP and compari-son with PBT and POPs criteria ......................................... 15
Table 6: Predicted no effect concentrations (PNECs) for different environment compartments (Source: ECB, 2003) ........................... 17
Table 7: Estimated total DBP releases from WEEE treatment processes in the EU (in kg per year) ................................................................. 26
Table 8: Estimated local DBP releases from WEEE treatment processes in the EU (in g per installation and day) ........................................... 26
Table 9: Results of the ECETOC-TRA model for exposure and risk of shredding ......................................................................................... 28
Table 10: Summary of monitoring levels of DBP in different environmental compartments (Source: ECB, 2003; ECHA, 2008) .......................... 30
Table 11: Selected EUSES input parameters .................................................. 30
Table 12: Selected EUSES input parameters: overall shredding .................... 31
Table 13: Results of environmental assessment using EUSES: overall shredding ......................................................................................... 31
Table 14: Results of PECs for secondary poisoning: overall shredding .......... 31
Table 15: Summary of most relevant concerns for identified alternatives, which might be used in the EEE sector (for details see COWI, 2009) ................................................................................................ 36
Table 16: Frame assumptions of the Socio Economic Analysis regarding a ban of DBP as plasticiser of plastics used in EEE (electrical and electronic equipment) ................................................................ 38
Table 17: Scenario Management Tableau of the Socio Economic Analysis regarding a ban of DBP as plasticiser for materials in EEE (electrical and electronic equipment) ............................................... 42
Table 18: Releases of DBP from main solid waste operations (Source: COWI, 2009, Table 2-12) ................................................................. 43

ROHS Annex II Dossier for DBP
Vienna, October 2013 53
14 LIST OF FIGURES
Figure 1: Large-scale metal shredder plant (Source: Umweltbundesamt, 2008) ................................................................................................ 24
Figure 2: Manual sorting of disintegrated WEEE (Source: Umweltbundesamt, 2008) ................................................................ 25
Figure 3: Installation for further treatment of mixed shredder fractions (Source: Umweltbundesamt, 2008) ................................................. 25