Substance Abuse and Mental Illness Among Youth in the ...
131
Walden University ScholarWorks Walden Dissertations and Doctoral Studies Walden Dissertations and Doctoral Studies Collection 2018 Substance Abuse and Mental Illness Among Youth in the United States Emmanuel Xavier Okoro Walden University Follow this and additional works at: hps://scholarworks.waldenu.edu/dissertations Part of the Public Health Education and Promotion Commons , and the Quantitative Psychology Commons is Dissertation is brought to you for free and open access by the Walden Dissertations and Doctoral Studies Collection at ScholarWorks. It has been accepted for inclusion in Walden Dissertations and Doctoral Studies by an authorized administrator of ScholarWorks. For more information, please contact [email protected].
Transcript of Substance Abuse and Mental Illness Among Youth in the ...

Walden UniversityScholarWorks
Walden Dissertations and Doctoral Studies Walden Dissertations and Doctoral StudiesCollection
2018
Substance Abuse and Mental Illness Among Youthin the United StatesEmmanuel Xavier OkoroWalden University
Follow this and additional works at: https://scholarworks.waldenu.edu/dissertations
Part of the Public Health Education and Promotion Commons, and the Quantitative PsychologyCommons
This Dissertation is brought to you for free and open access by the Walden Dissertations and Doctoral Studies Collection at ScholarWorks. It has beenaccepted for inclusion in Walden Dissertations and Doctoral Studies by an authorized administrator of ScholarWorks. For more information, pleasecontact [email protected].

Walden University
College of Health Sciences
This is to certify that the doctoral study by
Emmanuel Okoro
has been found to be complete and satisfactory in all respects,
and that any and all revisions required by
the review committee have been made.
Review Committee
Dr. Vibha Kumar, Committee Chairperson, Public Health Faculty
Dr. Adebowale Idowu Awosika-Olumo, Committee Member, Public Health Faculty
Dr. Ronald Hudak, University Reviewer, Public Health Faculty
Chief Academic Officer
Eric Riedel, Ph.D.
Walden University
2018

Abstract
Substance Abuse and Mental Illness Among Youth in the United States
by
Emmanuel Xavier Okoro
MPH, Capella University, 2012
BS, Georgia State University, 1995
Doctoral Study Submitted in Partial Fulfillment
of the Requirements for the Degree of
Doctor of Public Health
Walden University
November 2018
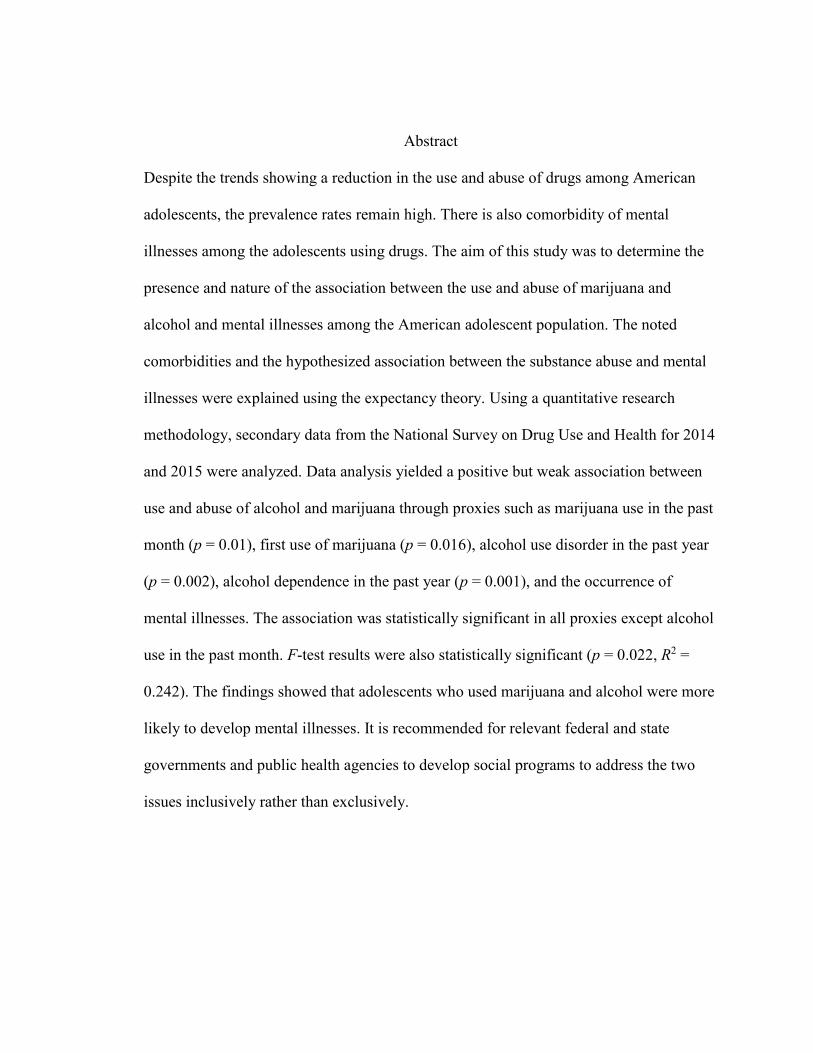
Abstract
Despite the trends showing a reduction in the use and abuse of drugs among American
adolescents, the prevalence rates remain high. There is also comorbidity of mental
illnesses among the adolescents using drugs. The aim of this study was to determine the
presence and nature of the association between the use and abuse of marijuana and
alcohol and mental illnesses among the American adolescent population. The noted
comorbidities and the hypothesized association between the substance abuse and mental
illnesses were explained using the expectancy theory. Using a quantitative research
methodology, secondary data from the National Survey on Drug Use and Health for 2014
and 2015 were analyzed. Data analysis yielded a positive but weak association between
use and abuse of alcohol and marijuana through proxies such as marijuana use in the past
month (p = 0.01), first use of marijuana (p = 0.016), alcohol use disorder in the past year
(p = 0.002), alcohol dependence in the past year (p = 0.001), and the occurrence of
mental illnesses. The association was statistically significant in all proxies except alcohol
use in the past month. F-test results were also statistically significant (p = 0.022, R2 =
0.242). The findings showed that adolescents who used marijuana and alcohol were more
likely to develop mental illnesses. It is recommended for relevant federal and state
governments and public health agencies to develop social programs to address the two
issues inclusively rather than exclusively.

Substance Abuse and Mental Illness Among Youth in the United States
by
Emmanuel Xavier Okoro
MPH, Capella University, 2012
BS, Georgia State University, 1995
Doctoral Study Submitted in Partial Fulfillment
of the Requirements for the Degree of
Doctor of Public Health
Walden University
November 2018

Acknowledgments
First, I would like to give God all the glory and honour due to Him for making
what seemed to be impossible possible for me. There were many difficulties and
challenges encountered in the pursuit of this academic ambition, but through it all, I
trusted God, and He proved Himself worthy of all my praises. Thank you, God.
I would also like to express my gratitude to my dissertation Committee Members:
Dr. Adebowale Awosika-Olumo and Dr. Ronald Hudak, for their knowledge and
guidance in reaching this milestone.
My deepest appreciation goes to my Chairperson: Dr. Vibha Kumar. I sincerely
thank you because without your understanding, dedication, and commitment throughout
the dissertation process, it would have been much harder to accomplish.
Last and not the least, none of this would have been possible without the
unwavering support of my lovely wife (Rose) and Children (Faith, Glory, Xavier, Joshua,
Ivana, and Jesse). I appreciate and thank you all for your support and encouragement.
This dissertation is a testament to your unconditional love that strengthened my
inspiration to complete this program successfully. I would be forever grateful.

i
Table of Contents
List of Figures .................................................................................................................. viii
Section 1: Foundation of the Study and Literature Review .................................................1
Introduction ....................................................................................................................1
Problem Statement .........................................................................................................5
Purpose of the Study ......................................................................................................8
Research Questions and Hypothesis ..............................................................................9
Research Questions ................................................................................................. 9
Hypotheses .............................................................................................................. 9
Nature of the Study ......................................................................................................10
The National Database .................................................................................................11
Limitations of the Study...............................................................................................19
Literature Review.........................................................................................................22
Introduction ........................................................................................................... 22
Literature Search Strategy..................................................................................... 23
Theoretical Foundation for the Study ................................................................... 24

ii
The American Adolescent..................................................................................... 32
Prevalence of Use and Abuse of Marijuana and Alcohol ..................................... 40
Conceptual Definitions ................................................................................................53
Assumptions and Limitations ......................................................................................54
Scope and Delimitations ..............................................................................................55
Significance of the Study .............................................................................................55
Implications for Social Change ....................................................................................56
Summary ......................................................................................................................57
Section 2: Research Design and Data Collection ..............................................................58
Introduction ..................................................................................................................58
Research Design and Rationale ...................................................................................58
Research Questions and Hypothesis ..................................................................... 58
Study Population ................................................................................................... 59
Data Methods ........................................................................................................ 59
Variables ............................................................................................................... 60
Data Analysis Plan ................................................................................................ 60

iii
Threats to Validity .......................................................................................................61
Ethical Considerations .................................................................................................62
Summary ......................................................................................................................63
Section 3: Presentation of the Results and Findings ..........................................................64
Marijuana Use in the Past Month.......................................................................... 64
First Use of Marijuana .......................................................................................... 67
Alcohol Use in the Past Month ............................................................................. 68
Alcohol Use Disorder in the Past Year ................................................................. 70
Alcohol Dependence in the Past Year .................................................................. 71
Major Depressive Episode in the Past Year .......................................................... 72
Association Between Alcohol and Marijuana Use and Mental Illness
Among American Adolescents ................................................................. 73
Section 4: Application to Professional Practice and Implications for Social
Change ...................................................................................................................79
Preamble ......................................................................................................................79
Trends in the State-Level and National-Level Data ....................................................80

iv
Association Between Substance Abuse and Mental Illness .........................................83
Implications for Social Change and Practice ...............................................................85
Conclusions ..................................................................................................................87
References ..........................................................................................................................91
Appendix A: Statistical Outputs ......................................................................................102

v
List of Tables
Table 1. Rate of Use of Marijuana Among Adolescents Aged Between 12 Years
and 17 Years in the Last Month by State ...............................................................41
Table 2. Rate of Use of Alcohol Among Adolescents Aged Between 12 Years and
17 Years in the Last Month by State ......................................................................48
Table 3. Summary of the Descriptive Statistics .................................................................65
Table 4. Summary of the Outputs for the One-Sample t Test ...........................................67
Table 5. Correlation Coefficients for Dependent and Independent Variable ....................74
Table 6. Model Summary From the Multiple Regression Test .........................................76
Table 7. ANOVA Results From the F-Test .......................................................................77
Table 8. Effect Coefficients for the Proxies of the Independent Variables .......................78
Table A1. Marijuana Use in the Past Month ....................................................................102
Table A2. One-Sample Test for the State Averages for Marijuana Use in the Past
Month ...................................................................................................................103
Table A3. One-Sample Test Against the National Average for Marijuana Use in
the Past Month .....................................................................................................104
Table A4. First Use of Marijuana ....................................................................................104
vi
Table A5. One-Sample Test Against the National Average ............................................106
Table A6. One-Sample Test for State-Level Incidence Rate ...........................................106
Table A7. One-Sample Test for Alcohol Use in the Past Month for the State Level
Data ......................................................................................................................107
Table A8. One-Sample Test for Alcohol Use in the Past Month for the State Level
Data ......................................................................................................................108
Table A9. One-Sample Test for Alcohol Use in the Past Month Against the
National Average .................................................................................................109
Table A10. Alcohol Use Disorder in the Past Year .........................................................109
Table A11. One-Sample Test for Alcohol Use Disorder in the Past Year ......................111
Table A12. One-Sample Test for Alcohol Use Disorder in the Past Year Against
the National Average ...........................................................................................111
Table A13. Alcohol Dependence in the Past Year ..........................................................112
Table A14. One-Sample Test for Alcohol Dependence in the Past Year ........................114
Table A15. One-Sample Test for Alcohol Dependence in the Past Year Against
the National Average ...........................................................................................114
Table A16. Major Depressive Episodes in the Past Year ................................................114

vii
Table A17. One-Sample Test Major Depressive Episodes in the Past Year ...................116
Table A18. One-Sample Test for Major Depressive Episode in the Past Year
Against the National Average ..............................................................................117

viii
List of Figures
Figure 1. The users of different drugs in 2013 for the population aged 12-17 years...........6
Figure 2. Projections on adolescent population .................................................................33
Figure 3. Classification of adolescents by their age ..........................................................34
Figure 4. Classification of adolescents by their gender .....................................................35
Figure 5. Classification of the adolescents by race and ethnicity ......................................36
Figure 6. Poverty statistics of the American adolescents ..................................................37
Figure 7. Geographical location in which the American adolescents live .........................39
Figure 8. Percentage of adolescents between 12 and 17 years who used marijuana
in the past month between 2013 and 2014 .............................................................40

1
Section 1: Foundation of the Study and Literature Review
Introduction
Mental illness is one of the public health concerns among the youth in the United
States. Schwarz (2009) argued that the youth, particularly the adolescents, are vulnerable
to the development of mental illnesses due to the developmental changes that are taking
place in their brains. The confluence of the development in their brains and the hormonal
changes that they experience predispose them to depression (Schwarz, 2009). Even more
compelling is the argument that the adolescents, owing to the confluence of the
development in their brains and the hormonal changes, have a higher likelihood of
engaging in behaviours angled to offer thrills.
Depression is considered the most commonly observed mental mood disorder and
is an emotional state of intense and persistent sadness (Mutrie, 2000). Episodes of mild
sadness occur to everyone, but depression consists of long-term periods, endless bad
mood, feelings of hopelessness, and a lack of satisfaction. Mood disorders (formerly
known as affective disorders) include a broad range in the category of disorders,
including the clinical picture of pathological mood and concomitant disorders. Examples
of mood disorders are depression, euphoria, and anger (Taylor, 1999). Major mood
disorders are common in the general population; patients experience primarily a
pathologically persistent and extremely depressed mood that may alternate with an
excessively pathologic euphoric feeling, as in the case of bipolar disorder (Reinecke &

2
Davison, 2002). Mood disorders get accompanied by several signs and symptoms that
affect all the functional areas (Reinecke & Davison, 2002; Taylor, 1999).
According to the Diagnostic and Statistical Manual of Mental Disorders (DSM-
IV-TR) by the American Psychiatric Association (2000), mood disorders are divided into
categories of (a) major depressive disorder, (b) dysthymic disorder, (c) depressive
disorder not otherwise specified, (d) bipolar disorder, (e) cyclothymic disorder, (f) bipolar
disorder not otherwise specified, (g) mood disorder due to a general medical condition,
and (h) substance-induced mood disorder. Today, depression is one of the most common
diseases in the mental health sector (Kessler et al., 2003). Marginalized for decades, it has
only recently received the perception from both the scientific community and the
stakeholders for its propagation range in the societies of the developed and developing
countries.
The World Health Organization (2016) has estimated the incidence of depression
among the entire population around the world to be 350 million people. It is considered
the most widespread mental illness in the United States, affecting approximately 40
million adults, about 18% of the country’s population (Kessler, Chiu, Demler, & Walters,
2005). In 2014, about 15.7 million, or 6.7%, of adults in the United States, had at least
one incidence of major depression in the previous year, while the number of patients at a
lifetime risk of experiencing major depression is at approximately 17% (Center for
Behavioral Health Statistics and Quality, 2015).

3
Statistics with respect to the country’s young population make depression the
most common mental illness in particular age ranges (Bose, Hedden, Lipari, & Park-Lee,
2016). In 2015, around 3 million adolescents, or 12% of the total age group between the
ages of 12 to 17, had at least one incidence of major depression in the previous year
reaching an all-time high in comparison to the period between 2004 to 2014 (Bose et al.,
2016). About 8.8% of the age group experienced a major depression episode with severe
impairment. Major depression episodes presented a higher percentage of female
adolescents with 19.5% compared to 5.8% for male adolescents. Of adolescents aged 15,
about 16.1% reported a major depressive episode, and if a teenager had two or more
ethnic races in their family, the number was 16.6% (Bose et al., 2016). Of the number of
reported events in 12.5% of the population, the teens who received treatment numbered
39.3%, or 1.2 million young people.
The statistics become even more important when considering that very often
depression is confused with little feelings of sadness or frustration related to various
events from daily life (Barker, 1992). The oversight results in underestimating
depression’s seriousness in depressed people who do not realize they have a mental
illness. It allows for a cycle to begin, resulting in patients with depression sometimes
finding it difficult to recover without the help of specialists in the field of mental health
(Graham, 2010).
Different researchers have explored different perspectives regarding the causative
elements or the predisposing factors of depression and other mental ailments in the youth.

4
One of the prevailing themes is the linkage between substance abuse and the occurrence
of mental illnesses in the youth. For instance, Wu et al. (2010) found that the disorders
that are related to substance abuse were comorbid with disorders that are related to
anxiety. The researchers attributed this finding to the fact that during the adolescent stage
of development, young people are more likely to develop the tendencies towards
substance use.
Schwinn, Schinke, and Trent (2010) found an association in the different
direction, reporting that the use of illicit drugs, tobacco, and alcohol in the urban youths
in the late adolescent stage of development was influenced by mental health and gender
among other issues. Even though they found that gender was not a predictive variable in
the use of illicit substances and other drugs, they reported a statistically significant
association between mental health and substance abuse (Schwinn et al., 2010). More
specifically, the researchers found a linear relationship where the urban youth who were
reported with poorer mental health were also more likely to be more involved in
substance abuse.
Further inquiry into this subject is warranted by the rising prevalence of mental
health issues among the youth, the high likelihood of the youth to engage in substance
abuse, and the findings of a linear association between mental illness in the population
and substance abuse. The findings from the study have significant social implications.
They will contribute towards resolving the issues of substance abuse and mental health

5
disorders from the point of collective understanding, especially in a population where the
two issues are prevalent as illustrated by Schwarz (2009) and Bose et al. (2016).
This part of the dissertation is comprised of two sections. The first of two sections
will delve into the foundation for the study and a review of related literature. In addition
to the introduction and background, the section will also feature subheadings such as the
problem statement, purpose of the study, research questions and hypotheses, theoretical
foundation of the study, nature of the study, literature search strategy, literature review
related to key variables, definitions, assumptions, scope and delimitations, and the
significance, summary, and conclusions.
The second section will delve into the research design and methods, and the data
collection and analysis procedures. Some of the featured subheadings in addition to the
introduction will include research design and rationale, methodological aspects such as
study population, sampling and sampling procedures, instrumentation and
operationalization of constructs, the operationalization of variables, data analysis plan,
threats of validity, ethical concerns, and a summary of concepts in the section.
Problem Statement
The trends of substance abuse among the youth are still alarming even though
trends have shown that the prevalence rates have been reducing steadily. The Substance
Abuse and Mental Health Services Administration (SAMHSA, 2014) reported from their
2013 national survey that the prevalence of illicit drug use for the population aged

6
between 12 and 17 years was at 8.8% in 2013. The reported rate was lower when
compared to the periods between 2002 and 2007 and the prevalence rate reported
between 2009 and 2012. As shown in Figure 1, the youth were abusing a wide variety of
drugs.
Figure 1. The users of different drugs in 2013 for the population aged 12-17 years. From
Results From the 2013 National Survey on Drug Use and Health: Summary of National
Findings. NSDUH Series H-48, HHS Publication No. (SMA) 14-4863, by Substance
Abuse and Mental Health Services Administration, 2014, Rockville, MD: Author.
Christensen, Pallister, Smale, Hickie, and Calear (2010) found that millions of the
youth in America suffer from depression and other mental illnesses. Among some of the
reasons associated with the mental illnesses were the physical, emotional, social, and
Marijuana, 7.10%
Non-medical Psychotherapeutic
Drugs, 2.20%Hallucinogens,
0.60% Inhalants, 0.50%Cocaine, 0.20% Heroin, 0.10%0.00%
1.00%
2.00%
3.00%
4.00%
5.00%
6.00%
7.00%
8.00%
Marijuana Non-medical Psychotherapeutic Drugs
Hallucinogens Inhalants
Cocaine Heroin

7
psychological changes that occur in their lives at this stage of life. As reported by
Schwarz (2009), the confluence of these changes and the development of their brains
might predispose them towards thrill-seeking behaviours, some of which include the use
and abuse of nontherapeutic and illicit substances. Depression leads as the most common
mental disorder in U.S. teens. According to Teen Help (2014), in 2014, approximately
2.8 million young people aged 12 to 17 years experienced the condition. Out of this, 17%
were female and 5.7% male. As a consequence of depression, most American youths
indulge in activities such as substance abuse and are more likely to commit suicide by
12% (Teen Help, 2014).
These arguments show an interplay between mental illnesses and substance abuse
among the youth. This is a finding that has been reported in numerous studies. For
instance, Kaminer, Connor, and Curry (2007) reported that substance abuse was
comorbid with major depressive disorders. The same findings were reported by Wu et al.
(2011), who found that comorbidity of suicidal ideations and the use and abuse of
substances was reported in children and adolescents. While these and more studies have
either found comorbidity or linear relationship between the two variables, it is
noteworthy that findings that benefit from more recent data are required to determine
whether the linear association reported by earlier studies is still as significant with the
passage of time. Additionally, a study using national-level data is important to determine
whether the association between the two variables in the study population is significant
when national-level data are considered.

8
In addition to the perspectives discussed above, it is noteworthy that the reporting
of incidence and prevalence rates has been done more commonly at the national level,
especially when federal agencies have published such data. Youth.gov (n.d.) has used this
format when reporting on youth statistics relating to the use and abuse of illicit
substances. However, the aim of such agencies is to reduce the incidence and prevalence
throughout the country by issuing generic policies and guidelines that are then adopted by
state agencies and other agencies at the lower levels of government. The implication of
reporting the prevalence and incidence at the national level is that generally acceptable
levels at the national stage give the impression that substance use and abuse, as well as
the comorbidity of mental disorders, is under control. However, comparing the national
data with the state level data would highlight the states where the problem is more
prevalent compared to the national averages. Such an analysis would be beneficial in
identifying where more efforts are required.
Purpose of the Study
The reason why researchers have focused on United States adolescents is that, as
presented previously, depression is the most common mental illness among American
youth, with current percentages high enough to constitute a stimulus for investigation and
research (Bose et al., 2016). Concurrently, and considering that the current adolescents in
the United States are tomorrow’s adults, it can be assumed that today’s depressed
adolescents will be tomorrow’s depressed adults, increasing the already high percentage
of depressed adults in the country. The aim is to determine the existence and nature of the

9
association between the use and abuse of alcohol and marijuana and mental illnesses
among the youth aged between 12 and 17 years in the United States. To enable the
inquiry, the independent variable was use and abuse of alcohol and marijuana while the
dependent variable was mental illnesses. The covariate variables in the study were the
age group of the youth from whom the data were collected. The failure to consider other
covariate variables is explained in the limitations section.
Research Questions and Hypothesis
The following are the research questions and null and alternative hypotheses that
guided the quantitative inquiry:
Research Questions
The following are the research questions that guided the proposed inquiry.
1. What is the association between the use and abuse of alcohol and marijuana
and mental illnesses among the youth aged between 12 and 17 years in the
United States?
2. What is the difference between use and abuse of alcohol and marijuana and
mental illnesses at the state level and at the national level?
Hypotheses
H01: There is no statistically significant association between the use and abuse of
alcohol and marijuana and mental illnesses among the youth aged between 12 and 17
years in the United States

10
Ha1: There is a statistically significant association between the use and abuse of
alcohol and marijuana and mental illnesses among the youth aged between 12 and 17
years in the United States.
H02: There is no statistically significant difference between state-level data and
the national averages on the use and abuse of alcohol and marijuana and on mental
illnesses among the youth aged between 12 and 17 years in the United States.
Ha2: There is a statistically significant difference between state-level data and the
national averages on the use and abuse of alcohol and marijuana on mental illnesses
among the youth aged between 12 and 17 years in the United States.
Nature of the Study
For this study, I took a quantitative approach. While there were many justifiable
reasons for the choice of this research method, the most significant was its aptness in
answering the research question. A quantitative approach is required in determining the
association between two variables. Xu (2004) argued that when dealing with quantitative
variables, the relationships between the quantitative study variables is established by
looking at the patterns in the data through the help of data manipulation software. It
involves the calculation of the coefficient of the independent or predictor variable that
can be used to explain the changes that are observed in the dependent variable (Xu,
2004). Curwin and Slater (2008) also reported the use of the different mathematical

11
formula to calculate different coefficients to describe data as well as enable the
determination of inferences in the relationship between different quantitative variables.
The National Database
The current study drew from a national database prepared and published by
SAMHSA. The specific database was the features population data and is the product of
the National Survey on Drug Use and Health (NSDUH). This is a survey that has been
performed under the mandate of the federal government in all the states since 1971
(SAMHSA, 2016). As a national database, it primarily provides statistical information for
use by all federal and state agencies on the use abuse of illicit substances. The NSDUH
collects information from citizens of the United States who are over 12 years,
noninstitutionalized, and of the civilian designation (SAMHSA, 2016).
In addition to the trends in the use and abuse of illicit substances, the database
also features information on mental illnesses, mental health problems, interventions and
treatments for the disorders related to substance abuse, and the mental illnesses that co-
occur in the population also using and abusing illicit substances (SAMHSA, 2016). In
addition to the database containing national-level data, there are deliberate measures
implemented to ensure the validity and integrity of the data (SAMHSA, 2016). For
instance, random sampling is employed in the identification and selection of the sample.
The result is a representative sample that best reflects the state of the nation with regards
to the variables for which the data is collected (SAMHSA, 2016).

12
The inclusion and exclusion criteria that are specified in the methodology for the
survey also ensure that data do not include any outliers. During the collection of the data,
researchers implement deliberate measures to encourage the respondent to give honest
responses to the prompts in the survey (SAMHSA, 2016). For instance, the survey uses
the audio computer-assisted interviewing protocol to improve the confidentiality and
privacy when giving the responses to the prompts. The aim is to ensure that the
respondents feel safe enough to be honest when they are giving responses to issues
considered to be sensitive, such as the use of illicit drugs (SAMHSA, 2016).
The database contains data on 15 variables, all of which measure the use and
abuse of illicit substances and mental illnesses. The illicit substances that are considered
in the database include marijuana, cocaine, and heroin (SAMHSA, 2016). In addition, the
database contains data on the use and abuse of alcohol, cigarettes, and tobacco. For some
of these drugs, the database explores the use of the substance in the past year, month, and
the first-time use of the drug. For alcohol, the database explored alcohol dependence and
use disorders (SAMHSA, 2016).
The variables used to measure mental illnesses include the occurrence of serious
mental illnesses, any mental illnesses, major episodes of depression, and serious suicidal
ideations. The respondents were asked to limit their responses to the past year
(SAMHSA, 2016). All the data collected on these variables were grouped per the age
group of the respondents and the state in which they resided (SAMHSA, 2016). The age
groups into which the data were grouped include all participants aged 12 years and

13
above, between 12 years and 17 years, between 18 years and 25 years, and 26 years and
above (SAMHSA, 2016). The data were included for the 50 states in the country and the
District of Columbia (SAMHSA, 2016).
There were three classes of variables relevant to the current inquiry. The
independent variable for the inquiry was the use and abuse of alcohol and marijuana. The
national database used for the inquiry contains data on this variable. The variable was
measured using different proxies that illustrate the incidence and total percentage for use
and abuse of different substances from 50 states as well as the District of Columbia. The
proxies for the independent variable relating to marijuana as a drug included marijuana
use in the past year, marijuana use in the past month, and the first use of marijuana. The
proxy for cocaine as a drug was cocaine use in the past month. The other drug to be
assessed was alcohol using proxies such as alcohol use in the past month, alcohol use in
the past month among individuals aged 12 to 20, and alcohol used disorder in the past
year, alcohol dependence in the past year. The other drugs explored as part of the
independent variable included heroin, tobacco, and cigarette using proxies such as heroin
use in the past year, tobacco product use in the past month, and cigarette use in the past
month. Despite a rich dataset containing many variables, this study focused on the use
and abuse of alcohol and marijuana among the youth of different age classification and
the influence the two independent variables and their proxies have on the occurrence of
mental illnesses.

14
The dependent variable for the study was mental illnesses. While mental illness is
an umbrella term that describes various mental disorders, the national database used for
the inquiry contained data on specific proxies that were used to measure mental illnesses.
The first proxy through which mental illness was measured is a serious mental illness in
the past year. The other three proxies were any mental illness in the past year, had
serious thoughts of suicide in the past year, and a major depressive episode in the past
year. These proxies were used in the proposed inquiry. The covariate variable in the
proposed study was age. The national database from which the data were derived grouped
the data by state of residence and age. Through this inquiry, I determined whether age as
a covariate variable was a significant predicting variable.
In addition to the independent and dependent variables, there were other
confounding variables that need to be considered. Some of the confounding variables
included the environmental influences. One of the aspects of this confounding variable
and one of significance was the different levels of control in the neighbourhoods in which
the youth lived. Kulis, Marsiglia, Sicotte, and Nieri (2007) explored the influence of
different levels of social control such as the parochial, private, and public levels. The
private level of social control emanates from the attempts of friends, parents, and the
extended family to control the behaviour of the young person (Kulis et al., 2007).
Social control at the parochial level is applied from the social institutions within
the community such as the churches, youth programs, and schools. The public social
control depends on the ability of the community in which the young people live to

15
acquire the goods and resources such as community youth centers, recreational facilities,
law enforcement services, and prevention programs (Kulis et al., 2007). The concerted
effort from these sources of social control has an influence on the behaviour of the young
person. It is arguable that the best results are achieved when each of the sources of social
control contributes towards restricting, teaching, and refining the behaviour of the youth.
Consequently, studies have linked the environment with the patterns of use and
abuse of illicit substances among the youth. For instance, Quitno (2003) found that there
was a tendency for risk behaviours involving the use and abuse of illicit substances in the
neighbourhoods in low socioeconomic settings. This is because some of the enduring
demographic characteristics of the people living in such neighbourhoods include single-
parent families, parents with different drug-related disorders, and high rates of crime
(Quitno, 2003) These factors coincide with low forms of social control from different
levels. The private level of social control might be inexistent or inadequate where the
youth are orphaned or are in single-parent families. The disenfranchised nature of some
of these low socioeconomic setting neighbourhoods means that many of the social
amenities, goods, and services are not available for the young people. This further
contributes to a deterioration of public level of social control (Samson, Morenoff, &
Earls, 1999). In scenarios where the social control is not existent or inadequate from
different levels, there is a higher likelihood that the youth will engage in risky behaviours
such as the use and abuse of illicit substances (Kulis et al., 2007).

16
Meyers and Dick (2010) also explored the environmental influence. In addition to
the social environment, Meyers and Dick explored the effect of the genetic environment
on the likelihood of the youth engaging in the risky behaviours such as the use and abuse
of illicit substances. The researchers found that some of the disorders related to use and
abuse of illicit substances are heritable. For instance, the researchers found that
alcoholism as a drug-related disorder could be passed down generations through
genetically related mechanisms.
Even with this biological aspect of the debate on the use and abuse of illicit
substances among the young population, it is still arguable that this aspect of the
environmental influence is still a confounding variable. In advancing this argument, Kulis
et al. (2007) argued that the presence of social controls could mitigate the effect of some
of the environmental factors. For instance, parental and parochial control can attenuate
the influence of the genetic environment by offering both structure and an environment
where the youth understand the ills of the use and abuse of illicit substances (Kulis et al.
2007). The provision of recreational facilities, youth programs, and community centers
among other public resources and goods can also offer the support and healthy
alternatives to attenuate the influence of the genetic environment on the likelihood of the
young person to engage in the risky behaviours such as the use and abuse of illicit
substances.
Socioeconomic status is yet another confounding variable of significance in this
study. Different markers of the socioeconomic status of the young population have been

17
studied for their influence on the risky behaviours among the youth. Some of the most
telling markers of the socioeconomic status include the status of the family on the social
ladder and the family resources. These factors were explored in the study by Hanson and
Chen (2007). Using a sample of 113 youth, Hanson and Chen collected data on the social,
economic status of the families as reported by the respondents and their tendencies
towards substance abuse. Hanson and Chen found that the likelihood of engaging in the
use and abuse of illicit substances was high among the teenagers from families with high
socioeconomic status.
Hanson and Chen’s (2007) findings showed that the financial wellbeing of a
family has a predictive role on whether the teenagers in the family engage in the risk
behaviour of use and abuse of substance abuse. The findings from this study have been
contradicted by other researchers whose findings reported a higher likelihood of engaging
in the use and abuse of substances among the youth from families in low socioeconomic
settings. These findings were the basis on which Humensky (2010) based his study, in
which he aimed to determine whether there was a higher likelihood for engaging in the
use and abuse of illicit drugs by the youth from families with high socioeconomic status.
Humensky (2010) found that the use of marijuana, binge drinking, and cocaine
was associated with the high parental educational achievements. The adolescents of
parents who had a high income were also found to engage in more use of marijuana and
binge drinking. Without disparaging earlier findings that the low socioeconomic status
had a predictive role in the likelihood of engaging in use and abuse of illicit substances,

18
Humensky (2010) found that the adolescents of parents with a high socioeconomic status
were also not protected from the predictive role of the factor.
There are various methodological aspects I considered for the current inquiry.
While I cover many of these aspects in the next section, I will highlight some of the
aspects such as the source of the dataset, the data collection method, and the analytical
procedures to be used. The source of the national database used in the inquiry was
SAMHSA. The data were collected in conjunction with the Center for Behavior Health
Statistics during the NSDUH that was performed between 2014 and 2015.
The data were collected from young people aged between 12 years and 25 years.
Data were also collected for the people aged more than 26 years. In the cohort of between
12 and 25 years, the subjects were divided into groups of between 12 and 17 years and 18
and 25 years. The data were sampled from 50 states in the United States of America as
well as British Columbia. I analyzed the data in the national database using the Statistical
Package for Social Sciences. However, the data platform and cleaning were done using
Microsoft Excel. The Statistical Package for Social Sciences is the preferred software for
the analysis of the data because it enables one to perform multiple regression to
determine how multiple independent variables influence one dependent variable (Norris,
Qureshi, Howitt, & Cramer, 2014).
I performed a multiple regression on the dataset for the various proxies that
measure the dependent and independent variables. The regression outputs offered the

19
correlation coefficients that were interpreted to determine whether a linear relationship
existed between the variables, the magnitude of any linear relationship determined to
exist, and its direction. The regression output also contained the ANOVA statistic that
helped determine the statistical significance of any linear relationship established
between the two variables (Norris et al., 2014).
Limitations of the Study
The covariate variable used in the study was age. However, there were other
variables that might influence the hypothesized relationship. Some of these variables
included the social economic status of the youth and their families, the level of education
of both the targeted group and their families, as well as race. The literature considered in
this paper showed that these factors had a significant influence on the hypothesized
relationship between the variables. For instance, Quitno (2003) reported that the youth
who lived in the neighbourhoods in low socioeconomic areas had a higher propensity to
engage in risky behaviours that involved the use and abuse of illicit drugs. Quitno
explained that the propensity for risk behaviours in this environment was attributed to the
enduring demographic characteristics such as parents who have had or still have issues
and disorders related to illicit substances, the high rates of crime that characterize the
neighbourhoods, and the single-parent families.
The genetic environment has also been shown to have an influence on the
hypothesized relationship between variables, and as such, would have been an
appropriate covariate variable. Meyers and Dick (2010) reported that many of the

20
disorders that the people who engage in the use and abuse of illicit drugs have are
heritable. The implications of this argument are that some trends witnessed in the target
group could be a product of the heritable behaviours from their parents. The genetic
environment would also have constituted an appropriate covariate variable.
Hanson and Chen (2017) showed that the socioeconomic status of the families
and the target group also had a confounding effect on the hypothesized relationship
between the variables. The family resources and the place of the families on the social
ladder are important markers of socioeconomic status. Families who enjoyed affluence
and were high on the social ladder were shown to have the surplus income the youth
might require to finance the risk behaviours. Hanson and Chen found that there was a
higher propensity for the youth from affluent families to engage in the risk behaviour of
use and abuse of illicit substances. The significance of this covariate variable was
illustrated by Humensky (2010), who found that binge drinking, cocaine usage, and
abuse, and smoking marijuana was common among the youth from families where the
parents had high academic achievements.
Despite the appropriateness of these confounding variables, only age can be used
in this study due to the nature of the national database chosen. The database contains data
that is described using several variables. One of the variables in the database is drugs.
Some of the drugs about which data were collected include marijuana, cocaine, heroin,
tobacco, and alcohol. For these variables, the data were collected through different

21
permutations. For instance, the data on marijuana pertained to the use of the drug by the
respondents in the past year, past month, and the first instance of use.
The only permutation used for cocaine and heroin was the use of the drug in the
target audience in the past year. The database contains more permutations for use for
alcohol. For instance, the database contains data on the dependence on alcohol within the
past year. The data on alcohol also contained information on the development of a
drinking disorder in the year before the national survey was performed. SAMHSA also
collected data on the use of alcohol in the past month for all the participants and
particularly for those participants aged between 12 years and 20 years.
In exploring the trends in the use of tobacco among the targeted population,
SAMHSA collected data on the use of a product containing tobacco in the month before
the national survey was performed. The SAMHSA also collected specific data on the use
of cigarette products in the month before the national survey was performed.
In addition to drugs, mental health was also included as a variable in the database.
SAMHSA used various variables in measuring the mental health of the targeted
population. One of the proxies that SAMHSA used was the development of serious
mental illness in the target population in the year leading to the national survey.
SAMHSA used wider inclusion criteria and collected data for the development of any
mental illness, serious or otherwise in the year before the national survey was performed.
SAMHSA also explored the presence of suicidal ideation among the target population in

22
the year leading to the national survey. The final proxy on mental illness was the
development of major depressive episodes in the target population in the year leading to
the national survey.
The grouping of the data in the national database was done with respect to age. It
is for this reason that I used ages as a covariate variable. In total, there were 15 groupings
based on age. The number is inflated by the fact that the partial analysis that was
performed before the database was published included a report of estimates, the lower
estimate, and the upper estimate. The fact that the national database only uses age as the
covariate variable was a limitation considering that part of the requirements was to use
one national database that contained all the variables that are necessary for exploring the
topic in-depth and answer the research questions comprehensively. It is for this reason
that age was the sole covariate variable in the study. Future studies using secondary data
should address this limitation to determine the influence of the other covariate variables
discussed earlier.
Literature Review
Introduction
In addition to the theoretical basis, the inquiry also benefited from a review of
existing literature. This exercise helped identify what is known as well as the gaps that
exist in the literature. The identification of gaps is a prerequisite for the formulation of
knowledge-based recommendations for other studies in the future. In this section, I

23
discuss the search strategy for the sources to be used in developing a literature review and
the theoretical foundation on which the inquiry was based.
Literature Search Strategy
I performed the literature search on numerous databases. The search engines
included PubMed, Google, NCBI, Google Scholar, Medline Plus, and PsychNet. Data
from published reports from reliable government websites such as the National Institute
of Mental Health and Centers for Disease Control and Prevention, as well as health
organization websites were also included. The information gotten from these search
engines was used in the literature review section. The relevant articles were retrieved
through a combination of search words.
Some of the search words and phrases used in different permutations included
mental illnesses, suicidal ideation, depression, depressive episodes, nonmedical
substances, illicit substances, substance use, substance abuse, association, regression,
correlation, and relationship. These search terms will be combined in different forms to
yield topic sentences or phrases that will be input in the search engines to yield possible
articles.
In terms of scope, the sources that were selected for the theoretical foundation and
other sections of the dissertation included peer-reviewed articles, periodicals, articles
from scholarly journals, articles published by relevant and credible organizations, books,

24
and credible electronic sources. The inclusion of articles that met that criteria helped
ensure that the literature reviewed in this paper was varied and credible.
Theoretical Foundation for the Study
Various mechanisms can be cited to explain the linkage between the use and
abuse of marijuana and alcohol and the comorbid occurrence of mental health issues. One
of the mechanisms is the expectancy theory. For this study, I did not hypothesize a causal
effect relationship between the two variables. Rather, the hypothesis was that the two
variables are related in a linear manner where a change in one variable results in a change
in another variable in a given direction and to a given magnitude. Considering this
proposition, the expectancy theory is one of the mechanisms that offers an apt
explanation of how the two variables relate.
The expectancy theory explains both the use and abuse of the nonmedical and
illicit substances and the linkage between the use and abuse and the comorbidity of
mental illnesses. One of the propositions of the expectancy theory is that people will
understand the effect that a certain drug will have on them after consumption by
observing its effects on other users of the drug (Pedersen et al., 2015). Using
experimentation and by observing the effects of the drug on others, the individuals are
also able to understand, reaffirm, or disprove the negative and positive beliefs regarding
use and abuse of nonmedical and illicit substances (Pedersen et al., 2015).

25
There are apt examples that can illustrate the relationship described above. For
instance, marijuana is the one illicit drug that is commonly used by adolescents and
young adults in the United States (Pedersen et al., 2015). There are prevailing beliefs and
attitudes regarding the use of the drug. For instance, some people believe that the use of
the drug relaxes them. A young person who uses the drug with this belief is likely to
experience a relaxed sensation. The said youth would likely affirm the belief through the
results of experimentation and is, therefore, more likely to continue using the drug. Other
young people are informed of the likelihood that the use of marijuana will diminish their
cognitive functions and capabilities. The young people can collect data on this belief
through observation or experimentation. If they determine that their cognitive functions
are diminished by using the drug, they are more likely to halt the use of the drug to avoid
any further negative consequences (Pedersen et al., 2015).
The expectancy theory can also be cited to explain the relationship between
mental illnesses and the use and abuse of nonmedical and illicit substances. Researchers
such as Low et al. (2012) have found that the beliefs surrounding the use of the drug play
an important role. For instance, a young person who believes that the use of a drug such
as marijuana will attenuate feelings such as social anxiety is likely to use the drug to help
combat social anxiety. In this scenario, the use of the drug can be intermittent and
predicted by situations where social anxiety is undesirable, such as when talking in
public.

26
However, there is the risk that one can develop an addiction to the substance,
especially because the therapeutic effect of the drug in combating the social anxiety is
only as sustainable as the length of the effect of the drug on the human body. Low et al.
(2012) reported that there is a higher likelihood for young people who are afflicted with
stressful events to engage in the use of illicit substances. When asked, they attribute the
use of the illicit substances such as marijuana on the need to attenuate the stress,
depression, and anxiety with which they are afflicted (Bottorff, Johnson, Moffat, &
Mulvogue, 2009).
The association of substance abuse and comorbidity of mental illnesses has been
explored from the vantage point of the expectancy theory. Pedersen et al. (2015) argued
that positive expectancies relating to the use of nonmedical and illicit substances are
predictive factors for the consequences that ensue. The positive expectancies are that the
use of the nonmedical and illicit substances will help to attenuate the stress and other
mental health issues such as depression. Conversely, negative expectations result in the
reduction of the risk. This often occurs when the young person is concerned that the use
of nonmedical and illicit substances will diminish their cognitive capabilities and
functions (Pedersen et al., 2015).
Using a sample of students from middle school, Clark, Ringwalt, and Shamblen
(2011) found that the positive expectancies in the use of the nonmedical and illicit
substances were associated with the use and abuse of these substances. Bickner and
Schmidt (2008) explored a different perspective using a sample comprising of young

27
adults drawn from community and clinical settings. The researchers found that there was
a positive association between the use of marijuana and the affliction of social anxiety.
This relationship indicated that young adults who had social anxieties were more
likely than their counterparts without the affliction to use marijuana. With regards to the
significance of the positive association found between the two variables, Bickner and
Schmidt (2008) found that the association was stronger in young adults who had negative
expectancies about the use of the drug. According to Pedersen et al. (2015), the negative
expectancies in this context were that in using the drugs, they would diminish the mental
capabilities and functions of the user.
The aptness of the expectancy theory in describing the association between the
study variables has also been shown through the research performed by de Dios et al.
(2010). The researchers in that study used a sample comprised entirely of young female
subjects. The researchers explored how expectancies regarding the ability of a drug to
help attenuate tension influenced the use of the drugs. They found that these expectancies
were a significant predictor of the use of drugs such as marijuana and anxiety in the users
(de Dios et al., 2010).
The expectancy theory described above explains why young people might engage
in the use and abuse of nonmedical and illicit substances. The theory also explains the
association that numerous researchers have reported between the use and abuse of
nonmedical and illicit substances and the comorbidity of mental illnesses among the

28
study population. This theory informed the inquiry to an extent. More precisely, and
because the study employed secondary data as will be discussed in Chapter 3, the
knowledge gained from this theory will help in the identification of gaps in the existing
literature, secondary data, and the current proposal as a prerequisite for making
recommendations for future studies.
Kaminer et al. (2007) argued that in most occasions, adolescents who were
diagnosed with different disorders relating to substance abuse were also found to have
comorbid psychiatric disorders. This is an occurrence that is common among the
adolescent population. For instance, Kaminer and Bukstein (2007) reported that between
70% and 80% of the clinical samples of adolescents who were diagnosed with different
substance abuse disorders were also found to have comorbid psychiatric disorders, a
phenomenon that is commonly referred to as dual diagnosis. While neither of the two
articles explored the relationship between the two variables, it is noteworthy that the
comorbidity of disorders that are related to substance abuse and mental health disorders
has been reported.
The comorbidity of the two variables in the adolescent population has also been
highlighted by the National Institute on Drug Abuse (2010). The corporate author found
that different mental illnesses and disorders related to the use and abuse of nonmedical
and illicit substances co-occur prevalently in the same individuals. The prevalence of the
comorbidity of the conditions has been high enough to warrant inquiry from both federal
organizations and players from academic realms. Deas (2006) also reported comorbidity,

29
arguing that the impact of the disorders related to the use and abuse of nonmedical and
illicit substances is not just predicted by the fact that these disorders are prevalent among
the adolescent population; the impact is also predicted by the fact that the disorders also
co-occur with other psychiatric disorders (Deas, 2006).
The findings from the clinical study performed by Langas, Malt, and
Opjordsmoen (2011) also contributed to the debate on the comorbidity of the disorders
related to the use and abuse of nonmedical and illicit substances and mental illnesses. The
researchers reported that the comorbidity was highly prevalent among the adolescent
population. Similar findings had been reported by Roberts, Roberts, and Xing (2006),
who argued that talks of mental illnesses were commonplace in any discussions relating
to substance abuse among the adolescent population. The findings reported in the studies
discussed above have a bearing on the proposed inquiry. It was noted earlier that while
my purpose was to explore the association between mental illnesses and the use and
abuse of nonmedical and illicit substances but not based on the need to establish
causality.
This argument has been exemplified by National Institute on Drug Abuse (2010),
who argued that the fact that comorbidity has been established through different studies is
not an indication that there is a causality relationship between the two variables. While
causality is not ruled out as an explanation for the comorbidity of the two variables, other
scenarios have also been postulated as possible explanations for the comorbidity
phenomenon. The first is a scenario where the drugs that are abused by the adolescents

30
cause them to develop or experience symptoms that are characteristic of different mental
illnesses (National Institute on Drug Abuse, 2010). This is common among the people
who abuse marijuana, as they have been found to have an increased risk of developing
psychosis, a mental illness. In this scenario, the two conditions might occur in the same
individual.
The second scenario is one where an adolescent result in using and abusing drugs
courtesy of a mental illness with which they have been diagnosed (National Institute on
Drug Abuse, 2010). It is not uncommon for individuals who are diagnosed with
subclinical, overt, or mild forms of different mental disorders to use different drugs for
the purposes of self-medication. This was explained at length by the expectancy theory,
particularly, where positive expectancies are harboured in the way of attenuating the
manifestations of the mental illness. For instance, patients who are diagnosed with
schizophrenia are known to consume tobacco-based products based on the belief that they
will attenuate the manifestations of the mental illness as well as to improve the cognitive
functions (National Institute on Drug Abuse, 2010). The third scenario is one where
overlapping factors including chronic stress, trauma, vulnerabilities in the genetics, and
deficits in one’s brain resulting in the development of mental illnesses as well as the use
and abuse of nonmedical and illicit substances.
Even with the presence of different scenarios that might explain the comorbidity,
an association between the dependent and independent variables has been established by
different researchers. It is worth noting that there has not been a consensus regarding the

31
existence of a relationship between the two variables. Researchers have reported findings
on either side of the divide. Harris and Edlund (2005) reported an association between the
two variables. The vulnerability of the adolescence stage of development was cited as a
contributing factor to the existence of the association.
Rao, Daley, and Hammen (2000) reported that it is during this period of
development when there is the highest likelihood of developing the disorders that are
related to both the use and abuse of nonmedical and illicit substances as well as mental
illnesses. This finding is significant because it offers a foundation for the association
between the two variables. Brook et al. (2002) argued that the teenagers who engage in
the use and abuse of nonmedical and other illicit substances at this stage of development
are more likely to develop depression later in the adolescence stage. This is an indication
that a linear relationship exists between the two variables.
However, the findings of an association have been denied in other studies. For
instance, Degenhardt, Hall, and Lynskey (2003) could not find that depression occurred
comorbid with substance abuse when working with youth who reported to using
marijuana. Curran, White, and Hansell (2000) also found that the increasing use of
alcohol or other drugs was not significantly associated with symptoms of mental
disorders such as anxiety or depression. Measelle et al. (2006) found that only a small
association existed between mental illnesses such as anxiety and depression and the use
and abuse of substances. The researchers further reported that the small relationship was

32
rendered statistically insignificant when the effect of the confounding variables was
considered.
The American Adolescent
This is a diverse group that differs in many attributes. The following are some of
the attributes that characterize the American adolescent.
Population growth. The American adolescent comprises a significant proportion
of the total population in the country. Estimates by the Office of Adolescent Health
(2016) estimates that there are 42 million adolescents in the United States, a number that
represents 12% of the total population. The adolescent group as conceptualized by the
Office of Adolescent Health comprises of the young people ranging from ages 10 to age
19. The number is projected to grow exponentially in the coming years. Figure 2 shows
that at present, the adolescent population is estimated at 42 million. By 2050, the
population is estimated to have increased to 45 million, a figure that will represent
approximately 11.2% of the total population.

33
Figure 2. Projections on adolescent population. From the Office of Adolescent Health,
2016.
Age and gender. The diversity seen in this group is further predicted by age and
gender as demographic attributes. Age is an important factor in the characterization of
this population cohort because the factor predicts the engagement of members of the
population cohort in risky behaviours. For instance, Centers for Disease Control and
Prevention (2014) found that there is a higher likelihood for the adolescents aged
between 15 years and 19 years to engage in risky behaviours such as the use and abuse of
illicit substances and unsafe sexual practices when compared to the youth aged between
10 years and 14 years. In addition to age, gender also predicts the behaviour of the
adolescents. For instance, there is a higher likelihood for the male adolescents to engage
in risky behaviours when compared to the female adolescents. Centers for Disease
13.20%
11.20%
42000000
45000000
40500000
41000000
41500000
42000000
42500000
43000000
43500000
44000000
44500000
45000000
45500000
10.00%
10.50%
11.00%
11.50%
12.00%
12.50%
13.00%
13.50%
2014 2050
Percentage Numbers

34
Control and Prevention (2014) found that there is a higher likelihood to engage in the use
and abuse of illicit drugs such as alcohol and tobacco. Figure 3 shows that there is an
equal divide between the adolescents in terms of age.
Figure 3. Classification of adolescents by their age. From the Office of Adolescent
Health, 2016.
Figure 4 shows that there are more male adolescents (51%) compared to the female
adolescent (49%).
50%, 50%50%, 50%
Adolescents by their Age
Ages 10-14
Ages 15-19

35
Figure 4. Classification of adolescents by their gender. From the Office of Adolescent
Health, 2016.
Race and ethnicity. Race and ethnicity is another attribute that predicts the
diversity of the American adolescent. Race and ethnicity are important descriptors of
behaviour as found by the Centers for Disease Control and Prevention (2014). The
health-seeking behaviours of the youth vary with their race and ethnicities. Race and
ethnicity is also a predictor of the socioeconomic characteristics of the youth. For
instance, the Agency for Healthcare Research and Quality (2012) reported that many of
the youth in the minority races and ethnicities live in lower socioeconomic settings
compared to the youth in the major races.
Figure 5 shows the proportion of the American adolescent from different
ethnicities and the projections for the growth of the adolescents from the ethnicity by
51%
49%
48%
49%
49%
50%
50%
51%
51%
52%
Males Females
Adolescents by the Gender

36
2050. At present, 54.1% of the American adolescents are of the white descent. Although
projections show that the proportion of the youth from this ethnicity will reduce to
40.3%, most of the adolescents at the time will still be of the white descent. The youth of
the Hispanic descent comprise 22.8% of the total adolescent population. However, this
number is projected to rise more significantly than that of the adolescents from other
ethnicities to 31.2% by 2050. The African American ethnicity accounts for the third most
number of adolescents in the United States with a proportion of 22.8%. This number is
not projected to increase significantly by 2050 as evidenced by a reduction of 0.9% to
13.1%.
Figure 5. Classification of the adolescents by race and ethnicity. From the Office of
Adolescent Health, 2016.
Socioeconomic status. The socioeconomic status is a predictor of the behaviour
of adolescents. The ability to finance leisure activities has an influence on the
engagement in risky behaviours. Blackwell (2010) reported that poverty is especially
54.10%
22.80%
14.00%
4.70%0.90% 0.20%
3.40%
40.30%
31.20%
13.10%
7.40%
0.70% 0.20%
7.00%
0.00%
10.00%
20.00%
30.00%
40.00%
50.00%
60.00%
White Hispanic Black Asian AIAN Alone HPI Alone Multiracial
2014 2050

37
significant for the youth raised in single-parent families. The significance of
socioeconomic status was modelled by Pampel, Kreueger & Denney (2010) in a study
where he found that there was a higher likelihood for adolescents from low
socioeconomic settings to partake in risk behaviours such as smoking and to also
experience emotional problems when compared to youth from high socioeconomic
settings.
Figure 6. Poverty statistics of the American adolescents. From “Current Population
Survey, Annual Social and Economic Supplement, 2014,” by the U.S. Census Bureau,
2014 (http://www.census.gov/cps/data/cpstablecreator.html).
The population survey that was performed by the U.S. Census Bureau (2014)
found that a significant 18% of the adolescent population in the United States were living
in low socioeconomic settings. This classification was based on the Federal Poverty Line
Living in Poverty , 18%
Not Living in Poverty, 82%

38
which is determined at a family consisting of four household members earning an annual
income amounting to 24,250 dollars.
Geographical location. The location where the adolescents in the United States
live is also another factor that predicts their diversity. The Office of Adolescent Health
(2016) also found that this factor is a significant predictor of behaviour because of
different exposures that different locations given the adolescents. Exposures affect the
socialization of the adolescents. For instance, the U.S. Department of Health and Human
Services (2011) reported that the youth living in urban areas have a higher likelihood to
access social amenities such as playgrounds and recreational parks. Samson et al., (1999)
had reported that social control is an important aspect of the influence of the environment
on the behaviour of adolescents.

39
Figure 7. Geographical location in which the American adolescents live. From “Current
Population Survey, Annual Social and Economic Supplement, 2014,” by the U.S. Census
Bureau, 2014 (http://www.census.gov/cps/data/cpstablecreator.html).
In the population survey performed by the U.S. Census Bureau (2014), 18.3
million adolescents in America were living in suburban areas. These are the areas in the
periphery of the city in a metropolitan area. U.S. Census Bureau (2014) also found that
another 11 million American adolescents lived in urban areas. These are the youth who
live in the cities of a metropolitan area. The number of the youth who lived in the rural
areas of the United States according to U.S. Census Bureau (2014) was 6.1 million
adolescents.
18300000
11000000
6100000
0 5000000 10000000 15000000 20000000
SUBURBAN
URBAN
RURAL

40
Prevalence of Use and Abuse of Marijuana and Alcohol
Prevalence of use and abuse of marijuana. The data on the prevalence of use
and abuse is available both at the state and national level. Arguably, the data at the state
level is aggregated to form national-level data. Figure 8 shows the prevalence of use of
marijuana in the past month in the target population in different states. The data shows
that the lowest prevalence was noted in Alabama with a rate of 4.98% while the highest
rates were noted in Colorado where the rate of use in the past month was noted at 12.56%
(Hughes, Lipari & Williams, 2015).
Figure 8. Percentage of adolescents between 12 and 17 years who used marijuana in the
past month between 2013 and 2014. From “State Estimates of Adolescent Marijuana Use
and Perceptions Of Risk Of Harm From Marijuana Use: 2013 And 2014,” by A. Hughes,
R. Lipari, and M. Williams, 2015
(https://www.samhsa.gov/data/sites/default/files/report_2121/ShortReport- 2121.html).

41
Table 1 shows that the prevalence rate at the national level remained relatively
constant between 2013 to 2014 and 2014 to 2015. However, the rates in states such as
Delaware Colorado, Arizona, and Hawaii among others reduced. The data also shows
that the prevalence rates in states such as Alaska, Georgia, Montana, and Massachusetts
among others increased. Comparing the state-level data with the prevalence rate at the
national level can help show the states in which the prevalence rates are higher than the
rate reported at the national level. This information is important in the planning and
evaluation of new and existing interventions respectively. This information can be used
by health agencies at the state level to justify increased investment in preventive-based
interventions to reduce both the incidence and prevalence rates.
Table 1
The Rate of Use of Marijuana Among Adolescents Aged Between 12 Years and 17 Years
in the Last Month by State

42
State
12-17 12-17
(2013-2014) (2014-2015)
The total U.S. 7.22 7.2
Alabama 4.98 5.16
Alaska 9.19 10.64
Arizona 8.3 7.71
Arkansas 6.22 6.46
California 8.74 8.32
Colorado 12.56 11.13
Connecticut 7.91 8.34
Delaware 8.22 7.42
District of Columbia 10.56 8.85
Florida 7.51 6.78
Georgia 6.06 6.92
Hawaii 7.65b 6.15

43
Idaho 6.39 6.51
Illinois 6.75 6.55
Indiana 6.52b 8.08
Iowa 5.17 5.3
Kansas 5.85 6.43
Kentucky 5.63 6.36
Louisiana 5.55 5.33
(table continues)

44
State 12-17 12-17
(2013-2014) (2014-2015)
Maine 9.9 10.01
Maryland 8.05 9.2
Massachusetts 8.88 9.22
Michigan 8.09 8.06
Minnesota 6.75 6.21
Mississippi 5.6 5.29
Missouri 6.45 6.56
Montana 8.3 8.71
Nebraska 5.54 5.26
Nevada 7.97 7.39
New Hampshire 9.83 9.44
New Jersey 6.36 6.81
New Mexico 7.98 8.53

45
New York 7.75 7.55
North Carolina 6.51 5.97
North Dakota 5.6 6.21
Ohio 6.04 6.05
Oklahoma 5.52 5.42
Oregon 10.19 9.42
Pennsylvania 7 6.98
Rhode Island 10.69 10.19
South Carolina 6.16 6.57
South Dakota 5.32 6.43
(table continues)

46
State 12-17 12-17
(2013-2014) (2014-2015)
Tennessee 5.7 5.9
Texas 6.12 6.86
Utah 5.42 4.54
Vermont 11.4 10.86
Virginia 5.89 5.44
Washington 10.06 9.17
West Virginia 5.6 6.05
Wisconsin 7.18 7.6
Wyoming 6.19 6.59
Note. From (SAMHSA, 2015).
Prevalence of use and abuse of alcohol. The number of adolescents who
consumed alcohol in the month prior to the administration of the national survey by
SAMHSA (2015) between 2013 and 2015 and 2014 and 2015 was 11.55% and 10.58%
respectively Source: (SAMHSA, 2015). In the same fashion with the trends on the use

47
and abuse of marijuana, some states such as Delaware, California, Florida, Colorado, and
Maine had prevalence rates that were higher than the national averages. The prevalence
rate in other states such as Arkansas, Alabama, Texas, and West Virginia among others
were lower than the national averages Source: (SAMHSA, 2015). The information
yielded from the comparison of state-level data, and national-level data can help identify
the states in which more interventions focused on prevention are required.

48
Table 2
The Rate of Use of Alcohol Among Adolescents Aged Between 12 Years and 17 Years in
the Last Month by State

49
State
12-17 12-17
(2013-2014) (2014-2015)
The total U.S. 11.55a 10.58
Alabama 10.53a 8.76
Alaska 9.22 11.04
Arizona 11.90b 10.45
Arkansas 9.9 9.34
California 12.01b 10.92
Colorado 14.25 12.55
Connecticut 12.77 13.61
Delaware 10.61 10.36
District of Columbia 12.63 13.18
Florida 12.26a 10.72
Georgia 10.60a 8.93
Hawaii 11.2 10.55

50
Idaho 10.79 10.25
Illinois 10.98b 9.88
Indiana 11.44 10.06
Iowa 10.81 10.16
Kansas 11.18 10.45
Kentucky 9.02 8.24
Louisiana 12.35 10.75
(table continues)

51
State 12-17 12-17
(2013-2014) (2014-2015)
Maine 11.86 12.47
Maryland 12.54 12.09
Massachusetts 13.3 12.21
Michigan 11.56 10.69
Minnesota 10.67 10.71
Mississippi 9.81 8.78
Missouri 10.91 9.83
Montana 11.19 9.9
Nebraska 10.53b 8.88
Nevada 13.59 13.67
New Hampshire 14.63 13.12
New Jersey 14.31 13.88
New Mexico 9.71 9.4

52
New York 12.86 12.57
North Carolina 10.17a 8.19
North Dakota 10.92 11.85
Ohio 11.01 10.33
Oklahoma 10.89 10.22
Oregon 12.92 11.68
Pennsylvania 12.87a 11.34
Rhode Island 13.21 13.23
South Carolina 9.63 8.87
South Dakota 9.29 10.38
(table continues)

53
State 12-17 12-17
(2013-2014) (2014-2015)
Tennessee 9.35 8.17
Texas 10.81 9.96
Utah 6.76b 5.44
Vermont 13.76 13.16
Virginia 11.2 10.65
Washington 10.44 10.65
West Virginia 9.67 9.97
Wisconsin 14.02a 11.25
Wyoming 10.6 10.72
Note. From: (SAMHSA, 2015).
Conceptual Definitions
The following terms are used operationally in this study:

54
Mental illnesses: While mental illness assumes different meanings in different
scenarios, the term is operationally defined as a serious mental illness in the past year,
any mental illness in the past year, serious thoughts of suicide in the past year, and a
major depressive episode in the past year.
Depression: Long-lasting periods of time with endless bad mood, feelings of
hopelessness, and a lack of satisfaction (Mutrie, 2000).
Adolescents: Young people aged 12 to 17 years.
Substance abuse: When used in some areas, this term is operationally defined to
mean the use and abuse of alcohol and marijuana.
Nonmedical and illicit substances: These terms are operationally defined to
include the illegal drugs such as methamphetamines.
Assumptions and Limitations
The hypothesized association between the two variables may be hindered by other
confounding variables that may not be analyzed in this study because of the nature of the
dataset available. This is also a trend in the existing literature where other factors such a
gender, socioeconomic status, and other similar variables have not been explored for an
influencing role in the relationship between the dependent and independent variable.

55
Scope and Delimitations
The study will be narrowed to include only American children ages 12 to 17 years
participating in studies published in credible journals within the last 17 years.
Significance of the Study
The study is significant because it advances the knowledge in an area of concern
for public health, and where evidence-based solutions are required to remedy the
prevailing trends. National Alliance on Mental Illness (n.d.) reported that 20% of the
adolescents in the age bracket of between 13 years and 18 years have one at least one
form of mental illness. Mood disorders are present among 11% of the youth in the same
age group. Another 8% of the adolescents in the same age bracket are diagnosed with an
anxiety disorder (National Alliance on Mental Illness, n.d.).
When considered in the context of the fact that suicide is ranked third on the list
of the causes of mortalities for the people in this population, it is important to explore the
influence of substance abuse as a contributing factor, especially because disorders related
to substance abuse have been found to be comorbid, and that a linear relationship has
been reported by numerous researchers. The findings are significant because they will
contribute to the existing knowledge, particularly from a dataset that reflects a national
outlook.
The study will also fill the existing gap of a lack of comprehensive knowledge on
the comparison between state-level statistics on incidence and prevalence with the

56
national levels to identify the regions where the two problems exceed the national
averages. This information will help underscore the need for more efforts in these
regions. This contribution in knowledge will also help highlight the importance of state-
level data in evaluating the progress made through the various programs aimed at
reducing the prevalence of the drug issues and the comorbid conditions.
Implications for Social Change
The findings of this study are of significance to social change. Social change in
this instance relates to the reduction of the incidence and prevalence of both substances
abuse as well as mental illnesses in the adolescent population. Any interventions aimed at
achieving this feat should be informed by an understanding of whether there is an
association between the two variables. This is important because it will inform the
decisions to create individual interventions or whether to address the two issues together.
The implications for social change stemming from the proposed study are both
direct and indirect. From an indirect perspective, a finding of an association between the
two variables would be a basis for inquiries exploring the possibility of a causality
relationship between the variables. Even without further inquiry, a finding of a linear
relationship between the two variables would mean that any interventions aiming at
reducing the incidence and prevalence of mental illnesses among the adolescent
population in the United States should also incorporate aspects aimed at addressing
substance abuse as an associated factor.

57
Summary
It has been demonstrated through the literature reviewed that the prevalence of
substance abuse and that of mental illnesses among the adolescent generation is
undesirably high. It has also been demonstrated that the two conditions are comorbid with
many of the youth who have one of the disorders likely to have the other at the time or in
the future. The societal and health impacts of the disorders are significant, and a
justification for any interventions aimed at reducing the prevalence. The reviewed
literature has also shown that an association exists between the two variables. The
expectancy theory adduced earlier helped explain why the association might exist
between the two variables. Even though this finding has been challenged in other studies,
the number of studies that have reported an association and the fact that there are many
confounding variables and issues with sample and sample size warrants further inquiry
into the association between the variables. As shown above, the matter is of significance,
and it has implications for social change.
58
Section 2: Research Design and Data Collection
Introduction
This section details the methods that were used in answering the research
questions. Among others, the section includes the research design and its justification, the
study population, research questions, and the hypotheses, the data methods, data analysis
plan, and the ethical considerations I made as the researcher.
Research Design and Rationale
The research design was quantitative with the research method as a collection of
secondary research data. The regression data analysis was conducted using the Statistical
Package for Social Sciences. The implications for social change are to contribute and
promote research into the dynamic between marijuana and alcohol use and the occurrence
of mental illnesses among the adolescents aged between 12 to 17 years. The research
study was centered on quantitative research to understand the association between
substance use and mental illnesses among youth in the United States.
Research Questions and Hypothesis
1. What is the association between the use and abuse of alcohol and marijuana
and mental illnesses among the youth aged between 12 and 17 years in the
United States?
2. What is the difference between the use and abuse of alcohol and marijuana
and mental illnesses at the state level and at the national level?

59
H01: There is no statistically significant association between the use and abuse of. alcohol
and marijuana and mental illnesses among the youth aged between 12 and 17
years in the United States
Ha1: There is a statistically significant association between the use and abuse of alcohol
and marijuana and mental illnesses among the youth aged between 12 and 17
years in the United States.
H02: There is no statistically significant difference between state-level data and the
national averages on the use and abuse of alcohol and marijuana and on mental
illnesses among the youth aged between 12 and 17 years in the United States.
Ha2: There is a statistically significant difference between state-level data and the
national averages on the use and abuse of alcohol and marijuana on mental
illnesses among the youth aged between 12 and 17 years in the United States.
Study Population
The study population included American adolescents aged 12 to 17. The youth
were sampled through a national survey that drew participants from 50 states as well as
the District of Columbia.
Data Methods
The inquiry was quantitative in nature and used secondary data. The dataset was
used to evaluate the association between substance abuse and mental illness among youth
in the United States. After the verification of the entries in Microsoft Excel, I created a

60
data analysis platform on the Statistical Software for Social Sciences, the software that
was employed in the manipulation of data. This was done by coding the entries into the
entry as a prerequisite for the entry of the data from the individual states, and for each of
the proxies used to measure both the dependent and independent variable. The final data
analysis platform was also inspected for missing figures and to ensure that all the coding
and entry of the values from the individual states and for all proxies that are used to
measure the dependent and independent variable.
Variables
The independent variable used was the use and abuse of alcohol and marijuana
while the dependent variable was mental illnesses. The covariate variable is the age
groups into which the subjects are categorized. While there are other covariate variables
affecting the hypothesized association, there were limitations in the number of variables
measured in the national database, a fact that has been noted as one of the limitations of
the study.
Data Analysis Plan
As highlighted earlier, the manipulation of data was done using both Microsoft
Excel and the Statistical Package for Social Sciences. Microsoft Excel was used in the
cleaning and verification of the data while the actual manipulation of the data was done
on the platform created in the Statistical Package for Social Sciences. The analysis used
both descriptive and inferential statistics. Measures of central tendency were employed to
describe the prevalence rate of the dependent and independent variables using data from

61
the proxies used to measure them. Some of the measures of central tendency that I
employed included mean and standard deviation. The means for each of the proxies were
compared at the state level using the t-test to determine whether any differences in
prevalence and incidence rate where applicable are statistically significant.
The association between the variables was measured using multiple regression
tests. Of note is the fact that the dependent variable was measured using four proxies. It
was important for me to determine the proportion of the changes in each of the four
proxies of the dependent variable that is attributable to the different proxies of the
independent variable. To enable the determination, each of the proxies for mental
illnesses was included as the dependent variable in a multiple regression test where all the
proxies for the independent variable were included in the model. This was done for each
of the proxies of the dependent variable to ensure that the influence of the independent
variables on the individual proxies of the dependent variable is determined empirically.
Threats to Validity
Brown (2006) present five criteria to determine the validity of a literature review:
(a) purpose, (b) scope, (c) authority, (d) audience, and (e) format. These criteria were
used to ensure the validity of this study. However, the considerations for internal and
external validity were not limited to the literature review section. The consideration of the
threats to validity also consider the research methods employed in the study. One of the
considerations that were implemented to ensure the external validity of the proposed
study is choosing a database that features high-quality data. According to Koziol and

62
Arthur (2011), studies that are sponsored by either the national or federal governments
through its agencies are more likely to include large sample sizes because of the
availability of resources such as human, time, and financial.
The effect of the large sample sizes in such studies is that the samples are more
representative of the population that is targeted in the study when compared to privately
funded studies. The increased representativeness enhances the external validity of the
study and the data used (Koziol & Arthur, 2011). It was for this reason that a choice was
made to use the database maintained by SAMHSA. The data contained in this database
paint both a state-level and national-level picture of the prevalence of use and abuse of
marijuana and alcohol, the two drugs included as independent variables for the targeted
group. The internal validity was addressed by controlling the covariate variables that
might influence the findings of the proposed study.
Ethical Considerations
Considering that the inquiry used secondary data collected from participants all
over the country and aggregated at the state level, informed consent or the consideration
for the confidentiality of the human subjects from whom the data were collected was not
necessary. Nonetheless, I had the responsibility as the researcher to ensure that ethical
practices were entrenched in the research processes. Firstly, I sought the written
permission of SAMHSA to use the data collected in their database for the purposes of the
inquiry. I also complied with the requests and demands made by SAMHSA as a
prerequisite for the permission to use the secondary data. Secondly, I sought the approval

63
of the Institutional Review Board of Walden University on the proposal and the use of
secondary data for the research exercise.
Summary
The inquiry and the research questions, objectives, and hypotheses will be
addressed using quantitative methods and secondary data. The data are contained in a
database that was developed following a national survey performed by SAMHSA. The
study population is the American youth, particularly, adolescents aged between 12 and 17
years. The association between variables will be determined by performing multiple
regressions on the dataset. The regression test enabled me to determine the correlation
coefficient and the direction and magnitude of any linear relationship between the
variables.

64
Section 3: Presentation of the Results and Findings
Results
Marijuana Use in the Past Month
One of the proxies that were used to measure the use and abuse of marijuana was
the use of the drug in the past month. The prevalence rate at the national level for the use
of the drug in the past month averaged 7.20% with a range of between 6.86% and 7.56%.
The average prevalence rate for this proxy for 29 states was lower than the national
average as shown in Table 3. The state with the lowest prevalence for adolescents using
marijuana in the past month was Utah at an average of 4.54% and a range of 3.43% to
5.99%. The states in which the average prevalence rate was lower than the national
average of 7.20% included Utah, Alabama, Nebraska, Mississippi, Iowa, Louisiana,
Oklahoma, Virginia, Tennessee, North Carolina, Ohio, West Virginia, Hawaii, North
Dakota, Minnesota, Kentucky, South Dakota, Kansas, Arkansas, Idaho, Illinois, Missouri,
South Carolina, Wyoming, Florida, New Jersey, Texas, Georgia, and Pennsylvania in an
ascending order. The state averages and ranges can be found in Table A1.

65
Table 3
Summary of the Descriptive Statistics
Proxy National
Prevalence
/Incidence
rate
Highest
Prevalence/Incidence
rate
Lowest Prevalence/
Incidence rate
State Rate State Rate
Marijuana use in
the past month
7.20% Utah 4.54% Colorado 11.13%
The first use of
marijuana
5.41% Utah 3.05% District of
Columbia
8.26%
Alcohol use in the
past month
10.58% Utah 5.44% New Jersey 13.88%
Alcohol use
disorder in the past
year
2.62% North
Carolina
2.08% New Jersey 3.24%
Alcohol
dependence in the
past year
0.95% Maryland
and
Tennessee
0.79% New
Mexico
1.23%
Major depressive
episode in the past
year
11.93% Hawaii 9.87% Indiana 14.64%
There were other states in which the average prevalence of marijuana use in the
past month by the adolescents was higher than the national average of 7.20%. There were
22 of these states namely Nevada, Delaware, New York, Wisconsin, Arizona, Michigan,
Indiana, California, Connecticut, New Mexico, Montana, District of Columbia,
Washington, Maryland, Massachusetts, Oregon, New Hampshire, Maine, Rhode Island,
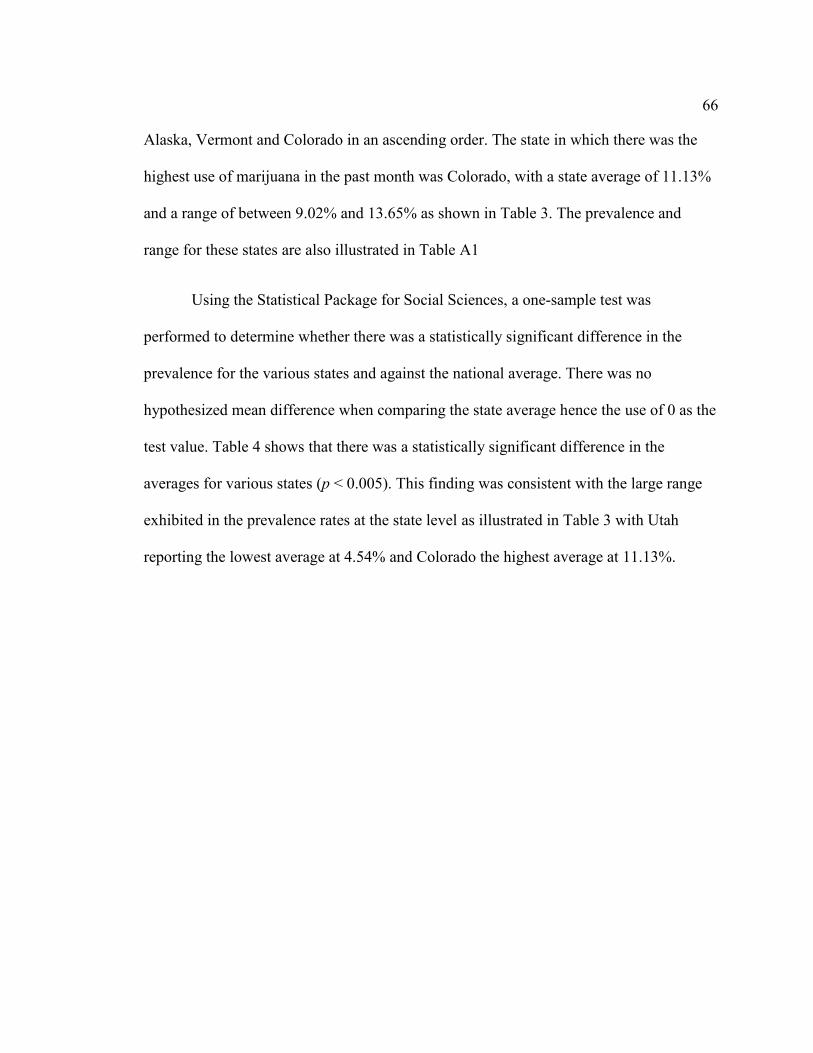
66
Alaska, Vermont and Colorado in an ascending order. The state in which there was the
highest use of marijuana in the past month was Colorado, with a state average of 11.13%
and a range of between 9.02% and 13.65% as shown in Table 3. The prevalence and
range for these states are also illustrated in Table A1
Using the Statistical Package for Social Sciences, a one-sample test was
performed to determine whether there was a statistically significant difference in the
prevalence for the various states and against the national average. There was no
hypothesized mean difference when comparing the state average hence the use of 0 as the
test value. Table 4 shows that there was a statistically significant difference in the
averages for various states (p < 0.005). This finding was consistent with the large range
exhibited in the prevalence rates at the state level as illustrated in Table 3 with Utah
reporting the lowest average at 4.54% and Colorado the highest average at 11.13%.

67
Table 4
Summary of the Outputs for the One-Sample t-Test
One test sample for various
states
One test sample against
national
prevalence/incidence rate
t df p-value t df p-value
Marijuana use in the past
month 32.248 51 .000 .492 51 .625
First use of marijuana 37.358 51 .000 -1.184 51 .242
Alcohol use in the past
month 46.267 51 .000 .419 51 .677
Alcohol use disorder in the
past year 63.218 51 .000 -.313 51 .756
Alcohol dependence in the
past year 68.977 51 .000 -1.972 51 .054
Major depressive episode
in the past year 76.269 51 .000 .250 51 .803
When a one-sample test was performed to compare the national prevalence rate
with the average of the prevalence rate of various states using the national average as the
test value as shown in Table 4, a p-value of .625 showed that the state averages do not
vary significantly from the national average.
First Use of Marijuana
While the previous proxy focused on the prevalence rate for the use of marijuana
in the past month, this proxy explored the incidence rate of the drug. The incidence rate at

68
the national level was 5.41% with a range of between 5.17% and 5.65% as shown in
Table 3. Utah also reported the lowest incidence rate of marijuana use at 3.05% with a
range of between 2.41% and 3.86%. Twenty-three states had an incidence rate that was
lower than the national average of 5.41%. The list of these states is presented in Table
A4. The incidence rate for the use of marijuana in 28 states was higher than the national
average of 5.41% as reported in Table A4.
In similar fashion with the previous proxy, a one-sample test did not show a
statistically significant difference between the incidence rate at the national level and the
average incidence rate for all the states (p > 0.242) as shown in Table 4. However, the
range of the incidence rates at the state level showed the extent to which this finding can
be relied upon when comparing state-level and national-level data.
A one-sample test of the state level incidence rate showed that the incidence rate
for marijuana use among the adolescents varied significantly from one state to another (p
< 0.05) as shown in Table 4. The finding of a statistical significance in the variance in the
first use of marijuana at the state level as shown in Table 4 was vindicated considering
the wide range given by the lowest incidence rate reported in Utah at 3.05% and the
highest incidence rate in District of Columbia at 8.26% as shown in Table 3.
Alcohol Use in the Past Month
In addition to marijuana, alcohol is the other drug on which the current study
focused. One of the proxies used to measure this drug was its use in the past month. It

69
was worth noting that in similar fashion with the two previous proxies for marijuana use,
Utah also had the lowest prevalence for the use of alcohol in the past month for the
population targeted in the study at a rate of 5.44% and a range of 2.98% and 7.40%. The
highest prevalence for the use of the drug in the past month by the adolescents was in
New Jersey were an average of 13.88% of the adolescents in the state consumed the drug
in the past month with a range of between 11.77% and 16.29% as illustrated in Table 3.
The national prevalence rate for the use of alcohol in the past month was 10.58% with a
range of between 10.15% and 11.02%. The number of states for which their prevalence
rate was higher than the national average was 25 as shown in Table A7. Another 26 states
reported a prevalence rate that was lower than the national average as illustrated in Table
A7.
A one-sample test comparing the difference in the state level prevalence showed
that there was a statistically significant variation in the means (p < 0.05) as shown in
Table 4. This finding was vindicated by the finding of a large range between the lowest
prevalence in Utah at 5.44% and the highest prevalence for the use of the drug in the past
month on New Jersey at 13.88% as shown in Table 3. When the one-sample test for the
state data was performed with the national average used at the test value was performed,
the outcome showed that the average of the prevalence for the states did not differ
significantly from the national average (p > 0.05) as shown in Table 4.

70
Alcohol Use Disorder in the Past Year
It is likely that the sustained use of alcohol can lead to the development of alcohol
use disorders. It is for this reason that this proxy was introduced to help assess the
occurrence of the alcohol use disorders among the adolescent population in the past year.
Evidently, these disorders occurred in an average of 2.62% of the adolescent population
nationally. However, there was a range of between 2.40% and 2.85% as illustrated in
Table A10.
For the first time, Utah did not report the lowest prevalence rate for the proxies
reported in this study. In its place, North Carolina reported the lowest prevalence rate of
youths reporting with an alcohol use disorder in the past year with a rate of 2.08% and a
range of between 1.53% and 2.82%. The state in which the highest prevalence was
reported was in New Jersey with a prevalence rate of 3.24% and a range of between
2.38% and 4.41% as illustrated in Table 3. The prevalence rate in 28 states was lower
than the national average of 2.62% while 23 states reported a prevalence rate that was
higher than the national average as shown in Table 3.
A one-sample test for the occurrence of alcohol use disorders showed that the
prevalence rates for the various states with regards to the occurrence of alcohol use
disorders in the past year differed in a statistically significant manner (p < 0.05) as shown
in Table 4. When the average prevalence for the various states was compared with the
national average in a one-sample test using the national average as the test value showed

71
that the state averages did not vary in a statistically significant manner from the national
averages as shown in Table 4.
Alcohol Dependence in the Past Year
The occurrence of alcohol dependence in people might precipitate the
development of alcohol dependence. This proxy was used to help assess the prevalence of
alcohol dependence in the year preceding the study. As shown in Table 3, the national
prevalence rate for the adolescent population was 0.95%. The states in which the lowest
prevalence was reported were Maryland and Tennessee with the rates at 0.79% as shown
in Table 3. The highest prevalence rate for this proxy was reported in New Mexico where
the rate was at 1.23%. The prevalence rate in 31 states was lower than the national
average of 0.95%. The prevalence rate in five states equalled the national average of
0.95% while the prevalence rate in 16 states was higher than the national average of
0.95%.
A one-sample test comparing the state averages showed that there was a
significant variation in the individual prevalence rates as shown in Table 3. Again, this
finding was vindicated by the range of 0.79% for the lowest prevalence rate and 1.23%
for the highest prevalence rate. A one-sample test in which the average of the prevalence
rates for the states was compared with the national average that was used as the test value
showed that the state averages did not differ significantly with the national average (p =
0.05) as shown in Table 4.

72
Major Depressive Episode in the Past Year
One of the hypotheses in the study was the occurrence of mental illnesses among
the adolescents in the United States was associated with the use and abuse of marijuana
and alcohol. This proxy was used to measure the prevalence of mental illnesses in the
study population. Table 3 shows that the national prevalence rate was 11.93% with a
range of between 11.48% and 12.40%. The state in which the lowest prevalence rate was
reported was Hawaii in which the rate was 9.87% and a range of between 7.95% and
12.17%. The highest prevalence rate was reported in Indiana where the rate was 14.64%
and a range of between 12.29% and 17.34%. The prevalence rates in 24 states were
higher than the national average while the prevalence rates in 27 states were lower than
the national average.
A one-sample test comparing the prevalence rate of major depressive episodes for
adolescents in the United States showed that the prevalence rates varied from one state to
another in a statistically significant manner (p < 0.05) as shown in Table 4. When a one-
sample test was performed with the national average as the test value, the findings
reported in Table 4 showed that in keeping with previous trends, the average of the state
level prevalence rates does not vary in a statistically significant manner from the national
average (p > 0.05).

73
Association Between Alcohol and Marijuana Use and Mental Illness Among
American Adolescents
The study aimed to determine whether there was an association between the use
and abuse of marijuana and alcohol and the occurrence of the mental illnesses in the
American adolescents. Table 5 shows the results of the Pearson correlation function to
show whether there is a linear relationship between the proxies for the independent
variable and dependent variable. The coefficient for the correlation between marijuana
use in the past month and major depressive episode in the past year is 0.323. Although
this is a weak positive correlation, a p-value of 0.01 shows that it is statistically
significant as shown in Table 5. The coefficient for the correlation between the first use
of marijuana and major depressive episode in the past year is 0.298 as shown in Table 5.
While this also points to a weak positive relationship between the two variables, a p-
value of 0.016 shows that the association of statistical significance.

74
Table 5
Correlation Coefficients for Dependent and Independent Variable
Proxies Correlation
Coefficient
P-value
Marijuana use in the past month 0.323 0.010
First use of marijuana 0.298 0.016
Alcohol use in the past month 0.176 0.105
Alcohol use disorder in the past
year
0.398 0.002
Alcohol dependence in the past year 0.413 0.001
The Pearson correlation coefficient for the association between alcohol use in the
past month and the occurrence of a major depressive episode in the past year was 0.176
as shown in Table 5. This was another indicator of a weak but positive linear relationship
between the two variables. However, a p-value of 0.105 shows that the weak but positive
linear relationship noted between the two variables is not statistically significant. A
correlation test was also performed between alcohol use disorder in the past year and the
occurrence of a major depressive episode in the past year. The linear relationship for the
two variables was also weak and in the positive direction as evidenced by a correlation
coefficient of 0.398. However, the linear relationship was statistically significant as
shown by a p-value of 0.002 as shown in Table 5. Finally, a Pearson correlation test for
the linear relationship between alcohol dependence in the past year and the occurrence of
a major depressive episode in the past year yielded a correlation coefficient of 0.413, a

75
positive and weak linear relationship that was statistically significant as evidenced by a p-
value of 0.001 as shown in Table 5.
In addition to the Pearson correlation test, a multiple regression test was
performed to help determine the influence of the different independent variables on
variation that was noted in the occurrence of mental illnesses in the American adolescent
population.
Table 6 shows that an R Square value of 0.242. This value shows that our
predictor model which includes constants such as alcohol dependence in the past year,
alcohol use in the past month, first use of marijuana, alcohol use disorder in the past year,
and marijuana use in the past month explains 24.2% of the variation that is seen in the
occurrence of major depressive episodes in the past year in the American adolescent
population. From the perspective of this study, the finding of an R Square means that
marijuana and alcohol use and abuse have a significant influence on the occurrence of
mental illnesses or episodes of depression among the adolescent population in the United
States. With the Durbin-Watson value at 1.703, it is a healthy assumption that first order
linear auto-correlations are nonexistent in the multiple regression performed in this study.

76
Table 6
Model Summary From the Multiple Regression Test
Model Summaryb
Model R
R
Square
Adjust
ed R
Square
Std.
Error of the
Estimate
Change Statistics
Durbi
n-
Watso
n
R
Squar
e
Chan
ge
F
Chang
e
d
f1
d
f2
Sig. F
Chan
ge
1 492a 242 160
.0103736114
091 .242 2.939 5 6 022 1.703
An F-test was performed together with the multiple regression to test whether the
model which included the use of abuse of alcohol and marijuana as the independent
variables as explained by the five proxies explained any statistically significant variance
in the occurrence of mental illnesses in the adolescent population.
Table 7 shows the ANOVA results for the for the multiple regression test. The
regression model hypothesized that the marijuana and alcohol abuse have a measurable
and statistically significant effect on mental illnesses among the American adolescent
population. The p-value of 0.002 shows that the hypothesis, that marijuana, and alcohol
use and abuse significantly affect their mental health was correct. The null hypothesis
that marijuana and alcohol use and abuse have no statistically significant influence on
mental illnesses in the American adolescence is rejected (p < 0.05). This means that the
two independent variables have a statistically significant influence on the occurrence of

77
mental illnesses. While there were two independent variables in the proposed study, there
were five proxies used to measure the two variables. The multiple regression allows one
to calculate the coefficients that predict the effect of each individual proxy on the
dependent variable.
Table 7
ANOVA Results From the F-Test
ANOVAa
Model Sum of Squares df Mean Square F Sig.
1 Regression .002 5 .000 2.939 .022b
Residual .005 46 .000
Total .007 51
Table 8 shows coefficients for the various proxies. From this table, one can
deduce that Predicted (Major depressive episode in the past year) = 0.073(Marijuana use
in the past month) + 0.178(First use of marijuana) – 0.117(Alcohol use in the past month)
+ 0.861(Alcohol use disorder in the past year) + 2.749(Alcohol dependence in the past
year). The coefficients of this mode can be used to determine the predicted effect of use
and abuse of alcohol and marijuana on the occurrence of mental illnesses among the
adolescent population in the United States.

78
Table 8
Effect Coefficients for the Proxies of the Independent Variables
Coefficientsa
Model
Unstandardized
Coefficients
Standardized
Coefficients
t Sig.
95.0%
Confidence
Interval for B
B
Std.
Error Beta
Lower
Bound
Upper
Bound
1 (Constant) .069 .016 .241 000 036 .102
Marijuana use in the
past month .073 .184 .106 398 692 .297 .444
First use of
marijuana .178 .273 .170 652 518 .372 .728
Alcohol use in the
past month .117 .133 -.171 .876 386 .384 .151
Alcohol use
disorder in the past
year
.861 .785 .226 .098 278 -.718 2.441
Alcohol dependence
in the past year .749 .024 .236 .358 181 -1.326 6.824

79
Section 4: Application to Professional Practice and Implications for Social Change
Preamble
In addition to identifying the association between substance abuse with specific
regard to marijuana and alcohol use among the American adolescent population, my
intention with this study was also to explore differences between the state-level
prevalence and the averages reported nationally to determine whether there was a
statistically significant difference. One of the practices identified in the problem
statement was that the reporting format commonly used involves reporting prevalence
and incidence rates using national level data. This is more the case when the data are
collected and published by federal agencies. It was highlighted in the problem statement
that this is the format that is used by Youth.gov (n.d.) when reporting on statistics relating
to the use and abuse of drugs and other substances and the comorbidity of mental
illnesses. This kind of reporting is in line with the mandate of such agencies to reduce the
incidence and prevalence rates.
However, such reporting might give the appearance that the problem in question
is in control in all the states if the national prevalence rate is favourable. While this
practice is appropriate for federal agencies, state-level agencies aiming to achieve a
reduced incidence and prevalence of alcohol and marijuana abuse and comorbidity of
mental illnesses should compare state-level data with the national level data to determine
the effectiveness of the strategies being implemented at the local level. This chapter will
highlight the findings of the study with regards to this practice and aspect and make

80
recommendations for best practices. Additionally, the chapter includes a discussion of the
findings with regards to the presence or absence of a linear association between the use
and abuse of marijuana and alcohol and mental illnesses among the adolescent
population.
Trends in the State-Level and National-Level Data
The database used in this study provided data on the prevalence or incidence rate
of the various proxies for all the states and District of Columbia and the average
prevalence rate at the national level. Two trends were emergent when the data were
analyzed further. One of the trends was that there was no statistically significant
difference when the prevalence or incidence rate at the state level was aggregated for
individual proxies and compared with the national average. As shown in Table 4 when
the averages for all the states were compared with the national average for the prevalence
rate for the use of marijuana in the past month, the mean difference was .0011152678462
or 0.1%, a difference that was not statically significant (p = 0.0625). The same finding
was reported in Table 4 where a comparison of the average incidence rate of the first use
of marijuana for all the states and the national average yielded a mean difference of -
.0017780304231 or -0.2%, a difference that was not statistically significant (0.242). This
is the trend that was noted for all the proxies for the independent and dependent variable
as reported in the various output tables presented in the previous chapter.
This trend can be attributed to certain factors in the data collection process by the
SAMHSA. Considering that the data were collected by SAMHSA in the same household

81
survey using similar methodologies, it is expected that there will be no statistically
significant difference between the national level data and the average of the state data for
the same proxy. This is a testament to the reliability of the data collection methods that
SAMHSA used during the household survey. Performing this comparison to yield
information for professional practice is myopic because it gives an impression that what
is reflected in the national average is congruent to the situation in the individual states.
Another trend that was emergent from the analysis of the data is that there were
states in which the prevalence or incidence rate for the various states was above the
national average while the prevalence and incidence rate for the same proxy in other
states were below the national average. This is an important finding for a public health
officer at the state level because it gives an overview of the effectiveness of the overall
interventions implemented at the state level to combat drug use and abuse and the
comorbidity of mental illnesses. For instance, states such as Utah, Alabama, Nebraska,
Mississippi, Iowa, Louisiana, Oklahoma, Virginia, Tennessee, North Carolina, Ohio,
West Virginia, Hawaii, North Dakota, Minnesota, Kentucky, South Dakota, Kansas,
Arkansas, Idaho, Illinois, Missouri, South Carolina, Wyoming, Florida, New Jersey,
Texas, Georgia, and Pennsylvania had a lower than average use of marijuana in the past
month compared to states such as Nevada, Delaware, New York, Wisconsin, Arizona,
Michigan, Indiana, California, Connecticut, New Mexico, Montana, District of Columbia,
Washington, Maryland, Massachusetts, Oregon, New Hampshire, Maine, Rhode Island,

82
Alaska, Vermont and Colorado in which the prevalence rate of the use of marijuana in the
past month was higher than the national average as shown in Table A1.
The states in which the incidence or prevalence rate for various proxies are higher
than the national averages should be of more focus from the state agencies. This is
because a prevalence or incidence rate that is higher than the national average shows that
if there are interventions in the state aimed at reducing the behaviour that the proxies
measure, the interventions do not have the desired effect. The reasons for which the
prevalence rates are higher than the national averages should be investigated to inform
any reforms in the interventions in place or a change of approach.
That the prevalence rate or incidence rate for some proxies in some states were
higher than the national averages vindicated the highlight in the problem statement that
the current reporting format obscures the actual picture of the problem at the state level
when the studies are performed or sponsored by federal agencies. This argument is
supported by the fact that the analysis of the data found that the prevalence and incidence
rates for all the proxies differed in a statistically significant manner from one state to
another. This finding indicated that while national-level data are important in showing the
progress the country has made in reducing the use and abuse of alcohol and marijuana
among the adolescent population as well as the comorbidity of mental illnesses, even
focus should be on the state level data because it is from this foundation that the national
averages are drawn.

83
Association Between Substance Abuse and Mental Illness
Another aim of the study was to determine whether an association existed
between the use and abuse of marijuana and alcohol and the comorbidity of mental
illnesses. The data on the proxies for alcohol use and the occurrence of mental illnesses
were analyzed to yield the Pearson correlation coefficient. With regards to alcohol use in
the past month as a proxy, the correlation coefficient was 0.176 (p-value = .105). The
correlation coefficients for alcohol use disorder in the past year and alcohol dependence
in the past year with the occurrence of mental illnesses were 0.398 (p-value = .002) and
0.413 (p-value = .001) respectively. These coefficients showed that a positive but weak
linear relationship occurs between the use and abuse of alcohol and mental illnesses. The
implication of this linear relationship is that the continued use and abuse of alcohol
among the adolescents increased the likelihood of developing mental illnesses,
particularly depression. This finding is supported by other studies such as the study
performed by Tembo, Burns, and Kalembo (2017).
This is a relationship that has been found and described in other studies. Although
Tembo et al. (2017) used a study sample of adolescents aged between 18 years and 24
years, their findings that the consumption of high levels of alcohol increased the
likelihood of developing psychological distress by a factor of 1.2 (OR 1.2, 95% CI: 1.1–
1.5) is still significant for this study. Studies performed on the adolescent population have
shown the likelihood of developing mental illnesses increases when the adolescents
engage in the consumption of alcohol (Degenhardt, Swift & Slade, 2012). Degenhardt et

84
al. (2012), in their study of adolescents in Australia, concluded that adolescents who used
and abused alcohol increase their risk of developing risky drinking behaviours; the
dependence on alcohol; and other mental illnesses such as depressive disorders and
anxiety.
The association between the use and abuse of marijuana was measured using two
proxies. The correlation coefficient for the relationship between the use of marijuana in
the past month and the occurrence of major depressive episodes in the past year was
0.323 (p-value = .010) while the correlation coefficient for the relationship between the
first use of marijuana and the occurrence of major depressive episodes in the past year
was 0.298 (p-value = .016). The correlation coefficients showed that the relationship
between the two proxies of the independent variable and the dependent variable was
weak and of the positive direction. However, the p-values of the relationship between the
two proxies of the independent variable and the proxy for the dependent variable as
shown in Table 5 were statistically significant.
This relationship has also been found and described in other studies. For instance,
Paruk and Burns (2014) found that when adolescents were initiated into the use and abuse
of marijuana at an early age, they were predisposed to the development of mental
disorders such as psychosis. This finding was also supported by the study performed by
Chen, Wagner, and Anthony (2002), who found a moderate association between the risk
of developing a major depressive episode and the use of marijuana. This finding was also
reported more recently by Bechtold, Pardini, Simpson, and White (2015), who found that

85
the use of marijuana by adolescents was associated with the occurrence of mental
problems.
With regards to the association between the two variables, Canadian Center on
Substance Abuse (2013) highlighted the commonality of both protective and risk factors
for mental illnesses and the use and abuse of drugs among the adolescents, the fact that
adolescents who are diagnosed with mental illnesses are more likely to engage in the use
and abuse of drugs later in their lives, and the fact that the use and abuse of drugs can
also cause the development of mental illnesses.
Implications for Social Change and Practice
The findings of the study have not only implications for social change but also
professional and scholarly practice. The study revealed a statistically significant
association between alcohol use and the occurrence of mental illnesses in the adolescent
population in the United States. However, this finding did not account for the association
between different levels of alcohol intake and the occurrence of mental illnesses. Future
studies should incorporate designs that assess the different levels of alcohol intake in the
adolescents to determine whether the presence and statistical significance of the
association between alcohol intake and the occurrence of mental illnesses in the
adolescent population vary with the amount of alcohol consumed.
There are many confounding factors for which the present study was not
controlled due to the limitations in the nature of the data used. The fact that the data used

86
were not specifically collected for the study implied that there are variables that would be
desirable for which data were not available. In the case of this study, such variables
include gender, socioeconomic status, education, and race. The fact that data on these
variables were not available means that their effect could not be controlled or quantified
in the study. Consequently, federal agencies tasked with performing these household
surveys should consider and collect data for other confounding variables that might affect
the findings for the variables of interest in their surveys.
The findings confirmed the concern that the reporting format used by federal
agencies reporting data on prevalence and incidence rate from national surveys at
national levels obscures the gravity of the situation at the state and lower levels,
especially if the national prevalence is favourable. The finding that some states reported
higher incidence and prevalence rate for certain proxies that were higher than the
reported national levels vindicates this concern. In this regard, it is recommended for a
change in reporting practices to include a comparison between the averages for various
states and the reported national average. Assuming a confluence of factors enabling the
states where their averages are higher the national prevalence implement interventions to
lower the prevalence rates in their jurisdictions, the resulting sustained effort will result in
an overall reduction in the prevalence of the problem at both the state and national level.
Public health agencies tasked with dealing with either mental illnesses or drug
abuse among the adolescent population and other cohorts to consider the comorbidity
dimension when designing interventions or assessing prevalence and incidence in

87
population surveys. This recommendation is justified by the finding of a statistically
significant association between the use and abuse of alcohol and marijuana through
proxies such as marijuana use in the past month (p = 0.01), first use of marijuana (p =
0.016), alcohol use disorder in the past year (p = 0.002), alcohol dependence in the past
year (p = 0.001), and the occurrence of mental illnesses.
The findings of the study are significant for practice. However, there is a need to
consider some of the limitations to the study. The hypothesized association between the
two variables may be hindered by other confounding variables that may not be analyzed
in this study because of the nature of the dataset available. This is also a trend in the
existing literature where other factors such a gender, socio-economic status, and other
similar variables have not been explored for an influencing role in the relationship
between the dependent and independent variable. Another limitation of the study is that
the national averages might have been drawn from an aggregation of the state level data,
a fact that would render any comparison between the two averages moot. However, the
finding that the averages in some states were higher than the reported national average
still gives credence to the comparison.
Conclusions
This study was necessitated by the fact that despite the many interventions
designed and implemented, the prevalence and incidence of use and abuse of drugs
remained high. Furthermore, the comorbidity between drug use and the occurrence of
mental illnesses amongst the adolescent population had been noted and reported in many

88
studies such as those performed by the National Institute on Drug Abuse (2010), Langas
et al. (2011), and Wu et al. (2011). The current study focused on marijuana and alcohol as
the two drugs of interest. This decision was based on the statistical evidence that the two
were some of the highest used drugs by the adolescent population. Using six proxies
where three measured the use and abuse of alcohol, two proxies for the use and abuse of
alcohol and one proxy for the dependent variable, the study analyzed secondary data from
the national household survey performed by SAMHSA between 2014 and 2015.
One of the gaps in information identified in the literature as part of the problem to
be resolved in this study was that the reporting format in studies commissioned by federal
agencies reported national-level averages even when such averages were means of the
indicators for different states. The implication of this reporting format is that it might
obscure the extent of a problem at the state level. The study sought to compare the state
level prevalence and incidences with the reported national averages to determine whether
there was a variance of statistical significance. Another gap that was identified as part of
the problem to be resolved in the study was that many of the studies that identified
comorbidity between the use and abuse of alcohol and the occurrence of major depressive
disorders did not benefit from the use of national-level data. Additionally, the data were
relatively dated compared to the recent data in the database used in this study. With the
benefit of recent and national data, the study aimed to determine whether a similar linear
relationship existed between the between the use and abuse of alcohol and the occurrence
of major depressive disorders.

89
This study found that the state level averages did not vary significantly with the
reported national level averages. However, this finding was attributed to the fact that the
prevalence and incidence at the national level were aggregated from the data collected
from various states. Even more significant was the finding that there was a high number
of states for which the incidence and prevalence rate for various proxies was higher than
the rates reported at the national level. The study found that there was a statistically
significant linear relationship between alcohol and marijuana use and abuse. The
marijuana uses in the past month (p = 0.01), first use of marijuana (p = 0.016), alcohol
use disorder in the past year (p = 0.002), alcohol dependence in the past year (p = 0.001)
respectively, are significantly related to the occurrence of mental illnesses in the
adolescent population.
These findings contribute to the existing knowledge on the subject area. They
support the findings by some of the studies such as those performed by Harris and Edlund
(2005), Bickner and Schmidt (2008), Schwinn et al. (2010), and de Dios et al. (2010) that
demonstrated a linear relationship between the use and abuse of alcohol and the
occurrence of major depressive disorders. The findings also contributed to literature by
underscoring the concerns that the reporting format might obscure the extent of the
situation at the lower levels when the data are reported at the national level by studies that
are commissioned and funded by federal agencies. Report your findings in a more direct
manner. Findings from this study showed varied prevalence and incidence rates across
the states. Hence, the need for state-level data when developing public health strategies.

90
The findings of the study have implications for both practice and social change.
With regards to practice, the findings underscore the need for public health officers and
agencies to consider both drug use and abuse and the comorbidity of mental illnesses in
inclusion. The literature review showed that the comorbidity is influenced by a
multiplicity of factors that are found both in the individuals and the environments in
which they live, some of which include the crime rate in the neighbourhoods, parental
and parochial control and socioeconomic status. While the effect of many of these factors
would have been quantified by analyzing data on the confounding variables, the absence
of which was noted in the limitations to the study, the theoretical perspectives argued by
the scholars cited gave plausible explanations. For instance, Low et al. (2012) and
Pedersen et al. (2015) explained that the adolescents used the drugs to attenuate the
effects of the mental issues such as depression and social anxiety.
Further implications for practice relate to the reporting format used by federal
agencies. While using the national level data for public health prevention and control
strategies, is not erroneous, especially because many of the reports also include the
averages for the various states. It is important for public health officers assessing progress
to consider that only looking at the national averages might obscure the full extent of the
problem in some states. With regards to social change, the findings of the study and the
advancement of knowledge will aid in the development of more targeted interventions to
deal with the problem described by the dependent and independent variables used in the
study.

91
References
Agency for Healthcare Research and Quality. (2012). Disparities in health care quality
among racial and ethnic groups: Selected findings from the 2011 National
Healthcare Quality and Disparities Reports. Rockville, MD: U.S. Department of
Health and Human Service.
American Psychiatric Association. (2000). Diagnostic and statistical manual of mental
disorders (4th ed., text rev.). Author.
Barker, P. (1992). Severe depression. London, UK: Chapman & Hall.
Bechtold, J., Pardini, D., Simpson, T. & White, H. (2015). Chronic adolescent marijuana
use as a risk factor for physical and mental health problems in young adult men.
Psychology of Addictive Behaviors, 29(3), 552-563.
Bickner, J. & Schmidt, N. (2008). Marijuana effect expectancies: relations to social
anxiety and marijuana use problems. Addictive Behavior, 33(11), 1477-1483.
Blackwell, D. L. (2010). Family structure and children's health in the United States:
Findings from the National Health Interview Survey, 2001-2007. Washington,
DC: National Center for Health Statistics.
Bose, J., Hedden, S., Lipari, R., & Park-Lee, E. (2016). Key substance use and mental
health indicators in the United States: Results from the 2015 National Survey on
Drug Use and Health. Rockville, MD: Substance Abuse and Mental Health

92
Services Administration.
Bottorff, J., Johnson, J., Moffat, B., & Mulvogue, T. (2009). Relief-oriented use of
marijuana by teens. Substance Abuse Treatment and Prevention Policy, 4,7.
Brook, D., Brook, J., Zhang, C., Cohen, P. & Whiteman, M. (2002). Drug use and the
risk of major depressive disorder, alcohol dependence, and substance use
disorders. Achieves of General Psychiatry, 59(11), 1039-1044.
Brown, R. (2006). Doing your dissertation in business and management (1st ed.).
London, UK: SAGE.
Canadian Center on Substance Abuse. (2013). When mental health and substance abuse
problems collide. Retrieved from
http://www.ccsa.ca/Resource%20Library/CCSA-Mental-Health-and- Substance-
Abuse-2013-en.pdf
Center for Behavioral Health Statistics and Quality. (2015). 2014 National Survey on
Drug Use and Health: Detailed Tables. Rockville, MD: Substance Abuse and
Mental Health Services Administration.
Centers for Disease Control and Prevention. (2014). Youth risk behavior surveillance —
United States, 2013. Morbidity and Mortality Weekly Report, 63(4).
Chen, C., Wagner, F. & Anthony, J. (2002). Marijuana use and the risk of major
depressive episode. Epidemiological evidence from the United States National

93
Comorbidity Survey. Social Psychiatry and Psychiatric Epidemiology, 37(5),
199-206.
Christensen, H., Pallister, E., Smale, S., Hickie, I. B., & Calear, A. L. (2010).
Community-based prevention programs for anxiety and depression in youth: a
systematic review. Journal of Primary Prevention, 31(3), 139-170.
Clark, H., Ringwalt, C., & Shamblen, S. (2011). Predicting adolescent substance use: the
effects of depressed mood and positive expectancies. Addictive Behavior, 36(5),
488-493.
Curan, G., White, R. & Hansell, S. (2000). Personality, environment, and problem drug
use. Journal of Drug Issues, 30, 375-406.
Curwin, J., & Slater, R. (2008). Quantitative methods for business decisions. London,
UK: South-Western Cengage Learning.
de Dios, M., Hagerty, C., Herman, D., Hayaki, J., Anderson, B., Budney, A. & Stein, M.
(2010). General anxiety disorder symptoms, tension reduction, and marijuana use
among young adult females. Journal of Women’s Health, 19(9), 1635-1642.
Deas, D. (2006). Adolescent substance abuse and psychiatric comorbidities. Journal of
Clinical Psychiatry, 67(7), 18-23.
Degenhardt, L., Hall, W. & Linskey, M. (2003). Exploring the association between
cannabis use and depression. Addiction, 98(11), 1493-1504.

94
Degenhardt, L., Swift, W., & Slade, T. (2012). The relationship between alcohol use and
mental disorders from adolescence to young adulthood - longitudinal analyses
from a large Australian cohort study. Retrieved from
https://ndarc.med.unsw.edu.au/project/relationship-between-alcohol-use-and-
mental-disorders-adolescence-young-adulthood
Graham, G. (2010). The disordered mind: An introduction to philosophy of mind and
mental illness. New York, NY: Routledge.
Hanson, M. & Chen, E. (2007). Socioeconomic status and substance use behaviors in
adolescents: The role of family resources versus family social status. Journal of
Health Psychology, 12(1), 32-35.
Harris, K. & Edlund, M. (2005). Self-medication of mental health problems: new
evidence from a national survey. Health Services Research, 40(1), 117-134.
Hughes, A., Lipari, R. & Williams, M. (2015). State Estimates of Adolescent Marijuana
Use and Perceptions Of Risk Of Harm From Marijuana Use: 2013 And 2014.
Retrieved from
https://www.samhsa.gov/data/sites/default/files/report_2121/ShortReport-
2121.html
Humensky, J. (2010). Are adolescents with high socioeconomic status more likely to
engage in alcohol and illicit drug use in early adulthood? Substance Abuse
Treatment, Prevention, and Policy, 5:19 https://doi.org/10.1186/1747-597X-5-19

95
Institute of Medicine Committee on a National Surveillance System for Cardiovascular
and Select Chronic Diseases. (2011). A Nationwide Framework for Surveillance
of Cardiovascular and Chronic Lung Diseases. Washington D.C. National
Academies Press.
Kaminer, Y. & Bukstein, O. (2007). Adolescent Substance Abuse: Psychiatric
Comorbidity and High Risk Behaviors. New York, NY: Haworth Press.
Kaminer, Y., Connor, D. & Curry, J. (2007). Comorbid adolescent substance use and
major depressive disorders: A review. Psychiatry, 4(12), 32-43.
Kessler, R., Berglund, P., Demler, O., Jin, R., Koretz, D., & Merikangas, K. et al. (2003).
The Epidemiology of Major Depressive Disorder. JAMA, 289(23), 3095.
http://dx.doi.org/10.1001/jama.289.23.3095
Kessler, R., Chiu, W., Demler, O., & Walters, E. (2005). Prevalence, Severity, and
Comorbidity of 12-Month DSM-IV Disorders in the National Comorbidity
Survey Replication. Archives of General Psychiatry, 62(6), 617.
http://dx.doi.org/10.1001/archpsyc.62.6.617
Kimberlin, C. & Winterstein, A. (2008). Validity and reliability of measurement
instruments used in research. American Journal of Health-System Pharmacy,
65(23), 2276-2284.
Koziol, N. & Arthur, A. (2011). An Introduction to Secondary Data Analysis. Retrieved

96
from
http://r2ed.unl.edu/presentations/2011/RMS/120911_Koziol/120911_Koziol.pdf
Kulis, S., Marsiglia, F., Sicotte, D. & Nieri, T. (2007). Neighbourhood Effects on Youth
Substance Use in a Southwestern City. Sociological Perspectives, 50(2), 273-
301.
Langas, A., Malt, U. & Opjordsmoen, S. (2011). Comorbid mental disorders in substance
users from a single catchment area - a clinical study. BMC Psychiatry, 11, 25.
Low, N., Dugas, E., O’Loughlin, E., Rodriguez, E., Contreras, G., Chaiton, M. &
O’Loughlin, J. (2012). Common stressful life events and difficulties are
associated with mental health symptoms and substance use in young adolescents.
BMC Psychiatry, 12, 116.
Measelle, J., Stice, E. & Springer, D. (2006). A prospective test of the negative affect
model of substance abuse: moderating effects of social support. Psychology of
Addictive Behavior, 20(3), 225-233.
Meyers, J. & Dick, D. (2010). Genetic and Environmental Risk Factors for Adolescent-
Onset Substance Use Disorders. Child and Adolescent Psychiatric Clinics of
North America, 19(3), 465-477.
Mutrie, N. (2000). The relationship between physical activity and clinically defined
depression. In S. Biddle, K. Fox & S. Boutcher, Physical Activity and

97
Psychological Well-Being (1st ed., pp. 46-62). Routledge.
National Alliance on Mental Illness. (n.d.). Mental Health Facts. Children & Teens.
Retrieved from https://www.nami.org/getattachment/Learn-More/Mental-Health-
by-the-Numbers/childrenmhfacts.pdf
National Institute on Drug Abuse. (2010). Comorbidity: Addiction and Other Mental
Illnesses. Retrieved from https://www.drugabuse.gov/publications/research-
reports/comorbidity-addiction-other-mental-illnesses/why-do-drug-use-disorders-
often-co-occur-other-men
Norris, G., Qureshi, F., Howitt, D. & Cramer, D. (2014). Introduction to Statistics with
SPSS for Social Science. New York. Routledge.
Office of Adolescent Health. (2016). The Changing Face of America's Adolescents.
Retrieved from https://www.hhs.gov/ash/oah/facts-and-stats/changing-face-of-
americas-adolescents/index.html
Pampel, F. C., Kreueger, P. M., & Denney, J. T. (2010). Socioeconomic disparities in
health behaviors. Annual Review of Sociology, 36, 349–370.
Paruk, S. & Burns, J. (2014). Cannabis and mental illness in adolescents: a review. South
African Family Practice, 58(1), 18-21.
Pedersen, E., Miles, J., Osilla, K., Ewing, B., Hunter, S. & D’Amico, E. (2015). The
effects of mental health symptoms and marijuana expectancies on marijuana use

98
and consequences among at-risk adolescents. Journal of Drug Issues, 45(2), 151-
165.
Quitno, M. (2003). Eighth Annual Safest Metro Area Award. Retrieved from
http://www.morganquitno.com/met02safe.htm
Rao. U., Daley, S. & Hammen, C. (2000). Relationship between depression and
substance use disorders in adolescent women during the transition to adulthood.
Journal of the American Academy of Child and Adolescent Psychiatry, 39(2),
215-222.
Reinecke, M. & Davison, M. (2002). Depression: A Practitioner's Guide to Comparative
Treatments. Springer Publishing.
Roberts, R., Roberts, C. & Xing, Y. (2006). Comorbidity of Substance Use Disorders and
Other Psychiatric Disorders Among Adolescents: Evidence from an
Epidemiologic Survey. Drug and Alcohol Dependence, 88(1), 4-13.
Sampson, J., Morenoff, D., & Earls, F. (1999). Beyond Social Capital: Spatial Dynamics
of Collective Efficacy for Children. American Sociological Review, 64,633–660.
Schwarz, S. (2009). Adolescent Mental Health in the United States. Facts for
Policymakers. National Center for Children in Poverty. Retrieved from
http://www.nccp.org/publications/pub_878.html
Schwinn, T., Schinke, S. & Trent, D. (2010). Substance Use among Late Adolescent

99
Urban Youths: Mental Health and Gender Influences. Addictive Behaviors, 35(1),
30-34.
Substance Abuse and Mental Health Services Administration. (2014). Results from the
2013 National Survey on Drug Use and Health: Summary of National Findings.
NSDUH Series H-48, HHS Publication No. (SMA) 14-4863. Rockville, MD:
Author.
Substance Abuse and Mental Health Services Administration. (2015). National Survey on
Drug Use and Health: Comparison of 2013-2014 and 2014-2015 Population
Percentages (50 States and the District of Columbia). Retrieved from
https://www.samhsa.gov/data/sites/default/files/NSDUHsaeShortTermCHG2015/
NSDUHsaeShortTermCHG2015.htm
Substance Abuse and Mental Health Services Administration. (2016). About Population
Data / NSDUH. Retrieved from https://www.samhsa.gov/data/population-data-
nsduh/about
Taylor, M. (1999). The fundamentals of clinical neuropsychiatry. Oxford University
Press.
Teen Help. (2014). Teen Depression Statistics & Facts. Retrieved January 11, 2017, from
https://www.teenhelp.com/teen-depression/teen-depression-statistics/
Tembo, C., Burns, S. & Kalembo, F. (2017). The association between levels of alcohol

100
consumption and mental health problems and academic performance among
young university students. PLoS One, 12(6), e0178142.
U.S. Census Bureau. (2014). Current Population Survey, Annual Social and Economic
Supplement, 2014. Retrieved from
http://www.census.gov/cps/data/cpstablecreator.html.
U.S. Department of Health and Human Services. (2011). The health and well-being of
children in rural areas: A portrait of the nation, 2007. Rockville, MD: U.S.
Department of Health and Human Services, Health Resources and Services
Administration, Maternal and Child Health Bureau.
Vroom, V. (1964). Work and motivation. New York, NY: Wiley.
World Health Organization. (2016). Depression. Retrieved from
http://www.who.int/mediacentre/factsheets/fs369/en/
Wu, P., Goodwin, R., Fuller, C., Liu, X., Comer, J., Cohen, P. & Hoven, C. (2010). The
Relationship Between Anxiety Disorders and Substance Use Among Adolescents
in the Community: Specificity and Gender Differences. Journal of Youth and
Adolescence, 39(2), 177-188.
Wu, P., Hoven, C., Liu, X., Cohen, P., Fuller, C. Shaffer, D. (2011). Substance Use,
Suicidal Ideation and Attempts in Children and Adolescents. Suicide and Life-
Threatening Behavior, 34(4), 408-420.

101
Xu, H. (2004). Relationships Between Quantitative Variables: Regression and
Correlation. Retrieved from http://www.stat.ucla.edu/~hqxu/stat11/ch12.pdf
Youth.gov. (n.d.). Retrieved from https://youth.gov/youth-topics/youth-mental-
health/prevalance-mental-health-disorders-among-youth

102
Appendix A: Statistical Outputs
Table 9
Marijuana Use in the Past Month
Order State
Marijuana use in the past month
12-17
Estimate
12-17
95% CI
(Lower)
12-17
95% CI
(Upper)
1 Total U.S. 7.20% 6.86% 7.56%
6 Alabama 5.16% 3.97% 6.68%
7 Alaska 10.64% 8.50% 13.24%
8 Arizona 7.71% 6.14% 9.65%
9 Arkansas 6.46% 5.07% 8.19%
10 California 8.32% 7.26% 9.52%
11 Colorado 11.13% 9.02% 13.65%
12 Connecticut 8.34% 6.63% 10.43%
13 Delaware 7.42% 5.88% 9.32%
14 District of Columbia 8.85% 6.85% 11.37%
15 Florida 6.78% 5.76% 7.96%
16 Georgia 6.92% 5.62% 8.48%
17 Hawaii 6.15% 4.76% 7.92%
18 Idaho 6.51% 5.11% 8.24%
19 Illinois 6.55% 5.50% 7.79%
20 Indiana 8.08% 6.42% 10.14%
21 Iowa 5.30% 4.01% 6.98%
22 Kansas 6.43% 5.00% 8.23%
23 Kentucky 6.36% 5.02% 8.01%
24 Louisiana 5.33% 4.13% 6.86%
25 Maine 10.01% 8.02% 12.43%
26 Maryland 9.20% 7.36% 11.46%
27 Massachusetts 9.22% 7.49% 11.31%
28 Michigan 8.06% 6.86% 9.45%
29 Minnesota 6.21% 4.84% 7.95%
30 Mississippi 5.29% 4.07% 6.85%
31 Missouri 6.56% 5.14% 8.35%

103
32 Montana 8.71% 7.00% 10.79%
33 Nebraska 5.26% 4.00% 6.88%
34 Nevada 7.39% 5.89% 9.25%
35 New Hampshire 9.44% 7.64% 11.62%
36 New Jersey 6.81% 5.52% 8.38%
37 New Mexico 8.53% 6.78% 10.68%
38 New York 7.55% 6.46% 8.81%
39 North Carolina 5.97% 4.82% 7.39%
40 North Dakota 6.21% 4.76% 8.07%
41 Ohio 6.05% 5.01% 7.29%
42 Oklahoma 5.42% 4.14% 7.07%
43 Oregon 9.42% 7.58% 11.66%
44 Pennsylvania 6.98% 5.84% 8.32%
45 Rhode Island 10.19% 8.24% 12.53%
46 South Carolina 6.57% 5.20% 8.26%
47 South Dakota 6.43% 5.03% 8.18%
48 Tennessee 5.90% 4.60% 7.54%
49 Texas 6.86% 5.83% 8.06%
50 Utah 4.54% 3.43% 5.99%
51 Vermont 10.86% 8.80% 13.32%
52 Virginia 5.44% 4.29% 6.87%
53 Washington 9.17% 7.32% 11.44%
54 West Virginia 6.05% 4.71% 7.75%
55 Wisconsin 7.60% 5.93% 9.70%
56 Wyoming 6.59% 5.15% 8.40%
Table 10
One-Sample Test for the State Averages for Marijuana Use in the Past Month
One-Sample Test
Test Value = 0
t
d
f
Sig.
(2-
Mean
Difference
95% Confidence Interval of
the Difference

104
taile
d) Lower Upper
Marijuanauseinthepastm
onth
32.24
8
5
1 .000
.07310543284
62
.0685542911
15
.0776565745
77
Table 11
One-Sample Test Against the National Average for Marijuana Use in the Past Month
One-Sample Test
Test Value = .0719901650
t df
Sig.
(2-
tailed
)
Mean
Difference
95% Confidence Interval of
the Difference
Lower Upper
Marijuanauseinthepastmo
nth .49
2
5
1 .625
.00111526784
62
-
.0034358738
85
.0056664095
77
Table 12
First Use of Marijuana
Order State
First Use of Marijuana
12-17
Estimate
12-17
95% CI
(Lower)
12-17
95% CI
(Upper)
1 Total U.S. 5.41% 5.17% 5.65%
6 Alabama 4.36% 3.56% 5.34%
7 Alaska 7.52% 6.20% 9.10%
8 Arizona 6.09% 5.05% 7.33%
9 Arkansas 5.37% 4.45% 6.47%
10 California 5.89% 5.27% 6.58%
11 Colorado 8.16% 6.89% 9.65%

105
12 Connecticut 6.61% 5.50% 7.93%
13 Delaware 5.29% 4.36% 6.41%
14 District of Columbia 8.26% 6.81% 10.00%
15 Florida 5.57% 4.96% 6.24%
16 Georgia 5.17% 4.40% 6.08%
17 Hawaii 6.31% 5.12% 7.75%
18 Idaho 5.50% 4.50% 6.71%
19 Illinois 4.59% 4.00% 5.27%
20 Indiana 5.97% 4.98% 7.14%
21 Iowa 4.31% 3.49% 5.32%
22 Kansas 5.01% 4.14% 6.05%
23 Kentucky 4.62% 3.81% 5.59%
24 Louisiana 4.46% 3.65% 5.45%
25 Maine 7.45% 6.26% 8.84%
26 Maryland 6.12% 5.14% 7.27%
27 Massachusetts 6.82% 5.72% 8.11%
28 Michigan 5.79% 5.09% 6.57%
29 Minnesota 4.39% 3.61% 5.32%
30 Mississippi 4.41% 3.62% 5.35%
31 Missouri 5.62% 4.67% 6.76%
32 Montana 6.19% 5.15% 7.43%
33 Nebraska 3.51% 2.80% 4.39%
34 Nevada 6.28% 5.15% 7.63%
35 New Hampshire 6.82% 5.74% 8.09%
36 New Jersey 4.99% 4.22% 5.88%
37 New Mexico 6.71% 5.54% 8.11%
38 New York 5.43% 4.80% 6.14%
39 North Carolina 5.35% 4.57% 6.26%
40 North Dakota 4.91% 4.03% 5.97%
41 Ohio 4.90% 4.24% 5.66%
42 Oklahoma 5.62% 4.60% 6.85%
43 Oregon 6.85% 5.72% 8.17%
44 Pennsylvania 4.74% 4.11% 5.46%
45 Rhode Island 6.71% 5.53% 8.13%
46 South Carolina 5.82% 4.87% 6.96%
47 South Dakota 4.45% 3.64% 5.42%

106
48 Tennessee 4.46% 3.66% 5.43%
49 Texas 4.87% 4.28% 5.53%
50 Utah 3.05% 2.41% 3.86%
51 Vermont 6.97% 5.84% 8.30%
52 Virginia 5.03% 4.28% 5.91%
53 Washington 5.96% 4.93% 7.19%
54 West Virginia 5.66% 4.71% 6.78%
55 Wisconsin 6.05% 5.01% 7.28%
56 Wyoming 5.33% 4.39% 6.46%
Table 13
One-Sample Test Against the National Average
One-Sample Test
Test Value = 0.05788483
t df
Sig.
(2-
tailed
)
Mean
Difference
95% Confidence Interval of the
Difference
Lower Upper
Firstuseofmarijuan
a
-
1.18
4
5
1 .242
-
.001778030423
1
-
.00479316598
4
.00123710513
8
Table 14
One-Sample Test for State-Level Incidence Rate
One-Sample Test
Test Value = 0
t df
Sig.
(2-
tailed
)
Mean
Difference
95% Confidence Interval of the
Difference
Lower Upper
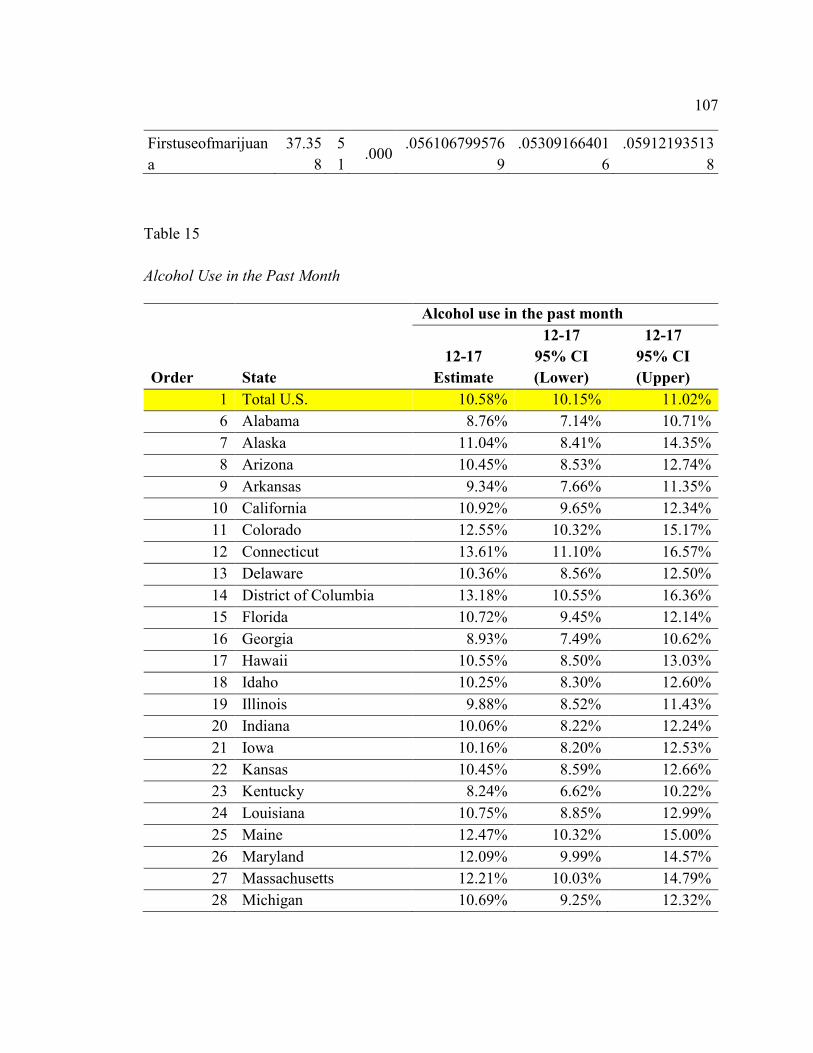
107
Firstuseofmarijuan
a
37.35
8
5
1 .000
.056106799576
9
.05309166401
6
.05912193513
8
Table 15
Alcohol Use in the Past Month
Order State
Alcohol use in the past month
12-17
Estimate
12-17
95% CI
(Lower)
12-17
95% CI
(Upper)
1 Total U.S. 10.58% 10.15% 11.02%
6 Alabama 8.76% 7.14% 10.71%
7 Alaska 11.04% 8.41% 14.35%
8 Arizona 10.45% 8.53% 12.74%
9 Arkansas 9.34% 7.66% 11.35%
10 California 10.92% 9.65% 12.34%
11 Colorado 12.55% 10.32% 15.17%
12 Connecticut 13.61% 11.10% 16.57%
13 Delaware 10.36% 8.56% 12.50%
14 District of Columbia 13.18% 10.55% 16.36%
15 Florida 10.72% 9.45% 12.14%
16 Georgia 8.93% 7.49% 10.62%
17 Hawaii 10.55% 8.50% 13.03%
18 Idaho 10.25% 8.30% 12.60%
19 Illinois 9.88% 8.52% 11.43%
20 Indiana 10.06% 8.22% 12.24%
21 Iowa 10.16% 8.20% 12.53%
22 Kansas 10.45% 8.59% 12.66%
23 Kentucky 8.24% 6.62% 10.22%
24 Louisiana 10.75% 8.85% 12.99%
25 Maine 12.47% 10.32% 15.00%
26 Maryland 12.09% 9.99% 14.57%
27 Massachusetts 12.21% 10.03% 14.79%
28 Michigan 10.69% 9.25% 12.32%

108
29 Minnesota 10.71% 8.88% 12.87%
30 Mississippi 8.78% 7.11% 10.80%
31 Missouri 9.83% 8.06% 11.92%
32 Montana 9.90% 8.03% 12.14%
33 Nebraska 8.88% 7.11% 11.04%
34 Nevada 13.67% 11.20% 16.58%
35 New Hampshire 13.12% 11.00% 15.59%
36 New Jersey 13.88% 11.77% 16.29%
37 New Mexico 9.40% 7.63% 11.53%
38 New York 12.57% 11.07% 14.24%
39 North Carolina 8.19% 6.78% 9.85%
40 North Dakota 11.85% 9.59% 14.55%
41 Ohio 10.33% 8.97% 11.86%
42 Oklahoma 10.22% 8.31% 12.52%
43 Oregon 11.68% 9.70% 14.00%
44 Pennsylvania 11.34% 9.85% 13.03%
45 Rhode Island 13.23% 10.82% 16.08%
46 South Carolina 8.87% 7.26% 10.80%
47 South Dakota 10.38% 8.45% 12.70%
48 Tennessee 8.17% 6.58% 10.10%
49 Texas 9.96% 8.76% 11.31%
50 Utah 5.44% 3.98% 7.40%
51 Vermont 13.16% 10.87% 15.83%
52 Virginia 10.65% 8.98% 12.59%
53 Washington 10.65% 8.73% 12.95%
54 West Virginia 9.97% 8.08% 12.25%
55 Wisconsin 11.25% 9.28% 13.57%
56 Wyoming 10.72% 7.98% 14.26%
Table 16
One-Sample Test for Alcohol Use in the Past Month for the State Level Data
One-Sample Test
Test Value = 0

109
t df
Sig.
(2-
tailed
)
Mean
Difference
95% Confidence Interval of
the Difference
Lower Upper
Alcoholuseinthepastmo
nth
46.26
7
5
1 .000
.10674498423
08
.1021131527
48
.1113768157
13
Table 17
One-Sample Test for Alcohol Use in the Past Month Against the National Average
One-Sample Test
Test Value = 0.1057774658
t df
Sig.
(2-
tailed
)
Mean
Difference
95% Confidence Interval of
the Difference
Lower Upper
Alcoholuseinthepastmo
nth .41
9
5
1 .677
.00096751843
08
-
.00366431305
2
.00559934991
3
Table 18
Alcohol Use Disorder in the Past Year
Order State
Alcohol use disorder in the past year
12-17
Estimate
12-17
95% CI
(Lower)
12-17
95% CI
(Upper)
1 Total U.S. 2.62% 2.40% 2.85%
6 Alabama 2.17% 1.53% 3.08%
7 Alaska 2.55% 1.84% 3.53%
8 Arizona 2.90% 2.10% 4.01%
9 Arkansas 2.76% 1.99% 3.81%

110
10 California 2.73% 2.13% 3.49%
11 Colorado 3.20% 2.33% 4.39%
12 Connecticut 2.74% 1.93% 3.87%
13 Delaware 2.42% 1.74% 3.36%
14 District of Columbia 2.44% 1.64% 3.62%
15 Florida 2.69% 2.14% 3.36%
16 Georgia 2.18% 1.63% 2.91%
17 Hawaii 2.48% 1.67% 3.64%
18 Idaho 2.98% 2.20% 4.03%
19 Illinois 2.42% 1.89% 3.11%
20 Indiana 2.65% 1.90% 3.68%
21 Iowa 2.57% 1.80% 3.66%
22 Kansas 2.51% 1.78% 3.51%
23 Kentucky 2.36% 1.69% 3.29%
24 Louisiana 2.43% 1.72% 3.44%
25 Maine 2.52% 1.80% 3.53%
26 Maryland 2.56% 1.82% 3.59%
27 Massachusetts 2.98% 2.15% 4.14%
28 Michigan 2.63% 2.07% 3.34%
29 Minnesota 2.20% 1.55% 3.12%
30 Mississippi 2.17% 1.53% 3.07%
31 Missouri 2.28% 1.61% 3.23%
32 Montana 2.60% 1.84% 3.66%
33 Nebraska 2.33% 1.63% 3.31%
34 Nevada 3.02% 2.13% 4.25%
35 New Hampshire 2.68% 1.92% 3.74%
36 New Jersey 3.24% 2.38% 4.41%
37 New Mexico 2.59% 1.83% 3.67%
38 New York 2.51% 1.96% 3.21%
39 North Carolina 2.08% 1.53% 2.82%
40 North Dakota 2.96% 2.08% 4.18%
41 Ohio 2.45% 1.88% 3.18%
42 Oklahoma 2.11% 1.44% 3.08%
43 Oregon 3.05% 2.23% 4.16%
44 Pennsylvania 2.53% 1.95% 3.27%
45 Rhode Island 2.86% 2.01% 4.04%

111
46 South Carolina 2.56% 1.85% 3.55%
47 South Dakota 2.63% 1.83% 3.76%
48 Tennessee 2.18% 1.53% 3.08%
49 Texas 2.98% 2.35% 3.77%
50 Utah 2.26% 1.52% 3.34%
51 Vermont 2.75% 1.98% 3.83%
52 Virginia 2.19% 1.61% 2.97%
53 Washington 2.74% 1.97% 3.80%
54 West Virginia 2.87% 2.08% 3.95%
55 Wisconsin 3.06% 2.20% 4.25%
56 Wyoming 2.94% 2.02% 4.24%
Table 19
One-Sample Test for Alcohol Use Disorder in the Past Year
One-Sample Test
Test Value = 0
t
d
f
Sig.
(2-
taile
d)
Mean
Difference
95% Confidence Interval
of the Difference
Lower Upper
Alcoholusedisorderinthepa
styear
63.21
8
5
1 .000
.0260241484
231
.0251977104
93
.0268505863
53
Table 20
One-Sample Test for Alcohol Use Disorder in the Past Year Against the National
Average
One-Sample Test
Test Value = 0.026152968
t
d
f
Sig.
(2-
Mean
Difference
95% Confidence Interval of
the Difference

112
taile
d) Lower Upper
Alcoholusedisorderinthepas
tyear
-
.31
3
5
1 .756
-
.00012881957
69
-
.0009552575
07
.0006976183
53
Table 21
Alcohol Dependence in the Past Year
Order State
Alcohol dependence in the past year
12-17
Estimate
12-17
95% CI
(Lower)
12-17
95% CI
(Upper)
1 Total U.S. 0.95% 0.83% 1.09%
6 Alabama 0.80% 0.53% 1.20%
7 Alaska 0.87% 0.58% 1.31%
8 Arizona 1.10% 0.75% 1.61%
9 Arkansas 0.96% 0.65% 1.40%
10 California 1.07% 0.79% 1.45%
11 Colorado 1.11% 0.75% 1.63%
12 Connecticut 0.92% 0.63% 1.35%
13 Delaware 0.92% 0.63% 1.32%
14 District of Columbia 0.84% 0.53% 1.30%
15 Florida 0.86% 0.62% 1.18%
16 Georgia 0.84% 0.59% 1.19%
17 Hawaii 0.84% 0.54% 1.30%
18 Idaho 0.92% 0.64% 1.32%
19 Illinois 0.91% 0.66% 1.24%
20 Indiana 0.98% 0.67% 1.43%
21 Iowa 0.94% 0.64% 1.38%
22 Kansas 0.94% 0.63% 1.41%
23 Kentucky 0.82% 0.55% 1.23%
24 Louisiana 0.85% 0.57% 1.27%
25 Maine 0.86% 0.57% 1.28%

113
26 Maryland 0.79% 0.53% 1.18%
27 Massachusetts 0.91% 0.63% 1.32%
28 Michigan 0.95% 0.69% 1.31%
29 Minnesota 0.85% 0.58% 1.23%
30 Mississippi 0.85% 0.57% 1.26%
31 Missouri 0.83% 0.56% 1.23%
32 Montana 0.94% 0.65% 1.37%
33 Nebraska 0.92% 0.62% 1.35%
34 Nevada 1.04% 0.72% 1.50%
35 New Hampshire 0.88% 0.60% 1.29%
36 New Jersey 0.91% 0.63% 1.30%
37 New Mexico 1.23% 0.80% 1.89%
38 New York 1.02% 0.75% 1.39%
39 North Carolina 0.81% 0.58% 1.15%
40 North Dakota 0.97% 0.65% 1.43%
41 Ohio 0.95% 0.70% 1.29%
42 Oklahoma 0.84% 0.57% 1.23%
43 Oregon 1.06% 0.72% 1.55%
44 Pennsylvania 0.88% 0.64% 1.21%
45 Rhode Island 0.96% 0.66% 1.41%
46 South Carolina 0.81% 0.55% 1.18%
47 South Dakota 0.95% 0.66% 1.34%
48 Tennessee 0.79% 0.54% 1.17%
49 Texas 1.16% 0.85% 1.58%
50 Utah 0.95% 0.64% 1.40%
51 Vermont 0.96% 0.65% 1.43%
52 Virginia 0.83% 0.58% 1.17%
53 Washington 0.93% 0.64% 1.34%
54 West Virginia 0.96% 0.65% 1.41%
55 Wisconsin 0.98% 0.67% 1.42%
56 Wyoming 1.06% 0.74% 1.54%

114
Table 22
One-Sample Test for Alcohol Dependence in the Past Year
One-Sample Test
Test Value = 0
t
d
f
Sig.
(2-
taile
d)
Mean
Difference
95% Confidence Interval
of the Difference
Lower Upper
Alcoholdependenceinthepa
styear
68.97
7
5
1 .000
.0092805850
962
.009010473
551
.009550696
641
Table 23
One-Sample Test for Alcohol Dependence in the Past Year Against the National Average
One-Sample Test
Test Value = 0.009545901
t
d
f
Sig.
(2-
taile
d)
Mean
Difference
95% Confidence Interval
of the Difference
Lower Upper
Alcoholdependenceinthepas
tyear
-
1.97
2
5
1 .054
-
.0002653159
038
-
.0005354274
49
.0000047956
41
Table 24
Major Depressive Episodes in the Past Year
Order State Major depressive episode in the past year

115
12-17
Estimate
12-17
95% CI
(Lower)
12-17
95% CI
(Upper)
1 Total U.S. 11.93% 11.48% 12.40%
6 Alabama 10.97% 9.08% 13.20%
7 Alaska 12.40% 10.27% 14.91%
8 Arizona 13.20% 11.02% 15.72%
9 Arkansas 12.72% 10.66% 15.12%
10 California 12.28% 11.02% 13.67%
11 Colorado 13.73% 11.51% 16.31%
12 Connecticut 11.49% 9.47% 13.88%
13 Delaware 11.47% 9.61% 13.64%
14 District of Columbia 9.96% 8.08% 12.23%
15 Florida 11.88% 10.52% 13.40%
16 Georgia 10.08% 8.49% 11.94%
17 Hawaii 9.87% 7.95% 12.17%
18 Idaho 13.03% 10.82% 15.61%
19 Illinois 11.20% 9.76% 12.83%
20 Indiana 14.64% 12.29% 17.34%
21 Iowa 11.87% 9.80% 14.30%
22 Kansas 11.18% 9.24% 13.48%
23 Kentucky 11.05% 9.17% 13.27%
24 Louisiana 11.00% 9.07% 13.29%
25 Maine 12.51% 10.42% 14.96%
26 Maryland 11.03% 9.16% 13.23%
27 Massachusetts 12.37% 10.25% 14.85%
28 Michigan 11.80% 10.36% 13.41%
29 Minnesota 12.55% 10.47% 14.96%
30 Mississippi 11.08% 9.11% 13.41%
31 Missouri 11.49% 9.60% 13.70%
32 Montana 11.42% 9.45% 13.73%
33 Nebraska 12.25% 10.19% 14.67%
34 Nevada 13.94% 11.58% 16.68%
35 New Hampshire 13.43% 11.26% 15.95%
36 New Jersey 10.32% 8.69% 12.22%
37 New Mexico 11.50% 9.53% 13.82%

116
38 New York 11.92% 10.56% 13.44%
39 North Carolina 12.35% 10.58% 14.36%
40 North Dakota 10.47% 8.66% 12.60%
41 Ohio 11.85% 10.43% 13.44%
42 Oklahoma 12.57% 10.35% 15.20%
43 Oregon 14.33% 12.04% 16.97%
44 Pennsylvania 11.64% 10.18% 13.28%
45 Rhode Island 13.03% 10.76% 15.70%
46 South Carolina 10.96% 9.13% 13.10%
47 South Dakota 9.90% 8.07% 12.09%
48 Tennessee 10.92% 8.99% 13.19%
49 Texas 11.53% 10.22% 12.99%
50 Utah 11.97% 10.05% 14.21%
51 Vermont 12.06% 10.05% 14.41%
52 Virginia 12.47% 10.63% 14.57%
53 Washington 12.54% 10.32% 15.14%
54 West Virginia 13.26% 11.09% 15.79%
55 Wisconsin 13.64% 11.42% 16.22%
56 Wyoming 13.31% 11.14% 15.84%
Table 25
One-Sample Test Major Depressive Episodes in the Past Year
One-Sample Test
Test Value = 0
t
d
f
Sig.
(2-
taile
d)
Mean
Difference
95% Confidence Interval
of the Difference
Lower Upper
Majordepressiveepisodeinthe
pastyear
76.2
69
5
1 .000
.1196923587
692
.116541773
564
.122842943
975

117
Table 26
One-Sample Test for Major Depressive Episode in the Past Year Against the National
Average
One-Sample Test
Test Value = 0.1192993673
t
d
f
Sig.
(2-
taile
d)
Mean
Difference
95% Confidence Interval
of the Difference
Lower Upper
Majordepressiveepisodeinthep
astyear .25
0
5
1 .803
.0003929914
692
-
.002757593
736
.003543576
675