Subsidy cut for NEV bus impacts earnings outlook; down to ...
14
January 13, 2017 ACTION Removed from Asia Pacific Buy List BYD Co. (1211.HK) Equity Research Subsidy cut for NEV bus impacts earnings outlook; down to Neutral What happened We lower our TP and downgrade BYD to Neutral (from Buy) following the reduced 2017 subsidies for new energy vehicles (particularly NEV bus), announced on Dec 30. Our revised TP implies 2% upside vs. -1% coverage avg. and we find current valuation fair given (1) its 1.9X 12m forward P/B is within historical median -1std; (2) the NEV business (incl. EV battery) trades at 1.4X P/S and 14.4X P/E 2020E, vs. Tesla’s 1.5X and 25.0X; and (3) weaker growth outlook post 2017 NEV policy announcement. Since reinstating coverage of BYD at Buy on Aug 31, 2016, the stock is -20% vs. the HSCEI +2% as a result of uncertainties surrounding the NEV subsidy policy. Current view As per the latest NEV subsidy policy for 2017: (1) maximum central government subsidy for NEV bus is to be cut by 25%-70%; (2) local government subsidy not to exceed 50% of central government subsidy; (3) NEV passenger car subsidy to be cut by 20% as expected, maximum NEV truck/special purpose vehicle subsidy to be increased, and fuel cell vehicle subsidy to stay unchanged; (4) technology qualification standard to be hiked (battery energy density, mileage, fast charge ratio, etc.). We lower our 2017E-2019E EPS by 15%/9%/9% respectively. We estimate that BYD’s NEV bus OPM will fall from 25.7% in 2016E to 16.2% in 2017E, and its overall NEV OPM will decline from 18.5% to 14.9%, with the subsidy cut partly offset by NEV credit income (estimated at 4.0%/ 3.5%/ 3.0% of 2018-2020 NEV passenger car revenues). Valuation: Our 12-month target price for BYD of HK$44.52 (down 25% from HK$59.45) is based on a sum-of-the-parts valuation methodology. Key risks: Higher/lower total NEV market size/BYD market share in the NEV space; higher/lower NEV credit income; higher/lower cost saving esp. on the battery side; higher ASP/OPM for NEV bus if BYD is able to pass on some subsidy reduction to the buyers; quicker/slower sales ramp-up in the new monorail business. INVESTMENT LIST MEMBERSHIP Neutral Coverage View: Neutral Yipeng Yang +86(10)6627-3189 [email protected] Beijing Gao Hua Securities Company Limited Goldman Sachs does and seeks to do business with companies covered in its research reports. As a result, investors should be aware that the firm may have a conflict of interest that could affect the objectivity of this report. Investors should consider this report as only a single factor in making their investment decision. For Reg AC certification and other important disclosures, see the Disclosure Appendix, or go to www.gs.com/research/hedge.html. Analysts employed by non- US affiliates are not registered/qualified as research analysts with FINRA in the U.S. Yuqian Ding +86(10)6627-3327 [email protected] Beijing Gao Hua Securities Company Limited Longjin Li +65-6654-5141 [email protected] Goldman Sachs (Singapore) Pte The Goldman Sachs Group, Inc. Global Investment Research Growth Returns * Multiple Volatility Volatility Multiple Returns * Growth Investment Profile Low High Percentile 20th 40th 60th 80th 100th * Returns = Return on Capital For a complete description of the investment profile measures please refer to the disclosure section of this document. BYD Co. (1211.HK) Asia Pacific Autos & Autoparts Peer Group Average Key data Current Price (HK$) 43.45 12 month price target (HK$) 44.52 Market cap (HK$ mn / US$ mn) 89,076.8 / 11,487.2 Foreign ownership (%) -- 12/15 12/16E 12/17E 12/18E EPS (Rmb) New 1.14 2.00 2.13 2.91 EPS revision (%) 0.0 1.0 (14.8) (9.1) EPS growth (%) 537.9 75.4 6.3 37.0 EPS (dil) (Rmb) New 1.14 2.00 2.13 2.91 P/E (X) 28.7 19.3 18.2 13.3 P/B (X) 2.5 2.1 1.9 1.7 EV/EBITDA (X) 12.9 8.5 8.5 7.7 Dividend yield (%) 0.0 1.6 1.4 1.9 ROE (%) 9.8 12.5 11.1 13.8 CROCI (%) 14.1 13.2 12.9 13.4 Price performance chart 7,500 8,000 8,500 9,000 9,500 10,000 10,500 30 35 40 45 50 55 60 Jan-16 Apr-16 Jul-16 Oct-16 BYD Co. (L) Hang Seng China Ent. Index (R) Share price performance (%) 3 month 6 month 12 month Absolute (14.4) (8.9) 19.2 Rel. to Hang Seng China Ent. Index (14.8) (17.0) 3.5 Source: Company data, Goldman Sachs Research estimates, FactSet. Price as of 1/12/2017 close.
Transcript of Subsidy cut for NEV bus impacts earnings outlook; down to ...

January 13, 2017
ACTION Removed from Asia Pacific Buy List
BYD Co. (1211.HK)
Equity Research
Subsidy cut for NEV bus impacts earnings outlook; down to Neutral
What happened
We lower our TP and downgrade BYD to Neutral (from Buy) following the
reduced 2017 subsidies for new energy vehicles (particularly NEV bus),
announced on Dec 30. Our revised TP implies 2% upside vs. -1% coverage
avg. and we find current valuation fair given (1) its 1.9X 12m forward P/B is
within historical median -1std; (2) the NEV business (incl. EV battery) trades
at 1.4X P/S and 14.4X P/E 2020E, vs. Tesla’s 1.5X and 25.0X; and (3) weaker
growth outlook post 2017 NEV policy announcement. Since reinstating
coverage of BYD at Buy on Aug 31, 2016, the stock is -20% vs. the HSCEI
+2% as a result of uncertainties surrounding the NEV subsidy policy.
Current view
As per the latest NEV subsidy policy for 2017: (1) maximum central
government subsidy for NEV bus is to be cut by 25%-70%; (2) local
government subsidy not to exceed 50% of central government subsidy;
(3) NEV passenger car subsidy to be cut by 20% as expected, maximum
NEV truck/special purpose vehicle subsidy to be increased, and fuel cell
vehicle subsidy to stay unchanged; (4) technology qualification standard to
be hiked (battery energy density, mileage, fast charge ratio, etc.).
We lower our 2017E-2019E EPS by 15%/9%/9% respectively. We estimate
that BYD’s NEV bus OPM will fall from 25.7% in 2016E to 16.2% in 2017E,
and its overall NEV OPM will decline from 18.5% to 14.9%, with the
subsidy cut partly offset by NEV credit income (estimated at 4.0%/ 3.5%/
3.0% of 2018-2020 NEV passenger car revenues).
Valuation: Our 12-month target price for BYD of HK$44.52 (down 25%
from HK$59.45) is based on a sum-of-the-parts valuation methodology.
Key risks: Higher/lower total NEV market size/BYD market share in the
NEV space; higher/lower NEV credit income; higher/lower cost saving esp.
on the battery side; higher ASP/OPM for NEV bus if BYD is able to pass on
some subsidy reduction to the buyers; quicker/slower sales ramp-up in the
new monorail business.
INVESTMENT LIST MEMBERSHIP
Neutral
Coverage View: Neutral
Yipeng Yang +86(10)6627-3189 [email protected] Beijing Gao Hua Securities Company Limited Goldman Sachs does and seeks to do business with companies
covered in its research reports. As a result, investors should be aware that the firm may have a conflict of interest that could affect the objectivity of this report. Investors should consider this report as only a single factor in making their investment decision. For Reg AC certification and other important disclosures, see the Disclosure Appendix, or go to www.gs.com/research/hedge.html. Analysts employed by non-US affiliates are not registered/qualified as research analysts with FINRA in the U.S.
Yuqian Ding +86(10)6627-3327 [email protected] Beijing Gao Hua Securities Company LimitedLongjin Li +65-6654-5141 [email protected] Goldman Sachs (Singapore) Pte
The Goldman Sachs Group, Inc. Global Investment Research
Growth
Returns *
Multiple
Volatility Volatility
Multiple
Returns *
Growth
Investment Profile
Low High
Percentile 20th 40th 60th 80th 100th
* Returns = Return on Capital For a complete description of the investment
profile measures please refer to the
disclosure section of this document.
BYD Co. (1211.HK)
Asia Pacific Autos & Autoparts Peer Group Average
Key data Current
Price (HK$) 43.45
12 month price target (HK$) 44.52
Market cap (HK$ mn / US$ mn) 89,076.8 / 11,487.2
Foreign ownership (%) --
12/15 12/16E 12/17E 12/18E
EPS (Rmb) New 1.14 2.00 2.13 2.91
EPS revision (%) 0.0 1.0 (14.8) (9.1)
EPS growth (%) 537.9 75.4 6.3 37.0
EPS (dil) (Rmb) New 1.14 2.00 2.13 2.91
P/E (X) 28.7 19.3 18.2 13.3
P/B (X) 2.5 2.1 1.9 1.7
EV/EBITDA (X) 12.9 8.5 8.5 7.7
Dividend yield (%) 0.0 1.6 1.4 1.9
ROE (%) 9.8 12.5 11.1 13.8
CROCI (%) 14.1 13.2 12.9 13.4
Price performance chart
7,500
8,000
8,500
9,000
9,500
10,000
10,500
30
35
40
45
50
55
60
Jan-16 Apr-16 Jul-16 Oct-16
BYD Co. (L) Hang Seng China Ent. Index (R)
Share price performance (%) 3 month 6 month 12 monthAbsolute (14.4) (8.9) 19.2
Rel. to Hang Seng China Ent. Index (14.8) (17.0) 3.5
Source: Company data, Goldman Sachs Research estimates, FactSet. Price as of 1/12/2017 close.

January 13, 2017 BYD Co. (1211.HK)
Goldman Sachs Global Investment Research 2
BYD Co.: Summary Financials
Analyst Contributors
Yipeng Yang
Yuqian Ding
Longjin Li
Profit model (Rmb mn) 12/15 12/16E 12/17E 12/18E Balance sheet (Rmb mn) 12/15 12/16E 12/17E 12/18E
Total revenue 77,612.0 101,672.3 115,852.9 137,286.3 Cash & equivalents 6,010.9 16,042.5 16,047.1 15,474.3
Cost of goods sold (60,439.1) (76,125.6) (87,612.0) (104,507.1) Accounts receivable 27,164.7 34,750.4 38,644.9 45,794.4
SG&A (8,659.2) (11,343.6) (13,215.4) (16,346.7) Inventory 15,750.6 19,838.5 22,831.8 27,234.7
R&D -- -- -- -- Other current assets 5,592.9 6,152.2 6,459.8 6,782.8
Other operating profit/(expense) 499.7 654.7 630.1 746.7 Total current assets 54,519.1 76,783.5 83,983.7 95,286.3
EBITDA 9,013.4 14,857.8 15,655.7 17,179.2 Net PP&E 39,039.0 43,457.8 46,069.0 48,292.2
Depreciation & amortization (5,313.6) (6,475.7) (6,726.9) (6,945.3) Net intangibles 7,168.7 5,927.7 4,686.8 3,445.8
EBIT 3,699.8 8,382.0 8,928.7 10,233.9 Total investments 4,960.1 4,834.3 4,720.2 4,643.0
Interest income 53.4 120.2 320.8 320.9 Other long-term assets 9,798.8 10,778.7 11,317.7 11,883.5
Interest expense (1,517.0) (1,595.5) (1,471.0) (1,411.7) Total assets 115,485.8 141,782.0 150,777.3 163,550.7
Income/(loss) from uncons. subs. 3.0 0.0 0.0 0.0
Others 1,555.8 (151.1) (139.4) 1,233.3 Accounts payable 30,655.8 35,483.8 39,637.7 45,849.9
Pretax profits 3,795.0 6,755.6 7,639.2 10,376.5 Short-term debt 26,412.9 27,412.9 27,212.9 26,512.9
Income tax (656.8) (1,183.6) (1,376.6) (1,921.8) Other current liabilities 9,041.4 10,770.5 10,492.1 11,028.5
Minorities (314.8) (400.8) (460.1) (506.5) Total current liabilities 66,110.1 73,667.2 77,342.6 83,391.2
Long-term debt 11,229.9 11,229.9 11,229.9 11,029.9
Net income pre-preferred dividends 2,823.4 5,171.2 5,802.5 7,948.2 Other long-term liabilities 2,116.5 2,539.8 3,047.7 3,504.9
Preferred dividends 0.0 0.0 0.0 0.0 Total long-term liabilities 13,346.4 13,769.7 14,277.6 14,534.8
Net income (pre-exceptionals) 2,823.4 5,171.2 5,802.5 7,948.2 Total liabilities 79,456.5 87,436.9 91,620.3 97,926.0
Post-tax exceptionals 0.0 0.0 0.0 0.0
Net income 2,823.4 5,171.2 5,802.5 7,948.2 Preferred shares 0.0 0.0 0.0 0.0
Total common equity 32,294.4 50,209.5 54,561.3 60,522.5
EPS (basic, pre-except) (Rmb) 1.14 2.00 2.13 2.91 Minority interest 3,734.8 4,135.7 4,595.7 5,102.2
EPS (basic, post-except) (Rmb) 1.14 2.00 2.13 2.91
EPS (diluted, post-except) (Rmb) 1.14 2.00 2.13 2.91 Total liabilities & equity 115,485.8 141,782.0 150,777.3 163,550.7
DPS (Rmb) 0.00 0.63 0.53 0.73
Dividend payout ratio (%) 0.0 31.7 25.0 25.0 BVPS (Rmb) 13.04 18.40 20.00 22.18
Free cash flow yield (%) (2.6) (5.6) 1.9 2.1
Growth & margins (%) 12/15 12/16E 12/17E 12/18E Ratios 12/15 12/16E 12/17E 12/18E
Sales growth 40.2 31.0 13.9 18.5 CROCI (%) 14.1 13.2 12.9 13.4
EBITDA growth 46.8 64.8 5.4 9.7 ROE (%) 9.8 12.5 11.1 13.8
EBIT growth 91.8 126.6 6.5 14.6 ROA (%) 2.7 4.0 4.0 5.1
Net income growth 551.3 83.2 12.2 37.0 ROACE (%) 7.1 9.4 9.1 11.0
EPS growth 537.9 75.4 6.3 37.0 Inventory days 77.7 85.3 88.9 87.4
Gross margin 22.1 25.1 24.4 23.9 Receivables days 117.3 111.1 115.6 112.2
EBITDA margin 11.6 14.6 13.5 12.5 Payable days 170.6 158.6 156.5 149.3
EBIT margin 4.8 8.2 7.7 7.5 Net debt/equity (%) 87.8 41.6 37.9 33.6
Interest cover - EBIT (X) 2.5 5.7 7.8 9.4
Cash flow statement (Rmb mn) 12/15 12/16E 12/17E 12/18E Valuation 12/15 12/16E 12/17E 12/18E
Net income pre-preferred dividends 2,823.4 5,171.2 5,802.5 7,948.2
D&A add-back 5,313.6 6,475.7 6,726.9 6,945.3 P/E (analyst) (X) 28.7 19.3 18.2 13.3
Minorities interests add-back 314.8 400.8 460.1 506.5 P/B (X) 2.5 2.1 1.9 1.7
Net (inc)/dec working capital (5,915.3) (6,845.5) (2,734.0) (5,340.3) EV/EBITDA (X) 12.9 8.5 8.5 7.7
Other operating cash flow 1,305.6 (864.7) (99.2) (229.1) EV/GCI (X) 1.3 1.2 1.2 1.1
Cash flow from operations 3,842.1 4,337.4 10,156.3 9,830.6 Dividend yield (%) 0.0 1.6 1.4 1.9
Capital expenditures (6,072.5) (10,167.2) (8,109.7) (7,550.7)
Acquisitions 0.0 0.0 0.0 0.0
Divestitures 1,808.6 904.3 452.1 0.0
Others (6,472.5) (514.9) (618.7) (620.7)
Cash flow from investments (10,736.5) (9,777.8) (8,276.3) (8,171.5)
Dividends paid (common & pref) 0.0 0.0 (1,729.1) (1,450.6)
Inc/(dec) in debt 10,465.6 1,000.0 (200.0) (900.0)
Common stock issuance (repurchase) 0.0 14,473.0 0.0 0.0
Other financing cash flows (1,510.7) (1.1) 53.8 118.7
Cash flow from financing 8,954.9 15,471.9 (1,875.3) (2,231.9)
Total cash flow 2,060.5 10,031.5 4.7 (572.8) Note: Last actual year may include reported and estimated data.
Source: Company data, Goldman Sachs Research estimates.

January 13, 2017 BYD Co. (1211.HK)
Goldman Sachs Global Investment Research 3
New NEV policy to cut bus subsidy by up to 70%
Passenger Car: subsidy cut by 20%, as expected; technology
qualification standards raised further
On Dec. 30, the Ministry of Finance (MoF) announced that the 2017-2018 NEV subsidy for
passenger cars will be cut by 20% vs. the 2016 level. This is in line with the 2016-2020 NEV
subsidy policy guidance announced on April 22, 2015 by the MoF, Ministry of Technology
(MoT), Ministry of Industry & Information Technology (MIIT), and National Development &
Reform Commission (NDRC). The technological qualification standards (for maximum
speed, battery energy density, electrification consumption, etc.) have also been raised.
However, what’s new is that EV car models equipped with batteries of energy density
higher than 120Wh/kg will be subsidized at 1.1X the standard subsidy, thus granting
qualified companies 10% higher government subsidy than under the previous policy.
Exhibit 1: NEV passenger car subsidy to be cut by 20% in 2017 vs. 2016; technological qualification standards raised NEV passenger cars subsidy (RMB’000) and new technology requirements summary
Source: Ministry of Finance (MoF).
Exhibit 2 shows that, although the government has raised the bar on maximum electricity
consumption, almost all top-selling EV models meet this requirement.
Exhibit 2: Almost all top-selling EV models can meet electricity consumption requirements Maximum electricity consumption requirement for different EV models with different levels of
vehicle weight
Source: MoF, Autohome.com, Gao Hua Securities Research.
Passenger cars-Subsidy (Rmb '000) 2016 2017-old 2017-new Chg New technology requirementsNEV Type Mileage under EV mode (km)
100≤R<150 25 20 20 0% 1. Maximum speed within 30 mins should be no less than 100km/h
150≤R<250 45 36 36 0%2. Battery energy density should be no less than 90Wh/kg, and 1.1X subsidy is granted for those higher than 120Wh/kg
R≥250 55 44 44 0%3. Electricity consumption per 100km should be lower than maximum levels for different vehicle weights
PHEV R≥50 30 24 24 0%Electricity consumption per 100km: 1) mileage≥80km: same to EV; 2) mileage<80km: fuel consumption (excl. electricity consumption) should be less than 70% of national fuel consumption standard
Maximum Local government subsidy N/A N/A0.5X of central
subsidy
EV
0
5
10
15
20
25
30
0 500 1000 1500 2000 2500
BYD e6
BYD e5
BYD Qin EVBAIC EV seriesBAIC EU series
BAIC EX series
JAC iEV6SJAC iEV
DenzaGeely Emgrand EV
Changan Eado
Roewe E50
Chery eQ
BMW i3
Zoyte 100
BAIC ES210
Tesla Model S
DF‐Nissan Venucia
Vehicle weight (kg)
Electricity consumption (kWh/100km)
m<=1000kg, Y<=0.014*m + 0.5
1000<m<=1600kg, Y<=0.012*m + 2.5
m>1600kg, Y<=0.005*m + 13.7

January 13, 2017 BYD Co. (1211.HK)
Goldman Sachs Global Investment Research 4
NEV Bus: maximum subsidy from central government to be
reduced by 25%-70% vs. previous proposal
Exhibit 3 shows that the new scheme will subsidize NEV bus makers/buyers according to
the battery size installed, with adjustments based on technology performance (battery
energy density, mileage, fast charge ratio, etc.). While we believe the new system will favor
the technology leaders in the bus sector due to the rising technology requirement, we also
foresee the NEV bus segment will be hurt the most due to the sharp decline in government
subsidy.
Exhibit 3: New subsidy scheme introduced to subsidize NEV bus makers/buyers according to battery size installed, with
adjustments based on technology performance NEV bus subsidy (RMB’000) and new technology requirements summary
Note: subsidy = battery size (kWh) X subsidy per unit of battery size (RMB/kWh) X adjustment factors (adjustment factors=system energy density/fast
charge ratio/fuel-saving rate).
Source: MoF.
In 2017, the maximum NEV bus subsidy from the central government will be cut by 25%-
70% vs. the previous version.
Exhibit 4: Central government subsidy for NEV bus to be cut by 25%-70%, much higher
than the expected 20%.
NEV bus subsidy (RMB’000) summary
Source: MoF.
If we include local government subsidy, the total subsidy per bus reduces further. Taking
BYD K9 bus (with length >10 meter) as an example, the previous plan was to cut the
maximum total subsidy from RMB 1mn in 2016 (RMB 500K each from central and local
Central government
subsidy
6<L≤8m 8<L≤10m L>10m
85-95 95-115 115+
0.8 1 1.2
3C-5C 5C-15C 15C+
0.8 1 1.4
40%-45% 45%-60% 60%+
0.8 1 1.2
Adjustment factors
Maxmium central government subsidy per vehicle
(RMB'000)Vehicle type
(RMB/kWh)
Local government
subsidy
Non-fast charging EV bus
1800
System energy density (Wh/kg)
90 200 300
Less than 0.5X of central
government subsidy
Fast charging EV bus
3000
Fast charge ratio
60 120 200
PHEV bus 3000
Fuel-saving rate
45 90 150
New technology requirements
1. Energy consumption per unit carriage (Ekg) should be lower than 0.24Wh/km·kg
2. EV bus mileage should be higher than 200km
3. Battery systems total weight should be lower than 20% of vehicle weight
4. Battery energy density of non-fast charging EV bus should be higher than 85Wh/kg, fast charge ratio of fast charging EV bus should be higher than 3C, and fuel-saving rate of PHEV bus should be higher than 40%
Bus-Maximum subsidy (Rmb'000) 2016 2017-old 2017-new ChgNEV Bus type Length (m)
6<L≤8 250 200 90 -55%
8<L≤10 400 320 200 -38%
L>10 500 400 300 -25%
6<L≤8 250 200 60 -70%
8<L≤10 400 320 120 -63%
L>10 500 400 200 -50%
6<L≤8 125 100 45 -55%
8<L≤10 200 160 90 -44%
L>10 250 200 150 -25%
Fast charging EV bus
PHEV bus
Non-fast charging EV bus
January 13, 2017 BYD Co. (1211.HK)
Goldman Sachs Global Investment Research 5
governments) by 20% to RMB 800k in 2017 (RMB 400K each from central and local
governments); under the new scheme however, the maximum subsidy in 2017 would be
RMB 450K (RMB 300k/150k from central/local government respectively), representing a 55%
decrease vs. 2016 and a 44% decrease vs. previous 2017 subsidy plan.
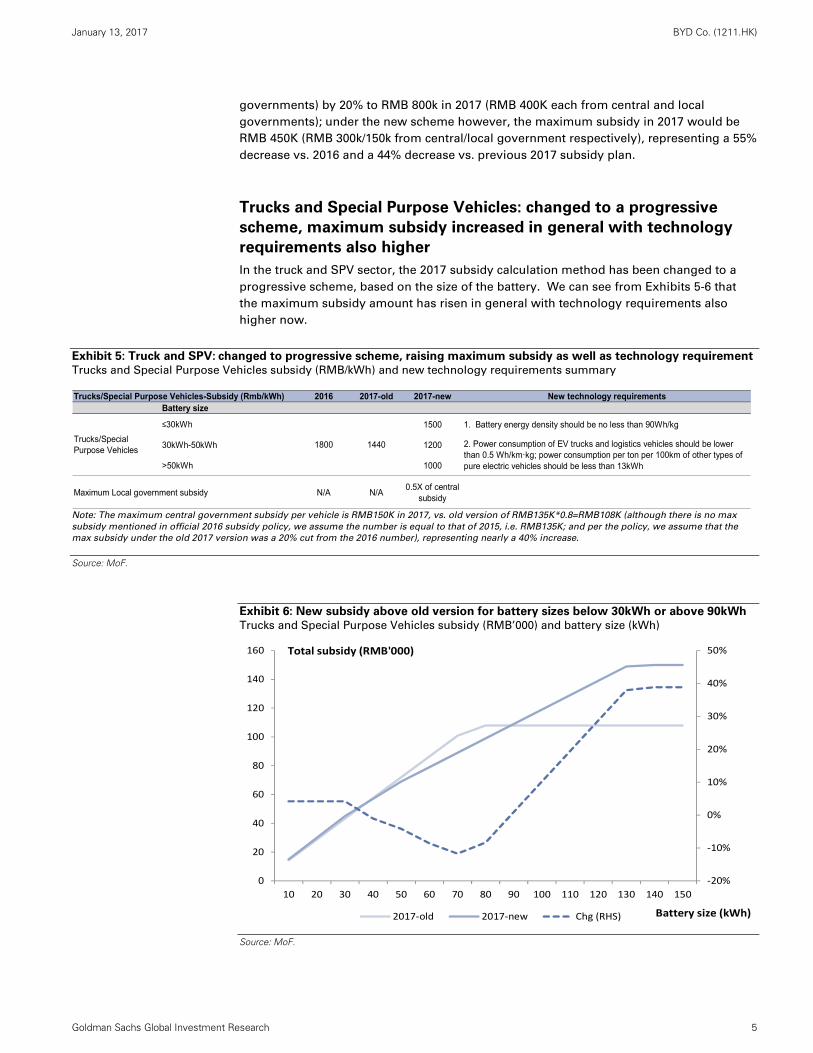
Trucks and Special Purpose Vehicles: changed to a progressive
scheme, maximum subsidy increased in general with technology
requirements also higher
In the truck and SPV sector, the 2017 subsidy calculation method has been changed to a
progressive scheme, based on the size of the battery. We can see from Exhibits 5-6 that
the maximum subsidy amount has risen in general with technology requirements also
higher now.
Exhibit 5: Truck and SPV: changed to progressive scheme, raising maximum subsidy as well as technology requirement
Trucks and Special Purpose Vehicles subsidy (RMB/kWh) and new technology requirements summary
Note: The maximum central government subsidy per vehicle is RMB150K in 2017, vs. old version of RMB135K*0.8=RMB108K (although there is no max
subsidy mentioned in official 2016 subsidy policy, we assume the number is equal to that of 2015, i.e. RMB135K; and per the policy, we assume that the
max subsidy under the old 2017 version was a 20% cut from the 2016 number), representing nearly a 40% increase.
Source: MoF.
Exhibit 6: New subsidy above old version for battery sizes below 30kWh or above 90kWh
Trucks and Special Purpose Vehicles subsidy (RMB’000) and battery size (kWh)
Source: MoF.
Trucks/Special Purpose Vehicles-Subsidy (Rmb/kWh) 2016 2017-old 2017-new New technology requirementsBattery size
≤30kWh 1500 1. Battery energy density should be no less than 90Wh/kg
30kWh-50kWh 1200
>50kWh 1000
Maximum Local government subsidy N/A N/A0.5X of central
subsidy
Trucks/Special Purpose Vehicles
2. Power consumption of EV trucks and logistics vehicles should be lower than 0.5 Wh/km·kg; power consumption per ton per 100km of other types of pure electric vehicles should be less than 13kWh
1800 1440
‐20%
‐10%
0%
10%
20%
30%
40%
50%
0
20
40
60
80
100
120
140
160
10 20 30 40 50 60 70 80 90 100 110 120 130 140 150
2017‐old 2017‐new Chg (RHS)
Total subsidy (RMB'000)
Battery size (kWh)

January 13, 2017 BYD Co. (1211.HK)
Goldman Sachs Global Investment Research 6
Meanwhile, we expect electric logistics trucks to shift up a gear with the rising maximum
subsidy amount as well as increasing number of qualified models. On December 29, 2016,
the MIIT announced the fifth batch of qualified NEV models, and 181 out of total 498
qualified models are electric logistics truck models.
Exhibit 7: We see that an increasing number of electric logistics truck models have
qualified for NEV subsidy and are included in the latest NEV models promotion catalog Mix of different NEV types, first five batches of NEV models promotion catalog
Source: Ministry of Industry and Information Technology (MIIT).
Fuel cell vehicles: subsidy remains unchanged, technology
requirement raised
Exhibit 8: The maximum subsidy amount remains the same for fuel cell vehicles, with technology requirements rising
Fuel cell vehicles subsidy (RMB’000) and new technology requirements summary
Source: MoF.
244 181
898
371 289
124 63 28
0%
10%
20%
30%
40%
50%
60%
70%
80%
90%
100%
First three batchs 4th batch 5th batch
Trucks and Special Purpose Vehicles NEV bus NEV passenger car
Fuel cell vehicles-Subsidy (Rmb '000) 2016 2017-old 2017-new Chg New technology requirements
Passenger car 200 200 200 0% 1. Mileage should be no less than 300km
Small 300 300 300 0%
Medium/Big 500 500 500 0%
Maximum Local government subsidy N/A N/A0.5X of central
subsidy
2. Rated power of fuel cell systems should be higher than 30% of that of drive motor (and no less than 30KW); fuel cell vehicles with rated power between 10kW and 3kW are subsidized by RMB6000/kW
Bus & Freigt wagon

January 13, 2017 BYD Co. (1211.HK)
Goldman Sachs Global Investment Research 7
OPM likely to decline; we lower 2017E-19E EPS by 15%/9%/9%
We lower our 2017-19 EPS estimates by 15%/9%/9%, respectively,
mainly due to the decline in NEV subsidy
Exhibit 9: Summary of earnings estimate changes
Source: Gao Hua Securities Research.
NEV bus OPM to decline 9.5 percentage points in 2017E vs. 2016E
on lower subsidies
In Exhibit 10 we estimate that BYD K9 OPM will decline from 25% in 2016E to 15.5% in
2017E based on the following assumptions:
BYD is unable to pass on the subsidy decline to bus buyers (i.e., it is unable to
increase the selling price);
There is a 38% reduction in the battery size installed per BYD bus, from current
324KWh (can ran ~300km per charge) to 200KWh, to meet the minimum 200km
mileage requirement;
15% battery cost saving and 10% other cost saving in 2017E vs. 2016E due to
economies of scale.
As a result, we forecast BYD’s NEV bus OPM will decline from 25.7% to 16.2%, and its
blended OPM for the overall auto business (NEV bus and car, plus ICE car) will decline from
12.0% in 2016E to 10.6% in 2017E.
(Rmb mn) New Old Diff. New Old Diff. New Old Diff. New Old Diff.
Revenue 101,672 101,229 0% 115,853 129,867 ‐11% 137,286 156,997 ‐13% 152,879 179,060 ‐15%
Gross profit 25,547 25,435 0% 28,241 31,657 ‐11% 32,779 37,956 ‐14% 35,585 43,559 ‐18%
EBIT 8,382 8,322 1% 8,929 10,260 ‐13% 10,234 12,718 ‐20% 10,787 15,010 ‐28%
Pretax profit 6,756 6,694 1% 7,639 8,925 ‐14% 10,376 11,488 ‐10% 12,477 13,955 ‐11%
Reported net profit 5,171 5,121 1% 5,802 6,814 ‐15% 7,948 8,741 ‐9% 9,557 10,547 ‐9%
Reported EPS (Rmb) 2.00 1.98 1% 2.13 2.50 ‐15% 2.91 3.20 ‐9% 3.50 3.87 ‐9%
2019E2018E2016E 2017E
January 13, 2017 BYD Co. (1211.HK)
Goldman Sachs Global Investment Research 8
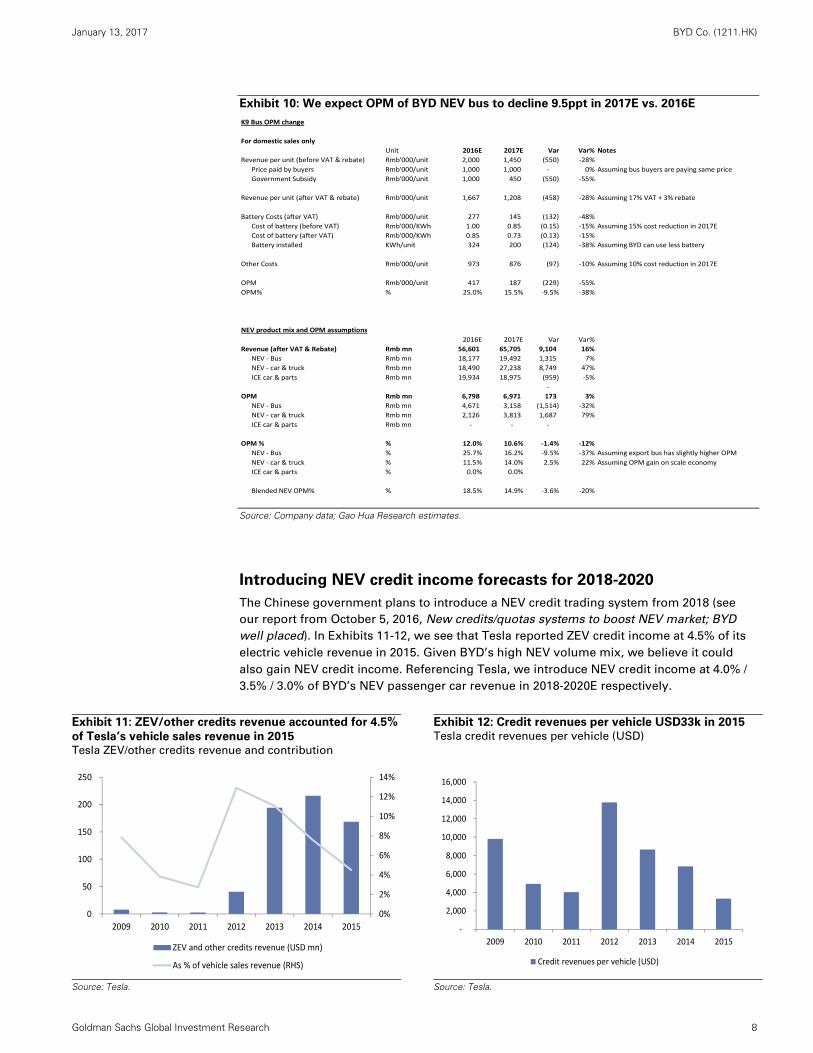
Exhibit 10: We expect OPM of BYD NEV bus to decline 9.5ppt in 2017E vs. 2016E
Source: Company data; Gao Hua Research estimates.
Introducing NEV credit income forecasts for 2018-2020
The Chinese government plans to introduce a NEV credit trading system from 2018 (see
our report from October 5, 2016, New credits/quotas systems to boost NEV market; BYD
well placed). In Exhibits 11-12, we see that Tesla reported ZEV credit income at 4.5% of its
electric vehicle revenue in 2015. Given BYD’s high NEV volume mix, we believe it could
also gain NEV credit income. Referencing Tesla, we introduce NEV credit income at 4.0% /
3.5% / 3.0% of BYD’s NEV passenger car revenue in 2018-2020E respectively.
Exhibit 11: ZEV/other credits revenue accounted for 4.5%
of Tesla’s vehicle sales revenue in 2015 Tesla ZEV/other credits revenue and contribution
Exhibit 12: Credit revenues per vehicle USD33k in 2015
Tesla credit revenues per vehicle (USD)
Source: Tesla.
Source: Tesla.
K9 Bus OPM change
For domestic sales only
Unit 2016E 2017E Var Var% Notes
Revenue per unit (before VAT & rebate) Rmb'000/unit 2,000 1,450 (550) ‐28%
Price paid by buyers Rmb'000/unit 1,000 1,000 ‐ 0% Assuming bus buyers are paying same price
Government Subsidy Rmb'000/unit 1,000 450 (550) ‐55%
Revenue per unit (after VAT & rebate) Rmb'000/unit 1,667 1,208 (458) ‐28% Assuming 17% VAT + 3% rebate
Battery Costs (after VAT) Rmb'000/unit 277 145 (132) ‐48%
Cost of battery (before VAT) Rmb'000/KWh 1.00 0.85 (0.15) ‐15% Assuming 15% cost reduction in 2017E
Cost of battery (after VAT) Rmb'000/KWh 0.85 0.73 (0.13) ‐15%
Battery installed KWh/unit 324 200 (124) ‐38% Assuming BYD can use less battery
Other Costs Rmb'000/unit 973 876 (97) ‐10% Assuming 10% cost reduction in 2017E
OPM Rmb'000/unit 417 187 (229) ‐55%
OPM% % 25.0% 15.5% ‐9.5% ‐38%
NEV product mix and OPM assumptions
2016E 2017E Var Var%
Revenue (after VAT & Rebate) Rmb mn 56,601 65,705 9,104 16%
NEV ‐ Bus Rmb mn 18,177 19,492 1,315 7%
NEV ‐ car & truck Rmb mn 18,490 27,238 8,749 47%
ICE car & parts Rmb mn 19,934 18,975 (959) ‐5%
‐
OPM Rmb mn 6,798 6,971 173 3%
NEV ‐ Bus Rmb mn 4,671 3,158 (1,514) ‐32%
NEV ‐ car & truck Rmb mn 2,126 3,813 1,687 79%
ICE car & parts Rmb mn ‐ ‐ ‐
OPM % % 12.0% 10.6% ‐1.4% ‐12%
NEV ‐ Bus % 25.7% 16.2% ‐9.5% ‐37% Assuming export bus has slightly higher OPM
NEV ‐ car & truck % 11.5% 14.0% 2.5% 22% Assuming OPM gain on scale economy
ICE car & parts % 0.0% 0.0%
Blended NEV OPM% % 18.5% 14.9% ‐3.6% ‐20%
0%
2%
4%
6%
8%
10%
12%
14%
0
50
100
150
200
250
2009 2010 2011 2012 2013 2014 2015
ZEV and other credits revenue (USD mn)
As % of vehicle sales revenue (RHS)
‐
2,000
4,000
6,000
8,000
10,000
12,000
14,000
16,000
2009 2010 2011 2012 2013 2014 2015
Credit revenues per vehicle (USD)

January 13, 2017 BYD Co. (1211.HK)
Goldman Sachs Global Investment Research 9
We reduce our target price by 25%, downgrade to Neutral
Reflecting lowered earnings estimates, our 12-month target price falls to HK$44.52 (down
25% from HK$59.45), based on our sum-of-the-parts valuation methodology.
Exhibit 13: 12-month target price cut by 25%...
Summary of valuation changes
Exhibit 14: … primarily driven by EV valuation cut
Waterfall chart for BYD valuation changes
Source: Gao Hua Securities Research.
Source: Gao Hua Securities Research.
The 25% reduction in our target price for BYD is attributed mainly to the 22.5% decline in
NEV valuation, which is driven by lowered NEV volume (as a result of higher competition
mainly in the NEV car space) together with lower ASP and OPM (due to the decline in NEV
bus subsidy), partly offset by new estimates for NEV credit income starting 2018E.
Exhibit 15: Reduction in BYD NEV valuation mainly on lowered NEV volume/ASP/OPM, partly offset by new estimates
for NEV credit income starting 2018E
Source: Gao Hua Securities Research.
New valuation Previous valuation Var (%)
1. Handset components & assembly services 6.25 6.41 -2.5%
1.1 BYDE 5.05 5.18 -2.6%
1.2 Others 1.20 1.23 -2.5%
2. Automobiles-ICE 0.26 4.16 -93.6%
3. Automobiles-EV 41.48 53.51 -22.5%
4. Rechargeable batteries and others 5.03 5.09 -1.2%
4.1 Handset batteries 3.60 3.67 -2.0%
4.2 Storage batteries 1.42 1.41 0.6%
4.3 Solar power system - -
Total before Financing cost, MI and others 53.02 69.16 -23.3%
5. Financing cost MI and others (8.50) (9.71) -12.5%
5.1 MI - BYDE (1.77) (1.81) -2.6%
5.2 Other MI and Financing costs (6.73) (7.90) -14.8%
Total (HK$) 44.52 59.45 -25.1%
59.45
44.52
0.16 3.89
12.03
0.06 1.21
0
10
20
30
40
50
60
70
Previousvaluation
Handsetcomponents &
assembly services
Automobiles‐ICE Automobiles‐EV Rechargeablebatteries and
others
Financing cost MIand others
New valuation
NEV business DCF
Unit 2016E 2017E 2018E 2019E 2020E 2016E 2017E 2018E 2019E 2020E 2016E 2017E 2018E 2019E 2020E Note
NEV Volume (unit) Unit 111,357 168,875 223,913 294,048 359,636 115,607 196,125 264,050 319,059 396,483 ‐4% ‐14% ‐15% ‐8% ‐9% Lower Nev car sales estimation on higher competition
ASP (RMB) Rmb/unit 329,271 276,715 262,884 236,447 225,943 313,474 307,069 294,760 296,838 292,641 5% ‐10% ‐11% ‐20% ‐23% Higher NEV bus price erosion on subsidy decline
Total Revenue (RMB mn) Rmb mn 36,667 46,730 58,863 69,527 81,257 36,240 60,224 77,831 94,709 116,027 1% ‐22% ‐24% ‐27% ‐30%
OP Rmb mn 6,792 6,981 8,036 8,170 8,716 6,382 9,042 10,823 12,380 14,381 6% ‐23% ‐26% ‐34% ‐39% Lower bus subsidy partly offset by battery cost saving
OPM% % 18.5% 14.9% 13.7% 11.8% 10.7% 17.6% 15.0% 13.9% 13.1% 12.4%
NEV credit income (RMB mn) Rmb mn ‐ ‐ 1,316 1,355 1,301 ‐ ‐ ‐ ‐ ‐
as % of NEV car revenue % 0.0% 0.0% 4.0% 3.5% 3.0% 0.0% 0.0% 0.0% 0.0% 0.0% Newly introduced, with reference to Tesla
OP+Credit income (RMB mn) Rmb mn 6,792 6,981 9,351 9,524 10,017 6,382 9,042 10,823 12,380 14,381 6% ‐23% ‐14% ‐23% ‐30%
D&A as % of revenue % ‐5.1% ‐4.7% ‐4.2% ‐3.9% ‐3.7% ‐5.2% ‐4.4% ‐4.0% ‐3.8% ‐3.6%
D&A (RMB mn) Rmb mn 1,888 2,213 2,446 2,743 3,036 1,872 2,654 3,076 3,616 4,218 1% ‐17% ‐20% ‐24% ‐28%
Tax% % 17.5% 18.0% 18.5% 19.0% 19.5% 17.5% 18.5% 19.5% 20.5% 20.5%
Net Income (RMB mn) Rmb mn 5,602 5,723 7,619 7,713 8,062 5,264 7,368 8,710 9,840 11,430 6% ‐22% ‐13% ‐22% ‐29%
As % of total company % 108% 99% 90% 76% 67% 103% 108% 100% 93% 88%
Share count (mn shares) mn share 2,724 2,725 2,726 2,727 2,728 2,724 2,725 2,726 2,727 2,728 0% 0% 0% 0% 0%
EPS (RMB/share) Rmb/share 2.053 2.098 2.793 2.827 2.955 1.929 2.701 3.193 3.607 4.190 6% ‐22% ‐13% ‐22% ‐29%
EV business DCF
Cash inflow per year (OPM after Tax + D&A) Rmb mn 7,490 7,936 10,065 10,456 11,098 7,136 10,022 11,787 13,455 15,649 5% ‐21% ‐15% ‐22% ‐29%
Cash outflow per year (CAPEX) Rmb mn (7,625) (6,082) (5,663) (6,306) (6,356) (7,592) (7,792) (7,654) (8,729) (9,255) 0% ‐22% ‐26% ‐28% ‐31%
Discount factor X ‐ 1.00 1.09 1.18 1.29 1.00 1.09 1.18 1.29 1.40
Discount year year ‐ 1.00 2.00 3.00 4.00 ‐ 1.00 2.00 3.00 4.00
DCF Rmb mn (135) 1,705 3,724 3,228 3,392 (456) 2,051 3,496 3,676 4,574 ‐70% ‐17% 7% ‐12% ‐26%
Sum DCF Rmb mn 98,399 126,933 ‐22%
Valuation per share HK$ 41.48 53.51 ‐22%
New estimation Previous estimation Var%
January 13, 2017 BYD Co. (1211.HK)
Goldman Sachs Global Investment Research 10
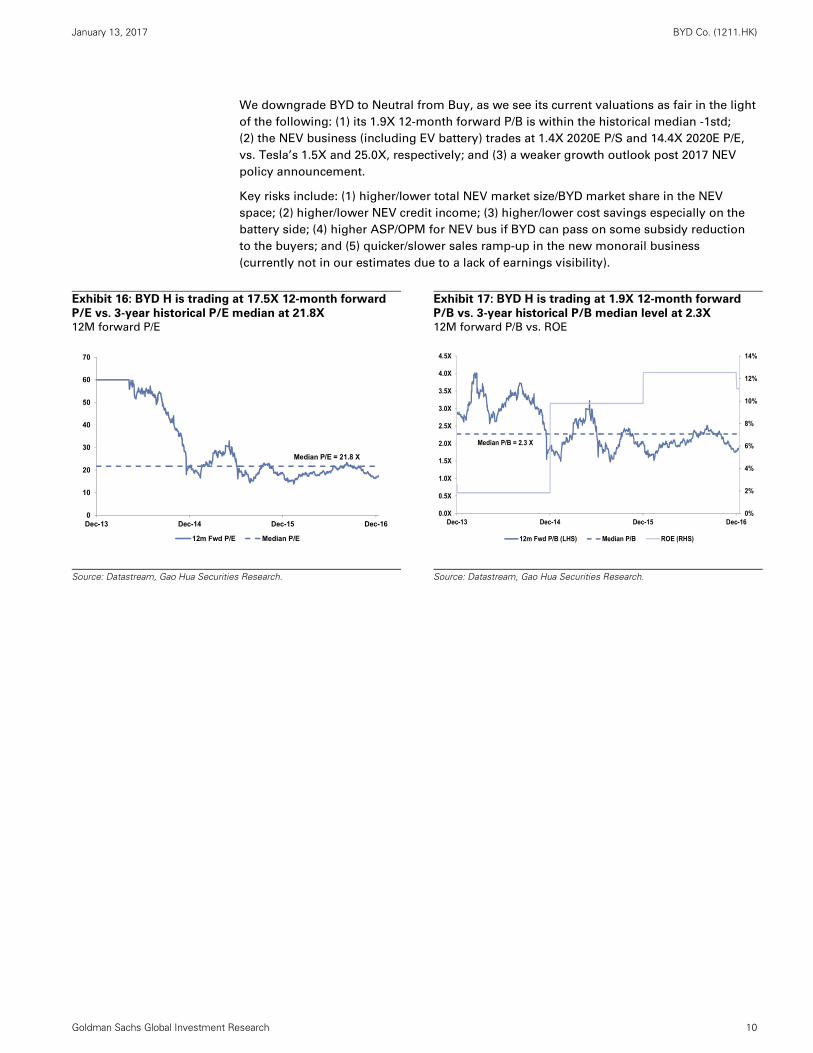
We downgrade BYD to Neutral from Buy, as we see its current valuations as fair in the light
of the following: (1) its 1.9X 12-month forward P/B is within the historical median -1std;
(2) the NEV business (including EV battery) trades at 1.4X 2020E P/S and 14.4X 2020E P/E,
vs. Tesla’s 1.5X and 25.0X, respectively; and (3) a weaker growth outlook post 2017 NEV
policy announcement.
Key risks include: (1) higher/lower total NEV market size/BYD market share in the NEV
space; (2) higher/lower NEV credit income; (3) higher/lower cost savings especially on the
battery side; (4) higher ASP/OPM for NEV bus if BYD can pass on some subsidy reduction
to the buyers; and (5) quicker/slower sales ramp-up in the new monorail business
(currently not in our estimates due to a lack of earnings visibility).
Exhibit 16: BYD H is trading at 17.5X 12-month forward
P/E vs. 3-year historical P/E median at 21.8X 12M forward P/E
Exhibit 17: BYD H is trading at 1.9X 12-month forward
P/B vs. 3-year historical P/B median level at 2.3X 12M forward P/B vs. ROE
Source: Datastream, Gao Hua Securities Research.
Source: Datastream, Gao Hua Securities Research.
0
10
20
30
40
50
60
70
Dec-13 Dec-14 Dec-15 Dec-16
12m Fwd P/E Median P/E
Median P/E = 21.8 X
0%
2%
4%
6%
8%
10%
12%
14%
0.0X
0.5X
1.0X
1.5X
2.0X
2.5X
3.0X
3.5X
4.0X
4.5X
Dec-13 Dec-14 Dec-15 Dec-16
12m Fwd P/B (LHS) Median P/B ROE (RHS)
Median P/B = 2.3 X
January 13, 2017 BYD Co. (1211.HK)
Goldman Sachs Global Investment Research 11
Disclosure Appendix
Reg AC
We, Yipeng Yang and Yuqian Ding, hereby certify that all of the views expressed in this report accurately reflect our personal views about the subject
company or companies and its or their securities. We also certify that no part of our compensation was, is or will be, directly or indirectly, related to
the specific recommendations or views expressed in this report.
Investment Profile
The Goldman Sachs Investment Profile provides investment context for a security by comparing key attributes of that security to its peer group and
market. The four key attributes depicted are: growth, returns, multiple and volatility. Growth, returns and multiple are indexed based on composites
of several methodologies to determine the stocks percentile ranking within the region's coverage universe.
The precise calculation of each metric may vary depending on the fiscal year, industry and region but the standard approach is as follows:
Growth is a composite of next year's estimate over current year's estimate, e.g. EPS, EBITDA, Revenue. Return is a year one prospective aggregate
of various return on capital measures, e.g. CROCI, ROACE, and ROE. Multiple is a composite of one-year forward valuation ratios, e.g. P/E, dividend
yield, EV/FCF, EV/EBITDA, EV/DACF, Price/Book. Volatility is measured as trailing twelve-month volatility adjusted for dividends.
Quantum
Quantum is Goldman Sachs' proprietary database providing access to detailed financial statement histories, forecasts and ratios. It can be used for
in-depth analysis of a single company, or to make comparisons between companies in different sectors and markets.
GS SUSTAIN
GS SUSTAIN is a global investment strategy aimed at long-term, long-only performance with a low turnover of ideas. The GS SUSTAIN focus list
includes leaders our analysis shows to be well positioned to deliver long term outperformance through sustained competitive advantage and
superior returns on capital relative to their global industry peers. Leaders are identified based on quantifiable analysis of three aspects of corporate
performance: cash return on cash invested, industry positioning and management quality (the effectiveness of companies' management of the
environmental, social and governance issues facing their industry).
Disclosures
Coverage group(s) of stocks by primary analyst(s)
Yipeng Yang: A-Share Autos, China Autos. Yuqian Ding: A-Share Autos, China Autos.
A-Share Autos: Anhui Jianghuai Automobile Co., Chongqing Changan Auto (A), FAW Car, Fuyao Glass Industry Group (A), Great Wall Motor Co.(A),
Huayu Automotive Systems, SAIC Motor, Weichai Power (A), Weifu High-Technology Group (A).
China Autos: Baoxin Auto Group, Brilliance China Automotive, BYD Co., China Harmony New Energy Auto, Dongfeng Motor, Fuyao Glass Industry
Group (H), Geely Automobile Holdings, Great Wall Motor Co. (H), Guangzhou Automobile Group, Minth Group, Nexteer Automotive Group, Sinotruk
(Hong Kong), Weichai Power (H), Zhengtong Auto Services Holdings, Zhongsheng Group.
Company-specific regulatory disclosures
The following disclosures relate to relationships between The Goldman Sachs Group, Inc. (with its affiliates, "Goldman Sachs") and companies
covered by the Global Investment Research Division of Goldman Sachs and referred to in this research.
Goldman Sachs has received compensation for investment banking services in the past 12 months: BYD Co. (HK$43.45)
Goldman Sachs expects to receive or intends to seek compensation for investment banking services in the next 3 months: BYD Co. (HK$43.45)
Goldman Sachs had an investment banking services client relationship during the past 12 months with: BYD Co. (HK$43.45)
Goldman Sachs had a non-securities services client relationship during the past 12 months with: BYD Co. (HK$43.45)
Goldman Sachs makes a market in the securities or derivatives thereof: BYD Co. (HK$43.45)
Distribution of ratings/investment banking relationships
Goldman Sachs Investment Research global Equity coverage universe
Rating Distribution Investment Banking Relationships
Buy Hold Sell Buy Hold Sell
Global 32% 54% 14% 64% 60% 51%
As of January 1, 2017, Goldman Sachs Global Investment Research had investment ratings on 2,902 equity securities. Goldman Sachs assigns stocks
as Buys and Sells on various regional Investment Lists; stocks not so assigned are deemed Neutral. Such assignments equate to Buy, Hold and Sell
for the purposes of the above disclosure required by the FINRA Rules. See 'Ratings, Coverage groups and views and related definitions' below. The
Investment Banking Relationships chart reflects the percentage of subject companies within each rating category for whom Goldman Sachs has
provided investment banking services within the previous twelve months.
January 13, 2017 BYD Co. (1211.HK)
Goldman Sachs Global Investment Research 12
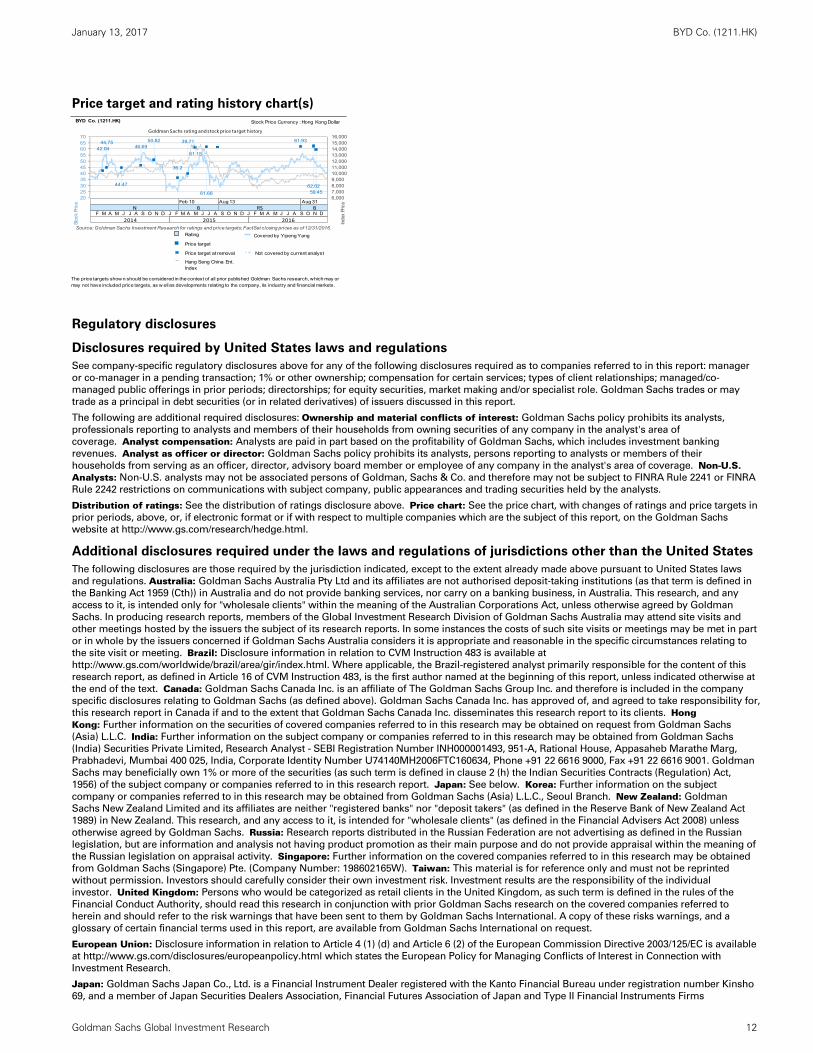
Price target and rating history chart(s)
Regulatory disclosures
Disclosures required by United States laws and regulations
See company-specific regulatory disclosures above for any of the following disclosures required as to companies referred to in this report: manager
or co-manager in a pending transaction; 1% or other ownership; compensation for certain services; types of client relationships; managed/co-
managed public offerings in prior periods; directorships; for equity securities, market making and/or specialist role. Goldman Sachs trades or may
trade as a principal in debt securities (or in related derivatives) of issuers discussed in this report.
The following are additional required disclosures: Ownership and material conflicts of interest: Goldman Sachs policy prohibits its analysts,
professionals reporting to analysts and members of their households from owning securities of any company in the analyst's area of
coverage. Analyst compensation: Analysts are paid in part based on the profitability of Goldman Sachs, which includes investment banking
revenues. Analyst as officer or director: Goldman Sachs policy prohibits its analysts, persons reporting to analysts or members of their
households from serving as an officer, director, advisory board member or employee of any company in the analyst's area of coverage. Non-U.S. Analysts: Non-U.S. analysts may not be associated persons of Goldman, Sachs & Co. and therefore may not be subject to FINRA Rule 2241 or FINRA
Rule 2242 restrictions on communications with subject company, public appearances and trading securities held by the analysts.
Distribution of ratings: See the distribution of ratings disclosure above. Price chart: See the price chart, with changes of ratings and price targets in
prior periods, above, or, if electronic format or if with respect to multiple companies which are the subject of this report, on the Goldman Sachs
website at http://www.gs.com/research/hedge.html.
Additional disclosures required under the laws and regulations of jurisdictions other than the United States
The following disclosures are those required by the jurisdiction indicated, except to the extent already made above pursuant to United States laws
and regulations. Australia: Goldman Sachs Australia Pty Ltd and its affiliates are not authorised deposit-taking institutions (as that term is defined in
the Banking Act 1959 (Cth)) in Australia and do not provide banking services, nor carry on a banking business, in Australia. This research, and any
access to it, is intended only for "wholesale clients" within the meaning of the Australian Corporations Act, unless otherwise agreed by Goldman
Sachs. In producing research reports, members of the Global Investment Research Division of Goldman Sachs Australia may attend site visits and
other meetings hosted by the issuers the subject of its research reports. In some instances the costs of such site visits or meetings may be met in part
or in whole by the issuers concerned if Goldman Sachs Australia considers it is appropriate and reasonable in the specific circumstances relating to
the site visit or meeting. Brazil: Disclosure information in relation to CVM Instruction 483 is available at
http://www.gs.com/worldwide/brazil/area/gir/index.html. Where applicable, the Brazil-registered analyst primarily responsible for the content of this
research report, as defined in Article 16 of CVM Instruction 483, is the first author named at the beginning of this report, unless indicated otherwise at
the end of the text. Canada: Goldman Sachs Canada Inc. is an affiliate of The Goldman Sachs Group Inc. and therefore is included in the company
specific disclosures relating to Goldman Sachs (as defined above). Goldman Sachs Canada Inc. has approved of, and agreed to take responsibility for,
this research report in Canada if and to the extent that Goldman Sachs Canada Inc. disseminates this research report to its clients. Hong Kong: Further information on the securities of covered companies referred to in this research may be obtained on request from Goldman Sachs
(Asia) L.L.C. India: Further information on the subject company or companies referred to in this research may be obtained from Goldman Sachs
(India) Securities Private Limited, Research Analyst - SEBI Registration Number INH000001493, 951-A, Rational House, Appasaheb Marathe Marg,
Prabhadevi, Mumbai 400 025, India, Corporate Identity Number U74140MH2006FTC160634, Phone +91 22 6616 9000, Fax +91 22 6616 9001. Goldman
Sachs may beneficially own 1% or more of the securities (as such term is defined in clause 2 (h) the Indian Securities Contracts (Regulation) Act,
1956) of the subject company or companies referred to in this research report. Japan: See below. Korea: Further information on the subject
company or companies referred to in this research may be obtained from Goldman Sachs (Asia) L.L.C., Seoul Branch. New Zealand: Goldman
Sachs New Zealand Limited and its affiliates are neither "registered banks" nor "deposit takers" (as defined in the Reserve Bank of New Zealand Act
1989) in New Zealand. This research, and any access to it, is intended for "wholesale clients" (as defined in the Financial Advisers Act 2008) unless
otherwise agreed by Goldman Sachs. Russia: Research reports distributed in the Russian Federation are not advertising as defined in the Russian
legislation, but are information and analysis not having product promotion as their main purpose and do not provide appraisal within the meaning of
the Russian legislation on appraisal activity. Singapore: Further information on the covered companies referred to in this research may be obtained
from Goldman Sachs (Singapore) Pte. (Company Number: 198602165W). Taiwan: This material is for reference only and must not be reprinted
without permission. Investors should carefully consider their own investment risk. Investment results are the responsibility of the individual
investor. United Kingdom: Persons who would be categorized as retail clients in the United Kingdom, as such term is defined in the rules of the
Financial Conduct Authority, should read this research in conjunction with prior Goldman Sachs research on the covered companies referred to
herein and should refer to the risk warnings that have been sent to them by Goldman Sachs International. A copy of these risks warnings, and a
glossary of certain financial terms used in this report, are available from Goldman Sachs International on request.
European Union: Disclosure information in relation to Article 4 (1) (d) and Article 6 (2) of the European Commission Directive 2003/125/EC is available
at http://www.gs.com/disclosures/europeanpolicy.html which states the European Policy for Managing Conflicts of Interest in Connection with
Investment Research.
Japan: Goldman Sachs Japan Co., Ltd. is a Financial Instrument Dealer registered with the Kanto Financial Bureau under registration number Kinsho
69, and a member of Japan Securities Dealers Association, Financial Futures Association of Japan and Type II Financial Instruments Firms
42.0444.75
44.47
46.6950.82
36.2
39.71
61.15
61.66
61.93
62.0259.45
6,0007,0008,0009,00010,00011,00012,00013,00014,00015,00016,000
2025303540455055606570
BYD Co. (1211.HK)
Goldman Sachs rating and stock price target history
Stock Price Currency : Hong Kong Dollar
Source: Goldman Sachs Investment Research for ratings and price targets; FactSet closing prices as of 12/31/2016.
The price targets show n should be considered in the context of all prior published Goldman Sachs research, which may or may not have included price targets, as w ell as developments relating to the company, its industry and financial markets.
Rating
Price target
Price target at removal
Covered by Yipeng Yang
Not covered by current analyst
Hang Seng China Ent. Index
Inde
xPr
ice
Sto
ckPr
ice Feb 10 Aug 13 Aug 31
N B RSF
BM A M J J A S O N D J F M A M J J A S O N D J F M A M J J A S O N D
2014 2015 2016
January 13, 2017 BYD Co. (1211.HK)
Goldman Sachs Global Investment Research 13
Association. Sales and purchase of equities are subject to commission pre-determined with clients plus consumption tax. See company-specific
disclosures as to any applicable disclosures required by Japanese stock exchanges, the Japanese Securities Dealers Association or the Japanese
Securities Finance Company.
Ratings, coverage groups and views and related definitions
Buy (B), Neutral (N), Sell (S) -Analysts recommend stocks as Buys or Sells for inclusion on various regional Investment Lists. Being assigned a Buy
or Sell on an Investment List is determined by a stock's return potential relative to its coverage group as described below. Any stock not assigned as
a Buy or a Sell on an Investment List is deemed Neutral. Each regional Investment Review Committee manages various regional Investment Lists to a
global guideline of 25%-35% of stocks as Buy and 10%-15% of stocks as Sell; however, the distribution of Buys and Sells in any particular coverage
group may vary as determined by the regional Investment Review Committee. Regional Conviction Buy and Sell lists represent investment
recommendations focused on either the size of the potential return or the likelihood of the realization of the return.
Return potential represents the price differential between the current share price and the price target expected during the time horizon associated
with the price target. Price targets are required for all covered stocks. The return potential, price target and associated time horizon are stated in each
report adding or reiterating an Investment List membership.
Coverage groups and views: A list of all stocks in each coverage group is available by primary analyst, stock and coverage group at
http://www.gs.com/research/hedge.html. The analyst assigns one of the following coverage views which represents the analyst's investment outlook
on the coverage group relative to the group's historical fundamentals and/or valuation. Attractive (A). The investment outlook over the following 12
months is favorable relative to the coverage group's historical fundamentals and/or valuation. Neutral (N). The investment outlook over the
following 12 months is neutral relative to the coverage group's historical fundamentals and/or valuation. Cautious (C). The investment outlook over
the following 12 months is unfavorable relative to the coverage group's historical fundamentals and/or valuation.
Not Rated (NR). The investment rating and target price have been removed pursuant to Goldman Sachs policy when Goldman Sachs is acting in an
advisory capacity in a merger or strategic transaction involving this company and in certain other circumstances. Rating Suspended (RS). Goldman
Sachs Research has suspended the investment rating and price target for this stock, because there is not a sufficient fundamental basis for
determining, or there are legal, regulatory or policy constraints around publishing, an investment rating or target. The previous investment rating and
price target, if any, are no longer in effect for this stock and should not be relied upon. Coverage Suspended (CS). Goldman Sachs has suspended
coverage of this company. Not Covered (NC). Goldman Sachs does not cover this company. Not Available or Not Applicable (NA). The
information is not available for display or is not applicable. Not Meaningful (NM). The information is not meaningful and is therefore excluded.
Global product; distributing entities
The Global Investment Research Division of Goldman Sachs produces and distributes research products for clients of Goldman Sachs on a global
basis. Analysts based in Goldman Sachs offices around the world produce equity research on industries and companies, and research on
macroeconomics, currencies, commodities and portfolio strategy. This research is disseminated in Australia by Goldman Sachs Australia Pty Ltd
(ABN 21 006 797 897); in Brazil by Goldman Sachs do Brasil Corretora de Títulos e Valores Mobiliários S.A.; in Canada by either Goldman Sachs
Canada Inc. or Goldman, Sachs & Co.; in Hong Kong by Goldman Sachs (Asia) L.L.C.; in India by Goldman Sachs (India) Securities Private Ltd.; in
Japan by Goldman Sachs Japan Co., Ltd.; in the Republic of Korea by Goldman Sachs (Asia) L.L.C., Seoul Branch; in New Zealand by Goldman Sachs
New Zealand Limited; in Russia by OOO Goldman Sachs; in Singapore by Goldman Sachs (Singapore) Pte. (Company Number: 198602165W); and in
the United States of America by Goldman, Sachs & Co. Goldman Sachs International has approved this research in connection with its distribution in
the United Kingdom and European Union.
European Union: Goldman Sachs International authorised by the Prudential Regulation Authority and regulated by the Financial Conduct Authority
and the Prudential Regulation Authority, has approved this research in connection with its distribution in the European Union and United Kingdom;
Goldman Sachs AG and Goldman Sachs International Zweigniederlassung Frankfurt, regulated by the Bundesanstalt für
Finanzdienstleistungsaufsicht, may also distribute research in Germany.
General disclosures
This research is for our clients only. Other than disclosures relating to Goldman Sachs, this research is based on current public information that we
consider reliable, but we do not represent it is accurate or complete, and it should not be relied on as such. The information, opinions, estimates and
forecasts contained herein are as of the date hereof and are subject to change without prior notification. We seek to update our research as
appropriate, but various regulations may prevent us from doing so. Other than certain industry reports published on a periodic basis, the large
majority of reports are published at irregular intervals as appropriate in the analyst's judgment.
Goldman Sachs conducts a global full-service, integrated investment banking, investment management, and brokerage business. We have
investment banking and other business relationships with a substantial percentage of the companies covered by our Global Investment Research
Division. Goldman, Sachs & Co., the United States broker dealer, is a member of SIPC (http://www.sipc.org).
Our salespeople, traders, and other professionals may provide oral or written market commentary or trading strategies to our clients and principal
trading desks that reflect opinions that are contrary to the opinions expressed in this research. Our asset management area, principal trading desks
and investing businesses may make investment decisions that are inconsistent with the recommendations or views expressed in this research.
The analysts named in this report may have from time to time discussed with our clients, including Goldman Sachs salespersons and traders, or may
discuss in this report, trading strategies that reference catalysts or events that may have a near-term impact on the market price of the equity
securities discussed in this report, which impact may be directionally counter to the analyst's published price target expectations for such stocks. Any
such trading strategies are distinct from and do not affect the analyst's fundamental equity rating for such stocks, which rating reflects a stock's
return potential relative to its coverage group as described herein.
We and our affiliates, officers, directors, and employees, excluding equity and credit analysts, will from time to time have long or short positions in,
act as principal in, and buy or sell, the securities or derivatives, if any, referred to in this research.
The views attributed to third party presenters at Goldman Sachs arranged conferences, including individuals from other parts of Goldman Sachs, do
not necessarily reflect those of Global Investment Research and are not an official view of Goldman Sachs.
Any third party referenced herein, including any salespeople, traders and other professionals or members of their household, may have positions in
the products mentioned that are inconsistent with the views expressed by analysts named in this report.
This research is not an offer to sell or the solicitation of an offer to buy any security in any jurisdiction where such an offer or solicitation would be
illegal. It does not constitute a personal recommendation or take into account the particular investment objectives, financial situations, or needs of
individual clients. Clients should consider whether any advice or recommendation in this research is suitable for their particular circumstances and, if
appropriate, seek professional advice, including tax advice. The price and value of investments referred to in this research and the income from them

January 13, 2017 BYD Co. (1211.HK)
Goldman Sachs Global Investment Research 14
may fluctuate. Past performance is not a guide to future performance, future returns are not guaranteed, and a loss of original capital may occur.
Fluctuations in exchange rates could have adverse effects on the value or price of, or income derived from, certain investments.
Certain transactions, including those involving futures, options, and other derivatives, give rise to substantial risk and are not suitable for all investors.
Investors should review current options disclosure documents which are available from Goldman Sachs sales representatives or at
http://www.theocc.com/about/publications/character-risks.jsp. Transaction costs may be significant in option strategies calling for multiple purchase
and sales of options such as spreads. Supporting documentation will be supplied upon request.
All research reports are disseminated and available to all clients simultaneously through electronic publication to our internal client websites. Not all
research content is redistributed to our clients or available to third-party aggregators, nor is Goldman Sachs responsible for the redistribution of our
research by third party aggregators. For research, models or other data available on a particular security, please contact your sales representative or
go to http://360.gs.com.
Disclosure information is also available at http://www.gs.com/research/hedge.html or from Research Compliance, 200 West Street, New York, NY
10282.
© 2017 Goldman Sachs.
No part of this material may be (i) copied, photocopied or duplicated in any form by any means or (ii) redistributed without the prior written consent of The Goldman Sachs Group, Inc.