SUBSCRIBE NOW AND RECEIVE CRISIS AND .... A study by Tammy O. Tengs and others has become a widely...
17
Subscribe to The Independent Review and receive a free book of your choice* such as the 25th Anniversary Edition of Crisis and Leviathan: Critical Episodes in the Growth of American Government, by Founding Editor Robert Higgs. This quarterly journal, guided by co-editors Christopher J. Coyne, and Michael C. Munger, and Robert M. Whaples offers leading-edge insights on today’s most critical issues in economics, healthcare, education, law, history, political science, philosophy, and sociology. Thought-provoking and educational, The Independent Review is blazing the way toward informed debate! Student? Educator? Journalist? Business or civic leader? Engaged citizen? This journal is for YOU! INDEPENDENT INSTITUTE, 100 SWAN WAY, OAKLAND, CA 94621 • 800-927-8733 • [email protected] PROMO CODE IRA1703 SUBSCRIBE NOW AND RECEIVE CRISIS AND LEVIATHAN* FREE! * Order today for more FREE book options Perfect for students or anyone on the go! The Independent Review is available on mobile devices or tablets: iOS devices, Amazon Kindle Fire, or Android through Magzter. “The Independent Review does not accept pronouncements of government officials nor the conventional wisdom at face value.” —JOHN R. MACARTHUR, Publisher, Harper’s “The Independent Review is excellent.” —GARY BECKER, Noble Laureate in Economic Sciences
Transcript of SUBSCRIBE NOW AND RECEIVE CRISIS AND .... A study by Tammy O. Tengs and others has become a widely...

Subscribe to The Independent Review and receive a free book of your choice* such as the 25th Anniversary Edition of Crisis and Leviathan: Critical Episodes in the Growth of American Government, by Founding Editor Robert Higgs. This quarterly journal, guided by co-editors Christopher J. Coyne, and Michael C. Munger, and Robert M. Whaples offers leading-edge insights on today’s most critical issues in economics, healthcare, education, law, history, political science, philosophy, and sociology.
Thought-provoking and educational, The Independent Review is blazing the way toward informed debate!
Student? Educator? Journalist? Business or civic leader? Engaged citizen? This journal is for YOU!
INDEPENDENT INSTITUTE, 100 SWAN WAY, OAKLAND, CA 94621 • 800-927-8733 • [email protected] PROMO CODE IRA1703
SUBSCRIBE NOW AND RECEIVE CRISIS AND LEVIATHAN* FREE!
*Order today for more FREE book options
Perfect for students or anyone on the go! The Independent Review is available on mobile devices or tablets: iOS devices, Amazon Kindle Fire, or Android through Magzter.
“The Independent Review does not accept pronouncements of government officials nor the conventional wisdom at face value.”—JOHN R. MACARTHUR, Publisher, Harper’s
“The Independent Review is excellent.”—GARY BECKER, Noble Laureate in Economic Sciences

65
Craig S. Marxsen is an associate professor of economics at the University of Nebraska, Kearney.
The Independent Review, v.V, n.1, Summer 2000, ISSN 1086-1653, Copyright © 2000, pp. 65–80
The EnvironmentalPropaganda Agency
—————— ✦ ——————
CRAIG S. MARXSEN
In 1990 the U.S. Environmental Protection Agency (EPA) published Environ-mental Investments: The Cost of a Clean Environment. That work became themost widely cited source of compliance-cost data used in studies reported in
economic journals. An impressed Congress, in the 1990 revision of the Clean AirAct, required the EPA to conduct a thorough cost-benefit analysis of its clean air re-quirements imposed since 1970. Finally, in October 1997, the EPA submitted toCongress The Benefits and Costs of the Clean Air Act, 1970 to 1990. (The wholestudy has been published on the Internet.) Although the EPA acknowledges that ithas imposed clean-air-compliance costs totaling $523 billion from 1970 to 1990, itclaims that its rules have produced benefits worth $22.2 trillion (measured in dol-lars of 1990 purchasing power). For comparison, the U.S. Department of Com-merce estimates that in the early 1990s all U.S. fixed reproducible tangible wealthtotaled less than $20 trillion.
To estimate the benefits and costs of the Clean Air Act, the EPA comparedthe differences in economic, health, and environmental outcomes under two alter-native scenarios: a “control scenario” and a “no-control scenario” (U.S. Environ-mental Protection Agency [U.S. EPA] 1997, ES-1). The “control scenario” isbased on actual historical data. The “no-control scenario” is the EPA’s hypotheti-cal description of what the United States would have experienced had no air-pol-lution controls been established beyond those in place prior to enactment of the1970 amendments (ES-1). The EPA claims to have, by 1990, eliminated 99 per-cent of lead emissions. It also claims to have effected reductions of 40 percent in

THE INDEPENDENT REVIEW
66 ✦ CRAIG S. MARXSEN
average atmospheric levels of sulfur dioxide, 30 percent in nitrogen oxides, 50percent in carbon monoxide, and 15 percent in ground-level ozone (ES-3). The“control scenario” involves reduced “acid rain,” a 45 percent reduction in totalsuspended particulate matter, and a 45 percent reduction in smaller particles(PM10 and PM2.5) (ES-4). The particulate matter is the most important pollut-ant in the EPA’s benefit assessment.
The costs of the Clean Air Act include expenditures due to requirements to install,operate, and maintain pollution-abatement equipment, costs incurred in monitoringand reporting regulatory compliance, and other costs of maintaining the regulatory bu-reaucracy. Many of these costs showed up as higher prices for goods and services. Thebenefits of the Clean Air Act were estimated by aggregating a dollar-value estimate ofthe entire harm that would have been done by the greater levels of air pollution thatwould have occurred in the “no-control scenario.” The EPA concluded that many pre-mature deaths would have resulted from the air pollution. Other projected health prob-lems included chronic bronchitis, hypertension, hospital admissions, respiratory-relatedsymptoms, restricted activity, decreased productivity of workers, soiling damage, lostvisibility, and agricultural output reductions (U.S. EPA 1997, ES-7). The EPA esti-mated dollar values for each of the negative effects and concluded that total monetizedbenefits ranged between $5.6 trillion and $49.4 trillion, with a central estimate of $22.2trillion, whereas EPA-estimated costs were $0.5 trillion (ES-8). When the EPA’s Sci-ence Advisory Board criticized the study, the EPA prepared an alternative estimate usinga modified methodology and reported benefits ranging between $4.8 trillion and $28.7trillion, with a central estimate of $14.3 trillion (ES-9).
The EPA’s conclusions: “First and foremost, these results indicate that the ben-efits of the Clean Air Act and associated control programs substantially exceededcosts.” The EPA has produced such a large benefit estimate that it goes on to claim,“Even considering the large number of important uncertainties permeating each stepof the analysis, it is extremely unlikely that the converse could be true” (U.S. EPA1997, ES-9). The EPA, therefore, has produced a cost-benefit study that, if true,should forever silence opponents who contend that our air-pollution regulations havecost more than they were worth.
But the truth has eluded the authors of the EPA report. Their study actually rep-resents a milestone in bureaucratic propaganda. Like junk science in a courtroom, thestudy seemingly attempts to obtain the largest possible benefit figure rather than tocome as close as possible to the truth.
Valuing Lives Allegedly Saved
The EPA valued each life saved as a $4.8 million benefit. The underlying concept issensible enough. Environmental regulations are forcing people to spend money anddivert valuable resources from other uses in order to reduce certain environmental

VOLUME V, NUMBER 1, SUMMER 2000
THE ENVIRONMENTAL PROPAGANDA AGENCY ✦ 67
health risks. Citing respectable studies, the EPA concludes that workers will acceptlower-wage jobs to reduce the probability of being accidentally killed on the job. In-stalling windows in tall buildings pays better than installing them in one-story housespartly because of the difference in the worker’s risk. The claim is not that a human lifeis worth only $4.8 million but rather that improving safety is worth $4.8 million inthe sense that people are spending that much per life saved in other contexts.
Government is largely specialized in the business of saving human lives. This is partof the duty of the military, the police department, the fire department, the public healthagency, the Federal Aviation Administration, the highway department, and variousother agencies of the various levels of government. Government passes laws and spendsmoney to improve public safety. Cost-benefit analysis is simply a method of assisting insaving the greatest number of lives per dollar spent. If one government activity saveslives at a lower cost per life saved than another, then the same total money expenditurecould save more lives if some of the spending were reallocated in favor of the former atthe expense of the latter. The Department of Transportation spends no more than $2.7million to save a statistical life (Hopkins 1997, 6 [March 1996 figure]). If the EPA bal-anced clean-air costs against benefits, then the Department of Transportation could stillsave almost two lives for every one life the EPA would save with the same mandatedspending. Unlike the Department of Transportation, which values saving the averagemotorist at $2.7 million, the EPA is theoretically valuing at $4.8 million the saving ofsome elderly person to live a short time longer on his deathbed.
Valuation of the saving of a life allegedly lost to small amounts of smoke and dust inthe outdoor air is critical in generating the EPA’s large benefit total. A recent article in Riskin Perspective (July 1999) deals with “Valuing the Health Effects of Air Pollution.” Thearticle explains that the EPA’s figure of $4.8 million per life lost comes from the idea thatan average worker might be paid $480 per year to accept an added fatality risk of one inten thousand on the job. But a healthy middle-aged worker is quite different from an eld-erly person with a serious cardiac or respiratory disease. The EPA, the article reports, dem-onstrates that more realistic estimates of what a particulate-pollution casualty has actuallylost result in dramatic reductions in the estimated value of life-years saved.
The EPA is notorious for overzealous mandates ostensibly intended to save a fewlife-years. A study by Tammy O. Tengs and others has become a widely cited source ofinformation on what various agencies spend to save a statistical life-year. The HarvardCenter for Risk Analysis features some estimates of the median value of cost per life-year saved for various regulatory agencies (Tengs and others 1995, 369–89):
Federal Aviation Administration $23,000
Consumer Product Safety Commission $68,000
National Highway Traffic Safety Administration $78,000

THE INDEPENDENT REVIEW
68 ✦ CRAIG S. MARXSEN
Occupational Safety and Health Administration $88,000
Environmental Protection Agency $7,600,000
Indeed, the Clean Air Act seems to be one of the EPA’s better bargains.Gains in life expectancy from medical interventions are very similar, in principle,
to the alleged gains from cleaner air. The Harvard Center for Risk Analysis refers read-ers of another issue of its newsletter to estimates of such gains (Risk in Perspective,November 1998, 2). If all smokers were to quit smoking, the life expectancy of thegeneral population would increase by about nine months. Gains for smokers alone, asa group, are also listed. A thirty-five-year-old smoker gains only fourteen months oflife expectancy by cutting smoking by 50 percent (Wright and Weinstein 1998, 383,table 2), whereas quitting altogether increases life expectancy only twenty-eightmonths. The EPA’s alleged 45 percent reduction in outdoor particulate pollutionwould not seem likely to have a greater effect on an individual’s life expectancy thanquitting smoking.
About 90 percent of the benefits of the Clean Air Act supposedly come from re-ductions in mortality (75 percent) and chronic bronchitis (15 percent) that particu-late matter (that is, dust and smoke) allegedly would otherwise have caused. Another6 percent of the $22.2 trillion in benefits is related to preventing people from dying oflead poisoning. During 1990, in the “no-control scenario,” the EPA figures that184,000 additional people thirty years old and older would have died prematurelybecause of particulate matter suspended in the air (U.S. EPA 1997, ES-4). At $4.8million per death, this life-saving adds $883.2 billion to the alleged benefits. Sum-ming over the whole twenty-year period, particulate matter alone causes loss of life inthe “no-control scenario” that the EPA tallies to be worth $16.632 trillion.
The EPA Science Advisory Board Council on Clean Air Act Compliance Analysisfound fault. The council asked the EPA to provide an alternative estimate of benefitsbased on the value of statistical life-years lost rather than lives lost per se. In response,the EPA revised the value of particulate-matter mortality to $9.1 trillion and came upwith a new central estimate of $14.3 trillion for the total benefits of the Clean Air Act(U.S. EPA 1997, ES-9). Although the Federal Aviation Administration mandatesspending at $23,000 per life-year gained (Bolch and Pendley 1998, 2), the EPA valueda life-year lost at $293,000 (U.S. EPA 1997, 58). Whenever a moribund seventy-year-old dies, the EPA figured, the fourteen years remaining of actuarial life expectancy for anaverage seventy-year-old represents the life-years lost (37, 44). Indeed, the average al-leged mortal victim of particulate matter was assumed to have lost fourteen years of lifeexpectancy because the average victim was an elderly person (44). This means the sev-enty-year-old lost fourteen years times $293,000 per year, or $2.9 million worth of life-years (I-23). In fact, the EPA treated every dying elderly person as if he would have livedout the full number of years remaining for an average person of his age. The EPA ac-

VOLUME V, NUMBER 1, SUMMER 2000
THE ENVIRONMENTAL PROPAGANDA AGENCY ✦ 69
knowledges doubts about the validity of this procedure, conceding that L. Cifuentesand L. B. Lave had found that 37 to 87 percent of deaths from short-term exposure toair pollution could have been premature by only a few days (I-25).
In summary, one must suspect a pervasive EPA tendency to exaggerate. To arriveat its $9.1 trillion worth of life-years that allegedly would have been lost to particu-late-matter mortality, the EPA figures that the average victim loses fourteen years ofremaining life expectancy (I-25). If, in fact, the average victim really suffers death onlythree days prematurely, then the total would be reduced by a factor equal to threedays divided by fourteen years. The EPA’s $9.1 trillion figure drops to $5.3 billion.Reducing the estimated value of a life-year saved to the same order of magnitude pre-sumed by other government agencies brings the total down below $1 billion. But weare still ignoring the deeper issue. Air pollution may never have caused those hypo-thetical deaths in the first place. The EPA Science Advisory Committee (nineteen ofthe committee’s twenty-one members) believed that no causal mechanism linkingmortality with particulate matter had been established (34).
Discovering the Victims
The EPA claims to base its prevented-deaths estimates on a number of studies thatattempted to correlate mortality rates with levels of particulate matter polluting theoutdoor air. The EPA picked the best one (or so it claims), the study by C. A. Popeand others published in 1995. It also cites twelve studies that report finding signifi-cant relationships between daily PM10 (particles 10 microns or smaller) concentra-tions and daily mortality (EPA 1997, D-15). The main cause of daily variations inthese particulate-matter levels, however, is the weather. On calm, hot, summer days,pollution levels outdoors tend to be high. Smog is almost exclusively a summer phe-nomenon. Is it a shocking surprise if statistical studies discover that the “dog days ofsummer” don’t kill just old dogs?
The study by Pope and others (1995) compares death rates for the over-thirtypopulation to annual median PM2.5 exposure in fifty cities (PM2.5 is particulate matter2.5 microns or smaller). Temperature differences are ignored (Fumento 1997, 1). Popeand others found a 17 percent difference in death rates over eight years between thecleanest and dirtiest cities (Kaiser 1997, 468). The study did not control for wealth orlifestyle but did control for schooling and obesity (Merline 1997, 13). Differences inannual pollutant emissions accounted for far less of the measured ambient pollutantconcentrations than did variations in meteorological conditions (Crandall, Rueter, andSteger 1996, 41–42). As a model for predicting mortality, the 1995 model of Pope andothers was seriously misspecified. It omitted many important variables. Thismisspecification results in mistakenly crediting causality to any included variable (such asPM2.5) that happens to be correlated with an important left-out variable. For instance,towns where everyone works in steel mills might tend to be towns with more particu-
THE INDEPENDENT REVIEW
70 ✦ CRAIG S. MARXSEN
late-matter pollution. And the differential mortality may arise from working in the steelmill rather than from breathing the outdoor air. Maybe the steel-town residents allsmoke high-tar cigarettes, get drunk on Saturday night, and fail to attend to church onSunday. Likewise, towns where people drive older cars might tend to be smokier. Townslocated in more densely populated industrial regions might tend to have above-averagelevels of fine particles. Particulate matter may blow onto places where beef is cheap andpeople eat too much fat. The possibilities are endless.
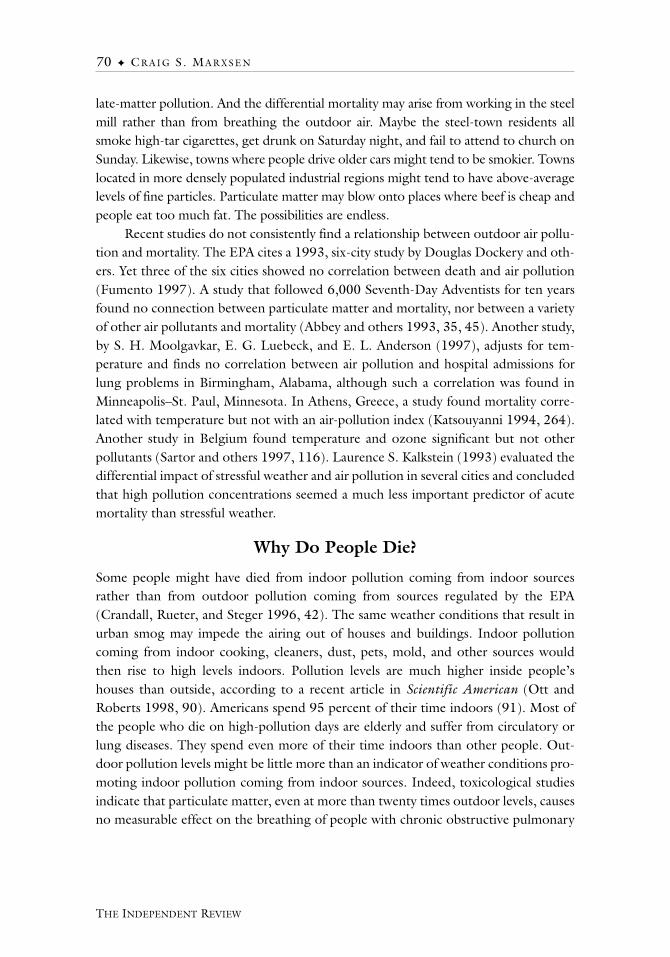
Recent studies do not consistently find a relationship between outdoor air pollu-tion and mortality. The EPA cites a 1993, six-city study by Douglas Dockery and oth-ers. Yet three of the six cities showed no correlation between death and air pollution(Fumento 1997). A study that followed 6,000 Seventh-Day Adventists for ten yearsfound no connection between particulate matter and mortality, nor between a varietyof other air pollutants and mortality (Abbey and others 1993, 35, 45). Another study,by S. H. Moolgavkar, E. G. Luebeck, and E. L. Anderson (1997), adjusts for tem-perature and finds no correlation between air pollution and hospital admissions forlung problems in Birmingham, Alabama, although such a correlation was found inMinneapolis–St. Paul, Minnesota. In Athens, Greece, a study found mortality corre-lated with temperature but not with an air-pollution index (Katsouyanni 1994, 264).Another study in Belgium found temperature and ozone significant but not otherpollutants (Sartor and others 1997, 116). Laurence S. Kalkstein (1993) evaluated thedifferential impact of stressful weather and air pollution in several cities and concludedthat high pollution concentrations seemed a much less important predictor of acutemortality than stressful weather.
Why Do People Die?
Some people might have died from indoor pollution coming from indoor sourcesrather than from outdoor pollution coming from sources regulated by the EPA(Crandall, Rueter, and Steger 1996, 42). The same weather conditions that result inurban smog may impede the airing out of houses and buildings. Indoor pollutioncoming from indoor cooking, cleaners, dust, pets, mold, and other sources wouldthen rise to high levels indoors. Pollution levels are much higher inside people’shouses than outside, according to a recent article in Scientific American (Ott andRoberts 1998, 90). Americans spend 95 percent of their time indoors (91). Most ofthe people who die on high-pollution days are elderly and suffer from circulatory orlung diseases. They spend even more of their time indoors than other people. Out-door pollution levels might be little more than an indicator of weather conditions pro-moting indoor pollution coming from indoor sources. Indeed, toxicological studiesindicate that particulate matter, even at more than twenty times outdoor levels, causesno measurable effect on the breathing of people with chronic obstructive pulmonary

VOLUME V, NUMBER 1, SUMMER 2000
THE ENVIRONMENTAL PROPAGANDA AGENCY ✦ 71
disease (Crandall, Rueter, and Steger 1996, 43). Allergies to indoor pollutants docause breathing problems for some people.
Most people, for whatever reason, die gradually over a period of several weeks ormonths (American Medical Association 1987, 768). In the end, breathing often be-comes labored, partly because the lungs become waterlogged due to heart failure,partly because of saliva that trickles down the windpipe. Pneumonia is not so muchthe cause of death as the mode of dying from some disease of the heart, liver, or kid-neys. The condition is exacerbated when the dying person ceases to rise from the bed.Life may be prolonged by helping such a person get up for a short walk or a ride in awheelchair. Kenneth Chilton (1997), testifying before a Senate subcommittee, said:“It is curious, to say the least, that the statistical link that has been demonstrated isbetween fine particles and cardiopulmonary deaths, and not deaths due to respiratorydisease or lung cancer alone” (4).
Particulate matter might be a killer largely because it is visible. People die as aresult of averting behavior. The dying person’s caregiver fears the “deadly pollution”on a hazy day and therefore refrains from getting Grandma up from the bed.Grandma dies of pulmonary edema exacerbated by her failure to get up. The deathcertificate reports cardiovascular disease as the cause of death because it is the underly-ing cause. In Israel, Iraqi missile attacks caused the deaths of several elderly peoplewho, fearing poison gas, smothered themselves by wearing government-issued gasmasks that had not been properly unpacked—the filter material was still sealed in itsplastic wrapper! The missiles that struck Israel delivered no poison gas. Similarly, theEPA may have unwittingly encouraged people to, in effect, smother their dying rela-tives in an effort to keep them from breathing nearly harmless pollution.
Epidemiological studies that correlate asthma attacks or hospital admissionswith particulate-matter pollution may actually be measuring a psychological phe-nomenon. People, having been persuaded that the haze in the air is deadly, then re-act accordingly. Children complain that they can’t breathe; they put on a big showsimilar to the one some have now been taught to perform whenever they are ex-posed to secondhand cigarette smoke. Adults likewise rush to the hospital in fearthat the pollution might be the last straw in their struggle against chronic bronchitisor some cardiopulmonary disorder. The environmental movement has encouragedphobic behavior by the more gullible segment of the population. Maybe somepeople just tend to close their windows to keep the pollution out and then are af-flicted with asthma or bronchitis caused by the much more irritating indoor pollu-tion coming from indoor sources.
Any correlation between daily ambient pollution levels and mortality may simplybe a misidentification of modest timing effects. Caregivers may simply tend to neglecta dying elder when spring turns to summer and the windows must be closed and theair conditioner turned on. Grandma may get less attention simply because her room

THE INDEPENDENT REVIEW
72 ✦ CRAIG S. MARXSEN
smells bad and is repugnant to enter. Maybe no one checked on Grandma after thewindows were closed to keep the outdoor pollution from coming in.
Regressions to Save the World!
One must appreciate the questionable significance of weak statistical regression. Oncea set of observations has been amassed, many experimental regression equations aretypically calculated. By adding and deleting variables or observations, experimentingwith transformations, and so forth, the analyst can often “find” a relationship betweenvariables that are actually not related. The pressures to experiment until the desired orexpected “fit” is obtained are considerable. The weaker the hypothesized relationship,the easier it is to find it spuriously.
Suppose we examine a sample of fifty-three cities, including New Orleans, Pasa-dena, Pittsburgh, and New York. Regression analysis reveals no statistically significantrelationship between mortality and PM2.5 (Jones, Gough, and Van Doren 1997, 3).Next, we eliminate the four named cities from the sample and add Ashland, Kentucky,even though its PM2.5 measurements seem to be 50 percent above their actual valueswhen we compare it with neighboring cities and look at its sulfate measurements. Voila!PM2.5 suddenly appears to cause a 17 percent increase in mortality in the dirtiest city,compared with the cleanest. We have arrived at the sample of Pope and others (1995)and found those analysts’ result. We have found what we expected, and we publish thatfinding. We do not report our first finding, which showed no relationship.
Establishing a true connection between PM2.5 and mortality may be impossiblewith regression analysis. Multicolinearity cannot be overcome because ambient levelsof particulate matter correlate too strongly with other variables, such as temperature,other pollutants, day of the week, season, averting behavior, characteristics of the localeconomy, transportation patterns, and so forth. Researchers must cheat andmisspecify the model by omitting some important variables; otherwise, the results failto point to one specific culprit as the cause of differential mortality. Moolgavkar andLuebeck (1996), Edward Calthrop and David Maddison (1996), and others have tes-tified to the unsuitability of regression analysis for testing the relationship betweenPM and mortality. A false positive result is, theoretically, almost assured for anyonewho cares to seek it.
As a general rule, epidemiological evidence is rejected when it establishes a rela-tive risk of less than three, or 300 percent (Taubes 1995, 167). Indeed, MarciaAngell, an editor of the New England Journal of Medicine, says that, as a rule ofthumb, papers are not accepted for publication unless they find a relative risk of threeor more, especially if a finding is biologically implausible or unprecedented (Taubes1995, 167).
But, with regard to the PM–mortality link, the print media exhibit an excep-tional bias in favor of the environmentalist agenda. The peer review process is driven

VOLUME V, NUMBER 1, SUMMER 2000
THE ENVIRONMENTAL PROPAGANDA AGENCY ✦ 73
by a sort of political correctness. Papers that support the established orthodoxy aremore likely to be published. Special-interest groups trying to further an environmen-tal agenda dominate the funding of such research. The EPA itself funds many studies.A great many zealots and hired-gun statisticians are getting grants, tenure, promo-tion, and fame for “proving” that pollution is destroying the earth. Zeal for the envi-ronment drives many investigators to pursue what would ordinarily be regarded asinsignificant research. It increases the number of such studies published, and it magni-fies the rewards of researchers such as Joel Schwartz, who received the MacArthurFellowship—a no-strings-attached $275,000 grant—for his work on lead and particu-late pollution (Skelton 1997, 29). Schwartz told an interviewer that his strategy wasone of “working very hard to dump out a lot of papers very fast, on the ground that ifI just kept on pounding this out in the literature, people could not ignore it” (30).
People seem to forget that regressions once “established” a connection betweenoverhead power lines and leukemia. The electromagnetic field (EMF) findings werestronger than those for PM2.5 and mortality and yet were later disproved (Merline1997, 12). The EMF threat lacked the bandwagon appeal that might have motivatedresearchers to construct a solid wall of scientific evidence such as the EPA and the en-vironmentalist groups claim exists for PM2.5 and mortality (10). Many epidemics ofanxiety have come and gone in recent years as a result of weak epidemiologic findings(Taubes 1995, 164). Radon gas and lung cancer were associated via mismeasurementof actual individual exposure; now the findings are doubted. Cancer and pesticideresidues were linked; DDT and breast cancer were linked and then unlinked; electro-magnetic fields from power lines seemed to cause brain cancer; hair dryers seemed tocause cancer; coffee seemed to cause cancer, so did saccharin. For particulate matter,so much “good” can be done by the “citizen of the world” statistician. He can“prove” that fossil fuels are killing people. For him, it may be a matter of the “earth inthe balance.” He can help fight global warming. He can prevent the collapse proph-esied in that sensational book, The Limits to Growth.
Once, in the late nineteenth century, William Stanley Jevons became enthusiasticabout a theoretical relationship between sunspots and the business cycle. He becameconvinced that a relationship existed, and the more he looked, the stronger seemed tobe the correlation he believed he had discovered. Because his theory fell out of favor,it became disreputable for subsequent investigators to seek such correlation. Seem-ingly good correlations were subsequently found, however, and a few even gainedpublication. Jevons’s sunspot theory might still make a comeback if the environmen-talists discover that it somehow serves their cause.
Lead Phobia
Lead is assumed to have been causing many deaths. The EPA’s mean estimate forlead-related mortality prevented by the Clean Air Act is $1.339 trillion (1990 dollars)

THE INDEPENDENT REVIEW
74 ✦ CRAIG S. MARXSEN
(U.S. EPA 1997, ES-7). The EPA relied on published estimates of a relationship be-tween blood lead levels and high blood pressure (G-9). It then multiplied by otherpublished coefficients distilled from degrees of correlation between high blood pres-sure and mortality (G-13). The result is a far cry from making inferences based ondeath certificates that list lead poisoning as the cause of death. Applying the EPA’sreasoning, we could save even more lives by eliminating final exams from all collegesand universities. Final exams also tend to elevate blood pressure, and elevated bloodpressure is correlated with mortality. The fallacy of such reasoning lies in the source ofthe correlation between blood pressure and mortality. As Crandall, Rueter, and Steger(1996, 44) have observed, high blood pressure is a predictor of mortality because itindicates heart disease. Heart disease has been the leading cause of death in recentyears. Moderately elevated blood pressure itself does not cause nearly the amount ofmortality with which it is statistically associated via its connection with heart disease.Maybe getting the lead out of gasoline was worth only a few billion dollars or evenless. In any event, the EPA’s method results in a huge exaggeration.
Although preventing mortality and chronic bronchitis generates 96 percent ofthe benefits claimed by the EPA, the largest part of the remainder is attributed to pre-venting IQ reductions that the EPA says lead would have caused. Drawing on amal-gamated regression studies (Schwartz 1993), the EPA relies on a statistical correlationbetween blood-lead levels in children and low IQ (U.S. EPA 1997, G-2). Supposingthat lead is reducing IQs, the EPA values the loss at $3,000 per IQ point per child.
But the EPA might be getting it backward (Juberg, Kleiman, and Kwon 1997,13). Cross-sectional studies are confounded by the fact that children with lower IQstend to descend from parents with lower IQs. Stupid parents tend to expose their chil-dren to more opportunities for ingesting lead, and the stupid children contribute byeating more dirt. Stupid parents tend to achieve lower socioeconomic status and livein residential areas where lead is more prevalent. Moreover, they tend to fail to pro-vide good diets for their children. Iron-deficient children will actually absorb more ofa given amount of ingested lead, and the iron deficiency will further contribute tolower IQ measurements.
Longitudinal studies, tracking the same children over time, persuade some oth-erwise skeptical scientists of a lead–IQ connection (Powell 1999, 166). However, therelationship between iron deficiency, IQ loss, and lead uptake illustrates the problemof confounding factors that are not evaded by switching from cross-sectional to longi-tudinal studies. Children living under conditions that expose them to more lead mayseem to suffer IQ loss from lead when the loss is actually due to other problems asso-ciated with low socioeconomic surroundings. IQ test results are supposedly influ-enced by the cultural deprivation common to children in low socioeconomicsurroundings. The same children who are exposed to more lead may also be exposedto illegal drug use, domestic violence, poor schools, bad diets, and a large number ofother factors detrimental to the enhancement of their intellect. Combining many re-

VOLUME V, NUMBER 1, SUMMER 2000
THE ENVIRONMENTAL PROPAGANDA AGENCY ✦ 75
gression studies is almost sure to pick up a false relationship if confounding factors canproduce one. Maybe moderate blood lead levels don’t really reduce IQ after all, butIQ is just a good predictor of lead ingestion and absorption (Juberg, Kleiman, andKwon 1997, 13). It seems likely, at least, that the EPA’s estimate of the benefits fromlead control is exaggerated.
The possibility of synthesizing epidemiological findings has long plagued thelead-IQ controversy. In 1979 Herbert Needleman and his collaborators reportedfinding a three- or four-point IQ drop associated with modestly elevated lead levelsmeasured in children’s teeth (Needleman and others 1979, 689–95). Mark Powell(1999, 163) reports that Claire Ernhart and her co-authors discredited Needleman’sresearch by charging that confounding variables had been inadequately controlledand that Needleman had performed so many regression comparisons that a few statis-tically significant outcomes were assured by chance alone (Ernhart, Landa, and Schell1981, 911–19). Later, in a 1990 Superfund court case, Needleman served as an ex-pert witness. Sandra Wood Scarr, a Virginia psychologist who had been an EPA panel-ist reviewing Needleman’s work, testified against Needleman (Powell 1999, 164).Scarr explained that Needleman’s first set of analyses found no lead–IQ relationshipand that only by eliminating other IQ-affecting variables did Needleman finally getthe results he sought (165). Unfortunately, Scarr and Ernhart were condemning prac-tices probably hidden in most of the epidemiological evidence underlying the EPA’sclaims of benefits of every kind from the Clean Air Act.
The Cost
The EPA provides an estimate of the cumulative costs of twenty years of compliancewith the Clean Air Act—roughly half a trillion dollars. This estimate is not very farfrom the total one gets by adding up the relevant figures in the EPA’s previous(1990) study. After all, the previous study was the EPA’s prime source of data forthe current cost study. However, the EPA has now added its own version of a gen-eral equilibrium analysis. The EPA undercuts previous findings by Michael Hazillaand Raymond J. Kopp by concluding that ripple effects reduced annual GDP byabout 1 percent, or $55 billion 1990 dollars by 1990 (U.S. EPA 1997, 9). Calculat-ing the present value of the GDP reductions, the EPA concludes that the aggregateimpact of clean-air regulation on production was $1,005 billion 1990 dollars.Hazilla and Kopp had found that, by 1990, environmental regulation of all kindsreduced GNP by 5.85 percent. The Clean Air Act, accounting for 30.46 percent ofpollution spending, would, therefore, presumably have reduced 1990 GDP by 1.78percent, according to Hazilla and Kopp. The EPA concedes that some economistsidentify a stifling effect of environmental regulation on technological innovation,which hinders productivity growth (U.S. EPA 1997, 11). The agency concedesmissing some of that effect, although it claims that its general equilibrium model

THE INDEPENDENT REVIEW
76 ✦ CRAIG S. MARXSEN
incorporated “endogenous productivity growth” that results from factor-pricechanges within the model. These are internal ripple effects, however, and do notrepresent the aggregate changes in multifactor productivity (or total factor produc-tivity) that economists equate with technological advance.
Focusing on the best private study of the productivity effects of the whole of en-vironmental regulation—the study by James Robinson (1995)—leads one to quite adifferent conclusion. Robinson, whose work was supported by a grant from the Officeof Technology Assessment, concludes: “Overall, the U.S. manufacturing sector at-tained a level of multifactor productivity in 1986 that was 11.4 percent lower than itwould have attained, absent the growth in environmental and occupational healthregulation since 1974” (414). Moreover, the contribution of occupational healthregulation was negligible, leaving the EPA as the sole cause of this entire effect (411).Robinson’s finding that actual manufacturing output was 11.4 percent lower than itspotential means that, by 1986, potential manufacturing output was 12.86 percenthigher than actual output. This implies that, over the twelve years from 1974 to 1986,manufacturing output would have grown by a factor of 1.01 percent per year in addi-tion to its actual growth, had environmental regulations not existed. Had the manu-facturing sector enjoyed this addition to annual growth from 1970 to 1990, thenmanufacturing output in 1990 would have been 22.35 percent higher than it actuallywas in 1990.
Michael Hazilla and Raymond J. Kopp (1990) developed a model that ignorestechnological progress but emphasizes the ripple effects produced as disturbances ofproduction in one sector alter factor inputs into other sectors. In their computablegeneral equilibrium model, environmental regulation reduced manufacturing outputabout 6.33 percent by 1990, largely by reducing capital accumulation and divertingother inputs. (The figure of 6.33 percent is approximate and is obtained by averagingall sectors of the manufacturing industry from Hazilla and Kopp 1990, table 4, 868–69.) The ripple effects from manufacturing and several other directly affected sectorsresulted in a reduction of real GNP of 5.85 percent by 1990 (Hazilla and Kopp 1990,867). In other words, Hazilla and Kopp found that, by 1990, environmental regula-tion reduced real GNP (and, therefore, real GDP) by 92.41 percent as much as it re-duced manufacturing output alone. If manufacturing output would have been 22.35percent higher in 1990 without EPA regulation, then real GDP probably could havebeen 20.65 percent higher than it actually was in 1990. Annual growth of real GDPfrom 1970 to 1990 appears to have suffered; the absence of environmental regulationwould have added 0.94 percent to the annual growth rate of real GDP from 1970 to1990. This figure is consistent with conclusions reached by Richard Vedder (1996,16), who concluded that annual productivity growth would have averaged one per-centage point higher had regulation in general remained at 1963 levels. Thomas GaleMoore (1997, 2) also infers a reduction in total factor productivity in the neighbor-hood of $2 trillion, based on findings by Gray and Shadbegian (1993) that every dol-

VOLUME V, NUMBER 1, SUMMER 2000
THE ENVIRONMENTAL PROPAGANDA AGENCY ✦ 77
lar spent on compliance costs in the paper, oil, and steel industries reduced total factorproductivity by $3 to $4. Moore applies this ratio to Hopkins’s $667 billion estimateof overall regulatory compliance cost. (For a discussion of the EPA’s role in causingpost-1970 American wage stagnation, see Marxsen 1999.)
By comparing actual real GDP each year with estimated potential real GDP(which would have grown larger than actual real GDP by an annually compoundingfactor of 1.009), we find a difference that totals $9,951.7 billion (1990 dollars) overthe period from 1970 to 1990. Because compliance costs for air-pollution controlalone constituted 30.46 percent of total 1970–1990 pollution-control compliancecosts (U.S. EPA 1990, 8–20, 8–21), the lost GDP attributable to air pollution controlwould total $3.03 trillion (1990 dollars). This figure needs to be added to the EPA-estimated half a trillion dollars of direct compliance cost because the compliance costrepresents a sinkhole for some of the GDP that actually was produced. To put the fig-ures into perspective, the entire U.S. stock of residential structures in 1990 was worthroughly $6 trillion; the stock of consumer durables (all the durable goods you ownbesides your house) was worth almost $2 trillion. The implied cost of the Clean AirAct from 1970 to 1990 is more than six times larger than the EPA’s official compli-ance cost estimate. It seems reasonable to suppose that the true cost must be some-where between $1.5 trillion (the EPA’s total, including the EPA-estimated lost GDPdue to productivity effects) and $3.5 trillion ($0.5 trillion plus $3 trillion, inferredfrom Robinson’s findings plus those of Hazilla and Kopp). The most likely value isprobably near $3.5 trillion because, unlike the EPA, Robinson, Hazilla, and Kopp hadlittle to gain by inflating their estimate. Apart from the dubious health benefits, meanEPA-estimated benefits from visibility, soiling damage avoided, and agriculture addup to just $151 billion and are probably also exaggerated. Quite opposite to the con-clusion reached by the EPA, it seems very unlikely that the benefits of the Clean AirAct exceeded the costs.
Conclusion
The EPA’s cost-benefit study appears to be a bureaucratic cover-up. In reality, theEPA has probably squandered a substantial portion of America’s resources. The sti-fling effect on productivity may account for a big part of America’s post-1973 wagestagnation (Marxsen 1999). Without the illusory benefit of all the lives saved, theactual benefits of the Clean Air Act were very modest and probably could have beenachieved nearly as well with far less sacrifice. The Clean Air Act and its amendmentsforce the EPA to mandate reduction of air pollution to levels that would have noadverse health effects on even the most sensitive person in the population (Powell1999, 91). The EPA relentlessly presses forward in its absurd quest, like a madmansetting fire to his house in an insane determination to eliminate the last of the in-sects infesting it.

THE INDEPENDENT REVIEW
78 ✦ CRAIG S. MARXSEN
The EPA has very recently issued a new study in which it attempts to measure thebenefits and costs of the Clean Air Act Amendments of 1990 (U.S. EPA 1999). TheEPA projects that annual benefits will total $110 billion by the year 2010, $100 bil-lion of which will allegedly come from a 5 to 10 percent reduction in fine particulatematter (iv, 75). Without the amendments, PM10 and PM2.5 supposedly would kill23,000 people, based on the mid-1990s study by Pope and others (U.S. EPA 1999,60). The EPA once again has valued each of these fatalities at $4.8 million (1990 dol-lars) (71). The total comes up short of the product of 23,000 times $4.8 because theEPA decided to add a five-year lag structure to death after exposure to particulatesand it used discounting in its calculations (75). Estimating costs to be just $27 billionper year by 2010, the EPA arrives at a four to one ratio of benefits to costs (71). Need-less to say, the agency continues to exaggerate.
ReferencesAbbey, David E., F. Peterson, P. K. Mills, and W. L. Beeson. 1993. Long-Term Ambient Con-
centrations of Total Suspended Particulates, Ozone, and Sulfur Dioxide and RespiratorySymptoms in a Nonsmoking Population. Archives of Environmental Health 48: 33–46.
American Medical Association. 1987. Family Medical Guide. New York: Random House.
Bolch, Ben, and Bradford Pendley. 1998. How the EPA Says It Makes Us Rich. Liberty 11(May): 1–2.
Calthrop, Edward, and David Maddison. 1996. The Dose-Response Function Approach toModelling the Health Effects of Air Pollution. Energy Policy 24: 599–607.
Chilton, Kenneth W. 1997. Has the Case Been Made for New Air Quality Standards? Policy Brief181 (April). St. Louis: Center for the Study of American Business, Washington University.
Crandall, Robert W., Frederick H. Rueter, and Wilbur A. Steger. 1996. Clearing the Air: EPA’sSelf-Assessment of Clean-Air Policy. Regulation no. 4: 35–46.
Dockery, D. W, F. E. Speizer, D. O. Stram, J. H. Ware, J. D. Spengler, and B. B. Ferris, Jr.1993. An Association between Air Pollution and Mortality in Six U.S. Cities. New En-gland Journal of Medicine 329 (24): 1753–59.
Ernhart, C., B. Landa, and N. Schell. 1981. Subclinical Levels of Lead and DevelopmentalDeficit: A Multivariate Follow-Up Reassessment. Pediatrics 67 (6): 911–19.
Fumento, Michael. 1997. The EPA’s Killer Air Pollution Proposals. American Enterprise Insti-tute: On the Issues, October.
Gray, Wayne B., and Ronald J. Shadbegian. 1993. Environmental Regulation and Manufactur-ing Productivity at the Plant Level. Working paper no. 4321 (April). National Bureau ofEconomic Research.
Harvard Center for Risk Analysis. 1998. Gains in Life Expectancy from Medical Interventions.Risk in Perspective 6 (November): 1–4.

VOLUME V, NUMBER 1, SUMMER 2000
THE ENVIRONMENTAL PROPAGANDA AGENCY ✦ 79
———. 1999. Valuing the Health Effects of Air Pollution. Risk in Perspective 7 (July): 1–6.
Hazilla, Michael, and Raymond J. Kopp. 1990. Social Cost of Environmental Quality Regula-tions: A General Equilibrium Analysis. Journal of Political Economy 98 (August): 853–73.
Hopkins, Thomas D. 1997. U.S. Environmental Protection Agency’s Rule on National Ambi-ent Air Quality Standards for Particulate Matter. Economists Incorporated: Papers Avail-able Online (March 12). Retrieved June 18, 1998, from http:///www.ei.com/publications/papers.htm.
Jones, Kay, Michael Gough, and Peter VanDoren. 1997. Addendum to the CSE Foundationstudy Is the EPA Misleading the Public about the Health Risks of PM2.5? Washington,D.C.: Citizens for a Sound Economy Foundation, May 12. Retrieved December 9, 1999,from http://www.csef.org/csefhome/kjonesaddendum.htm.
Juberg, Daland R., Cindy F. Kleiman, and Simona C. Kwon. 1997. Lead and Human Health.New York: American Council on Science and Health, December. Retrieved December 9,1999, from http://www.acsh.org/publications/booklets/lead.html.
Kaiser, Jocelyn. 1997. Showdown over Clean Air Science. Science 275 (July): 446–50.
Kalkstein, Laurence S. 1993. Direct Impacts in Cities. Lancet 342 (December 4): 1397–1400.
Katsouyanni, K. 1993. Evidence for Interaction between Air Pollution and High Temperaturein the Causation of Excess Mortality. Archives of Environmental Health 48: 235–42.
———. 1994. Evidence for Interaction between Air Pollution and High Temperature in theCausation of Excess Mortality (abstract). Journal of the American Medical Association271 (January 26): 264.
Marxsen, Craig S. 1999. Why Stagnation? B>Quest. Retrieved December 9, 1999, from http://www.westga.edu/~bquest/1999/stag.html.
Merline, John. 1997. How Deadly Is Air Pollution? Consumers’ Research Magazine 80 (Febru-ary): 10–15.
Moolgavkar, S. H., and E. G. Luebeck. 1996. A Critical Review of the Evidence on ParticulateAir Pollution and Mortality. Epidemiology 7 (July): 420–28.
Moolgavkar, S. H., E. G. Luebeck, and E. L. Anderson. 1997. Air Pollution and Hospital Ad-missions for Respiratory Causes in Minneapolis St. Paul and Birmingham. Epidemiology 8(July): 364–70.
Moore, Thomas Gale. 1997. Issues in Regulatory Policy. Hoover Institution: World Bank Pa-per prepared for the Conference on Economic Reform in Korea, January 15–16, 1997.Retrieved November 19, 1999, from http://www.stanford.edu/~moore/RegPolicy.html.
Needleman, H., and others. 1979. Deficits in Psychological and Classroom Performance inChildren with Elevated Dentine Lead Levels. New England Journal of Medicine 300(March 29): 689–95.
Ott, Wayne R., and John W. Roberts. 1998. Everyday Exposure to Toxic Pollutants. ScientificAmerican 278 (February): 86–91.

THE INDEPENDENT REVIEW
80 ✦ CRAIG S. MARXSEN
Pope, C. A. III, M. J. Thun, M. M. Namboodiri, D. W. Dockery, J. S. Evans, F. E. Speizer, andC. W. Heath, Jr. 1995. Particulate Air Pollution as a Predictor of Mortality in a Prospec-tive Study of U.S. Adults. American Journal of Respiratory Critical Care Medicine 151:669–74.
Powell, Mark R. 1999. Science at EPA. Washington, D.C.: Resources for the Future.
Robinson, James C. 1995. The Impact of Environmental and Occupational Health Regulationon Productivity Growth in U.S. Manufacturing. Yale Journal on Regulation 12 (Sum-mer): 387–434.
Sartor, F., C. Demuth, R. Snacken, and D. Walckiers. 1997. Mortality in the Elderly and Ambi-ent Ozone Concentration During the Hot Summer, 1994, in Belgium. EnvironmentalResearch 72 (February): 109–17.
Schwartz, J. 1993. Beyond LOEL’s, p Values, and Vote Counting: Methods for Looking at theShapes and Strengths of Associations. Neurotoxicology 14 (2–3): 237–48.
Skelton, Renee. 1997. Clearing the Air: An Epidemiologist Takes on the Worst Air PollutionProblems of Our Times. Amicus Journal 19 (Summer): 27–31.
Taubes, Gary. 1995. Epidemiology Faces Its Limits. Science 269 (July 14): 164–69.
Tengs, Tammy O., and others. 1995. Five-hundred Life-Saving Interventions and Their Cost-Effectiveness. Risk Analysis 15 (June): 369–89.
U.S. Department of Commerce. 1997. Survey of Current Business, May, table 15.
U.S. Environmental Protection Agency. 1990. Environmental Investments: The Cost of a CleanEnvironment. Washington D.C.: Environmental Protection Agency.
———. 1997. The Benefits and Costs of the Clean Air Act, 1970 to 1990. Prepared for U.S. Con-gress by U.S. Environmental Protection Agency, October, 1997. Retrieved November24, 1999, from http://www.epa.gov/airprogm/oar/sect812/index.html.
———. 1999. The Benefits and Costs of the Clean Air Act, 1990 to 2010. Prepared for U.S. Con-gress by U.S. Environmental Protection Agency, November. Retrieved November 24,1999, from http://www.epa.gov/airprogm/oar/sect812/index.html.
Vedder, Richard K. 1996. Federal Regulation’s Impact on the Productivity Slowdown: A Trillion-Dollar Drag. Study no. 131 (July). St. Louis: Center for the Study of American Business,Washington University.
Wright, Janice C., and Milton C. Weinstein. 1998. Gains in Life Expectancy from Medical In-terventions: Standardizing Outcomes Data. New England Journal of Medicine 339 (Au-gust 6): 380–86.