Subscribe for Long Term” to Sona BLW Precision Forgings Ltd.
10
“Subscribe for Long Term” to Sona BLW Precision Forgings Ltd. Present in high growth EV market
Transcript of Subscribe for Long Term” to Sona BLW Precision Forgings Ltd.
“Subscribe for Long Term” to Sona BLW Precision Forgings Ltd.
Present in high growth EV market

Salient features of the IPO: • Blackstone-backed Sona BLW Precision Forgings Ltd.. (Sona BLW), is
planning to raise up to Rs. 5,500cr through an IPO, which opens on 14th Jun. and closes on 16th Jun. 2021. The price band is Rs. 285 - 291 per share.
• The issue is a combination of fresh issue and OFS. The company will not receive any proceeds from the OFS portion. Of the net proceeds from the fresh issue, Rs. 241cr will be utilized to repay or prepayment of debt availed by the company. Residual funds will be used for general corporate purposes.
Key competitive strengths: • One of the leading manufacturers and suppliers to global EV markets • One of the leading global companies and gaining market share,
diversified across key automotive geographies, products, vehicle segments and customers
• Strong research and development and technological capabilities in both hardware and software development
• Strong business development with customer centric approach • Consistent financial performance with industry leading metrics • Highly experienced board of directors and management team Risk and concerns: • Global slowdown in automotive sector • Inability to adapt to the evolving EV technology • Revenue concentration risk • Delay in new product development plans • Unfavorable forex movement • Unfavorable movement in raw material prices • Rise in interest rate • Competition Peer comparison and valuation: At higher price band of Rs. 291, Sona BLW is demanding a TTM P/E multiple of 78.9x, which is at premium to the peer average of 60.3x. However, if we compare with EV focused global peer, it is at discount. Below are a few key observations of the issue: (continued in next page) • Global light vehicle production has remained flat between 2015-19. In
2020, production declined by around 18% due to Covid-19 pandemic. Given the USA and most parts of Europe severely impacted by the pandemic, a V-shaped recovery is not anticipated, but a more gradual one. In 2021, growth will be primarily driven by the Chinese market. According to Ricardo Research, overall global volumes are likely to reach around 92mn by 2025 with China, Europe and North America accounting for approximately 70% of the global production volumes.
• As fuel economy norms become more stringent over time and countries introduce legislation to ban fossil fuel vehicles, production of internal combustion engine (ICE) vehicles will be dis-incentivized and the importance of battery electric vehicle (BEV) will gain prominence. According to Ricardo Research, BEV has been the fastest growing vehicle segment growing at 46% CAGR between 2015-20 and is expected to expand by 36% CAGR between 2020-25. Further by 2025, BEVs are likely to account for approximately 12% of the global production as against 3.3% in 2020.
11th Jun. 2021
1
Recommendation Subscribe for Long Term Price band Rs. 285 - 291 per share Face value Rs. 10 Shares for fresh issue 1.03 - 1.05cr shares Shares for OFS 18.04 - 18.42cr shares Fresh issue size Rs. 300cr OFS issue size Rs. 5,250cr
Total issue size 19.07 - 19.47cr shares (Rs. 5,550cr)
Bidding date 14th Jun. - 16th Jun. 2021 MCAP at higher price band Rs. 16,974cr
Enterprise value at higher price band Rs. 17,117cr
Book running lead manager
Kotak Mahindra Capital Company Ltd., Credit Suisse Securities (India) Pvt. Ltd., JM Financial Ltd., J.P. Morgan India Pvt. Ltd. and Nomura Financial Advisory and Securities (India) Pvt. Ltd.
Registrar KFIN Technologies Pvt. Ltd. Sector/Industry Auto Parts & Equipment
Promoters
Mr. Sunjay Kapur, Sona Autocomp Holding Pvt. Ltd. and Singapore VII Topco III Pte. Ltd.
Issue breakup
Category Percent of issue (%) Number of shares
QIB portion 75% 14.30 - 14.61cr shares Non institutional portion 15% 2.86 - 2.92cr shares
Retail portion 10% 1.91 - 1.95cr shares Indicative IPO process time line Finalization of basis of allotment 21st Jun. 2021
Unblocking of ASBA account 22nd Jun. 2021
Credit to demat accounts 23rd Jun. 2021 Commencement of trading 24th Jun. 2021 Pre and post - issue shareholding pattern
Pre-issue Post-issue Promoter & promoter group 100.00% 67.30%
Public 0.00% 32.70% Total 100.00% 100.00% Retail application money at higher cut-off price per lot Number of shares per lot 51 Application money Rs. 14,841 per Lot Analyst Rajnath Yadav Research Analyst (022 - 6707 9999; Ext: 912) Email: [email protected]

© CHOICE INSTITUTIONAL RESEARCH
Peer comparison and valuation (Contd…):
Company name Face value (Rs.)
CMP (Rs.)
MCAP (Rs. cr)
EV (Rs. cr)
Stock return (%) TTM
operating revenue (Rs. cr)
TTM EBITDA (Rs. cr)
TTM PAT (Rs. cr)
TTM EBITDA
margin (%)
TTM PAT
margin (%) 1 M 3 M 6 M 1 Y
Sona BLW Precision Forgings Ltd. 10 291 16,974 17,117 1,566 441 215 28.2% 13.7% Motherson Sumi Systems Ltd. 1 247 77,922 80,842 11.9% 14.3% 56.8% 149.3% 57,370 4,359 1,039 7.6% 1.8% Sundaram-Clayton Ltd. 5 3,642 7,369 15,516 17.7% 11.6% 84.5% 118.4% 20,299 2,388 324 11.8% 1.6% Varroc Engineering Ltd. 1 380 5,799 6,812 -1.5% -7.8% -7.5% 128.0% 11,303 397 (632) 3.5% -5.6% Bosch Ltd. 10 15,790 46,570 42,392 16.2% 5.6% 16.9% 41.4% 9,716 1,161 482 11.9% 5.0% Bharat Forge Ltd. 2 759 35,329 37,359 18.5% 23.2% 37.5% 108.5% 6,336 862 (126) 13.6% -2.0% Mahindra CIE Automotive Ltd. 10 218 8,250 9,434 19.6% 22.9% 39.0% 113.2% 6,050 502 106 8.3% 1.8% Endurance Technologies Ltd. 10 1,500 21,104 20,571 11.5% 7.2% 27.5% 81.2% 6,547 1,040 520 15.9% 7.9% Minda Industries Ltd. 2 583 15,855 16,525 9.3% 4.8% 44.2% 98.6% 5,023 530 78 10.6% 1.6% Sundram Fasteners Ltd. 1 842 17,696 18,251 15.5% 16.1% 56.6% 159.1% 3,644 664 359 18.2% 9.9% WABCO India Ltd. 5 6,818 12,932 11,835 -2.3% 6.1% 18.3% -1.1% 1,864 206 104 11.0% 5.6% Average 11.2% 2.7%
Company Name TTM EPS (Rs.)
BVPS (Rs.)
DPS (Rs.)
Debt equity ratio
Total asset turnover
ratio
RoE (%)
RoCE (%)
P / E (x)
P / B (x)
EV / Sales (x)
EV / EBITDA (x)
MCAP / Sales (x)
Earning yield (%)
Sona BLW Precision Forgings Ltd. 3.7 27.5 1.5 0.3 0.6 13.4% 16.7% 78.9 10.6 10.9 38.8 10.8 1.3% Motherson Sumi Systems Ltd. 3.3 39.8 0.5 0.7 1.2 8.3% 5.4% 75.0 6.2 1.4 18.5 1.4 1.3% Sundaram-Clayton Ltd. 160.0 1,435.6 26.0 3.4 0.9 11.1% 14.9% 22.8 2.5 0.8 6.5 0.4 4.4% Varroc Engineering Ltd. (41.4) 198.2 0.0 0.6 1.0 -20.9% -10.1% (9.2) 1.9 0.6 17.2 0.5 -10.9% Bosch Ltd. 163.4 3,327.1 115.0 0.0 0.7 4.9% 8.0% 96.6 4.7 4.4 36.5 4.8 1.0% Bharat Forge Ltd. (2.7) 116.3 2.0 0.8 0.5 -2.3% 3.0% (279.5) 6.5 5.9 43.4 5.6 -0.4% Mahindra CIE Automotive Ltd. 2.8 129.5 0.0 0.3 0.6 2.2% 2.9% 77.5 1.7 1.6 18.8 1.4 1.3% Endurance Technologies Ltd. 36.9 253.2 6.0 0.1 1.1 14.6% 15.9% 40.6 5.9 3.1 19.8 3.2 2.5% Minda Industries Ltd. 2.9 74.5 0.4 0.5 1.0 3.9% 6.2% 202.7 7.8 3.3 31.2 3.2 0.5% Sundram Fasteners Ltd. 17.1 111.7 1.3 0.3 1.0 15.3% 18.2% 49.3 7.5 5.0 27.5 4.9 2.0% WABCO India Ltd. 54.7 1,052.5 11.0 0.0 0.7 5.2% 5.7% 124.6 6.5 6.4 57.5 6.9 0.8% Average 16.2 0.7 0.9 4.2% 7.0% 40.0 5.1 3.2 27.7 3.2 0.3%
Source: Choice Broking Research
• Sona BLW is one of India’s leading automotive technology companies engaged into the designing, manufacturing and supplying highly engineered, mission critical automotive systems and components such as differential assemblies, differential gears, conventional & micro-hybrid starter motors, BSG systems, EV traction motors and motor control units for both electrified and non-electrified powertrains.
• The company is the global supplier and derived around 75% of the business from overseas markets. It gets 36.1%, 26.5% and 7.6% of the business from the North America, Europe and China, respectively. The company has long-standing relationships of 15 years and more with 13 of its top-20 customers. According to the management, the company has not lost any customer till date.
• Its products are sold to global automotive OEMs across the US, Europe, India and China. Some of its key OEM customers include global OEM of EVs, a North American OEM of PVs & CVs, Ampere Vehicles (an Indian OEM of PVs, CVs and EVs), Ashok Leyland, CNH, Daimler, Escorts, Escorts Kubota, Geely, Jaguar Land Rover, John Deere, Mahindra & Mahindra, Mahindra Electric, Maruti Suzuki, Renault Nissan, Revolt Intellicorp, TAFE, Volvo etc. The company also serves selected leading Tier-1 automotive system suppliers such as Carraro, Dana, Jing-Jin Electric, Linamar and Maschio.
• The company has nine manufacturing & assembly facilities, of which six are located in India and one each in China, Mexico and USA. Moreover, it has eight warehouses across India, USA, Germany and Belgium to serve and prioritize the customer’s needs.
• Sona BLW is one of the two largest exporters of starter motors from India and amongst the top-10 global starter motor suppliers in 2020. The company has increased its global market share of differential gears and starter motors to 5% and 3%, respectively, in 2020 from 4.5% and 2.5%, respectively, in 2019. Its global market share in BEV differential assemblies was at 8.7% in 2020. In the domestic market, Sona BLW is the largest manufacturer of differential gears for PV, CV and tractor OEMs in India with an estimated market share of approximately 55-60%, 80-90% and 75-85%, respectively.
• The company’s product offerings span across all types of electrified powertrains. It currently supplies differential assemblies, differential gears, EV traction motors to customers in US, China and India, for use in hybrid and BEVs. Its business to the EV market has increased by 153.2% CAGR, from Rs. 12.7cr in FY18 to Rs. 205.7cr in FY21. The company’s business contribution from the BEVs and hybrid vehicles stood at 40.5% in FY21 as compared to 11.4% in FY18.

© CHOICE INSTITUTIONAL RESEARCH
Peer comparison and valuation (Contd…):
• According to the Crisil Report, Sona BLW’s total operating income has increased by 10.9% CAGR over FY16-20, which is
higher as compared to 8.1% CAGR growth reported by the top-ten listed auto-component manufacturers in India. • Despite global automotive slowdown in 2020, Sona BLW has reported a robust financial performance over FY18-20. On
the back of rapid growth in the hybrid and BEVs, the company has reported a 36% CAGR rise in consolidated operating revenue to Rs. 1,566.3mn in FY21. Total operating expenditure increased by 35.5% CAGR, thereby leading to a 37.2% CAGR rise in consolidated EBITDA to Rs. 441cr in FY20. EBITDA margin expanded by 76bps over the period. Reported PAT increased by 40.6% CAGR to Rs. 215.2cr in FY20 with 131bps expansion in the margin. The company reported a positive operating cash flow over FY18-20, with an average flow of Rs. 175cr. Consolidated debt declined by 11.7% CAGR, leading to a net-debt to EBITDA ratio of 1x in FY20 as compared to 3.9x in FY18. Average RoIC during the period stood at 20.6%.
At higher price band of Rs. 291, Sona BLW is demanding a TTM P/E multiple of 78.9x, which is at premium to the peer average of 60.3x. However, if we compare with EV focused global peer, it is at discount. Thus considering the growth potential in the EV segment and the company’s product portfolio spanning over all types of electrified power trains, we assign “Subscribe for Long Term” rating for the issue.

Offer opens on 14-Jun-2021
Offer closes on 16-Jun-2021
Finalization of basis of allotment 21-Jun-2021
Unblocking of ASBA account 22-Jun-2021
Credit to demat accounts 23-Jun-2021
About the issue: • Sona BLW is coming up with an initial public offering (IPO) with 19.07 - 19.47cr shares (fresh issue: 1.03 - 1.05cr shares;
OFS shares: 18.04 - 18.42cr shares) in offering. The offer represents around 32.70% of its post issue paid-up equity shares of the company. Total IPO size is Rs. 5,550cr.
• The issue will open on 14th Jun. 2021 and close on 16th Jun. 2021.
• The issue is through book building process with a price band of Rs. 285 - 291 per share.
• The issue is a combination of fresh issue and OFS. The company will not receive any proceeds from the OFS portion. Of the net proceeds from the fresh issue, Rs. 241cr will be utilized to repay or prepayment of debt availed by the company. Residual funds will be used for general corporate purposes.
• 75% of the net issue shall be allocated on a proportionate basis to qualified institutional buyers, while rest 15% and 10% is reserved for non-institutional bidders and retail investors, respectively.
• Promoter holds 100.00% stake in the company and post-IPO this will come down to 67.30%. Public holding will increase
from current nil to 32.70%.
Pre and post issue shareholding pattern (%)
Pre-issue Post-issue (at higher price band)
Promoter & Promoter Group (%) 100.00% 67.30%
Public (%) 00.00% 32.70%
Source: Choice Equity Broking
Indicative IPO process time line:
Commencement of trading 24-Jun-2021

Financial performance: Performance over FY18-21: Despite global automotive slowdown in 2020, Sona BLW has reported a robust financial performance over FY18-20. On the back of rapid growth in the hybrid and BEVs, the company has reported a 36% CAGR rise in consolidated operating revenue to Rs. 1,566.3mn in FY21. Total operating expenditure increased by 35.5% CAGR, thereby leading to a 37.2% CAGR rise in consolidated EBITDA to Rs. 441cr in FY20. EBITDA margin expanded by 76bps over the period. Depreciation charge increased by 60.8% CAGR, while finance cost increased by 19.5% CAGR over FY18-20. Effective tax rate declined by around 6ppts, which led to a 35.7% CAGR rise in profit from the continuing operations. Reported PAT increased by 40.6% CAGR to Rs. 215.2cr in FY20. PAT margin expanded by 131bps over the period. Sona BLW reported a positive operating cash flow over FY18-20, with an average flow of Rs. 175cr. Consolidated debt declined by 11.7% CAGR, leading to a net-debt to EBITDA ratio of 1x in FY20 as compared to 3.9x in FY18. Average RoIC during the period stood at 20.6%.
Source: Choice Equity Broking
Consolidated financial snapshot (Rs. cr) FY18 FY19 FY20 FY21 CAGR (%) Y-o-Y (%, Annual)
Revenue from operations 623.1 699.2 1,038.0 1,566.3 36.0% 50.9% EBITDA 170.7 200.0 242.3 441.0 37.2% 82.0% Reported PAT 77.4 173.0 360.3 215.2 Adjusted PAT 77.4 173.0 128.3 229.1 43.6% 78.6%
Restated adjusted EPS 1.3 3.0 2.2 3.9 43.6% 78.6%
Cash flow from operating activities 148.9 154.6 253.3 142.7 -1.4% -43.7% NOPLAT 99.7 117.5 158.6 267.7 39.0% 68.7% FCF 114.4 (342.3) 86.3 -125.2%
RoIC (%) 13.2% 39.7% 12.0% 17.5% 428 bps 553 bps
Revenue growth rate (%) 12.2% 48.4% 50.9% EBITDA growth rate (%) 17.2% 21.1% 82.0% EBITDA margin (%) 27.4% 28.6% 23.3% 28.2% 76 bps 482 bps EBIT growth rate (%) 14.7% 3.6% 96.4% EBIT margin (%) 23.7% 24.2% 16.9% 22.0% (168) bps 509 bps Restated reported PAT growth rate (%) 123.4% -25.8% 78.6% Restated reported PAT margin (%) 12.4% 24.7% 12.4% 14.6% 220 bps 227 bps
Inventory days 618.8 313.0 108.1 141.9 -38.8% 31.2% Debtor days 164.6 113.0 67.8 75.8 -22.8% 11.8% Payable days (718.8) (355.1) (76.0) (96.2) -48.8% 26.7% Cash conversion cycle 64.5 70.9 100.0 121.5 23.5% 21.5% Fixed asset turnover ratio (x) 0.9 2.3 1.1 1.4 13.6% 31.4% Total asset turnover ratio (x) 0.4 0.4 0.6 0.7 19.7% 28.4%
Current ratio (x) 1.2 1.0 2.2 2.0 18.8% -10.8% Debt to equity (x) 1.3 0.4 0.4 2.7% Net debt to EBITDA (x) 3.9 1.0 1.0 1.0 -1.4%
RoE (%) 99.5% 10.9% 17.6% 668 bps RoA (%) 5.2% 10.6% 6.9% 10.5% 531 bps 360 bps RoCE (%) 15.6% 54.2% 11.2% 19.5% 391 bps 836 bps
© CHOICE INSTITUTIONAL RESEARCH
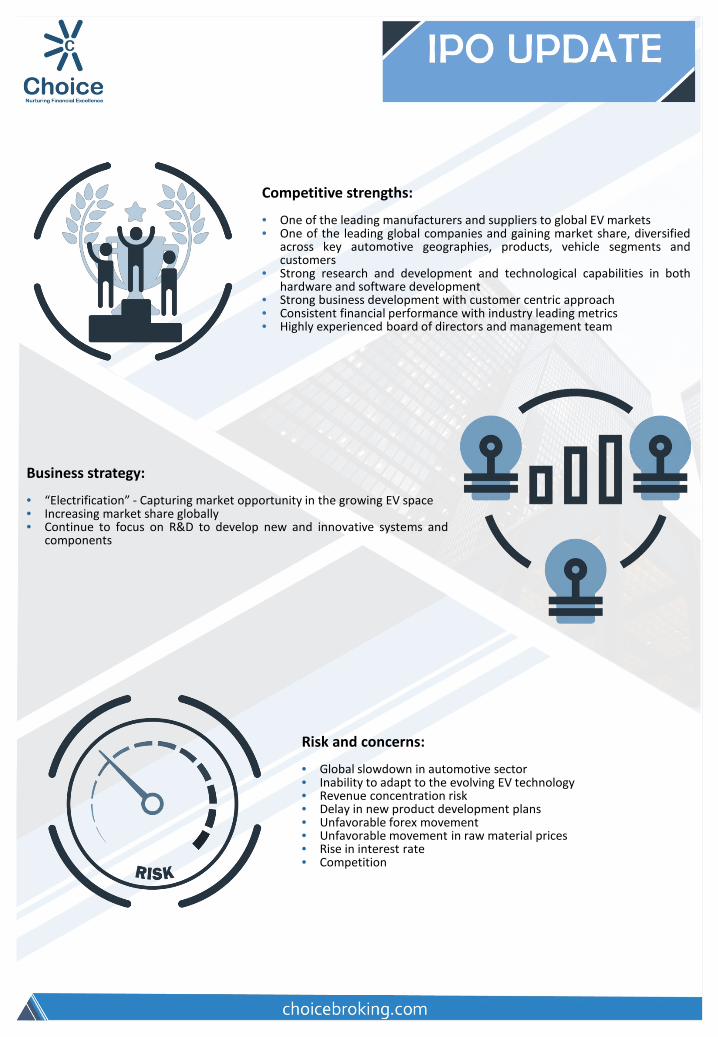
Competitive strengths: • One of the leading manufacturers and suppliers to global EV markets • One of the leading global companies and gaining market share, diversified
across key automotive geographies, products, vehicle segments and customers
• Strong research and development and technological capabilities in both hardware and software development
• Strong business development with customer centric approach • Consistent financial performance with industry leading metrics • Highly experienced board of directors and management team
Business strategy:
• “Electrification” - Capturing market opportunity in the growing EV space • Increasing market share globally • Continue to focus on R&D to develop new and innovative systems and
components
Risk and concerns:
• Global slowdown in automotive sector • Inability to adapt to the evolving EV technology • Revenue concentration risk • Delay in new product development plans • Unfavorable forex movement • Unfavorable movement in raw material prices • Rise in interest rate • Competition

© CHOICE INSTITUTIONAL RESEARCH
Financial statements: Consolidated profit and loss statement (Rs. cr)
FY18 FY19 FY20 FY21 CAGR over FY18 - 21 (%)
Annual growth over FY20 (%)
Revenue from operations 623.1 699.2 1,038.0 1,566.3 36.0% 50.9% Cost of materials consumed (175.9) (192.8) (442.4) (709.5) 59.2% 60.4% Changes in inventories of finished goods and work-in-progress 8.5 (12.2) (3.2) 64.2 96.4% -2119.1% Gross profit 455.7 494.2 592.4 921.0 26.4% 55.5% Excise duty (11.1) Employee benefits expense (41.8) (49.0) (102.7) (147.4) 52.3% 43.5% Other expenses (232.1) (245.2) (247.4) (332.5) 12.7% 34.4% EBITDA 170.7 200.0 242.3 441.0 37.2% 82.0% Depreciation and amortization expense (23.3) (31.0) (67.1) (96.9) 60.8% 44.4% EBIT 147.4 169.0 175.2 344.1 32.7% 96.4% Finance costs (19.1) (17.8) (26.0) (32.5) 19.5% 25.2% Other income 2.8 3.3 5.8 2.3 -5.8% -59.5% Share of profit / (loss) of associates (0.2) 0.2 Exceptional items 232.1 (13.9) -106.0% PBT 130.9 154.8 387.0 300.0 31.8% -22.5% Tax expenses (44.8) (54.6) (26.7) (84.8) 23.7% 218.0% PAT from continuing operations 86.1 100.1 360.3 215.2 35.7% -40.3% Net profit from discontinued operations (8.6) 73.1 PAT before minority interest 77.6 173.2 360.3 215.2 40.5% -40.3% Minority interest (0.1) (0.2) Reported PAT 77.4 173.0 360.3 215.2 Adjusted PAT 77.4 173.0 128.3 229.1 43.6% 78.6%
Consolidated balance sheet statement (Rs. cr)
FY18 FY19 FY20 FY21 CAGR over FY18 - 21 (%)
Annual growth over FY20 (%)
Equity share capital 27.7 27.7 47.2 573.0 174.4% 1115.1% Other equity (27.5) 146.1 1,130.8 730.9 -398.3% -35.4% Non controlling interest 2.5 2.4 Non current borrowings 452.8 106.4 220.9 250.2 -17.9% 13.3% Non current lease liabilities 92.8 15.7 53.2 72.0 -8.1% 35.3% Other non current financial liabilities 0.1 0.1 0.1 0.1 0.0% 0.0% Non current provisions 394.1 2.4 6.7 8.7 -72.0% 29.9% Non current net deferred tax liabilities 0.0 11.1 107.7 126.0 17.0% Current borrowings 35.0 38.9 84.6 114.5 48.5% 35.3% Current lease liabilities 33.6 2.4 7.2 10.5 -32.1% 46.8% Other current financial liabilities 70.0 69.7 48.2 23.4 -30.6% -51.4% Trade payables 329.8 69.2 116.2 224.1 -12.1% 92.8% Current provisions 37.7 1.6 5.1 7.3 -42.2% 42.4% Current net tax liabilities 5.5 0.1 11.8 17.0 45.9% 44.3% Other current liabilities 29.6 12.1 11.0 17.1 -16.8% 54.8% Liabilities of disposal group classified as held for sale 1,126.8 Total liabilities 1,483.8 1,632.6 1,850.7 2,174.8 13.6% 17.5%
Property, plant and equipment 527.0 178.4 284.5 344.9 -13.2% 21.2% Intangible assets 10.5 72.4 462.9 536.6 271.0% 15.9% Capital work-in-progress 18.0 13.2 58.1 82.1 66.0% 41.3% Intangible assets under development 31.5 1.1 -96.6% Right-of-use assets 100.5 40.5 141.9 159.3 16.6% 12.2% Goodwill on consolidation 155.2 175.8 175.8 4.2% 0.0% Non current investments 1.9 Other non current financial assets 2.7 3.8 0.1 Non current loans 1.7 2.3 5.1 5.8 51.4% 13.7% Non current net income tax assets 1.4 1.1 29.1 18.7 139.1% -35.9% Non current net deferred tax assets 17.2 Other non current assets 9.2 8.4 27.8 29.6 47.9% 6.4% Inventories 283.9 67.8 196.2 305.6 2.5% 55.7% Trade receivables 281.0 152.1 233.6 417.0 14.1% 78.5% Cash and cash equivalents 26.4 25.6 167.3 27.6 1.5% -83.5% Other current financial assets 3.8 3.2 0.5 15.2 59.2% 2761.3% Current loans 14.9 0.0 0.5 1.5 -53.4% 206.3% Current net income tax assets 1.0 Other current assets 29.5 13.0 33.6 54.2 22.4% 61.0% Assets of disposal group classified as held for sale 1,050.7 Total assets 1,483.8 1,632.6 1,850.7 2,174.8 13.6% 17.5%

© CHOICE INSTITUTIONAL RESEARCH
Financial statements:
Note: Ratios calculated on pre-issue data; Source: Choice Equity Broking
Consolidated cash flow statement (Rs. cr)
Particulars (Rs. mn) FY18 FY19 FY20 FY21 CAGR over FY18 - 21 (%)
Annual growth over FY20 (%)
Cash flow before working capital changes 172.8 200.9 264.8 402.6 32.6% 52.1% Change in working capital (10.0) 43.7 16.4 (315.5) 216.3% Cash flow from operating activities 148.9 154.6 253.3 142.7 -1.4% -43.7% Purchase of property , plant & equipment (87.8) (141.8) (212.1) (218.9) 35.6% 3.2% Cash flow from investing activities (137.9) 204.1 (954.2) (156.1) 4.2% -83.6% Cash flow from financing activities (12.8) (346.1) 766.8 (66.7) 73.2% -108.7%
Net cash flow (1.9) 12.6 66.0 (80.0) 247.6% Effect of foreign exchange fluctuation 28.3 26.4 39.0 105.0 54.8% 169.0% Opening balance of cash 26.4 39.0 105.0 24.9 -1.9% -76.2% Closing balance of cash 8.1 9.9 29.7 21.9 91.2% 200.1%
Consolidated financial ratios Particulars (Rs. mn) FY18 FY19 FY20 FY21 Revenue growth rate (%) 12.2% 48.4% 50.9% EBITDA growth rate (%) 17.2% 21.1% 82.0% EBITDA margin (%) 27.4% 28.6% 23.3% 28.2% EBIT growth rate (%) 14.7% 3.6% 96.4% EBIT margin (%) 23.7% 24.2% 16.9% 22.0% PAT growth rate (%) 123.4% -25.8% 78.6% PAT margin (%) 12.4% 24.7% 12.4% 14.6%
Turnover ratios Inventories turnover ratio (x) 2.2 4.0 7.9 6.2 Trade receivable turnover ratio (x) 2.2 3.2 5.4 4.8 Accounts payable turnover ratio (x) 1.9 3.5 11.2 9.2 Fixed asset turnover ratio (x) 0.9 2.3 1.1 1.4 Total asset turnover ratio (x) 0.4 0.4 0.6 0.7
Return ratios RoE (%) 99.5% 10.9% 17.6% RoA (%) 5.2% 10.6% 6.9% 10.5% RoCE (%) 15.6% 54.2% 11.2% 19.5%
Per share data Restated reported EPS (Rs.) 1.3 3.0 2.2 3.9 Restated DPS (Rs.) 0.0 0.0 1.7 1.5 Restated BVPS (Rs.) 0.0 3.0 20.2 22.4 Restated operating cash flow per share (Rs.) 2.6 2.7 4.3 2.4 Restated free cash flow per share (Rs.) 2.0 (5.9) 1.5 Dividend payout ratio 0.0% 0.0% 75.5% 39.5%

Disclaimer This is solely for information of clients of Choice Broking and does not construe to be an investment advice. It is also not intended as an offer or solicitation for the purchase and sale of any financial instruments. Any action taken by you on the basis of the information contained herein is your responsibility alone and Choice Broking its subsidiaries or its employees or associates will not be liable in any manner for the consequences of such action taken by you. We have exercised due diligence in checking the correctness and authenticity of the information contained in this recommendation, but Choice Broking or any of its subsidiaries or associates or employees shall not be in any way responsible for any loss or damage that may arise to any person from any inadvertent error in the information contained in this recommendation or any action taken on basis of this information. This report is based on the fundamental analysis with a view to forecast future price. The Research analysts for this report certifies that all of the views expressed in this report accurately reflect his or her personal views about the subject company or companies and its or their securities, and no part of his or her compensation was, is or will be, directly or indirectly related to specific recommendations or views expressed in this report. Choice Broking has based this document on information obtained from sources it believes to be reliable but which it has not independently verified; Choice Broking makes no guarantee, representation or warranty and accepts no responsibility or liability as to its accuracy or completeness. The opinions contained within the report are based upon publicly available information at the time of publication and are subject to change without notice. The information and any disclosures provided herein are in summary form and have been prepared for informational purposes. The recommendations and suggested price levels are intended purely for stock market investment purposes. The recommendations are valid for the day of the report and will remain valid till the target period. The information and any disclosures provided herein may be considered confidential. Any use, distribution, modification, copying, forwarding or disclosure by any person is strictly prohibited. The information and any disclosures provided herein do not constitute a solicitation or offer to purchase or sell any security or other financial product or instrument. The current performance may be unaudited. Past performance does not guarantee future returns. There can be no assurance that investments will achieve any targeted rates of return, and there is no guarantee against the loss of your entire investment.
POTENTIAL CONFLICT OF INTEREST DISCLOSURE (as on date of report) Disclosure of interest statement – • Analyst interest of the stock /Instrument(s): - No. • Firm interest of the stock / Instrument (s): - No.
+91-022-6707 9999 +91-022-6707 9959 www.choicebroking.in
Choice Equity Broking Pvt. Ltd. Choice House, Shree Shakambhari Corporate Park, Plot No: -156-158,
J.B. Nagar, Andheri (East), Mumbai - 400 099.