Submitted to theSubmitted to the Commission on Capital ...
39
State of New Jersey Debt Report Debt Report Submitted to the Submitted to the Commission on Capital Budgeting and Planning November 2009
Transcript of Submitted to theSubmitted to the Commission on Capital ...

State of New JerseyDebt ReportDebt Report
Submitted to theSubmitted to the Commission on CapitalBudgeting and Planning
November 2009
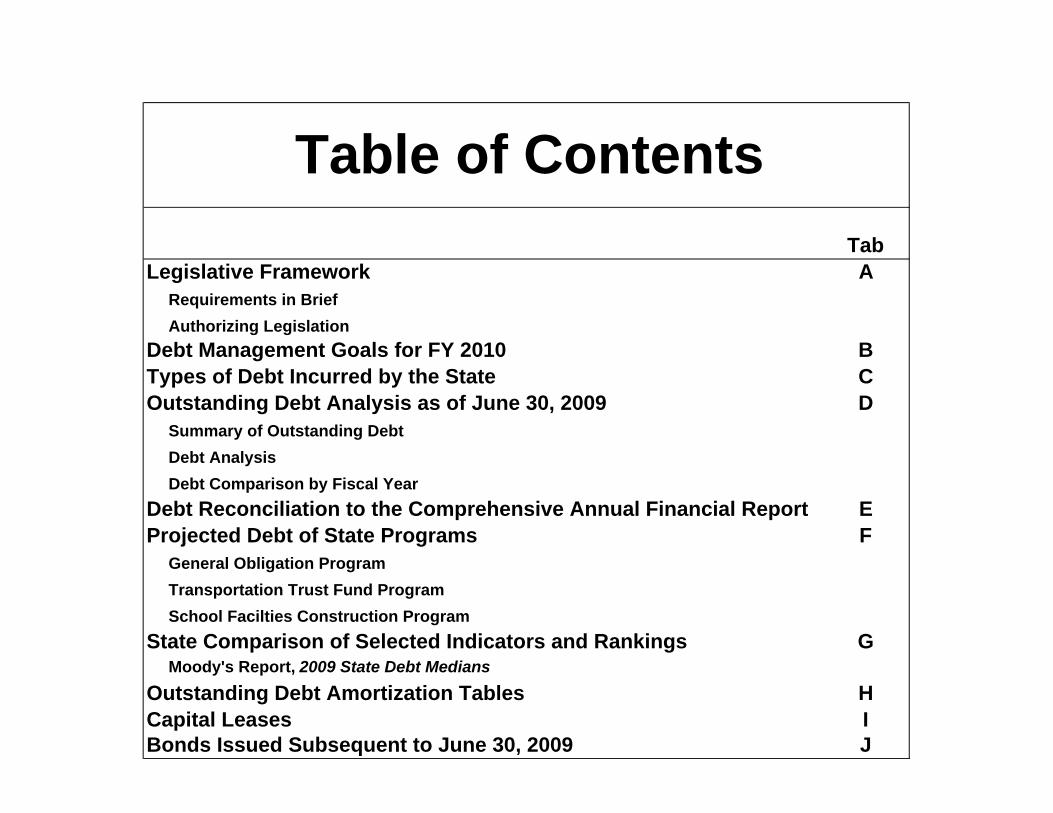
Table of ContentsTab
Legislative Framework A Requirements in Brief Authorizing LegislationDebt Management Goals for FY 2010 BTypes of Debt Incurred by the State COutstanding Debt Analysis as of June 30, 2009 D Summary of Outstanding Debt Debt Analysis Debt Comparison by Fiscal YearDebt Reconciliation to the Comprehensive Annual Financial Report EProjected Debt of State Programs F General Obligation Program Transportation Trust Fund Program School Facilties Construction ProgramState Comparison of Selected Indicators and Rankings G Moody's Report, 2009 State Debt MediansOutstanding Debt Amortization Tables HCapital Leases IBonds Issued Subsequent to June 30, 2009 J
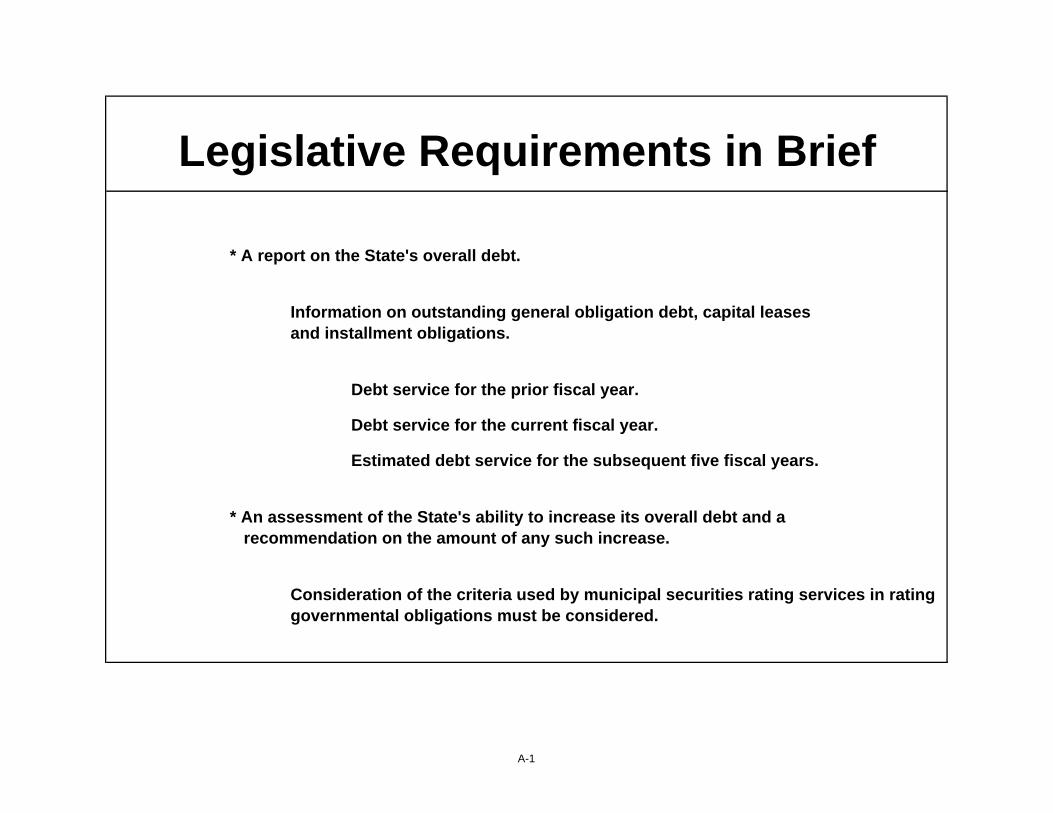
Legislative Requirements in Brief
* A report on the State's overall debt.
Information on outstanding general obligation debt, capital leasesand installment obligations.
Debt service for the prior fiscal year.
Debt service for the current fiscal year.
Estimated debt service for the subsequent five fiscal years.
* An assessment of the State's ability to increase its overall debt and a recommendation on the amount of any such increase.
Consideration of the criteria used by municipal securities rating services in ratinggovernmental obligations must be considered.
A-1

LexisNexis (TM) New Jersey Annotated Statutes
*** THIS SECTION IS CURRENT THROUGH NEW JERSEY 213TH LEGISLATURE ***
*** 2ND ANNUAL SESSION (P.L. 2009 CH. 143 AND J.R. 10) *** *** ANNOTATIONS CURRENT THROUGH OCTOBER 22, 2009 ***
TITLE 52. STATE GOVERNMENT, DEPARTMENTS AND OFFICERS
SUBTITLE 1. GENERAL PROVISIONS CHAPTER 9S. COMMISSION ON CAPITAL BUDGETING AND PLANNING
GO TO THE NEW JERSEY ANNOTATED STATUTES ARCHIVE DIRECTORY
N.J. Stat. § 52:9S-1 (2009)
§ 52:9S-1. Definitions As used in this act, the following words and terms shall have the following meanings, unless the context shall indi-cate another or different meaning or intent:
a. "Capital project" means any undertaking which is to be financed or funded or is proposed to be financed or funded by the issuance of bonds, notes or other evidences of indebtedness of the State or any public authority thereof; or any undertaking which is to be financed or funded or is requested to be financed or funded by an appropriation in the annual budget, where the expenditure therefor is, by statute, or under standards as they may be prescribed from time to time by the Department of the Treasury, a capital expenditure.
b. "Commission" means the New Jersey Commission on Capital Budgeting and Planning created by section 2 of this act;
c. "Plan" means the State Capital Improvement Plan provided for by subsection a. of section 3. of this act.
d. "State agency" means an executive or administrative department, office, public authority or other instrumentality of State Government. HISTORY: L. 1975, c. 208, 1, eff. Sept. 23, 1975.

Page 2
LexisNexis (TM) New Jersey Annotated Statutes
*** THIS SECTION IS CURRENT THROUGH NEW JERSEY 213TH LEGISLATURE *** *** 2ND ANNUAL SESSION (P.L. 2009 CH. 143 AND J.R. 10) ***
*** ANNOTATIONS CURRENT THROUGH OCTOBER 22, 2009 ***
TITLE 52. STATE GOVERNMENT, DEPARTMENTS AND OFFICERS SUBTITLE 1. GENERAL PROVISIONS
CHAPTER 9S. COMMISSION ON CAPITAL BUDGETING AND PLANNING
GO TO THE NEW JERSEY ANNOTATED STATUTES ARCHIVE DIRECTORY
N.J. Stat. § 52:9S-2 (2009) § 52:9S-2. New Jersey Commission on Capital Budgeting and Planning There is hereby created a New Jersey Commission on Capital Budgeting and Planning. The commission shall consist of 12 members selected as follows: the State Treasurer and any three other members of the Executive Branch designated by the Governor to so serve at his pleasure, two members of the General Assembly, two members of the Senate and four public members from the State at large.
The members from the General Assembly shall be appointed by the Speaker of the General Assembly. The mem-bers of the Senate shall be appointed by the President of the Senate. No more than one of the members appointed by the Speaker or President shall be from the same political party. Legislative members shall serve while members of their respective houses for the term for which they have been elected.
Of the four public members two shall be appointed by the Governor with advice and consent of the Senate, no more than one of whom shall be of the same political party, and two by the Legislature, one each by the President of the Se-nate and the Speaker of the General Assembly, for a term of six years and until their successors are qualified, provided that the members serving on the effective date of this 1995 amendatory act shall continue to serve until the expiration of their appointments. The President of the Senate shall make the first appointment of a public member upon the expiration of the term of the public member first occurring after the effective date of this 1995 amendatory act, and the Speaker of the General Assembly shall make the second appointment of a public member upon the expiration of the term of the public member next occurring after the effective date of this 1995 amendatory act. The public members shall be chosen based upon their experience and expertise in public finance and the capital improvement process. Any vacancy among the public members shall be filled in the same manner as the original appointment, but for the unexpired term only. A member shall be eligible for reappointment.
A chairman of the commission shall be selected annually by the membership of the commission from among the public members.
Members of the commission shall serve without compensation, but public members shall be entitled to reimburse-ment for expenses incurred in the performance of their duties. HISTORY: L. 1975, c. 208, § 2; amended 1995, c. 398, § 1.

LexisNexis (TM) New Jersey Annotated Statutes
*** THIS SECTION IS CURRENT THROUGH NEW JERSEY 213TH LEGISLATURE *** *** 2ND ANNUAL SESSION (P.L. 2009 CH. 143 AND J.R. 10) ***
*** ANNOTATIONS CURRENT THROUGH OCTOBER 22, 2009 ***
TITLE 52. STATE GOVERNMENT, DEPARTMENTS AND OFFICERS SUBTITLE 1. GENERAL PROVISIONS
CHAPTER 9S. COMMISSION ON CAPITAL BUDGETING AND PLANNING
GO TO THE NEW JERSEY ANNOTATED STATUTES ARCHIVE DIRECTORY
N.J. Stat. § 52:9S-3 (2009) § 52:9S-3. Preparation of State Capital Improvement Plan a. The commission shall each year prepare a State Capital Improvement Plan containing its proposals for State spending for capital projects, which shall be consistent with the goals and provisions of the State Development and Re-development Plan adopted by the State Planning Commission and shall be prepared after consultation with the New Jersey Council of Economic Advisors, created pursuant to P.L.1993, c.149 (C.52:9H-34 et seq.). Copies of the plan shall be submitted to the Governor and the Legislature no later than December 1 of each year. The plan shall provide:
(1) A detailed list of all capital projects of the State which the commission recommends be undertaken or continued by any State agency in the next three fiscal years, together with information as to the effect of such capital projects on future operating expenses of the State, and with recommendations as to the priority of such capital projects and the means of funding them;
(2) The forecasts of the commission as to the requirements for capital projects of State agencies for the four fiscal years next following such three fiscal years and for such additional periods, if any, as may be necessary or desirable for adequate presentation of particular capital projects, and a schedule for the planning and implementation or construction of such capital projects;
(3) A schedule for the next fiscal year of recommended appropriations of bond funds from issues of bonds pre-viously authorized;
(4) A review of capital projects which have recently been implemented or completed or are in process of imple-mentation or completion;
(5) Recommendations as to the maintenance of physical properties and equipment of State agencies;
(6) Recommendations which the commission deems appropriate as to the use of properties reported in subsection c. of this section;
(7) A report on the State's overall debt. This report shall include information on the outstanding general obligation debt and debt service costs for the prior fiscal year, the current fiscal year, and the estimated amount for the subsequent five fiscal years. In addition, the report shall provide similar information on capital leases and installment obligations;
(8) An assessment of the State's ability to increase its overall debt and a recommendation on the amount of any such increase. In developing this assessment and recommendation, the commission shall consider those criteria used by municipal securities rating services in rating governmental obligations; and
(9) Such other information as the commission deems relevant to the foregoing matters.
b. Each State agency shall no later than August 15 of each year provide the commission with:
(1) A detailed list of capital projects which each State agency seeks to undertake or continue for its purposes in the next three fiscal years, together with information as to the effect of such capital projects on future operating expenses of the State, and with such relevant supporting data as the commission requests;

(2) Forecasts as to the requirements for capital projects of such agency for the four fiscal years next following such three fiscal years and for such additional periods, if any, as may be necessary or desirable for adequate presentation of particular capital projects, and a schedule for the planning and implementation or construction of such capital projects;
(3) A schedule for the next fiscal year of requested appropriations of bond funds from issues of bonds previously authorized;
(4) A report on capital projects which have recently been implemented or completed or are in process of imple-mentation or completion;
(5) A report as to the maintenance of its physical properties and capital equipment;
(6) Such other information as the commission may request.
c. Each State agency shall, when requested, provide the commission with supplemental information in addition to that to be available to the commission under the computerized record keeping of the Department of the Treasury, Bu-reau of Real Property Management, concerning any real property owned or leased by the agency including its current or future availability for other State uses.
d. A copy of the plan shall also be forwarded to the Division of Budget and Accounting each year upon its comple-tion, and the portion of the plan relating to the first fiscal year thereof shall, to the extent it treats of capital appropria-tions in the annual budget, constitute the recommendations of the commission with respect to such capital appropria-tions in the budget for the next fiscal year. HISTORY: L. 1975, c. 208, § 3; amended 1979, c. 320, § 1; 1985, c. 398, § 13; 1995, c. 398, § 2.

Actively manage outstanding debt and related instruments to minimize debt service costs and adjust to market volatility.
Issue bonds under authorized programs at the lowest possible interest cost.
Continue to increase information available to investors in order to increase interest in state bonds, reduce relative interest cost and increase liquidity.
Maintain the State's highest investment grade, short-term credit rating.
Maintain long-term credit rating of the State and its bond issuing authorities.
Debt Management Goals for FY 2010
B-1

Types of DebtGeneral Obligation
General Obligation Bonds are direct and general obligations of the State and the full faith and credit ofthe State are pledged to the payment of the principal and interest as they become due.
Subject to AppropriationThe State's obligation to meet its payments on these instruments is subject to and dependent uponappropriations being made on an annual basis by the State Legislature for such purpose. These bonds are generally issued by an Independent Authority.
Moral ObligationThe authorizing legislation for certain State entities provides for specific budgetary procedures withrespect to certain obligations issued by such entities. Pursuant to such legislation, a designatedofficial is required to certify any deficiency in a debt service reserve fund maintained to meet paymentsof principal and interest on the obligations, and a State appropriation in the amount of the deficiencyis to be made. However, the State Legislature is not legally bound to make an appropriation.
Capital LeaseA direct substitute for the purchase of an asset with borrowed money. It is a noncancelable contract to make a series of payments in return for use of an asset for a specified period of time. It transfers substantially all the benefits and risks inherent in the ownership of the property to the lease.
Line of CreditA master lease arrangement using one lease agreement that allows the State, as Lessee, to accesstax-exempt financing for the procurement of essential personal property such as IT equipment, vehicles, and furniture over a short term (3 yr) period. Repayment is subject to appropriation.
C-1
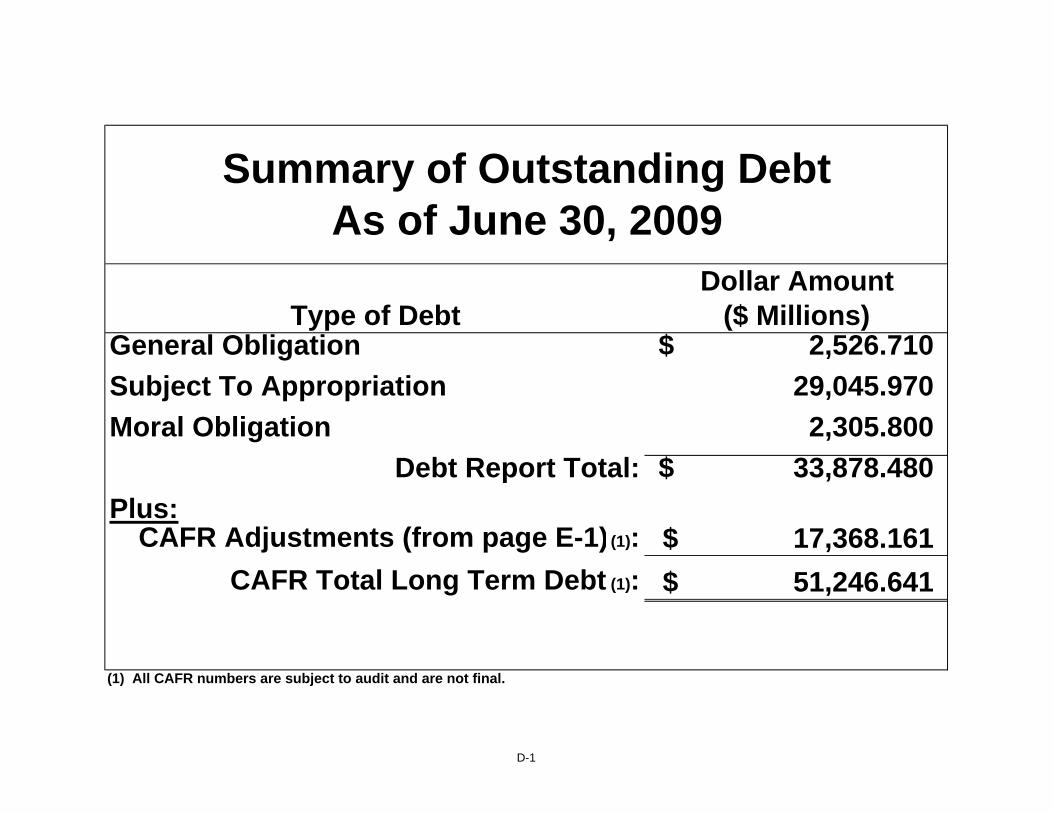
Summary of Outstanding DebtAs of June 30, 2009
Dollar AmountType of Debt ($ Millions)
General Obligation 2,526.710$ Subject To Appropriation 29,045.970Moral Obligation 2,305.800
Debt Report Total: 33,878.480$ Plus:
CAFR Adjustments (from page E-1) (1): 17,368.161$ CAFR Total Long Term Debt (1): 51,246.641$
(1) All CAFR numbers are subject to audit and are not final.
D-1

6/30/2009 RatingsOutstanding
Description 2009 2010 2011 2012 2013 2014 2015 Debt S & P Moody's FitchState of New Jersey
General Obligation 413.309$ 263.614$ 398.183$ 383.609$ 379.129$ 284.198$ 283.909$ 2,526.710$ AA Aa3 AA-James J. Howard Marine Lab 1.156 1.150 1.147 1.143 1.137 1.134 - 4.605 AA- A1 N/RChapter 12 - County College Bonds 36.079 37.401 31.860 28.286 25.890 24.157 21.920 215.983 N/R N/R N/RCapital Leases 90.734 84.614 74.870 67.713 60.369 47.003 39.219 379.729 N/R N/R N/RLine of Credit 27.846 18.340 10.080 3.072 0.109 - - 30.525 N/R N/R N/R
Building AuthorityState Building Revenue Bonds 59.259 65.891 65.866 87.422 87.823 70.598 56.914 672.485 AA- A1 A+
Economic Development AuthorityTrenton Office Complex 10.198 10.197 10.203 10.204 - - - 27.650 AA- A1 A+Liberty State Park Project 1.250 1.286 1.327 1.368 1.409 1.447 1.496 12.511 AA- A1 A+Liberty State Park, Liberty Science Center 6.971 6.855 6.846 7.426 7.390 7.348 7.300 90.900 AA- A1 A+Market Transition Facility 71.789 71.714 71.631 44.418 - - - 175.650 AA- A1 N/RGreen Lights Energy Conservation 0.313 0.314 0.315 - - - - 0.585 AA- A1 A+NJ Performing Arts Center 5.542 5.545 5.542 5.542 3.660 3.661 3.660 26.010 AA- A1 A+State Pension Funding 212.178 230.564 249.172 270.472 293.427 316.710 341.727 2,573.802 AA- A1 A+Dept. of Human Services Programs 3.478 3.297 3.154 2.994 2.875 2.649 2.512 23.985 A N/R N/RState Office Buildings Acquisition 5.263 5.266 5.263 5.265 5.260 5.259 5.264 43.435 AA- A1 A+School Facilities Construction (1) 378.449 343.033 473.492 463.089 464.557 483.800 480.194 7,073.899 AA- A1 A+Motor Vehicle Commission - - - 73.325 73.325 73.325 11.280 159.998 AA- A1 N/RMunicipal Rehabilitation 14.111 14.112 14.114 14.111 14.114 14.111 14.113 166.075 AA- A1 A+Business Employment Incentive Program 40.960 33.679 33.533 33.358 28.023 27.916 27.803 171.445 AA- A2 A+Designated Industries Economic Growth & Development Program 7.576 6.811 5.979 5.506 4.120 2.888 - 22.375 AA- A2 A+Motor Vehicle Surcharge Revenue 37.763 37.763 37.763 64.906 36.589 36.589 36.589 807.502 A Baa1 N/RMotor Vehicle Surcharge Revenue (Special Needs Housing) 5.546 5.546 5.546 5.546 5.546 5.546 5.546 206.508 A Baa1 N/RCigarette Tax Revenue 128.873 124.143 119.388 114.691 110.231 110.304 107.830 1,231.415 BBB Baa2 BBBLafayette Yard Hotel Project 1.579 1.656 1.738 1.829 1.917 2.013 2.115 17.060 AA- A1 A+
Educational Facilities AuthorityEquipment Leasing Fund 9.009 3.929 0.512 0.457 - - - 4.745 AA- A1 A+Facilities Trust Fund 20.974 20.970 20.972 - - - - 39.920 AA- A1 A+Technology Infrastructure Fund 6.346 - - - - - - - AA- A1 A+Capital Improvement Fund 43.887 43.888 43.882 43.886 43.879 43.883 43.884 455.105 AA- A1 A+Dormitory Safety Trust Fund 7.892 7.588 7.285 6.992 6.742 6.489 6.225 40.170 AA- A1 A+Public Library Project Grant Program 3.777 3.774 3.774 3.758 3.765 3.763 3.751 37.665 AA- A1 A+
Garden State Preservation TrustOpen Space & Farmland Preservation Program 59.162 97.993 97.990 97.995 97.997 97.993 97.994 1,149.699 AAA Aa3 AA-
Health Care Facilities Financing AuthorityDept. of Human Services Lease (Greystone Hospital) 15.624 15.625 15.622 15.623 15.622 15.622 15.624 198.355 AA- A1 A+Hospital Asset Transformation Program 12.495 26.677 28.452 28.451 28.450 31.036 31.869 449.415 AA- A1 A+
Sports and Exposition AuthorityState Contract Bonds 65.739 96.587 93.486 71.994 64.426 59.288 61.361 671.395 AA- A1 A+
Transportation Trust Fund AuthorityTransportation System Bonds (2) 687.053 723.162 741.728 742.215 742.781 743.116 758.576 10,205.307 AA- A1 A+
South Jersey Port CorporationMarine Terminal Revenue Bonds 11.151 12.429 12.558 12.560 12.548 12.079 12.087 143.790 A A1 N/R
State Debt Service Total: 2,503.327$ 2,425.413$ 2,693.273$ 2,719.225$ 2,623.110$ 2,533.926$ 2,480.765$ 30,056.410$
Other Obligations (for which debt service is offset by other revenues)EDA - Economic Recovery Fund 21.604 21.605 21.602 23.603 25.603 25.605 25.602 167.120 AA- A1 A+EDA - NJ Transit Light Rail System 71.794 72.886 53.406 53.431 52.907 52.370 51.809 416.325 AA- A1 N/RHigher Ed Student Assistance Auth. 244.889 105.696 105.586 103.287 112.966 114.094 128.836 2,162.010 A+ (3) N/R AA (3)NJ Transit - Transportation Equipment 57.257 95.712 92.488 105.228 104.962 104.707 88.218 956.585 AA- A1 A+SEA - Conv. Center - Luxury Tax 12.215 12.210 12.181 12.177 12.161 12.156 12.147 120.030 A (ins) Baa (ins) N/R
Other Debt Service Total: 407.759$ 308.109$ 285.263$ 297.726$ 308.599$ 308.932$ 306.611$ 3,822.070$
Grand Total: 2,911.086$ 2,733.521$ 2,978.536$ 3,016.952$ 2,931.709$ 2,842.858$ 2,787.376$ 33,878.480$ Breakdown:
Principal 1,338.332$ 1,129.860$ 1,419.508$ 1,493.697$ 1,454.775$ 1,415.066$ 1,432.609$ Interest 1,572.753 1,603.661 1,559.028 1,523.255 1,476.934 1,427.792 1,354.767
(2) Net of federal Build America Bonds subsidy.(3) Underlying rating on 1998 Master Trust Indenture.
State of New JerseyDebt Analysis as of June 30, 2009
Total Debt Service ($ Millions)
(1) Amounts do not include $400 million School Facilities Construction Notes, 2009 Series A issued June 18, 2009. It is anticipated that these Notes will be refunded prior to their maturity in Fiscal Year 2010.
D-2

Description DescriptionFY 2008 FY 2009 FY 2008 FY 2009
State of New Jersey State of New JerseyGeneral Obligation 2,801.345$ 2,526.710$ General Obligation 702.380$ 702.380$ James J. Howard Marine Lab 5.315 4.605 James J. Howard Marine Lab N/A N/AChapter 12 - County College Bonds 225.885 215.983 Chapter 12 - County College Bonds N/A N/ACapital Leases 410.552 379.729 Capital Leases N/A N/ALine of Credit 49.393 30.525 Line of Credit N/A N/A
Building Authority Building AuthorityState Building Revenue Bonds 679.602 672.485 State Building Revenue Bonds N/A N/A
Economic Development Authority Economic Development AuthorityTrenton Office Complex 35.960 27.650 Trenton Office Complex N/A N/ALiberty State Park (Park Project) 12.726 12.511 Liberty State Park (Park Project) N/A N/ALiberty State Park (Liberty Science Center) 93.415 90.900 Liberty State Park (Liberty Science Center) N/A N/AMarket Transition Facility 237.120 175.650 Market Transition Facility 44.730 44.730 Green Lights Energy Conservation 0.855 0.585 Green Lights Energy Conservation N/A N/ANJ Performing Arts Center 29.915 26.010 NJ Performing Arts Center N/A N/AState Pension Funding 2,612.686 2,573.802 State Pension Funding N/A N/ADept. of Human Services Programs 26.115 23.985 Dept. of Human Services Programs N/A N/AState Office Buildings Acquisition 46.265 43.435 State Office Buildings Acquisition N/A N/ASchool Facilities Construction 7,005.714 7,073.899 (1) School Facilities Construction 5,129.071 4,554.071 Motor Vehicle Commission 159.998 159.998 Motor Vehicle Commission N/A N/AMunicipal Rehabilitation Bonds 171.225 166.075 Municipal Rehabilitation Bonds N/A N/ABusiness Employment Incentive Program 201.850 171.445 Business Employment Incentive Program N/A N/ADesignated Industries Economic Growth & Development Program 28.640 22.375 Designated Industries Economic Growth & Development Program N/A N/AMotor Vehicle Surcharges Revenue 807.502 807.502 Motor Vehicle Surcharges Revenue N/A N/AMotor Vehicle Surcharges Revenue - Special Needs Housing 206.508 206.508 Motor Vehicle Surcharges Revenue - Special Needs Housing - - Cigarette Tax Revenue 1,315.940 1,231.415 Cigarette Tax Revenue N/A N/ALafayette Yard Hotel Project 17.710 17.060 Lafayette Yard Hotel Project N/A N/A
State Capital Construction Project Bond Program 270.000 270.000
Educational Facilities Authority Educational Facilities AuthorityEquipment Leasing Fund 13.320 4.745 Equipment Leasing Fund 86.680 95.255 Facilities Trust Fund 58.435 39.920 Facilities Trust Fund - - Technology Infrastructure Fund 6.165 - Technology Infrastructure Fund - - Capital Improvement Fund 476.475 455.105 Capital Improvement Fund 0.590 0.590 Dormitory Safety Trust Fund 45.830 40.170 Dormitory Safety Trust Fund 10.790 10.790 Public Library Project Grant Program 39.595 37.665 Public Library Project Grant Program - -
Garden State Preservation Trust Garden State Preservation TrustOpen Space & Farmland Preservation Program 1,149.714 1,149.699 Open Space & Farmland Preservation Program - -
Health Care Facilities Financing Authority Health Care Facilities Financing AuthorityDept. of Human Services Lease (Greystone Hospital) 204.330 198.355 Dept. of Human Services Lease (Greystone Hospital) - - Hospital Asset Transformation Program 45.425 449.415 Hospital Asset Transformation Program - -
Sports & Exposition Authority Sports & Exposition AuthorityState Contract Bonds 691.035 671.395 State Contract Bonds N/A N/A
Transportation Trust Fund Authority Transportation Trust Fund AuthorityTransportation System Bonds 8,923.912 10,205.307 Transportation System Bonds 5,936.988 4,398.013
South Jersey Port Corporation South Jersey Port CorporationMarine Terminal Revenue Bonds 123.075 143.790 Marine Terminal Revenue Bonds N/A N/A
State Obligation Totals: 28,959.548$ 30,056.410$
Other Obligations (for which debt service Other Obligations (for which debt serviceis offset by other revenues) is offset by other revenues)NJEDA - Economic Recovery Fund 173.975 167.120 NJEDA - Economic Recovery Fund N/A N/ANJEDA - NJ Transit Light Rail System 469.380 416.325 NJEDA - NJ Transit Light Rail System N/A N/AHigher Education Student Assistance Authority 1,545.135 2,162.010 Higher Education Student Assistance Authority N/A N/ANJ Transit - Transportation Equipment 590.200 956.585 NJ Transit - Transportation Equipment N/A N/ASports & Expo Authority - Convention Center - Luxury Tax 126.020 120.030 Sports & Expo Authority - Convention Center - Luxury Tax N/A N/A
Other Obligation Totals: 2,904.710$ 3,822.070$
TOTAL DEBT OBLIGATIONS: 31,864.257$ 33,878.480$ TOTAL DEBT OBLIGATIONS: 12,181.229$ 10,075.829$
(1) Amounts do not include $400 million School Facilities Construction Notes, 2009 Series A issued June 18, 2009. It is anticipated that these Notes will be refunded prior to their maturity in Fiscal Year 2010.
D-3
Outstanding DebtAs of 6/30
Authorized Unissued DebtAs of 6/30
State of New Jersey
Fiscal Year Comparisons ($ Millions)Outstanding Debt
State of New JerseyAuthorized Unissued Debt
Fiscal Year Comparisons ($ Millions)

Outstanding Debt Reconciliation to the Comprehensive Annual Financial Report (CAFR)
Annual Description Debt Report CAFR (2) Notes
Total Outstanding State Debt and Other Obligations
33,878.480$ (1) 51,246.641$
Obligations Not Included in CAFRChapter 12 - County College Bonds (215.983) Debt is on the various counties' books.NJEDA - Lafayette Yard Hotel Project (17.060) Bonds secured by City of Trenton PILOT revenues.NJEFA - Capital Improvement Fund (138.088) Portion of debt on various colleges' books.NJEFA - Dormitory Safety Trust Fund (21.595) Portion of debt on various colleges' books.South Jersey Port Corporation (143.790) Moral obligation; debt on SJ Port Corporation's books.NJEDA - NJ Transit Light Rail System (416.325) Obligation on NJ Transit Corporation's books.Higher Ed. Student Assistance Authority (2,162.010) Moral obligation; debt on Authority's books.NJ Transit Corp. - Transportation Equipment (956.585) Obligation on NJ Transit Corporation's books.Sports & Expo Auth. - Conv. Center - Luxury Tax (120.030) Revenues from Luxury Tax offset debt service.
Subtotal: (4,191.466)$
Obligations Not Included in ReportCompensated Absences 635.820 Unsecuritized obligations reported in CAFR.Loans Payable 1,279.358 Unsecuritized obligations reported in CAFR.OPEB Liability 6,636.300 GASB accounting requirements.Net Pension Obligation 6,365.698 Unsecuritized obligations reported in CAFR.Other 304.727 Unsecuritized obligations reported in CAFR.Unamortized Premium 1,356.541 GASB accounting requirements.Unamortized Deferral on Refunding (793.694) GASB accounting requirements.Unamortized Discount on CAB's (7,960.065) GASB accounting requirements.Capital Appreciation Bond Accretion 9,667.683 GASB accounting requirements.NJTTFA - Garvee Bonds 105.620 Bonds secured solely by federal grants.Tobacco Settlement Financing Corp. 3,429.696 Bonds secured solely by Corporation revenues.NJEDA - School Facilities Construction Notes 400.000 Short term refundable note.Pollution Remediation Obligation 131.943 New GASB accounting requirements.
Subtotal: 21,559.627$
TOTALS: 51,246.641$ 51,246.641$
($ Millions)
(1) Does not include $400 million School Facilities Construction Notes, 2009 Series A issued June 18, 2009. It is anticipated that these Notes will be refunded prior to their maturity in Fiscal Year 2010.(2) All CAFR numbers are subject to audit and are not final.
E-1

State Debt Programs with Remaining Unissued Authorizations,
Existing and Anticipated Debt Issuances:
A. State Of New Jersey, General Obligation Program
B. Transportation Trust Fund Authority, Transportation Trust Fund Program
C. Economic Development Authority, School Facilities Construction Program
F
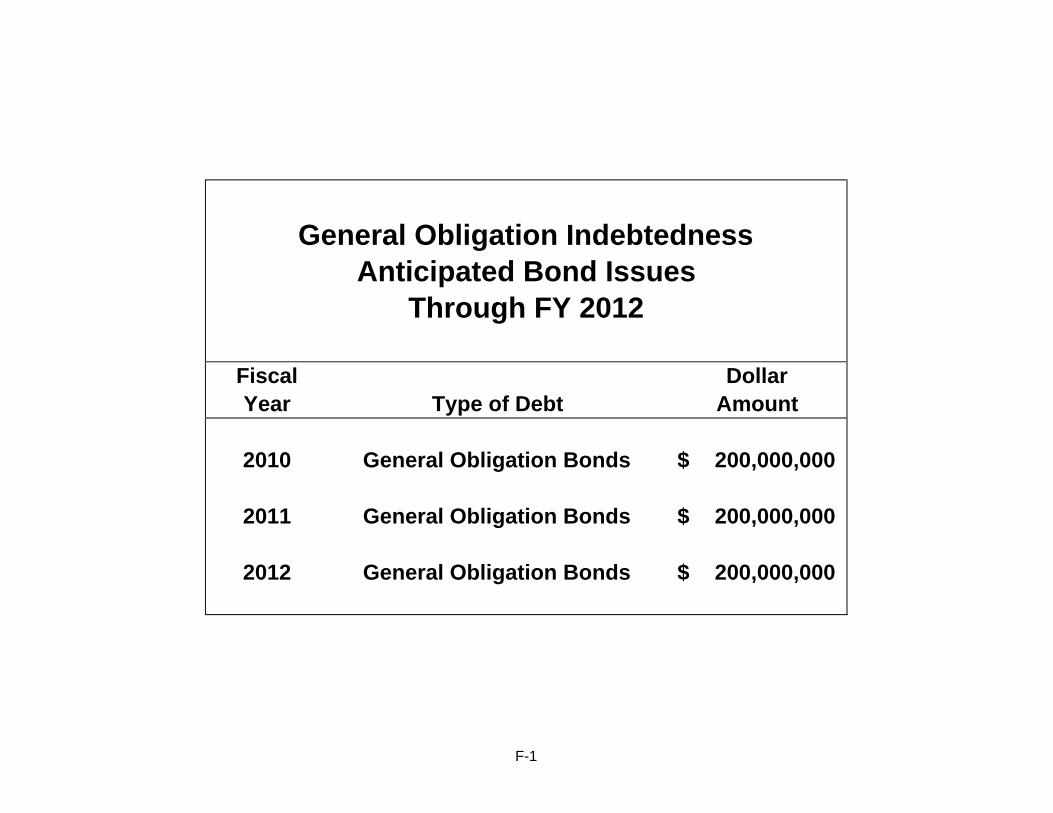
General Obligation IndebtednessAnticipated Bond Issues
Through FY 2012
Fiscal DollarYear Type of Debt Amount
2010 General Obligation Bonds 200,000,000$
2011 General Obligation Bonds 200,000,000$
2012 General Obligation Bonds 200,000,000$
F-1

State of New JerseyGeneral Obligation Bond Program
Debt Service on Existing and Projected Bond Issues
Existing 2010 Issue 2011 Issue 2012 Issue ProjectedFiscal G.O. Projected Projected Projected AggregateYear Debt Service Debt Service Debt Service Debt Service Debt Service2010 263,614,399$ - - - 263,614,399$ 2011 398,183,065 11,875,000$ - - 410,058,0652012 383,608,609 15,489,294 12,500,000$ - 411,597,9032013 379,128,771 15,490,756 15,815,875 13,125,000$ 423,560,4022014 284,198,139 15,487,731 15,819,875 16,152,619 331,658,3642015 283,909,200 15,489,506 15,818,125 16,149,719 331,366,5502016 279,030,956 15,490,250 15,819,875 16,150,019 326,491,1002017 224,466,275 15,489,250 15,819,250 16,147,600 271,922,3752018 204,311,403 15,490,675 15,815,500 16,151,412 251,768,9902019 191,875,072 15,488,694 15,817,625 16,150,406 239,331,7972020 163,327,325 15,487,475 15,819,500 16,148,662 210,782,9622021 49,568,444 15,490,950 15,815,250 16,150,000 97,024,6442022 49,614,069 15,488,169 15,818,750 16,148,238 97,069,2262023 49,645,731 15,488,181 15,818,750 16,152,063 97,104,7252024 35,975,375 15,489,800 15,819,125 16,150,162 83,434,4622025 19,488,750 15,486,956 15,818,625 16,151,225 66,945,5562026 19,492,000 15,488,463 15,816,000 16,148,806 66,945,2692027 19,488,000 15,488,013 15,814,875 16,151,331 66,942,2192028 - 15,489,300 15,818,625 16,152,094 47,460,019 2029 - 15,490,900 15,815,750 16,149,519 47,456,169 2030 - 15,491,387 15,819,625 16,151,769 47,462,781 2031 - 15,489,337 15,818,500 16,151,875 47,459,712 2032 - - 15,815,750 16,148,000 31,963,750 2033 - - - 16,148,044 16,148,044
3,298,925,583$ 321,660,087$ 328,855,250$ 336,128,563$ 4,285,569,483$
Principal 2,526,710,000$ 200,000,000$ 200,000,000$ 200,000,000$ 3,126,710,000$ Interest 772,215,583 121,660,087 128,855,250 136,128,563 1,158,859,483
F-2
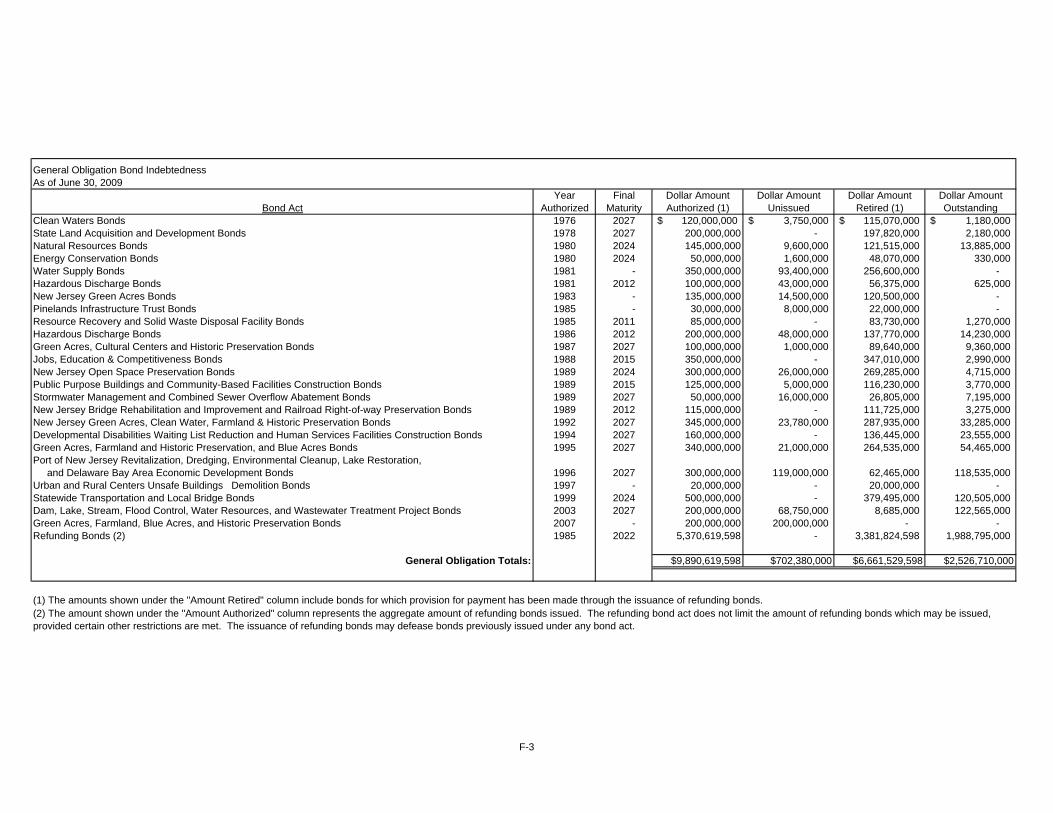
General Obligation Bond IndebtednessAs of June 30, 2009
Year Final Dollar Amount Dollar Amount Dollar Amount Dollar AmountBond Act Authorized Maturity Authorized (1) Unissued Retired (1) Outstanding
Clean Waters Bonds 1976 2027 120,000,000$ 3,750,000$ 115,070,000$ 1,180,000$ State Land Acquisition and Development Bonds 1978 2027 200,000,000 - 197,820,000 2,180,000 Natural Resources Bonds 1980 2024 145,000,000 9,600,000 121,515,000 13,885,000 Energy Conservation Bonds 1980 2024 50,000,000 1,600,000 48,070,000 330,000 Water Supply Bonds 1981 - 350,000,000 93,400,000 256,600,000 - Hazardous Discharge Bonds 1981 2012 100,000,000 43,000,000 56,375,000 625,000 New Jersey Green Acres Bonds 1983 - 135,000,000 14,500,000 120,500,000 - Pinelands Infrastructure Trust Bonds 1985 - 30,000,000 8,000,000 22,000,000 - Resource Recovery and Solid Waste Disposal Facility Bonds 1985 2011 85,000,000 - 83,730,000 1,270,000 Hazardous Discharge Bonds 1986 2012 200,000,000 48,000,000 137,770,000 14,230,000 Green Acres, Cultural Centers and Historic Preservation Bonds 1987 2027 100,000,000 1,000,000 89,640,000 9,360,000 Jobs, Education & Competitiveness Bonds 1988 2015 350,000,000 - 347,010,000 2,990,000 New Jersey Open Space Preservation Bonds 1989 2024 300,000,000 26,000,000 269,285,000 4,715,000 Public Purpose Buildings and Community-Based Facilities Construction Bonds 1989 2015 125,000,000 5,000,000 116,230,000 3,770,000 Stormwater Management and Combined Sewer Overflow Abatement Bonds 1989 2027 50,000,000 16,000,000 26,805,000 7,195,000 New Jersey Bridge Rehabilitation and Improvement and Railroad Right-of-way Preservation Bonds 1989 2012 115,000,000 - 111,725,000 3,275,000 New Jersey Green Acres, Clean Water, Farmland & Historic Preservation Bonds 1992 2027 345,000,000 23,780,000 287,935,000 33,285,000 Developmental Disabilities Waiting List Reduction and Human Services Facilities Construction Bonds 1994 2027 160,000,000 - 136,445,000 23,555,000 Green Acres, Farmland and Historic Preservation, and Blue Acres Bonds 1995 2027 340,000,000 21,000,000 264,535,000 54,465,000 Port of New Jersey Revitalization, Dredging, Environmental Cleanup, Lake Restoration, and Delaware Bay Area Economic Development Bonds 1996 2027 300,000,000 119,000,000 62,465,000 118,535,000 Urban and Rural Centers Unsafe Buildings Demolition Bonds 1997 - 20,000,000 - 20,000,000 - Statewide Transportation and Local Bridge Bonds 1999 2024 500,000,000 - 379,495,000 120,505,000 Dam, Lake, Stream, Flood Control, Water Resources, and Wastewater Treatment Project Bonds 2003 2027 200,000,000 68,750,000 8,685,000 122,565,000 Green Acres, Farmland, Blue Acres, and Historic Preservation Bonds 2007 - 200,000,000 200,000,000 - - Refunding Bonds (2) 1985 2022 5,370,619,598 - 3,381,824,598 1,988,795,000
General Obligation Totals: $9,890,619,598 $702,380,000 $6,661,529,598 $2,526,710,000
(1) The amounts shown under the "Amount Retired" column include bonds for which provision for payment has been made through the issuance of refunding bonds.(2) The amount shown under the "Amount Authorized" column represents the aggregate amount of refunding bonds issued. The refunding bond act does not limit the amount of refunding bonds which may be issued, provided certain other restrictions are met. The issuance of refunding bonds may defease bonds previously issued under any bond act.
F-3

Fiscal DollarYear Type of Debt Amount
2010 Subject To Appropriation 1,409,871,951$
2011* Subject To Appropriation 1,595,379,860$
*Bond authorization expires in Fiscal Year 2011.
NJ Transportation Trust Fund AuthorityAnticipated Debt Issuances
Through FY 2011
F-4
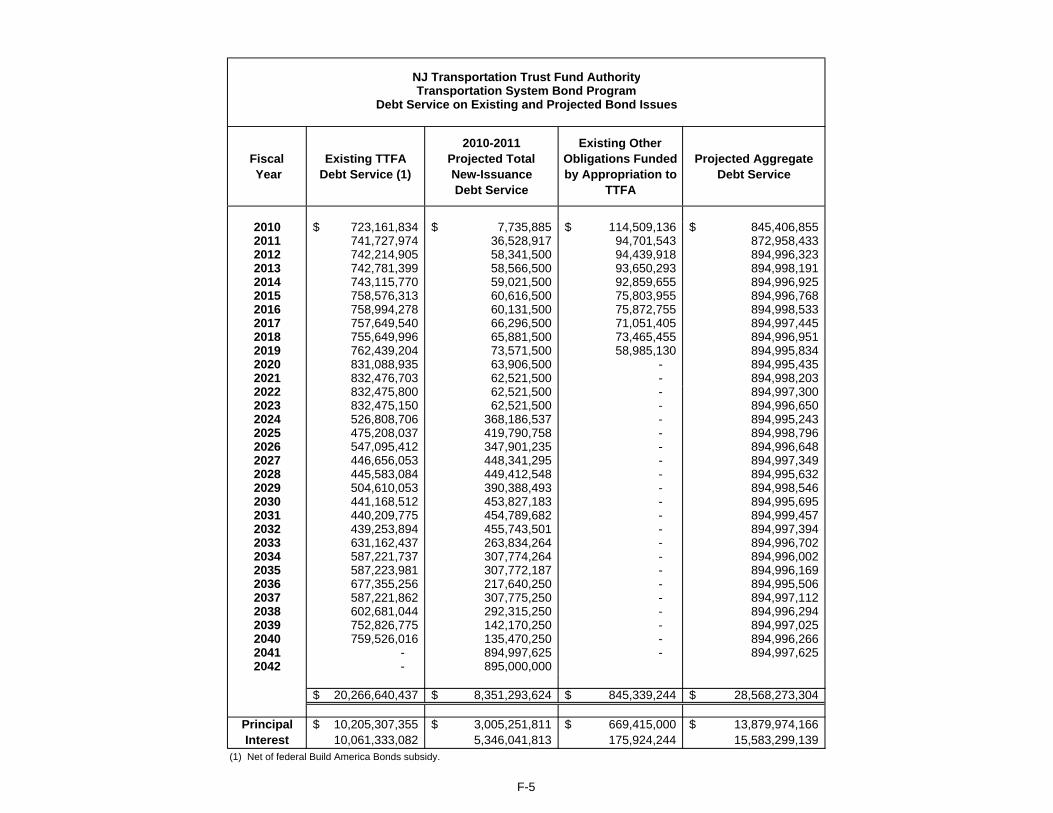
NJ Transportation Trust Fund AuthorityTransportation System Bond Program
Debt Service on Existing and Projected Bond Issues
Fiscal Year
Existing TTFA Debt Service (1)
2010-2011 Projected Total New-Issuance Debt Service
Existing Other Obligations Funded by Appropriation to
TTFA
Projected Aggregate Debt Service
2010 723,161,834$ 7,735,885$ 114,509,136$ 845,406,855$ 2011 741,727,974 36,528,917 94,701,543 872,958,4332012 742,214,905 58,341,500 94,439,918 894,996,3232013 742,781,399 58,566,500 93,650,293 894,998,1912014 743,115,770 59,021,500 92,859,655 894,996,9252015 758,576,313 60,616,500 75,803,955 894,996,7682016 758,994,278 60,131,500 75,872,755 894,998,5332017 757,649,540 66,296,500 71,051,405 894,997,4452018 755,649,996 65,881,500 73,465,455 894,996,9512019 762,439,204 73,571,500 58,985,130 894,995,8342020 831,088,935 63,906,500 - 894,995,4352021 832,476,703 62,521,500 - 894,998,2032022 832,475,800 62,521,500 - 894,997,3002023 832,475,150 62,521,500 - 894,996,6502024 526,808,706 368,186,537 - 894,995,2432025 475,208,037 419,790,758 - 894,998,7962026 547,095,412 347,901,235 - 894,996,6482027 446,656,053 448,341,295 - 894,997,3492028 445,583,084 449,412,548 - 894,995,6322029 504,610,053 390,388,493 - 894,998,5462030 441,168,512 453,827,183 - 894,995,6952031 440,209,775 454,789,682 - 894,999,4572032 439,253,894 455,743,501 - 894,997,3942033 631,162,437 263,834,264 - 894,996,7022034 587,221,737 307,774,264 - 894,996,0022035 587,223,981 307,772,187 - 894,996,1692036 677,355,256 217,640,250 - 894,995,5062037 587,221,862 307,775,250 - 894,997,1122038 602,681,044 292,315,250 - 894,996,2942039 752,826,775 142,170,250 - 894,997,0252040 759,526,016 135,470,250 - 894,996,2662041 - 894,997,625 - 894,997,6252042 - 895,000,000
20,266,640,437$ 8,351,293,624$ 845,339,244$ 28,568,273,304$
Principal 10,205,307,355$ 3,005,251,811$ 669,415,000$ 13,879,974,166$ Interest 10,061,333,082 5,346,041,813 175,924,244 15,583,299,139
(1) Net of federal Build America Bonds subsidy.
F-5

Fiscal DollarYear Type of Debt Amount
2010 Subject To Appropriation 1,100,000,000$
2011 Subject To Appropriation 1,000,000,000$
2012 Subject To Appropriation 1,000,000,000$
2013 Subject To Appropriation 1,000,000,000$
New Jersey Economic Development AuthoritySchool Construction Funding Program
Anticipated Bond Issuance Through FY 2013
F-6
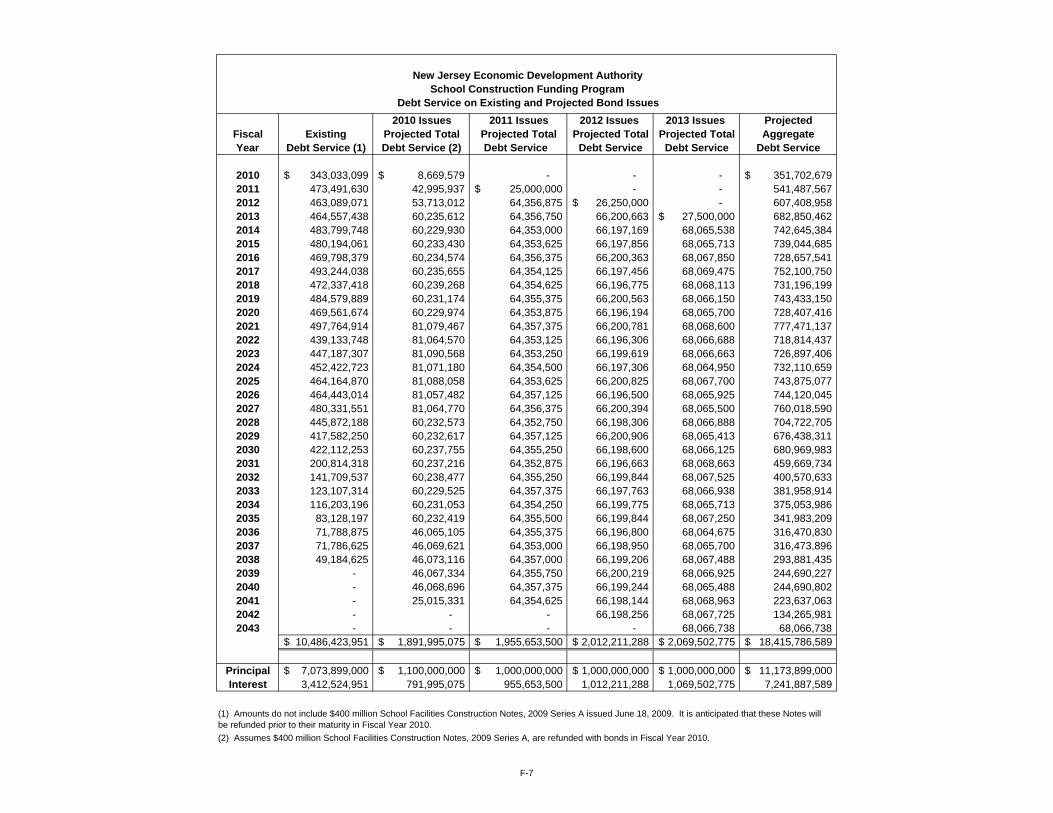
New Jersey Economic Development AuthoritySchool Construction Funding Program
Debt Service on Existing and Projected Bond Issues2010 Issues 2011 Issues 2012 Issues 2013 Issues Projected
Fiscal Existing Projected Total Projected Total Projected Total Projected Total AggregateYear Debt Service (1) Debt Service (2) Debt Service Debt Service Debt Service Debt Service
2010 343,033,099$ 8,669,579$ - - - 351,702,679$ 2011 473,491,630 42,995,937 25,000,000$ - - 541,487,5672012 463,089,071 53,713,012 64,356,875 26,250,000$ - 607,408,9582013 464,557,438 60,235,612 64,356,750 66,200,663 27,500,000$ 682,850,4622014 483,799,748 60,229,930 64,353,000 66,197,169 68,065,538 742,645,3842015 480,194,061 60,233,430 64,353,625 66,197,856 68,065,713 739,044,6852016 469,798,379 60,234,574 64,356,375 66,200,363 68,067,850 728,657,5412017 493,244,038 60,235,655 64,354,125 66,197,456 68,069,475 752,100,7502018 472,337,418 60,239,268 64,354,625 66,196,775 68,068,113 731,196,1992019 484,579,889 60,231,174 64,355,375 66,200,563 68,066,150 743,433,1502020 469,561,674 60,229,974 64,353,875 66,196,194 68,065,700 728,407,4162021 497,764,914 81,079,467 64,357,375 66,200,781 68,068,600 777,471,1372022 439,133,748 81,064,570 64,353,125 66,196,306 68,066,688 718,814,4372023 447,187,307 81,090,568 64,353,250 66,199,619 68,066,663 726,897,4062024 452,422,723 81,071,180 64,354,500 66,197,306 68,064,950 732,110,6592025 464,164,870 81,088,058 64,353,625 66,200,825 68,067,700 743,875,0772026 464,443,014 81,057,482 64,357,125 66,196,500 68,065,925 744,120,0452027 480,331,551 81,064,770 64,356,375 66,200,394 68,065,500 760,018,5902028 445,872,188 60,232,573 64,352,750 66,198,306 68,066,888 704,722,7052029 417,582,250 60,232,617 64,357,125 66,200,906 68,065,413 676,438,3112030 422,112,253 60,237,755 64,355,250 66,198,600 68,066,125 680,969,9832031 200,814,318 60,237,216 64,352,875 66,196,663 68,068,663 459,669,7342032 141,709,537 60,238,477 64,355,250 66,199,844 68,067,525 400,570,6332033 123,107,314 60,229,525 64,357,375 66,197,763 68,066,938 381,958,9142034 116,203,196 60,231,053 64,354,250 66,199,775 68,065,713 375,053,9862035 83,128,197 60,232,419 64,355,500 66,199,844 68,067,250 341,983,2092036 71,788,875 46,065,105 64,355,375 66,196,800 68,064,675 316,470,8302037 71,786,625 46,069,621 64,353,000 66,198,950 68,065,700 316,473,8962038 49,184,625 46,073,116 64,357,000 66,199,206 68,067,488 293,881,4352039 - 46,067,334 64,355,750 66,200,219 68,066,925 244,690,2272040 - 46,068,696 64,357,375 66,199,244 68,065,488 244,690,8022041 - 25,015,331 64,354,625 66,198,144 68,068,963 223,637,0632042 - - - 66,198,256 68,067,725 134,265,9812043 - - - - 68,066,738 68,066,738
10,486,423,951$ 1,891,995,075$ 1,955,653,500$ 2,012,211,288$ 2,069,502,775$ 18,415,786,589$
Principal 7,073,899,000$ 1,100,000,000$ 1,000,000,000$ 1,000,000,000$ 1,000,000,000$ 11,173,899,000$ Interest 3,412,524,951 791,995,075 955,653,500 1,012,211,288 1,069,502,775 7,241,887,589
(1) Amounts do not include $400 million School Facilities Construction Notes, 2009 Series A issued June 18, 2009. It is anticipated that these Notes will be refunded prior to their maturity in Fiscal Year 2010.(2) Assumes $400 million School Facilities Construction Notes, 2009 Series A, are refunded with bonds in Fiscal Year 2010.
F-7

State of New JerseyState Comparisons of Selected Indicators and Rankings
+ Hypothetical $500mm new debt + Hypothetical $1,000mm new debtNJ's NJ's NJ's
Category Criteria Ranking Criteria Ranking Criteria RankingNet Tax-Supported Debt Per Capita $3,621 4* $3,679 3 $3,736 3
Net Tax-Supported Debt as a Percentageof 2007 Personal Income 7.3% 4** 7.2% 4 7.3% 4
Total Net Tax-Supported Debt ($ millions) $31,438 3*** $31,938 3 $32,438 3
Notes:(1) Source: 2009 State Debt Medians published by Moody's Investors Service, July, 2009. (Report Attached)
* Top 5 ranking (in order) includes: Connecticut, Massachusetts, Hawaii, New Jersey, New York.
** Top 5 ranking (in order) includes: Hawaii, Massachusetts, Connecticut, New Jersey, New York.
*** Top 5 ranking (in order) includes: California, New York, New Jersey, Massachusetts, Illinois.
2009 Medians are based on net tax supported debt as calculated by Moody's as of calendar year-end 2008; estimated personal income for 2007 from the U.S. Department of Commerce, Bureau of Economic Analysis; and estimated population for 2008 from the U.S. Census Bureau.
2007 estimated personal income is approximately $442.116 billion and 2008 estimated population is 8,682,261.
Hypothetical State rankings are imprecise as they reflect projected information for New Jersey only.
2009 State Debt Medians (1)
G-1

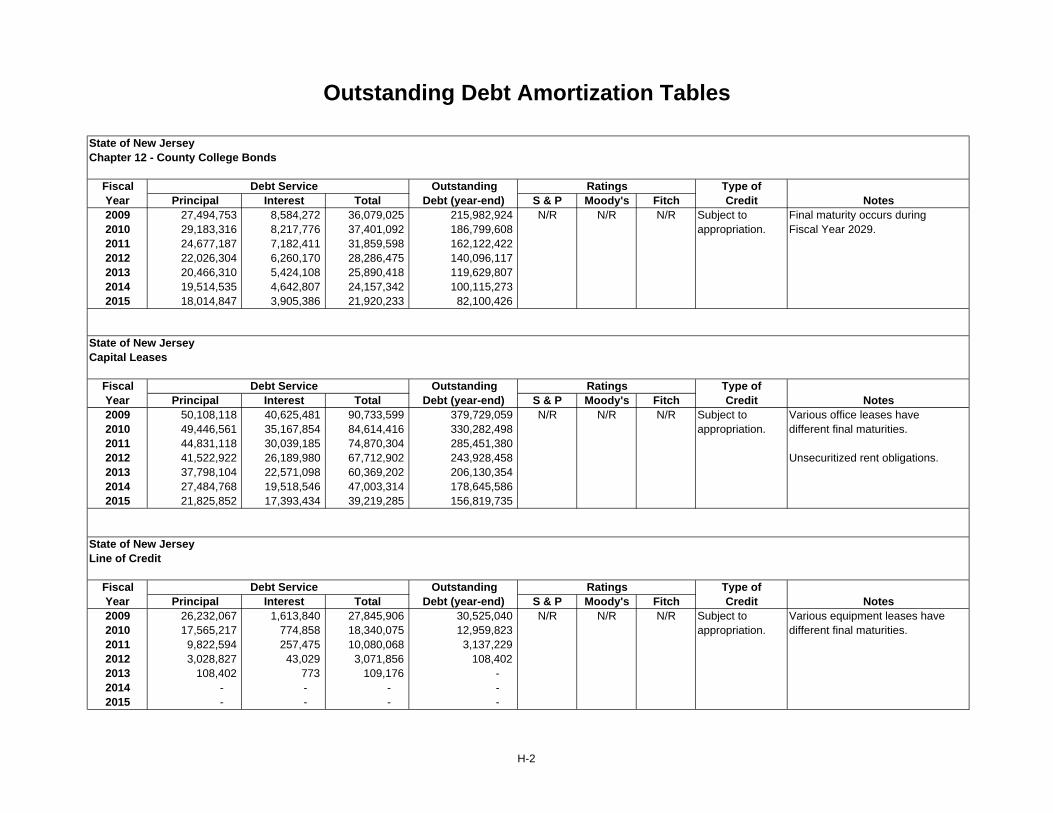
Outstanding Debt Amortization Tables
State of New JerseyGeneral Obligation Bonds
Fiscal Debt Service Outstanding Ratings Type ofYear Principal Interest Total Debt (year-end) S & P Moody's Fitch Credit Notes2009 255,525,482 157,783,396 413,308,878 2,526,710,000 AA Aa3 AA- Gen. Obligation Final maturity occurs during 2010 139,120,000 124,494,399 263,614,399 2,387,590,000 Fiscal Year 2027.2011 276,380,000 121,803,065 398,183,065 2,111,210,0002012 280,535,000 103,073,609 383,608,609 1,830,675,0002013 288,945,000 90,183,771 379,128,771 1,541,730,0002014 209,590,000 74,608,139 284,198,139 1,332,140,0002015 220,490,000 63,419,200 283,909,200 1,111,650,000
State of New JerseyJames J. Howard Marine Sciences Laboratory
Fiscal Debt Service Outstanding Ratings Type ofYear Principal Interest Total Debt (year-end) S & P Moody's Fitch Credit Notes2009 710,000 445,513 1,155,513 4,605,000 AA- A1 N/R Subject to Final maturity occurs during2010 770,000 379,800 1,149,800 3,835,000 appropriation. Fiscal Year 2014.2011 840,000 307,350 1,147,350 2,995,0002012 915,000 228,375 1,143,375 2,080,0002013 995,000 142,425 1,137,425 1,085,0002014 1,085,000 48,825 1,133,825 - 2015 - - - -
H-1
Outstanding Debt Amortization Tables
State of New JerseyChapter 12 - County College Bonds
Fiscal Debt Service Outstanding Ratings Type ofYear Principal Interest Total Debt (year-end) S & P Moody's Fitch Credit Notes2009 27,494,753 8,584,272 36,079,025 215,982,924 N/R N/R N/R Subject to Final maturity occurs during2010 29,183,316 8,217,776 37,401,092 186,799,608 appropriation. Fiscal Year 2029.2011 24,677,187 7,182,411 31,859,598 162,122,4222012 22,026,304 6,260,170 28,286,475 140,096,1172013 20,466,310 5,424,108 25,890,418 119,629,8072014 19,514,535 4,642,807 24,157,342 100,115,2732015 18,014,847 3,905,386 21,920,233 82,100,426
State of New JerseyCapital Leases
Fiscal Debt Service Outstanding Ratings Type ofYear Principal Interest Total Debt (year-end) S & P Moody's Fitch Credit Notes2009 50,108,118 40,625,481 90,733,599 379,729,059 N/R N/R N/R Subject to Various office leases have2010 49,446,561 35,167,854 84,614,416 330,282,498 appropriation. different final maturities.2011 44,831,118 30,039,185 74,870,304 285,451,3802012 41,522,922 26,189,980 67,712,902 243,928,458 Unsecuritized rent obligations.2013 37,798,104 22,571,098 60,369,202 206,130,3542014 27,484,768 19,518,546 47,003,314 178,645,5862015 21,825,852 17,393,434 39,219,285 156,819,735
State of New JerseyLine of Credit
Fiscal Debt Service Outstanding Ratings Type ofYear Principal Interest Total Debt (year-end) S & P Moody's Fitch Credit Notes2009 26,232,067 1,613,840 27,845,906 30,525,040 N/R N/R N/R Subject to Various equipment leases have2010 17,565,217 774,858 18,340,075 12,959,823 appropriation. different final maturities.2011 9,822,594 257,475 10,080,068 3,137,2292012 3,028,827 43,029 3,071,856 108,4022013 108,402 773 109,176 - 2014 - - - - 2015 - - - -
H-2

Outstanding Debt Amortization Tables
NJ Building AuthorityState Building Revenue Bonds
Fiscal Debt Service Outstanding Ratings Type ofYear Principal Interest Total Debt (year-end) S & P Moody's Fitch Credit Notes2009 34,735,000 24,524,336 59,259,336 672,485,000 AA- A1 A+ Subject to Final maturity occurs on 6/15/27.2010 41,785,000 24,105,589 65,890,589 630,700,000 appropriation.2011 43,550,000 22,315,997 65,865,997 587,150,0002012 67,390,000 20,032,233 87,422,233 519,760,0002013 70,785,000 17,037,545 87,822,545 448,975,0002014 56,620,000 13,977,906 70,597,906 392,355,0002015 45,020,000 11,893,672 56,913,672 347,335,000
NJ Economic Development AuthorityTrenton Office Complex
Fiscal Debt Service Outstanding Ratings Type ofYear Principal Interest Total Debt (year-end) S & P Moody's Fitch Credit Notes2009 8,310,000 1,887,900 10,197,900 27,650,000 AA- A1 A+ Subject to Final maturity occurs on 6/15/12.2010 8,745,000 1,451,625 10,196,625 18,905,000 appropriation.2011 9,210,000 992,513 10,202,513 9,695,0002012 9,695,000 508,988 10,203,988 - 2013 - - - - 2014 - - - - 2015 - - - -
NJ Economic Development AuthorityLiberty State Park, Park Project
Fiscal Debt Service Outstanding Ratings Type ofYear Principal Interest Total Debt (year-end) S & P Moody's Fitch Credit Notes2009 215,116 1,034,736 1,249,853 12,510,895 AA- A1 A+ Subject to Final maturity occurs on 3/15/22.2010 220,003 1,066,340 1,286,343 12,290,892 appropriation.2011 225,550 1,101,943 1,327,493 12,065,3432012 230,343 1,137,950 1,368,293 11,835,0002013 730,000 678,793 1,408,793 11,105,0002014 810,000 637,183 1,447,183 10,295,0002015 905,000 591,013 1,496,013 9,390,000
H-3

Outstanding Debt Amortization Tables
NJ Economic Development AuthorityLiberty State Park, Liberty Science Center
Fiscal Debt Service Outstanding Ratings Type ofYear Principal Interest Total Debt (year-end) S & P Moody's Fitch Credit Notes2009 2,515,000 4,455,996 6,970,996 90,900,000 AA- A1 A+ Subject to Final maturity occurs on 3/15/27.2010 2,485,000 4,369,684 6,854,684 88,415,000 appropriation.2011 2,565,000 4,280,544 6,845,544 85,850,0002012 3,240,000 4,185,906 7,425,906 82,610,0002013 3,345,000 4,044,881 7,389,881 79,265,0002014 3,450,000 3,898,169 7,348,169 75,815,0002015 3,565,000 3,734,606 7,299,606 72,250,000
NJ Economic Development AuthorityMarket Transition Facility
Fiscal Debt Service Outstanding Ratings Type ofYear Principal Interest Total Debt (year-end) S & P Moody's Fitch Credit Notes2009 61,470,000 10,319,250 71,789,250 175,650,000 AA- A1 N/R Subject to Final maturity occurs on 7/1/12.2010 64,545,000 7,168,875 71,713,875 111,105,000 appropriation - 2011 67,770,000 3,861,000 71,631,000 43,335,000 driver surcharges.2012 43,335,000 1,083,375 44,418,375 - 2013 - - - - 2014 - - - - 2015 - - - -
NJ Economic Development AuthorityGreen Lights Energy Conservation
Fiscal Debt Service Outstanding Ratings Type ofYear Principal Interest Total Debt (year-end) S & P Moody's Fitch Credit Notes2009 270,000 42,750 312,750 585,000 AA- A1 A+ Subject to Final maturity occurs on 1/15/11.2010 285,000 29,250 314,250 300,000 appropriation.2011 300,000 15,000 315,000 - 2012 - - - - 2013 - - - - 2014 - - - - 2015 - - - -
H-4

Outstanding Debt Amortization Tables
NJ Economic Development AuthorityNewark Performing Arts Center
Fiscal Debt Service Outstanding Ratings Type ofYear Principal Interest Total Debt (year-end) S & P Moody's Fitch Credit Notes2009 3,905,000 1,637,020 5,542,020 26,010,000 AA- A1 A+ Subject to Final maturity occurs on 6/15/16.2010 4,125,000 1,419,625 5,544,625 21,885,000 appropriation.2011 4,355,000 1,187,365 5,542,365 17,530,0002012 4,600,000 942,145 5,542,145 12,930,0002013 2,980,000 680,270 3,660,270 9,950,0002014 3,145,000 516,370 3,661,370 6,805,0002015 3,320,000 340,250 3,660,250 3,485,000
NJ Economic Development AuthorityState Pension Funding Bonds
Fiscal Debt Service Outstanding Ratings Type ofYear Principal Interest Total Debt (year-end) S & P Moody's Fitch Credit Notes2009 38,883,366 173,294,311 212,177,677 2,573,802,271 AA- A1 A+ Subject to Final maturity occurs on 2/15/29.2010 43,334,860 187,228,817 230,563,677 2,530,467,412 appropriation.2011 46,906,803 202,264,874 249,171,677 2,483,560,6082012 50,670,718 219,800,959 270,471,677 2,432,889,8912013 53,950,205 239,476,472 293,426,677 2,378,939,6862014 56,656,499 260,053,178 316,709,677 2,322,283,1872015 59,217,290 282,509,387 341,726,677 2,263,065,897
NJ Economic Development AuthorityHuman Services Facilities Programs
Fiscal Debt Service Outstanding Ratings Type ofYear Principal Interest Total Debt (year-end) S & P Moody's Fitch Credit Notes2009 2,130,000 1,348,345 3,478,345 23,985,000 A N/R N/R Subject to Final maturity occurs on 7/1/32.2010 2,050,000 1,247,409 3,297,409 21,935,000 appropriation.2011 2,010,000 1,144,269 3,154,269 19,925,0002012 1,955,000 1,038,599 2,993,599 17,970,0002013 1,940,000 934,724 2,874,724 16,030,0002014 1,820,000 829,123 2,649,123 14,210,0002015 1,790,000 722,300 2,512,300 12,420,000
H-5

Outstanding Debt Amortization Tables
NJ Economic Development AuthorityState Office Buildings Acquisition
Fiscal Debt Service Outstanding Ratings Type ofYear Principal Interest Total Debt (year-end) S & P Moody's Fitch Credit Notes2009 2,830,000 2,432,750 5,262,750 43,435,000 AA- A1 A+ Subject to Final maturity occurs on 6/15/20.2010 2,990,000 2,275,650 5,265,650 40,445,000 appropriation.2011 3,160,000 2,102,713 5,262,713 37,285,0002012 3,345,000 1,920,013 5,265,013 33,940,0002013 3,535,000 1,724,938 5,259,938 30,405,0002014 3,720,000 1,539,350 5,259,350 26,685,0002015 3,920,000 1,344,050 5,264,050 22,765,000
NJ Economic Development AuthoritySchool Facilities Construction (1)
Fiscal Debt Service Outstanding Ratings Type ofYear Principal Interest Total Debt (year-end) S & P Moody's Fitch Credit Notes2009 109,595,000 268,854,083 378,449,083 7,073,899,000 AA- A1 A+ Subject to Final maturity occurs on 9/1/37.2010 72,090,000 270,943,099 343,033,099 7,001,809,000 appropriation.2011 211,260,000 262,231,630 473,491,630 6,790,549,0002012 209,970,000 253,119,071 463,089,071 6,580,579,0002013 221,060,000 243,497,438 464,557,438 6,359,519,0002014 252,015,000 231,784,748 483,799,748 6,107,504,0002015 260,760,000 219,434,061 480,194,061 5,846,744,000
(1) Amounts do not include $400 million School Facilities Construction Notes, 2009 Series A issued June 18, 2009. It is anticipated that these Notes will be refunded prior to their maturity in Fiscal Year 2010.
NJ Economic Development AuthorityMotor Vehicle Commission
Fiscal Debt Service Outstanding Ratings Type ofYear Principal Interest Total Debt (year-end) S & P Moody's Fitch Credit Notes2009 - - - 159,998,107 AA- A1 N/R Subject to Final maturity occurs on 7/1/15. 2010 - - - 159,998,107 appropriation.2011 - - - 159,998,1072012 53,500,120 19,824,880.25 73,325,000 106,497,9882013 51,007,803 22,317,197 73,325,000 55,490,1852014 48,403,299 24,921,701 73,325,000 7,086,8862015 7,086,886 4,193,114 11,280,000 -
H-6
Outstanding Debt Amortization Tables
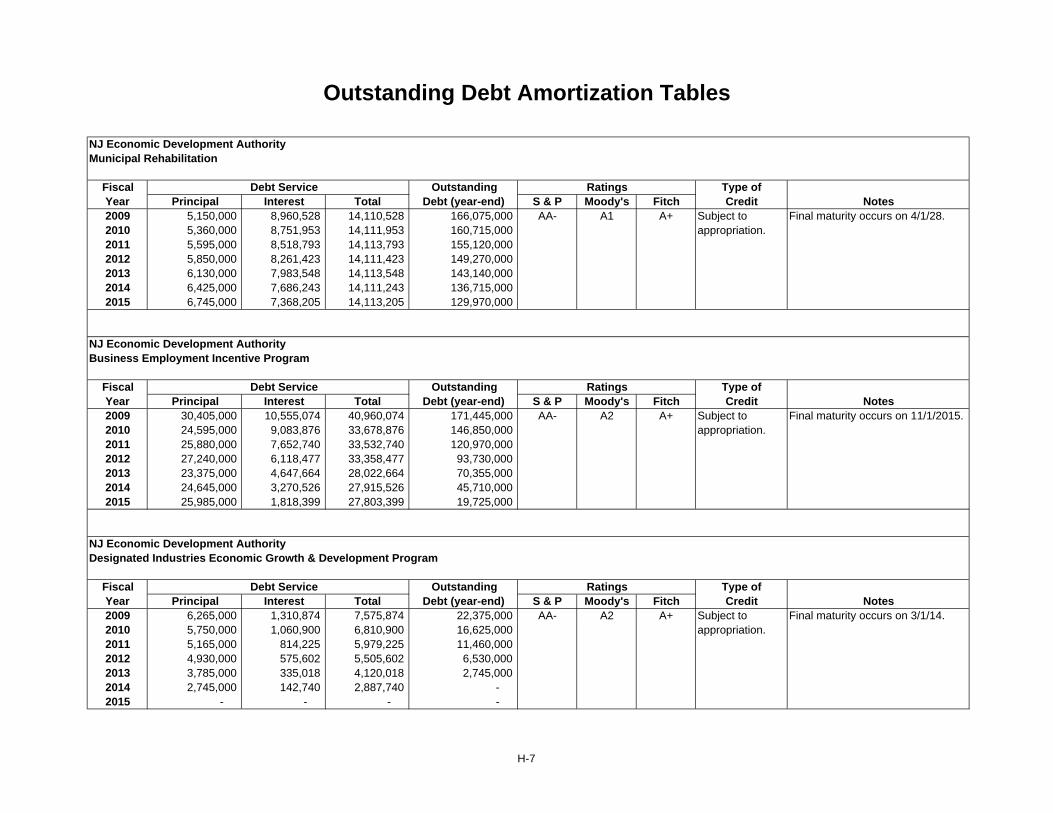
NJ Economic Development AuthorityMunicipal Rehabilitation
Fiscal Debt Service Outstanding Ratings Type ofYear Principal Interest Total Debt (year-end) S & P Moody's Fitch Credit Notes2009 5,150,000 8,960,528 14,110,528 166,075,000 AA- A1 A+ Subject to Final maturity occurs on 4/1/28.2010 5,360,000 8,751,953 14,111,953 160,715,000 appropriation.2011 5,595,000 8,518,793 14,113,793 155,120,0002012 5,850,000 8,261,423 14,111,423 149,270,0002013 6,130,000 7,983,548 14,113,548 143,140,0002014 6,425,000 7,686,243 14,111,243 136,715,0002015 6,745,000 7,368,205 14,113,205 129,970,000
NJ Economic Development AuthorityBusiness Employment Incentive Program
Fiscal Debt Service Outstanding Ratings Type ofYear Principal Interest Total Debt (year-end) S & P Moody's Fitch Credit Notes2009 30,405,000 10,555,074 40,960,074 171,445,000 AA- A2 A+ Subject to Final maturity occurs on 11/1/2015.2010 24,595,000 9,083,876 33,678,876 146,850,000 appropriation.2011 25,880,000 7,652,740 33,532,740 120,970,0002012 27,240,000 6,118,477 33,358,477 93,730,0002013 23,375,000 4,647,664 28,022,664 70,355,0002014 24,645,000 3,270,526 27,915,526 45,710,000 2015 25,985,000 1,818,399 27,803,399 19,725,000
NJ Economic Development AuthorityDesignated Industries Economic Growth & Development Program
Fiscal Debt Service Outstanding Ratings Type ofYear Principal Interest Total Debt (year-end) S & P Moody's Fitch Credit Notes2009 6,265,000 1,310,874 7,575,874 22,375,000 AA- A2 A+ Subject to Final maturity occurs on 3/1/14.2010 5,750,000 1,060,900 6,810,900 16,625,000 appropriation.2011 5,165,000 814,225 5,979,225 11,460,0002012 4,930,000 575,602 5,505,602 6,530,0002013 3,785,000 335,018 4,120,018 2,745,0002014 2,745,000 142,740 2,887,740 - 2015 - - - -
H-7

Outstanding Debt Amortization Tables
NJ Economic Development AuthorityMotor Vehicle Surcharge Revenue
Fiscal Debt Service Outstanding Ratings Type ofYear Principal Interest Total Debt (year-end) S & P Moody's Fitch Credit Notes2009 - 37,763,281 37,763,281 807,502,356 A Baa1 N/R Subject to Final maturity occurs on 7/1/35.2010 - 37,763,281 37,763,281 807,502,356 appropriation.2011 - 37,763,281 37,763,281 807,502,3562012 27,730,000 37,176,169 64,906,169 779,772,3562013 - 36,589,056 36,589,056 779,772,3562014 - 36,589,056 36,589,056 779,772,3562015 - 36,589,056 36,589,056 779,772,356
NJ Economic Development AuthorityMotor Vehicle Surcharge Revenue (Special Needs Housing)
Fiscal Debt Service Outstanding Ratings Type ofYear Principal Interest Total Debt (year-end) S & P Moody's Fitch Credit Notes2009 - 1,756,288.59 5,546,175 206,508,197 A Baa1 N/R Subject to Final maturity occurs on 7/1/27.2010 - 5,546,174.50 5,546,175 206,508,197 appropriation.2011 - 5,546,174.50 5,546,175 206,508,1972012 - 5,546,174.50 5,546,175 206,508,1972013 - 5,546,174.50 5,546,175 206,508,1972014 - 5,546,174.50 5,546,175 206,508,1972015 - 5,546,174.50 5,546,175 206,508,197
NJ Economic Development AuthorityCigarette Tax Revenue
Fiscal Debt Service Outstanding Ratings Type ofYear Principal Interest Total Debt (year-end) S & P Moody's Fitch Credit Notes2009 58,300,000 70,572,650 128,872,650 1,231,415,000 BBB Baa2 BBB Subject to Final maturity occurs on 6/15/34.2010 56,485,000 67,657,650 124,142,650 1,174,930,000 appropriation.2011 54,555,000 64,833,400 119,388,400 1,120,375,0002012 52,585,000 62,105,650 114,690,650 1,067,790,0002013 50,755,000 59,476,400 110,231,400 1,017,035,0002014 53,365,000 56,938,650 110,303,650 963,670,0002015 53,760,000 54,070,281 107,830,281 909,910,000
H-8

Outstanding Debt Amortization TablesNJ Economic Development AuthorityLafayette Yard Hotel Project
Fiscal Debt Service Outstanding Ratings Type ofYear Principal Interest Total Debt (year-end) S & P Moody's Fitch Credit Notes2009 650,000 928,643 1,578,643 17,060,000 AA- A1 A+ Subject to Final maturity occurs on 4/1/20.2010 760,000 896,163 1,656,163 16,300,000 appropriation.2011 880,000 858,064 1,738,064 15,420,0002012 1,015,000 813,510 1,828,510 14,405,0002013 1,155,000 761,917 1,916,917 13,250,0002014 1,310,000 702,978 2,012,978 11,940,0002015 1,480,000 635,264 2,115,264 10,460,000
NJ Educational Facilities AuthorityEquipment Leasing Fund
Fiscal Debt Service Outstanding Ratings Type ofYear Principal Interest Total Debt (year-end) S & P Moody's Fitch Credit Notes2009 8,575,000 433,725 9,008,725 4,745,000 AA- A1 A+ Subject to Final maturity occurs on 3/1/12.2010 3,805,000 124,225 3,929,225 940,000 appropriation.2011 490,000 21,750 511,750 450,0002012 450,000 7,200 457,200 - 2013 - - - - 2014 - - - - 2015 - - - -
NJ Educational Facilities AuthorityHigher Education Facilities Trust Fund
Fiscal Debt Service Outstanding Ratings Type ofYear Principal Interest Total Debt (year-end) S & P Moody's Fitch Credit Notes2009 18,515,000 2,458,875 20,973,875 39,920,000 AA- A1 A+ Subject to Final maturity occurs on 3/1/11.2010 19,460,000 1,509,500 20,969,500 20,460,000 appropriation.2011 20,460,000 511,500 20,971,500 - 2012 - - - - 2013 - - - - 2014 - - - - 2015 - - - -
H-9

Outstanding Debt Amortization Tables
NJ Educational Facilities AuthorityHigher Education Technology Infrastructure Fund
Fiscal Debt Service Outstanding Ratings Type ofYear Principal Interest Total Debt (year-end) S & P Moody's Fitch Credit Notes2009 6,165,000 181,097 6,346,097 - AA- A1 A+ Subject to Final maturity occurs on 3/1/09.2010 - - - - appropriation.2011 - - - - 2012 - - - - 2013 - - - - 2014 - - - - 2015 - - - -
NJ Educational Facilities AuthorityHigher Education Capital Improvement Fund
Fiscal Debt Service Outstanding Ratings Type ofYear Principal Interest Total Debt (year-end) S & P Moody's Fitch Credit Notes2009 21,370,000 22,516,875 43,886,875 455,105,000 AA- A1 A+ Subject to Final maturity occurs on 3/1/25.2010 22,425,000 21,462,506 43,887,506 432,680,000 appropriation.2011 23,575,000 20,306,731 43,881,731 409,105,0002012 24,840,000 19,045,594 43,885,594 384,265,0002013 26,170,000 17,708,588 43,878,588 358,095,0002014 27,550,000 16,332,738 43,882,738 330,545,0002015 28,955,000 14,929,438 43,884,438 301,590,000
NJ Educational Facilities AuthorityDormitory Safety Trust Fund
Fiscal Debt Service Outstanding Ratings Type ofYear Principal Interest Total Debt (year-end) S & P Moody's Fitch Credit Notes2009 5,660,000 2,231,871 7,891,871 40,170,000 AA- A1 A+ Subject to Final maturity occurs on 3/1/18.2010 5,650,000 1,938,044 7,588,044 34,520,000 appropriation.2011 5,640,000 1,644,576 7,284,576 28,880,0002012 5,640,000 1,351,794 6,991,794 23,240,0002013 5,635,000 1,106,821 6,741,821 17,605,0002014 5,635,000 853,966 6,488,966 11,970,0002015 5,630,000 595,410 6,225,410 6,340,000
H-10

Outstanding Debt Amortization Tables
NJ Educational Facilities AuthorityPublic Library Project Grant Program
Fiscal Debt Service Outstanding Ratings Type ofYear Principal Interest Total Debt (year-end) S & P Moody's Fitch Credit Notes2009 1,930,000 1,846,648 3,776,648 37,665,000 AA- A1 A+ Subject to Final maturity occurs on 3/1/23.2010 1,995,000 1,779,456 3,774,456 35,670,000 appropriation.2011 2,065,000 1,708,870 3,773,870 33,605,0002012 2,140,000 1,618,200 3,758,200 31,465,0002013 2,245,000 1,519,800 3,764,800 29,220,0002014 2,335,000 1,428,200 3,763,200 26,885,0002015 2,430,000 1,320,750 3,750,750 24,455,000
Garden State Preservation TrustOpen Space & Farmland Preservation Program
Fiscal Debt Service Outstanding Ratings Type ofYear Principal Interest Total Debt (year-end) S & P Moody's Fitch Credit Notes2009 15,000 59,146,678 59,161,678 1,149,699,410 AAA Aa3 AA- Subject to Final maturity occurs on 5/1/29.2010 39,950,000 58,043,346 97,993,346 1,109,749,410 appropriation.2011 42,215,000 55,775,158 97,990,158 1,067,534,4102012 44,650,000 53,344,778 97,994,778 1,022,884,4102013 47,255,000 50,741,652 97,996,652 975,629,4102014 50,050,000 47,942,576 97,992,576 925,579,4102015 53,070,000 44,924,411 97,994,411 872,509,410
Health Care Facilities Financing AuthorityDept. of Human Services Lease (Greystone Hospital)
Fiscal Debt Service Outstanding Ratings Type ofYear Principal Interest Total Debt (year-end) S & P Moody's Fitch Credit Notes2009 5,975,000 9,648,525 15,623,525 198,355,000 AA- A1 A+ Subject to Final maturity occurs on 3/15/29.2010 6,245,000 9,380,385 15,625,385 192,110,000 appropriation.2011 6,525,000 9,097,094 15,622,094 185,585,0002012 6,825,000 8,797,751 15,622,751 178,760,0002013 7,140,000 8,482,002 15,622,002 171,620,0002014 7,485,000 8,137,086 15,622,086 164,135,0002015 7,860,000 7,763,778 15,623,778 156,275,000
H-11

Outstanding Debt Amortization Tables
Health Care Facilities Financing AuthorityHospital Asset Transformation Program
Fiscal Debt Service Outstanding Ratings Type ofYear Principal Interest Total Debt (year-end) S & P Moody's Fitch Credit Notes2009 1,480,000 11,015,098 12,495,098 449,415,000 AA- A1 A+ Subject to Final maturity occurs on 10/1/38.2010 4,985,000 21,691,511 26,676,511 444,430,000 appropriation.2011 5,250,000 23,202,157 28,452,157 439,180,0002012 5,520,000 22,930,700 28,450,700 433,660,0002013 5,805,000 22,645,267 28,450,267 427,855,0002014 8,745,000 22,291,120 31,036,120 419,110,0002015 10,020,000 21,849,097 31,869,097 409,090,000
NJ Sports & Exposition AuthorityState Contract Bonds
Fiscal Debt Service Outstanding Ratings Type ofYear Principal Interest Total Debt (year-end) S & P Moody's Fitch Credit Notes2009 34,110,000 31,628,556 65,738,556 671,395,000 AA- A1 A+ Subject to Final maturity occurs on 3/1/26.2010 61,075,000 35,512,493 96,587,493 610,320,000 appropriation.2011 61,370,000 32,116,493 93,486,493 548,950,0002012 43,275,000 28,719,070 71,994,070 505,675,0002013 38,150,000 26,276,201 64,426,201 467,525,0002014 35,125,000 24,163,345 59,288,345 432,400,0002015 39,175,000 22,186,277 61,361,277 393,225,000
New Jersey Transportation Trust Fund AuthorityTransportation System Bonds (2)
Fiscal Debt Service Outstanding Ratings Type ofYear Principal Interest Total Debt (year-end) S & P Moody's Fitch Credit Notes2009 257,580,000 429,472,548 687,052,548 10,205,307,355 AA- A1 A+ Subject to Final maturity occurs on 12/15/39.2010 271,590,000 451,571,833 723,161,833 9,933,717,355 appropriation.2011 305,160,000 436,567,974 741,727,974 9,628,557,3552012 322,295,000 419,919,905 742,214,905 9,306,262,3552013 341,840,000 400,941,399 742,781,399 8,964,422,3552014 361,545,000 381,570,770 743,115,770 8,602,877,3552015 396,885,000 361,691,312 758,576,312 8,205,992,355
(3) Net of federal Build America Bonds subsidy.
H-12

Outstanding Debt Amortization Tables
South Jersey Port CorporationMarine Terminal Revenue Bonds
Fiscal Debt Service Outstanding Ratings Type ofYear Principal Interest Total Debt (year-end) S & P Moody's Fitch Credit Notes2009 5,170,000 5,980,997 11,150,997 143,790,000 A A1 N/R Moral Obligation. Final maturity occurs on 1/1/39.2010 5,425,000 7,003,622 12,428,622 138,365,0002011 5,675,000 6,883,386 12,558,386 132,690,0002012 5,920,000 6,639,681 12,559,681 126,770,0002013 6,170,000 6,377,816 12,547,816 120,600,0002014 6,000,000 6,079,211 12,079,211 114,600,0002015 6,280,000 5,806,986 12,086,986 108,320,000
NJ Economic Development AuthorityEconomic Recovery Fund
Fiscal Debt Service Outstanding Ratings Type ofYear Principal Interest Total Debt (year-end) S & P Moody's Fitch Credit Notes2009 6,854,578 14,749,389 21,603,966 167,120,064 AA- A1 A+ Subject to Final maturity occurs on 3/15/21.2010 6,640,418 14,964,149 21,604,566 160,479,646 appropriation.2011 6,459,745 15,141,959 21,601,704 154,019,901 Payments from Port Authority of2012 6,867,903 16,734,734 23,602,636 147,151,999 New York & New Jersey offset2013 7,214,271 18,389,126 25,603,397 139,937,727 debt service.2014 7,037,269 18,567,494 25,604,763 132,900,4592015 13,439,098 12,162,778 25,601,875 119,461,361
NJ Economic Development AuthorityNew Jersey Transit Light Rail System
Fiscal Debt Service Outstanding Ratings Type ofYear Principal Interest Total Debt (year-end) S & P Moody's Fitch Credit Notes2009 49,470,000 22,324,086 71,794,086 416,325,000 AA- A1 N/R Subject to Final maturity occurs on 5/1/19.2010 52,025,000 20,861,374 72,886,374 364,300,000 appropriation.2011 35,375,000 18,031,155 53,406,155 328,925,000 Payments from Federal Transit2012 37,210,000 16,220,980 53,430,980 291,715,000 Administration offset debt service.2013 38,490,000 14,416,980 52,906,980 253,225,0002014 39,825,000 12,545,205 52,370,205 213,400,0002015 41,255,000 10,553,955 51,808,955 172,145,000
H-13

Outstanding Debt Amortization Tables
NJ Higher Education Student Assistance AuthorityNJ Class Loan Program (Various Series) and Student Loan Revenue Bonds
Fiscal Debt Service Outstanding Ratings Type ofYear Principal Interest Total Debt (year-end) S & P Moody's Fitch Credit Notes2009 155,904,000 88,984,698 244,888,698 2,162,010,000 A+ (3) N/R AA (3) Moral Obligation. Final maturity occurs on 6/1/42.2010 5,840,000 99,855,671 105,695,671 2,062,154,3292011 6,040,000 99,545,904 105,585,904 1,962,608,4252012 4,055,000 99,231,921 103,286,921 1,863,376,5042013 13,985,000 98,981,307 112,966,307 1,764,395,1972014 15,845,000 98,248,996 114,093,996 1,666,146,2002015 31,440,000 97,395,802 128,835,802 1,568,750,398
(3) Underlying rating on 1998 Master Trust Indenture.
State of New Jersey Certificates of ParticipationNJ Transit - Transportation Equipment
Fiscal Debt Service Outstanding Ratings Type ofYear Principal Interest Total Debt (year-end) S & P Moody's Fitch Credit Notes2009 27,870,000 29,386,888 57,256,888 956,585,000 AA- A1 A+ Subject to Equipment leases have various 2010 44,800,000 50,912,111 95,712,111 911,785,000 appropriation. maturities.2011 46,730,000 45,758,219 92,488,219 865,055,0002012 61,820,000 43,408,469 105,228,469 803,235,000 Payments of certain bonds 2013 64,605,000 40,356,694 104,961,694 738,630,000 anticipated from federal full funding 2014 67,485,000 37,222,381 104,707,381 671,145,000 agreement to offset debt service.2015 54,295,000 33,922,731 88,217,731 616,850,000
NJ Sports & Exposition AuthorityAtlantic City Convention Center - Luxury Tax Supported Bonds
Fiscal Debt Service Outstanding Ratings Type ofYear Principal Interest Total Debt (year-end) S & P Moody's Fitch Credit Notes2009 5,990,000 6,225,419 12,215,419 120,030,000 A (ins) Baa (ins) N/R Luxury tax Final maturity occurs on 3/1/22.2010 6,260,000 5,949,794 12,209,794 113,770,000 revenue.2011 6,540,000 5,641,356 12,181,356 107,230,000 Ratings are based on bond2012 6,880,000 5,297,469 12,177,469 100,350,000 insurance.2013 7,225,000 4,936,028 12,161,028 93,125,0002014 7,600,000 4,556,138 12,156,138 85,525,0002015 7,990,000 4,156,644 12,146,644 77,535,000
H-14

Address Municipality
Fiscal Year of Lease
Expiration 2009 2010 2011 2012 2013 2014 2015
Imputed Principal Balance*
1601 Atlantic Avenue Atlantic City 2014 0.676 0.676 0.676 0.676 0.676 0.338 - 2.751 Tennessee Ave & Boardwalk Atlantic City 2014 1.183 1.183 1.183 1.183 1.183 0.296 - 4.417 312-314 Front Street Belvidere Twp. 2011 0.063 0.063 0.037 - - - - 0.084 10 Washington Street Bridgeton 2015 0.085 0.088 0.088 0.088 0.088 0.088 0.007 0.356 14-16 Commerce Street Bridgeton 2013 0.154 0.154 0.154 0.154 0.026 - - 0.362 Route 49 & South Pearl Bridgeton 2019 1.083 1.083 1.083 1.083 1.083 1.083 1.083 7.832 601 South Main Street Cape May 2011 0.211 0.211 0.217 - - - - 0.402 2201 Route 38 Cherry Hill 2018 0.593 0.593 0.593 0.593 0.593 0.593 0.593 4.370 8861 Highland Avenue Commercial Twp. 2015 0.093 0.100 0.102 0.102 0.102 0.102 0.026 0.352 Shiloh Avenue Deerfield Twp. 2012 0.002 0.002 0.002 0.002 - - - 0.007 240 South Harrison Street East Orange 2010 0.480 0.240 - - - - - 0.235 45 Kilmer Road Edison Twp. 2012 0.496 0.496 0.496 0.413 - - - 1.307 2511 Fire Road Suite B-12 Egg Harbor Twp. 2010 0.071 0.036 - - - - - 0.035 25-39 Artic Parkway Ewing Twp. 2015 0.927 0.927 0.958 0.958 0.958 0.958 0.958 4.928 820 Bear Tavern Road Ewing Twp. 2019 0.256 0.308 0.308 0.308 0.308 0.308 0.308 1.159 Mercer County Airport Ewing Twp. 2022 0.071 0.071 0.071 0.074 0.074 0.074 0.074 0.668 Trooper Drive Ewing Twp. 2009 0.158 - - - - - - - 7 Broad Street Freehold 2014 0.256 0.268 0.268 0.268 0.268 0.134 - 1.076 60 State Street Hackensack 2014 0.995 0.995 0.995 0.995 0.995 0.995 - 4.501 121 First Avenue Hamilton Twp. 2010 0.522 0.479 - - - - - 0.354 5 Commerce Way Hamilton Twp. 2018 0.811 0.811 0.811 0.811 0.811 0.811 0.811 4.146 Quakerbridge Plaza Hamilton Twp. 2013 7.092 7.092 7.092 7.092 3.546 - - 22.289 438 Summit Avenue Jersey City 2014 2.636 2.636 2.636 2.636 2.636 1.098 - 9.159 8-10 Clifton Place Jersey City 2012 0.811 0.811 0.811 0.473 - - - 1.933 945 SH 12 Kingwood Twp. 2011 0.095 0.095 0.079 - - - - 0.164 1215 Highway 70 Lakewood Twp. 2016 0.560 0.573 0.586 0.600 0.615 0.630 0.645 3.157 3131 Princeton Pike Lawrence Twp. 2009 0.383 - - - - - - - One Lawrence Park Lawrence Twp. 2014 0.651 0.660 0.660 0.660 0.660 0.275 - 2.639 1B Laurel Drive, Route 206 N Mount Olive Twp. 2010 0.199 0.133 - - - - - 0.130 40 Taylor Avenue Neptune 2013 0.409 0.409 0.425 0.433 0.144 - - 1.145 172 New Street New Brunswick 2012 0.305 0.305 0.305 0.280 - - - 0.800 506 Jersey Avenue New Brunswick 2009 0.242 - - - - - - - 596 Jersey Avenue New Brunswick 2016 0.066 0.066 0.066 0.066 0.066 0.066 0.066 0.290 124 Halsey Street Newark 2011 6.568 6.568 2.189 - - - - 8.273 153 Halsey Street Newark 2011 6.966 6.966 3.483 - - - - 8.953 2 Gateway Center Newark 2015 2.383 2.383 2.383 2.383 2.383 2.383 1.986 12.205 31 Clinton Street Newark 2020 2.447 2.447 2.472 2.497 2.497 2.497 2.497 18.634 990-998 Broad Street Newark 2013 0.569 0.569 0.569 0.569 0.190 - - 1.141 20 East Clinton & Mora Newton Twp. 2014 0.414 0.414 0.414 0.414 0.414 0.138 - 1.412 114 Prospect Street Passaic 2016 0.381 0.254 0.258 0.300 0.300 0.300 0.300 0.573 25 Howe Avenue Passaic 2011 0.525 0.525 0.437 - - - - 0.609 33 Mill Street Passaic 2009 0.324 - - - - - - - 100 Hamilton Plaza Paterson 2014 1.340 1.340 1.340 1.369 1.379 0.345 - 4.948 66 Hamilton Street Paterson 2014 0.392 0.398 0.406 0.406 0.406 0.237 - 1.671 77 Hamilton Street Paterson 2011 0.045 0.045 0.011 - - - - 0.054 2 Main Street Pleasantville 2014 0.401 0.401 0.401 0.401 0.401 0.300 - 1.710
I-1
Comprehensive Annual Financial Report - Capital LeasesState of New Jersey
Total Net Lease Payments ($ Millions)
Lease Payments by the State Net of any Operating Expenses and Property Taxes as of June 30, 2009

Address Municipality
Fiscal Year of Lease
Expiration 2009 2010 2011 2012 2013 2014 2015
Imputed Principal Balance*
195 East Broadway Salem 2029 0.195 0.780 0.780 0.780 0.780 0.800 0.858 9.356 75 Veterans Memorial Drive Somerville 2017 0.904 0.904 0.904 0.914 0.924 0.924 0.924 2.511 Route 206 North Southampton Twp. 2009 0.111 - - - - - - - 1005-1027 Hooper Avenue Toms River 2022 0.551 0.551 0.551 0.551 0.582 0.582 0.582 5.156 1510 Hooper Avenue Toms River 2014 0.952 0.957 0.957 0.957 0.957 0.399 - 3.621 1861 Hooper Avenue Toms River 2016 0.085 0.085 0.085 0.085 0.085 0.085 0.085 0.220 Main Street Toms River 2013 0.223 0.223 0.223 0.223 0.130 - - 0.744 1 West State Street Trenton 2014 1.238 1.279 1.279 1.28 1.28 0.639 - 4.143 101 North Broad Street Trenton 2010 0.288 0.192 - - - - - 0.184 120 South Stockton Street Trenton 2017 1.329 1.329 1.329 1.329 1.329 1.329 1.329 7.958 1212 Edgewood Avenue Trenton 2011 0.112 0.112 0.009 - - - - 0.103 135 East State Street Trenton 2014 0.572 0.672 0.672 0.672 0.672 0.280 - 2.593 140 East Front Street Trenton 2021 1.761 1.761 1.761 1.889 1.889 1.889 1.889 13.730 167-169 West Hanover Street Trenton 2013 0.405 0.405 0.405 0.405 0.135 - - 1.216 171 Jersey Street Trenton 2014 0.684 0.691 0.691 0.691 0.691 0.288 - 2.573 200 South Broad Street Trenton 2010 1.262 0.210 - - - - - 0.209 200 Wolverton Street Trenton 2014 0.868 0.878 0.878 0.878 0.878 0.366 - 2.946 221 West Hanover Street Trenton 2016 0.773 0.773 0.799 0.826 0.826 0.826 0.826 4.499 240 West State Street Trenton 2014 1.718 1.718 1.718 1.718 1.718 0.859 - 5.668 25 Market Street Trenton 2037 1.300 1.300 1.300 1.300 1.300 1.300 1.300 19.570 28 West State Street Trenton 2012 1.348 1.348 1.348 1.236 - - - 2.858 33 West State Street Trenton 2023 3.112 3.153 3.194 3.235 3.287 3.339 3.380 25.684 428 East State Street Trenton 2014 0.819 0.819 0.819 0.819 0.819 0.273 - 2.772 433 East State Street Trenton 2014 0.032 0.032 0.032 0.032 0.032 0.011 - 0.127 436 East State Street Trenton 2012 0.154 0.154 0.154 0.013 - - - 0.258 440 East State Street Trenton 2014 0.289 0.289 0.289 0.289 0.289 0.096 - 1.137 50 Barracks Street Trenton 2022 0.691 0.691 0.691 0.691 0.691 0.691 0.691 6.723 50 East State Street Trenton 2023 3.972 4.030 4.088 4.147 4.205 4.264 4.322 38.342 50 North Clinton Avenue Trenton 2010 0.108 0.055 - - - - - 0.054 50 West State Street Trenton 2009 3.366 - - - - - - - 503 John Fitch Way Trenton 2028 2.273 2.273 2.273 2.273 2.273 2.273 2.273 19.325 519-523 East State Street Trenton 2014 0.122 0.122 0.122 0.122 0.122 0.041 - 0.255 605 South Broad Street Trenton 2009 0.294 - - - - - - - 7-17 Ewing Street Trenton 2013 0.308 0.308 0.308 0.308 0.077 - - 0.818 John Fitch Way Trenton 2027 4.850 4.850 4.850 4.850 4.850 4.850 4.850 20.012 Station Plaza Trenton 2018 5.770 5.770 5.770 5.770 5.749 5.739 5.739 28.292 171 Route 173 Suite 201 Union Twp. 2014 0.106 0.106 0.110 0.111 0.113 0.009 - 0.119 501 Landis Avenue Vineland 2009 0.270 - - - - - - - 56 West Landis Avenue Vineland 2009 0.129 - - - - - - - 415 East Washington Avenue Washington Twp. 2018 0.266 0.266 0.266 0.266 0.278 0.300 0.300 1.832 1578 Route 23 Wayne Twp. 2009 0.076 - - - - - - - Route 295 & Crown Point Road West Deptford Twp. 2011 0.892 0.892 0.372 - - - - 1.057 200 Campbell Drive Willingboro 2018 0.487 0.487 0.497 0.505 0.505 0.505 0.519 1.018 Franklin & Monroe Avenues Woodbine 2013 0.178 0.178 0.178 0.178 0.104 - - 0.548 65 Newton Street Woodbury 2012 0.102 0.102 0.102 0.085 - - - 0.264
90.734 84.614 74.870 67.713 60.369 47.003 39.219 379.729
50.108 49.447 44.831 41.523 37.798 27.485 21.826 40.625 35.168 30.039 26.190 22.571 19.519 17.393
* Refers to the present value of the lease payments discounted at the lessee's borrowing rate.
I-2
Total Net Lease Payments ($ Millions)Lease Payments by the State Net of any Operating Expenses and Property Taxes as of June 30, 2009
Imputed Principal: Imputed Interest:
Grand Total:
State of New Jersey Comprehensive Annual Financial Report - Capital Leases

IssueDate Issuer Program/Use Par Amount Type of Credit Issuance Type
20-Aug-09 Economic Development Authority School Facilities Construction Bonds, 2009 Series BB 200,000,000$ Subject to Appropriation New Money
* Through November 13, 2009.
Long Term Debt Issued Subsequent to June 30, 2009*
J-1