Submitted to the Faculty of the Graduate School of...
195
RISK FACTORS FOR PRESSURE ULCER DEVELOPMENT IN CRITICALLY ILL PATIENTS By Richard A. Benoit, Jr. Dissertation Submitted to the Faculty of the Graduate School of Vanderbilt University in partial fulfillment of the requirements for the degree of DOCTOR OF PHILOSOPHY In Nursing Science May, 2013 Nashville, Tennessee Approved: Professor Lorraine C. Mion Professor Ann Minnick Professor Mary S. Dietrich Oliver Gunter
Transcript of Submitted to the Faculty of the Graduate School of...
RISK FACTORS FOR PRESSURE ULCER DEVELOPMENT IN CRITICALLY ILL PATIENTS
By
Richard A. Benoit, Jr.
Dissertation
Submitted to the Faculty of the
Graduate School of Vanderbilt University
in partial fulfillment of the requirements
for the degree of
DOCTOR OF PHILOSOPHY
In
Nursing Science
May, 2013
Nashville, Tennessee
Approved:
Professor Lorraine C. Mion
Professor Ann Minnick
Professor Mary S. Dietrich
Oliver Gunter

Copyright © 2013 by Richard A. Benoit, Jr. All Rights Reserved

DEDICATION
This dissertation is dedicated primarily to patients who need care in an intensive
care unit. I hope that this study will provide some guidance to their caregivers.
Additionally, this dissertation is dedicated to my friends and family with special
attention to the following individuals:
To my mother, father, brother, and other family who never seemed to tire of
listening to my vicissitudes and who encouraged me every step of the way.
To David Metz, my best friend, who never complained about the countless hours
of study that removed me from home activities. He never complained about the
mountains of laundry he washed, the countless meals he cooked, or doing the daily
chores that I did not. His presence made this dream possible.
iii

ACKNOWLEDGEMENTS
I would like to acknowledge the following individuals and groups who have
contributed to the completion of my dissertation.
First, I would like to thank Vanderbilt University School of Nursing for their
generous financial support. Without it, this endeavor would not have been possible.
Second, I would like to recognize the members of my dissertation committee, Dr.
Lorraine Mion, Dr. Ann Minnick, Dr. Mary Dietrich, and Dr. Oliver Gunter for their
contributions to this work.
Third, I would like to acknowledge my colleagues at Vanderbilt University
School of Nursing who took this journey with me. Brian, Cathy, and James have
provided companionship and support throughout this process.
Fourth, I want to acknowledge Carolyn Watts and Christy Thomas for their help
with enrolling subjects for the study. They provided me with extra sets of expert eyes
when I needed them.
Finally, I want to acknowledge Mr. Buck who kept silent vigil from his chair in
my home office for the last five years. He worked on every paper and assignment with
me, quietly listened to me, wagged his tail to let me know all was well, and sometimes
reminded me that it is necessary to go outside.
iv
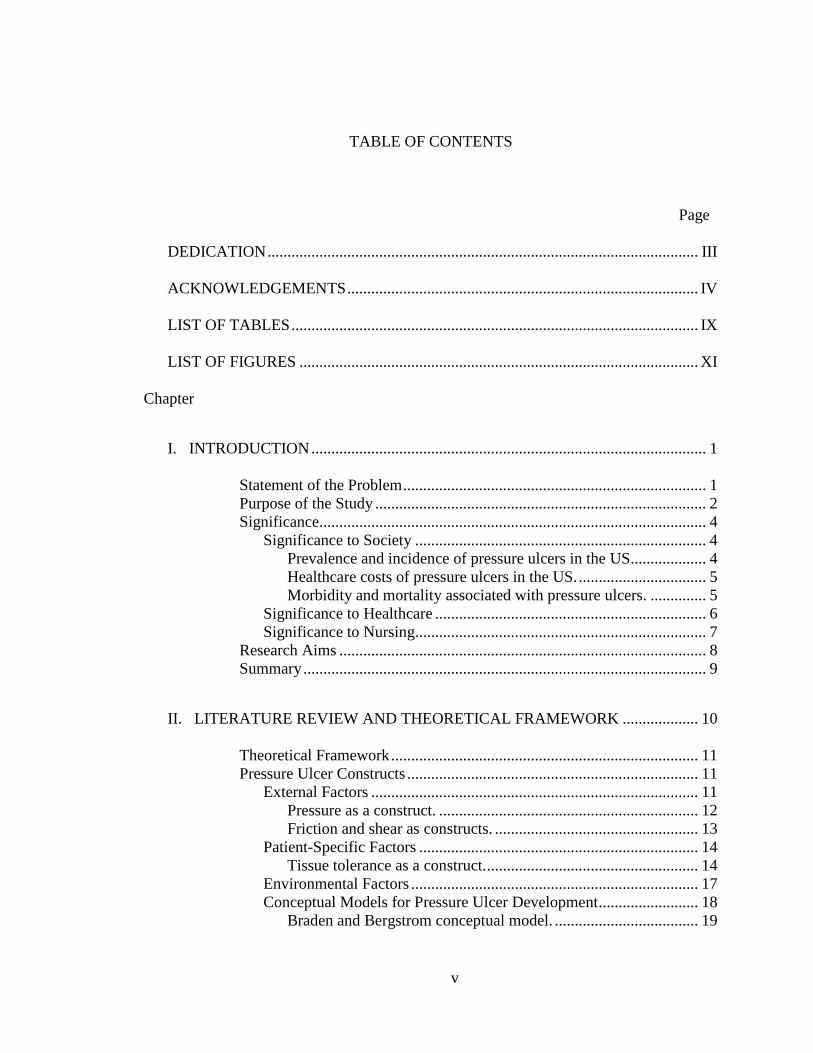
TABLE OF CONTENTS
Page
DEDICATION ............................................................................................................ III
ACKNOWLEDGEMENTS ........................................................................................ IV
LIST OF TABLES ...................................................................................................... IX
LIST OF FIGURES .................................................................................................... XI
Chapter
I. INTRODUCTION ................................................................................................... 1
Statement of the Problem ............................................................................ 1 Purpose of the Study ................................................................................... 2 Significance................................................................................................. 4
Significance to Society ......................................................................... 4 Prevalence and incidence of pressure ulcers in the US ................... 4 Healthcare costs of pressure ulcers in the US. ................................ 5 Morbidity and mortality associated with pressure ulcers. .............. 5
Significance to Healthcare .................................................................... 6 Significance to Nursing......................................................................... 7
Research Aims ............................................................................................ 8 Summary ..................................................................................................... 9
II. LITERATURE REVIEW AND THEORETICAL FRAMEWORK ................... 10
Theoretical Framework ............................................................................. 11 Pressure Ulcer Constructs ......................................................................... 11
External Factors .................................................................................. 11 Pressure as a construct. ................................................................. 12 Friction and shear as constructs. ................................................... 13
Patient-Specific Factors ...................................................................... 14 Tissue tolerance as a construct. ..................................................... 14
Environmental Factors ........................................................................ 17 Conceptual Models for Pressure Ulcer Development ......................... 18
Braden and Bergstrom conceptual model. .................................... 19
v

Defloor Conceptual Model. .......................................................... 21 Braden, Bergstrom, and Defloor Conceptual Model Comparison ...... 22
Critical Analysis of the Relevant Literature ............................................. 25 State of Pressure Ulcer Risk Factor Science ....................................... 25
Theoretical frameworks to guide risk factor study. ...................... 27 Study populations.......................................................................... 27
Braden Risk Assessment Scale ........................................................... 28 Validity of the Braden risk assessment scale. ............................... 28 Reliability of the Braden risk assessment scale. ........................... 29 Specificity and sensitivity of the Braden risk assessment scale. .. 31
Augmented Braden and Bergstrom Model ......................................... 35 Definition of Terms................................................................................... 38
Primary Outcome Measure ................................................................. 38 Demographic and Pre-hospital Admission Variables ......................... 40 Post-Admission Clinical Study Variables ........................................... 41
Summary ................................................................................................... 50
III. STUDY METHODOLOGY ................................................................................ 51
Overview ................................................................................................... 51 Research Design........................................................................................ 51 Assumptions Surrounding the Research Design ....................................... 52
Theoretical Assumption ...................................................................... 52 Methodological Assumptions ............................................................. 52
Description of the Research Setting .......................................................... 54 Study Concepts and Variables .................................................................. 54 Sample and Sampling Plan ....................................................................... 57
Nature and Size of the Sample ............................................................ 57 Inclusion, Exclusion, and Matching Criteria ...................................... 58 Subject Recruitment Methodology ..................................................... 61 Human Subjects Protection ................................................................. 62
Informed consent. ......................................................................... 62 Dignity and Personal Privacy........................................................ 63 Protection of Personal Health Information. .................................. 64
Data Collection Methods .......................................................................... 65 Procedures ........................................................................................... 65
Case enrollment. ........................................................................... 65 Control enrollment. ....................................................................... 67 Data collection. ............................................................................. 68 Data source.................................................................................... 69
Reliability and Validity of Instruments............................................... 69 Reliability and Validity of the Study Methods ................................... 70
Data Analysis Strategy .............................................................................. 71 Data Cleaning Procedures ................................................................... 71 Statistical Methods…………………………………………………...71
vi

Aim 1. ......................................................................................... 71 Sample size and power............................................................ 72
Aim 2. .......................................................................................... 73
IV. RESULTS ........................................................................................................... 74
Unmatched Cases ...................................................................................... 74 Missing Data ............................................................................................. 75
Pre-Admission Variables .................................................................... 75 Nicotine Use Variable ......................................................................... 76 Hematocrit Variables .......................................................................... 76 Protein Reserve Variables ................................................................... 77
Recoded Variables .................................................................................... 80 Primary Aim.............................................................................................. 81
Subject Profile ..................................................................................... 82 Characteristics of Case and Control Subjects ........................................... 84
Matching Criteria and Consent Type .................................................. 84 Description of Variables Assessing Pressure Distribution Capacity .. 84 Description of Variables Assessing Metabolic Supply ....................... 84 Description of Variables Assessing Metabolic Demand .................... 92 Description of Variables Assessing Threats to Skin Integrity ............ 92 Description of Variables Assessing Duration and Magnitude of
Pressure and Other Variables ......................................................... 96 Pressure Ulcer Findings ...................................................................... 97
Summary of Unadjusted (Univariate) Findings ........................................ 99 Multivariate Analysis ................................................................................ 99
Analysis of Variables Measured 24 Hours Prior to Study Enrollment .................................................................................... 100
Analysis of Variables Measured 48 Hours Prior to Study Enrollment .................................................................................. 1055
Summary ................................................................................................. 110 Secondary Aim........................................................................................ 111
V. DISCUSSION .................................................................................................... 112 Primary Aim ................................................................................................ 112 Predictive Ability of the Braden Score in Critically Ill Patients ................. 112
Statistically Significant Variables Assessing Tissue Tolerance for Pressure at 24 Hours ........................................................................... 115 Gender ............................................................................................... 115 Age .................................................................................................... 117 Hematocrit......................................................................................... 118 Braden Nutrition Subscale ................................................................ 119 Braden Moisture Subscale ................................................................ 120
Statistically Significant Variables Assessing Intensity and Duration of Pressure at 24 Hours ........................................................................... 121 Braden Activity Subscale .................................................................. 121
vii

Restraints........................................................................................... 121 Non-Significant Variables Assessing Pressure Ulcer Risk ..................... 122
Remaining Braden subscales ............................................................ 122 Other variables assessing pressure distribution capacity .................. 123
Body mass index. ........................................................................ 123 Variables assessing metabolic supply ............................................... 124
Nicotine use. ............................................................................... 124 Vasopressor use. ......................................................................... 125 Mean arterial pressure. ................................................................ 126 Oxygen saturation of hemoglobin ............................................... 126
Variables assessing metabolic demand ............................................. 126 Steroid use. .................................................................................. 126
Strengths and Limitations ....................................................................... 127 Study Design ..................................................................................... 127 Analysis Strategies ............................................................................ 128 Clinical Utility .................................................................................. 128
Implications............................................................................................. 129 Implications for Healthcare Policy ................................................... 129 Implications for Nursing ................................................................... 130
Recommendations for Future Research .................................................. 131
Appendix
A. DATA MANAGEMENT AND STUDY ENROLLMENT FORMS .................. 133
B. DATA COLLECTION FORMS .......................................................................... 148
C. FEASIBILITY STUDY ....................................................................................... 159
D. TABLES............................................................................................................... 166
REFERENCES ......................................................................................................... 175
viii
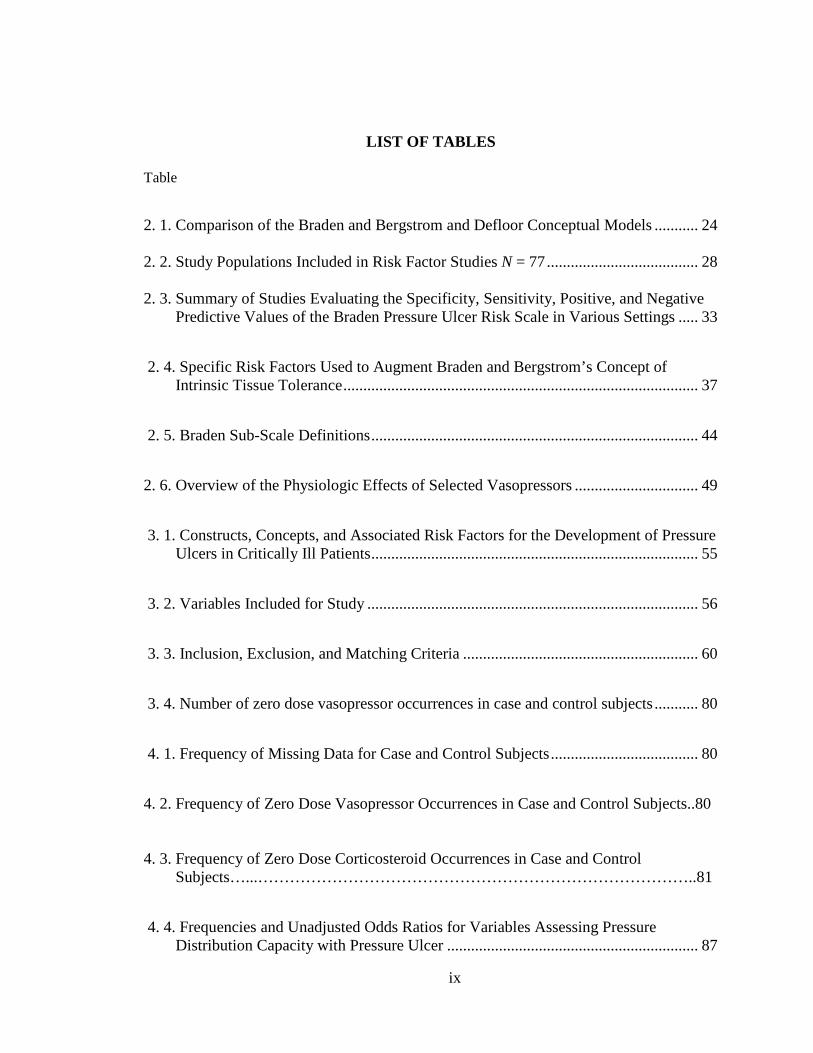
LIST OF TABLES
Table
2. 1. Comparison of the Braden and Bergstrom and Defloor Conceptual Models ........... 24
2. 2. Study Populations Included in Risk Factor Studies N = 77 ...................................... 28
2. 3. Summary of Studies Evaluating the Specificity, Sensitivity, Positive, and Negative Predictive Values of the Braden Pressure Ulcer Risk Scale in Various Settings ..... 33
2. 4. Specific Risk Factors Used to Augment Braden and Bergstrom’s Concept of Intrinsic Tissue Tolerance ......................................................................................... 37
2. 5. Braden Sub-Scale Definitions .................................................................................. 44
2. 6. Overview of the Physiologic Effects of Selected Vasopressors ............................... 49
3. 1. Constructs, Concepts, and Associated Risk Factors for the Development of Pressure Ulcers in Critically Ill Patients .................................................................................. 55
3. 2. Variables Included for Study ................................................................................... 56
3. 3. Inclusion, Exclusion, and Matching Criteria ........................................................... 60
3. 4. Number of zero dose vasopressor occurrences in case and control subjects ........... 80
4. 1. Frequency of Missing Data for Case and Control Subjects ..................................... 80
4. 2. Frequency of Zero Dose Vasopressor Occurrences in Case and Control Subjects..80 4. 3. Frequency of Zero Dose Corticosteroid Occurrences in Case and Control
Subjects…...………………………………………………………………………..81
4. 4. Frequencies and Unadjusted Odds Ratios for Variables Assessing Pressure Distribution Capacity with Pressure Ulcer ............................................................... 87
ix
4. 5. Frequencies and Unadjusted Odds Ratios for Variables Assessing Metabolic Supply with Pressure Ulcer ....................................................................................... 88
4. 6. Frequencies and Unadjusted Odds Ratios for Variables Assessing Metabolic Demand and Skin Integrity with Pressure Ulcer....................................................... 93
4. 7. Frequencies and Unadjusted Odds Ratios for Variables Assessing Intensity and Duration of Pressure and Other Factors with Pressure Ulcer ................................... 94
4. 8. Distribution and Severity of Pressure Ulcers (N=180) ............................................ 98
4. 9. Summary of Multivariate Associations with Pressure Ulcer Measured at 24 Hours Prior to Study Enrollment for Block One and Two ................................................ 100
4. 10. Summary of Multivariate Associations with Pressure Ulcer Measured at 24 Hours Prior to Study Enrollment for the Entire Model ..................................................... 102
4. 11. Summary of Multivariate Associations with Pressure Ulcer Measured at 48 Hours Prior to Study Enrollment for Block One and Two ................................................ 105
4. 12. Summary of Multivariate Associations with Pressure Ulcer Measured at 48 Hours Prior to Study Enrollment for the Entire Model ..................................................... 108
x
LIST OF FIGURES
Figure
2. 1. Braden and Bergstrom’s Conceptual Schema Depicting Factors in the Etiology of Pressure Sores. .......................................................................................................... 20
2. 2. Defloor’s Conceptual Scheme Depicting Risk Factors in the Etiology of Pressure Sores……………………………………………………………………...23
2. 3. Conceptual Model for Pressure Ulcer Etiology in Critically Ill Patients………….36
4. 1. Process for Enrolling Case Subjects for Dissertation Study……………………….83
xi

CHAPTER I
INTRODUCTION
Statement of the Problem
Pressure ulcers and the risk factors associated with their development have been
studied for almost 50 years yet the temporal, qualitative, and quantitative relationship
between pressure ulcer risk factors and pressure ulcer incidence is still poorly understood.
The literature suggests that specific risk factors for pressure ulcer incidence are
associated with specific patient populations (de Laat, Schoonhoven, Pickkers, Verbeek, &
van Achterberg, 2006); however, methodological strategies to explain associations
between risk factors and pressure ulcer incidence generally do not reflect a specific
patient population orientation. The literature identifies over 200 risk factors that may
contribute to pressure ulcer development (Anthony, Parboteeah, Saleh, & Papanikolaou,
2008), but methodological and definitional inconsistencies complicate and slow the
process of translating research into clinical practice (Keller, Wille, van Ramshorst, & van
der Werken, 2002). Consequently, clinicians lack a specific set of risk factors on which
to focus their prevention efforts, resulting in the diffuse application of preventive
measures with limited effectiveness. Hospital acquired pressure ulcer (HAPU) rates
increased by 63% between 1993 and 2006 (Russo & Elixhauser, 2006). These statistics
have not been risk-adjusted for severity of illness; however, hospital admission rates
increased only 11% during the same period, and hospital stays for patients over 65 years
old increased by 14%, suggesting that the observed increase in HAPU rates are not
1

entirely a function of the patient demographic. This increase in HAPUs contributes to
higher health care costs, increased morbidity and mortality rates (Russo & Elixhauser,
2006), and raises concerns about the quality of care delivered in US nursing homes and
hospitals (Needleman, Kurtzman, & Kizer, 2007).
Of the populations studied, patients who are critically ill (i.e., receiving care in an
intensive care unit [ICU]) are the most prone to the development of pressure ulcers
(Bours, de Laat, Halfens, & Lubbers, 2001; de Laat, et al., 2006), yet few investigators
have systematically evaluated the predictive relationships between risk factor presence
and pressure ulcer development in this population. The most recent International
Pressure Ulcer Prevalence Survey (IPUPS; VanGilder, Amlung, Harrison, & Meyer,
n.d.), conducted in 2008 through 2009, substantiates the disproportionate prevalence of
pressure ulcers in ICUs. Pressure ulcers acquired in the ICU had a prevalence rate of
8.8% to 12.1% in 2008 and 2009, respectively representing approximately 8,000 to
11,000 patients annually who developed a pressure ulcer while in the ICU in the US. In
2009, 3.3% of US ICU patients developed a severe facility-acquired pressure ulcer
defined as Stage III, Stage IV, unstageable, or deep tissue injury (VanGilder et al., n.d.).
These findings suggest that clinicians working in ICUs need prevention strategies
focused on risk factors specific to their patient population.
Purpose of the Study
Pressure ulcer prevention interventions are predicated on identifying salient risk
factors for pressure ulcer development in specific patient populations (de Laat, et al.,
2

2006). The descriptive research identifies multiple patient specific risk factors that
contribute to pressure ulcer incidence in a variety of patient populations; however, with
the exception of increased age, no single or combination of risk factors predicts pressure
ulcer incidence equally well among various patient populations. Braden and Bergstrom’s
(1987) and Defloor’s (1999) conceptual models identify pressure ulcer risk factors, but
have not been extensively studied in various patient populations, specifically the ICU
population. Critically ill patients, the most prone to pressure ulcer development, are the
least studied patient population reported in the literature. A search of the PubMed
database conducted using the search terms ‘risk factors’ and ‘pressure ulcers,’ with the
limits of all adult, humans, core clinical and nursing journals, and English with no date
constraints yielded 574 articles published between 1975 and 2011. To refine the search
to risk factors for pressure ulcer development in critically ill patients, the search term
‘intensive care’ was added using the same limits. The search returned 57 articles
published from 1975 to 2011. Of those, eleven were prospective studies designed to
identify causality between pressure ulcer risk factors and pressure ulcer incidence.
Further studies to evaluate causal relationships between risk factors in critically ill
patients and pressure ulcer development are needed to further understand, prevent, and
mitigate the effects of pressure ulcers in this vulnerable population. The purpose of this
study was to identify risk factors that contributed to pressure ulcer development in
critically ill patients.
3

Significance
The significance of pressure ulcers is viewed within the broader contexts of their
significance to society, healthcare, and specifically to the nursing profession.
Significance to Society
Prevalence and incidence of pressure ulcers in the US. National estimates of
pressure ulcer prevalence rates vary widely in the literature. In a summary of findings by
the 2004 National Nursing Home Survey, Park-Lee and Caffrey (2009) reported that
about 159,000 (11%) of nursing home residents had a pressure ulcer. This statistic is
somewhat higher than those released by the Agency for Healthcare Research and Quality
(AHRQ) in 2004. According to AHRQ, pressure ulcer rates in nursing homes ranged
from 8.5% to 8.7% (Agency for Healthcare Research and Quality [AHRQ], n.d.).
National pressure ulcer prevalence rates in acute care facilities are less precise than those
reported in nursing homes, possibly because of the dynamic nature and increased acuity
of the acute care patient populations. Using data from secondary sources, the Institute for
Healthcare Improvement (IHI) estimated pressure ulcer prevalence rates in acute care
facilities ranged from 0.4% to 38% (Lyder, 2003). The National Pressure Ulcer Advisory
Panel (NPUAP) estimates pressure ulcer prevalence rates in acute care facilities at 15%
and incidence rates in acute care facilities at 7% (Cuddington, Ayello & Sussman, 2001).
National statistics on pressure ulcer prevalence and incidence in critically ill
patients in the US are difficult to locate. Estimates of pressure ulcer prevalence and
incidence rates in the ICU patient population are higher than those of the general acute
care facility population because of their increased association with risk factors that are
4

generally thought to contribute to pressure ulcer development (Carlson, Kemp, & Shott,
1999). In a national benchmarking study conducted in US acute care facilities in 1999,
Amlung, Miller, and Bosley (2001) found pressure ulcer incidence rates among critically
ill patients to be 13%. This statistic falls within the 7% to 15% identified by Cuddington,
et al. (2001), although some estimates of pressure ulcer incidence rates in ICUs approach
50% in US ICUs (Cuddington et al., 2001; Fife et al., 2001; Jiricka, Pyan, Carvalho, &
Bukvich, 1995).
Healthcare costs of pressure ulcers in the US. In 2006, the national estimates
on the costs of treating pressure ulcers in the US ranged between $1.3 and $3.5 billion per
year (Courtney, Ruppman, & Cooper, 2006). These costs are similar to earlier estimates
by Whittington and Briones (2004) of between $2.2 and $3.6 billion per year for the
treatment of pressure ulcers. By 2008, the Institute for Healthcare Improvement (IHI)
estimated a total national cost of $11 billion per year to treat pressure ulcers (Institute for
Health Care Improvement [IHI], 2008). The IHI also estimated that the cost of treating a
single full-thickness pressure ulcer to be as high as $70,000 per ulcer (IHI, 2008).
Although there is no specific rationale that explains the 214% to 746% increase in
estimated pressure ulcer treatment costs between 2006 and 2008, Leape and Berwick
(2005) suggested that the increasing complexity of both healthcare systems and patients
contribute to the rising costs demonstrated by these cost statistics.
Morbidity and mortality associated with pressure ulcers. In addition to the
high cost of treatment, pressure ulcer presence is a poor prognostic factor (Reddy, Gill, &
Rochon, 2006). Prior to 2005, pressure ulcer associated morbidity and mortality in the
US was significantly underestimated. In a cross-sectional descriptive study of mortality
5
causes, Redelings, Lee, and Sorvillo (2005) reviewed death records of the 27,572,153
persons who had died in the US between 1990 and 2001. The study found that 114,380
(0.41%) death records listed pressure ulcers as a contributing cause of death. Of those,
80% of pressure ulcer associated deaths occurred in persons 75 years of age or older. In a
prospective cohort study designed to compare hospital length of stays and complications
in pressure ulcer positive patients compared with pressure ulcer negative patients,
Allman, Goode, Burst, Bartolucci, and Thomas (1999) found that patients who developed
pressure ulcers were more likely to develop nosocomial infections (45.9% vs. 20.1%, p =
0.001). Severity of illness adjusted costs of hospital stays were also statistically
significantly higher in those patients who developed pressure ulcers ($14,260 vs.
$12,382, p = 0.03) (Allman et al., 1999).
Significance to Healthcare
Pressure ulcers are among the serious events listed by the National Quality Forum
(NQF) in their 2006 update (National Quality Forum [NQF], 2006). Specifically, the
NQF states that pressure ulcers are a product of lapses of care management, and that
nosocomially acquired stage III or IV pressure ulcers are a serious event. The NQF
acknowledges that pressure ulcers may not be preventable in all cases, but suggests that
their incidence in healthcare settings warrants scrutiny of the systems and processes
designed to prevent and treat pressure ulcers (NQF, 2006).
The National Quality Measures Clearinghouse (NQMC) provides 18 metrics for
pressure ulcers that are included in either the outcome or the process domains (National
Quality Measures Clearinghouse [NQMC], n.d.). While most of the measures focus on
aspects of appropriate treatment and prevalence rates of pressure ulcers within acute or
6

long-term care facilities, five evaluate the identification of pressure ulcer risk and
presence or absence of preventive measures. The measures do not identify a preferred
risk-stratification tool, nor do they speak to the quality of the preventive interventions.
The lack of specificity regarding pressure ulcer risk stratification and prevention
measures suggests a lack of consensus on stratification of pressure ulcer risk and best
pressure ulcer prevention practices. Adequate risk stratification is essential for accurate
comparisons of adverse event rates across hospitals (Needleman, et al., 2007). The lack
of empirical data supporting the putative link between nursing processes and pressure
ulcer incidence (Needleman et al., 2007) suggests a need for a more rigorous risk
adjustment method to control for the multiplicity of pressure ulcer risk factors that may
be functioning as confounding variables in pressure ulcer research.
Significance to Nursing
According to the American Nurses Association (ANA), pressure ulcer prevention
is primarily a nursing responsibility. In 1995, the ANA introduced 10 quality measures
described as most sensitive to nursing care (Montalvo, 2007) and integrated those
measures into the NQF’s voluntary consensus standards for evaluating nurse sensitive
care (Kurtzman & Corrigan, 2007). Nosocomially acquired pressure ulcers are among
the nurse sensitive outcomes adopted by the NQF and considered to be within the domain
of patient-centered outcomes (Kurtzman & Corrigan, 2007). To date, the nurse-specific
quality metrics suggested by the ANA and the NQF are associated with patient outcomes,
but do not imply causality. The empirical evidence to support a causal link between
nursing quality of care and pressure ulcer development is lacking.
7
Research Aims
Further study is needed to understand the relationship between pressure ulcer risk
factors and pressure ulcer development in critically ill patients. The resulting knowledge
can help more accurately stratify pressure ulcer risk in this vulnerable population and
help nurses target prevention measures to decrease the incidence of pressure ulcer
development in the critically ill patient population. The aims for the proposed study
were:
1. To compare the frequency and magnitude of pressure ulcer risk factors
between critically ill patients that do and do not develop a pressure ulcer
during their ICU stay and evaluate their influence on the associations between
the Braden subscales and pressure ulcer outcome; and
2. To compare the frequency and magnitude of pressure ulcer risk factors
between critically ill patients that have progression of their Stage I pressure
ulcer during the ICU stay to those who do not have a progression of their
Stage I pressure ulcer during the ICU stay.
The study was accomplished using a prospective matched case-control study
design using convenience sampling in five ICUs at Vanderbilt University Hospital
(VUH). Risk factors were identified using a previously published conceptual model
(Benoit & Mion, 2012). Datasets were constructed that described the study sample and to
conduct analyses that addressed the study aims.
8
Summary
Nursing care processes correlate with various quality outcomes, including
pressure ulcer development. Despite the abundance of pressure ulcer risk factors
identified in the literature, the HAPU incidence rate continues to rise, suggesting that
current prevention interventions are inadequate, possibly because they lack specificity to
various patient populations. Critically ill patients are the most vulnerable to pressure
ulcer formation, but commonly used risk assessment tools lack the specificity needed to
guide focused prevention efforts in the ICU patient population. By identifying risk
factors that disproportionately contribute to pressure ulcer formation in the ICU patient
population, nursing can improve patient outcomes by refining and selectively targeting
pressure ulcer prevention efforts.
9
CHAPTER II
LITERATURE REVIEW AND THEORETICAL FRAMEWORK
The historical perspective of pressure ulcers indicates they have been a concern to
the sick and injured for nearly 4000 years, but their relative importance to healthcare
providers has fluctuated as the prevailing science and theoretical approaches to human
disease have evolved (Parish, Witkowski, & Crissey, 1997; van Rijswijk, 2001). Prior to
World War I (1914-1918), the medical community largely viewed pressure ulcers as an
unavoidable consequence of illness, and prevention efforts were virtually nonexistent
(Parish et al., 1997). As the prevailing view of pressure ulcers shifted toward a more
preventive stance, the medical community began to identify risk factors for pressure ulcer
development. The growing body of medical evidence on pressure ulcer risk factors
indicates that some risk factors, such as advanced age and poor nutritional status, are
common among various patient groups, while other risk factors may be unique or exhibit
disproportionate importance within specific patient groups, such as the critically ill (de
Laat, et al., 2006). The purpose of this chapter is to:
1. Identify and describe constructs related to pressure ulcer development;
2. Discuss the relationships among those constructs as described in two
previously published conceptual frameworks;
3. Present a critical analysis of the extant literature on pressure ulcer risk
factors;
10
4. Describe the validity, reliability, specificity and sensitivity of the most
commonly used pressure ulcer risk assessment scale in the US and discuss
its predictive ability in critically ill patient populations;
5. Present the conceptual framework used in this study that incorporates
those risk factors identified in the literature review.
Theoretical Framework
Pressure Ulcer Constructs
Factors contributing to pressure ulcer development comprise three separate but
interrelated constructs. External factors include compression, friction, and shearing
forces on the skin and underlying connective tissue. Patient-specific factors include the
characteristics of the skin and underlying connective tissue that affect their ability to
withstand the external forces without consequent damage (Defloor, 1999; Thompson,
2005). Environmental factors refer to the characteristics of the environment in which
medical and nursing care is received that may contribute to pressure ulcer development.
External Factors
Pressure ulcers develop as compressive, friction and shearing forces overwhelm
the tissues’ ability to withstand those forces. The resulting pressure damage can range
from superficial disruption of the epidermis to deep ulceration involving muscle and
associated connective tissues. The relative importance of the type and magnitude of the
11

destructive forces and the characteristics affecting the tissues’ tolerance for those forces
are not well understood (Thompson, 2005).
Pressure as a construct. Early conceptual models for pressure ulcer formation
focused on describing the compressive force, or pressure, necessary to occlude capillary
blood flow, creating ischemia to the involved tissues. In 1930, Landis (cited in Defloor,
1999) first described capillary closing pressures of 12 and 32 mm Hg at the venous and
arterial end of a human finger capillary, respectively. Defloor (1999) suggested that the
commonly accepted arterial capillary closing pressure of 32 mmHg be re-evaluated with
regard to its clinical appropriateness because Landis’ study was conducted on healthy
persons. Defloor reasoned that persons who were ill enough to develop pressure ulcers
would have pathophysiologic processes that influence capillary closing pressures. Early
animal experiments conducted by Kosiack in 1959 (cited in Nixon, 2001) and a later
study outlining tissue tolerance for pressure over time by Reswick and Rogers (1976)
support an inverse parabolic relationship between the pressure intensity and time. These
findings suggest that minimal amounts of compressive force over long periods had the
same effect on blood flow as did high amounts of compressive force over shorter periods.
The findings by Reswick and Rogers (1976) and Kosiack (cited in Nixon, 2001), obviate
the utility of capillary closing pressures in describing the pathogenesis of pressure ulcers
in favor of multifactorial explanations.
Compressive forces, which are those forces applied perpendicularly to the skin,
seem to have the least destructive effects, especially when applied for short periods at a
low magnitude (Nixon, 2001). Uniformly distributed compressive forces briefly applied
to the body’s surface do not have any long-term effects on the tissues. For example, a
12
scuba diver in 33 feet of water experiences an external compressive force of about 760
mm Hg (Springle, 2000) but does not develop pressure ulcers because the external force
is uniformly applied and of short duration. This observation of uniform pressure
distribution suggests that other forces, combined with pressure, may be more destructive
than pressure alone.
Friction and shear as constructs. In 1958, the concept of shearing forces was
added to compressive forces as a second causal factor in the development of pressure
ulcers (Defloor, 1999). Shearing forces are those forces applied along a plane parallel to
the skin and supporting structures. The effects of shear and friction in combination with
compressive forces more completely explain the synergistic effects that these forces have
on pressure ulcer development. Shearing forces, in combination with compressive forces,
contribute to deformation of the deep tissues, thereby occluding blood flow and causing
ischemic damage (Nixon, 2001). Friction contributes to pressure ulcer development by
mechanical debridement of the epidermal and dermis layers rather than through ischemic
mechanisms. Nixon (2001) described research done by Dinsdale in 1973, when he
reported that friction initially removed the stratum corneum and separated the epidermis
from the dermis. It was established that friction forces alone did not result in ischemia,
but rather produced its effects through mechanical disruption of the epidermis. When
combined with compressive forces, shearing and friction decrease the pressure required
to occlude blood flow by approximately one half (Springle, 2000). The additive effects
of pressure, friction, and shear can overcome the skin and connective tissues’ tolerance
for these forces, producing a disruption in the skin’s integrity. The intensity and duration
13

of the external forces necessary to cause tissue damage is determined by the tissues’
ability to tolerate them.
External factors are categorized according to their mechanism of action on the
skin and underlying connective tissue and are composed of compressive, friction, and
shearing forces. These external forces, however, are not enough to produce pressure
ulcers by themselves (Defloor, 1999). Pressure ulcer development also depends on the
general health of the individual, skin, and associated tissues. These patient-specific
characteristics determine the duration and magnitude of external forces necessary to
produce pressure ulcers.
Patient-Specific Factors
Patient-specific risk factors constitute the individual’s overall tolerance of the
tissue to withstand external forces without damage (Braden & Bergstrom, 1987). The
interplay between the external forces of compression, friction, and shearing forces with
aspects of tissue tolerance are dynamic and multifactorial (Nixon, 2001), explaining
pressure ulcer incident differences among individuals with varying exposure to external
forces. The concept of tissue tolerance includes factors that are known to influence the
risk of pressure ulcer development, but do not directly affect the pressure, shear, and
friction forces. Risk factors are, however, just as important in the etiology of pressure
ulcer development as the accompanying pressure, shearing, and friction forces (Meijer,
Germs, Schneider, & Ribbe, 1994).
Tissue tolerance as a construct. Tissue’s tolerance for pressure, friction, and
shear is a function of the homeostatic factors that maintain skin structure, blood and
lymph flow to the skin and supporting structures. The dermal layer of the skin is a
14

critical determinate in its ability to tolerate pressure, friction and shearing forces. The
dermis is composed of the papillary layer and the reticular layer and is responsible for
most of the structural strength of the skin (Seeley, Stephens, & Tate, 2006). The
papillary layer is composed of papillae that extend upwards into the epidermis. The
dermal papillae contain an arteriolar and venous capillary necessary for nutrient and
waste exchange with cells in the epidermis. The reticular layer is composed of a mat of
collagen, elastin, and reticular fibers that contribute to the tensile strength of the skin
(Seeley et al., 2006). The subcutaneous layer, or hypodermis, has an abundance of fat.
In addition to its insulating and energy storage capabilities, fat is critical in dispersing the
effects of extraneous pressure (Nixon, 2001).
Cutaneous blood flow is proportional to the metabolic needs of the tissues. Local
blood flow is controlled by a combination of nervous and local factors associated with
cell metabolism, such as the accumulation of metabolic byproducts. Cutaneous blood
flow is also affected by the nervous system, which responds to various intravascular
systemic conditions, such as blood pressure fluctuation and fluid and electrolyte balance.
Vasoconstrictive nerve fibers from the sympathetic nervous system extend to most parts
of the circulatory system and are prominent in the skin.
In addition to the extensive blood supply, human skin is permeated with a mesh of
lymphatic vessels. Because lymph vessels have minimal or no musculature in their walls,
the circulation of lymph is sluggish and largely controlled by forces such as pressure,
skeletal muscle action, massaging, and heat. Any external pressure exerted, such as from
a fixed dressing, interferes with its flow. Since skin plays a major role in immunologic
15

responses of the body, its lymphatic drainage is as significant as its blood vascular system
(Skin Anatomy, n.d.).
In addition to the structural components of the skin, numerous types of sensory
nerve fibers transmit signals to the brain, relaying a vast amount of information about the
skin’s immediate environment. Of primary importance to the concept of pressure ulcers
are the mechanoreceptors and pain receptors located throughout the epidermis, dermis,
and subcutaneous layers. The ability to respond to these sensory stimuli requires an
intact central nervous system and functional effector organs, such as muscle, to alter a
noxious stimulus. Alterations in any component of the central nervous system or the
effector organs will affect the skin and supportive structure’s tolerance for pressure.
Lymphocytes, macrophages, and mast cells are intimately associated with the skin
and surrounding structures. When there is damage to the skin, these cells release
inflammatory cytokines and chemical mediators. These chemical mediators increase
vascular blood flow and vascular permeability at the injury site. Increased vascular
permeability alters the capillary exchange mechanism on both the arterial and venous
ends, resulting in an increase in net hydrostatic pressure combined with a decrease in net
osmotic pressure. The result is interstitial edema because of the increase in net filtration
pressure. As edema increases, the metabolic demands of the tissue increase and local
factors favor vasodilation. Vasodilation increases edema and the cycle worsens.
Eventually, increased edema overcomes the pressures in the capillaries and they close,
creating an ischemic environment that leads to cell death.
16

Environmental Factors
Additionally, environmental elements may contribute to pressure ulcer
development. For institutionalized (i.e. hospitalized and long-term care) patients,
environmental variables that influence the delivery of care are important because they
constitute elements of the clinical setting that affect patient outcomes (Kane, 2006).
Kane described outcomes as a function of the patient’s baseline clinical, psychosocial,
and demographic characteristics influenced by the treatments received and the setting in
which those treatments occur. When written as a formula, the relation between outcomes
and contributing factors becomes “Outcomes = ƒ (baseline, patient clinical
characteristics, patient demographic/psychosocial characteristics, treatment, setting)”
(Kane, 2006, p. 9).
Kane classified outcome measures as generic or condition-specific and suggested
that outcomes under investigation should be selected based on a clear idea of what needs
to be measured and why. Pressure ulcers qualify as a generic outcome because their
occurrence relates to numerous intrinsic and extrinsic factors (Nixon, 2001) and is
associated with multiple health conditions. Treatment and setting influences on patient
outcomes can be categorized as nurse characteristics, such as educational level, attitude,
and age (Aiken, Clarke, Cheung, Sloane, & Silber, 2003), and administratively mediated
variables, such as nurse staffing levels, nurse skill mix, hospital structural characteristics,
patient care environments, and equipment (Aiken, Clarke, Sloane, Lake, & Cheney,
2008).
Although environmental variables are increasingly recognized as important
contributors to patient outcomes such as pressure ulcer development (Horn, Buerhaus,
17

Bergstrom & Smout, 2005; Seago, Williamson, & Atwood, 2006), this research focused
on the effects of the external forces of compression, friction, and shear and those patient-
specific risk factors that comprise the tissue’s tolerance to the external forces.
Theoretical constructs contributing to pressure ulcer development are compressive
forces, shearing, and friction forces, and the tissues’ tolerance for those forces
(Bergstrom, Braden, Laquzza, & Holman, 1987; Thompson, 2005). For purposes of this
research, pressure ulcer risk factors were categorized as either external (pressure, friction
and shear) or patient-specific risk factors that affect the tissues’ ability to withstand the
external forces.
In summary, pressure ulcers are a localized area of damage to the skin and
underlying structures caused by compressive forces, shearing and friction, or a
combination thereof. The skin and underlying tissues’ ability to tolerate varying degrees
of these forces is a function of the structural integrity of the skin, the blood and lymph
flow to the cutaneous tissues, and an intact central nervous system required to reduce the
destructive effects of those forces. Damage to the skin or underlying tissues results in an
inflammatory immune response that ultimately contributes to localized ischemia and cell
death, if the damaging element such as prolonged pressure, persists.
Conceptual Models for Pressure Ulcer Development
Prior to 2012, there were two conceptual models demonstrating the relationships
between patient specific risk factors and the development of pressure ulcers. They are
the Braden and Bergstrom conceptual model (Figure 2.1), and the Defloor conceptual
model (Figure 2.2).
18

Braden and Bergstrom conceptual model. Braden and Bergstrom (1987)
published the first conceptual model to explain the patient specific etiology of pressure
ulcers (Figure 2.1). Their model was the first to identify components that contributed to
the tissues’ tolerance for pressure.
19
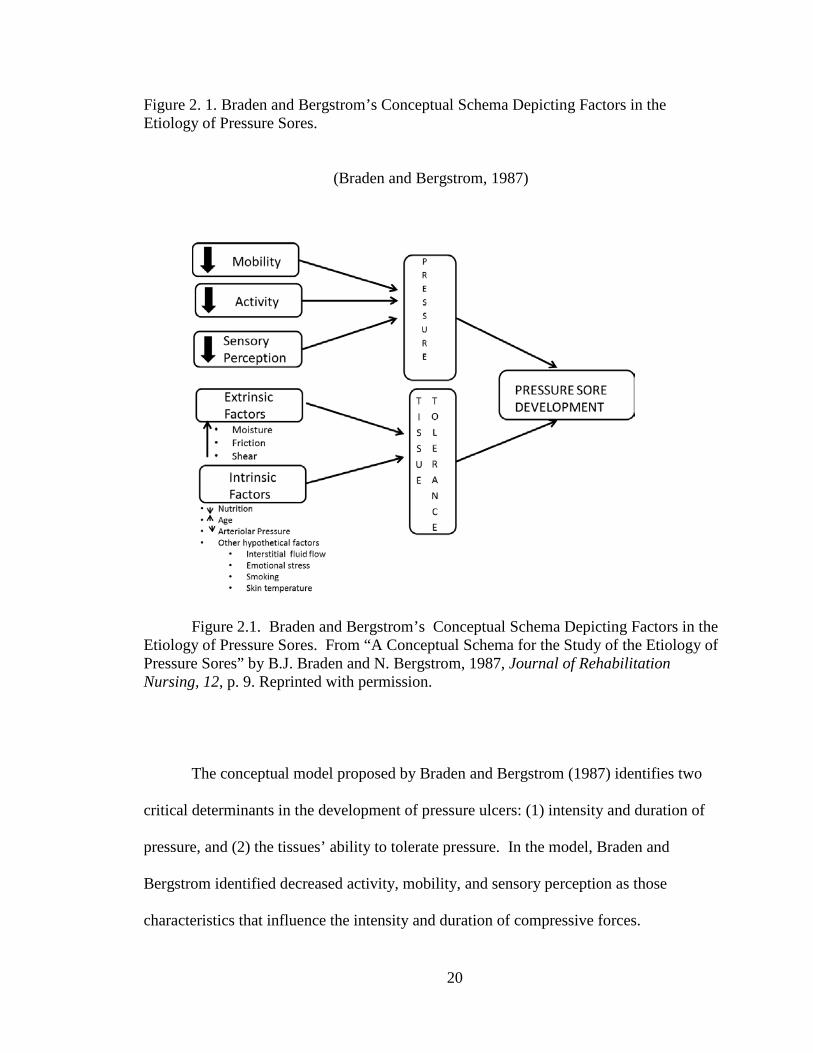
Figure 2. 1. Braden and Bergstrom’s Conceptual Schema Depicting Factors in the Etiology of Pressure Sores.
(Braden and Bergstrom, 1987)
Figure 2.1. Braden and Bergstrom’s Conceptual Schema Depicting Factors in the Etiology of Pressure Sores. From “A Conceptual Schema for the Study of the Etiology of Pressure Sores” by B.J. Braden and N. Bergstrom, 1987, Journal of Rehabilitation Nursing, 12, p. 9. Reprinted with permission.
The conceptual model proposed by Braden and Bergstrom (1987) identifies two
critical determinants in the development of pressure ulcers: (1) intensity and duration of
pressure, and (2) the tissues’ ability to tolerate pressure. In the model, Braden and
Bergstrom identified decreased activity, mobility, and sensory perception as those
characteristics that influence the intensity and duration of compressive forces.
20

To explain the variability in the tissues’ tolerance for any given intensity and
duration of compressive forces, Braden and Bergstrom (1987) drew heavily from the
literature published on pressure ulcer incidence in patients with spinal cord injuries.
Cross sectional, descriptive studies published in journals such as Archives of Physical
Medicine and Rehabilitation and the Journal of Plastic and Reconstructive Surgery
provided Braden and Bergstrom with the empirical evidence to include general and
patient specific factors in their model. Using the descriptive evidence in the literature,
Braden and Bergstrom identified intrinsic and extrinsic factors known to affect skin
integrity and included them in their construct for tissue tolerance. Among them are
friction and shearing forces, moisture, age, arteriolar pressure, and nutritional status.
This model, now commonly known as the Braden model, served as the basis for the
Braden Scale for Predicting Pressure Sore Risk© (Copyright by Barbara Braden & Nancy
Bergstrom, 1988; Bergstrom, Braden, Laquzza, & Holman, 1987) discussed later in this
chapter.
Defloor Conceptual Model. Defloor (1999) modified Braden and Bergstrom’s
conceptual framework to include two specific components that affect tissue tolerance
(Figure 2.2). Rather than the intrinsic and extrinsic components of tissue tolerance
identified by Braden and Bergstrom (1987), Defloor suggested that the overall concept of
tissue tolerance is composed of unique factors that influence the tissue’s tolerance for
pressure and its tolerance for alterations in oxygen supply and demand. According to
Defloor, the tissue’s tolerance for pressure is dependent on factors that help to distribute
pressure. Defloor defined pressure as the amount of force distributed over a surface area
and reasoned that factors that increase surface area will decrease the force on any given
21

plane of the skin/pressure interface. Tissue mass and factors that affect the skin’s ability
to distribute pressure, such as amount and quality of collagen, are examples of factors
that Defloor suggested influence the tissue’s tolerance for pressure and are conceptually
similar to those identified by Braden and Bergstrom. Defloor further modified Braden
and Bergstrom’s conceptual model by adding the construct of tissue oxygenation as a
determinate of tissue tolerance. Tissue oxygenation status is a function of the supply and
demand of the oxygen traveling to the skin and supporting connective tissues. Defloor
theorizes that mean arterial pressure, medications, and characteristics of the circulating
hemoglobin will affect oxygen supply and waste removal of the involved tissues, thereby
influencing the tissue’s tolerance for pressure.
Braden, Bergstrom, and Defloor Conceptual Model Comparison
Despite the multiple similarities in intrinsic, extrinsic, and determinants of
intensity and duration of pressure, Defloor enriched Braden’s concept of tissue tolerance
by describing factors that may contribute to either the structural or the physiologic
components of tissue that affect its tolerance for pressure. Although not mutually
exclusive, the elements in Defloor’s tissue tolerance concept elaborate on characteristics
commonly encountered in the clinical setting that are not explained in Braden’s
conceptual model.
22
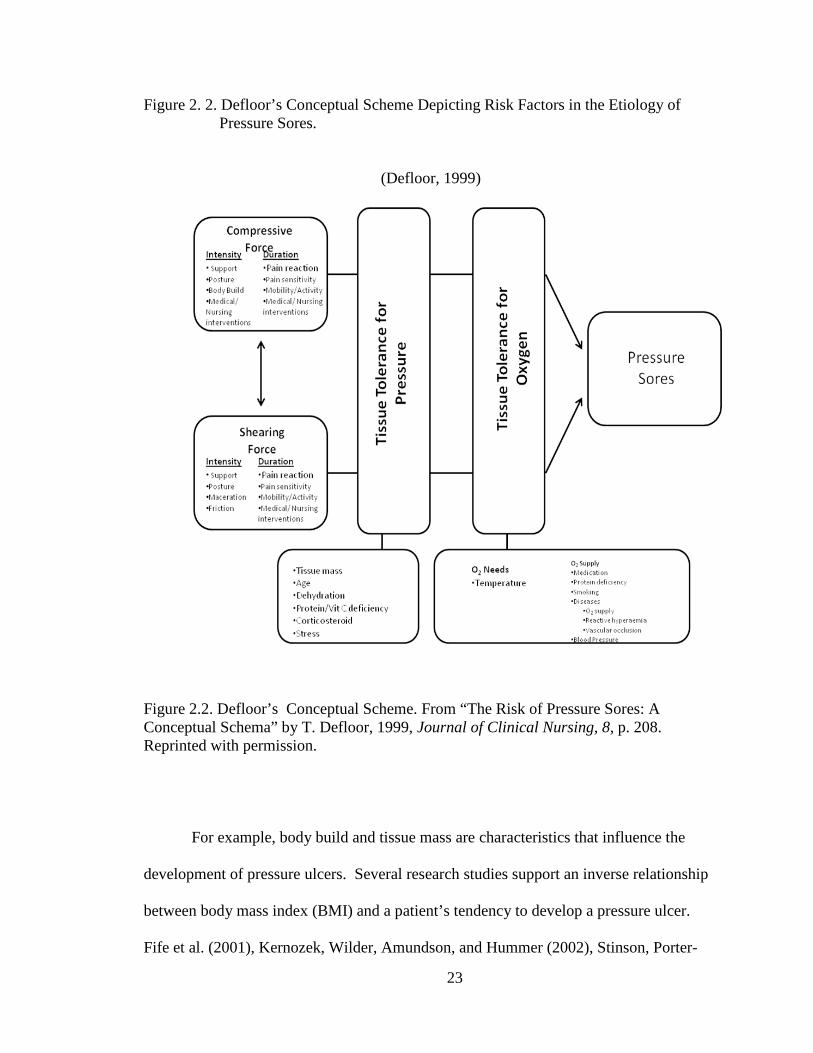
Figure 2. 2. Defloor’s Conceptual Scheme Depicting Risk Factors in the Etiology of Pressure Sores.
(Defloor, 1999)
Figure 2.2. Defloor’s Conceptual Scheme. From “The Risk of Pressure Sores: A Conceptual Schema” by T. Defloor, 1999, Journal of Clinical Nursing, 8, p. 208. Reprinted with permission.
For example, body build and tissue mass are characteristics that influence the
development of pressure ulcers. Several research studies support an inverse relationship
between body mass index (BMI) and a patient’s tendency to develop a pressure ulcer.
Fife et al. (2001), Kernozek, Wilder, Amundson, and Hummer (2002), Stinson, Porter-
23
Armstrong, and Eakin, (2003), and Lindgren, Unosson, Krantz, and Ek (2005) all
documented that patients with lower than normal body weights tend to develop pressure
ulcers more frequently than those of normal weight or obese patients. By including
characteristics such as body weight, medications, and diseases known to affect oxygen
demand and delivery, Defloor provided a more comprehensive approach to the study of
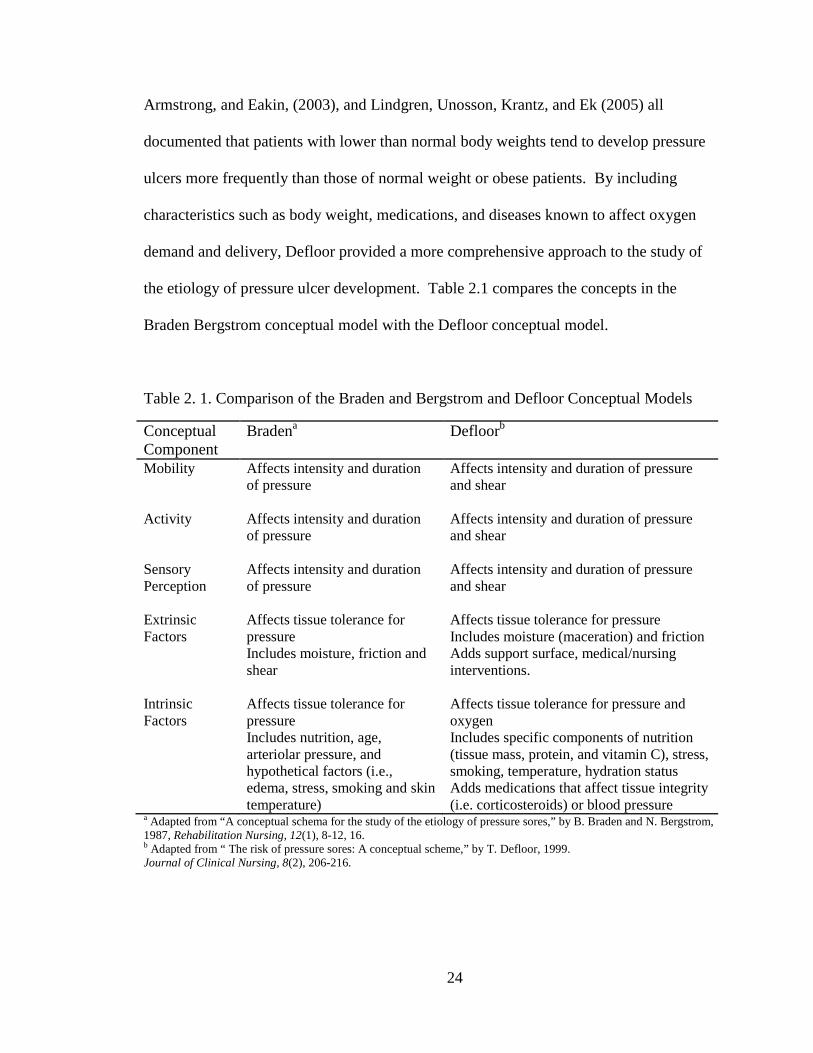
the etiology of pressure ulcer development. Table 2.1 compares the concepts in the
Braden Bergstrom conceptual model with the Defloor conceptual model.
Table 2. 1. Comparison of the Braden and Bergstrom and Defloor Conceptual Models
a Adapted from “A conceptual schema for the study of the etiology of pressure sores,” by B. Braden and N. Bergstrom, 1987, Rehabilitation Nursing, 12(1), 8-12, 16. b Adapted from “ The risk of pressure sores: A conceptual scheme,” by T. Defloor, 1999. Journal of Clinical Nursing, 8(2), 206-216.
Conceptual Component
Bradena Defloorb
Mobility Affects intensity and duration of pressure
Affects intensity and duration of pressure and shear
Activity Affects intensity and duration of pressure
Affects intensity and duration of pressure and shear
Sensory Perception
Affects intensity and duration of pressure
Affects intensity and duration of pressure and shear
Extrinsic Factors
Affects tissue tolerance for pressure Includes moisture, friction and shear
Affects tissue tolerance for pressure Includes moisture (maceration) and friction Adds support surface, medical/nursing interventions.
Intrinsic Factors
Affects tissue tolerance for pressure Includes nutrition, age, arteriolar pressure, and hypothetical factors (i.e., edema, stress, smoking and skin temperature)
Affects tissue tolerance for pressure and oxygen Includes specific components of nutrition (tissue mass, protein, and vitamin C), stress, smoking, temperature, hydration status Adds medications that affect tissue integrity (i.e. corticosteroids) or blood pressure
24

Critical Analysis of the Relevant Literature
State of Pressure Ulcer Risk Factor Science
Knowledge progression and associated research questions described by Wood and
Ross-Kerr (2006) suggests that subject knowledge progresses from descriptive,
observational studies aimed at identifying important components of a phenomenon to
understanding the relationships between those variables. Once the relationships are well
understood, the knowledge progresses to explaining cause and effect relationships
between the variables, requiring an experimental research design (Wood & Ross-Kerr,
2006). The current literature about pressure ulcer risk factors suggests that the constructs
of pressure and friction/shear are commonly accepted risk factors for pressure ulcer
development. A search of the PubMed database using the search terms “pressure ulcers”
and “risk factors”, with the limits of all adult, humans, and English, but with no date
restraints yielded 1054 articles published between 1975 and August 2012. Of those, 206
were cross sectional or cohort studies that described pressure ulcer risk factors in 585,729
subjects in various settings. Sixty-two were experimental treatment studies evaluating
the efficacy of pressure reduction and redistribution devices in 10,168 subjects in various
settings. None of the experimental studies evaluated treatments aimed at improving
tissue tolerance for pressure. This finding suggests that the relationship between the
magnitude and duration of pressure and pressure ulcers is understood well enough to
warrant experimental research; however, the knowledge surrounding components of
tissue tolerance is not advanced enough to warrant experimental intervention. de Laat et
al. (2006) assert that interventions for pressure ulcer preventions are predicated on
25

identifying salient risk factors for pressure ulcer development in specific patient
populations. As medical science evolves and patients with multiple comorbidities
survive longer, the search for pressure ulcer risk factors segregates among various target
populations, requiring additional study to identify salient pressure ulcer risk factors. The
literature is replete with studies designed to identify unique pressure ulcer risk factors in
various patient populations. The same literature search identified 39 studies evaluating
pressure ulcer risk in spinal cord injury patients, 14 evaluating risk factors in patients
with hip fractures, 13 for patients in the operating room, and 21 for critically ill patients.
Despite the abundance of findings reported in the literature for specific patient
populations, there is a demonstrated lack of any theoretical framework guiding the
research efforts (de Laat et al., 2006). Indeed, the only studies citing a theoretical
framework were those evaluating the predictive ability of various risk assessment scales.
The resulting findings describe a wide range of risk factors derived from author-
hypothesized risk factors and others identified by researchers through literature searches.
According to Anthony et al. (2008), over 200 risk factors for pressure ulcer development
are identified in the literature. However, the ability to generalize these findings becomes
increasingly limited as various target populations assume unique characteristics (Hulley,
Newman, & Cummings, 2007). Additionally there are measurement and definitional
differences among the study variables reported in the literature (de Laat et al., 2006),
contributing to the lack of generalizability of the risk factors identified. Use of an
accepted conceptual framework to guide risk factor study in the critically ill patient
population will standardize the identification and measurement of variables, thereby
26
enhancing the generalizability of the findings to guide nursing interventions aimed at
pressure ulcer prevention.
Theoretical frameworks to guide risk factor study. To evaluate the conceptual
frameworks used to identify pressure ulcer risk factors for study, the search term
“prospective” was added to the search limits described earlier. “Prospective” was chosen
because of the temporal association between prospective study designs and risk factor
identification supporting causality. That search returned 252 articles published between
1982 and June 2012. Of those, 175 were excluded because they were not relevant to
pressure ulcer risk factors, were literature summaries, or evaluated pressure ulcer
prevention or treatment interventions. Of the 77 remaining, 32 evaluated risk factors that
the authors identified from literature reviews or were included via expert opinion. None
of those 32 articles cited a theoretical framework guiding the research. Fifteen of the
articles evaluated the predictability of various pressure ulcer risk assessment scales by
examining specificity and sensitivity results in prospective incident studies. Braden and
Bergstrom’s (1987) conceptual model provided the theoretical framework guiding risk
factor identification in 30 of the studies.
Study populations. Study populations in the 77 articles evaluating pressure ulcer
risk were widely distributed. Table 2.2 provides a summary of the study populations
evaluated relative to pressure ulcer risk factors.
27
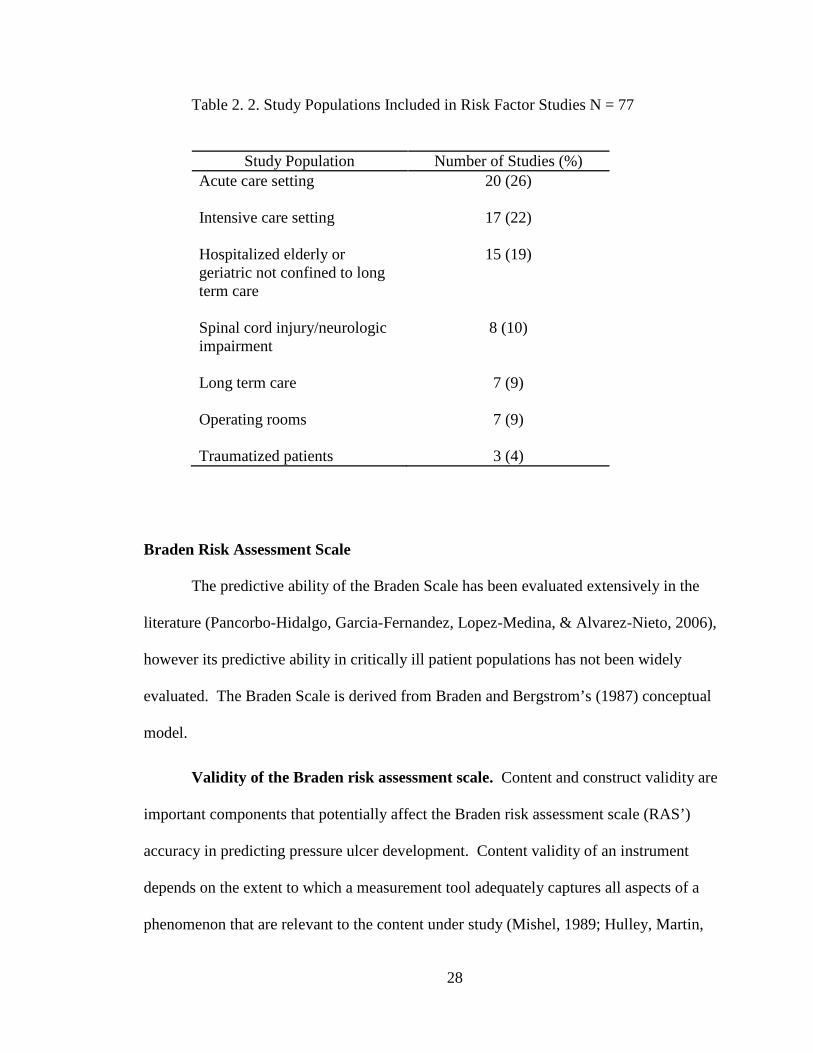
Table 2. 2. Study Populations Included in Risk Factor Studies N = 77
Study Population Number of Studies (%) Acute care setting 20 (26)
Intensive care setting 17 (22)
Hospitalized elderly or geriatric not confined to long term care
15 (19)
Spinal cord injury/neurologic impairment
8 (10)
Long term care
7 (9)
Operating rooms
7 (9)
Traumatized patients
3 (4)
Braden Risk Assessment Scale
The predictive ability of the Braden Scale has been evaluated extensively in the
literature (Pancorbo-Hidalgo, Garcia-Fernandez, Lopez-Medina, & Alvarez-Nieto, 2006),
however its predictive ability in critically ill patient populations has not been widely
evaluated. The Braden Scale is derived from Braden and Bergstrom’s (1987) conceptual
model.
Validity of the Braden risk assessment scale. Content and construct validity are
important components that potentially affect the Braden risk assessment scale (RAS’)
accuracy in predicting pressure ulcer development. Content validity of an instrument
depends on the extent to which a measurement tool adequately captures all aspects of a
phenomenon that are relevant to the content under study (Mishel, 1989; Hulley, Martin,
28

& Cummings, 2007). Construct validity refers to how well the tool in question adheres to
a set of theoretical constructs believed to influence the outcome (Hulley, Martin, &
Cummings, 2007). Although there is expert consensus on the validity of the Braden RAS
(Braden & Frantz, 2004), its predictive ability when used in various patient populations
varies because the theoretical constructs of the tool are based on patients in long-term
care facilities (Kottner, Dassen, & Tannen, 2009). Because the etiology of pressure ulcer
development is multifactorial (Nixon, 2001) and pressure ulcer etiology varies among
different patient populations (DeLaat et al., 2006), the content validity of the Braden
Scale may affect the accuracy of the tool in predicting pressure ulcer incidence in
disparate populations.
Reliability of the Braden risk assessment scale. The reliability of an instrument
refers to its consistency in assessing a phenomenon over time and is primarily dependent
on the degree of random error that is experienced during measurement (Mishel, 1989).
Reliability of a measure is a prerequisite for validity (Kottner & Dassen, 2010). To
determine the amount of reliability testing on the Braden RAS, a literature search was
conducted in PubMed using the search terms Braden scale/score and reliability with the
limits of humans, English, core clinical journals, nursing journals, and all adult. The
search returned 21 results. An additional search using identical limits and the search
terms pressure ulcer risk scales and reliability returned 19 results, 11 of which were
duplicates. Of the remaining 29, one was an incidence study, three were unrelated
articles, and six evaluated the interrater reliability of a modified version of the Braden
Scale. Three were designed as pre-test post-test evaluations of interrater agreement after
29

a web based educational initiative. Additionally, 12 were meta-analysis or review
articles.
The remaining four articles reviewed interrater reliability findings of the Braden
RAS in a multi-center, long-term care, home care, and intensive care unit (ICU)
environment. In their prospective study to evaluate the interrater reliability of the Braden
RAS in various acute care wards in multiple settings, Halfens, Van Achterberg, and Bal
(2000) evaluated the Braden scores of 320 patients collected by staff nurses on 11 acute
care wards. Various nurses rated each patient five times during the course of the study.
The interrater reliability for the Braden subscales varied from 0.71 to 0.86 (Cohen’s
kappa) with the moisture subscale demonstrating the lowest interrater reliability at 0.54
(Halfens et al., 2000).
In a cross-sectional study to evaluate the interrater reliability among nurses in two
German long-term care facilities, Kottner and Dassen (2008) evaluated data on 152 long-
term care residents. The first Braden score was obtained during a routine pressure ulcer
prevalence study then repeated scores were obtained by staff nurses up to three days later.
Kottner and Dassen (2008) reported intraclass correlation coefficients (ICC) on
individual subscore items from 0.06, 95% CI [-0.31, 0.48] to 0.97, 95% CI [0.93, 0.99]
with the ICC being lowest for the sensory perception subscale (ICC range 0.16 to 0.62)
and nutrition subscale (ICC range 0.17 to 0.89). Overall Braden scores demonstrated a
higher interrater agreement ranging from an ICC of 0.73, 95% CI [0.26, 0.910] to 0.95,
95% CI [0.87, 0.98]. Kottner, Halfens, and Dassen (2009) reported similar findings in a
cross sectional study designed to evaluate the interrater reliability of nurses using the
Braden RAS in a home care environment. Data were collected during pressure ulcer
30

prevalence surveys of 691 home care patients during 2007 and 2008. Patients were
scored twice; once by the home health nurse and a second time by a certified wound
nurse during each data collection period. Range values for the ICC of the Braden
subscales is not presented for either year; however, the overall summative Braden
summative scores from 2007 demonstrated an ICC of 0.90, 95% CI [0.88, 0.92] and an
ICC of 0.88, 95% CI [0.85, 0.91] in 2008.
One study evaluated the interrater reliability of the Braden RAS in two ICU
settings (Kottner & Dassen, 2010). Sequential cross-sectional studies were conducted in
two ICUs of a large university hospital in Germany between January and April of 2009.
Three nurses were randomly selected from each ICU to do Braden assessments on a total
of 45 patients. Range values for the ICC of the Braden subscales was not presented for
the study; however, the overall summative Braden summative scores demonstrated an
ICC of 0.72, 95% CI [0.52, 0.87] for one ICU and 0.84, 95% CI [0.72, 0.92] for the
second ICU (Kottner & Dassen, 2010). Based on the 0.71 to 0.86 range of Cohen’s
Kappa coefficients from the Halfens et al. (2000) study, the reliability of the Braden RAS
is considered good to very good (Newman, Browner, Cummings, & Hulley, 2007).
Because ICC agreement levels are considered much like the Kappa agreement levels,
(Reliability Analysis, n.d.), the 0.72 to 0.95 ICC range of Braden summative scores
reported by Kottner and Dassen (2008), Kottner, Halfens, and Dassen (2009), and
Kottner and Dassen (2010), indicate a similar ranking of good to very good.
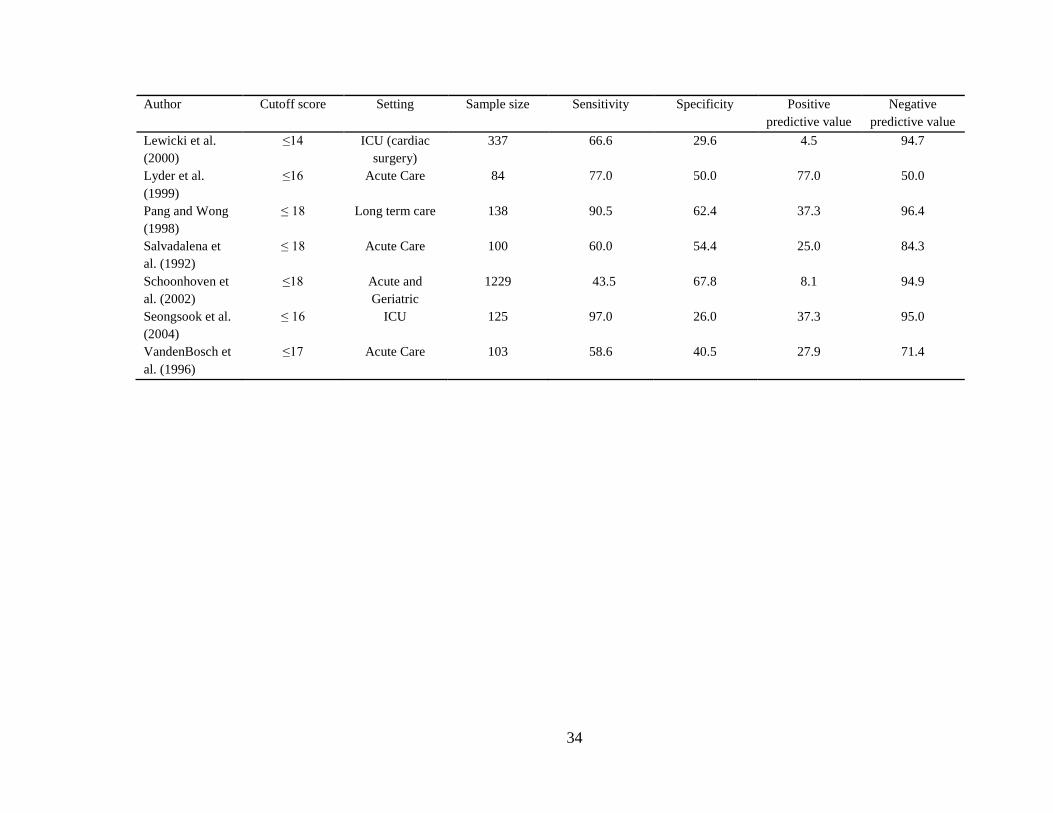
Specificity and sensitivity of the Braden risk assessment scale. The predictive
ability of the Braden Scale has been evaluated extensively in the literature (Pancorbo-
Hildalgo, et al., 2006). As outlined in Table 2.3, most of the specificity and sensitivity
31

studies of the Braden RAS were conducted in long term and acute care settings. In three
studies evaluating optimum scores for ICU patients, cutoff scores of 16 or less yielded a
sensitivity range from 97% to 66.6% with associated specificities ranging from 63.9% to
22%. In two of the three studies with larger sample sizes specificities were lower
(<30%). The same cutoff score had associated positive predictive values (PPVs) ranging
from 15.3% to 60.6%. The results of these studies indicate that a Braden Scale score of
16 or less adequately identifies patients at risk that do develop a pressure ulcer, but the
score is not specific enough to adequately screen out patients that do not develop a
pressure ulcer.
These values indicate that ICU clinicians may lack an accurate tool that accounts
for unique pressure ulcer risk factors associated with critically ill patients, resulting in a
diffuse application of prevention efforts to patients incorrectly identified to be at risk.
Multiple studies of the sensitivity and specificity of various RAS, including the Braden
Scale, indicate that none of them adequately identifies pressure ulcer risk across various
patient populations (Anthony, et al., 2008), raising doubt about the efficacy of any one
tool to guide treatment decisions in nursing homes, in acute care facilities, and ICUs.
32

Table 2. 3. Summary of Studies Evaluating the Specificity, Sensitivity, Positive, and Negative Predictive Values of the Braden Pressure Ulcer Risk Scale in Various Settings
Author Cutoff score Setting Sample size Sensitivity Specificity Positive predictive value
Negative predictive value
Barnes and Payton (1993)
≤16 Acute Care 361 72.7 90.6 33.3 98.1
Bergstrom, Braden et al. (1987)
≤ 16 Acute Care 100 100 90.2 43.8 100
Bergstrom, Demuth et al. (1987)
≤ 16 ICU 60 83.3 63.9 60.6 85.2
Bergstrom et al. (1998)
≤19 Combined 843 51.9 77.8 25.6 91.7
Braden and Bergstrom (1994)
≤ 18 Long term care 123 78.6 74.3 53.7 90.2
Capobianco and McDonald (1996)
≤16 Acute Care 50 71.4 83.3 62.5 88.2
Goodridge et al. (1998)
≤19 Long term care 330 50.0 52.3 10.1 90.7
Hagisawa and Barbenel (1999)
≤ 16 Acute Care 275 38.9 100 100 91.6
Halfens et al. (2000)
≤20 Acute Care 320 61.7 79.9 34.5 92.4
Langemo et al. (1991)
≤ 16 Acute Care 1244 54.5 93.7 60.0 92.2
Langemo et al. (1991)
≤ 18 Long term care 74 57.1 61.1 36.4 78.6
33
Author Cutoff score Setting Sample size Sensitivity Specificity Positive predictive value
Negative predictive value
Lewicki et al. (2000)
≤14 ICU (cardiac surgery)
337 66.6 29.6 4.5 94.7
Lyder et al. (1999)
≤16 Acute Care 84 77.0 50.0 77.0 50.0
Pang and Wong (1998)
≤ 18 Long term care
138 90.5 62.4 37.3 96.4
Salvadalena et al. (1992)
≤ 18 Acute Care 100 60.0 54.4 25.0 84.3
Schoonhoven et al. (2002)
≤18 Acute and Geriatric
1229 43.5 67.8 8.1 94.9
Seongsook et al. (2004)
≤ 16 ICU 125 97.0 26.0 37.3 95.0
VandenBosch et al. (1996)
≤17 Acute Care 103 58.6 40.5 27.9 71.4
34

Augmented Braden and Bergstrom Model
To provide a conceptual framework that incorporates pressure ulcer risk factors
specific to critically ill patients, the focus of this research, Benoit and Mion (2012)
augmented Braden and Bergstrom’s (1987) conceptual model with risk factors identified
in well-designed prospective studies. Multivariate findings from studies having high or
medium design quality as defined by the National Institute of Health and Clinical
Excellence (NICE, 2005) standards were conceptually grouped and subsequently
integrated into Braden and Bergstrom’s (1987) conceptual model, retaining their original
constructs and augmenting their concept of intrinsic factors for tissue tolerance. Thirty-
seven non-unique risk factor variables for pressure ulcer development were identified as
statistically significant (p ≤.05) at the multivariate level in eight studies identified as
higher quality using the NICE criteria (Benoit & Mion, 2012). These were condensed
into 18 unique risk factors that augment Braden and Bergstrom’s (1987) construct of
intrinsic Tissue Tolerance.
The additional risk factors were categorized as affecting metabolic supply and
demand, pressure distribution capacity, and threats to skin integrity. Metabolic supply
and demand included perfusion and oxygenation parameters, Braden’s nutrition subscale,
surgical treatment, severity of illness, and other physiologic alterations. Pressure
distribution capacity included gender, body habitus, and age. Threats to skin integrity
included preexisting pressure ulcers, dry or thin skin, edema, skin problems in pressure
prone areas, and chemical exposure, such as with fecal incontinence. The resulting
conceptual model (Figure 2.3) indicates that Tissue Tolerance is composed of Braden et
al.’s (1987) extrinsic concepts of Moisture and Friction/Shear and that the augmented
35
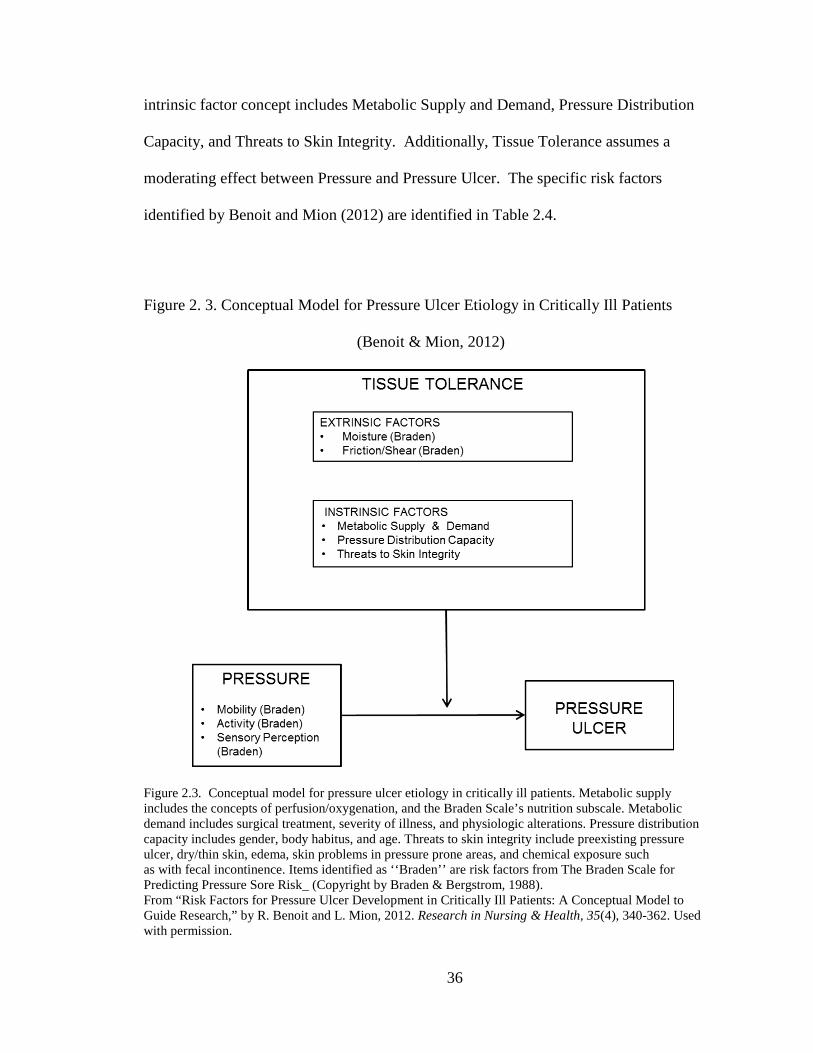
intrinsic factor concept includes Metabolic Supply and Demand, Pressure Distribution
Capacity, and Threats to Skin Integrity. Additionally, Tissue Tolerance assumes a
moderating effect between Pressure and Pressure Ulcer. The specific risk factors
identified by Benoit and Mion (2012) are identified in Table 2.4.
Figure 2. 3. Conceptual Model for Pressure Ulcer Etiology in Critically Ill Patients
(Benoit & Mion, 2012)
Figure 2.3. Conceptual model for pressure ulcer etiology in critically ill patients. Metabolic supply includes the concepts of perfusion/oxygenation, and the Braden Scale’s nutrition subscale. Metabolic demand includes surgical treatment, severity of illness, and physiologic alterations. Pressure distribution capacity includes gender, body habitus, and age. Threats to skin integrity include preexisting pressure ulcer, dry/thin skin, edema, skin problems in pressure prone areas, and chemical exposure such as with fecal incontinence. Items identified as ‘‘Braden’’ are risk factors from The Braden Scale for Predicting Pressure Sore Risk_ (Copyright by Braden & Bergstrom, 1988). From “Risk Factors for Pressure Ulcer Development in Critically Ill Patients: A Conceptual Model to Guide Research,” by R. Benoit and L. Mion, 2012. Research in Nursing & Health, 35(4), 340-362. Used with permission.
36
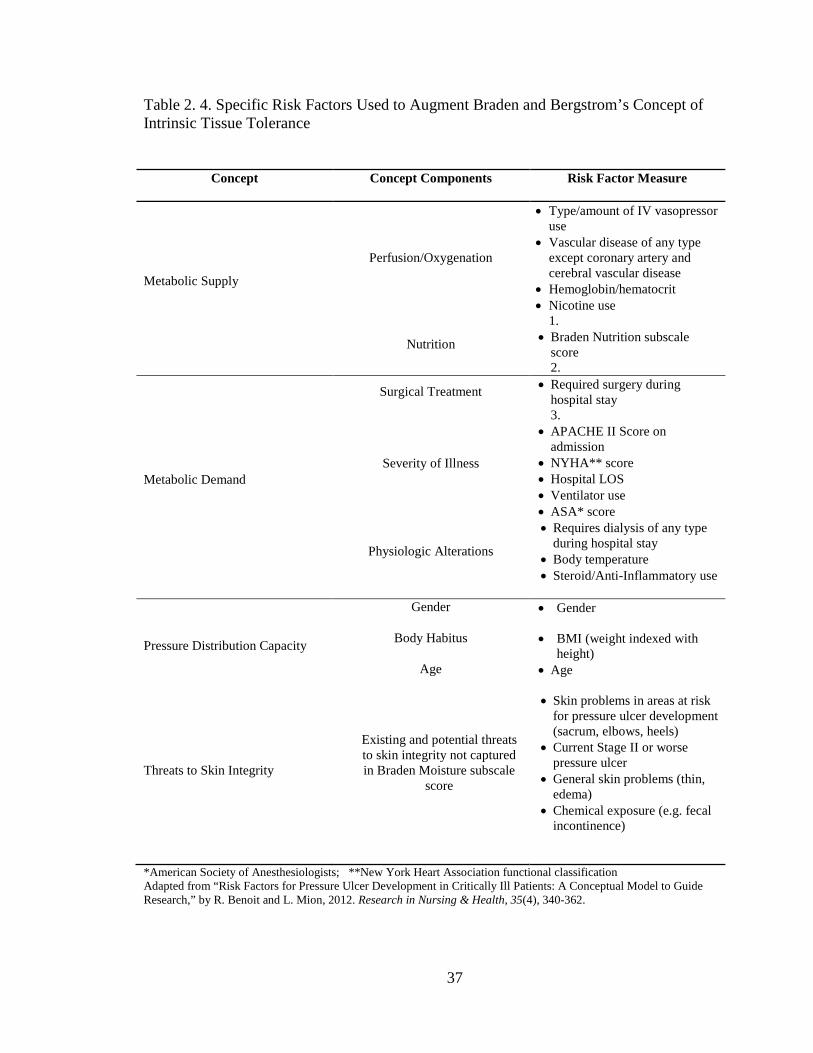
Table 2. 4. Specific Risk Factors Used to Augment Braden and Bergstrom’s Concept of Intrinsic Tissue Tolerance
Concept Concept Components Risk Factor Measure
Metabolic Supply
Perfusion/Oxygenation
• Type/amount of IV vasopressor use
• Vascular disease of any type except coronary artery and cerebral vascular disease
• Hemoglobin/hematocrit • Nicotine use
1.
Nutrition • Braden Nutrition subscale score 2.
Metabolic Demand
Surgical Treatment • Required surgery during hospital stay 3.
Severity of Illness
• APACHE II Score on admission
• NYHA** score • Hospital LOS • Ventilator use • ASA* score
Physiologic Alterations
• Requires dialysis of any type during hospital stay
• Body temperature • Steroid/Anti-Inflammatory use
Pressure Distribution Capacity
Gender • Gender
Body Habitus • BMI (weight indexed with height)
Age • Age
Threats to Skin Integrity
Existing and potential threats to skin integrity not captured in Braden Moisture subscale
score
• Skin problems in areas at risk for pressure ulcer development (sacrum, elbows, heels)
• Current Stage II or worse pressure ulcer
• General skin problems (thin, edema)
• Chemical exposure (e.g. fecal incontinence)
*American Society of Anesthesiologists; **New York Heart Association functional classification Adapted from “Risk Factors for Pressure Ulcer Development in Critically Ill Patients: A Conceptual Model to Guide Research,” by R. Benoit and L. Mion, 2012. Research in Nursing & Health, 35(4), 340-362.
37

Braden and Bergstrom’s modified conceptual framework served as the theoretical
framework for this study. Risk factor measures were selected from each of the
conceptual components based on their feasibility of study in the sample population.
Their measures and operational definitions are included below.
Definition of Terms
Primary Outcome Measure
The definition for pressure ulcer most commonly cited in the US is from the
National Pressure Ulcer Advisory Panel (NPUAP). According to the NPUAP, a pressure
ulcer is a “localized injury to the skin and/or underlying tissue usually over a bony
prominence, as a result of pressure, or pressure in combination with shear and/or friction.
A number of contributing or confounding factors are also associated with pressure ulcers;
the significance of these factors is yet to be elucidated” (NPUAP, 2007, Updated staging
systems, ¶ 2). The NPUAP also provides the most commonly used pressure ulcer
severity or staging system used in the US (NPUAP, 2007). In 2006, the NPUAP updated
its staging system to include six categories of pressure ulcer stages that includes stage I,
stage II, stage III, stage IV, unstageable, and suspected deep tissue injury (SDTI).
Because of its widely accepted use in the US, the NPUAP definitions from 2006 were
used to describe pressure ulcer severity in this study (NPUAP, 2007). The definitions for
pressure ulcer stages are:
38

• Stage I: Intact skin with non-blanchable redness of a localized area
usually over a bony prominence. Darkly pigmented skin may not have
visible blanching; its color may differ from the surrounding area.
• Stage II: Partial thickness loss of dermis presenting as a shallow open
ulcer with a red pink wound bed, without slough. This stage may also
present as an intact or open/ruptured serum-filled blister.
• Stage III: Full thickness tissue loss. Subcutaneous fat may be visible but
bone, tendon or muscle is not exposed. Slough may be present but does
not obscure the depth of tissue loss. This stage may include undermining
and tunneling.
• Stage IV: Full thickness tissue loss with exposed bone, tendon or muscle.
Slough or eschar may be present on some parts of the wound bed. This
stage often includes undermining and tunneling.
• Unstageable: Full thickness tissue loss in which the base of the ulcer is
covered by slough (yellow, tan, gray, green or brown) and/or eschar (tan,
brown or black) in the wound bed.
• Suspected Deep Tissue Injury (SDTI): Purple or maroon localized area of
discolored intact skin or blood-filled blister due to damage of underlying
soft tissue from pressure and/or shear. The area may be preceded by tissue
that is painful, firm, mushy, boggy, warmer, or cooler as compared to
adjacent tissue. (NPUAP, 2007, updated staging systems).
In case subjects with multiple pressure ulcers, the most severe pressure ulcer stage
was used.
39
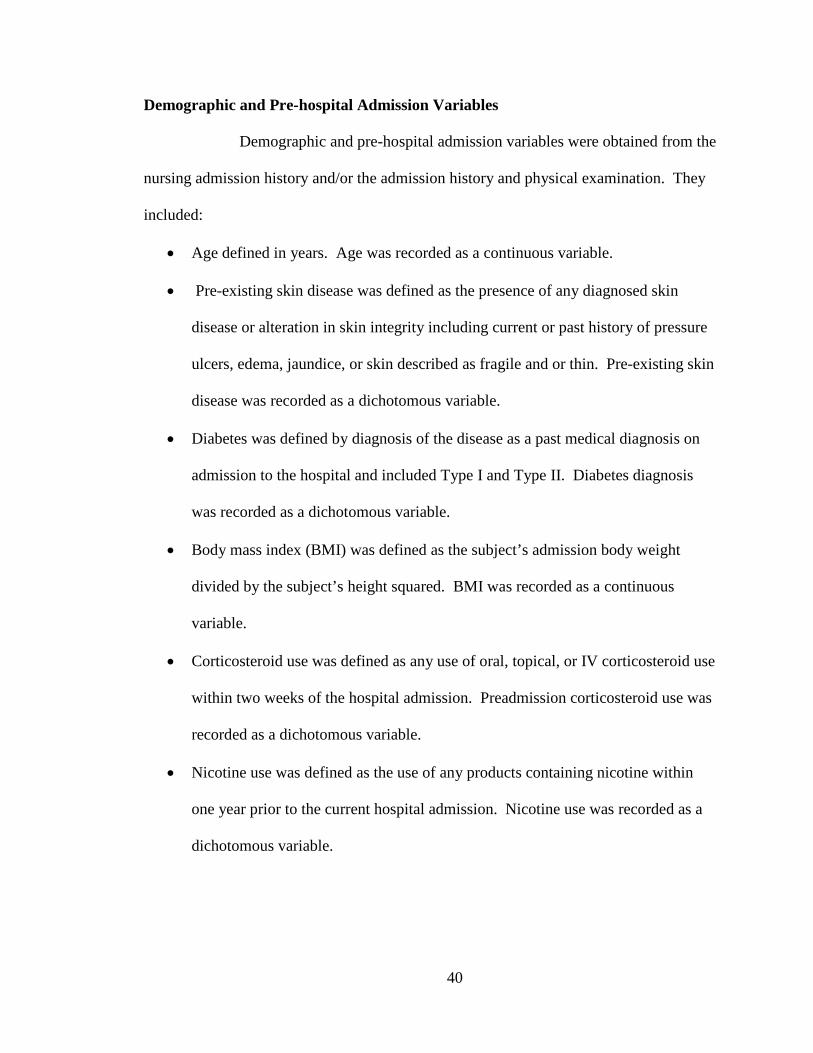
Demographic and Pre-hospital Admission Variables
Demographic and pre-hospital admission variables were obtained from the
nursing admission history and/or the admission history and physical examination. They
included:
• Age defined in years. Age was recorded as a continuous variable.
• Pre-existing skin disease was defined as the presence of any diagnosed skin
disease or alteration in skin integrity including current or past history of pressure
ulcers, edema, jaundice, or skin described as fragile and or thin. Pre-existing skin
disease was recorded as a dichotomous variable.
• Diabetes was defined by diagnosis of the disease as a past medical diagnosis on
admission to the hospital and included Type I and Type II. Diabetes diagnosis
was recorded as a dichotomous variable.
• Body mass index (BMI) was defined as the subject’s admission body weight
divided by the subject’s height squared. BMI was recorded as a continuous
variable.
• Corticosteroid use was defined as any use of oral, topical, or IV corticosteroid use
within two weeks of the hospital admission. Preadmission corticosteroid use was
recorded as a dichotomous variable.
• Nicotine use was defined as the use of any products containing nicotine within
one year prior to the current hospital admission. Nicotine use was recorded as a
dichotomous variable.
40

Post-Admission Clinical Study Variables
Post-admission study variables were obtained from the subject’s electronic
medical records (EMR). They included:
• Ventilator use: The continuous or discontinuous presence of a ventilator
delivering respiratory support on any mode via tracheal or endotracheal tube
within 48 hours of study enrollment. Ventilator use was recorded as a
dichotomous variable.
• The lowest subscale score of the Braden RAS (Braden & Bergstrom, 1987) within
a 24 and 48-hour period prior to study enrollment. A complete list of the Braden
subscales and their weighted definitions are presented in Table 2.5.
o Moisture: degree of skin exposure to moisture. Ranked as an ordinal
variable from least to greatest level of skin exposure on a 4-point scale.
o Friction/Shear: no overall summary definition given. Ranked as an
ordinal variable from least to greatest level of severity on a 3-point scale.
o Nutrition: usual food intake pattern. Ranked as an ordinal variable from
least to greatest level of intake on a 4-point scale.
o Sensory/Perception: ability to respond meaningfully to pressure related
discomfort. Ranked as an ordinal variable from least to greatest level of
ability on a 4-point scale.
o Mobility: ability to change and control body position. Ranked as an
ordinal variable from least to greatest level of mobility on a 4-point scale.
o Activity: degree of physical activity. Ranked as an ordinal variable from
least to greatest level of activity on a 4-point scale.
41
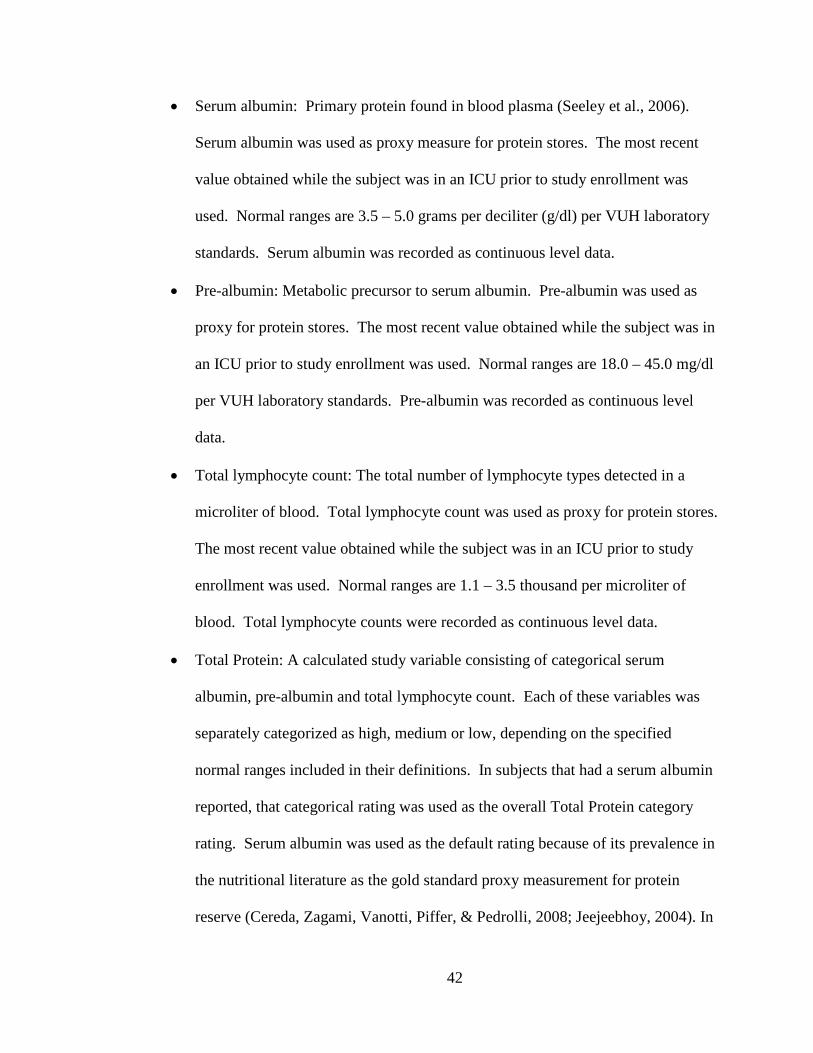
• Serum albumin: Primary protein found in blood plasma (Seeley et al., 2006).
Serum albumin was used as proxy measure for protein stores. The most recent
value obtained while the subject was in an ICU prior to study enrollment was
used. Normal ranges are 3.5 – 5.0 grams per deciliter (g/dl) per VUH laboratory
standards. Serum albumin was recorded as continuous level data.
• Pre-albumin: Metabolic precursor to serum albumin. Pre-albumin was used as
proxy for protein stores. The most recent value obtained while the subject was in
an ICU prior to study enrollment was used. Normal ranges are 18.0 – 45.0 mg/dl
per VUH laboratory standards. Pre-albumin was recorded as continuous level
data.
• Total lymphocyte count: The total number of lymphocyte types detected in a
microliter of blood. Total lymphocyte count was used as proxy for protein stores.
The most recent value obtained while the subject was in an ICU prior to study
enrollment was used. Normal ranges are 1.1 – 3.5 thousand per microliter of
blood. Total lymphocyte counts were recorded as continuous level data.
• Total Protein: A calculated study variable consisting of categorical serum
albumin, pre-albumin and total lymphocyte count. Each of these variables was
separately categorized as high, medium or low, depending on the specified
normal ranges included in their definitions. In subjects that had a serum albumin
reported, that categorical rating was used as the overall Total Protein category
rating. Serum albumin was used as the default rating because of its prevalence in
the nutritional literature as the gold standard proxy measurement for protein
reserve (Cereda, Zagami, Vanotti, Piffer, & Pedrolli, 2008; Jeejeebhoy, 2004). In
42
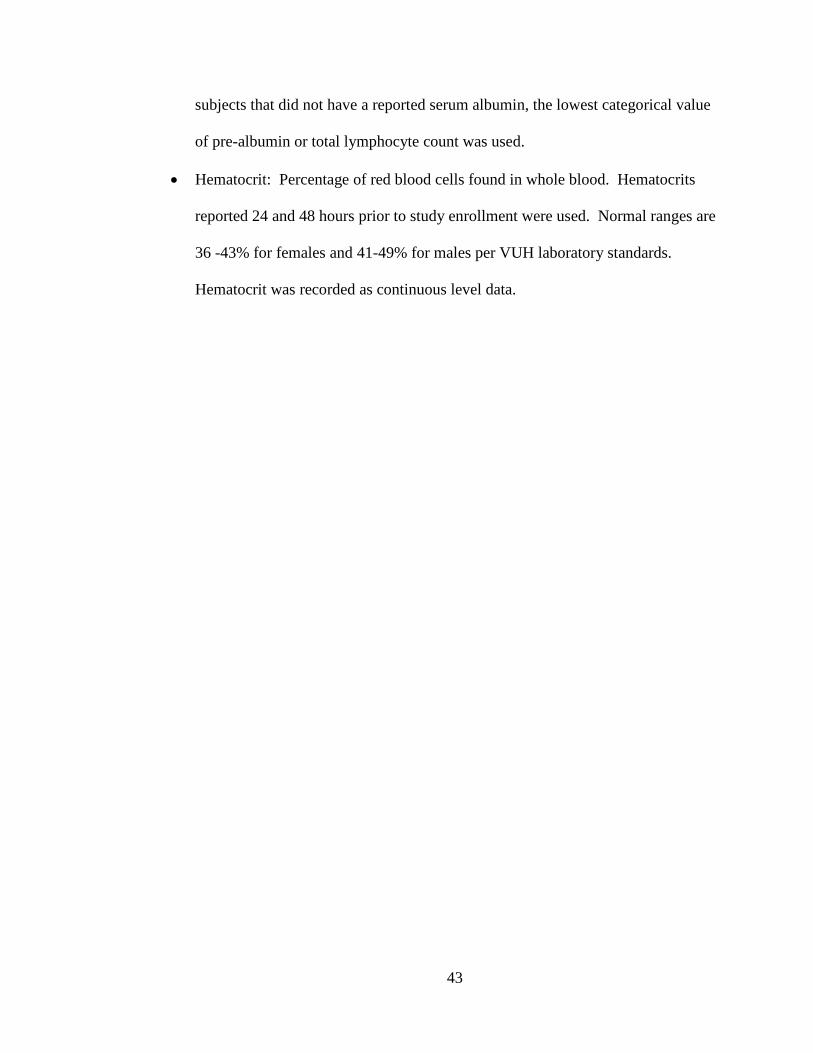
subjects that did not have a reported serum albumin, the lowest categorical value
of pre-albumin or total lymphocyte count was used.
• Hematocrit: Percentage of red blood cells found in whole blood. Hematocrits
reported 24 and 48 hours prior to study enrollment were used. Normal ranges are
36 -43% for females and 41-49% for males per VUH laboratory standards.
Hematocrit was recorded as continuous level data.
43

Table 2. 5. Braden Sub-Scale Definitions
Risk Factor Variable Scoring Criteria SENSORY PERCEPTION ability to respond meaningfully to pressure-related discomfort
1. Completely Limited Unresponsive (does not moan, flinch, or grasp) to painful stimuli, due to diminished level of consciousness or sedation. OR limited ability to feel pain over most of body
2. Very Limited Responds only to painful stimuli. Cannot communicate discomfort except by moaning or restlessness OR has a sensory impairment which limits the ability to feel pain or discomfort over ½ of body.
3. Slightly Limited Responds to verbal commands, but cannot always communicate discomfort or the need to be turned. OR has some sensory impairment which limits ability to feel pain or discomfort in 1 or 2 extremities.
4. No Impairment Responds to verbal commands. Has no sensory deficit which would limit ability to feel or voice pain or discomfort.
MOISTURE degree to which skin is exposed to moisture
1. Constantly Moist Skin is kept moist almost constantly by perspiration, urine, etc. Dampness is detected every time patient is moved or turned.
2. Very Moist Skin is often, but not always moist. Linen must be changed at least once a shift.
3. Occasionally Moist Skin is occasionally moist, requiring an extra linen change approximately once a day.
4. Rarely Moist Skin is usually dry, linen only requires changing at routine intervals.
ACTIVITY degree of physical activity
1. Bedfast Confined to bed.
2. Chairfast Ability to walk severely limited or non-existent. Cannot bear own weight and/or must be assisted into chair or wheelchair.
3. Walks Occasionally Walks occasionally during day, but for very short distances, with or without assistance. Spends majority of each shift in bed or chair
4. Walks Frequently Walks outside room at least twice a day and inside room at least once every two hours during waking hours
MOBILITY ability to change and control body position
1. Completely Immobile Does not make even slight changes in body or extremity position without assistance
2. Very Limited Makes occasional slight changes in body or extremity position but unable to make frequent or significant changes independently
3. Slightly Limited Makes frequent though slight changes in body or extremity position independently.
4. No Limitation Makes major and frequent changes in position without assistance.
44

Risk Factor Variable Scoring Criteria NUTRITION usual food intake pattern
1. Very Poor Never eats a complete meal. Rarely eats more than a of any food offered. Eats 2 servings or less of protein (meat or dairy products) per day. Takes fluids poorly. Does not take a liquid dietary supplement OR is NPO and/or maintained on clear liquids or IV=s for more than 5 days.
2. Probably Inadequate Rarely eats a complete meal and generally eats only about 2 of any food offered. Protein intake includes only 3 servings of meat or dairy products per day. Occasionally will take a dietary supplement. OR receives less than optimum amount of liquid diet or tube feeding
3. Adequate Eats over half of most meals. Eats a total of 4 servings of protein (meat, dairy products per day. Occasionally will refuse a meal, but will usually take a supplement when offered OR is on a tube feeding or TPN regimen which probably meets most of nutritional needs
4. Excellent Eats most of every meal. Never refuses a meal. Usually eats a total of 4 or more servings of meat and dairy products. Occasionally eats between meals. Does not require supplementation.
FRICTION & SHEAR (no definition given)
1. Problem Requires moderate to maximum assistance in moving. Complete lifting without sliding against sheets is impossible. Frequently slides down in bed or chair, requiring frequent repositioning with maximum assistance. Spasticity, contractures or agitation leads to almost constant friction
2. Potential Problem Moves feebly or requires minimum assistance. During a move skin probably slides to some extent against sheets, chair, restraints or other devices. Maintains relatively good position in chair or bed most of the time but occasionally slides down.
3. No Apparent Problem Moves in bed and in chair independently and has sufficient muscle strength to lift up completely during move. Maintains good position in bed or chair.
N A
Braden Scale for Predicting Pressure Sore Risk© (Copyright by Braden & Bergstrom, 1988).
45
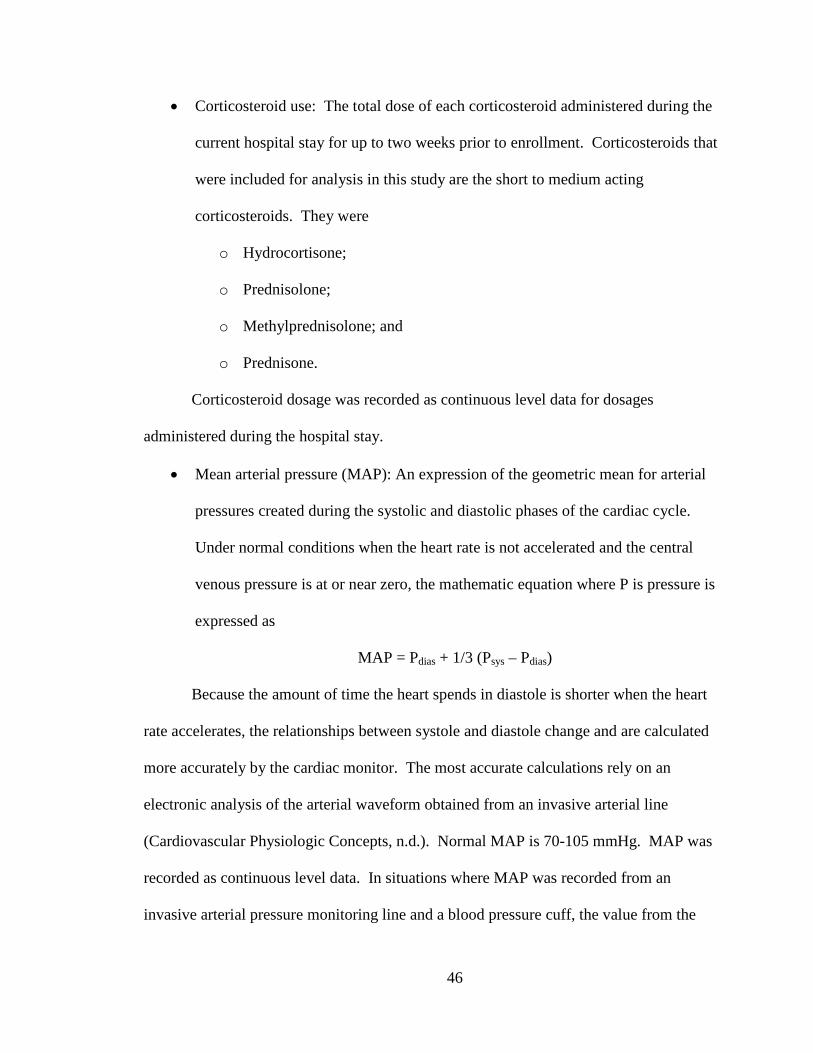
• Corticosteroid use: The total dose of each corticosteroid administered during the
current hospital stay for up to two weeks prior to enrollment. Corticosteroids that
were included for analysis in this study are the short to medium acting
corticosteroids. They were
o Hydrocortisone;
o Prednisolone;
o Methylprednisolone; and
o Prednisone.
Corticosteroid dosage was recorded as continuous level data for dosages
administered during the hospital stay.
• Mean arterial pressure (MAP): An expression of the geometric mean for arterial
pressures created during the systolic and diastolic phases of the cardiac cycle.
Under normal conditions when the heart rate is not accelerated and the central
venous pressure is at or near zero, the mathematic equation where P is pressure is
expressed as
MAP = Pdias + 1/3 (Psys – Pdias)
Because the amount of time the heart spends in diastole is shorter when the heart
rate accelerates, the relationships between systole and diastole change and are calculated
more accurately by the cardiac monitor. The most accurate calculations rely on an
electronic analysis of the arterial waveform obtained from an invasive arterial line
(Cardiovascular Physiologic Concepts, n.d.). Normal MAP is 70-105 mmHg. MAP was
recorded as continuous level data. In situations where MAP was recorded from an
invasive arterial pressure monitoring line and a blood pressure cuff, the value from the
46
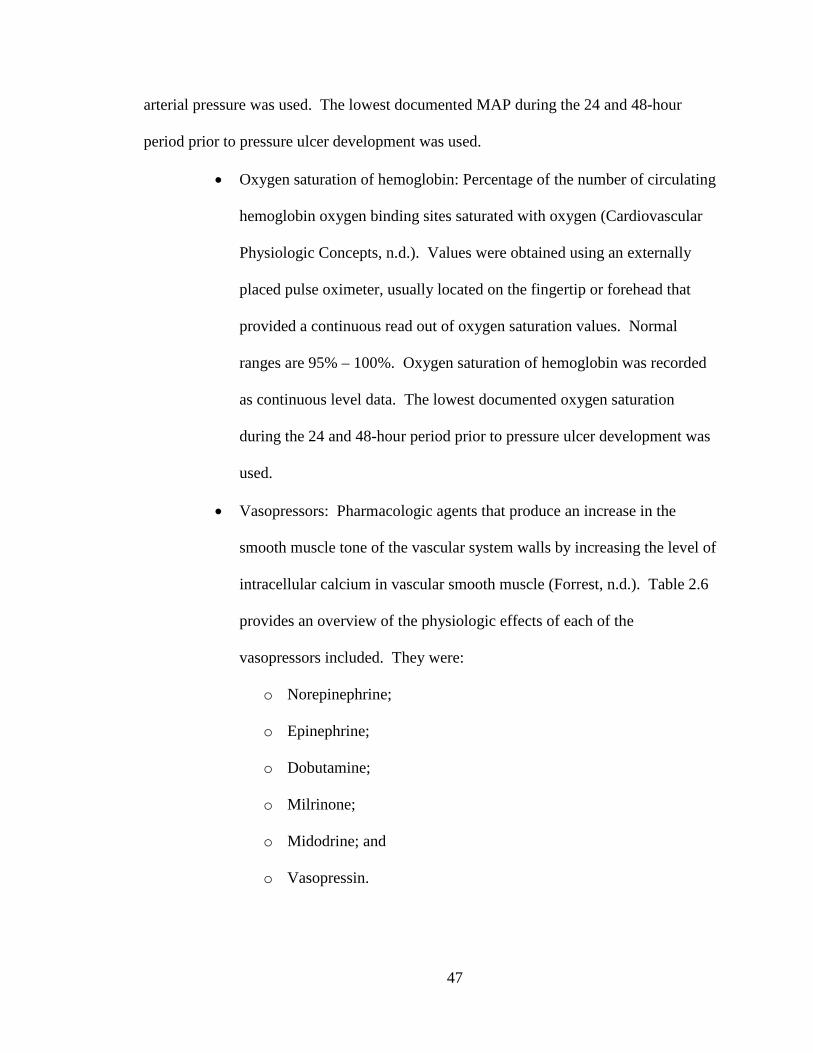
arterial pressure was used. The lowest documented MAP during the 24 and 48-hour
period prior to pressure ulcer development was used.
• Oxygen saturation of hemoglobin: Percentage of the number of circulating
hemoglobin oxygen binding sites saturated with oxygen (Cardiovascular
Physiologic Concepts, n.d.). Values were obtained using an externally
placed pulse oximeter, usually located on the fingertip or forehead that
provided a continuous read out of oxygen saturation values. Normal
ranges are 95% – 100%. Oxygen saturation of hemoglobin was recorded
as continuous level data. The lowest documented oxygen saturation
during the 24 and 48-hour period prior to pressure ulcer development was
used.
• Vasopressors: Pharmacologic agents that produce an increase in the
smooth muscle tone of the vascular system walls by increasing the level of
intracellular calcium in vascular smooth muscle (Forrest, n.d.). Table 2.6
provides an overview of the physiologic effects of each of the
vasopressors included. They were:
o Norepinephrine;
o Epinephrine;
o Dobutamine;
o Milrinone;
o Midodrine; and
o Vasopressin.
47
With the exception of Vasopressin, each vasopressor was calculated in total
micrograms/kg (μg/kg) each day for 24 and 48 hours prior to study enrollment.
Vasopressin was calculated as total units each day for 24 and 48 hours prior to study
enrollment. Vasopressor doses were recorded as continuous level data.
• Prior vasopressor use: The use of any additional vasopressor prior to study
enrollment. Vasopressors in use at the time of study enrollment were excluded.
Prior vasopressor use was recorded as dichotomous data.
• Restraint Use: The continuous or discontinuous use of wrist restraints at any time
during the 24 and 48 hours prior to study enrollment. Restraint use was recorded
as dichotomous level data.
48

Table 2. 6. Overview of the Physiologic Effects of Selected Vasopressors
Vasopressor Half-life and excretion
Effect on skin blood flow Comments
Dobutamine 2 min – renal
Primarily a beta 1 agonist with minimal effect on peripheral vascular constriction
Epinephrine 2 min – renal
Non-selective adrenergic agonist Alpha receptor stimulation produces pronounced vasoconstriction
Cutaneous vasoconstriction leads to rise in temperature and metabolic activity
Midodrine 25 min – unclear
Alpha adrenergic agonist Alpha receptor stimulation produces pronounced vasoconstriction
Milrinone 2.4 hours – renal
Phosphodiesterase inhibitor Produces vasodilation and has positive inotropic effects
Norepinephrine
Termination of effects related to degradation to metabolites and presynaptic uptake
Less potent than epinephrine at alpha receptor sites
Vasopressin 10-20 min-liver, renal
Directly stimulates smooth muscle V1 receptors but effects on skin blood flow uncertain
Adapted from “Vasopressors” by P. Forrest (n.d.).
49

Summary
As medical science progresses and patients are living longer with multiple
comorbidities, pressure ulcer risk becomes stratified among various patient populations,
requiring additional research to completely understand pressure ulcer etiology in any
given patient population. Pressure ulcer risk factor studies are well documented in the
literature; however, the results have limited generalizability because of methodological
and definitional inconsistencies. Additionally, a conceptual framework does not guide
the majority of studies, producing a myriad of findings that do not substantially
contribute to evidence-based prevention interventions by clinicians. Prior to 2012,
Braden and Bergstrom (1987) and Defloor (1999) provided the only conceptual models to
guide risk factor research. Because neither was specifically designed for evaluating risk
factors in the critically ill patient, the focus population of interest, Braden and
Bergstrom’s conceptual model was augmented to identify pressure ulcer risk factors that
disproportionately contributed to pressure ulcer incidence in this patient population. The
augmented model (Benoit & Mion, 2012) served as the conceptual model for this study.
The following chapter describes the methodology employed to meet the aims of this
study.
50
CHAPTER III
STUDY METHODOLOGY
Overview
This chapter presents the methodology used to investigate the significance of
patient-specific risk factors identified in the conceptual model for pressure ulcer
development in critically ill subjects (Figure 2.3). The methodology is presented in the
order of:
1. Design of the research study;
2. Assumptions surrounding the research design;
3. Description of the research setting;
4. Sample and sampling plan;
5. Data collection methods; and
6. Data analysis.
Research Design
This study utilized a prospective, case-control design. This design is best suited
for evaluating the effect of risk factors on the development of a relatively rare outcome,
pressure ulcer development (Cummings, Newman, & Hulley, 2007).
51

Assumptions Surrounding the Research Design
Theoretical Assumption
Braden and Bergstrom’s (1987) augmented conceptual model (Figure 2.3) served
as the theoretical basis for this study. By enhancing the explanatory model, the assumed
criterion-related validity of the model improved, thereby theoretically enhancing its
predictive ability (Cummings, et al., 2007). The predictive ability of the associated
Braden Scale score, discussed in Chapter 2, could be improved by enhancing the
criterion-related validity for critically ill patients. This study did not intend to test a
modified Braden Scale; its goal was to validate the enhanced model. Subsequent
research using the risk factors validated in this study to evaluate the Braden Scale score’s
predictive ability in critically ill patients will support or refute the assumptions made
about the criterion-related validity of the enhanced model.
Methodological Assumptions
Literature describing the timeframes for pressure ulcer onset is scant leading to
assumptions about when to measure both dependent and the independent variables in this
study. Because time-to-event of pressure ulcer genesis is not fully understood, and
because the temporal relationships between tissue insult and pressure ulcer development
probably vary with each individual (Nixon, 2001; Pronovost, Goeschel, & Wachter,
2008), the timing of data collection in this study is based on clinical judgment and
consensus of the dissertation committee. Gefen (2008) integrated evidence from various
studies and concluded that pressure ulcers may form within one to six hours of insult.
52

However, in a multisite study of pressure ulcer incidence, Bergstrom et al. (1998)
observed some new pressure ulcer onset at 21 days; although it is unclear if the authors
were able to relate tissue insult to the new pressure ulcer occurrences.
Annual admissions to the study ICUs, based on fiscal year (FY) 2009 data, were
7,654 adult patients. Of those, 5,514 (72%) had a length of stay (LOS) greater than 48
hours in the ICU. To minimize sample bias incurred by including case patients with a
non-ICU acquired pressure ulcer, and to maximize case enrollment, any pressure ulcer
occurring after 48 hours of admission to an ICU was considered ICU acquired for
purposes of this study. This timeframe provided some assurance that tissue insults
resulting in pressure ulcers occurring before the ICU admission would be evident within
48 hours and not erroneously considered ICU acquired.
Similarly, there is no evidence in the literature suggesting optimal timeframes to
capture cause and effect of vasopressor use, physiologic parameters, and resulting
pressure ulcer incidence. Clinical judgment and consensus of the dissertation committee
suggested that these data be collected retrospectively at 48 and 24-hour increments prior
to pressure ulcer development.
If vasopressor use and alterations in the physiologic parameters identified for
study occurred prior to the 48-hour cutoff disproportionately contributed to pressure ulcer
incidence, their effects were not recognized with the timeframe constraints in this study,
contributing to a Type I error in the interpretation of the findings. To account for this
possibility, vasopressor use at any time during the ICU stay prior to pressure ulcer
development was captured as a dichotomous variable. Further research using varying
53

timeframes for physiologic data capture will yield better estimates about the temporal
relationships of these variables to pressure ulcer incidence.
Description of the Research Setting
The study took place in five adult intensive care units (ICUs) at VUH in
Nashville, TN. VUH is an 847-bed teaching hospital that operates the only Level 1
Trauma Center, and the only Level 3 Burn Unit in Middle Tennessee. The five ICUs are
Cardiovascular ICU (CVICU, 27 beds), Medical ICU (MICU, 34 beds), a combined
neuro-medicine and neuro-surgical ICU (NICU, 34 beds), Surgical ICU (SICU, 34 beds),
and Trauma ICU (TICU, 14 beds).
Study Concepts and Variables
The conceptual model used as the theoretical basis for this study (Figure 2.3)
identifies two constructs containing eight concepts that can be measured by 23 variables
(Table 3.1). The three Braden Scale’s sub scores of Mobility, Activity, and Sensory
Perception exclusively measure the construct of Pressure. Likewise, the Braden Scale’s
sub scores of Moisture and Friction/Shear exclusively measure extrinsic factors related to
Tissue Tolerance. Intrinsic factors related to Metabolic Supply and Demand contain 10
risk factors. Of those, the presence of surgical procedures was not captured because of
the mixed ICU population used in this study. Ventilator use, a proxy measure for
severity of illness, was used to match cases and controls, so was not evaluated as an
independent risk factor. Body temperature and the use of hemodialysis were not
captured.
54

Table 3. 1. Constructs, Concepts, and Associated Risk Factors for the Development of Pressure Ulcers in Critically Ill Patients
Pressure Construct Tissue Tolerance Construct Risk Factors
Mobility (Braden) Concept of Extrinsic Factors
Risk Factors Activity (Braden) Moisture (Braden) Sensory Perception (Braden) Friction/Shear (Braden)
Concept of Intrinsic Factors Risk Factors
• Metabolic Supply o Vasopressor use o Vascular disease of any type except
cerebral and cardiovascular o Nicotine use o Lower hemoglobin/hematocrit o Nutrition (Braden)/Protein reserve • Metabolic Demand o Surgical procedure o Increased severity of illness • Physiologic demands o Dialysis of any type o Body temperature o Corticosteroid use • Pressure Distribution o Gender (male) o Body habitus o Increased age • Threats to Skin Integrity o Pre-existing pressure ulcer o Dry, thin skin o Edema o General skin problems in pressure prone
areas o Chemical exposure, such as with
incontinent diarrhea
Pressure distribution capacity contains three risk factors, all of which were
included in the study. They are BMI, age, and gender. Threats to skin integrity include
55

five unique risk factors. Four of those (pre-existing pressure ulcer, dry, thin skin, edema,
and skin problems) were captured as nominal variables. Chemical exposure, such as with
diarrhea, was not captured because of the variability of its use as a descriptive term in the
nursing documentation, and its presence and magnitude could not be visually verified by
the investigator. Of the 23 variables identified by the conceptual model, 18 were
included for data collection. Table 3.2 summarizes concepts, variables, and variable
levels collected for data analysis. Refer to Chapter II for a complete list of term
definitions and measurement frequency.
Table 3. 2. Variables Included for Study
Variable Type Aim Purpose† Pre-Admission variables
Diabetes history Dichotomous/Nominal 1,2 D, C
Nicotine history Dichotomous 1,2 D, C
Steroid history Dichotomous 1,2 D, C Pre-existing skin disease Dichotomous/Nominal 1,2 D, C
Demographic variables
ICU Nominal 1,2 D, C Gender Dichotomous 1,2 D, C Age Continuous 1,2 D, C
Pressure ulcer risk Braden Subscale Score Nominal 1,2 D, C
Threats to skin integrity
BMI* Continuous 1,2 D, C Corticosteroid dose Continuous 1,2 D, C
Restraint use Dichotomous 1,2 D, C Albumin Continuous 1,2 D, C Pre-Albumin Continuous 1,2 D, C Total lymphocytes Continuous 1,2 D, C
Total Protein Nominal 1.2 D, C
56
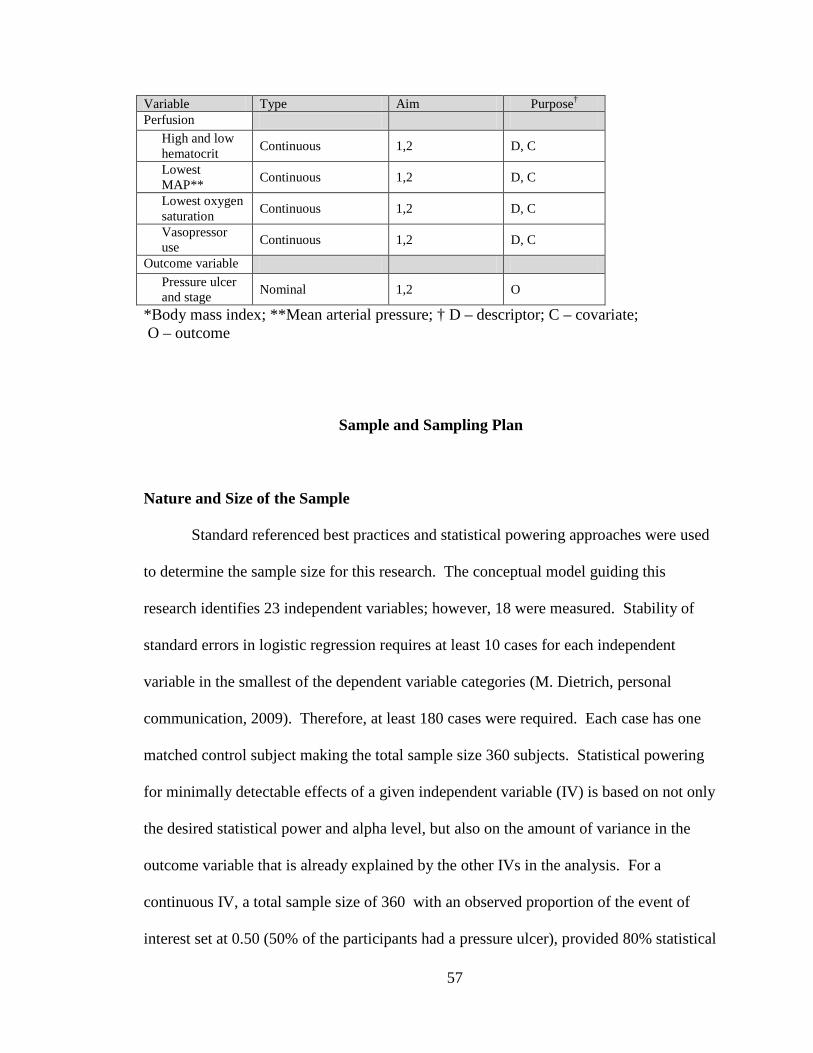
Variable Type Aim Purpose† Perfusion
High and low hematocrit Continuous 1,2 D, C
Lowest MAP** Continuous 1,2 D, C
Lowest oxygen saturation Continuous 1,2 D, C
Vasopressor use Continuous 1,2 D, C
Outcome variable Pressure ulcer and stage Nominal 1,2 O
*Body mass index; **Mean arterial pressure; † D – descriptor; C – covariate; O – outcome
Sample and Sampling Plan
Nature and Size of the Sample
Standard referenced best practices and statistical powering approaches were used
to determine the sample size for this research. The conceptual model guiding this
research identifies 23 independent variables; however, 18 were measured. Stability of
standard errors in logistic regression requires at least 10 cases for each independent
variable in the smallest of the dependent variable categories (M. Dietrich, personal
communication, 2009). Therefore, at least 180 cases were required. Each case has one
matched control subject making the total sample size 360 subjects. Statistical powering
for minimally detectable effects of a given independent variable (IV) is based on not only
the desired statistical power and alpha level, but also on the amount of variance in the
outcome variable that is already explained by the other IVs in the analysis. For a
continuous IV, a total sample size of 360 with an observed proportion of the event of
interest set at 0.50 (50% of the participants had a pressure ulcer), provided 80% statistical
57

power to detect an odds ratio of 1.34 if there was no variance explained by the other IVs.
If as much as 30% of the variance in the likelihood of a pressure ulcer was explained by
the other IVs, the sample provided 80% statistical power to detect an odds ratio of 1.42
(alpha = .05). For a dichotomous IV, those respective odds ratios were between 1.82 (0%
variance explained by other IVs) and 2.06 (30% variance explained by other IVs).
Inclusion, Exclusion, and Matching Criteria
Inclusion criteria for both cases and controls were:
1. 18 to 79 years of age; and
2. Admission or transfer within to any of the five ICUs identified above.
Exclusion criteria for cases were:
1. Presence of any pressure ulcer on admission to the ICU;
2. Any pressure ulcer that developed within 48 hours of admission to the ICU;
3. Cardiopulmonary resuscitation requiring chest compressions and/or
resuscitation drugs within 48 hours of pressure ulcer development;
4. Discharge from ICU prior to visual verification of pressure ulcer; and
5. ICU length of stay less than 48 hours.
Exclusion criteria for controls were:
1. Any stage pressure ulcer on admission to the ICU;
2. Any pressure ulcer that developed during the ICU stay;
3. Cardiopulmonary resuscitation during the ICU stay;
4. ICU length of stay less than 48 hours.
Matching criteria were:
58
1. Must be from the same ICU;
2. Must have been in the same ICU within 90 days of each other (i.e., up to 90 days
prior to the case index date or up to 90 days after the case index date);
3. ICU length of stay for controls was at least as long as the length of stay as the
case subjects’ length of stay upon developing a pressure ulcer; and
4. Must be matched on ventilator use during the 48 hour period prior to case index
date.
See Table 3.3 for a summary of the inclusion, exclusion, and matching criteria.
59
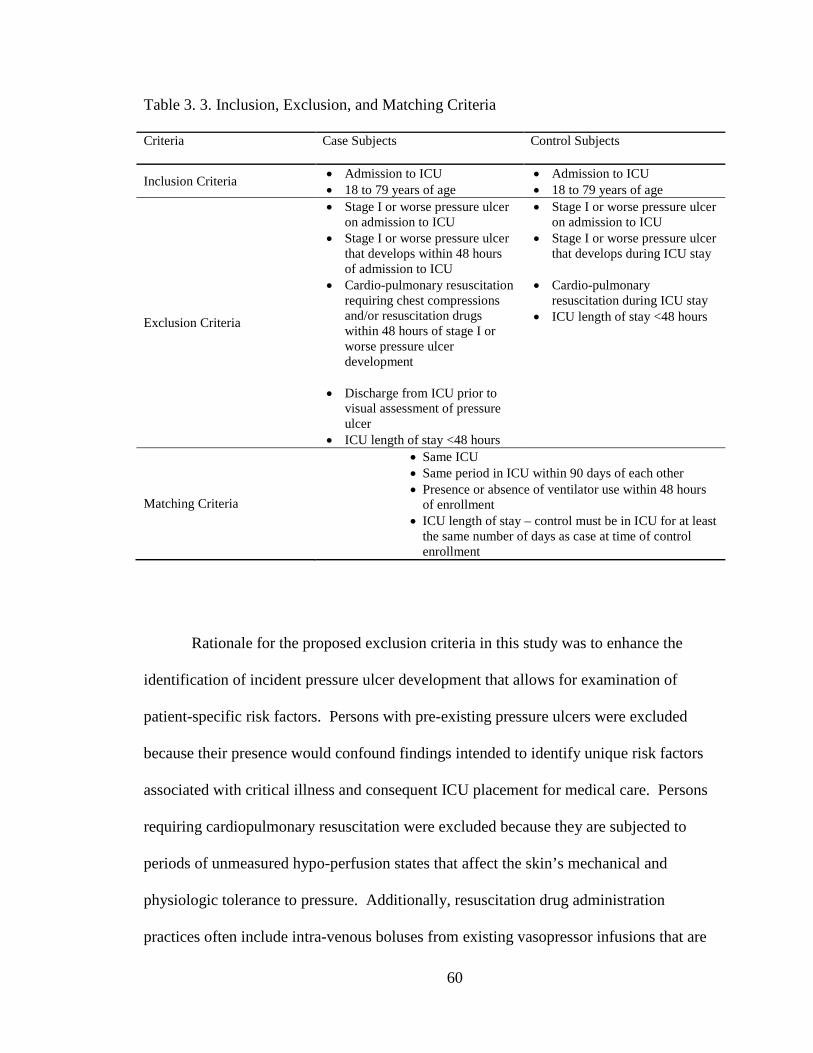
Table 3. 3. Inclusion, Exclusion, and Matching Criteria
Rationale for the proposed exclusion criteria in this study was to enhance the
identification of incident pressure ulcer development that allows for examination of
patient-specific risk factors. Persons with pre-existing pressure ulcers were excluded
because their presence would confound findings intended to identify unique risk factors
associated with critical illness and consequent ICU placement for medical care. Persons
requiring cardiopulmonary resuscitation were excluded because they are subjected to
periods of unmeasured hypo-perfusion states that affect the skin’s mechanical and
physiologic tolerance to pressure. Additionally, resuscitation drug administration
practices often include intra-venous boluses from existing vasopressor infusions that are
Criteria Case Subjects Control Subjects
Inclusion Criteria • Admission to ICU • Admission to ICU • 18 to 79 years of age • 18 to 79 years of age
Exclusion Criteria
• Stage I or worse pressure ulcer on admission to ICU
• Stage I or worse pressure ulcer on admission to ICU
• Stage I or worse pressure ulcer that develops within 48 hours of admission to ICU
• Stage I or worse pressure ulcer that develops during ICU stay
• Cardio-pulmonary resuscitation requiring chest compressions and/or resuscitation drugs within 48 hours of stage I or worse pressure ulcer development
• Cardio-pulmonary resuscitation during ICU stay
• ICU length of stay <48 hours
• Discharge from ICU prior to visual assessment of pressure ulcer
• ICU length of stay <48 hours
Matching Criteria
• Same ICU • Same period in ICU within 90 days of each other • Presence or absence of ventilator use within 48 hours
of enrollment • ICU length of stay – control must be in ICU for at least
the same number of days as case at time of control enrollment
60
recorded on the resuscitation forms used by VUMC, but not necessarily captured on the
nursing flow sheet, which was the documentation record used in collecting vasopressor
dosage data. Case subjects who were discharged from the ICU prior to visual verification
of the pressure ulcer were excluded because of the difficulty in locating and visually
confirming pressure ulcer presence in a timely manner following ICU discharge.
Subjects whose ICU length of stay is less than 48 hours were excluded because other risk
factor influences prior to ICU placement may disproportionately contribute to pressure
ulcer incidence in case subjects with less than a 48-hour ICU stay.
The matching criteria increase the comparability of cases and controls (Newman
et al., 2007). By matching on the same ICU within 90 days prior or post pressure ulcer
development, unique nursing practice and staffing patterns associated with the particular
ICU during a similar period were matched, thereby minimizing potential confounders.
Additionally, matching on ventilator use enhanced the validity because ventilator use is
considered a proxy for severity of illness in critical care settings (Horner, Sloane, &
Kahn, 1998). Other, established severity of illness scores, such as the APACHE II, are
not consistently gathered in all VUH ICUs and therefore not available for analysis.
Because of geographic limitations and fluctuating non-ICU bed availability at VUH, not
all patients housed in a VUH ICU have the same severity of illness.
Subject Recruitment Methodology
Institutional Review Board (IRB) approval at Vanderbilt University Medical
Center (VUMC) was sought and the study was approved. A convenience sample of
potential subjects was identified using ICU census data and Star Panel. The PI then
61

verified inclusion and exclusion criteria. To help with subject enrollment, Carolyn Watts,
MSN, RN, CWON and Christy Thomas, RN were recruited by the PI and trained in
recruitment methodology. Patients meeting the inclusion criteria were then approached
by the PI, Carolyn Watts or Christy Thomas for study enrollment using the procedures
outlined below. Methods to ensure inter-rater reliability among the PI, Carolyn Watts
and Christy Thomas are discussed later in this section.
Human Subjects Protection
Informed consent. The patient’s cognitive and sedation status dictates their
ability to understand and give informed consent. One study found that more than 75% of
ventilated patients in an ICU were unable to give informed consent for participation in
research because of confusion and delirium that persisted after ventilator use was
discontinued (Fan et al., 2008). At VUH, sedation status is indicated by the Richmond
Agitation Sedation Scale (RASS). The tool is well validated by several studies and is a
commonly accepted way of objectively measuring the sedation status of a patient (Sessler
et al., 2002; Ely et al., 2003). The tool ranges from -5 (unarousable) to +4 (combative).
A RASS of zero is calm, awake, and alert. A RASS of +1 is described as restless
(anxious or apprehensive but movements not aggressive or vigorous). A RASS of -1 is
described as drowsy (not fully alert, but has sustained periods of awakening with eye
contact to verbal stimuli). Fan et al. (2008) used the RASS range of -1 to +1 in their
study about obtaining informed consent and it is the evidence on which this study criteria
for obtaining informed consent is based. The RASS score is routinely assessed and
documented by VUH ICU nurses every four hours.
62

Delirium in the ICU patient is measured with the Confusion Assessment
Methodology for ICU patients (CAM-ICU). Delirium is indicated as a positive or
negative finding and depends on the RASS score as part of its algorithm. As with RASS,
the CAM-ICU is well validated in clinical practice (Ely, Inouye, et al., 2001; Ely,
Margolin et al., 2001). Fan et al. (2008) used a CAM-ICU negative for their criteria in
obtaining informed consent and it is the evidence on which this study criteria is based.
Similar to the RASS score, all ICU nurses at VUH assess the patients for delirium and
document the CAM-ICU each shift.
Per the approved IRB protocol, two face-to-face attempts and one phone attempt
with a surrogate who could give consent were conducted for potential case patients that
could not give consent themselves. Consent was waived after the three attempts to obtain
it were unsuccessful. Potential case subjects who could not give consent and who did not
have a contact person or next of kin indicated in the medical record were not enrolled.
Dignity and Personal Privacy. The following procedures were used to ensure
patient dignity and privacy:
1. The PI, Carolyn Watts or Christy Thomas contacted the nurse caring for the
patient and arranged a mutually agreeable time to visualize the patient’s skin,
such as during a bath or during the pressure ulcer dressing change, if applicable.
Not all pressure ulcers require a dressing.
2. To maintain respect, the nurse then introduced the PI, C. Watts, or Christy
Thomas to the patient and/or family, analogous to introducing a medical or
nursing student.
63

3. The patient’s privacy was ensured by closing room curtains or shades and room
door.
4. The nurse then repositioned the patient, if necessary, so that the pressure ulcer
could be visualized.
5. The nurse then removed the dressing, if applicable, and the PI, Carolyn Watts, or
Christy Thomas visualized the ulcer.
6. The PI, Carolyn Watts, or Christy Thomas then offered assistance to the nurse to
re-dress the ulcer, if applicable.
Protection of personal health information. The data collected involved patient
demographic and health information, such as age, gender, body mass index, and presence
of various pre-existing diseases, such as diabetes. Physiologic data, such as blood
pressure and oxygen saturation were also collected, as were specific medications that
were of interest, such as vasopressors. Patient confidentiality was assured by entering
medical record numbers and associated demographic information directly from the EMR
onto the paper Data Collection Form, which remained under double lock in the PI’s
office. Data were then entered into Vanderbilt University’s Research, Electronic Data
Capture (REDCap) database using the completed Data Collection Forms, which remained
under double lock in the PI’s office. REDCap is a secure, web-based application that is
flexible enough to be used for a variety of types of research. REDCap provides an
intuitive user interface that streamlines project development and improves data entry
through real-time validation rules with automated data type and range checks. REDCap
also provides easy data manipulation with audit trails for reporting, monitoring and
querying patient records, and an automated export mechanism to common statistical
64
packages (Harris et al., 2009). REDCap servers are housed in a local data center at
Vanderbilt, and all web-based information transmission is encrypted. REDCap was
developed specifically around HIPAA-Security guidelines and is recommended to
Vanderbilt researchers by both the Privacy Office and Institutional Review Board. Upon
completion, all paper forms were destroyed using the shredder in the SICU (where the
PI’s office is located).
All data were kept in the REDCap database for the duration of the study. The
REDCap data base was de-identified at the conclusion and will be indefinitely maintained
for reference, should a secondary data analysis be required. Paper data collection forms
were maintained under double lock until the PI was satisfied that all data were entered
correctly, then were shredded. The Screening Tracking Tool, Data Management Tool,
and Consent Tracking Tool were maintained on Vanderbilt’s SICU secure ‘M’ drive and
were only accessible by the PI or Carolyn Watts (Appendix A). The completed tools
were deleted from the Vanderbilt’s secured ‘M’ drive at the completion of the study.
Data Collection Methods
Procedures
Case enrollment. At least twice a week, the following steps were taken to
identify case subjects.
1. The PI reviewed the Star Panel census for each ICU. The census indicates which
patients are designated as having a pressure ulcer by the nursing staff.
Information about the location and stage of the pressure ulcer was also available
65

in Star Panel. Recording pressure ulcer characteristics is a standard of care and is
routine care for every patient at VUH.
2. The Inclusion/Exclusion Screening Tool (Appendix A) was used by the PI to
determine case eligibility for study enrollment.
3. Once inclusion criteria were met, the PI, Carolyn Watts, or Christy Thomas
approached the nurse assigned to the patient. That nurse determined the patient’s
ability to consent based on the CAM and RASS assessments that are standard
nursing assessment practices in all ICU’s at VUH. At a time designated by the
nurse caring for the patient, the PI, Carolyn Watts, or Christy Thomas entered the
room with the nurse. To maintain respect, the nurse introduced the PI, Carolyn
Watts, or Christy Thomas, analogous to introducing a medical or nursing student.
4. Patients who were awake and able to understand (i.e., CAM negative with current
RASS score of 0, +1 or -1 as documented by the nurse) were asked to give written
consent for pressure ulcer visualization and access to PHI from the medical record
using the Informed Consent Form (Appendix A). Carolyn Watts, the PI, or
Christy Thomas then visualized the pressure ulcer to ensure that the staff nurse
documents the location and stage correctly.
5. The PI or co-investigator did not touch the patient unless the primary nurse giving
care to the patient requested assistance.
6. In cases where the patient was unable to give consent (i.e. CAM positive with
current RASS score of anything other than 0, +1 or -1), family was sought to
obtain surrogate consent on two face to face attempts and one phone contact
attempt using the Surrogate Informed Consent Rider (Appendix A). After three
66
failed attempts to obtain informed consent, consent was waived and the patient
enrolled into the study. A Patient Information Sheet (Appendix A) was left in the
patient’s room for those patients identified to be possible case or control subjects.
This information sheet informed family who may not be present that the patient
was considered for entry into a research study. Carolyn Watts, the PI, or Christy
Thomas then visualized the pressure ulcer to ensure that the staff nurse
documented the location and stage correctly. The PI or co-investigators did not
touch the patient unless the primary nurse giving care to the patient requested
assistance.
7. Case patients unable to give consent were periodically reevaluated by the PI or
co-investigators in conjunction with the nurse to determine their ability to give
written consent. If a patient became capable of giving consent, the consent
process was completed.
8. A copy of the informed consent document was given to the patient or surrogate,
one copy was placed in the patient’s paper medical record, and the original was
retained by the PI in accordance with the approved IRB protocol for protecting
personal health information.
9. All attempts to obtain informed consent were tracked in the Consent Tracking
Tool. (Appendix A)
Control enrollment. After a case subject was identified, the PI used the
following method to identify control subjects. Efforts were made to match the ICU
admission dates as closely as possible.
67
1. Each time a case subject was identified, the EMR was used to identify potential
control subjects using the matching criteria outlined above.
2. If no control match was located for the case subject on the day of case subject
enrollment, a period of 10 days elapsed before a second attempt. On day 11, a
second search was completed for a control subject within +/- 10 days of the case
index date. The process proceeded incrementally until the search for control
subjects reached 90 days +/- the case index date.
3. If no control was found, data on the case subject was kept and labeled as an
unmatched case subject.
4. All control subjects who were currently in the ICU underwent the same consent
process as that for cases.
Data collection. All data were collected by the PI using either the Case Data
Collection Form or the Control Data Collection Form (Appendix B) approved by the
IRB. Data were collected using the EMR. Immediately after the data were collected on
the paper form, the completed forms were stored in a locked file cabinet in the PI’s
locked office. For case subjects, the PI entered the medical record number, ICU, length
of ICU stay, and ventilator use (if patient was ventilated) into the Data Management
Form spreadsheet (Appendix A). The spreadsheet automatically calculated the required
matching criteria for ICU admission dates to assist in identifying a matched control
subject. Once a control subject was identified, the medical record number and ICU were
entered into the Data Management Form, indicating that a match has occurred. The
spreadsheet was kept on Vanderbilt’s secure data drive, the SICU’s ‘M’ drive, accessible
from workstations in Carolyn Watt’s and the PI’s office, or remotely from the PI’s home
68

computer on Vanderbilt’s secured drive. The data drive is password protected and only
the PI and Carolyn Watts had access.
Data for case and control subjects were transcribed from the paper data collection
sheets into REDCap by the PI. The paper data collection sheets remained under double
lock in the PI’s office at VUH until the completion of the study, at which time they were
shredded. Christy Thomas did not do data entry and therefore did not have access to the
REDCap database or data collection spreadsheets.
Data source. All data were collected from the EMR using Star Panel or the
nursing documentation system, Horizon Expert Documentation (HED). Star Panel serves
as the primary clinical database for VUH. Star Panel acquires information from
numerous other databases used in VUH to consolidate patient-specific information into
one place. All variables identified in this study were acquired from Star Panel through
interfaces with provider documentation, laboratory results, medication administration,
and the Nursing Flow Sheet.
Reliability and Validity of Instruments
The instruments used in this study (Appendix B) were designed to capture patient
demographic data and risk factors identified in the conceptual model. Therefore, the
validity, reliability, and credibility of these instruments are assumed because they are
specific to this study and were not used as measurement instruments. For this study,
reliability and validity issues were identified in the methodology, discussed below.
69

Reliability and Validity of the Study Methods
To assess the reliability and validity of staff nurse documentation of pressure
ulcers, a feasibility study was conducted prior to the start of this study. The study,
designed to determine the completeness and accuracy of documentation regarding
pressure ulcer presence and stage, demonstrated 100% agreement between the expert
rater and staff nurses on the presence/absence of a pressure ulcer. The study also
demonstrated 100% agreement between staff and expert rater on pressure ulcers with
regard to location, and 83.3% agreement between staff and expert rater with regard to
stage of pressure ulcer. Appendix C presents a detailed description of the feasibility
study and its findings.
To ensure that proper pressure ulcer identification and staging was documented
for each case patient, the PI, Carolyn Watts or Christy Thomas visually inspected the
pressure ulcer during the process of enrollment. In cases of disagreement with the staff
nurse staging, the PI, Carolyn Watts, or Christy Thomas assigned the pressure ulcer stage
used.
To ensure inter-rater reliability among Carolyn Watts, Christy Thomas, and the
PI during the enrollment process, the PI visually validated the presence and stage of
every tenth case patient that Carolyn Watts and Christy Thomas each enrolled. An
educational session and more frequent validations were planned in the case of any
discrepancies that were noted; however, the inter-rater reliability demonstrated 100%
agreement obviating the need for education or more frequent inter-rater reliability
validations.
70
Data Analysis Strategy
Data Cleaning Procedures
After all data were collected and prior to analysis, variable data for 18 random
case subjects and 18 random control subjects were examined for errors and omissions.
No errors or omissions were found. Frequencies were checked for all identifier variables
to ensure that there were no repeated subjects and that no control patient was coded as
having a pressure ulcer. Matching criteria for each case-control pair were also analyzed
to ensure that ICU, ventilator use, and ICU length of stay were identical. No errors in
matching were identified. Unmatched cases (n = 12) were described and removed from
the database for further analysis (see Chapter 4).
Statistical Methods
All data analyses were conducted using SPSS software (SPSS for Windows,
Graduate Student Version, Rel. 16.0.1. 2007. Chicago: SPSS Inc.). Initially an
investigation of the nature of the missing data values was undertaken to determine if there
were any systematic patterns. None were detected in the primary study variables and
thus missing was assumed to be random. Subsequently, multiple imputations were used
to estimate the missing values. Results from both completed and imputed data sets are
reported.
Aim 1. To compare the frequency and magnitude of pressure ulcer risk factors
between critically ill patients that do and do not develop a pressure ulcer during their ICU
stay and evaluate their influence on the associations between the Braden subscales and
pressure ulcer outcome.
71
Descriptive statistics were generated to summarize the variables in each of the
patient groups (with and without pressure ulcers). Frequency distributions summarized
nominal variables. Due to the skewed nature of the continuous variables, median and 25th
to 75th interquartile range (IQR) were used to summarize those distributions.
Logistic regression analysis was used to generate both unadjusted and adjusted
associations of each risk factor (IV) with the presence of a pressure ulcer (DV). The
conceptual model guiding this research identified 18 independent variables. Simple
univariate logistic regressions were used to generate estimates of the unadjusted
associations. Odds ratios with 95% confidence intervals (CI) were obtained for each
variable (IV).
Multiple hierarchical logistic regression was used to generate adjusted odds ratios.
Age was entered in the first step of this analysis. Braden subscale values were entered in
the second step followed lastly by the other proposed risk variables. Odds ratios with
95% CI were generated. Both the univariate and adjusted analyses were conducted
separately for variables collected at 24 hours and at 48 hours of the case index date. An
alpha of 0.50 was used for determining statistical significance.
Sample size and power. Stability of standard errors in logistic regression
requires at least 10 cases for each IV in the smallest of the dependent variable categories
(Dietrich, 2009). Because a case-control design was proposed, the dependent variable
categories would be of equal size. Therefore, for 18 IVs, at least 180 cases (and
correspondingly 180 controls) were required to meet the minimal sample size
requirement. The minimally detectable effects of a given risk factor (IV) in multiple
regression analyses is based on not only the desired statistical power and alpha level, but
72
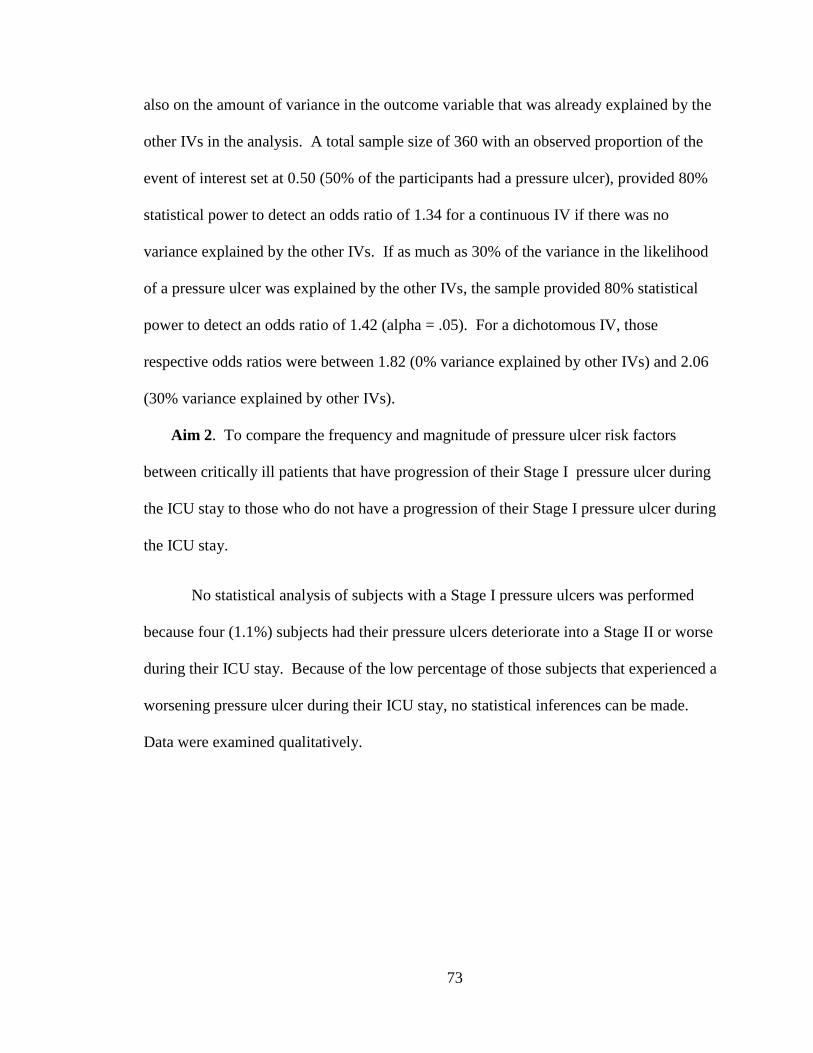
also on the amount of variance in the outcome variable that was already explained by the
other IVs in the analysis. A total sample size of 360 with an observed proportion of the
event of interest set at 0.50 (50% of the participants had a pressure ulcer), provided 80%
statistical power to detect an odds ratio of 1.34 for a continuous IV if there was no
variance explained by the other IVs. If as much as 30% of the variance in the likelihood
of a pressure ulcer was explained by the other IVs, the sample provided 80% statistical
power to detect an odds ratio of 1.42 (alpha = .05). For a dichotomous IV, those
respective odds ratios were between 1.82 (0% variance explained by other IVs) and 2.06
(30% variance explained by other IVs).
Aim 2. To compare the frequency and magnitude of pressure ulcer risk factors
between critically ill patients that have progression of their Stage I pressure ulcer during
the ICU stay to those who do not have a progression of their Stage I pressure ulcer during
the ICU stay.
No statistical analysis of subjects with a Stage I pressure ulcers was performed
because four (1.1%) subjects had their pressure ulcers deteriorate into a Stage II or worse
during their ICU stay. Because of the low percentage of those subjects that experienced a
worsening pressure ulcer during their ICU stay, no statistical inferences can be made.
Data were examined qualitatively.
73
CHAPTER IV
RESULTS
This chapter provides the results of a prospective case-control study examining
risk factors for pressure ulcers in critically ill patients. A review of the primary aim, a
description of unmatched cases, missing data, and variables with no data are presented.
Characteristics of case and control subjects, pressure ulcer findings, and unadjusted and
adjusted OR findings are also presented. Finally, the secondary aim is reviewed with its
findings.
Unmatched Cases
There were 12 unmatched case subjects. Statistically significant differences
between unmatched and matched (n = 180) case subjects were noted in five variables.
Unmatched case subjects had statistically significantly less frequency of norepinephrine
use prior to study enrollment (X2 = 6.49, p = 0.011) than did matched case subjects.
Unmatched case subjects had statistically significantly lower scores on the Braden
Mobility subscale scores 24 hours (z = -2.20, p = 0.028) prior to study enrollment and the
Braden Moisture subscale scores 48 hours (z = -2.04, p = 0.041) prior to study enrollment
than did matched case subjects. Lowest oxygen saturation 24 hours prior to enrollment
was statistically significantly lower in matched case subjects (z =-2.41, p = 0.016) than in
unmatched case subjects. ICU length of stay was statistically significantly higher in
74

unmatched cases than matched cases (z =-5.58, p <0.001). ICU length of stay prior to
pressure ulcer development in the unmatched case subjects was the primary reason these
subjects were not matched. No further considerations of the unmatched cases were
required, so they were removed from the data set for further analysis. See Appendix D,
Tables 1, 2 and 3 for complete description of the comparisons between unmatched and
matched case subjects.
Missing Data
Missing data were identified in the pre-admission variables describing presence or
absence of diabetes, nicotine use within one year of hospital admission, corticosteroid use
prior to hospital admission, and pre-existing skin disease. Hematocrit values measured at
24 and 48 hours prior to study enrollment and measures of protein reserve also contained
missing data. Table 4.1 details the variables with missing data and their frequencies.
Appendix D, Table 4 provides an expanded detail of the variables with missing data.
Pre-Admission Variables
Frequencies for missing data among the pre-admission variables ranged from
6.1% for nicotine use to 18.1% for history of diabetes (see Table 4.1). Variables with
more than 10% missing values were excluded from analysis because of the possibility of
biasing the conclusions (Duffy & Jacobsen, 2005; Cummings, Browning, & Hulley,
2007). Consequently diabetes, pre-existing skin disease, and pre-admission
corticosteroid use were eliminated as variables and not included in further analyses.
Aspects of pressure ulcer risk contributed by the eliminated variables shared some
75

conceptual overlap with other variables, thereby potentially minimizing the risk of losing
any explanatory power these variables may have contributed to the study. Presence and
type of diabetes had originally been included because of its association with vascular
disease and detrimental effect on metabolic supply to the tissues. Other study variables,
vasopressor use, hematocrit values, nicotine use, and the Braden nutrition subscale scores
are related to this conceptual component of pressure ulcer risk. Pre-existing skin disease
is conceptually identified as a threat to skin integrity. The Braden moisture subscale, also
related to the skin integrity concept, provided the one measure to assess the concept of
skin integrity threats. Because steroid use was also measured during the hospital
admission, the effects of steroid use, a conceptual component of metabolic demand, was
retained for further analyses. See Table 2.4 for a summary of pressure ulcer risk factor
concepts and measures.
Nicotine Use Variable
Nicotine use was missing in 11 (6.1%) each of case and control subjects.
Consequently, nicotine use was retained for further analyses and missing nicotine values
were imputed using a regression equation to predict missing values (Duffy & Jacobsen,
2005).
Hematocrit Variables
High and low hematocrit levels at both 48 and 24 hours were reported in
351(97.5%) subjects. Values for the nine remaining subjects were imputed for further
data analysis using a regression equation. After the missing variables were imputed,
collinearity statistics revealed a collinearity tolerance of 0.165 for high hematocrit and
0.162 for low hematocrit 24 hours prior to study enrollment and similar collinearity
76

statistics were identified for high (0.177) and low (0.181) hematocrits 48 hours prior to
study enrollment. Further analyses were conducted using only the low hematocrit values
because of the collinearity tolerance values.
Protein Reserve Variables
Laboratory values for serum albumin, pre-albumin, and total lymphocyte count
were not reported in a number of case or control subjects. None of these protein
variables were reported in 22 (12.2%) of case subjects and 15 (8.3%) of control subjects.
Serum albumin levels were not reported in 112 (62.2%) of case subjects or 113 (62.7%)
of control subjects. Pre-albumin levels were not reported in 100 (55.5%) of case or
control subjects, and total lymphocyte counts were not reported in 51 (28.3%) of case
subjects and 41 (22.8%) of control subjects. To retain any explanatory contribution that
protein reserve may have on pressure ulcer incidence, a new variable, ‘Protein Store’,
was calculated to capture the presence of any protein store variable in study subjects (see
Chapter II for complete definition). To accommodate for the frequency of un-reported
protein store measures, values were categorized as high, normal or low, using references
from the VUH clinical laboratory. In subjects with values reported for more than one of
the protein reserve variables, the value for serum albumin (high, normal or low) was the
default ranking. If serum albumin was not reported the value for either pre-albumin or
total lymphocyte count was used. When values for two variables differed, the lower of
the two was used. Serum albumin was used as the default ranking because of its use as
the standard of measure in multiple studies examining nutrition status (Jeejeebhoy, 2004).
After the variable was categorized into high, normal, and low, seven subjects (1.9%)
were ranked as ‘high’ and data were missing for 27 subjects. Because the missing data
77
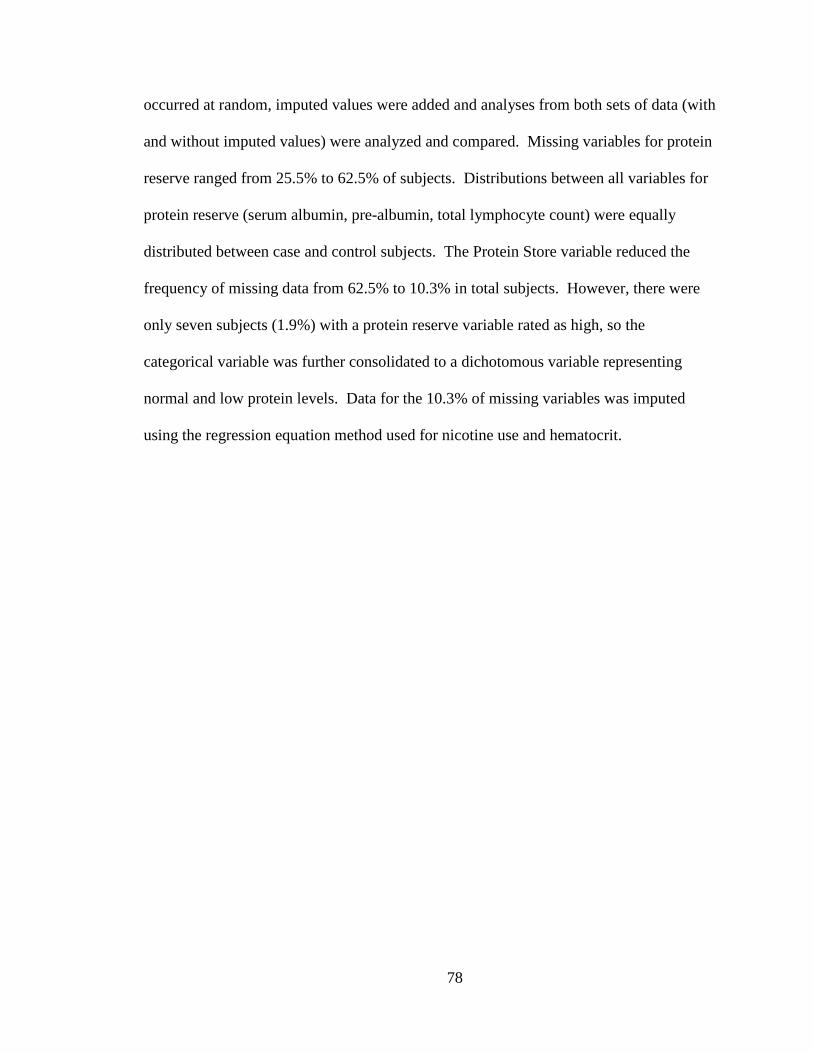
occurred at random, imputed values were added and analyses from both sets of data (with
and without imputed values) were analyzed and compared. Missing variables for protein
reserve ranged from 25.5% to 62.5% of subjects. Distributions between all variables for
protein reserve (serum albumin, pre-albumin, total lymphocyte count) were equally
distributed between case and control subjects. The Protein Store variable reduced the
frequency of missing data from 62.5% to 10.3% in total subjects. However, there were
only seven subjects (1.9%) with a protein reserve variable rated as high, so the
categorical variable was further consolidated to a dichotomous variable representing
normal and low protein levels. Data for the 10.3% of missing variables was imputed
using the regression equation method used for nicotine use and hematocrit.
78
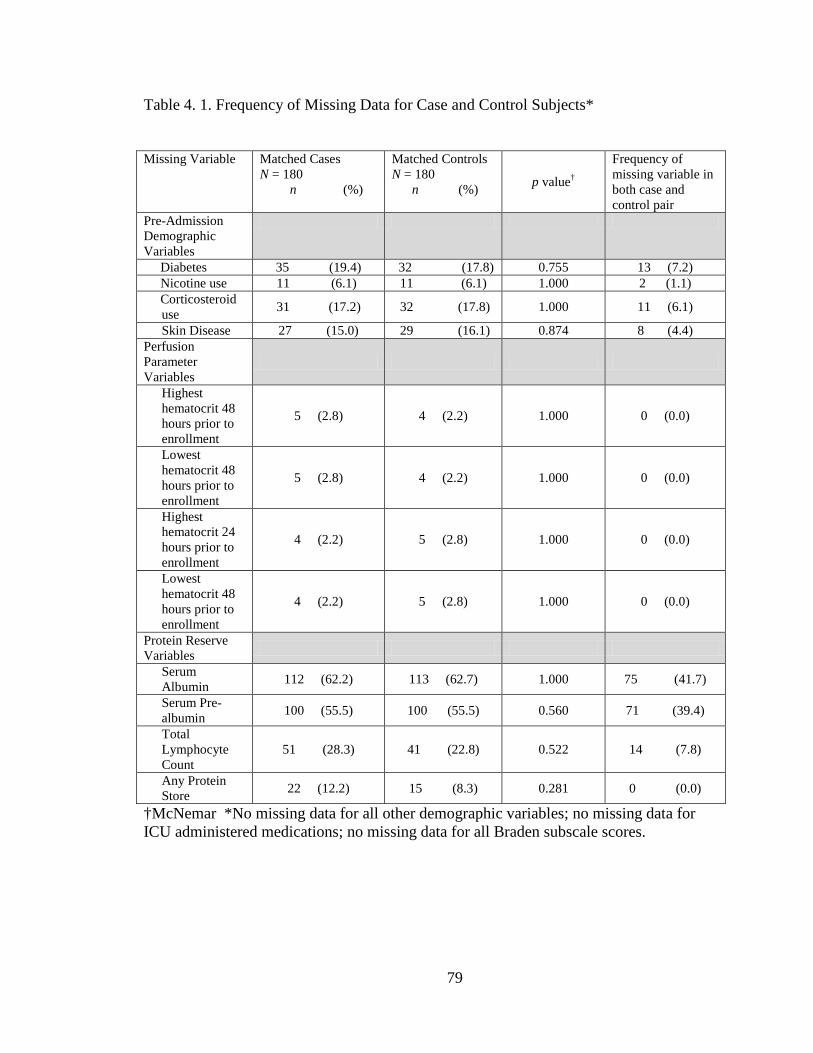
Table 4. 1. Frequency of Missing Data for Case and Control Subjects*
Missing Variable Matched Cases N = 180 n (%)
Matched Controls N = 180 n (%) p value†
Frequency of missing variable in both case and control pair
Pre-Admission Demographic Variables
Diabetes 35 (19.4) 32 (17.8) 0.755 13 (7.2) Nicotine use 11 (6.1) 11 (6.1) 1.000 2 (1.1) Corticosteroid
use 31 (17.2) 32 (17.8) 1.000 11 (6.1)
Skin Disease 27 (15.0) 29 (16.1) 0.874 8 (4.4) Perfusion Parameter Variables
Highest hematocrit 48 hours prior to enrollment
5 (2.8) 4 (2.2) 1.000 0 (0.0)
Lowest hematocrit 48 hours prior to enrollment
5 (2.8) 4 (2.2) 1.000 0 (0.0)
Highest hematocrit 24 hours prior to enrollment
4 (2.2) 5 (2.8) 1.000 0 (0.0)
Lowest hematocrit 48 hours prior to enrollment
4 (2.2) 5 (2.8) 1.000 0 (0.0)
Protein Reserve Variables
Serum Albumin 112 (62.2) 113 (62.7) 1.000 75 (41.7)
Serum Pre-albumin 100 (55.5) 100 (55.5) 0.560 71 (39.4)
Total Lymphocyte Count
51 (28.3) 41 (22.8) 0.522 14 (7.8)
Any Protein Store 22 (12.2) 15 (8.3) 0.281 0 (0.0)
†McNemar *No missing data for all other demographic variables; no missing data for ICU administered medications; no missing data for all Braden subscale scores.
79

Recoded Variables
After investigating the initial variable distributions, variables with low response
rates were either dichotomized or included with similar variables to create a global
categorical variable. Table 4.2 provides summaries of the lack of any vasopressor use in
case and control subjects. Vasopressor use frequency ranged from 55 (30.6%)
occurrences to one occurrence (0.6%) in case subjects and 50 (27.8%) occurrences to
zero occurrences in control patients. Because of the high frequency of zero doses across
types of vasopressor, a global vasopressor variable was included that combined the
specific types into a single global ordered categorical variable (zero, one, two, and more
than two vasopressors received).
Table 4.2. Frequency of Zero Dose Vasopressor Occurrences in Case and Control Subjects
Vasopressor
Matched Cases
N = 180 n (%)
Matched Controls N = 180
n (%)
p value†
Dobutamine 177 (98.3) 174 (96.7) 0.508 Epinephrine 174 (96.7) 174 (96.7) 1.000 Milrinone 166 (92.2) 170 (94.4) 0.481 Midodrine 179 (99.4) 180 (100.0) 1.000 Norepinephrine 125 (69.4) 139 (77.2) 0.115 Vasopressin 149 (82.8) 163 (90.6) 0.050 † McNemar
Similarly, Table 4.3 presents the summaries of the number of subjects in the two
groups that did not receive corticosteroids during the current hospitalization. Subjects
80
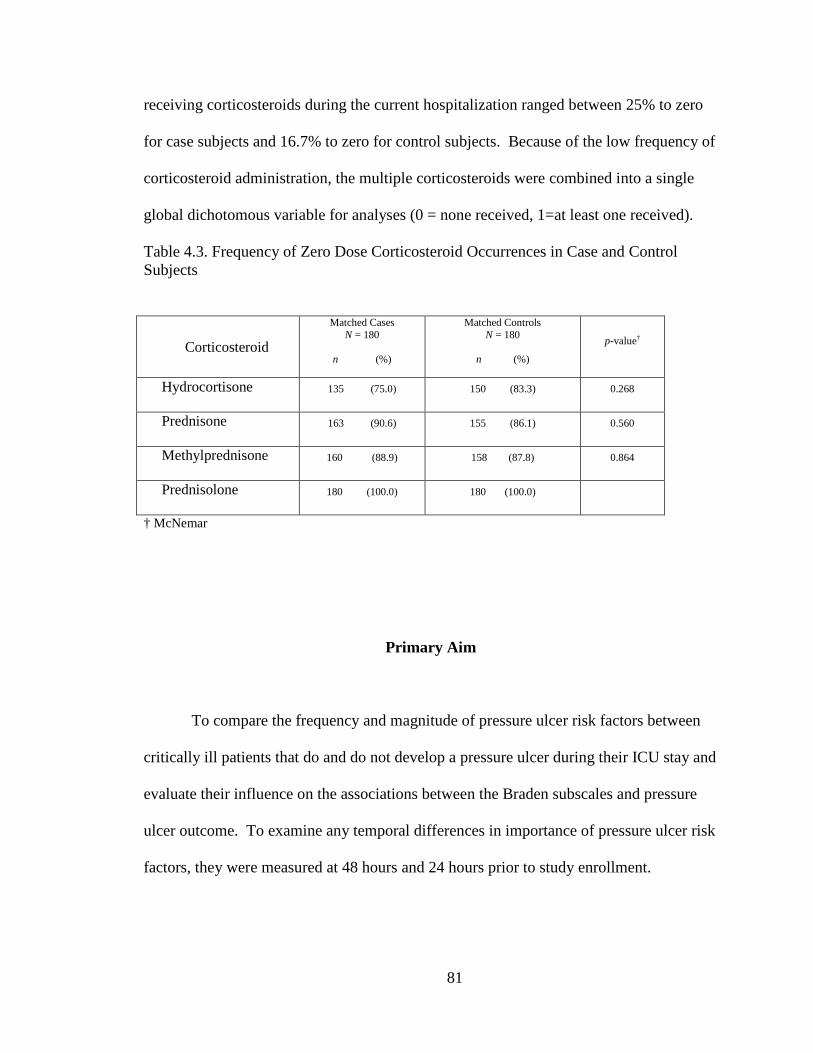
receiving corticosteroids during the current hospitalization ranged between 25% to zero
for case subjects and 16.7% to zero for control subjects. Because of the low frequency of
corticosteroid administration, the multiple corticosteroids were combined into a single
global dichotomous variable for analyses (0 = none received, 1=at least one received).
Table 4.3. Frequency of Zero Dose Corticosteroid Occurrences in Case and Control Subjects
Corticosteroid
Matched Cases N = 180
n (%)
Matched Controls N = 180
n (%)
p-value†
Hydrocortisone 135 (75.0) 150 (83.3) 0.268
Prednisone 163 (90.6) 155 (86.1) 0.560
Methylprednisone 160 (88.9) 158 (87.8) 0.864
Prednisolone 180 (100.0) 180 (100.0)
† McNemar
Primary Aim
To compare the frequency and magnitude of pressure ulcer risk factors between
critically ill patients that do and do not develop a pressure ulcer during their ICU stay and
evaluate their influence on the associations between the Braden subscales and pressure
ulcer outcome. To examine any temporal differences in importance of pressure ulcer risk
factors, they were measured at 48 hours and 24 hours prior to study enrollment.
81

Subject Profile
Case subject enrollment followed a defined process (Figure 4.1). During the data
collection period from October 2010 through October 2012, 25,180 patients were
admitted to the study ICUs. A convenience sample of 1,095 (4.35%) patients was
screened as potential case subjects. Eight hundred and eighty-five (80.8%) of the
potential case subjects did not meet enrollment criteria, leaving 210 potential case
subjects. Eighteen of those were not enrolled due to lack of consent. Of the 192 case
subjects that were enrolled, 12 (6.3%) did not have matched controls, so were excluded
from further study leaving 180 case subjects. Comparative demographic data between
subjects and patients admitted to study ICUs during the data collection period are not
available given patient confidentiality issues. Matching control subjects were identified
through the EMR after each case subject was identified.
82
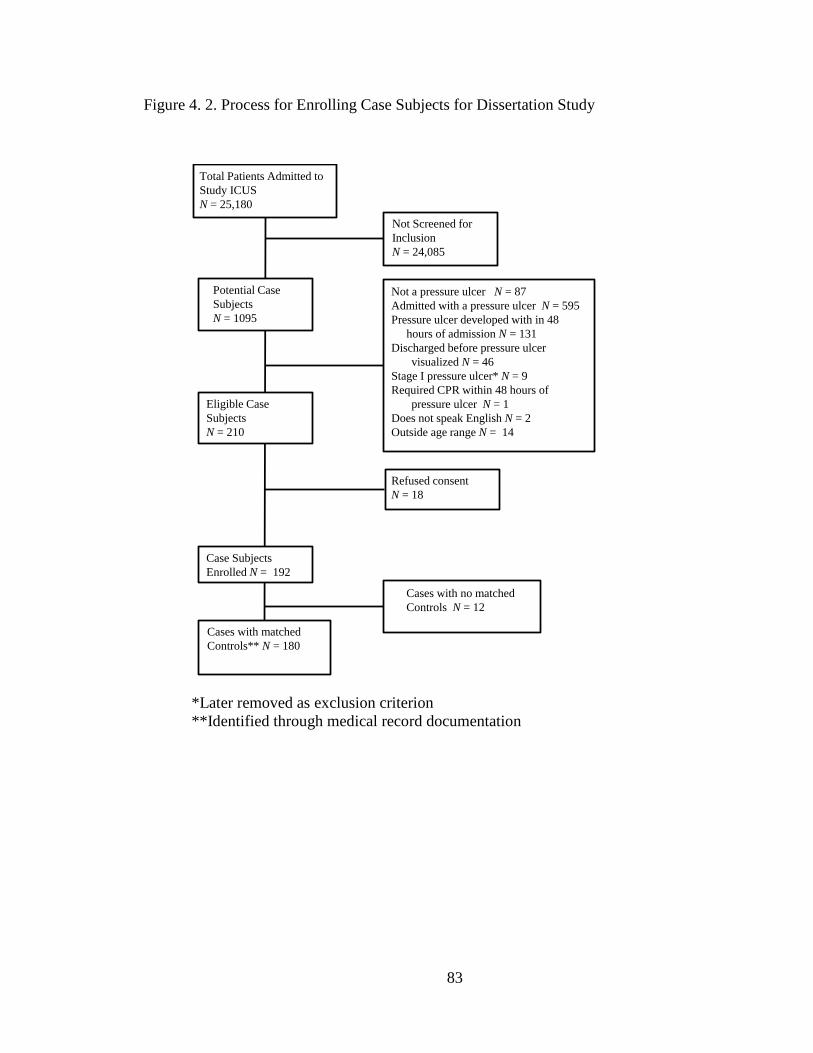
Figure 4. 2. Process for Enrolling Case Subjects for Dissertation Study
*Later removed as exclusion criterion **Identified through medical record documentation
Total Patients Admitted to Study ICUSN = 25,180
Not Screened for InclusionN = 24,085
Not a pressure ulcer N = 87Admitted with a pressure ulcer N = 595Pressure ulcer developed with in 48
hours of admission N = 131Discharged before pressure ulcer
visualized N = 46Stage I pressure ulcer* N = 9Required CPR within 48 hours of
pressure ulcer N = 1Does not speak English N = 2Outside age range N = 14
Refused consentN = 18
Cases with matched Controls** N = 180
Cases with no matched Controls N = 12
Potential Case SubjectsN = 1095
Eligible Case SubjectsN = 210
Case Subjects Enrolled N = 192
83
Characteristics of Case and Control Subjects
Matching Criteria and Consent Type
Matched pairs were most frequently drawn from the SICU (31.1%) and least
frequently from the Neuro ICU (5.6%). The Trauma ICU contributed 23.9% of the
matched pairs, 20.0% were drawn from the MICU, and 19.4% from the CVICU.
Ventilator use was present in 79.4% of the matched pairs.
Sixteen percent of case subjects gave consent for study participation. Surrogates
gave consent for 49.4% of case subjects. Following the consent process established for
the study protocol, 34.4% of consents were waived in case subjects and 99.4% of control
subjects.
Description of Variables Assessing Pressure Distribution Capacity
Table 4.4 provides descriptive statistics and unadjusted odds ratios for likelihood
of pressure ulcer for variables assessing pressure distribution capacity. Males comprised
63.9% of the subjects enrolled. A statistically significantly higher percentage were in the
cases (71%) than in the controls (57%) (p = 0.005). Subjects’ age ranged from 18 to 89
years (median = 58, IQR = 47.2 – 67.0). Average age for patients admitted to the study
ICUs during the data collection period was 54.7 years. Subject body mass index ranged
from 12.8 to 78.27 (median = 27.3, IQR = 23.6 – 32.9) kg/m2. No statistically significant
associations with the presence of a pressure ulcer were observed for age or BMI.
Description of Variables Assessing Metabolic Supply
Table 4.5 provides descriptive statistics and unadjusted odds ratios for likelihood
of pressure ulcer for variables assessing metabolic supply. No statistically significant
84

associations with development of a pressure ulcer were observed for nicotine use,
vasopressor administration, Braden Nutrition scores, or oxygen saturation of hemoglobin
values (p > 0.05).Nicotine use within one year prior to hospital admission was present in
39.9% of subjects. Vasopressor administration was measured at 24 hours prior to study
enrollment, 48 hours prior to study enrollment, and at any time during the ICU stay prior
to the 48-hour measure. A majority of subjects (69.7%) did not receive vasopressors
within 24 or 48 hours of study enrollment (69.2%). Vasopressor use prior to the 48-hour
measure occurred in 44.4% of subjects. See Appendix D, Table 5 for a complete
description of vasopressor use prior to study enrollment. Using VUH laboratory ranges
as the reference, the combined measures of protein reserve (serum albumin, serum pre-
albumin, and total lymphocyte count) were in the clinically "low" range in 79.3% of
subjects. Within the 24 hours prior to study enrollment, minimum Braden Nutrition
subscale scores were in the low risk range (scores of 3 or 4) in 54.1% of study subjects
and thus in the high risk range (scores of 1 or 2) in 45.8% of subjects when measured at
24 hours prior to study enrollment. Within 48 hours prior to study enrollment, those
values shifted slightly (Braden Nutrition low risk: 51.9%; high risk: 48.0%). Lowest
observed oxygen saturation of hemoglobin measured at 24 hours before study enrollment
ranged from 71% to 100% (median = 93.0, IQR = 90.0 – 96.0) and measures at 48 hours
before study enrollment ranged from 67% to 100% (median = 92.0, IQR = 89.0 – 95.0).
Statistically significant associations with the development of a pressure ulcer were
observed for hematocrit levels and for MAP (see Table 4.5). Within 24 hours prior to
study enrollment, the minimum observed hematocrit levels in case subjects had a median
hematocrit level of 26.0 (IQR = 24.0 – 29.0) while the controls had a median of 29.0
85
(IQR = 26.0 – 32.0) (p < 0.001). Highest observed hematocrit levels during the same
time demonstrated a similar pattern (cases: median = 28.0, controls: median = 29.0, p <
0.001). Within 48 hours prior to study enrollment, the minimum observed hematocrit
levels in case subjects had a median hematocrit level of 27.0 (IQR = 24.0 – 30.0) while
controls had a median of 29.0 (IQR = 26.0 – 33.0) (p = 0.011). Highest observed
hematocrit levels during the same 48 hour period before study enrollment demonstrated a
similar pattern (cases: median = 28.0, controls: median = 30.0, p = 0.008).
Within 24 hours prior to study enrollment, the minimum observed MAP in case
subjects had a median value of 61.0 (IQR = 56.0 – 67.0) mm Hg while the controls had a
median of 64.0 mm Hg (IQR = 58.0 – 70.0) (p = 0.012). MAP values obtained 48 hours
prior to study enrollment demonstrated a similar pattern (cases: median = 61.0, controls:
median = 63.0, p = 0.023)
86
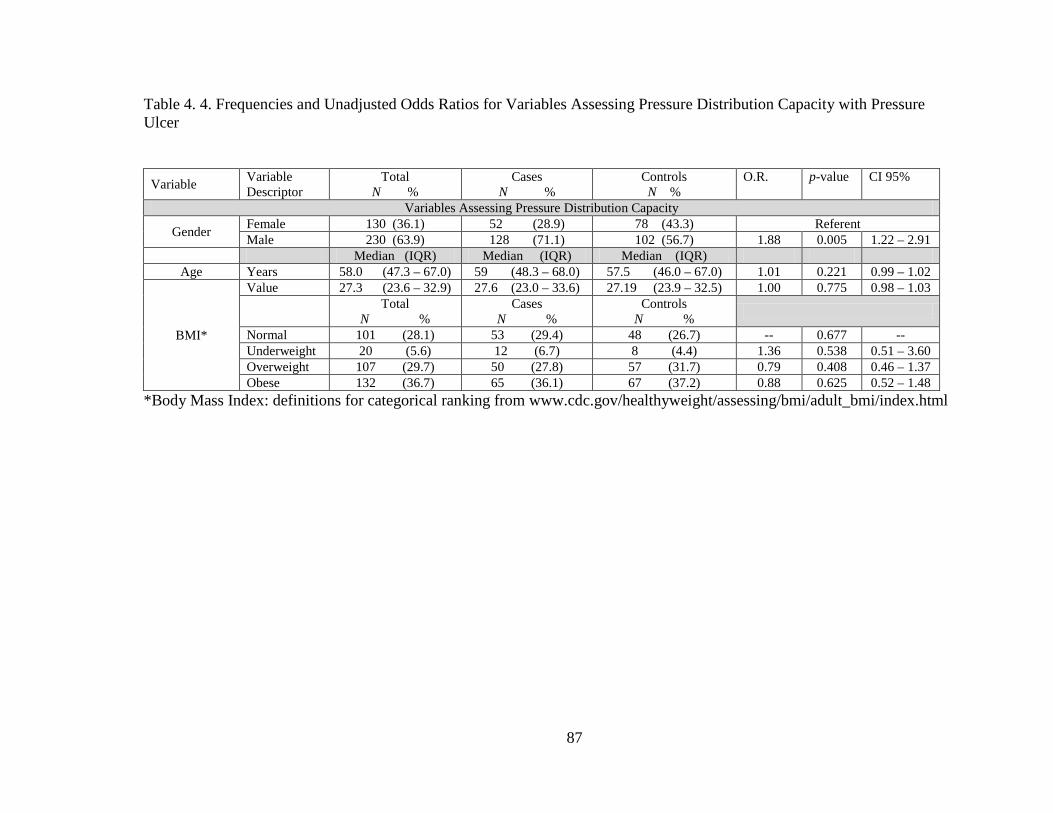
Table 4. 4. Frequencies and Unadjusted Odds Ratios for Variables Assessing Pressure Distribution Capacity with Pressure Ulcer
Variable Variable Descriptor
Total N %
Cases N %
Controls N %
O.R. p-value CI 95%
Variables Assessing Pressure Distribution Capacity
Gender Female 130 (36.1) 52 (28.9) 78 (43.3) Referent Male 230 (63.9) 128 (71.1) 102 (56.7) 1.88 0.005 1.22 – 2.91
Median (IQR) Median (IQR) Median (IQR) Age Years 58.0 (47.3 – 67.0) 59 (48.3 – 68.0) 57.5 (46.0 – 67.0) 1.01 0.221 0.99 – 1.02
BMI*
Value 27.3 (23.6 – 32.9) 27.6 (23.0 – 33.6) 27.19 (23.9 – 32.5) 1.00 0.775 0.98 – 1.03 Total
N % Cases
N % Controls
N %
Normal 101 (28.1) 53 (29.4) 48 (26.7) -- 0.677 -- Underweight 20 (5.6) 12 (6.7) 8 (4.4) 1.36 0.538 0.51 – 3.60 Overweight 107 (29.7) 50 (27.8) 57 (31.7) 0.79 0.408 0.46 – 1.37 Obese 132 (36.7) 65 (36.1) 67 (37.2) 0.88 0.625 0.52 – 1.48
*Body Mass Index: definitions for categorical ranking from www.cdc.gov/healthyweight/assessing/bmi/adult_bmi/index.html
87
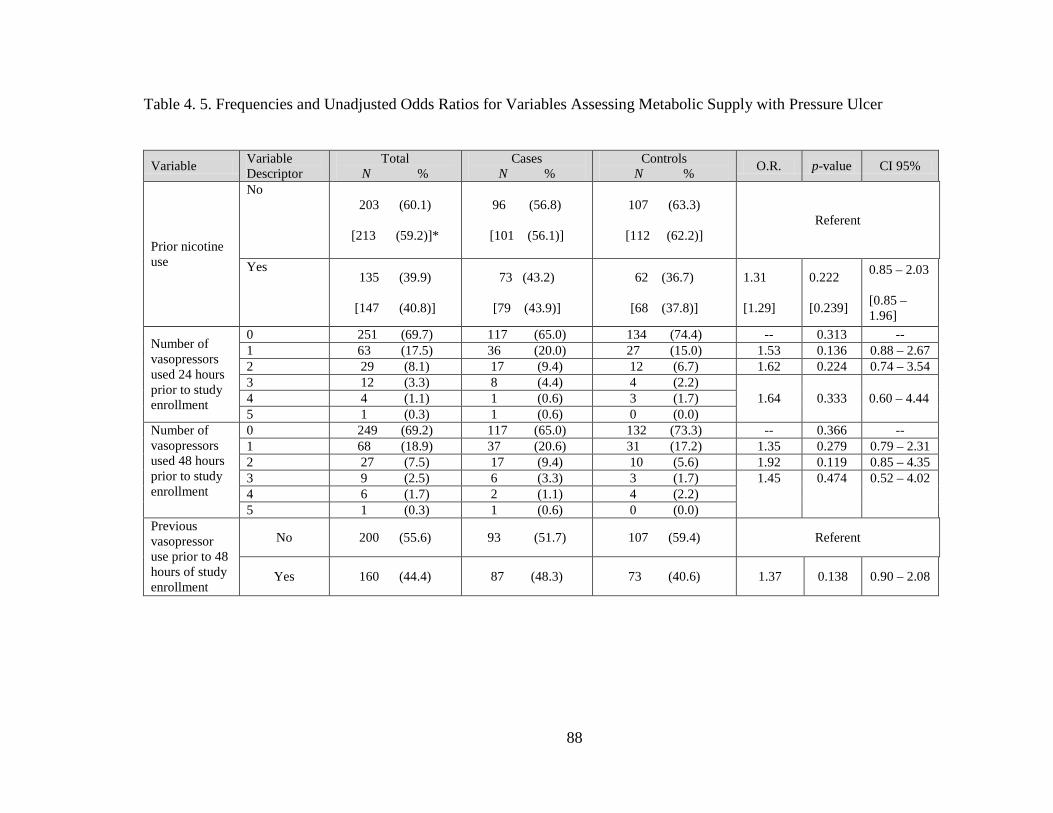
Table 4. 5. Frequencies and Unadjusted Odds Ratios for Variables Assessing Metabolic Supply with Pressure Ulcer
Variable Variable Descriptor
Total N %
Cases N %
Controls N % O.R. p-value CI 95%
Prior nicotine use
No 203 (60.1)
[213 (59.2)]*
96 (56.8)
[101 (56.1)]
107 (63.3)
[112 (62.2)] Referent
Yes 135 (39.9)
[147 (40.8)]
73 (43.2)
[79 (43.9)]
62 (36.7)
[68 (37.8)]
1.31 [1.29]
0.222 [0.239]
0.85 – 2.03 [0.85 – 1.96]
Number of vasopressors used 24 hours prior to study enrollment
0 251 (69.7) 117 (65.0) 134 (74.4) -- 0.313 -- 1 63 (17.5) 36 (20.0) 27 (15.0) 1.53 0.136 0.88 – 2.67 2 29 (8.1) 17 (9.4) 12 (6.7) 1.62 0.224 0.74 – 3.54 3 12 (3.3) 8 (4.4) 4 (2.2)
1.64 0.333 0.60 – 4.44 4 4 (1.1) 1 (0.6) 3 (1.7) 5 1 (0.3) 1 (0.6) 0 (0.0)
Number of vasopressors used 48 hours prior to study enrollment
0 249 (69.2) 117 (65.0) 132 (73.3) -- 0.366 -- 1 68 (18.9) 37 (20.6) 31 (17.2) 1.35 0.279 0.79 – 2.31 2 27 (7.5) 17 (9.4) 10 (5.6) 1.92 0.119 0.85 – 4.35 3 9 (2.5) 6 (3.3) 3 (1.7) 1.45 0.474 0.52 – 4.02 4 6 (1.7) 2 (1.1) 4 (2.2) 5 1 (0.3) 1 (0.6) 0 (0.0)
Previous vasopressor use prior to 48 hours of study enrollment
No 200 (55.6) 93 (51.7) 107 (59.4) Referent
Yes 160 (44.4) 87 (48.3) 73 (40.6) 1.37 0.138 0.90 – 2.08
88

Variable Variable Descriptor
Total N %
Cases N %
Controls N % O.R. p-value CI 95%
Minimum protein level recorded during ICU stay prior to enrollment
Normal
67 (20.7)
[83 (23.1)]*
30 (19.0)
[43 (23.9)]
37 (22.4)
[40 (22.2)] Referent
Low
256 (79.3)
[277 (76.9)]
128 (81.0)
[137 (76.1)]
128 (77.6)
[140 (77.8)]
1.23
[0.91]
0.447
[0.707]
0.72 – 2.12
[0.56 – 1.49]
Lowest Braden nutrition score 24 hours before study enrollment
4 3 (0.8) 2 (1.1) 1 (0.6)
-- 0.224 -- 3 192 (53.3) 88 (48.9) 104 (57.8)
2 121 (33.6) 64 (35.6) 57 (31.7) 1.31 0.244 0.83 – 2.06
1 44 (12.2) 26 (14.4) 18 (10.0) 1.69 0.123 0.87 – 3.28
Lowest Braden nutrition score 48 hours before study enrollment
4 3 (0.8) 1 (0.6) 2 (1.1)
-- 0.730 -- 3 184 (51.1) 89 (49.4) 95 (52.8)
2 133 (36.9) 70 (38.9) 63 (35.0) 1.19 0.427 0.77 – 1.87
1 40 (11.1) 20 (11.1) 20 (11.1) 1.08 0.830 0.54 – 2.13
Total Median (IQR)
Cases Median (IQR)
Controls Median (IQR)
O.R. p-value CI 95%
Lowest hematocrit recorded 24 hours prior to study enrollment
28.0 (24.0 – 31.0)
n = 351
[28.0 (24.0 – 31.0)] n = 360
26.0 (24.0 – 29.0)
n = 176
[26.0 (24.0 – 29.0)] n = 180
29.0 (26.0 – 32.0)
n = 175
[29.0 (26.0 – 32.0)] n = 180
0.90
[0.91]
<0.001
[<0.001]
0.86 – 0.95
[0.87 – 0.95]
89

Variable Variable Descriptor
Total N %
Cases N %
Controls N % O.R. p-value CI 95%
Highest hematocrit recorded 24 hours prior to study enrollment
28.0 (26.0 – 31.0)
n = 351
[28.0 (26.0 – 31.0)] n = 360
28.0 (25.0 – 30.0)
n = 176
[28.0 (25.0 – 30.0)] n = 180
29.0 (26.0 – 33.0)
n = 175
[29.0 (26.0 – 33.0)] n = 180
0.91
[0.91]
<0.001
[<0.001]
0.87 – 0.95
[0.87 – 0.96]
Lowest hematocrit recorded 48 hours prior to study enrollment
28.0 (25.0 – 31.0)
n = 351
[28.0 (25.0 – 31.0)] n = 360
27.0 (24.0 – 30.0)
n = 175
[27.0 (24.0 – 30.0)] n = 180
29.0 (25.0 – 32.0)
n = 176
[29.0 (25.0 – 32.0)] n = 180
0.95
[0.95]
0.011
[0.010]
0.91 – 0.99
[0.91 – 0.99]
Highest hematocrit recorded 48 hours prior to study enrollment
29.0 (26.0 – 32.0)
n =351
[29.0 (26.0 – 32.0)] n =360
28.0 (26.0 – 31.0)
n = 175
[28.0 (26.0 – 31.0)] n = 180
30.0 (27.0 – 32.8)
n = 176
[30.0 (27.0 – 33.0)] n = 180
0.94
[0.94]
0.008
[0.005]
0.90 – 0.99
[0.90 – 0.98]
Lowest MAP† recorded 24 hours prior to study enrollment
63.0 (57.0 – 69.0) 61.0 (56.0 – 67.0) 64.0 (58.0 – 70.0) 0.97 0.012 0.96 – 0.99
Lowest MAP† recorded 48 hours prior to study enrollment
62.0 (56.0 – 67.0) 61.0 (55.0 – 66.0) 63.0 (57.0 – 69.8) 0.98 0.023 0.96 – 0.99
90
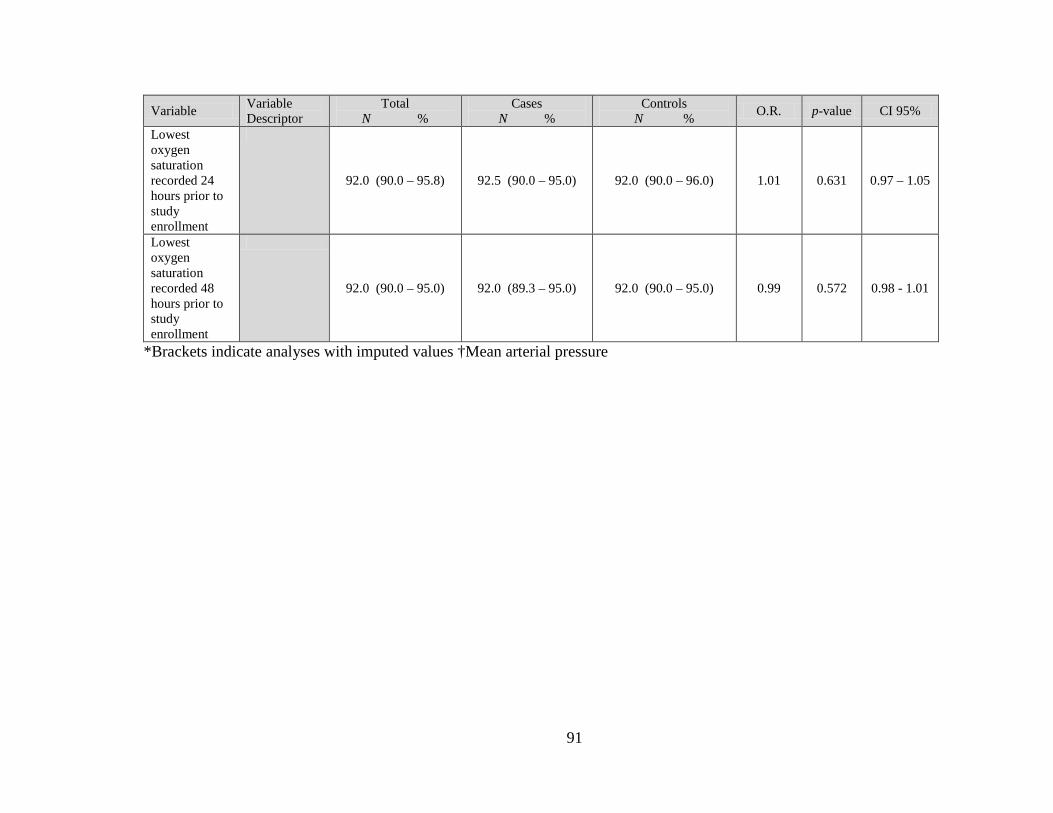
*Brackets indicate analyses with imputed values †Mean arterial pressure
Variable Variable Descriptor
Total N %
Cases N %
Controls N % O.R. p-value CI 95%
Lowest oxygen saturation recorded 24 hours prior to study enrollment
92.0 (90.0 – 95.8) 92.5 (90.0 – 95.0) 92.0 (90.0 – 96.0) 1.01 0.631 0.97 – 1.05
Lowest oxygen saturation recorded 48 hours prior to study enrollment
92.0 (90.0 – 95.0) 92.0 (89.3 – 95.0) 92.0 (90.0 – 95.0) 0.99 0.572 0.98 - 1.01
91
Description of Variables Assessing Metabolic Demand
Metabolic demand summaries are presented in Table 4.6. No statistically
significant differences were demonstrated between case and control subjects. Steroid
administration during the hospitalization up to 14 days prior to study enrollment occurred
in 36.7% of case subjects and in 30.6% of control subjects. See Appendix D, Table 5 for
a complete description of the type and amount of steroid administration received during
the hospitalization.
Description of Variables Assessing Threats to Skin Integrity
Table 4.6 provides summary and unadjusted associations with pressure ulcers for
the Braden Moisture (skin integrity) score. A statistically significantly association with
pressure ulcer development was observed for values with 24 hours of study enrollment (p
= 0.002) but not for 48 hours prior to enrollment (p = 0.080). When measured at 24
hours prior to study enrollment, low Braden Moisture subscale scores of 1 or 2, indicating
greatest risk of pressure ulcer incidence, were noted in 31.7% of case subjects and 18.3%
of control subjects (p < 0.001). Braden moisture subscale scores of 3 were observed in
56.1% of case subjects and 57.8% of control subjects (p = 0.031).
92
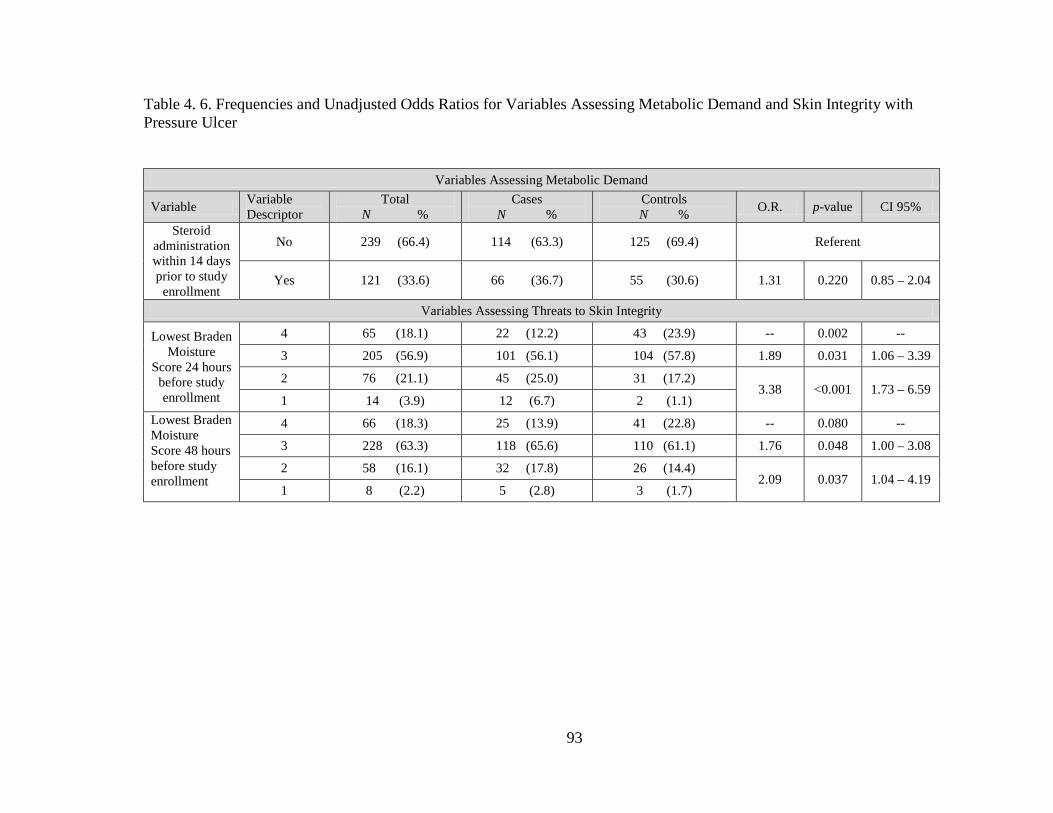
Table 4. 6. Frequencies and Unadjusted Odds Ratios for Variables Assessing Metabolic Demand and Skin Integrity with Pressure Ulcer
Variables Assessing Metabolic Demand
Variable Variable Descriptor
Total N %
Cases N %
Controls N % O.R. p-value CI 95%
Steroid administration within 14 days prior to study
enrollment
No 239 (66.4) 114 (63.3) 125 (69.4) Referent
Yes 121 (33.6) 66 (36.7) 55 (30.6) 1.31 0.220 0.85 – 2.04
Variables Assessing Threats to Skin Integrity
Lowest Braden Moisture
Score 24 hours before study enrollment
4 65 (18.1) 22 (12.2) 43 (23.9) -- 0.002 --
3 205 (56.9) 101 (56.1) 104 (57.8) 1.89 0.031 1.06 – 3.39
2 76 (21.1) 45 (25.0) 31 (17.2) 3.38 <0.001 1.73 – 6.59
1 14 (3.9) 12 (6.7) 2 (1.1) Lowest Braden Moisture Score 48 hours before study enrollment
4 66 (18.3) 25 (13.9) 41 (22.8) -- 0.080 --
3 228 (63.3) 118 (65.6) 110 (61.1) 1.76 0.048 1.00 – 3.08
2 58 (16.1) 32 (17.8) 26 (14.4) 2.09 0.037 1.04 – 4.19
1 8 (2.2) 5 (2.8) 3 (1.7)
93

Table 4. 7. Frequencies and Unadjusted Odds Ratios for Variables Assessing Intensity and Duration of Pressure and Other Factors with Pressure Ulcer
Variable Variable Descriptor
Total N %
Cases N %
Controls N % O.R. p-value CI 95%
Lowest Braden Sensory score 24 hours before study enrollment
4 70 (19.4) 28 (15.6) 42 (23.3) -- 0.025 --
3 126 (35.0) 57 (31.7) 69 (38.3) 1.24 0.479 0.69 – 2.24
2 115 (31.9) 63 (35.0) 52 (28.9) 1.82 0.052 0.99 – 3.32
1 49 (13.6) 32 (17.8) 17 (9.4) 2.82 0.007 1.32 – 6.03 Lowest Braden Sensory score 48 hours before study enrollment
4 60 (16.7) 21 (11.7) 39 (21.7) -- 0.047 --
3 129 (35.8) 63 (35.0) 66 (36.7) 1.77 0.076 0.94 – 3.34
2 121 (33.6) 67 (37.2) 54 (30.0) 2.30 0.011 1.21 - 4.37
1 50 (13.9) 29 (16.1) 21 (11.7) 2.57 0.017 1.18 – 5.55 Lowest Braden Mobility score 24 hours before study enrollment
4 19 (5.3) 2 (1.1) 17 (9.4) -- 0.002 --
3 78 (21.7) 34 (18.9) 44 (24.4)
2 171 (47.5) 86 (47.8) 85 (47.2) 1.71 0.038 1.03 – 2.85
1 92 (25.6) 58 (32.2) 34 (18.9) 2.89 <0.001 1.60 – 5.22 Lowest Braden Mobility score 48 hours before study enrollment
4 7 (1.9) 1 (0.6) 6 (3.3) -- 0.012 --
3 86 (23.9) 35 (19.4) 51 (28.3)
2 164 (45.6) 82 (45.6) 82 (45.6) 1.59 0.082 0.94 – 2.66
1 103 (28.6) 62 (34.4) 41 (22.8) 2.39 0.003 1.35 – 4.25 Lowest Braden Activity score 24 hours before study enrollment
4 4 (1.1) 0 (0.0) 4 (2.2) -- 0.007 --
3 24 (6.7) 6 (3.3) 18 (10.0)
2 83 (23.1) 39 (21.7) 44 (24.4) 3.25 0.021 1.19 – 8.84
1 249 (69.2) 135 (75.0) 114 (63.3) 4.34 0.002 1.70 – 11.08
94

Lowest Braden Activity score 48 hours before study enrollment
4 4 (1.1) 2 (1.1) 2 (1.1) -- 0.929 --
3 16 (4.4) 8 (4.4) 8 (4.4)
2 79 (21.9) 38 (21.1) 41 (22.8) 0.93 0.879 0.35 – 2.47
1 261 (72.5) 132 (73.3) 129 (71.1) 1.02 0.960 0.41 – 2.54
Lowest Braden Friction/Shear score 24 hours before study enrollment
3 35 (9.7) 9 (5.0) 26 (14.4) -- 0.001 --
2 163 (45.3) 75 (41.7) 88 (48.9) 2.46 0.031 1.07 – 5.58
1 162 (45.0) 96 (53.3) 66 (36.7) 4.20 0.001 1.85 – 9.54
Lowest Braden Friction/Shear Score 48 hours before study enrollment
3 31 (8.6) 9 (5.0) 22 (12.2) -- 0.018 --
2 181 (50.3) 87 (48.3) 94 (52.2) 2.26 0.053 0.99 – 5.18
1 148 (41.1) 84 (46.7) 64 (35.6) 3.21 0.007 1.38 – 7.44
Other Factors
Restraint use No 96 (26.7) 49 (27.2) 47 (26.1) Referent
Yes 264 (73.3) 131 (72.8) 133 (73.9) 0.95 0.812 0.59 – 1.51
95

Description of Variables Assessing Duration and Magnitude of Pressure and Other Variables
Descriptive statistical summaries and unadjusted associations of the pressure and
mobility variables in the model with the development of pressure ulcers are presented in
Table 4.7. Statistically significant associations with pressure ulcers were observed for he
Braden Sensory Perception, Mobility, and Friction/Shear scores at both 24 hours and 48
hours prior to study enrollment (p < 0.05, see Table 4.7). Activity values within 24 hours
prior to enrollment were statistically significantly associated (p = 0.007) while values
within 48 hours were not (p = 0.929). When measured at 24 hours prior to study
enrollment, low Braden Sensory subscale scores of 1, indicating a high pressure ulcer
risk, were observed in 17.8% of case subjects and 9.4% of control subjects (p = 0.007).
When measured at 48 hours prior to study enrollment, Braden Sensory subscales of 1 and
2 were found to be statistically significantly associated with pressure ulcer (Braden
Sensory score of 1, p = 0.017; Braden Sensory score of 2, p = 0.011). When measured at
both 48 and 24 hours prior to study enrollment, all of the Braden Moisture subscale
scores were statistically significantly associated with pressure ulcer. Similarly, when
measured at 24 hours prior to study enrollment, all of the Braden Friction/Shear subscale
scores were statistically significantly associated with pressure ulcer. When measured at
48 hours prior to study enrollment, Friction/Shear subscale scores of 1 and 3 were
statistically significantly associated (Braden Friction/Shear score 1, p = 0.007; Braden
Friction/Shear score 3, p = 0.018) while Friction/Shear subscale scores of 2 were not.
There was no statistically significant association of restraint use with the pressure
ulcers. Of the subjects enrolled, 73.3% of them were in restraints prior to study
enrollment. (See Table 4.7)
96

Pressure Ulcer Findings
Multiple pressure ulcers occurred in 51 (28.3%) of case subjects. Of those with
multiple pressure ulcers, 177 (98.3%) were limited to three or less. One case subject
(0.6%) each had four, five, and eight pressure ulcers. The presence of multiple pressure
ulcers was confirmed visually per the protocol and had not been documented within 48
hours after the ICU admission. They were therefore considered eligible for study
enrollment. Table 4.8 describes the frequency, stage, and location of the most severe
pressure ulcer identified in case patients. Deep tissue injury occurred the most frequently
in 72 (40.0%) of case subjects followed by Stage II pressure ulcers. The sacrum was the
most commonly occurring location for pressure ulcers (n= 77; 42.8%) followed by the
right (n=29; 16.1%) and left (n=18; 10.0%) heels.
97
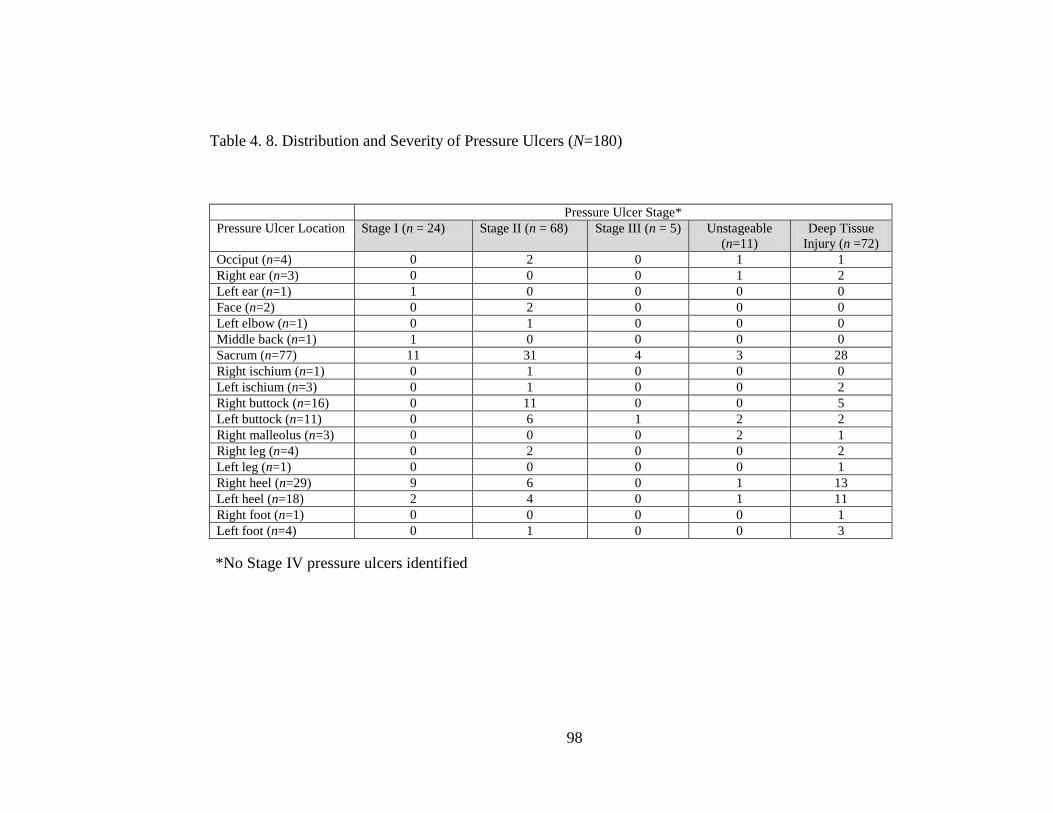
Table 4. 8. Distribution and Severity of Pressure Ulcers (N=180)
*No Stage IV pressure ulcers identified
Pressure Ulcer Stage* Pressure Ulcer Location Stage I (n = 24) Stage II (n = 68) Stage III (n = 5) Unstageable
(n=11) Deep Tissue
Injury (n =72) Occiput (n=4) 0 2 0 1 1 Right ear (n=3) 0 0 0 1 2 Left ear (n=1) 1 0 0 0 0 Face (n=2) 0 2 0 0 0 Left elbow (n=1) 0 1 0 0 0 Middle back (n=1) 1 0 0 0 0 Sacrum (n=77) 11 31 4 3 28 Right ischium (n=1) 0 1 0 0 0 Left ischium (n=3) 0 1 0 0 2 Right buttock (n=16) 0 11 0 0 5 Left buttock (n=11) 0 6 1 2 2 Right malleolus (n=3) 0 0 0 2 1 Right leg (n=4) 0 2 0 0 2 Left leg (n=1) 0 0 0 0 1 Right heel (n=29) 9 6 0 1 13 Left heel (n=18) 2 4 0 1 11 Right foot (n=1) 0 0 0 0 1 Left foot (n=4) 0 1 0 0 3
98
Summary of Unadjusted (Univariate) Findings
Prior to controlling for the inter-correlations among the factors included in this
study, gender, a determinate of the capacity to distribute pressure, demonstrated that
males were more likely to develop pressure ulcers than females (p = 0.005, O.R. = 1.88,
95% C.I. = 1.22 - 2.91). Factors contributing conceptually to metabolic supply that did
show statistical significance were lower hematocrit levels at 24 and 48 hours prior to
study enrollment, and lower mean arterial pressure recorded within the same timeframe.
Braden sub-scale scores comprised 15 (68.2%) of the statistically significant findings.
Subjects with low (1 or 2) Braden Moisture subscales, indicating a higher pressure ulcer
risk, were statistically significantly more likely to develop a pressure ulcer than subjects
with Moisture subscale scores of 3 or 4 which represent less pressure ulcer risk. Similar
findings were observed in the Braden subscale components of Sensory Perception,
Mobility, Activity, and Friction/Shear (see Table 4.7). Of the Braden sub-scales, only
Nutrition subscale scores, a conceptual component contributing to metabolic supply, were
not statistically significantly different between case and control subjects.
Multivariate Analysis
Hierarchical multiple logistic regression analysis was conducted controlling for
the effects of age, then the Braden subscale scores, with the remaining variables added to
test for the combined effects. Data analysis was separated into those variables measured
99

at 24 hours prior to study enrollment with and without imputed values, and those
measured at 48 hours prior to study enrollment with and without imputed values.
Analysis of Variables Measured 24 Hours Prior to Study Enrollment
The adjusted associations of age and Braden scores with the likelihood of a
pressure ulcer are summarized in Table 4.9.
Table 4. 9. Summary of Multivariate Associations with Pressure Ulcer Measured at 24 Hours Prior to Study Enrollment for Block One and Two Variable Without Imputed Values With Imputed Values O.R. p-value CI 95%
O.R. p-value CI 95%
Block 1 Age 1.01 0.345 0.99 – 1.02 1.01 0.221 0.99 – 1.02 Block 2 Age 1.01 0.327 0.99 – 1.02 1.01 0.193 0.99 – 1.02 Braden Nutrition subscore 3 and 4 -- 0.068 -- -- 0.682 --
Braden Nutrition subscore 2 1.64 0.068 0.96 – 2.79 1.21 0.436 0.75 – 1.97
Braden Nutrition subscore 1 2.41 0.062 0.96 – 6.07 1.26 0.550 0.59 – 2.69
Braden Mobility subscore 3 and 4 -- 0.753 -- -- 0.551
Braden Mobility subscore 2 1.18 0.667 0.55 – 2.53 1.22 0.583 0.61 – 2.44
Braden Mobility subscore 1 1.48 0.456 0.53 – 4.18 1.67 0.287 0.65 – 4.31
Braden Activity subscore 3 and 4 -- 0.153 -- -- 0.249 --
Braden Activity subscore 2 4.26 0.054 0.97 – 18.64 2.42 0.112 0.81 – 7.18
Braden Activity subscore 1 3.58 0.107 0.76 – 16.91 1.91 0.285 0.58 – 6.24
Braden Moisture subscore 4 -- 0.005 -- -- 0.027 --
Braden Moisture subscore 3 2.44 0.024 1.13 – 5.29 1.57 0.185 0.81 – 3.08
Braden Moisture subscore < 3 4.32 0.001 1.79 – 10.43 2.74 0.011 1.27 – 5.92
Braden Sensory Perception subscore 4
-- 0.285 -- -- 0.574 --
Braden Sensory Perception subscore 3
0.48 0.071 0.21 – 1.07 0.61 0.184 0.29 – 1.26
100

Variable Without Imputed Values With Imputed Values O.R. p-value CI 95%
O.R. p-value CI 95%
Braden Sensory Perception subscore 2
0.64 0.347 0.26 – 1.62 0.72 0.440 0.31 – 1.65
Braden Sensory Perception subscore 1
0.49 0.273 0.14 – 1.74 0.82 0.729 0.27 – 2.51
Braden Friction/Shear subscore 3
-- 0.584 -- -- 0.234 --
Braden Friction/Shear subscore 2
1.07 0.911 0.35 – 3.23 1.65 0.297 0.64 – 4.26
Braden Friction/Shear subscore 1
1.42 0.563 0.43 – 4.69 2.28 0.117 0.81 – 6.37
Hierarchical tests without imputed values (N=299): Block 1: Age alone: X2 (df = 1) = 0.89, p = 0.344; Block 2: Addition of Braden Subscale scores: X2 (df = 13) = 34.72, p = 0.001; Model: X2 (df = 14) = 35.62, p = 0.001 Hierarchical tests with imputed values (N=360): Block 1: Age alone: X2 (df = 1) = 1.51, p = 0.219; Block 2: Addition of Braden Subscale scores: X2 (df = 13) = 30.96, p = 0.003; Model: X2 (df = 14) = 32.46, p = 0.003
Consistent with the unadjusted findings, age alone (Block 1) was not statistically
significantly associated with pressure ulcer outcome. After controlling for age, there was
a statistically significant association of the Braden subscales (Block 2) with pressure
ulcer development for both the complete (X2 (df = 13) = 34.72, p = 0.001) and imputed data
sets (X2 (df = 13) = 30.96, p = 0.003). This finding indicates that the Braden subscales are
statistically significantly related to pressure ulcer outcome, after controlling for the
effects of age. Within the set of scores, however, only the moisture subscale score
contributed uniquely to this effect (see Table 4.9).
To evaluate the effects of the other variables after controlling for the effects of
age and the Braden subscales, the remaining variables were entered into the logistic
regression analysis. Table 4.10 describes the multivariate associations of all variables
measured at 24 hours prior to study enrollment.
101
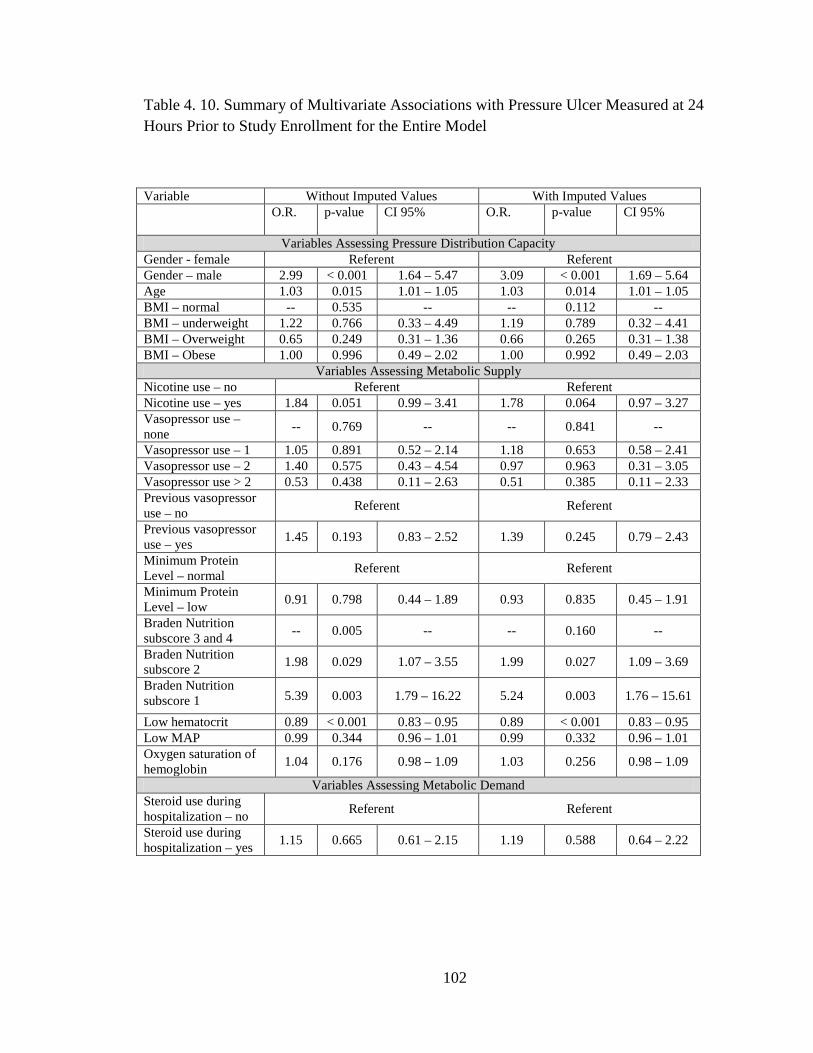
Table 4. 10. Summary of Multivariate Associations with Pressure Ulcer Measured at 24 Hours Prior to Study Enrollment for the Entire Model
Variable Without Imputed Values With Imputed Values O.R. p-value CI 95%
O.R. p-value CI 95%
Variables Assessing Pressure Distribution Capacity Gender - female Referent Referent Gender – male 2.99 < 0.001 1.64 – 5.47 3.09 < 0.001 1.69 – 5.64 Age 1.03 0.015 1.01 – 1.05 1.03 0.014 1.01 – 1.05 BMI – normal -- 0.535 -- -- 0.112 -- BMI – underweight 1.22 0.766 0.33 – 4.49 1.19 0.789 0.32 – 4.41 BMI – Overweight 0.65 0.249 0.31 – 1.36 0.66 0.265 0.31 – 1.38 BMI – Obese 1.00 0.996 0.49 – 2.02 1.00 0.992 0.49 – 2.03
Variables Assessing Metabolic Supply Nicotine use – no Referent Referent Nicotine use – yes 1.84 0.051 0.99 – 3.41 1.78 0.064 0.97 – 3.27 Vasopressor use – none -- 0.769 -- -- 0.841 --
Vasopressor use – 1 1.05 0.891 0.52 – 2.14 1.18 0.653 0.58 – 2.41 Vasopressor use – 2 1.40 0.575 0.43 – 4.54 0.97 0.963 0.31 – 3.05 Vasopressor use > 2 0.53 0.438 0.11 – 2.63 0.51 0.385 0.11 – 2.33 Previous vasopressor use – no Referent Referent
Previous vasopressor use – yes 1.45 0.193 0.83 – 2.52 1.39 0.245 0.79 – 2.43
Minimum Protein Level – normal Referent Referent
Minimum Protein Level – low 0.91 0.798 0.44 – 1.89 0.93 0.835 0.45 – 1.91
Braden Nutrition subscore 3 and 4 -- 0.005 -- -- 0.160 --
Braden Nutrition subscore 2 1.98 0.029 1.07 – 3.55 1.99 0.027 1.09 – 3.69
Braden Nutrition subscore 1 5.39 0.003 1.79 – 16.22 5.24 0.003 1.76 – 15.61
Low hematocrit 0.89 < 0.001 0.83 – 0.95 0.89 < 0.001 0.83 – 0.95 Low MAP 0.99 0.344 0.96 – 1.01 0.99 0.332 0.96 – 1.01 Oxygen saturation of hemoglobin 1.04 0.176 0.98 – 1.09 1.03 0.256 0.98 – 1.09
Variables Assessing Metabolic Demand Steroid use during hospitalization – no Referent Referent
Steroid use during hospitalization – yes 1.15 0.665 0.61 – 2.15 1.19 0.588 0.64 – 2.22
102
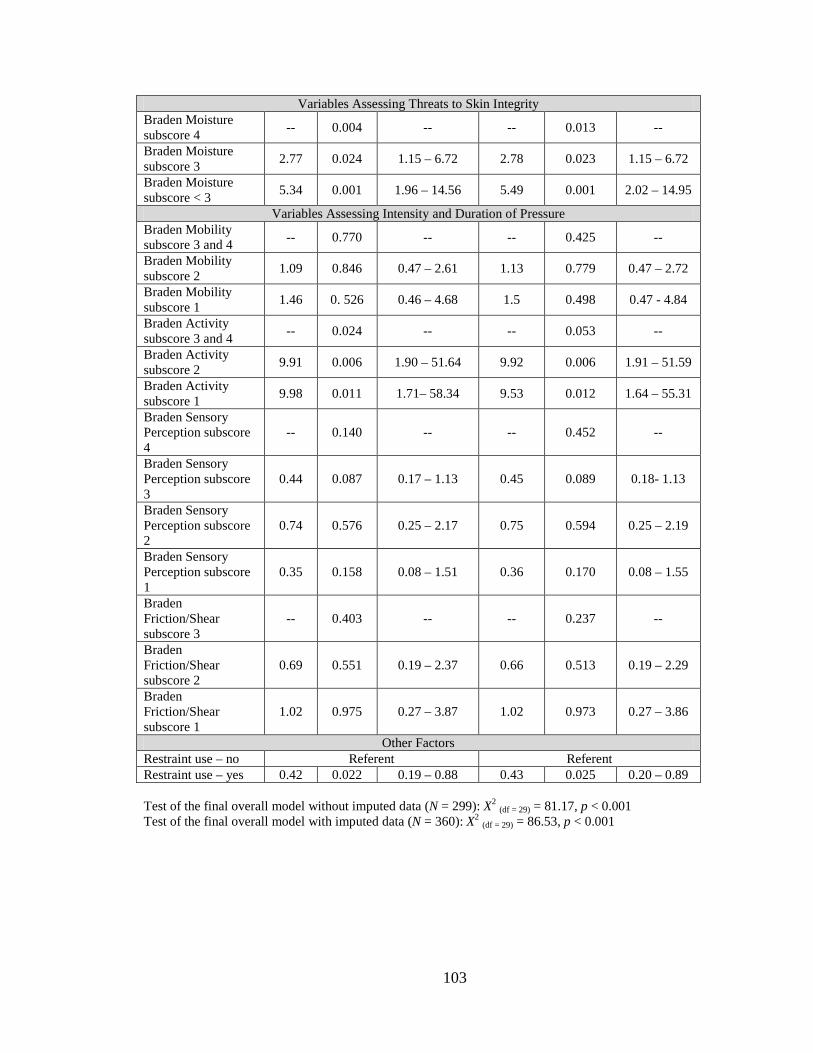
Variables Assessing Threats to Skin Integrity Braden Moisture subscore 4 -- 0.004 -- -- 0.013 --
Braden Moisture subscore 3 2.77 0.024 1.15 – 6.72 2.78 0.023 1.15 – 6.72
Braden Moisture subscore < 3 5.34 0.001 1.96 – 14.56 5.49 0.001 2.02 – 14.95
Variables Assessing Intensity and Duration of Pressure Braden Mobility subscore 3 and 4 -- 0.770 -- -- 0.425 --
Braden Mobility subscore 2 1.09 0.846 0.47 – 2.61 1.13 0.779 0.47 – 2.72
Braden Mobility subscore 1 1.46 0. 526 0.46 – 4.68 1.5 0.498 0.47 - 4.84
Braden Activity subscore 3 and 4 -- 0.024 -- -- 0.053 --
Braden Activity subscore 2 9.91 0.006 1.90 – 51.64 9.92 0.006 1.91 – 51.59
Braden Activity subscore 1 9.98 0.011 1.71– 58.34 9.53 0.012 1.64 – 55.31
Braden Sensory Perception subscore 4
-- 0.140 -- -- 0.452 --
Braden Sensory Perception subscore 3
0.44 0.087 0.17 – 1.13 0.45 0.089 0.18- 1.13
Braden Sensory Perception subscore 2
0.74 0.576 0.25 – 2.17 0.75 0.594 0.25 – 2.19
Braden Sensory Perception subscore 1
0.35 0.158 0.08 – 1.51 0.36 0.170 0.08 – 1.55
Braden Friction/Shear subscore 3
-- 0.403 -- -- 0.237 --
Braden Friction/Shear subscore 2
0.69 0.551 0.19 – 2.37 0.66 0.513 0.19 – 2.29
Braden Friction/Shear subscore 1
1.02 0.975 0.27 – 3.87 1.02 0.973 0.27 – 3.86
Other Factors Restraint use – no Referent Referent Restraint use – yes 0.42 0.022 0.19 – 0.88 0.43 0.025 0.20 – 0.89 Test of the final overall model without imputed data (N = 299): X2 (df = 29) = 81.17, p < 0.001 Test of the final overall model with imputed data (N = 360): X2 (df = 29) = 86.53, p < 0.001
103

The remaining set of variables (nicotine use, BMI, gender, vasopressor use,
protein level, steroid use during hospitalization, restraint use, and lowest observed
hematocrit, MAP, and oxygen saturation of hemoglobin 24 hours before study
enrollment) were added in the final step of the hierarchical analysis. After controlling for
age and the Braden scores, the set added statistically significantly to the model (Complete
data: X2 (df = 15) = 45.61, p < 0.001; Imputed data set: X2 (df = 15) = 54.07, p < 0.001). As
would be expected, the overall model containing all of the variables was statistically
significant (p < 0.001). Within the set of added variables the following variables
contributed to that effect: gender, restraint use, and lowest hematocrit levels. The
adjusted effects of restraint use on pressure ulcer outcome indicated that restrained
subjects were approximately 60% less likely to develop a pressure ulcer than unrestrained
subjects using variables with (p = 0.025, O.R. = 0.43, 95% C.I. = 0.20 – 0.89) and
without (p = 0.022, O.R. = 0.42, 95% C.I. = 0.19 – 0.88) imputed data.
Finally, once all variables were adjusted for in the analysis some findings
emerged that were not apparent in the unadjusted or in the previous steps. Age became a
statistically significant variable. Subjects were 3% more likely to develop a pressure
ulcer with each increase in age by one year using variables with (p = 0.014, O.R. = 1.03,
95% C.I. = 1.01 – 1.05) and without (p = 0.015, O.R. = 1.03, 95% C.I. = 1.01 – 1.05)
imputed data. Braden subscales of Nutrition and Activity became statistically significant
in the overall test of the model only when data without imputed values were used
(Nutrition p = 0.005; Activity p = 0.024).
Variables remaining statistically significant in the adjusted analysis included
Braden Moisture subscale and low hematocrit using the variables with and without
104

imputed values. Braden Activity subscale maintained the statistical significance
demonstrated in univariate associations with pressure ulcer in multivariate analysis using
only the variables without imputed values.
Finally, variables that appeared to be statistically significant in the unadjusted or
in the model without the last set of variables but were no longer in the full model
included Braden Sensory Perception and Friction/Shear subscales. Similarly, MAP was
no longer statistically significant in multivariate tests of its association with pressure
ulcer outcome.
Analysis of Variables Measured 48 Hours Prior to Study Enrollment
Another multiple hierarchical logistic regression analysis was conducted using
variables assessed 48 hours prior to study enrollment. Table 4.11 summarizes that
analysis.
Table 4. 11. Summary of Multivariate Associations with Pressure Ulcer Measured at 48 Hours Prior to Study Enrollment for Block One and Two
Variable Without Imputed Values With Imputed Values O.R. p-value CI 95%
O.R. p-value CI 95%
Block 1 Age 1.01 0.303 0.99 – 1.03 1.01 0.221 0.99 – 1.02 Block 2 Age 1.01 0.200 0.94 – 1.03 1.01 0.112 0.99 – 1.03 Braden Nutrition subscores 3 and 4 -- 0.638 -- -- 0.586 --
Braden Nutrition subscore 2 1.24 0.432 0.73 – 2.09 1.22 0.416 0.75 – 1.98
Braden Nutrition subscore 1 0.89 0.788 0.39 – 2.06 0.87 0.715 0.42 – 1.83
Braden Mobility subscore 3 and 4 -- 0.167 -- -- 0.162 --
Braden Mobility subscore 2 1.72 0.178 0.78 – 3.77 1.47 0.266 0.75 – 2.91
Braden Mobility subscore 1 2.62 0.059 0.97 – 7.09 2.30 0.061 0.96 – 5.51
105
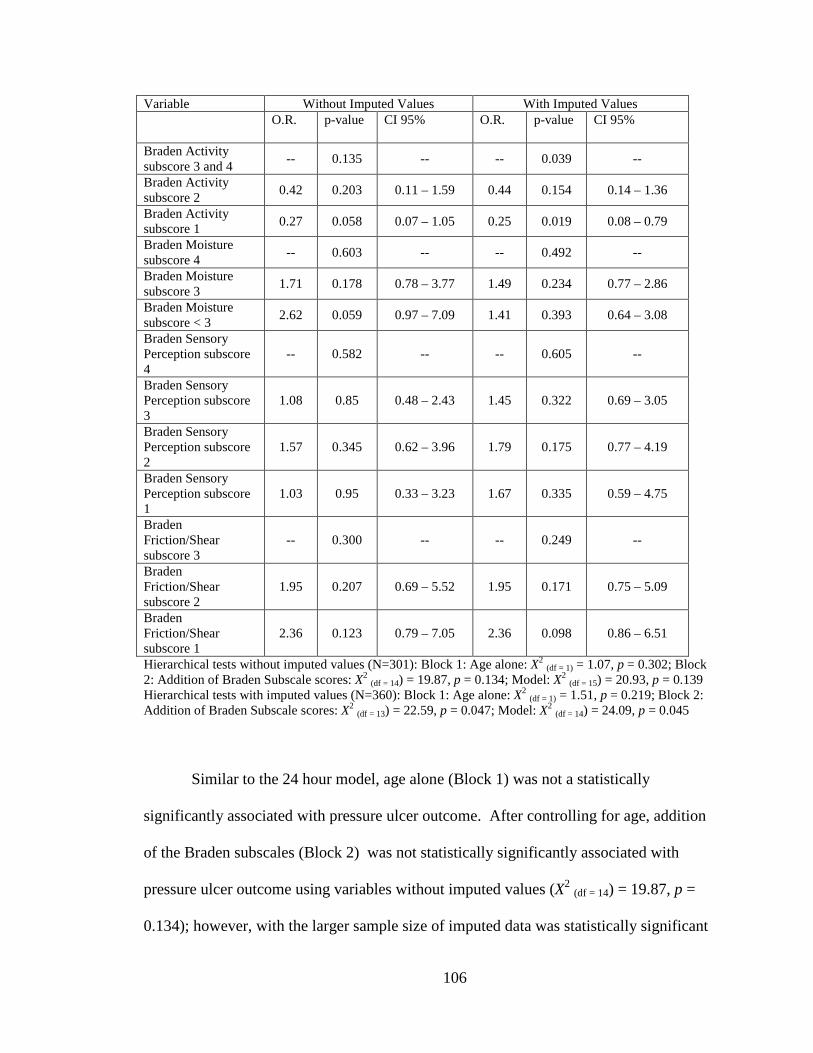
Variable Without Imputed Values With Imputed Values O.R. p-value CI 95%
O.R. p-value CI 95%
Braden Activity subscore 3 and 4 -- 0.135 -- -- 0.039 --
Braden Activity subscore 2 0.42 0.203 0.11 – 1.59 0.44 0.154 0.14 – 1.36
Braden Activity subscore 1 0.27 0.058 0.07 – 1.05 0.25 0.019 0.08 – 0.79
Braden Moisture subscore 4 -- 0.603 -- -- 0.492 --
Braden Moisture subscore 3 1.71 0.178 0.78 – 3.77 1.49 0.234 0.77 – 2.86
Braden Moisture subscore < 3 2.62 0.059 0.97 – 7.09 1.41 0.393 0.64 – 3.08
Braden Sensory Perception subscore 4
-- 0.582 -- -- 0.605 --
Braden Sensory Perception subscore 3
1.08 0.85 0.48 – 2.43 1.45 0.322 0.69 – 3.05
Braden Sensory Perception subscore 2
1.57 0.345 0.62 – 3.96 1.79 0.175 0.77 – 4.19
Braden Sensory Perception subscore 1
1.03 0.95 0.33 – 3.23 1.67 0.335 0.59 – 4.75
Braden Friction/Shear subscore 3
-- 0.300 -- -- 0.249 --
Braden Friction/Shear subscore 2
1.95 0.207 0.69 – 5.52 1.95 0.171 0.75 – 5.09
Braden Friction/Shear subscore 1
2.36 0.123 0.79 – 7.05 2.36 0.098 0.86 – 6.51
Hierarchical tests without imputed values (N=301): Block 1: Age alone: X2 (df = 1) = 1.07, p = 0.302; Block 2: Addition of Braden Subscale scores: X2 (df = 14) = 19.87, p = 0.134; Model: X2 (df = 15) = 20.93, p = 0.139 Hierarchical tests with imputed values (N=360): Block 1: Age alone: X2 (df = 1) = 1.51, p = 0.219; Block 2: Addition of Braden Subscale scores: X2 (df = 13) = 22.59, p = 0.047; Model: X2 (df = 14) = 24.09, p = 0.045
Similar to the 24 hour model, age alone (Block 1) was not a statistically
significantly associated with pressure ulcer outcome. After controlling for age, addition
of the Braden subscales (Block 2) was not statistically significantly associated with
pressure ulcer outcome using variables without imputed values (X2 (df = 14) = 19.87, p =
0.134); however, with the larger sample size of imputed data was statistically significant
106

(X2 (df = 13) = 22.59, p = 0.047). None of the individual Braden subscales was statistically
significantly associated with pressure ulcer outcome in Block 2 of the model. After
controlling for age and the Braden scores, the set added statistically significantly to the
model when imputed data were used (X2 (df = 14) = 22.01, p = 0.045) but did not add
statistically significantly to the model when the complete data set was used (X2 (df = 15) =
22.94, p = 0.139).
The results of the final model at 48 hours are presented in Table 4.12. The
remaining set of variables (nicotine use, BMI, gender, vasopressor use, protein level,
steroid use during hospitalization, restraint use, and lowest observed hematocrit, MAP,
and oxygen saturation of hemoglobin 48 hours before study enrollment) were added in
the final step of the hierarchical analysis. After controlling for age and the Braden
scores, the set added statistically significantly to the model (Complete data: X2 (df = 15) =
32.09, p = 0.006; Imputed data set: X2 (df = 15) = 36.42, p = 0.002). As with the variables
measured at 24 hours, the overall model containing all of the variables measured at 48
hours prior to study enrollment was statistically significant (p < 0.001). Within the set of
added variables, gender and low hematocrit contributed to that effect. The adjusted
effects of restraint use on pressure ulcer outcome indicated that restrained subjects were
approximately 50% less likely to develop a pressure ulcer than unrestrained subjects
using variables with imputed data (p = 0.041, O.R. = 0.52, 95% C.I. = 0.28 – 0.97);
however, restraint use was not statistically significantly associated with pressure ulcer
using the complete data set (p = 0.117).
107

Table 4. 22. Summary of Multivariate Associations with Pressure Ulcer Measured at 48 Hours Prior to Study Enrollment for the Entire Model Variable Without Imputed Values With Imputed Values O.R. p-value CI 95% O.R. p-value CI 95%
Variables Assessing Pressure Distribution Capacity Gender - female Referent Referent Gender – male 2.52 0.001 1.43 – 4.44 2.29 0.001 1.38 – 3.83 Age 1.02 0.082 0.99 – 1.04 1.02 0.020 1.00 – 1.04 BMI – normal -- 0.341 -- -- 0.161 -- BMI – underweight 1.39 0.588 0.42 – 4.68 2.02 0.209 0.67 – 6.06 BMI – Overweight 0.59 0.131 0.29 – 1.17 0.64 0.155 0.35 – 1.18 BMI – Obese 0.75 0.405 0.38 – 1.48 0.78 0.427 0.43 – 1.43
Variables Assessing Metabolic Supply Nicotine use – no Referent Referent Nicotine use – yes 1.32 0.341 0.74 – 2.35 1.53 0.104 0.92 – 2.56 Vasopressor use – none -- 0.529 -- -- 0.767 -- Vasopressor use – 1 1.48 0.241 0.77 – 2.85 1.16 0.641 0.63 – 2.14 Vasopressor use – 2 1.88 0.267 0.62 – 5.73 1.37 0.528 0.52 – 3.59 Vasopressor use > 2 1.12 0.882 0.26 – 4.79 0.69 0.544 0.21 – 2.31 Previous vasopressor use – no Referent Referent
Previous vasopressor use – yes 1.53 0.121 0.89 – 2.63 1.32 0.263 0.81 – 2.16
Minimum Protein Level – normal Referent Referent
Minimum Protein Level – low 1.14 0.696 0.59 – 2.20 0.75 0.316 0.43 – 1.32
Braden Nutrition subscore 3 and 4 -- 0.831 -- -- 0.705 --
Braden Nutrition subscore 2 1.16 0.597 0.66 – 2.05 1.21 0.482 0.72 – 2.03
Braden Nutrition subscore 1 0.94 0.897 0.36 – 2.42 0.91 0.826 0.39 – 2.11
Low hematocrit 0.94 0.030 0.89 – 0.99 0.95 0.017 0.91 – 0.99
Low MAP 0.99 0.454 0.97 – 1.01 0.99 0.240 0.96 – 1.01
Oxygen saturation of hemoglobin 0.99 0.557 0.98 – 1.01 0.99 0.550 0.98 – 1.01
Variables Assessing Metabolic Demand Steroid use during hospitalization – no Referent Referent
Steroid use during hospitalization – yes 1.06 0.837 0.59 – 1.93 1.23 0.443 0.72 – 2.09
Variables Assessing Threats to Skin Integrity
Braden Moisture subscore 4 -- 0.566 -- -- 0.317 --
Braden Moisture subscore 3 1.50 0.318 0.68 – 3.35 1.70 0.144 0.83 – 3.47
Braden Moisture subscore < 3 1.60 0.326 0.62 – 4.13 1.78 0.188 0.75 – 4.22
Variables Assessing Intensity and Duration of Pressure Braden Mobility -- 0.116 -- -- 0.094 --
108

Variable Without Imputed Values With Imputed Values O.R. p-value CI 95% O.R. p-value CI 95% subscore 3 and 4 Braden Mobility subscore 2 1.91 0.128 0.83 – 4.38 1.72 0.147 0.83 – 3.59
Braden Mobility subscore 1 3.12 0.038 1.06 – 9.13 2.87 0.030 1.12 – 7.46
Braden Activity subscore 3 and 4 -- 0.137 -- -- 0.093 --
Braden Activity subscore 2 0.34 0.151 0.08 – 1.48 0.42 0.165 0.12 – 1.43
Braden Activity subscore 1 0.22 0.051 0.05 – 1.01 0.26 0.038 0.07 – 0.93
Braden Sensory Perception subscore 4 -- 0.598 -- -- 0.740 --
Braden Sensory Perception subscore 3 0.91 0.839 0.37 – 2.24 1.35 0.481 0.58 – 3.15
Braden Sensory Perception subscore 2 1.43 0.509 0.49 – 4.09 1.68 0.300 0.63 – 4.47
Braden Sensory Perception subscore 1 0.99 0.989 0.28 – 3.55 1.77 0.335 0.55 – 5.69
Braden Friction/Shear subscore 3 -- 0.356 -- -- 0.297 --
Braden Friction/Shear subscore 2 1.86 0.282 0.60 – 5.74 1.73 0.302 0.61 – 4.91
Braden Friction/Shear subscore 1 2.30 0.163 0.71 – 7.43 2.27 0.143 0.76 – 6.78
Other Factors Restraint use – no Referent Referent Restraint use – yes 0.58 0.117 0.29 – 1.15 0.52 0.041 0.28 – 0.97 Test of the final overall model without imputed data (N = 299): X2 (df = 29) = 81.17, p < 0.001 Test of the final overall model with imputed data (N = 360): X2 (df = 29) = 86.53, p < 0.001
Multivariate associations of age with pressure ulcer outcome again became
statistically significant in the overall model with imputed values (p = 0.020, O.R. = 1.02,
95% C.I. = 1.00 – 1.04); however, multivariate associations of age with pressure ulcer
outcome were not statistically significant using imputed values (p = 0.082, O.R. = 1.02,
95% C.I. = 0.99 – 1.04). Braden Activity subscore, identified as a statistically significant
association with pressure ulcer in Block 2 (p = 0.039) of the 48-hour multivariate analysis
was no longer statistically significant in Block 3 (p = 0.705).
Using both the complete (p = 0.001, O.R. = 2.52, 95% C.I. = 1.43 – 4.44)
variables and variables with imputed data (p = 0.001, O.R. = 2.29, 95% C.I. = 1.38 –
109

3.83), male gender demonstrated a statistically significant association with pressure ulcer
at 48 hours prior to study enrollment. Similarly, low hematocrit demonstrated a
statistically significant association with pressure ulcer at 48 hours prior to study
enrollment with both complete (p = 0.030, O.R. = 0.94, 95% C.I. = 0.89 – 0.99) and
imputed data ((p = 0.017, O.R. = 0.95, 95% C.I. = 0.91 – 0.99). None of the Braden
subscale scores were statistically significantly associated with pressure ulcer in the final
model using variables obtained 48 hours to study enrollment.
Summary
Although the Braden subscale scores are statistically significantly associated with
pressure ulcer outcomes, the addition of other variables at both 24 and 48 hours did
contribute statistically significantly to the overall model. With the exception of nutrition,
all of the Braden subscale scores were statistically significant in unadjusted (univariate)
analysis. In multivariate analysis, Braden Nutrition (without imputed values), Activity
(without imputed values), and Moisture were statistically significantly associated with
pressure ulcer when analyzed with scores obtained 24 hours prior to study enrollment, but
did not show a statistically significant association with pressure ulcer when analyzed with
scores obtained 48 hours before study enrollment. Consequently, none of the Braden
subscores were uniquely identified as statistically significant predictors when analyzed
with their scores obtained 48 hours prior to study enrollment. Increased age and restraint
use, although not identified as statistically significant in unadjusted, did demonstrate
statistically significant associations with pressure ulcer when analyzed with data collected
110

at 24 and 48 hours prior to study enrollment. Male gender and low hematocrit were
statistically significantly associated with pressure ulcer in unadjusted and adjusted
analyses at both 24 and 48 hours prior to study enrollment.
Secondary Aim
The secondary aim of this study was to compare the frequency and magnitude of
pressure ulcer risk factors between critically ill patients that have progression of their
Stage I pressure ulcer during the ICU stay to those who do not have a progression of
their Stage I pressure ulcer during the ICU stay.
Stage I pressure ulcers were identified in 24 of the case subjects. Of those, four
(1.1%) subjects had their pressure ulcers deteriorate into a Stage II or worse during their
ICU stay. Ages of these four subjects ranged from 27 years to 74 years ( median = 58
years for entire sample), and length of ICU stay until a pressure ulcer developed ranged
from nine to 22 days (median = 7 days for the entire sample). Two were males. Low
hematocrit ranged from 24% to 36% (𝜒� = 28.0% for the entire sample). One of the four
subjects was quadriplegic requiring permanent ventilator support. Because of the low
percentage of those subjects that experienced a worsening pressure ulcer during their ICU
stay, no statistical inferences can be made.
111

CHAPTER V
DISCUSSION
This chapter provides an overview of the primary and secondary aims of this
dissertation research and findings for each of the aims are discussed relative to their
contributions to the conceptual model identified in Chapter II. Strengths and limitations
are presented and the implications of this research are discussed. Finally, an outline of
recommendations for future research is presented.
Primary Aim
To compare the frequency and magnitude of pressure ulcer risk factors between
critically ill patients that do and do not develop a pressure ulcer during their ICU stay and
evaluate their influence on the associations between the Braden subscales and pressure
ulcer outcome. To examine any temporal differences in importance of pressure ulcer risk
factors, they were measured at 48 hours and 24 hours prior to study enrollment.
Predictive Ability of the Braden Score in Critically Ill Patients
A hierarchical test of the independent variables initially controlled for the effects
of age and then tested for the added effect of the Braden subscale scores. As indicated
112

from the adjusted effects of the association after controlling for age, the Braden subscale
scores at 24 hours prior to study enrollment were statistically significant (p < 0.001 with
and without imputed data). A similar hierarchical test using Braden subscale scores
obtained 48 hours prior to study enrollment demonstrated that the added associations of
the Braden subscale scores after controlling for age were not statistically significant when
analyzed without imputed data (p = 0.100). When analyzed with imputed data, the added
effects of the Braden subscale scores did reach statistical significance (p = 0.047). The
findings of this study indicate that the Braden subscale scores reflect more of an
association with pressure ulcers when measured within 24 hours of pressure ulcer
occurrence than they do when measured within 48 hours of pressure ulcer occurrence.
The temporal relationship between Braden Scale and pressure ulcer has not been
widely evaluated in the literature (Brown, 2004). In their study of 843 subjects in tertiary
care, skilled nursing facilities (SNFs), and Veteran’s Administration Medical Centers
(VAMCs), Bergstrom, Braden, Kemp, Champagne and Ruby (1998) evaluated the
specificity and sensitivity of the Braden Scale on admission to the facility, 48 to 72 hours
after admission. A third measure (indicated as Time 3) was calculated as the time
between the last observation and first recorded pressure ulcer. Bergstrom et al.’s findings
indicated that Time 3 was least useful in pressure ulcer prediction in tertiary care settings
compared to VAMCs and SNFs, but the authors did not indicate the number of days
between risk score and pressure ulcers development.
Although the Braden Scale was not evaluated, Nijs et al. (2008) found that factors
affecting metabolic supply and demand such as dialysis, vasopressor use, and elevated
body temperature were statistically significantly associated with pressure ulcer outcome
113
when measured at 24 and 48 hours before the occurrence of a pressure ulcer. In their
study of 520 critically ill patients receiving care in a surgical unit, use of sedatives, a
component that theoretically diminishes a patient’s ability to minimize intensity and
duration of pressure, was found to be a protective factor 24 hours (p = 0.006, O.R = 0.30,
95% C.I = 0.13 – 0.70) and 48 hours (p = 0.004, O.R = 0.27, 95% C.I = 0.11 – 0.65).
Nijs et al. suggested that reduced muscle tension associated with sedative use may
facilitate preventive measures. Multivariate analyses in this study were conducted only
on variables that demonstrated a p-value ≤ 0.2 with univariate logistic regression, thereby
enhancing the chances of a Type I or II error in the study findings.
There are two possible explanations for the findings in this study. First, it is
possible that patients are assessed as low pressure ulcer risk (higher Braden subscale
scores) until there is visual evidence of skin damage, such as blanching erythema or
dermatitis, that leads to pressure ulcer development. This explanation assumes that the
presence of skin damage biases the rater toward lower (higher risk) Braden subscale
scores. A second explanation may lie with the acute nature of critically ill patients whose
pressure ulcer risk can change significantly over the course of hours. This explanation
favors Benoit and Mion’s (2012) idea that tissue tolerance serves as a moderating factor
between duration and intensity of pressure and pressure ulcer outcomes. Components of
tissue tolerance may be the critical determinates of pressure ulcers in critically ill
patients. Patients with depleted tissue tolerance reserve may be susceptible to acute
changes that pressure ulcers develop more quickly than they would in patients with better
tissue tolerance reserves. The implication of this second explanation is that the Braden
114
Score, when used alone, may lack the sensitivity to capture acute changes in tissue
tolerance that quickly lead to pressure ulcer development.
Statistically Significant Variables Assessing Tissue Tolerance for Pressure at 24 Hours
Indeed, when variables that assessed tissue tolerance were added to the
multivariate regression, male gender, increased age, lower hematocrit, and Braden
Nutrition and Moisture subscale scores were all statistically significant in their
associations with pressure ulcer outcome when measured at 24 hours prior to study
enrollment. All are included in Benoit and Mion’s (2012) conceptual model as affecting
tissue tolerance for pressure. Of the remaining variables analyzed in this study, only the
Braden subscale score for Activity and restraint use were identified as statistically
significant at 24 hours. Neither of these variables was considered by Benoit and Mion to
affect tissue tolerance, but do play a role in affecting magnitude and duration of pressure.
Gender
van Rijswijk (2001) and Sayar et al. (2008) questioned the significance of gender
as a pressure ulcer risk factor, citing conflicting findings in the published literature on the
influence of gender on pressure ulcer development. Fisher, Wells, and Harrison (2004)
postulated that females would be more prone to pressure ulcer development because
males tend to have better tissue tolerance for pressure due to higher muscle mass and
anabolic hormones. Males, however, tend to have less body fat than females,
115
theoretically reducing their ability to distribute pressure across the body surface (Nixon,
2001), thereby making males more vulnerable to pressure ulcer development.
Male gender was a statistically significant risk factor for pressure ulcer
development in both univariate and multivariate analysis findings in this study. This is
consistent with those results reported by Nonnemacher et al. (2008); however, female
gender as an important risk factor has also been reported. Lindgren et al., 2004 sampled
a mixed group of surgical patients (n = 286) and reported female gender to be statistically
significantly associated with pressure ulcers in multivariate analysis (p = 0.003; O.R. =
0.27, 95% C.I. = 0.11 – 0.68) although the odds ratios reported indicate female gender is
a protective factor. Furthermore, the women in Lindgren et al.’s study were significantly
older than males, and demonstrated higher risk for pressure ulcer development on
admission to the study, possibly explaining the findings. In a multisite study of 530
subjects admitted to a tertiary care facility and a county hospital, female gender was
identified as a risk factor with univariate analysis, but the variable did not maintain
significance in multivariate analysis (Lindgren et al., 2005). It is unclear if the sample
populations were shared between this study and the previous one by Lindgren et al.
published a year earlier. The population in Lindgren et al.’s 2005 study was reported to
include 286 surgical subjects- the same number of subjects included in Lindgren et al.’s
2004 study.
Because gender was not controlled for in this study, there was a disproportionate
representation of males (63.9%) in this study. This sampling bias could account for the
findings in this study.
116
Age
The relationship between increasing age and pressure ulcer incidence is well
documented in the literature. A PubMed search of the literature using the search terms
age and pressure ulcer risk with no limits returned 577 articles, indicating that the
relationship is well studied. The effects of age on pressure ulcer risk in the critically ill
patient population share the positive association documented for subjects with less acute
illness, and there is little evidence that the magnitude of the relationship between
increased age and pressure ulcers in critically ill patients is more pronounced. In their
study of 3,026 critically ill patients, Eachempati, Hydo, & Barie (2001) found increased
age to retain its statistical significance with multivariate analysis (p = 0.003; O.R. = 1.08,
95% C.I. = 0.003 – 0.013). Increased age was identified as statistically significant with
univariate analysis in two other studies of critically ill patients, but age did not maintain
its statistical significance in multivariate analyses. In their study of 332 critically ill
patients, Theaker et al., 2000 found that the odds of developing a pressure ulcer increased
by approximately 80% for each increase in year of age (p = 0.025; O.R. = 1.79, 95% C.I.
= 0.003 – 0.013). Papantonio, Wallop, & Kolodner (1994) reported categorical findings
for age in their study of 136 thoracic surgery patients. Subjects ≥ 70 years of age were
five times more likely to develop a pressure ulcer than subjects less than 70 years of age
(p = 0.001; O.R. = 5.38, 95% C.I. = 1.96 – 14.76).
Age did demonstrate a slight decrease in p-value from 48 hours (p = 0.020) to 24
hours (p = 0.014) when imputed values were used, and odds ratios remained
approximately the same (1.02 at 48 hours; 1.03 at 24 hours). One possible explanation
for the lack of statistical change for age in this study was the similar age ranges among
117
case and control patients. Age ranged between 51 and 70 years for 50.6% of subjects in
this study (controls = 46.1%; cases = 55.0%). Subjects older than 70 years accounted for
16.4% (controls = 16.7%; cases = 16.1%) of the study population. Patients older than 89
years were not enrolled in this study because of protective measures of human subjects
and concerns for this vulnerable population. The homogenous mix of age in this study is
representative of the population most likely to require intensive care during their hospital
stay and may explain the lack of statistical change in odds ratios and significance from 48
to 24 hours.
Hematocrit
Hematocrit levels were randomly missing in nine subjects, and values for this
variable were imputed. Lower hematocrit values demonstrated statistical significance
with univariate and multivariate analyses 24 and 48 hours prior to pressure ulcer
development using the variable with and without imputed data. This finding is consistent
with those reported in several studies of pressure ulcer risk factors. In studies of 149
acute care patients, Olson et al. (1996) found decreased hemoglobin on admission to be
univariately associated with pressure ulcer incidence. Strordeur, Laurent, and D’Hoore
(1998) found decreased hemoglobin on admission to be statistically significant in
univariate and multivariate analyses of 163 cardiac surgery patients. In studies of
critically ill patients, Lewicki et al. (1997) reported a statistically significant difference (p
= 0.004) between hematocrit values in 337 pressure ulcer positive and pressure ulcer
negative patients. Nijs et al. (2008) reported statistically significant univariate findings
for hemoglobin 48 hours prior to pressure ulcer development (p = 0.015; O.R. 0.78; 95%
C.I. = 0.64 – 0.95) in their study of 520 patients receiving care in a surgical ICU, but the
118

variable did not maintain its statistical significance with multivariate analysis. Theaker et
al. (2000) found anemia to be statistically significant when analyzed at both univariate (p
= 0.013; O.R. 3.23; 95% C.I. = 1.89 – 5.51) and multivariate (p = 0.013; O.R. 2.81; 95%
C.I. = 1.24 – 6.34) levels for 286 patients in a general ICU.
The findings in this study demonstrate stronger p-values at for both imputed and
non-imputed variables at 24 hours (p < 0.001) than the studies cited above, and similar p-
values for imputed and non-imputed variables at 48 hours (without imputed value, p =
0.030; with imputed values, p = 0.017) (see Table 4.8 and 4.10). The implications of this
finding are discussed below.
Braden Nutrition Subscale
Of the Braden subscales, Nutrition is the only one requiring some historical
knowledge of the patient (see Table 2.5). Temporary food intake restrictions, such as for
surgical procedures, do not adversely affect the Braden Nutrition subscale score.
Additionally, physicians and dieticians closely monitor nutritional status in the ICUs, and
aggressive measures provide adequate nutritional support during critical illness. No
studies were located that described statistical significance of Braden Nutrition subscore in
isolation; however, depleted protein stores are a common finding among critically ill
patients (Anthony, et al., 2000). In their study of 186 patients in a neurologic ICU, Fife
et al. (2001) did report low serum albumin to be statistically significant with pressure
ulcers (p = 0.033), but it is unclear how the variables for multivariate analysis were
selected, and no odds ratios or confidence intervals are reported. Perhaps the largest
study to demonstrate a statistically significant multivariate association between
nutritional status and pressure ulcer outcome was in Nonnemacher et al.’s (2008) study of
119

34,238 patients admitted to a large university hospital. Multivariate analysis in that study
demonstrated that patients with insufficient nutrition were 60% more likely to develop a
pressure ulcer than those patients who did not have nutritional insufficiency (p = 0.002,
O.R. = 1.61; 95% C.I. = 1.20 – 2.17). Eachempati et al. (2001) also reported similar
multivariate findings.
Measures of protein reserve did not show statistical significance in this study.
This finding is understandable given that the majority of both case and control subjects
had low protein levels (79.3% without imputed data and 76.9% with imputed data).
Braden Moisture Subscale
Braden’s Moisture subscale assesses threats to skin integrity in the conceptual
model described in Table 2.4, and is theorized to affect the tissue’s extrinsic tolerance for
pressure. Prolonged exposure of skin to moisture contributes to skin integrity problems
(Nixon, 2001; Sayar et al., 2008), especially with reference to urinary and fecal
incontinence. Several studies identified some element of moisture (perspiration, urinary
or fecal incontinence) as a statistically significant risk factor in univariate or multivariate
analysis of their findings. In their study of 286 patients admitted to an urban teaching
hospital, Allman, et al. (1995) found high incidence of fecal incontinence to be a
significant risk factor with univariate analysis ( p = 0.04, no O.R. reported). Halfens, et
al. (2000) found moisture to co-exist with the summative Braden score (that includes the
Moisture subscale) as a multivariate statistically significant risk factor (p < 0.01, O.R. =
2.35, 95% C.I. = 1.40 – 3.94) in 320 subjects enrolled in a multi-center study.
120
Statistically Significant Variables Assessing Intensity and Duration of Pressure at 24 Hours
Braden Activity Subscale
In the study by Lindgren et al. (2004, n = 530) decreased physical activity was
identified as a statistically significant predictor of pressure ulcer incidence in univariate
analysis of non-ICU patients (p = 0.029, O.R. = 0.77, 95% C.I. = 0.62 – 0.97). In a study
of 3026 critically ill patients, Eachempati et al. (2001) identified number of days in bed to
be a statistically significant predictor with both univariate (p = 0.0328) and multivariate
analysis (p = 0.0064). The odds ratio reported in Eachempati et al.’s study is 1.05 and the
95% confidence interval is reported as -0.0013 – 0.0156. It is unclear with which p-value
the odds ratio and confidence interval are associated.
Restraints
Use of upper limb restraints is common in ICUs as a method to prevent tube
dislodgement by patients. There is some evidence in the literature suggesting that
restraint use pre-disposes patients to pressure ulcers (Castle & Engberg, 2009), but the
association has not been widely explored in the literature. This study demonstrated that
restraint use was not statistically significantly associated with pressure ulcer incidence
with univariate analysis, but did show statistical significance as a protective factor in
multivariate analysis at 24 hours prior to study enrollment with imputed values (p =
0.025; O.R. 0.43; 95% C.I. = 0.20 – 0.89) and without imputed values (p = 0.022; O.R.
0.42; 95% C.I. = 0.19 – 0.88). One possible explanation for this finding is that restraint
121
use reduces the amount of friction and shear experienced by the patient by reducing
movement across the surface of the bed. Another explanation for this finding are the
regulatory and institutional mandates for repositioning restrained patients every two
hours.
Non-Significant Variables Assessing Pressure Ulcer Risk
Remaining Braden subscales
The Sensory, Activity, Mobility, and Friction/Shear subscales were not
statistically significant in multivariate tests of the model in this study. They are all
variables used to assess intensity and duration of pressure identified in Benoit and Mion’s
conceptual model (2012). As discussed earlier, the findings of this study suggest that
tissue tolerance for pressure may play a more important role in pressure ulcer
development than does pressure relief in critically ill patients, especially when considered
within the context of the enhanced statistical significance of the findings at 24 hours prior
to study enrollment. All of the remaining Braden subscales are possibly affected by
sedative use, a common practice in ICUs. As discussed earlier, Nijs et al. (2008)
identified sedative use as a protective factor. One possible explanation for the findings in
this study and the study by Nijs et al. is that sedated patients are more receptive to
nursing interventions to reduce intensity and duration of pressure, such as repositioning;
however, Nijs et al. also report nursing interventions identified as prevention measures
and frequency of turning to be positively associated with pressure ulcer outcome. Nijs et
122
al.’s study design was prospective, so the relationship between nursing intervention and
pressure ulcer outcome may be causal. As indicated earlier, Nijs et al.’s multivariate
analysis consisted of only those variables that demonstrated p-values of <0.20.
Nonnemacher et al. (2008) reported contradictory findings in their study of 34,238
patients admitted to a large university hospital. Those findings indicated that sedative use
(p = 0.0006, O.R. = 1.61, 95% C.I. = 1.23 – 2.12) and limited mobility and activity (p
<0.0001, O.R. = 4.42, 95% C.I. = 3.50 – 5.59) were statistically significant in
multivariate analysis and increased odds of pressure ulcer development. One possible
explanation for this finding is that Nonnemacher et al. collected dichotomous data and
combined variables scored as ‘unknown’ with ‘no’ responses, possibly increasing the
chances for a Type I or II error.
Other variables assessing pressure distribution capacity
Body mass index. There is strong evidence in the literature that lower BMIs are
disproportionately related to pressure ulcer development. The relationship between BMI
and pressure ulcer development is a function of poor nutritional status and resulting loss
of body fat that results in exaggerated bony prominences (Jirika et al., 1995) with a
consequent loss of pressure distribution capacity. In a prospective study of 286 patients
admitted to an urban teaching hospital, Allman et al. (1995) identified lower BMI as a
pressure ulcer risk factor (p = 0.03; O.R. 2.18; 95% C.I. = 1.05 – 4.52). Fife et al. (2001)
reported a negative correlation between pressure ulcer incidence and body mass (r = -
0.258, p = 0.002) in their study of 186 patients in a neurologic ICU. Similarly, Lindgren
et al. (2004) identified increased weight as a protective factor (p= 0.002; O.R. 0.96; 95%
C.I. = 0.94 – 0.99) as did Tschannen, Baates, Talsma, and Guo (2012) in their
123
retrospective analysis of 3225 patient records (p< 0.001; O.R. 0.97; 95% C.I. = 0.95 –
0.98). In a retrospective examination of 64,372 patient records, VanGilder, MacFarlane,
Meyer, and Lachenbruch (2009) found a higher prevalence of pressure ulcers in
underweight patients (25.3%) than in normal weight or obese patients, but do not
hypothesize about the reason for the finding. Categorical measures of BMI were not
identified as statistically significant at either univariate or multivariate analyses in this
study. One explanation for this finding is the lack of underweight subjects enrolled in
this study (n = 20; 5.6%) compared to the distribution of normal weight (n = 101; 28.1%),
overweight (n = 107; 29.7%) and obese (n = 132; 36.7%) subjects.
Variables assessing metabolic supply
Nicotine use. The study findings indicate that nicotine use was not a statistically
significant predictor of pressure ulcer formation with univariate or multivariate analyses.
Nicotine use is a component of the Waterlow Pressure Ulcer Prevention/Treatment Policy
(Copyright by J. Waterlow, 1985; Revised, 2005). It was included in the conceptual
model because of statistically significant findings (p < 0.001; O.R. 1.18; 95% C.I. = 1.13
– 1.23) involving high Waterlow risk scores and pressure ulcer incidence (Anthony, et
al., 2000) and the positive relationship between nicotine use and vascular disease.
Multivariate analyses reported by Nijs et al. (2008) in a study of 520 subjects in a
surgical ICU indicated that a history of vascular disease was statistically significant for
pressure ulcer incidence at 24 hours in multivariate analysis (p < 0.001; O.R. 4.51; 95%
C.I. = 1.99 – 10.24) and 48 hours (p = 0.001; O.R. 2.85; 95% C.I. = 1.29 – 6.30).
Nonnemacher et al. (2008) reported similar findings with vascular disease after
multivariate analysis (p = 0.032; O.R. 1.80; 95% C.I. = 1.05 – 3.08) in their study of
124

34,238 subjects admitted to a large university hosptial. Because medical diagnoses were
not collected as part of this study, it is unclear if there is any association between nicotine
use and vascular disease. Because populations from mixed ICU types were included, it is
possible that any significance that nicotine use had with pressure ulcer incidence was
obfuscated by medical diagnoses unrelated to vascular disease – a potential result of
nicotine use.
Vasopressor use. The findings in this study indicate that vasopressor use was not
a statistically significant predictor of pressure ulcer formation with univariate or
multivariate analyses. This finding is not consistent with the results reported in the
literature, although the studies evaluating vasopressor use as a pressure ulcer risk factor
are limited. Nijs et al. (2008) identified low dose dopamine (≤ 5 µg/kg/min) to be an
independent predictor of risk 24 hours prior to prior to pressure ulcer development in
520 subjects with multivariate analysis (p= 0.003; O.R. 6.05; 95% C.I. = 1.88 – 19.54).
Similarly, Theaker et al. (2000) found norepinephrine to be an independent predictor of
pressure ulcers in a multivariate analysis of 22 risk factors (p< 0.001; O.R. 8.11; 95% C.I.
= 3.64 – 18.0) in a study of 286 general ICU patients. In a more recent cohort study of
3,225 critically ill patients, Tschannen et al. (2012) identified use of vasopressors to be
statistically significant with multivariate analysis (p = 0.03; O.R. 1.3; 95% C.I. = 1.03 –
1.73). Only variables with a univariate p-value of < 0.30 were selected for inclusion into
the multivariate analysis conducted by Tschannen et al. which may contribute to Type I
or II error in the findings.
The findings in this study are difficult to explain, given that norepinephrine was
the most commonly used vasopressor in case and control subjects (26.7%) compared to
125
the other vasopressors identified for study. Norepinephrine works to increase systemic
vascular resistance by stimulating ɑ-1 and ɑ-2 adrenergic receptor cites in the peripheral
vasculature (Klabunde, 2011), and has been associated with extremity ischemia when
used at high doses for long periods. Because only total amounts of vasopressor infusions
were collected instead of infusion rates, any significance that higher infusion rates may
have on pressure ulcer incidence were not captured. Additionally, the lack of vasopressor
infusions necessitated the use of vasopressor as a categorical variable, possibly
contributing to a Type II error with regard to vasopressor use.
Mean arterial pressure. Univariate analyses of lowest recorded MAP was
statistically significantly associated with pressure ulcer development at 24 and 48 hours
prior to study enrollment; however, it did not maintain its statistical significance with
multivariate analysis. A plausible explanation of this finding is because extremes of
arterial pressures are treated with medications, such as vasopressors, to maintain arterial
pressures within a prescribed normal physiologic range.
Oxygen saturation of hemoglobin. No measure of oxygen saturation of
hemoglobin demonstrated statistical significance at either the univariate or multivariate
level of analysis. This finding is consistent with ICU practices to provide supplemental
oxygen as needed to keep oxygen saturations values near to 100%.
Variables assessing metabolic demand
Steroid use. Steroid use did not demonstrate statistical significance at either the
univariate or multivariate level of analysis in this study. Steroid use is included in
Waterlow’s pressure ulcer risk assessment and was included in the conceptual model
because of Anthony et al.’s (2000) finding that summative Waterlow scores were
126
statistically significant with multivariate analysis of their findings (p < 0.001; O.R. 1.18;
95% C.I. = 1.13 – 1.23). In their study of 163 cardiac surgery patients, Stordeur et al.
(1998) identified post-operative corticosteroid use as being statistically significant in a
multivariate analysis (p = 0.020). No odds ratios or confidence intervals were presented
in the article. Additionally, the multivariate analysis included only those variables that
were statistically significant with univariate analysis, possibly contributing to a Type I or
II error in Stordeur et al.’s interpretation of their study results.
Strengths and Limitations
Strengths and limitations of this study were considered within the contexts of the
study design, data analysis strategies, and the clinical utility of the findings. These areas
are discussed in this section.
Study Design
The use of a prospective cohort case-control design was a strength of this study
because it supported the investigation into potential causes of pressure ulcer incidence
(Cummings, Newman, et al., 2007) and allowed for the examination of temporal
sequencing. Spurious associations due to bias resulting from the study design were
minimized by enrolling sample subjects from the targeted ICU patient population. Some
measures of predictor variables such as protein reserve, medication administration, and
Braden subscale scoring by staff nurses may have contributed to systematic errors
because of reduced accuracy of those measures. Spurious associations due to chance
were minimized by use of a case-control study design where subjects were individually
127

matched on ICU type, ICU length of stay before pressure ulcer development (cases), and
severity of illness. These matching criteria were considered potentially confounding
variables in this study. A limitation of this study was that case-control subjects were not
matched on age or medical diagnoses that are other potential confounding variables in
this study.
Analysis Strategies
To evaluate the relationships among the variables in this study adequately, it was
necessary to apply statistical methods that allowed for paired analysis of case-control
subjects and that would allow for evaluation of one set of variables while controlling for
potential confounding variables. Analytic strategies that facilitated these statistical
evaluations were a strength of this study. Wilcoxon’s Signed Rank test and McNemar’s
Chi Square were used to evaluate differences in the dependent variables for descriptive
analysis. Hierarchical tests controlling for age, then Braden scores, allowed for statistical
evaluations of the strength of the associations with each variable set. As noted in the
previous section, the final block of the model demonstrated that the added associations of
the remaining variables after controlling for age and Braden subscale scores enhanced the
statistical significance of the model compared to the effects of the Braden subscales
alone.
Clinical Utility
A strength of this study was that it identified risk factors for pressure ulcer
development that enhance the predictive ability of the Braden RAS with variables that are
easily obtained in the ICU setting. Integrating age, gender, and hematocrit levels into a
modified Braden RAS would not require extensive effort from clinical staff, especially in
128

facilities where computerized medical records are readily available for laboratory results.
Another strength of this study is that the findings can easily be implemented in smaller
community hospitals that do have the resources of tertiary care medical centers.
Implications
The implications of this study are related to healthcare policy and guiding nursing
practice in the prevention of pressure ulcers. They are discussed in this section.
Implications for Healthcare Policy
As discussed in Chapter I, there is a lack of empirical evidence needed to link
nursing quality of care and pressure ulcer development (Needleman et al., 2007). Despite
the lack of empirical evidence, the NQF placed nosocomially acquired pressure ulcers
among outcomes considered sensitive to nursing care (Kurtzman & Corrigan, 2007).
Using the NQF’s list of “never events” published in 2001, The Centers for Medicare and
Medicaid Services (CMS) began to scrutinize the Diagnostic Related Group (DRG)
complication codes related to the NQF’s never events (Wachter, Foster, & Dudley, 2008).
In October 2008, CMS began to stop payments for three hospital-acquired infections and
five complications of care. Pressure ulcers were among the complications of care that
CMS included in that list (Wachter et al., 2008). Wachter et al. (2008) suggested that
these sanctions are reasonable if four criteria concerning the never event are met. The
criteria include adequate evidence that the event is preventable, the event is accurately
measurable, the event results in clinically significant patient harm, and that it is possible
129

to differentiate among those events that are nosocomial versus those that are present on
admission to the healthcare institution (Wachter et al., 2008).
The findings from this study tend to refute the NQF’s assertion that pressure ulcer
outcomes are primarily functions of nursing care quality. Hematocrit levels demonstrated
a statistically significant univariate (p < 0.001) and multivariate (p < 0.001 within 24
hours; p = 0.030 within 48 hours) association with pressure ulcer incidence. The decision
to transfuse blood lies within the domain of medicine. Because of limited resources,
blood transfusion policies tend to be conservative and the risks of anemia compared to
the risks of transfusions are evaluated carefully (Shader, Javidroozi, Ozawa, & Hare,
2011). Enhanced collaboration on pressure ulcer reduction strategies among providers
and nursing staff will promote shared responsibility for pressure ulcer prevention by
considering more aggressive strategies, such as blood transfusion, that are outside the
purview of nursing.
Implications for Nursing
The results of this study have the potential to enhance the specificity of the
Braden score in critically ill patients. As discussed in Chapter II (Table 2.3) the
specificity of the Braden score ranges from 26% to 77.8% in studies of critically patients
with cutoff scores between 14 and 16 and from 40.5% to 100% in acute care patients with
cutoff scores between 16 and 20. Additionally, the findings of this study indicate that the
Braden Scale, when used alone, does not adequately capture pressure ulcer risk at 48
hours prior to pressure ulcer development, suggesting that the tool lacks the sensitivity
required to identify rapidly changing moderators of pressure ulcer incidence in critically
ill patients. Augmenting the Braden RAS with the findings in this study may provide
130

higher sensitivity levels in critically ill and acute care patients. The enhanced sensitivity
would allow nursing staff to target prevention measures more efficiently.
Recommendations for Future Research
Critically ill patients are a vulnerable and understudied population with regard to
pressure ulcer risk factors. Research is needed that is directed at better understanding
risk factor measurement strategies and pressure ulcer etiology. This dissertation research
contributes to the body of knowledge about risk factors, but more work is needed to
enhance the understanding of pressure ulcer risk factors.
A first step for future research is to determine appropriate measurement strategies
for risk factors. The decision to evaluate some risk factors, such as medication
administration and Braden subscale scores, was primarily based on clinical experiences
of the researcher with input from the dissertation committee. Expanded data collection
timeframes in future research will provide insight into the optimum time intervals in
which to collect data.
A second goal of future research is to evaluate medical diagnoses and any
confounding effects that exists between pressure ulcer outcomes and other variables. For
example, some studies have identified cancer as having a statistically significant
relationship to pressure ulcers (Flattau & Blank, 2012; Fromantin et al., 2011); however,
it is unclear if cancer is the direct cause of the pressure ulcer or if cancer is associated
with another variable, such as malnutrition and cachexia, which is responsible for
pressure ulcer development. Another example is the effect of surgery and surgical
131
procedures on pressure ulcer development. Several studies have evaluated surgery as a
pressure ulcer risk factor; however, standard approaches to studying the surgical variable
are lacking. A better understanding of the relationship between disease states and
pressure ulcer outcomes may have implications for healthcare policy in the future.
A third direction for future research involves hospital processes that may
contribute to pressure ulcer development. Multiple studies identified surgical procedures
as a statistically significant effect on pressure ulcer incidence (Nonnemacher et al., 2008;
Schoonhoven, et al., 2002). The limited understanding of pressure ulcer etiology
combined with the complexity of hospital processes impedes the ability to discern which
processes need improvement. Patients with long term ICU stays requiring multiple
surgeries may develop a pressure ulcer that is assigned incorrectly to the care received in
the ICU. A better understanding of the processes surrounding high risk areas such as
ICUs and operating rooms will help to focus prevention and improvement efforts.
132

Appendix A
Data Management and Study Enrollment Forms
Screening Tracking Tool - Example
Consent Tracking Tool – Example
Date Screened ROOM NO. SCREENED AS ELIGIBLE? REASON NOT ELIGIBLE? CODE 3/7/2011 8633 CASE N PU w/I 48 hours admission 8 Sacrum I
4/25/2011 8615 CASE N Admitted to ICU w/ PU 2 Buttock, R/L II10/17/2011 8642 CASE N Admitted w/ PU 2 Sacrum II
8/7/2011 8615 CASE N Not a Pressure Ulcer 1 R Ishcium II12/22/2010 8656 CASE N Admitted to ICU w/ PU 2
1/27/2011 8641 CASE N Admitted to ICU w/ PU 2 L Buttock/I5/4/2011 NA CONTROL N Low Vent 55/9/2011 8619 CASE N PU w/I 48 hours admission 8 Sacrum II2/7/2011 8659 CASE N Admitted to ICU w/ PU 2 L Buttock 4
5/15/2011 8639 CASE N Admitted to ICU w/ PU 2 L Hip IV7/6/2011 8603 CASE N Admitted to ICU w/ pu 2 L Hip IV
1/23/2012 8655 CASE N Admitted w/ PU 2L Occiput DTI: L ishcium DTI
8/31/2011 8615 CASE N Admitted w/ PU 2 Sacrum II3/27/2011 8657 CASE Y
10/21/2010 8613 CASE N Stage I 37/6/2011 8649 CASE N Admitted to ICU w/ pu 2 Sacrum II
12/22/2010 8625 CASE N PU w/I 48 hours admission 86/1/2011 8641 CASE N Admitted to ICU w/ PU 2 Sacrum I
10/17/2011 8625 CASE N Admitted w/ PU 2 Sacrum I5/18/2011 8607 CASE N PU w/I 48 hours admission 8 Sacrum II1/27/2011 8621 CASE N Admitted to ICU w/ PU 2 Sacrum 2
10/27/2011 8631 CASE N Admitted w/ PU 2R heel, ustg; L/R scrotum II
5/1/2011 8613 CASE N PU w/I 48 hours admission 8 Sacrum II
ROOM # CASE/CONTROL DATE/TIME 1ST ATTEMPT CONSENT OBTAINED ? (Yes, No, Refused) DATE/TIME 2ND ATTEMPT
CONSENT OBTAINED ? (Yes, No, Refused) DATE/TIME PHONE ATTEMPT
CONSENT OBTAINED ? (Yes, No, Refused) CONSENT WAIVED
CONTROL
CONSENT WAIVED-D/C at time of enrolloment
CASE 5/23/2011 YCASE 6/7/2011 RefusedCase 1/12/2011 N 1/13/2011 N 1/13/2011 YCASE 8/29/2011 Y 8/30/2011 Y
CONTROL
CONSENT WAIVED-D/C at time of enrolloment
CASE 10/27/2011 YCASE 12/2/2011 N 12/13/2011 YCASE 5/5/2011 YCASE 4/26/2011 Y
133

Informed Consent Tool-Case Subject This informed consent applies to Adults. Name of participant: _________________________________________________________ Age: ___________ The following is given to you to tell you about this research study. Please read this form with care and ask any questions you may have about this study. Your questions will be answered. Also, you will be given a copy of this consent form. You do not have to be in this research study. You can stop being in this study at any time. If we learn something new that may affect the risks or benefits of this study, you will be told so that you can decide whether or not you still want to be in this study. 1. What is the purpose of this study?
You are being asked to take part in this research study because you have developed a pressure ulcer (bed sore) in an intensive care unit. The purpose of this study is to see if you have any additional risk factors that may have caused the pressure ulcer compared to other patients in an ICU that have not developed a pressure ulcer (bed sore). Examples of risk factors that this study evaluates are your average blood pressure, some medications that you may have received, your age and weight, and certain health problems that you may have had before you were admitted to the hospital, such as diabetes. Certain laboratory values from your blood work will also be considered, such as hemoglobin and hematocrit (the amount of red blood cells you have) and albumin (the amount of protein in your blood).
2. What will happen and how long will you be in the study?
Some types of wounds and skin problems are easily confused with a pressure ulcer (bed
sore). For that reason, either myself or another investigator will need to look at the wound to make sure it is a pressure ulcer (bed sore). Either myself or another investigator will only look at your skin wound during normal routines that you will experience during your ICU stay. Examples are when your nurse routinely changes the dressing on the wound or positions you to evaluate the wound. Your nurse will be in the room when we look at the wound and will be doing all of the treatments on you. After myself or the other investigator have looked at the wound and have determined that it is a pressure ulcer (bed sore), you will be entered into the study. We will then look at your medical record and use the data about your risk factors to record in a database. The data from your medical record will contain your medical record number so that we can make sure that we have all the data entered correctly. At the end of the study, your medical record number is removed, and the data from your medical record will be analyzed mathematically to see if your risk factors made a difference in why you developed the pressure ulcer (bed sore). We will be evaluating the pressure ulcer (bed sore) only one time.
. 3. Costs to you if you take part in this study:
There is no cost to you for taking part in this study. However, you are still responsible for paying for the usual care you would normally receive for the treatment of your illness. This includes treatments and tests you would need even if you were not in this study. These costs will be billed to you and/or your insurance.
134

4. Side effects and risks that you can expect if you take part in this study:
There are no side effects that are associated with this study because the study does not involve additional or different treatment than you would normally receive because of your illness. The risks involved in this study are minimal and include possible loss of anonymity because your medical record number will be associated with the data we collect about you from the medical record. Multiple safe-guards are in place to prevent this from happening as described in section 13, below. Additional minimal risks involve those associated with routine care in the ICU, such as repositioning in bed and possibly losing a tube that has been inserted as part of your care. Your nurse is experienced at protecting you from accidentally losing a tube and will be the one helping you to turn or reposition in bed.
4. Risks that are not known:
NONE
6. Payment in case you are injured because of this research study:
If it is determined by Vanderbilt and the Investigator that an injury occurred as a direct result of the tests or treatments that are done for research, then you and/or your insurance will not have to pay for the cost of immediate medical care provided at Vanderbilt to treat the injury. There are no plans for Vanderbilt to pay for the costs of any additional care. There are no plans for Vanderbilt to give you money for the injury.
7. Good effects that might result from this study: a) The benefits to science and humankind that might result from this study. Patients in
ICUs get pressure ulcers (bed sores) more frequently than do other hospitalized patients. This study will help to identify risk factors specific to ICU patients that cause them to get pressure ulcers (bed sores) more frequently than do other patients. If we can identify those risk factors before the pressure ulcer (bed sore) develops, then we can take steps to prevent them.
b) The benefits you might get from being in this study. There are no benefits to you from participating in this study. 8. Other treatments you could get if you decide not to be in this study:
Your treatment will be the same if you participate in the study or not.
9. Payments for your time spent taking part in this study or expenses:
You will not be paid for your time spent participating in this study.
10. Reasons why the study doctor may take you out of this study: You may be removed from the study data base if your are discharged from the ICU before either myself or the co-investigator can look at your wound to determine if it is a pressure ulcer (bed sore) or if you require CPR within 48 hours of the time that the nurse first noticed the wound.
11. What will happen if you decide to stop being in this study?
135

If you decide to stop being part of the study, you should tell either myself of the co-investigator.
12. Who to call for any questions or in case you are injured:
If you should have any questions about this research study or if you feel you have been hurt by being a part of this study, please feel free to contact Richard Benoit at 322-6565 or the Faculty Advisor, Dr. Lorraine Mion at 343-7098. If you cannot reach the research staff, please page Richard Benoit at 835-7701
For additional information about giving consent or your rights as a person in this study, to discuss problems, concerns, and questions, or to offer input, please feel free to call the Vanderbilt University Institutional Review Board Office at (615) 322-2918 or toll free at (866) 224-8273.
13. Confidentiality: All data will be collected by either Richard Benoit, the Principal Investigator (PI) or Carolyn Watts, co-investigator, using a paper data collection form. Immediately after the data has been collected on the paper form, the completed forms will be stored in a locked file cabinet in the PI’s locked office in the SICU at Vanderbilt University Hospital. Data will then be transcribed from the paper data collection sheets into Vanderbilt’s secured data base by the PI. The paper data collection sheets will remain under double lock at Vanderbilt until the completion of the study, at which time they will be placed in a shredder box located near the PI’s office in the SICU. The medical record number will remain attached to the protected health information until the study’s completion and the PI is satisfied that the data is complete and accurate. At that time, the records will be de-identified by removing the medical record number. Only Richard Benoit and Carolyn Watts will have access to the paper data collection forms. After the information has been entered into Vanderbilt’s secured data base, Richard Benoit, Carolyn Watts, Drs. Lorraine Mion and Anne Minnick, the faculty advisors, Dr. Mary Dietrich, the statistician, and Dr. Oliver Gunter, the physician advisor, will have access to the database.
14. Authorization to Use/Disclose Protected Health Information
All efforts, within reason, will be made to keep your protected health information (PHI) private. PHI is your health information that is, or has been gathered or kept by Vanderbilt as a result of your healthcare. This includes data gathered for research studies that can be traced back to you. Using or sharing (“disclosure”) such data must follow federal privacy rules. By signing the consent for this study, you are agreeing (“authorization”) to the uses and likely sharing of your PHI. If you decide to be in this research study, you are also agreeing to let the study team use and share your PHI as described below. As part of the study, Richard Benoit and his study team may share the results of your study and/or non-study linked information such as lab values,demographic variables, and severity of the pressure ulcer (bed sore) as well as parts of your medical record, to the groups named below. These groups may include people from the Federal Government Office for Human Research Protections, the Vanderbilt University Institutional Review Board, National Database of Nursing Quality Indicators (NDNQI), and the National Pressure Ulcer Advisory Panel (NPUAP). Federal privacy rules may not apply to these groups; they have their own rules and codes to assure that all efforts, within reason, will be made to keep your PHI private. Vanderbilt may give or sell your health data, without identifiers, to others or use it for other research projects not listed in this form. Vanderbilt, Richard Benoit and his staff will comply
136
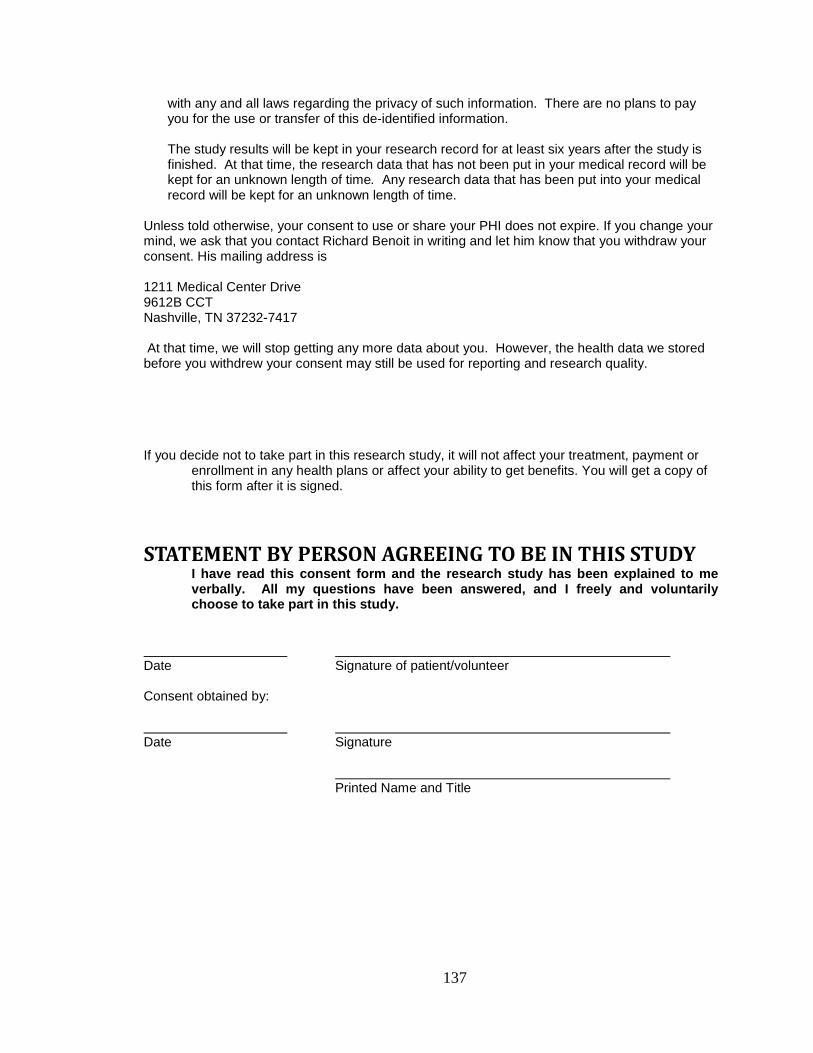
with any and all laws regarding the privacy of such information. There are no plans to pay you for the use or transfer of this de-identified information. The study results will be kept in your research record for at least six years after the study is finished. At that time, the research data that has not been put in your medical record will be kept for an unknown length of time. Any research data that has been put into your medical record will be kept for an unknown length of time.
Unless told otherwise, your consent to use or share your PHI does not expire. If you change your mind, we ask that you contact Richard Benoit in writing and let him know that you withdraw your consent. His mailing address is 1211 Medical Center Drive 9612B CCT Nashville, TN 37232-7417 At that time, we will stop getting any more data about you. However, the health data we stored before you withdrew your consent may still be used for reporting and research quality. If you decide not to take part in this research study, it will not affect your treatment, payment or
enrollment in any health plans or affect your ability to get benefits. You will get a copy of this form after it is signed.
STATEMENT BY PERSON AGREEING TO BE IN THIS STUDY I have read this consent form and the research study has been explained to me
verbally. All my questions have been answered, and I freely and voluntarily choose to take part in this study.
Date Signature of patient/volunteer
Consent obtained by: Date Signature Printed Name and Title
137

SURROGATE RIDER-CASE PATIENT I, __________ [name of decision-maker/surrogate], am the ____________ __________ [state relationship to participant] of __________ [state participant’s name]. I have read the informed consent document or it has been explained to me. I have had the opportunity to ask any questions and all of my questions have been answered. I believe participating in this research would be in the interests of [participant’s name] and is consistent with what he/she would have decided had he/she been able to do so. Your decision to allow your family member/friend to participate in this research study is voluntary. You may choose not to allow his/her participation and he/she will receive the same treatments. The decision not to participate in the research will not affect his/her healthcare/services or other rights. You are also free to withdraw him/her from this study at any time. In the event new information becomes available that may affect the risks or benefits associated with this research study or your willingness to allow continued participation in this research study, you will be notified so that you can make an informed decision whether or not to continue your family member/friend’s participation in this study. Your family member/friend will periodically be re-evaluated for the capacity to give consent. If he/she is found to be capable, continued participation in this study would only occur with his/her consent. ________________________________________________ ___/___/___ Signature of Health Care Decision-Maker/Surrogate Date
________________________________________________ ___/___/___ Signature of Witness Date
________________________________________________ ___/___/___ Name and Signature of person obtaining consent Date
138

Informed Consent Tool – Case Subject This informed consent applies to Adults. Name of participant: _________________________________________________________ Age: ___________ The following is given to you to tell you about this research study. Please read this form with care and ask any questions you may have about this study. Your questions will be answered. Also, you will be given a copy of this consent form. You do not have to be in this research study. You can stop being in this study at any time. If we learn something new that may affect the risks or benefits of this study, you will be told so that you can decide whether or not you still want to be in this study. 5. What is the purpose of this study?
You are being asked to take part in this research study because you are a patient in an intensive care unit who has not developed a pressure ulcer (bed sore). The purpose of this study is to see if any risk factors you may have for pressure ulcer development are different from other patients that have developed a pressure ulcer. Examples of risk factors that this study evaluates are your average blood pressure, some medications that you may have received, your age and weight, and certain health problems that you may have had before you were admitted to the hospital, such as diabetes. Certain laboratory values from your blood work will also be considered, such as hemoglobin and hematocrit (the amount of red blood cells you have) and albumin (the amount of protein in your blood).
6. What will happen and how long will you be in the study?
Once you give permission, one of the study team will go to your medical record and use
risk factor information that has already been collected as part of your routine care at Vanderbilt. There will be no additional tests or procedures performed as a result of your entry into the study. The data from your medical record will contain your medical record number so that we can make sure that we have all the data entered correctly. At the end of the study, your medical record number is removed, and the data from your medical record will be analyzed mathematically to see if your risk factors made a difference in why you did not develop a pressure ulcer (bed sore).
. 7. Costs to you if you take part in this study:
There is no cost to you for taking part in this study. However, you are still responsible for paying for the usual care you would normally receive for the treatment of your illness. This includes treatments and tests you would need even if you were not in this study. These costs will be billed to you and/or your insurance.
4. Side effects and risks that you can expect if you take part in this study:
There are no side effects that are associated with this study because the study does not involve additional or different treatment than you would normally receive because of your illness. The risks involved in this study are minimal and include possible loss of anonymity because your medical record number will be associated with the data we
139
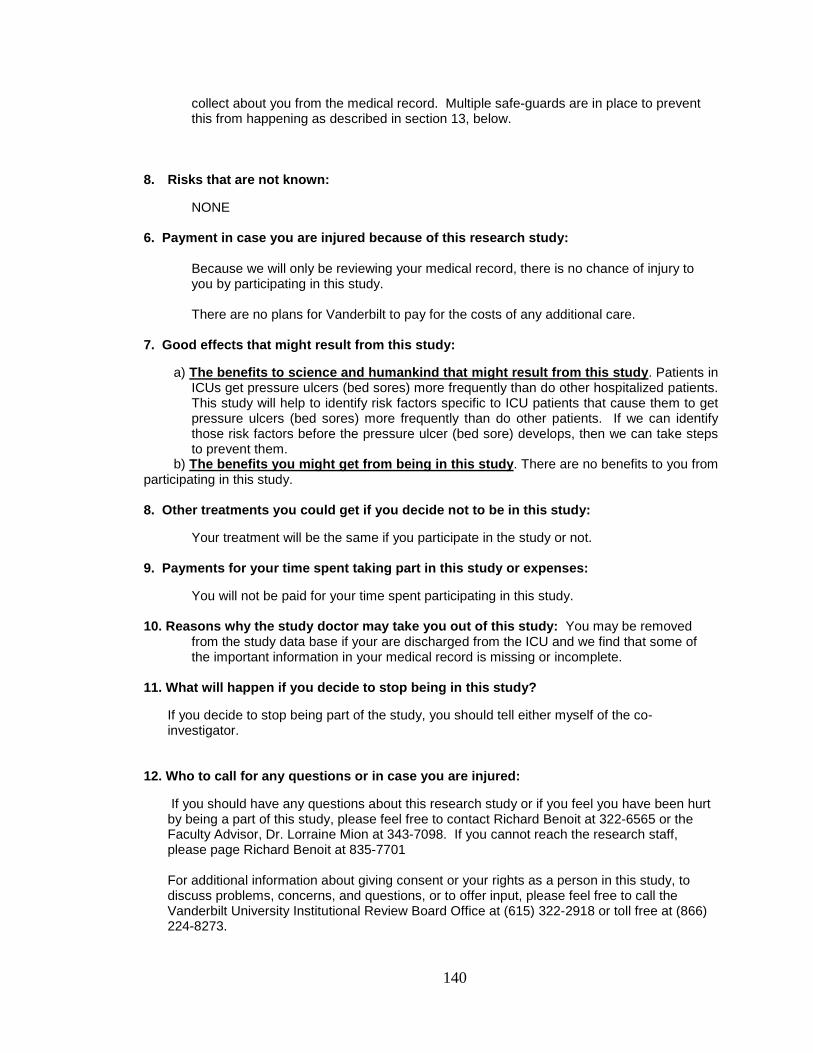
collect about you from the medical record. Multiple safe-guards are in place to prevent this from happening as described in section 13, below.
8. Risks that are not known:
NONE
6. Payment in case you are injured because of this research study:
Because we will only be reviewing your medical record, there is no chance of injury to you by participating in this study. There are no plans for Vanderbilt to pay for the costs of any additional care.
7. Good effects that might result from this study: a) The benefits to science and humankind that might result from this study. Patients in
ICUs get pressure ulcers (bed sores) more frequently than do other hospitalized patients. This study will help to identify risk factors specific to ICU patients that cause them to get pressure ulcers (bed sores) more frequently than do other patients. If we can identify those risk factors before the pressure ulcer (bed sore) develops, then we can take steps to prevent them.
b) The benefits you might get from being in this study. There are no benefits to you from participating in this study. 8. Other treatments you could get if you decide not to be in this study:
Your treatment will be the same if you participate in the study or not.
9. Payments for your time spent taking part in this study or expenses:
You will not be paid for your time spent participating in this study.
10. Reasons why the study doctor may take you out of this study: You may be removed from the study data base if your are discharged from the ICU and we find that some of the important information in your medical record is missing or incomplete.
11. What will happen if you decide to stop being in this study?
If you decide to stop being part of the study, you should tell either myself of the co-investigator.
12. Who to call for any questions or in case you are injured:
If you should have any questions about this research study or if you feel you have been hurt by being a part of this study, please feel free to contact Richard Benoit at 322-6565 or the Faculty Advisor, Dr. Lorraine Mion at 343-7098. If you cannot reach the research staff, please page Richard Benoit at 835-7701
For additional information about giving consent or your rights as a person in this study, to discuss problems, concerns, and questions, or to offer input, please feel free to call the Vanderbilt University Institutional Review Board Office at (615) 322-2918 or toll free at (866) 224-8273.
140
15. Confidentiality: All data will be collected by either Richard Benoit, the Principal Investigator (PI) or Carolyn Watts, co-investigator, using a paper data collection form. Immediately after the data has been collected on the paper form, the completed forms will be stored in a locked file cabinet in the PI’s locked office in the SICU at Vanderbilt University Hospital. Data will then be transcribed from the paper data collection sheets into Vanderbilt’s secured data base by the PI. The paper data collection sheets will remain under double lock at Vanderbilt until the completion of the study, at which time they will be placed in a shredder box located near the PI’s office in the SICU. The medical record number will remain attached to the protected health information until the study’s completion and the PI is satisfied that the data is complete and accurate. At that time, the records will be de-identified by removing the medical record number. Only Richard Benoit and Carolyn Watts will have access to the paper data collection forms. After the information has been entered into Vanderbilt’s secured data base, Richard Benoit, Carolyn Watts, Drs. Lorraine Mion and Anne Minnick, the faculty advisors, Dr. Mary Dietrich, the statistician, and Dr. Oliver Gunter, the physician advisor, will have access to the database.
16. Authorization to Use/Disclose Protected Health Information
All efforts, within reason, will be made to keep your protected health information (PHI) private. PHI is your health information that is, or has been gathered or kept by Vanderbilt as a result of your healthcare. This includes data gathered for research studies that can be traced back to you. Using or sharing (“disclosure”) such data must follow federal privacy rules. By signing the consent for this study, you are agreeing (“authorization”) to the uses and likely sharing of your PHI. If you decide to be in this research study, you are also agreeing to let the study team use and share your PHI as described below. As part of the study, Richard Benoit and his study team may share the results of your study and/or non-study linked information such as lab values,demographic variables, as well as parts of your medical record to the groups named below. These groups may include people from the Federal Government Office for Human Research Protections, the Vanderbilt University Institutional Review Board, National Database of Nursing Quality Indicators (NDNQI), and the National Pressure Ulcer Advisory Panel (NPUAP). Federal privacy rules may not apply to these groups; they have their own rules and codes to assure that all efforts, within reason, will be made to keep your PHI private. Vanderbilt may give or sell your health data, without identifiers, to others or use it for other research projects not listed in this form. Vanderbilt, Richard Benoit and his staff will comply with any and all laws regarding the privacy of such information. There are no plans to pay you for the use or transfer of this de-identified information. The study results will be kept in your research record for at least six years after the study is finished. At that time, the research data that has not been put in your medical record will be kept for an unknown length of time. Any research data that has been put into your medical record will be kept for an unknown length of time.
Unless told otherwise, your consent to use or share your PHI does not expire. If you change your mind, we ask that you contact Richard Benoit in writing and let him know that you withdraw your consent. His mailing address is 1211 Medical Center Drive 9612B CCT Nashville, TN 37232-7417 At that time, we will stop getting any more data about you. However, the health data we stored before you withdrew your consent may still be used for reporting and research quality.
141
If you decide not to take part in this research study, it will not affect your treatment, payment or
enrollment in any health plans or affect your ability to get benefits. You will get a copy of this form after it is signed.
STATEMENT BY PERSON AGREEING TO BE IN THIS STUDY I have read this consent form and the research study has been explained to me
verbally. All my questions have been answered, and I freely and voluntarily choose to take part in this study.
Date Signature of patient/volunteer
Consent obtained by: Date Signature Printed Name and Title
142

SURROGATE RIDER – CONTROL PATIENT
I, __________ [name of decision-maker/surrogate], am the ____________ __________ [state relationship to participant] of __________ [state participant’s name]. I have read the informed consent document or it has been explained to me. I have had the opportunity to ask any questions and all of my questions have been answered. I believe participating in this research would be in the interests of [participant’s name] and is consistent with what he/she would have decided had he/she been able to do so. Your decision to allow your family member/friend to participate in this research study is voluntary. You may choose not to allow his/her participation and he/she will receive the same treatments. The decision not to participate in the research will not affect his/her healthcare/services or other rights. You are also free to withdraw him/her from this study at any time. In the event new information becomes available that may affect the risks or benefits associated with this research study or your willingness to allow continued participation in this research study, you will be notified so that you can make an informed decision whether or not to continue your family member/friend’s participation in this study. Your family member/friend will periodically be re-evaluated for the capacity to give consent. If he/she is found to be capable, continued participation in this study would only occur with his/her consent. ________________________________________________ ___/___/___ Signature of Health Care Decision-Maker/Surrogate Date
________________________________________________ ___/___/___ Signature of Witness Date
________________________________________________ ___/___/___ Name and Signature of person obtaining consent Date
Patient Information Sheet Hello: Your family member/friend is being considered for enrollment in a study at Vanderbilt. This sheet is provided as information only and does not mean that your family member/friend
143

has been enrolled. A member of the study team will be attempting to contact you in person or by phone to get consent from you to enroll your family member/friend in the study.
Information about the Pressure Ulcer Risk Factor Study What is the Study About? This is a nursing study we are doing in the intensive care units at Vanderbilt. The study is to help us see what risk factors cause pressure ulcers in critically ill patients. There are many risk factors, such as older age or poor nutrition, that can lead to the development of pressure ulcers. We do not know which combination of risk factors are the ones most likely to predict a pressure ulcer. The study will help us find out which risk factors are most important. We can then plan better ways to prevent them from happening. Why is my family member/friend being asked to participate? Your family member/friend is a patient in an ICU. Studies show that patients in ICUs have a higher risk for developing pressure ulcers, commonly known as bedsores. We want to see what risk factors (such as nutrition status and some types of medications) contribute to pressure ulcer development. Your family member/friend may or may not have a pressure ulcer. In either case, we want to compare risk factors between patients that do and do not have a pressure ulcer. What will happen and how long will my family member/friend be in the study? If your family member/friend has a pressure ulcer, one of the research nurses will observe the pressure ulcer when the nurse does usual care and turns him/her. In addition, the research nurse will get information from the chart on your family member/friend’s illness, medications, and some blood work. Your family member/friend will be in the study until discharged from the ICU. If your family member/friend does not have a pressure ulcer, the research nurse will get information from the chart on your family member/friend’s illness, medications, and some blood work. Your family member/friend will be in the study until discharged from the ICU.
144
Are there costs to my family member/friend for being in the study? There are no costs or charges for being in this study. Are there any side effects or risks? There are no side effects since we are only looking at the pressure ulcer (if there is one) and gathering information from the chart. The only risk is the loss of anonymity. We will make sure that any study forms with your family member/friend’s name or medical record are kept locked in a private office. Only the nurse researchers will be able to see that information. We will destroy all forms with the name and medical record number at the end of this study. Can my family member/friend expect to get paid? No. We do not plan on paying people who are in this study. Are there any good effects for being in this study? There are no direct benefits to your family member/friend. The findings from this study will help future ICU patients. If I decide to not enroll my family member/friend in the study, are there other treatments? The treatment will be the same if your family member/friend participates in this study or not. Can I stop my family member/friend from being in the study after I give consent? You may withdraw from participating in the study. Please contact the investigator, Richard Benoit, at 322-6565, to discuss this. Who do to call for any questions? If you have questions about the study, please contact Richard Benoit at 322-6565 or on his pager at 835-7701. If you have any questions about your rights in participating in research, please call the Vanderbilt IRB at 322-2918. How will privacy and information be protected? The study forms will be in a locked office. Only the nurse researchers will be able to get to the study forms. After the study is over, all paper forms will be shredded. We will enter the study information into the Vanderbilt computer system, but that information will not include the name
145
or medical record number. All publications will be in group results only; no individual will have results published. Certain groups, such as the Vanderbilt IRB, the National Database of Nursing Quality Indicators (NDNQI), may look at the information. Richard Benoit and the other nurse researchers will comply with any and all laws that protect the privacy of your family member/friend’s information. Will I be able to see the results of the study? Because the specific results do not include any details other than those located in the medical record, you will need to follow Vanderbilt’s procedures for accessing information in personal records. You must address your request in writing to the Medical Information Services Department. You may download a copy of the request form at http://www.vanderbilthealth.com/main/11323 or you may ask your nurse to get a copy of it for you from E-docs, Vanderbilt’s electronic document service. Mail or fax the completed form to: Medical Information Services 1211 22nd Avenue N. B-334 VUH Nashville, TN 37232 Fax # (615)343-0126 If you have any questions about accessing a medical record, please call: (615) 322-2062. The overall findings of the study will be published in an appropriate journal after the findings have been analyzed. If you would like information about the journal name and publication date, please email the Principal Investigator at [email protected] to request this information once it is available.
Inclusion/Exclusion Tracking Tool PRESSURE ULCER RISK FACTOR
Inclusion/Exclusion Tool
Date of Screening: ____/____/____ Your Initials ________
146

INCLUSION CRITERIA: Subject 18 years of age or older? _________ Current ICU ________________________ EXCLUSION CRITERIA:
CASE CONTROL ICU LOS < 48 hours ICU LOS < 48 hours Stage II or worse pressure ulcer on admission to ICU
Stage II or worse pressure ulcer on admission to ICU
Stage II or worse pressure ulcer that develops within 48 hours of ICU admission
Stage II or worse pressure ulcer development during ICU stay
CPR within 48 hours prior to pressure ulcer development
CPR during ICU stay
Discharge from ICU prior to visual assessment of pressure ulcer
Discharge from ICU with any missing pre-admission or demographic information
Is this subject a CASE or CONTROL? (Circle one) If this is a CASE subject, is the patient able to give consent as assessed by the nurse? YES NO If YES, date consent form signed ____________ If NO, is there a surrogate present during the pressure ulcer screening? If yes, date surrogate consent form signed ______________________ If no surrogate and patient unable to consent, date “Written Information about the Pressure Ulcer Study” left in room _______________ Study ID: _____________________ (001- 174 Case numbers for CW) (1001-1174 Control numbers for CW) (175-350 Case numbers for RB) (1175-1350 Control numbers for RB)
147
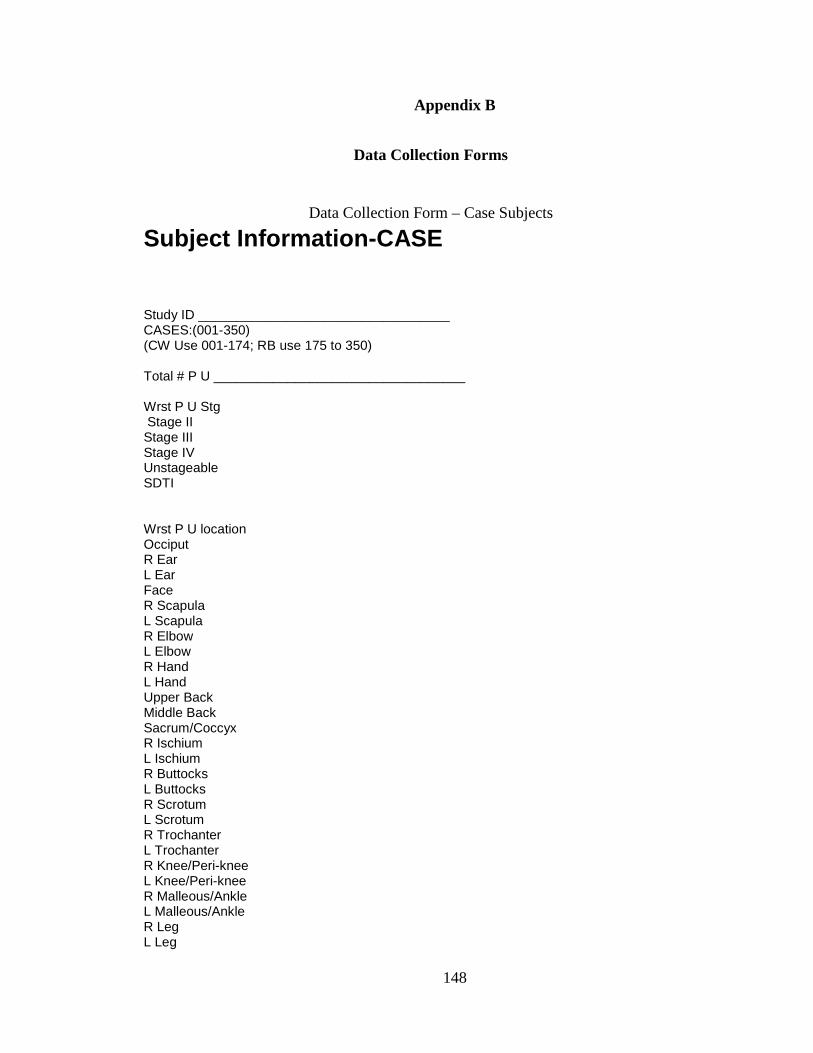
Appendix B
Data Collection Forms
Data Collection Form – Case Subjects
Subject Information-CASE Study ID __________________________________ CASES:(001-350) (CW Use 001-174; RB use 175 to 350) Total # P U __________________________________ Wrst P U Stg Stage II Stage III Stage IV Unstageable SDTI Wrst P U location Occiput R Ear L Ear Face R Scapula L Scapula R Elbow L Elbow R Hand L Hand Upper Back Middle Back Sacrum/Coccyx R Ischium L Ischium R Buttocks L Buttocks R Scrotum L Scrotum R Trochanter L Trochanter R Knee/Peri-knee L Knee/Peri-knee R Malleous/Ankle L Malleous/Ankle R Leg L Leg
148

R Heel L Heel R Foot L Foot ICU Adm Date __________________________________ (Continuous ICU stay-even if transferred from another ICU. ) Date P U ided by RN __________________________________ Ht (in) __________________________________ Wt (lbs) __________________________________ Vent use? (Has the patient required a ventilator at ANY TIME during the ICU stay? ) No Yes IF YES: Curr Vent use? (Is the patient CURRENTLY requiring vent use? ) No Yes IF NO: Contin Vent use hrs __________________________________ (Longest # hrs continuous vent use up to midnight before study enrollment (Includes time on vent prior to transfer from another ICU, if applicable) IF YES: Prior cont Vent use __________________________________ (Longest # hrs continuous vent use up to midnight before study enrollment ) Sens 48 1 2 3 4 (may be from either day or night Braden) Sens 24 1 2 3 4 (may be from either day or night Braden) Nut 48 1 2 3 4 (may be from either day or night Braden ) Nut 24 1 2 3 4 (may be from either day or night Braden) Mob 48 1 2 3 4 (may be from either day or night Braden) Mob 24 1 2 3 4 (may be from either day or night Braden) Act 48 1 2 3 4 (may be from either day or night Braden) Act 24 1 2 3 4 (may be from either day or night Braden)
149

Moi 24 1 2 3 4 (may be from either day or night Braden) Moi 48 1 2 3 4 (may be from either day or night Braden) F/S 24 1 2 3 (may be from either day or night Braden) F/S 48 1 2 3 (may be from either day or night Braden ) HYDRO? (Hydrocortisone use) No Yes
HYDRO 14 d __________________________________
PREDSOL (Prednisolone use) No Yes
PREDSOL 14d __________________________________ METH (Methylprednisolone use) No Yes
METH 14d __________________________________ PRED (Prednisone use ) No Yes
PRED 14d __________________________________ Serum Albumin 24 __________________________________ (Enter 888 if no value available) Serum Albumin 48 __________________________________ (Enter 888 if no value available) Total Lymphocyte count 24 __________________________________ (Enter 888 if no value available) Total Lymphocyte count 48 __________________________________ (Enter 888 if no value available)
150
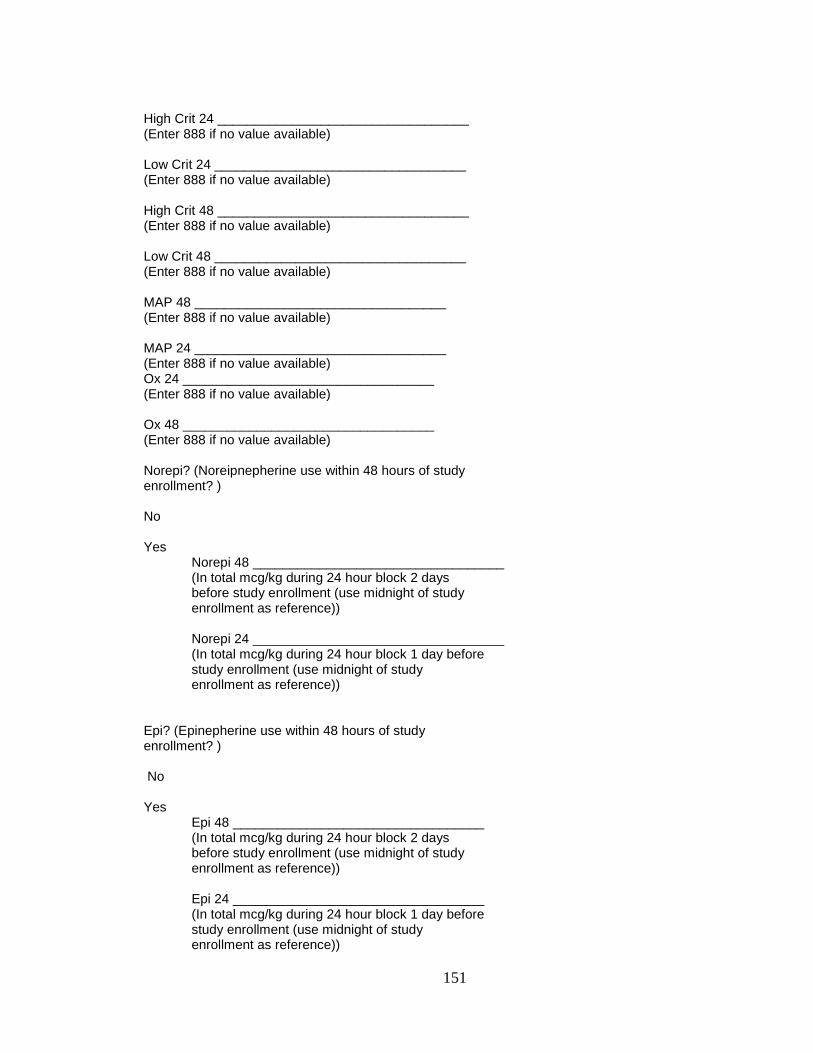
High Crit 24 __________________________________ (Enter 888 if no value available) Low Crit 24 __________________________________ (Enter 888 if no value available) High Crit 48 __________________________________ (Enter 888 if no value available) Low Crit 48 __________________________________ (Enter 888 if no value available) MAP 48 __________________________________ (Enter 888 if no value available) MAP 24 __________________________________ (Enter 888 if no value available) Ox 24 __________________________________ (Enter 888 if no value available) Ox 48 __________________________________ (Enter 888 if no value available) Norepi? (Noreipnepherine use within 48 hours of study enrollment? ) No Yes
Norepi 48 __________________________________ (In total mcg/kg during 24 hour block 2 days before study enrollment (use midnight of study enrollment as reference)) Norepi 24 __________________________________ (In total mcg/kg during 24 hour block 1 day before study enrollment (use midnight of study enrollment as reference))
Epi? (Epinepherine use within 48 hours of study enrollment? ) No Yes
Epi 48 __________________________________ (In total mcg/kg during 24 hour block 2 days before study enrollment (use midnight of study enrollment as reference)) Epi 24 __________________________________ (In total mcg/kg during 24 hour block 1 day before study enrollment (use midnight of study enrollment as reference))
151

Dobut? (Dobutamine use within 48 hours of study enrollment? ) No Yes
Dobut 48 __________________________________ (In total mcg/kg during 24 hour block 2 days before study enrollment (use midnight of study enrollment as reference))
Dobut 24 __________________________________ (In total mcg/kg during 24 hour block 1 day before study enrollment (use midnight of study enrollment as reference))
Mil? (Milrinone use within 48 hours of study enrollment? ) No Yes
Mil 48 __________________________________ (In total mcg/kg during 24 hour block 2 days before study enrollment (use midnight of study enrollment as reference)) Mil 24 __________________________________ (In total mcg/kg during 24 hour block 1 day before study enrollment (use midnight of study enrollment as reference))
Mid? (Midodrine use within 48 hours of study enrollment? ) No Yes
Mid 48 __________________________________ (In total mcg/kg during 24 hour block 2 days before study enrollment (use midnight of study enrollment as reference)) Mid 24 __________________________________ (In total mcg/kg during 24 hour block 1 day before study enrollment (use midnight of study enrollment as reference))
152

Vaso? (Vasopressin use within 48 hours of study enrollment? ) No Yes
Vaso 48 __________________________________ (In total units during 24 hour block 2 days before study enrollment (use midnight of study enrollment as reference)) Vaso 24 __________________________________ (In total units during 24 hour block 1 day before study enrollment (use midnight of study enrollment as reference))
Prssors? (Did the patient require pressor use at any point during the ICU stay PRIOR to 48 hours of study enrollment? Use only the pressors identified in this study) No Yes
Pressor use Norepinepherine Epinepherine Dobutamine Dopamine Milrinone Midodrine Vasopressin
Restr? (Is the patient currently in wrist restraints or were wrist restraints used within 48 hours of study enrollment (use midnight of study enrollment as reference)) No Yes
Data Collection Form – Control
Subject Information-CONTROL Assigned Study ID __________________________________
153
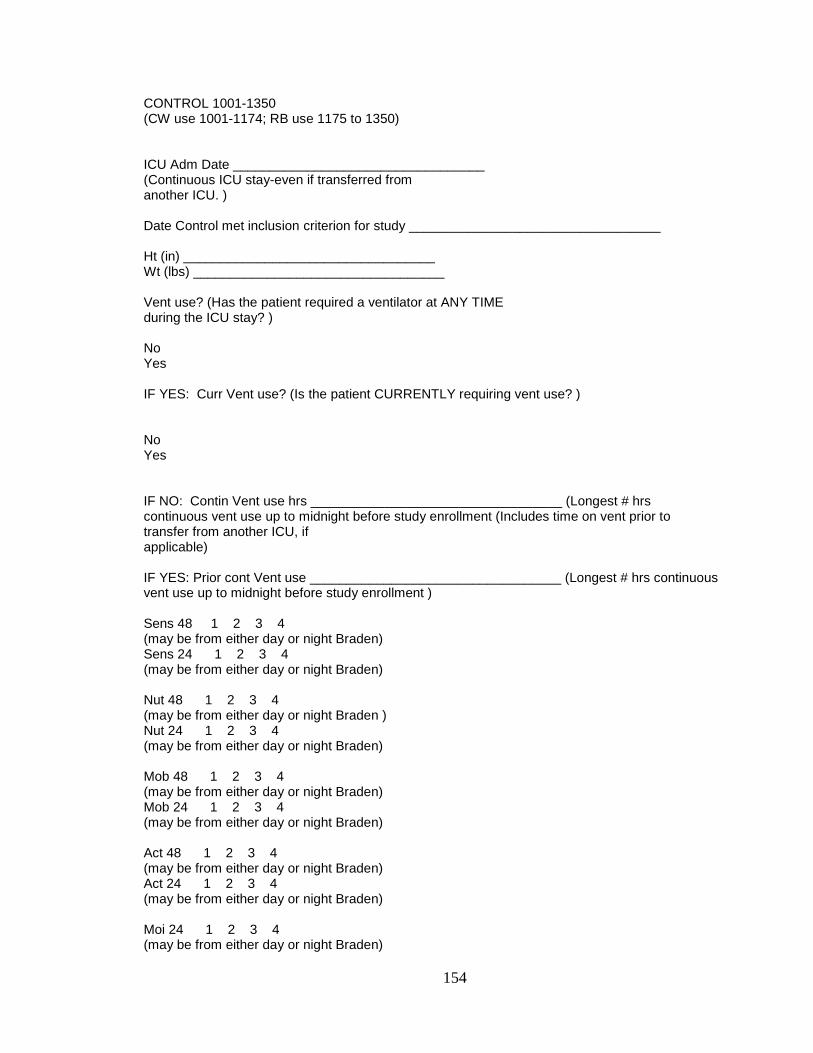
CONTROL 1001-1350 (CW use 1001-1174; RB use 1175 to 1350) ICU Adm Date __________________________________ (Continuous ICU stay-even if transferred from another ICU. ) Date Control met inclusion criterion for study __________________________________ Ht (in) __________________________________ Wt (lbs) __________________________________ Vent use? (Has the patient required a ventilator at ANY TIME during the ICU stay? ) No Yes IF YES: Curr Vent use? (Is the patient CURRENTLY requiring vent use? ) No Yes IF NO: Contin Vent use hrs __________________________________ (Longest # hrs continuous vent use up to midnight before study enrollment (Includes time on vent prior to transfer from another ICU, if applicable) IF YES: Prior cont Vent use __________________________________ (Longest # hrs continuous vent use up to midnight before study enrollment ) Sens 48 1 2 3 4 (may be from either day or night Braden) Sens 24 1 2 3 4 (may be from either day or night Braden) Nut 48 1 2 3 4 (may be from either day or night Braden ) Nut 24 1 2 3 4 (may be from either day or night Braden) Mob 48 1 2 3 4 (may be from either day or night Braden) Mob 24 1 2 3 4 (may be from either day or night Braden) Act 48 1 2 3 4 (may be from either day or night Braden) Act 24 1 2 3 4 (may be from either day or night Braden) Moi 24 1 2 3 4 (may be from either day or night Braden)
154

Moi 48 1 2 3 4 (may be from either day or night Braden) F/S 24 1 2 3 (may be from either day or night Braden) F/S 48 1 2 3 (may be from either day or night Braden ) HYDRO? (Hydrocortisone use) No Yes
HYDRO 14 d __________________________________
PREDSOL (Prednisolone use) No Yes
PREDSOL 14d __________________________________ METH (Methylprednisolone use) No Yes
METH 14d __________________________________ PRED (Prednisone use ) No Yes
PRED 14d __________________________________ Serum Albumin 24 __________________________________ (Enter 888 if no value available) Serum Albumin 48 __________________________________ (Enter 888 if no value available) Total Lymphocyte count 24 __________________________________ (Enter 888 if no value available) Total Lymphocyte count 48 __________________________________ (Enter 888 if no value available) High Crit 24 __________________________________ (Enter 888 if no value available)
155
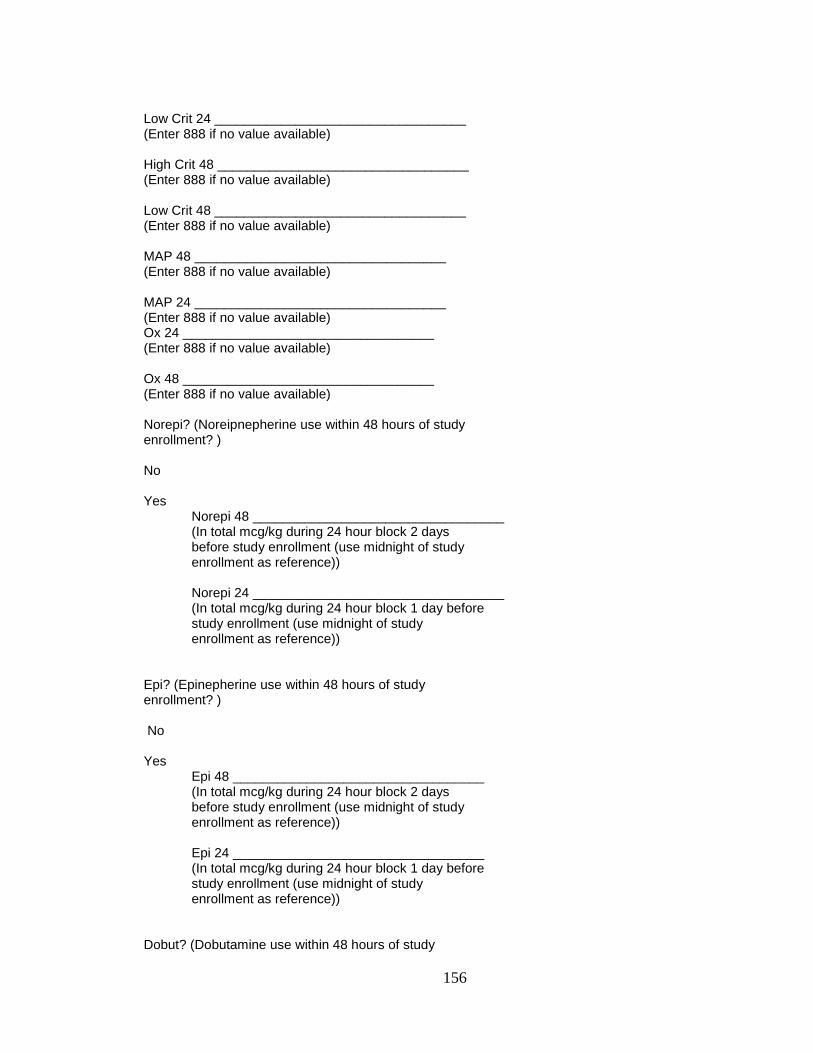
Low Crit 24 __________________________________ (Enter 888 if no value available) High Crit 48 __________________________________ (Enter 888 if no value available) Low Crit 48 __________________________________ (Enter 888 if no value available) MAP 48 __________________________________ (Enter 888 if no value available) MAP 24 __________________________________ (Enter 888 if no value available) Ox 24 __________________________________ (Enter 888 if no value available) Ox 48 __________________________________ (Enter 888 if no value available) Norepi? (Noreipnepherine use within 48 hours of study enrollment? ) No Yes
Norepi 48 __________________________________ (In total mcg/kg during 24 hour block 2 days before study enrollment (use midnight of study enrollment as reference)) Norepi 24 __________________________________ (In total mcg/kg during 24 hour block 1 day before study enrollment (use midnight of study enrollment as reference))
Epi? (Epinepherine use within 48 hours of study enrollment? ) No Yes
Epi 48 __________________________________ (In total mcg/kg during 24 hour block 2 days before study enrollment (use midnight of study enrollment as reference)) Epi 24 __________________________________ (In total mcg/kg during 24 hour block 1 day before study enrollment (use midnight of study enrollment as reference))
Dobut? (Dobutamine use within 48 hours of study
156
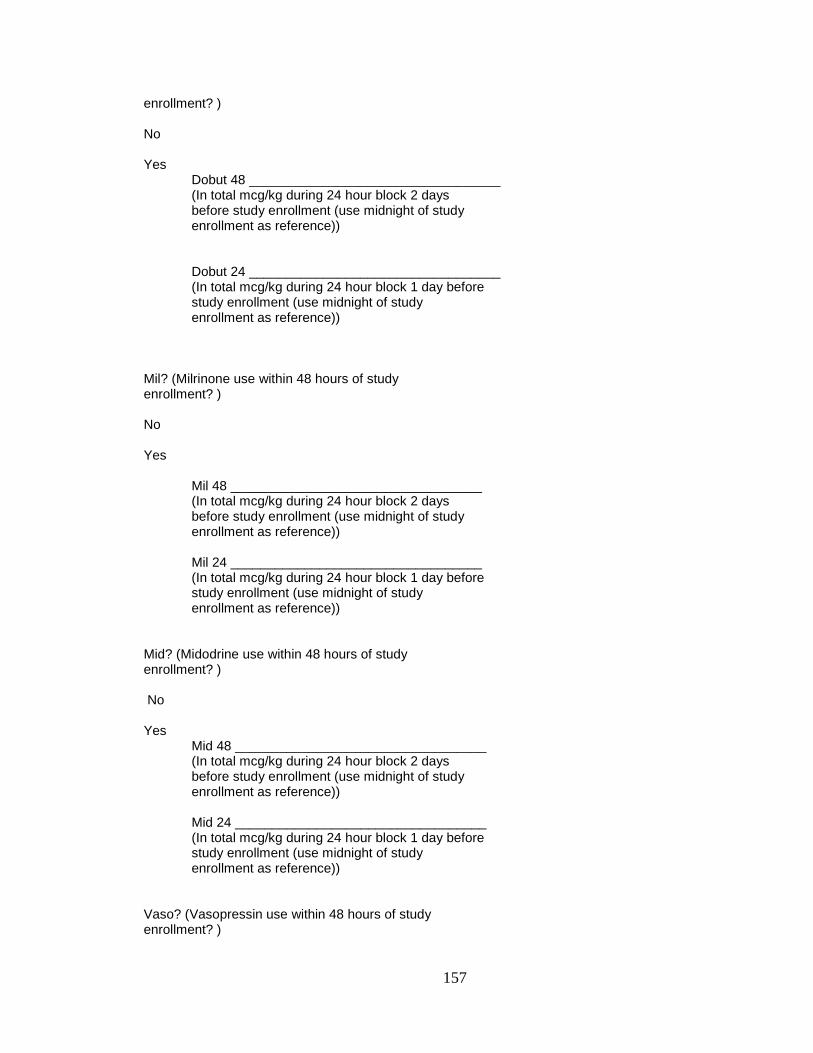
enrollment? ) No Yes
Dobut 48 __________________________________ (In total mcg/kg during 24 hour block 2 days before study enrollment (use midnight of study enrollment as reference))
Dobut 24 __________________________________ (In total mcg/kg during 24 hour block 1 day before study enrollment (use midnight of study enrollment as reference))
Mil? (Milrinone use within 48 hours of study enrollment? ) No Yes
Mil 48 __________________________________ (In total mcg/kg during 24 hour block 2 days before study enrollment (use midnight of study enrollment as reference)) Mil 24 __________________________________ (In total mcg/kg during 24 hour block 1 day before study enrollment (use midnight of study enrollment as reference))
Mid? (Midodrine use within 48 hours of study enrollment? ) No Yes
Mid 48 __________________________________ (In total mcg/kg during 24 hour block 2 days before study enrollment (use midnight of study enrollment as reference)) Mid 24 __________________________________ (In total mcg/kg during 24 hour block 1 day before study enrollment (use midnight of study enrollment as reference))
Vaso? (Vasopressin use within 48 hours of study enrollment? )
157

No Yes
Vaso 48 __________________________________ (In total units during 24 hour block 2 days before study enrollment (use midnight of study enrollment as reference)) Vaso 24 __________________________________ (In total units during 24 hour block 1 day before study enrollment (use midnight of study enrollment as reference))
Prssors? (Did the patient require pressor use at any point during the ICU stay PRIOR to 48 hours of study enrollment? Use only the pressors identified in this study) No Yes
Pressor use Norepinepherine Epinepherine Dobutamine Dopamine Milrinone Midodrine Vasopressin
Restr? (Is the patient currently in wrist restraints or were wrist restraints used within 48 hours of study enrollment (use midnight of study enrollment as reference)) No Yes
158

Appendix C
Feasibility Study
The Efficacy of Using the Electronic Medical Record as a Data Source for a Prospective Cohort Study to Determine Pressure Ulcer Risk in
Critically Ill Patients
Abstract Objective: To determine the feasibility of using the electronic medical record (EMR) as a data source for a future study to identify pressure ulcer risk factors in critically ill patients. Design: Prospective cohort study. Setting: Six intensive care units (ICUs) in a 847 bed tertiary care center. Subjects: All patients, aged 18 years, admitted the ICUs during the study without a pre-existing pressure ulcer. Interventions: None. Methods: Daily concurrent chart reviews for pressure ulcer incidence. Data were abstracted from the EMR and entered into the database for pressure ulcer positive subjects. Variables: ICU, age, height, weight, pre-existing skin disease, and history of diabetes or nicotine use. Subsequent measures were collected until subjects were discharged from the ICU, developed a stage I or worse pressure ulcer, or died. Measures: Worst mean arterial pressure, oxygen saturation, albumin, vasopressor use, and Braden sub- and summative scores. Expert visual screening assessment and Braden scores were conducted independently to evaluate the validity of the documentation. Results: 100 subjects were enrolled; six developed a pressure ulcer. There was 100% agreement between staff nurse and expert on pressure ulcer status among pressure ulcer positive and negative subjects, and 83% agreement on pressure ulcer stage. Braden sub-scores weighted Kappa coefficient agreement ranged from 0.25 to 0.67. Expected electronic medical record (EMR) variable information was available 66% of the time. Transient technical difficulties precluded a higher data retrieval rate. Time required exceeded 100 hours. Conclusion: The EMR is a reliable source of data for pressure ulcer research. However, the prospective cohort design used in this study was time intensive. To limit the time required for future studies, a case-control study designed will be used.
Introduction Pressure ulcers are a complication of acute and chronic illness that affect approximately 8.5% to 15% of institutionalized (i.e. nursing homes, acute care facilities) patients per year, representing between 2.4 and 5.2 million persons annually. Patients who are critically ill and require placement in an ICU during their hospitalization are more likely to develop pressure ulcers than patients who are less critically ill and do not require ICU placement for their care
159

needs (Bours, De Laat, Halfens, & Lubbers, 2001; De Laat, Schoonhoven, Pickkers, Verbeek, & van Achterberg, 2006; Frankel, Sperry & Kaplan, 2007; Keller, Wille, van Ramshorst, & van der Werken, 2002; Kirby & Gunter, 2008; Shahin, Dassen & Halfens, 2008; Theaker, Mannan, Ives, & Soni, 2000). Pressure ulcer prevention interventions are predicated on identifying salient risk factors for pressure ulcer development in specific patient populations (De Laat et al., 2006).
The predominant approach to studying pressure ulcer risk factors in the related literature is the prospective cohort study. Prospective cohort studies are particularly valuable for establishing causality. By measuring variables in all study subjects before the outcome occurs, the researcher establishes a temporal relationship between pre-existing risk factors and the incidence of the dependent variable (Cummings, Newman, & Hulley, 2007). Prospective cohort studies are not without their limitations, however. Prospective cohort studies can be expensive and time consuming. Many studies designed to identify pressure ulcer risk factors relied on teams of observers to collect data, which adds to study costs and introduces the risk of inter-rater reliability issues. Data availability and inter-rater reliability on pressure ulcer staging and risk scoring are missing in a large number of prospective cohort studies evaluating pressure ulcer risk factors. Prior to initiating a large, prospective cohort study, a feasibility study was necessary to determine the accuracy and timeliness of nurses’ documentation of pressure ulcers in the ICU population, and the ease of extraction of physiologic risk factors from the electronic medical record (EMR). This feasibility study was designed to identify potential problems with data collection and evaluate the reliability of staff nurses regarding pressure ulcer presence and staging, and their agreement with expert raters on the Braden score.
Methods Study Design
This study used a prospective cohort design. Study Setting
Data were collected in each of the six intensive care units (ICUs) in a 847 bed tertiary care center. The six ICUS included Burn (BICU, 9 beds), Cardiovascular (CVICU, 27 beds), Medical (MICU, 34 beds), combined neuro-medicine and neuro-surgical (NICU, 34 beds), Surgical (SICU, 34 beds), and Trauma (TICU, 14 beds). Sample Subjects were recruited to this study if they met the inclusion criteria of:
• 18 years of age or older • Admitted to one of six ICUs during the course of the study • Had no pre-existing pressure ulcer on admission to the ICU
Due to the nature of this study, subjects were not excluded based on lack of data in the EMR. Study Procedures
Beginning on the first Monday of the study, EMR census logs were reviewed by the PI, Richard Benoit, MSN, RN, CCRN, or Carolyn Watts, MSN,RN, CWON, for admissions the previous day. Demographic information on subjects that met the inclusion criteria were entered into the database. The following day, clinical information from the previous 24 hours was abstracted from the EMR and entered into the database. Nursing documentation in the EMR was examined
160

and the identified physiologic and medication information was entered into the database. The data on subjects was collected each day for 14 days with newly admitted patients captured for study the following day. Any patient that developed a pressure ulcer during the 14-day study (as indicated in the EMR) was visually evaluated by either the PI or Carolyn Watts to ensure accurate staging of the pressure ulcer as entered by the staff nurse. A Braden score was also performed by the PI or Carolyn Watts at the time that the pressure ulcer was evaluated. Each day, study subjects that did not have a documented pressure ulcer in the EMR were randomly selected d by the PI or Carolyn Watts for a skin evaluation and Braden score. Twenty-seven subjects were randomly evaluated. Data Collection Procedures
The study was approved Vanderbilt University’s Institutional Review Board. Written consent was waived in all cases, and verbal consent was required for those patients who were chosen to have a random assessment of their skin by an expert rater. Following a literature review to identify demographic and physiologic variables that potentially contribute to pressure ulcer development in critically ill patients, data extraction from the EMR was conducted over a two-week period on 100 patients meeting the inclusion criteria for the study. Baseline demographic information was entered into the data base on the day the patient qualified for the study, and daily physiologic parameters were entered throughout the duration of the patient’s eligibility to be in the study. Subjects in the study were randomly selected for reliability testing on pressure ulcer presence and Braden scores generated by the staff nurses. Baseline Measures
Baseline measures were collected on any patient meeting the inclusion criterion. Age, weight and height were abstracted from the EMR primarily using the institution’s nursing admission and history form. BMI was calculated using the standard formula weight/height2. History of diabetes and history of nicotine use was located in either the nursing admission form or the physician’s history and physical. History of diabetes was recorded as either present or absent. Similarly, nicotine use was recorded as present if the patient admitted to its use within one year of the current hospitalization. Pre-existing skin disease was also coded as present or absent on admission. Where possible, the description of any pre-existing skin disease was noted in the database. The type of ICU the subject was admitted to was recorded in the database. The six possible ICU admissions were to the Trauma, Burn, Medical, Surgical, Neurologic, and Cardiovascular ICUs. Daily Measures The day following a subject’s enrollment in the study, measures were obtained using data from the previous 24 hours until the subject was either discharged from the ICU, developed a stage I or worse pressure ulcer, died, or the study concluded. All measures but the Braden score and lab values for the previous 24-hour period were extracted from the electronic nursing vital sign flowsheet. For MAP, the worst value during the previous 24 hours from either an invasive arterial line reading or non-invasive cuff reading was utilized. In cases where there
161

were both types of readings, the arterial line measurement was used. Similarly, the worst oxygen saturation of hemoglobin was used. Vasopressor use was indicated as either present or absent for the previous 24 hours. When vasopressors were used, the type and highest dose during the 24-hour period were recorded. Lowest serum albumin and hematocrit levels from the previous 24-hour period were recorded.
Staff nurses’ assessments of the subject’s Braden scores are documented with the location and stage of any pressure ulcers present. The Braden score and any associated pressure ulcer documentation are required every 12 hours. The results from the most recent Braden scores and pressure ulcer documentation were used and entered into the study database.
Data Analysis Data collected in this feasibility study were analyzed based on their availability and
reliability. Demographic and laboratory variables were analyzed for their frequency of availability. Daily clinical variables were analyzed for their expected frequency, based on number of subjects enrolled in the study on any given day. Braden scores were analyzed for the level of agreement between staff nurse and expert rater by manually calculating weighted Kappa scores.
Results
Subject Profile One hundred subjects were enrolled in the study. Subjects ranged in age from 19 years
to 94 years, mean 53.5 years. BMI ranged from 16.23 to 54.04 with a mean of 28.6. ICU length of stay ranged from 1 day to 14 days. Thirty eight patients (38%) had a history of nicotine use prior to admission, 9 (9%) had pre-existing skin disease, and 20 (20%) had a history of diabetes. Table 1 represents the frequency of those demographic and clinical variables that were obtained. Given that there were 100 subjects enrolled in the study, the maximum number of results for each demographic variable was 100. As subjects were added and removed from the study, the number of daily maximum clinical variables changed, depending on how many subjects were enrolled on any given day. By calculating the number of subjects enrolled in the study on each of the 14 days, the total number of patient days evaluated were 476. Because of the standard frequency of collecting MAP, oxygen saturation, and Braden scores, at least 476 variables were expected for each of those variables. Laboratory values for hematocrit and serum albumin were collected as they were available.
Table 1 gives a summary of the availability of expected variables. Because vasopressor use in critically ill patients is highly variable, no expected number of variables was possible to calculate. Of the 100 subjects enrolled, 31 received vasopressors during the study, and vasopressors were in use during 85 of the 476 patient days. All data regarding vasopressor type and infusion rates were available in the EMR.
Braden score agreement between staff nurse and expert rater were evaluated using manual calculations of a weighted Kappa score. Twenty-seven subjects were randomly evaluated for their skin integrity and Braden score by an expert rater. Additionally, the expert
162

raters performed Braden scores on the six pressure ulcer positive subjects. Weighted Kappa scores are presented in Table 2.
Of the six subjects that developed a pressure ulcer during the 14 day study, there was 100% agreement between the staff nurse documentation and expert rater validation regarding presence and location of the pressure ulcer. There was discrepancy on one pressure ulcer stage, giving an 83.3% agreement between staff nurse documentation and expert rater on pressure ulcer staging.
Discussion The feasibility of data retrieval and the quality of that data are prime concerns to a
researcher wishing to use the EMR. Added concerns about the quality of nursing documentation around pressure ulcer presence, staging, and risk stratification are particularly troublesome. The quality and quantity of pressure ulcer documentation is generally poor (Gunningberg & Ehrenberg, 2004). Studies of ward nurses conducted in Europe report that pressure ulcers were often classified incorrectly and report Kappa statistics slightly greater than 0.3 (Beeckman et al., 2007; Defloor, Schoonhoven, Katrien, Weststrate, & Myny, 2006). This study was designed to answer questions about data availability and quality with regard to the study of pressure ulcers and their risk factors.
Demographic and daily clinical information were readily available. The EMR was easily accessible and the information was easily located. The laboratory values of hematocrit and serum albumin were chosen as potential risk variables based on a review of the literature and for their physiologic importance in maintaining skin integrity. Hematocrit values were performed on each subject almost daily. Serum albumin values, used extensively in the literature as a proxy measure for protein stores, were sparse, with only 25 values being recorded during any previous 24 hour observation period for the 100 subjects enrolled. Assuming this level of serum albumin testing will continue, other proxy measures for protein stores or funding for serum albumin testing is necessary.
The 66% availability of the staff nurse Braden scores was primarily a function of the EMR. As each new Braden score was entered into the EMR, the previous one was automatically archived and consequently was not available for analysis. As the data collection was designed to evaluate clinical parameters and Braden scores from the previous 24 hours, Braden score evaluation became problematic if the data collection was occurring in the afternoon. By that time, the nurse had entered a new Braden score for the day, and the scores from the previous day were not accessible. Since the study, the author has learned how to retrieve archived information, so future studies should show higher availability of the Braden scores.
Agreement between Braden scores performed by the staff nurse and those conducted by the expert rater had good to excellent agreement. All weighted Kappa scores were above 0.53 with the exception of the moisture subscale. The low agreement on the moisture subscale is confounding, but probably of little clinical significance. When staff nurse and expert rater Braden scores were dichotomized into high risk (Braden scores ≤ 16) and low risk (Braden scores ≥ 17), the non-weighted Kappa score was 0.698 (p< 0.001).
The agreement between staff nurse and expert rater on the presence, location, and stage of pressure ulcer positive subjects is encouraging. It should be noted that the six subjects
163
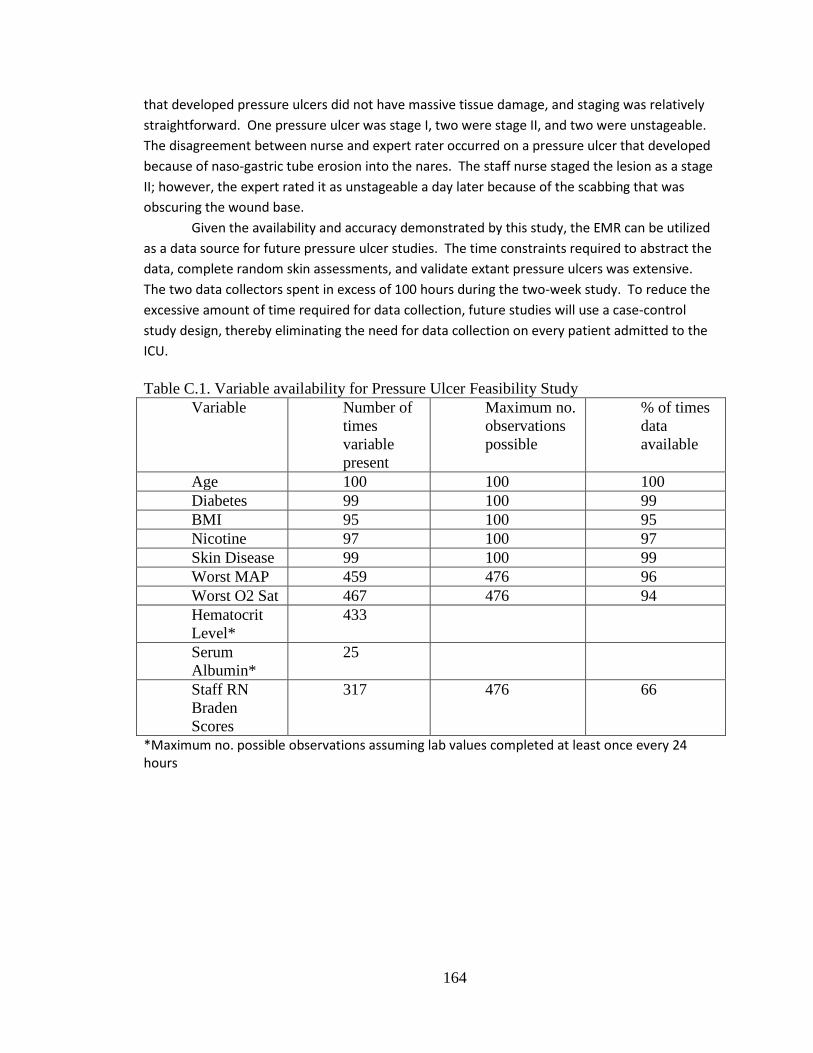
that developed pressure ulcers did not have massive tissue damage, and staging was relatively straightforward. One pressure ulcer was stage I, two were stage II, and two were unstageable. The disagreement between nurse and expert rater occurred on a pressure ulcer that developed because of naso-gastric tube erosion into the nares. The staff nurse staged the lesion as a stage II; however, the expert rated it as unstageable a day later because of the scabbing that was obscuring the wound base.
Given the availability and accuracy demonstrated by this study, the EMR can be utilized as a data source for future pressure ulcer studies. The time constraints required to abstract the data, complete random skin assessments, and validate extant pressure ulcers was extensive. The two data collectors spent in excess of 100 hours during the two-week study. To reduce the excessive amount of time required for data collection, future studies will use a case-control study design, thereby eliminating the need for data collection on every patient admitted to the ICU. Table C.1. Variable availability for Pressure Ulcer Feasibility Study
Variable Number of times variable present
Maximum no. observations possible
% of times data available
Age 100 100 100 Diabetes 99 100 99 BMI 95 100 95 Nicotine 97 100 97 Skin Disease 99 100 99 Worst MAP 459 476 96 Worst O2 Sat 467 476 94 Hematocrit Level*
433
Serum Albumin*
25
Staff RN Braden Scores
317 476 66
*Maximum no. possible observations assuming lab values completed at least once every 24 hours
164
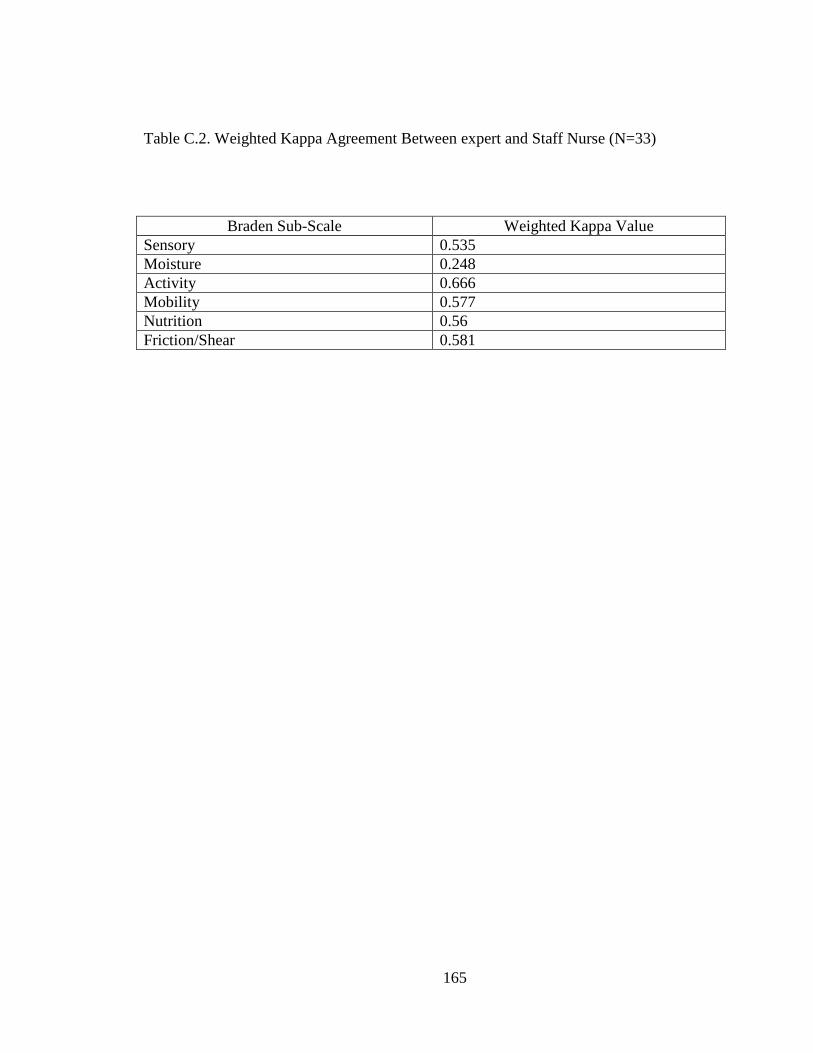
Table C.2. Weighted Kappa Agreement Between expert and Staff Nurse (N=33)
Braden Sub-Scale Weighted Kappa Value Sensory 0.535 Moisture 0.248 Activity 0.666 Mobility 0.577 Nutrition 0.56 Friction/Shear 0.581
165
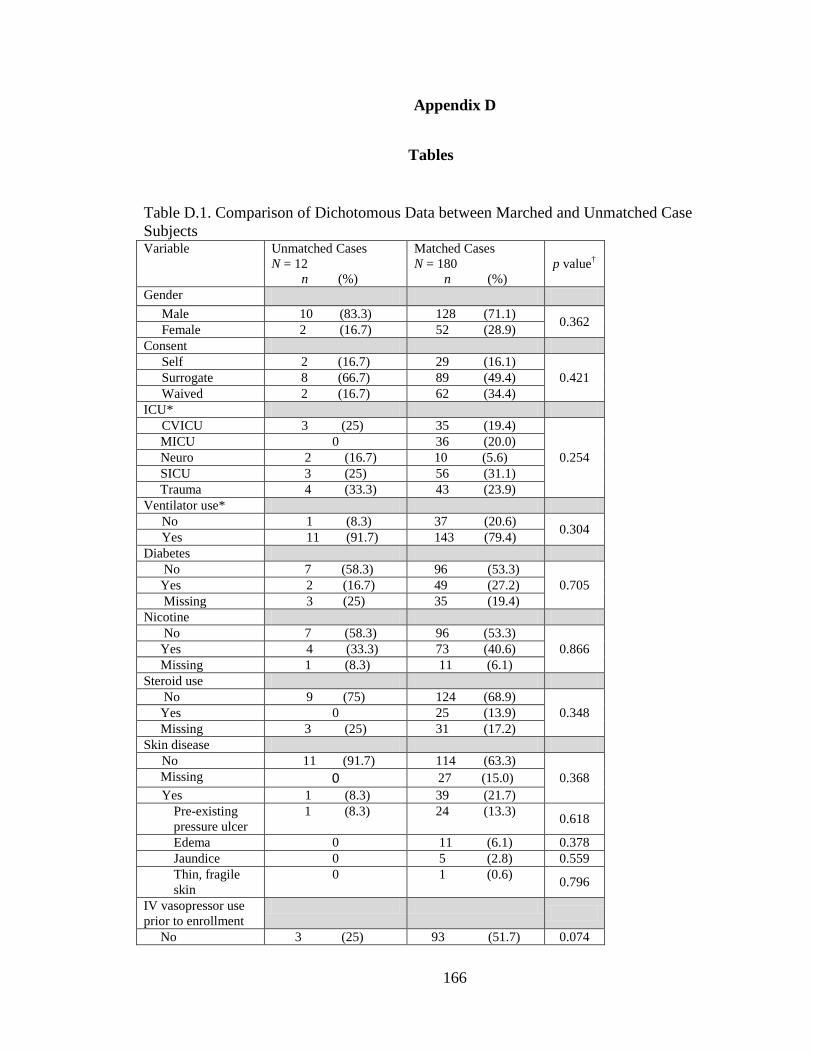
Appendix D
Tables
Table D.1. Comparison of Dichotomous Data between Marched and Unmatched Case Subjects Variable Unmatched Cases
N = 12 n (%)
Matched Cases N = 180 n (%)
p value†
Gender Male 10 (83.3) 128 (71.1) 0.362 Female 2 (16.7) 52 (28.9)
Consent Self 2 (16.7) 29 (16.1)
0.421 Surrogate 8 (66.7) 89 (49.4) Waived 2 (16.7) 62 (34.4)
ICU* CVICU 3 (25) 35 (19.4)
0.254 MICU 0 36 (20.0) Neuro 2 (16.7) 10 (5.6) SICU 3 (25) 56 (31.1) Trauma 4 (33.3) 43 (23.9) Ventilator use*
No 1 (8.3) 37 (20.6) 0.304 Yes 11 (91.7) 143 (79.4) Diabetes No 7 (58.3) 96 (53.3)
0.705 Yes 2 (16.7) 49 (27.2) Missing 3 (25) 35 (19.4) Nicotine No 7 (58.3) 96 (53.3)
0.866 Yes 4 (33.3) 73 (40.6) Missing 1 (8.3) 11 (6.1) Steroid use No 9 (75) 124 (68.9)
0.348 Yes 0 25 (13.9) Missing 3 (25) 31 (17.2) Skin disease
No 11 (91.7) 114 (63.3) 0.368 Missing 0 27 (15.0)
Yes 1 (8.3) 39 (21.7) Pre-existing pressure ulcer
1 (8.3) 24 (13.3) 0.618
Edema 0 11 (6.1) 0.378 Jaundice 0 5 (2.8) 0.559 Thin, fragile skin
0 1 (0.6) 0.796
IV vasopressor use prior to enrollment
No 3 (25) 93 (51.7) 0.074
166

Variable Unmatched Cases N = 12 n (%)
Matched Cases N = 180 n (%)
p value†
Yes 9 (75) 87 (48.3) Dobutamine 0 14 (7.8) 0.316 Dopamine 0 9 (5.0) 0.428 Epinephrine 1 (8.3) 23 (12.8) 0.652 Midodrine 0 0 -- Milrinone 1 (8.3) 17 (9.4) 0.898 Norepinephrine 9 (75) 68 (37.8) 0.011 Vasopressin 5 (41.7) 39 (21.7) 0.110
Restraint use No 6 (50) 49 (27.2) 0.091 Yes 6 (50) 131 (72.8)
† X2 *Matching criteria Table D.2. Comparison of Braden Subscale Scores between Matched and Unmatched Case Subjects
Braden Sub Scale Score
Unmatched Cases N = 12 n (%)
Matched Cases N = 180 n (%) p value†
Lowest Sensory 48 hours prior to enrollment
1 2 (16.7) 29 (16.1)
0.973 2 4 (33.3) 67 (37.2) 3 5 (41.7) 63 (35.0) 4 1 (8.3) 21 (11.7)
Lowest Sensory 24 hours prior to enrollment
1 2 (16.7) 32 (17.8)
0.953 2 4 (33.3) 63 (35.0) 3 5 (41.7) 57 (31.7) 4 1 (8.3) 28 (15.6)
Lowest Nutrition 48 hours prior to enrollment
1 1 (8.3) 20 (11.1)
0.587 2 4 (33.3) 70 (38.9) 3 7 (58.3) 89 (49.4) 4 -- 1 (0.6)
Lowest Nutrition 24 hours prior to enrollment
1 1 (8.3) 26 (14.4)
0.133 2 2 (16.7) 64 (35.6) 3 9 (75.0) 88 (48.9) 4 -- 2 (1.1)
Lowest Mobility 48
167

Braden Sub Scale Score
Unmatched Cases N = 12 n (%)
Matched Cases N = 180 n (%) p value†
hours prior to enrollment
1 5 (41.7) 62 (34.4)
0.236 2 7 (58.3) 82 (45.6) 3 -- 35 (19.4) 4 -- 1 (0.6)
Lowest Mobility 24 hours prior to enrollment
1 6 (50.0) 58 (32.2)
0.080
2 6 (50.0) 86 (47.8) 3 -- 34 (18.9) 4 -- 2 (1.1)
Lowest Activity 48 hours prior to enrollment
1 10 (83.3) 132 (73.3)
0.408 2 2 (16.7) 38 (21.1) 3 -- 8 (4.4) 4 -- 2 (1.1)
Lowest Activity 24 hours prior to enrollment
1 7 (58.3) 135 (75.0)
0.246 2 5 (41.7) 39 (21.7) 3 -- 6 (3.3) 4 -- --
Lowest Moisture 48 hours prior to enrollment
1 1 (8.3) 5 (2.8)
0.041 2 5 (41.7) 32 (17.8) 3 5 (41.7) 118 (65.6) 4 1 (8.3) 25 (13.9)
Lowest Moisture 24 hours prior to enrollment
1 1 (8.3) 12 (6.7)
0.050 2 6 (50.0) 45 (25.0) 3 5 (41.7) 101 (56.1) 4 -- 22 (12.2)
Lowest Friction/Shear 48 hours prior to enrollment
168

Braden Sub Scale Score
Unmatched Cases N = 12 n (%)
Matched Cases N = 180 n (%) p value†
1 5 (41.7) 84 (46.7) 0.891 2 7 (58.3) 87 (48.3)
3 -- 9 (5.0) Lowest Friction/Shear 24 hours prior to enrollment
1 6 (50.0) 96 (53.3) 0.756 2 5 (41.7) 75 (41.7)
3 1 (8.3) 9 (5.0) †Mann-Whitney Table D.3. Comparison of Continuous Data between Matched and Unmatched Case Subjects
Variable
Unmatched Cases N = 12
Median (n; IQR)
Matched Cases N = 180
Median (n; IQR) p value††
Age
58.5 (12; 41.3 - 61.8)
59.0 (180; 48.3 – 68.0)
0.530
ICU length of stay before enrollment*
24.5 (12; 21.0 - 27.5)
7.0 (180; 4.0 – 11.0)
< 0.001
BMI**
27.6 (12; 23.9 - 34.3)
27.6 (180; 23.0 - 33.6)
0.826
Total corticosteroid dose 14 days before enrollment
Hydrocortisone dose
1275.0 (4; 343.8 – 1625.0)
450.0 (45; 200.0 – 1000.0)
0.182
Methylprednisone dose
1250.0 (1; 1250.0 – 1250.0)
342.5 (20; 125.0 - 1117.5) 0.280
Prednisolone dose 0 0 --
Prednisone dose 0
140.0 (17; 62.5 – 230)
--
Protein store
169

Variable
Unmatched Cases N = 12
Median (n; IQR)
Matched Cases N = 180
Median (n; IQR) p value††
Serum albumin
2.8 (7; 2.6 – 3.0)
2.8 (68; 2.4 - 3.2) 0.763
Pre-albumin
12.5 (10; 8.0 – 23.0)
11.0 (80; 8.0 – 14.0) 0.354
Lymphocyte count
1.0 (8; 0.6 - 1.4)
1.0 (129; 0.6 - 1.6)
0.765
Perfusion parameters
Highest hematocrit 48 hours prior to enrollment
27.0 (11; 23.0 – 32.0)
28.0 (175; 26.0 – 31.0)
0.528
Lowest hematocrit 48 hours prior to enrollment
27.0 (11; 23.0 – 31.0)
27.0 (175; 24.0 – 30.0)
0.871
Highest hematocrit 24 hours prior to enrollment
29.0 (11; 25.0 – 33.0)
28.0 (176; 25.0 – 30.0)
0.624
Lowest hematocrit 24 hours prior to enrollment
29.0 (11; 25.0 – 33.0)
26.0 (176; 24.0 – 29.0)
0.225
Lowest MAP† 48 hours prior to enrollment
57.5 (12; 51.5 – 65.0)
61.0 (180; 55.0 – 66.0)
0.197
Lowest MAP 24 hours prior to enrollment
53.0 (12; 42.3 – 66.3)
61.0 (180; 56.0 – 67.0)
0.064
Lowest O2 saturation 48 hours prior to enrollment
95.0 (12; 87.0 – 98.3)
92.0 (180; 89.3 – 95.0)
0.400
Lowest O2 saturation 24 hours prior to enrollment
95.5 (12; 93.3 – 98.5) 92.5 (180; 90.0 – 95.0)
0.016
Vasopressor dose in total micrograms/kg
Norepinephrine dose 48 hours prior to enrollment
73.6 (2; 1.2 – 0.0)
44.5 (49; 15.8 – 86.0)
0.633
Norepinephrine dose 24 hours prior to enrollment
37.1 (1; 37.1 -37.1)
51.3 (43; 9.4 - 117.3)
0.098
Epinephrine dose 48 hours prior to enrollment
0
9.4 (6; 5.9 - 53.2)
--
170
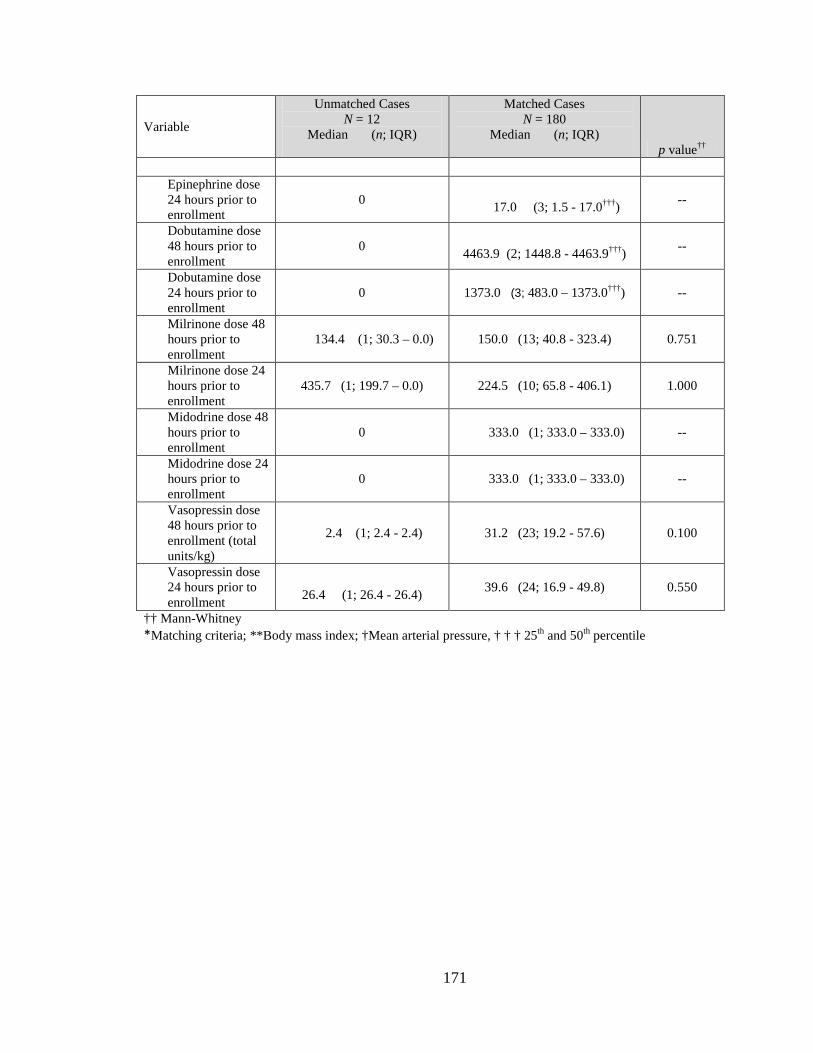
Variable
Unmatched Cases N = 12
Median (n; IQR)
Matched Cases N = 180
Median (n; IQR) p value††
Epinephrine dose 24 hours prior to enrollment
0 17.0 (3; 1.5 - 17.0†††) --
Dobutamine dose 48 hours prior to enrollment
0 4463.9 (2; 1448.8 - 4463.9†††) --
Dobutamine dose 24 hours prior to enrollment
0
1373.0 (3; 483.0 – 1373.0†††)
--
Milrinone dose 48 hours prior to enrollment
134.4 (1; 30.3 – 0.0)
150.0 (13; 40.8 - 323.4)
0.751
Milrinone dose 24 hours prior to enrollment
435.7 (1; 199.7 – 0.0)
224.5 (10; 65.8 - 406.1)
1.000
Midodrine dose 48 hours prior to enrollment
0
333.0 (1; 333.0 – 333.0)
--
Midodrine dose 24 hours prior to enrollment
0
333.0 (1; 333.0 – 333.0)
--
Vasopressin dose 48 hours prior to enrollment (total units/kg)
2.4 (1; 2.4 - 2.4)
31.2 (23; 19.2 - 57.6)
0.100
Vasopressin dose 24 hours prior to enrollment
26.4 (1; 26.4 - 26.4)
39.6 (24; 16.9 - 49.8)
0.550
†† Mann-Whitney *Matching criteria; **Body mass index; †Mean arterial pressure, † † † 25th and 50th percentile
171

Table D.4. Summary of Missing Data Missing Variable Matched Cases
N = 180 n (%)
Matched Controls N = 180 n (%)
p value†
Pre-Admission Demographic Variables
Diabetes 35 (19.4) 32 (17.8) 0.755 Nicotine use 11 (6.1) 11 (6.1) 1.000 Corticosteroid
use 31 (17.2) 32 (17.8) 1.000
Skin Disease 27 (15.0) 29 (16.1) 0.874 Perfusion Parameter Variables
Highest hematocrit 48 hours prior to enrollment
5 (2.8) 4 (2.2) 1.000
Lowest hematocrit 48 hours prior to enrollment
5 (2.8) 4 (2.2) 1.000
Highest hematocrit 24 hours prior to enrollment
4 (2.2) 5 (2.8) 1.000
Lowest hematocrit 48 hours prior to enrollment
4 (2.2) 5 (2.8) 1.000
Protein Reserve Variables
Serum Albumin 112 (62.2) 113 (62.7) 1.000
Serum Pre-albumin 100 (55.5) 100 (55.5) 0.560
Total Lymphocyte Count
51 (28.3) 41 (22.8) 0.522
Any Protein Store 22 (12.2) 15 (8.3) 0.281
172
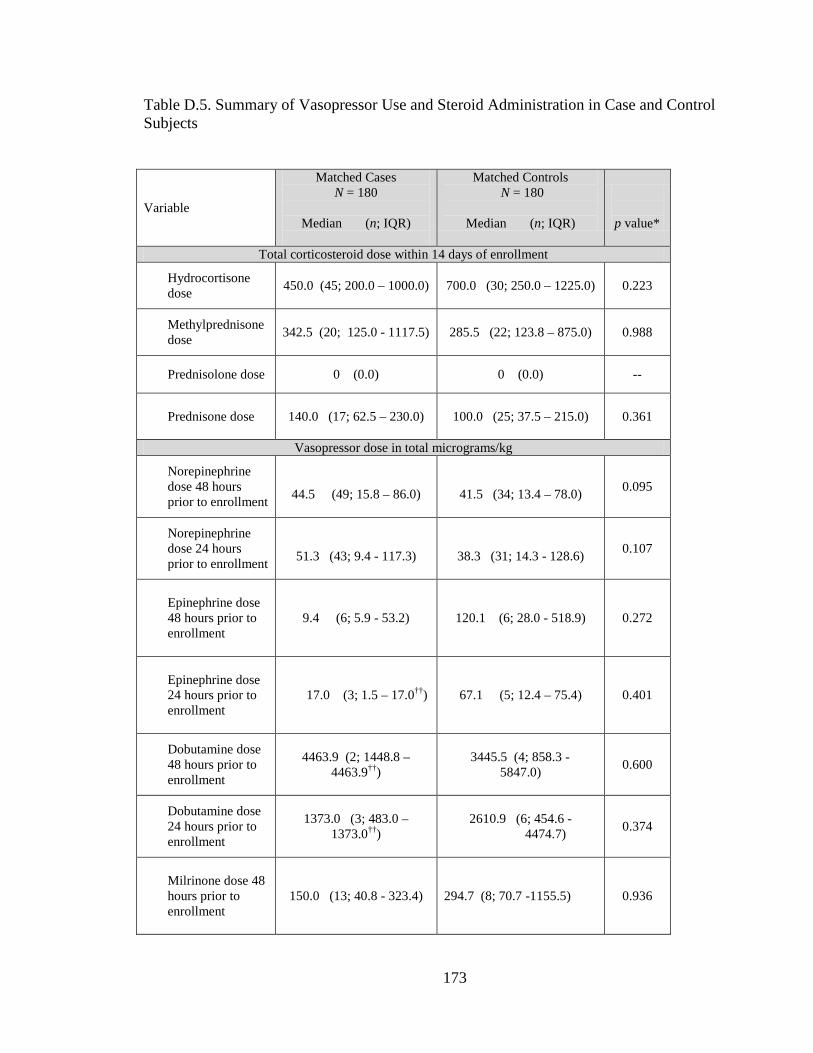
Table D.5. Summary of Vasopressor Use and Steroid Administration in Case and Control Subjects
Variable
Matched Cases N = 180
Median (n; IQR)
Matched Controls N = 180
Median (n; IQR)
p value*
Total corticosteroid dose within 14 days of enrollment
Hydrocortisone dose
450.0 (45; 200.0 – 1000.0)
700.0 (30; 250.0 – 1225.0)
0.223
Methylprednisone dose
342.5 (20; 125.0 - 1117.5)
285.5 (22; 123.8 – 875.0)
0.988
Prednisolone dose 0 (0.0) 0 (0.0) --
Prednisone dose
140.0 (17; 62.5 – 230.0)
100.0 (25; 37.5 – 215.0)
0.361
Vasopressor dose in total micrograms/kg
Norepinephrine dose 48 hours prior to enrollment
44.5 (49; 15.8 – 86.0)
41.5 (34; 13.4 – 78.0)
0.095
Norepinephrine dose 24 hours prior to enrollment
51.3 (43; 9.4 - 117.3)
38.3 (31; 14.3 - 128.6)
0.107
Epinephrine dose 48 hours prior to enrollment
9.4 (6; 5.9 - 53.2)
120.1 (6; 28.0 - 518.9)
0.272
Epinephrine dose 24 hours prior to enrollment
17.0 (3; 1.5 – 17.0††)
67.1 (5; 12.4 – 75.4)
0.401
Dobutamine dose 48 hours prior to enrollment
4463.9 (2; 1448.8 – 4463.9††)
3445.5 (4; 858.3 -
5847.0)
0.600
Dobutamine dose 24 hours prior to enrollment
1373.0 (3; 483.0 –
1373.0††)
2610.9 (6; 454.6 - 4474.7)
0.374
Milrinone dose 48 hours prior to enrollment
150.0 (13; 40.8 - 323.4)
294.7 (8; 70.7 -1155.5)
0.936
173
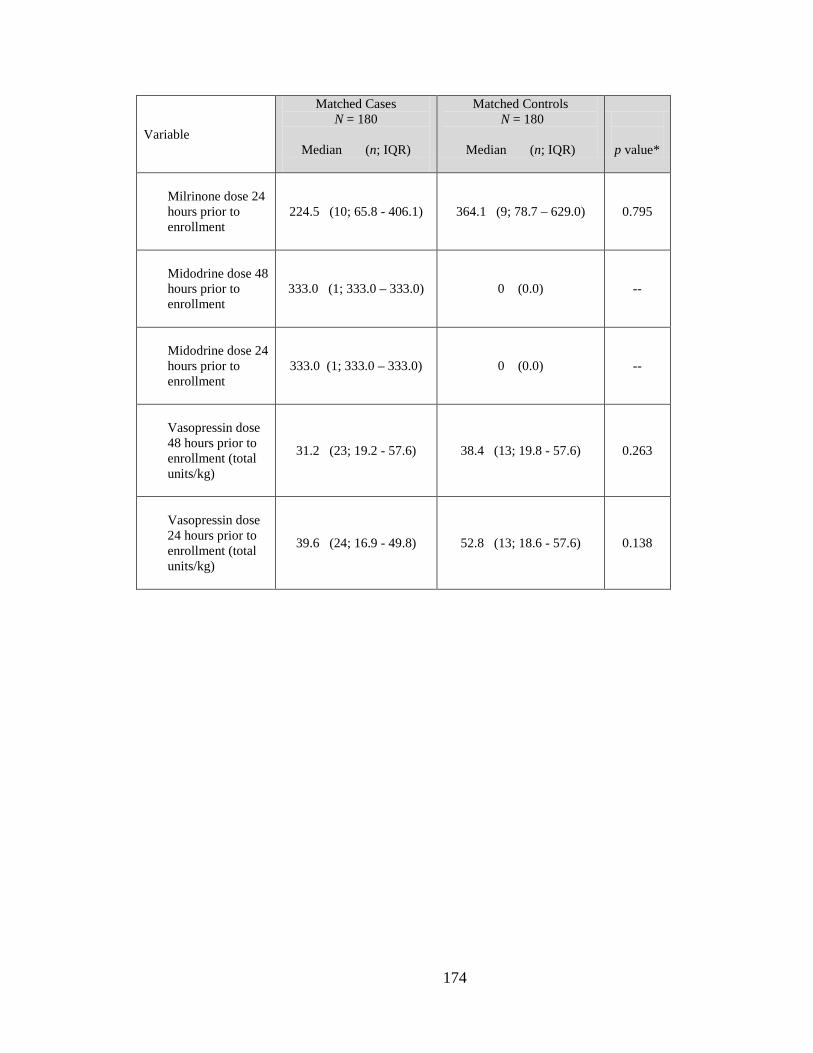
Variable
Matched Cases N = 180
Median (n; IQR)
Matched Controls N = 180
Median (n; IQR)
p value*
Milrinone dose 24 hours prior to enrollment
224.5 (10; 65.8 - 406.1)
364.1 (9; 78.7 – 629.0)
0.795
Midodrine dose 48 hours prior to enrollment
333.0 (1; 333.0 – 333.0)
0 (0.0) --
Midodrine dose 24 hours prior to enrollment
333.0 (1; 333.0 – 333.0)
0 (0.0) --
Vasopressin dose 48 hours prior to enrollment (total units/kg)
31.2 (23; 19.2 - 57.6) 38.4 (13; 19.8 - 57.6) 0.263
Vasopressin dose 24 hours prior to enrollment (total units/kg)
39.6 (24; 16.9 - 49.8) 52.8 (13; 18.6 - 57.6) 0.138
174

REFERENCES
Agency for Healthcare Research and Quality (n.d.). On time prevention of pressure
ulcers. Retrieved October 8, 2009 from http://www.ahrq.gov/research/pressureulcers/puqio2.htm
Aiken, L., Clarke, S., Cheung, R., Sloane, D., & Silber, J. (2003). Educational levels of
hospital nurses and surgical patient mortality. JAMA, 290(12), 1617-1623. Aiken, L., Clarke, S., Sloane, D., Lake, E., & Cheney, T. (2008). Effects of hospital care
environment on patient mortality and nurse outcomes. Journal of Nursing Administration, 38(5), 223-229.
Allman, R.M., Goode, P.S., Burst, N., Bartolucci, A.A., & Thomas, D.R. (1999).
Pressure ulcers, hospital complications, and disease severity: Impact on hospital costs and length of stay. Advances in Skin and Wound Care, 12 (1), 22-30.
Anthony, D., Reynolds, T., & Russell, L. (2000). An investigation into the use of serum
albumin in pressure sore prediction. Journal of Advanced Nursing, 32(2), 359-365.
Amlung, S.R., Miller, W.L., & Bosley, L.M. (2001). The 1999 national pressure ulcer
prevalence survey: A benchmarking approach. Advances in Skin and Wound Care, 14(6), 297–301.
Anthony, D., Parboteeah, S., Saleh, M., & Papanikolaou, P. (2008). Norton, Waterlow
and Braden scores: A review of the literature and a comparison between the scores and clinical judgment. Journal of Clinical Nursing, 17(5), 646-653.
Barnes, D., & Payton, R.G. (1993). Clinical application of the Braden Scale in the acute-
care setting. Dermatology Nursing, 5(5), 386-388. Benoit, R., & Mion, L. (2012). Risk factors for pressure ulcer development in critically ill
patients: A conceptual model to guide research. Research in Nursing & Health. Advance online publication. doi: 10.1002/nur.21481
Bergstrom, N., Braden, B., Kemp, M., Champagne, M., & Ruby, E. (1998). Multi-site
study of incidence of pressure ulcers and the relationship between risk level, demographic characteristics, diagnoses, and prescription of preventive interventions. Journal of the American Geriatric Society, 44(1), 22-30.
Bergstrom, N., Braden, B.J., Laquzza, A., & Holman, V. (1987). The Braden scale for
predicting pressure sore risk. Nursing Research, 36(4), 205-210.
175

Bergstrom, N., Demuth, P.J., & Braden, B.J. (1987). A clinical trial of the Braden Scale for predicting pressure sore risk. Nursing Clinics of North American, 22(2), 417-428.
Bours, G.J., De Laat, E., Halfens, R.J., & Lubbers, M. (2001). Prevalence, risk factors
and prevention of pressure ulcers in Dutch intensive care units: Results of a cross-sectional survey. Intensive Care Medicine, 27(10), 1599-1605.
Braden, B.J., & Bergstrom, N. (1987). A conceptual schema for the study of the etiology
of pressure sores. Rehabilitation Nursing, 12(1), 8-12, 16. Braden, B.J., & Bergstrom, N. (1994). Predictive validity of the Braden Scale for
pressure sore risk in a nursing home population. Research in Nursing & Health, 17(6), 459-470.
Brown, S.J. (2004). The Braden Scale: A review of the research evidence. Orthopaedic
Nursing, 23(1), 30-38. Burt, M.G., Johannsson, G., Umpleby, A.M., Chisholm, D.J., & Ho, K.Y. (2007). Impact
of acute and chronic low-dose glucocorticoids on protein metabolism. The Journal of Clinical Endocrinology & Metabolism, 92, 3923 – 3929.
Capobianco, M.L., & McDonald, D.D. (1996). Factors affecting the predictive validity
of the Braden Scale. Advances in Wound Care, 9(6), 32-36. Cardiovascular Physiology Concepts (n.d.). Mean aterial pressure. Retrieved March 11,
2010 from http://www.cvphysiology.com/Blood%20Pressure/BP006.htm Carlson, E.V., Kemp, M.G., & Shott, S. (1999). Predicting the risk of pressure ulcers in
critically ill patients. American Journal of Critical Care, 8(4), 262-269. Castle, N.G., & Engberg, J. (2009). The health consequences of using physical restraints
in nursing homes. Medical Care, 47(11), 1164-1173. Cereda, E., Zagami, A., Vanotti, A., & Pedrolli, C. (2008). Geriatric nutritional risk index
and overall-cause mortality prediction in institutionalised elderly: A 3-year survival analysis. Clinical Nutrition, 27(5), 717-723.
Cho, I., & Noh, M. (2010). Braden Scale: Evaluation of clinical usefulness in an intensive
care unit. Journal of Advanced Nursing, 66(2), 293-302. Courtney, B.A., Ruppman, J.B., & Cooper, H.M.(2006) Save our skin: Initiative cuts
pressure ulcer incidence in half. Nursing Management, 37(4), 36, 38, 40.
176
Cuddington, J., Ayello, E.A., & Sussman, C. (2001). Pressure ulcers in America: Prevalence, incidence, and implication for the future. Reston, VA: National Pressure Ulcer Advisory Panel
Cummings, S.R., Browner, W.S., & Hulley, S.B. (2007). Conceiving the research
question. In S.B. Hulley, S.R. Cummings, W.S. Browner, D.G. Grady, & T.B.Newman, (Eds.). Designing Clinical Research (3rd ed.). (pp. 17-26). New York: Lippincott Williams & Wilkins.
Cummings, S.R., Newman, T.B., & Hulley, S.B. (2007). Designing a cohort study. In
S.B. Hulley, S.R. Cummings, W.S. Browner, D.G. Grady, & T.B.Newman, (Eds.). Designing Clinical Research (3rd ed.). (pp. 97-107). New York: Lippincott Williams & Wilkins.
Defloor, T. (1999). The risk of pressure sores: A conceptual scheme. Journal of Clinical
Nursing, 8(2), 206-216. de Laat, E., Schoonhoven, L, Pickkers, P., Verbeek, A., & van Achterberg, T. (2006).
Epidemiology, risk and prevention of pressure ulcers in critically ill patients: A literature review. Journal of Wound Care, 16(6), 269-275.
Duffy, M.E., & Jacobsen, B.S. (2005). Univariate descriptive statistics. In B.H. Munro,
(Ed.). Statistical Methods for Health Care Research (5th ed.). (pp. 33-72). Baltimore: Lippincott Williams & Wilkins.
Eachempati, S.R., Hydo, L.J., & Barie, P.S. (2001). Factors influencing the development
of decubitus ulcers in critically ill surgical patients. Critical Care Medicine, 29(9), 1678-1682.
Ely, E.W., Inouye, S.K., Bernard, G.R., Gordon, S., Francis, J., May, L., Truman, B. et
al. (2001). Delirium in mechanically ventilated patients: validity and reliability of the confusion assessment method for the intensive care unit (CAM-ICU). Journal of the American Medical Association 286(21), 2703-2710.
Ely, E.W., Margolin, R., Francis, J., May, L., Truman, B., Dittus, R. et al. (2001).
Evaluation of delirium in critically ill patients: validity of the Confusion Assessment Method for the Intensive Care Unit (CAM-ICU). Critical Care Medicine, 29(7), 1370-1379.
Ely, E.W., Truman, B., Shintani, A., Thomason, J.W., Wheeler, A.P., Gordon, S. et al.
(2003). Monitoring sedation status over time in ICU patients: reliability and validity of the Richmond Agitation-Sedation Scale (RASS). Journal of the American Medical Association, 289(22), 2983-2991.
177

Fan, E., Shahid, S., Kondreddi, V.P., Bienvenu, O.J., Mendez-Tellez, P.A., Pronovost, P.J., & Needham, D.M. (2008). Informed consent in the critically ill: A two-step approach incorporating delirium screening. Critical Care Medicine, 36(1), 94-99.
Fife, C., Otto, G., Capsuto, E.G., Brandt, K., Lyssy, K., Murphy, K., et al. (2001).
Incidence of pressure ulcers in a neurologic intensive care unit. Critical Care Medicine, 29(2), 283-290.
Fisher, A., Wells, G., & Harrison, M. (2004). Factors associated with pressure ulcers in
Adults in Acute Care Hospitals. Holistic Nursing Practice, 18(5), 242 – 253. Flattau, A., & Bank, A.E. (2012). Risk factor for 90-day and 180-day mortality in
hospitalized patients with pressure ulcers. International Wound Journal. Advance online publication. doi: 10.1111/j.1742-481X.2012.01032.x.
Forrest, P. (n.d.). Vasopressors. Retrieved July 15, 2008, from http://www.usyd.edu.au
/anaes/lectures/pforrest/Vasopressor%20lecture%20-Part%201.htm Fromantin, I., Falcou, M.C., Baffie, A., Petot, C., Mazerat, R., Jaouen, C., Teot, L, &
Ryche, Y. (2011). Inception and validation of a pressure risk scale in oncology. Journal of Wound Care, 20(7), 328-330, 334.
Gefen, A. (2008). How much time does it take to get a pressure ulcer? Integrated
evidence from human, animal, and in vitro studies. Wound and Ostomy Management, 54(10), 26-28, 30-35.
Goodridge, D.M., Sloan, J.A., LeDoyen, Y.M., McKenzie, J.A., Knight, W.E., & Gayari,
M. (1998). Risk-assessment scores, prevention strategies, and the incidence of pressure ulcers among the elderly in four Canadian health-care facilities. Canadian Journal of Nursing Research, 30(2), 23-44.
Hagisawa, S., & Barbenel, J. (1999). The limits of pressure sore prevention. Journal of
the Royal Society of Medicine, 92(11), 576 – 578. Halfens, R.J., Van Achterberg, T., & Bal, R.M. (2000). Validity and reliability of the
Braden Scale and the influence of other risk factors: A multi-centre prospective study. International Journal of Nursing Studies, 37(4), 313-319.
Horn, S.D., Buerhaus, P., Bergstrom, N., & Smout, R.J. (2005). RN staffing time and
outcomes of long stay nursing home residents: Pressure ulcers and other adverse outcomes are less likely as RNs spend more time on direct patient care. American Journal of Nursing, 105(11), 58-70.
Horner, R.D., Sloane, R.J., & Kahn, K.L.(1998). Is use of mechanical ventilation a
reasonable proxy indicator for coma among medicare patients hospitalized for acute stroke? HSR: Health Services Research, 32(6), 841-859
178
Hulley, S.B., Martin, J., & Cummings, S.R.(2007). Planning the measurements: Precision
and accuracy. In S.B. Hulley, S.R. Cummings, W.S. Browner, D.G. Grady, & T.B.Newman, (Eds.). Designing Clinical Research (3rd ed.). (pp. 37-49). New York: Lippincott Williams & Wilkins.
Hulley, S.B., Newman, T.B., & Cummings, S.R.(2007). Choosing the study subjects:
Specification, sampling, and recruitment. In S.B. Hulley, S.R. Cummings, W.S. Browner, D.G. Grady, & T.B.Newman, (Eds.). Designing Clinical Research (3rd ed.). (pp. 27-36). New York: Lippincott Williams & Wilkins.
Institute for Healthcare Improvement (2008). 5 million lives campaign. Getting started
kit: Prevent pressure ulcers how-to guide. Retrieved October 8, 2009 from www.ihi.org
Jeejeebhoy, K.N. (2004). Nutritional assessment. In L.R. Johnson (Ed.). Encyclopedia of
Gastroenterology. (pp. 759-766). Academic Press: Elsevier. Jiricka, M.K., Pyan, P., Carvalho, M.A., & Bukvich, J. (1995). Pressure ulcer risk factors
in an ICU population. American Journal of Critical Care, 4(5), 361-367. Kane, R.L. (2006). Introduction. In R.L. Kane (Ed.). Understanding health care
outcomes research (2nd ed., pp. 3-22). Sudbury, MA: Jones and Bartlett. Keller, B.P., Wille, J., van Ramshorst, B., & van der Werken, C. (2002). Pressure ulcers
in intensive care patients: A review of risks and prevention. Intensive Care Medicine, 28(10), 1379-1388.
Kernozek, T.W., Wilder, P.A., Amundson, A., & Hummer, J. (2002). The effects of
body mass index on peak seat-interface pressure of institutionalized elderly. Archives of Physical Medicine and Rehabilitation, 83(2), 868-871.
Klabunde, R.E. (2011). Cardiovascular physiology concepts (2nd ed.). New York:
Lippincott Williams & Wilkins. Kottner, J., & Dassen, T. (2008). An interrater reliability study of the Braden scale in two
nursing homes. International Journal of Nursing Studies, 45(10), 1501-1511. Kottner, J., & Dassen, T. (2010). Pressure ulcer risk assessment in critical care: Interrater
reliability and validity studies of the Braden and Waterlow scales and subjective ratings in two intensive care units. International Journal of Nursing Studies, 47, 671-677.
Kottner, J., Dassen, T., & Tannen, A. (2009). Inter-and intrarater reliability of the
Waterlow pressure sore risk scale: A systematic review. International Journal of Nursing Studies, 46(3), 369-379.
179

Kottner, J., Halfens, R., & Dassen, T. (2009). An interrater reliability study of the
assessment of pressure ulcer risk using the Braden scale and the classification of pressure ulcers in a home care setting. International Journal of Nursing Studies,46(10), 1307-1312.
Kurtzman, E.T., & Corrigan, J.M. (2007). Measuring the contribution of nursing to
quality, patient safety, and health care outcomes. Policy, Politics & Nursing Practice, 8(1), 20-36.
Langemo, D.K., Olson, B., Hunter, S., Hanson, D., Burd, C., & Cathcart-Silberberg, T.
(1991). Incidence and prediction of pressure ulcers in five patient care settings. Decubitus, 4(3), 25-26, 28, 30.
Leape, L.L., & Berwick, D.M. (2005). Five years after to err is human: What have we
learned? Journal of the American Medical Association, 293(19), 2384-2390. Lewicki, L.J., Mion, L.C., & Secic, M. (2000). Sensitivity and specificity of the Braden
Scale in the cardiac surgical population. Journal of Wound, Ostomy, and Continence Nursing, 27(1), 36-41.
Lewicki, L.J., Mion, L., Splane, K.G., Samstag, D., & Secic, M. (1997). Patient risk
factors for pressure ulcers during cardiac surgery. Association of Operating Room Nurses Journal,65(5), 933-942.
Lindgren, M., Unosson, M., Fredrikson, M., & Ek, A.C. (2004). Immobility- a major risk
factor for the development of pressure ulcers among adult hospitalized patients: A prospective study. Scandinavian Journal of Caring Sciences, 18, 57-64.
Lindgren, M.L., Unosson, M., Krantz, A., & Ek, A-C. (2005). Pressure ulcer risk factors
in patients undergoing surgery. Journal of Advanced Nursing, 50(6), 605-612. Lyder, C.H. (2003). Pressure ulcer prevention and management. Journal of the American
Medical Association, 298(2), 223-226. Lyder, C.H., Yu, C., Emerling, J., Mangat, R., Stevenson, D., Empleo-Frazier, O., &
McKay, J. (1999). The Braden Scale for pressure ulcer risk: Evaluating the predictive validity in Black and Latino/Hispanic elders. Applied Nursing Research, 12(2), 60-68.
Meijer J.H., Germs P.H., Schneider H. & Ribbe M.W. (1994).Susceptibility to decubitus
ulcer formation. Archives of Physical Medicine and Rehabilitation 75, 318-323. Mishel, M.H. (1989). Methodological studies: Instrument development. In P.J. Brink &
M.J. Wood (Eds.). Advanced design in nursing research (pp. 238-284). Newbury Park, CA: Sage.
180

Montalvo, I. (2007). The National Database of Nursing Quality Indicators. The Online
Journal of Issues in Nursing, 12(3) Retrieved February 2, 2009, from www.nursingworld.org /MainMenuCategories/ ANAMarketplace/ANA Periodicals /OJIN/TableofContents / Volume122007/No3Sept07/NursingQualityIndicators.aspx
National Institute for Health and Clinical Excellence. (2005). The management of
pressure ulcers in primary and secondary care: A clinical practice guideline. Retrieved September 5, 2011, from http://guidance.nice.org.uk/CG29/Guidance/Appendices/pdf/English
National Pressure Ulcer Advisory Panel. (2007). Pressure Ulcer Definition and Staging.
Retrieved July 10, 2008 from http://www.npuap.org/pr2.htm National Quality Measures Clearinghouse. (n.d.). National Quality Measures
Clearinghouse: Domains. Retrieved October 10, 2009 from www.qualitymeasures.ahrq.gov
National Quality Forum. (2006). Serious reportable events in healthcare 2006 update: A
consensus report. Retrieved October 9, 2009, from http://www.qualityforum.org /Publications/2007/03/Serious_Reportable_Events_in_Healthcare–2006_Update.aspx
Needleman, J., Kurtzman, E.T., & Kizer, K.W. (2007). Performance measurement of
nursing care. Medical Care Research and Review, 64(Suppl.2), 10S-43S. doi: 10.1177/ 1077558707299260
Newman, T., Browner, W.S., Cummings, S.R., & Hulley, S.B.(2007). Designing studies
of medical tests. In S.B. Hulley, S.R. Cummings, W.S. Browner, D.G. Grady, & T.B.Newman, (Eds.). Designing Clinical Research (3rd ed.). (pp. 183-205). New York: Lippincott Williams & Wilkins.
Nijs, N., Toppets, A., Defloor, T., Bernaerts, K., Milisen, K., & Van Den Berghe,
G.(2008). Incidence and risk factors for pressure ulcers in the intensive care unit. Journal of Clinical Nursing, 18(9), 1258-1266.
Nixon, J. (2001). The pathophysiology and aetiology of pressure ulcers. In M.J. Morison
& L. van Rijswijk (Eds.). The prevention and treatment of pressure ulcers (pp. 17-36). St. Louis: Mosby.
Nonnemacher, M., Stausberg, J., Bartoszek, G., Lottko, B., Neuhaeuser, M., & Maier, I.
(2008). Predicting pressure ulcer risk: A multifactorial approach to assess risk factors in a large university hospital population. Journal of Clinical Nursing, 18(1), 99-107.
181
Pancorbo-Hidalgo, P. L., Garcia-Fernandez, F. P., Lopez-Medina, I. M., & Alvarez-Nieto, C. (2006). Risk assessment scales for pressure ulcer prevention: A systematic review. Journal of Advanced Nursing, 54(1), 94-110.
Pang, S., & Wong, T. (1998). Predicting pressure sore risk with the Norton, Braden, and
Waterlow scales in a Hong Kong rehabilitation hospital. Nursing Research, 47(3), 147-153.
Papantonio, CT, Wallop, J.M., & Kolodner, K.B. (1994). Sacral ulcers following cardiac
surgery: Incidence and risks. Advances in Wound Care, 7(2), 24-36. Park-Lee, E., & Caffrey, C. (2009). Pressure ulcers among nursing home residents:
United States, 2004. NCHS Data Brief, U.S. Department of Health and Human Services Centers for Disease Control. Retrieved October 8, 2009 from www.cdc.gov/ nchs/data/ databriefs/ db14.htm
Parish, L.C., Witkowski, J.A., & Crissey, J.T. (1997). The decubitus ulcer in clinical
practice. New York: Springer. Pronovost, P.J., Goeschel, C.A., & Wachter, R.M. (2008). The wisdom and justice of not
paying for “preventable complications.” Journal of the American Medical Association, 299(18), 2197-2199.
Reddy, M., Gill, S.S., & Rochon, P.A. (2006). Preventing pressure ulcers: A systematic
review. Journal of the American Medical Association, 296(8), 974-984. Redelings, M.D., Lee, N.E., & Sorvillo, F. (2005). Pressure ulcers: More lethal than we
thought? Advances in Skin and Wound Care, 18(7), 367-372. Reswick, J.B., & Rogers, J.E. (1975). Experience at Rancho Los Amigos Hospital with
devices and techniques to prevent pressure sores. In R.M. Kenedi & J.M. Cowden (Eds.), Bedsore biomechanics (pp. 301-301). Baltimore: University Park Press.
Russo, C.A., & Elixhauser, A. (2006). Hospitalizations related to pressure sores, 2003
(Healthcare Cost and Utilization Project [HCUP] Statistical Brief #3). Retrieved from Agency for Healthcare Research website: http://www.hcup-us.ahrq.gov/reports / statbriefs/sb3.pdf
Salvadalena, G.D., Snyder, M.L., & Brogdon, K.E. (1992). Clinical trial of the Braden
scale on an acute care medical unit. Journal of Enterostomal Nursing, 19(5), 160-165.
Sayar, S., Turgut, S., Dogan, H., Ekici, A., Yurtsever, S., Demirkan, F., Doruk, N., &
Tasdelen, B. (2008). Incidence of pressure ulcers in intensive care unit pateints at risk according to the Waterlow scale and factors influencing the development of pressure ulcers. Journal of Clinical Nursing, 18(5), 765-774.
182

Schoonhoven, L., Defloor, T., van der Tweel, I., Buskens, E., & Grypdonick, M. (2002).
Risk indicators for pressure ulcers during surgery. Applied Nursing Research, 16(2), 163-173.
Seago, J.A., Williamson, A., Atwood, C. (2006). Longitudinal analysis of nurse staffing
and patient outcomes. Journal of Nursing Administration, 36(1), 13-21. Seeley, R.R., Stephens, T.D., & Tate, P. (2006). Anatomy and physiology (7th ed.). St.
Louis: McGraw-Hill. Seongsook, J., Ihnsook, J., & Younghee, L. (2004). Validity of pressure ulcer risk
assessment scales: Cubbin and Jackson, Braden, and Douglas scales. International Journal of Nursing Studies, 41(2), 199-204.
Sessler, C.N., Gosnell, M.S., Grap, M.J., Brophy, G.M., O’Neal, P.V., Keane, K.A., et al.
(2002). The Richmond Agitation-Sedation scale: validity and reliability in adult intensive care unit patients. American Journal of Respiratory and Critical Care Medicine, 166(10), 1338-1344.
Skin Anatomy. Encyclopedia Britannica. (n.d.). Retrieved May 29, 2008, from
http://www.britannica.com/EBchecked/topic /547591/human-skin/26790/Blood-and-lymph-vessels
Shander, A., Javidroozi, M., Ozawa, S., & Hare, G.M. (2011). What is really dangerous:
Anaemia or transfusion? British Journal of Anesthesia, 107(Suppl. 1), i41-i59. Springle, S. (2000). Effects of forces and the selection of support surfaces. Topics in
Geriatric Rehabilitation, 16(2), 47-62. Stinson, M.D., Porter-Armstrong, A., & Eakin, P. (2003). Seat-interface pressure: A pilot
study of the relationship to gender, body mass index, and seating position. Archives of Physical Medicine and Rehabilitation, 84( 3), 405-409.
Stordeur, S., Laurent, S., & D’Hoore, W. (1998). The importance of repeated risk
assessment for pressure sores in cardiovascular surgery. Journal of Cardiovascular Surgery, 39(3), 343-349.
Theaker, C., Mannan, M., Ives, N., & Soni, N.(2000). Risk factors for pressure sores in
the critically ill. Anaesthesia, 55(3), 221-224. Thompson, D. (2005). Tissue viability: An evaluation of the Waterlow pressure ulcer
risk-assessment tool. British Journal of Nursing, 14, 455-459.
183

Tschannen, D., Bates, O, Talsma, A., Guo, Y. (2012). Patient-specific and surgical characteristics in the development of pressure ulcers. American Journal of Critical Care, 21: 116 – 125.
VandenBosch, T., Montoye, C., Satwicz, M., Durkee-Leonard, K., & Boylan-Lewis, B.
(1996). Predictive validity of the Braden Scale and nurse perception in identifying pressure ulcer risk. Applied Nursing Research, 9(2), 80-86.
VanGilder C, MacFarlane G, Meyer S, & Lachenbruch C. (2009). Body mass index,
weight, and pressure ulcer prevalence: An analysis of the 2006-2007 international pressure ulcer prevalence surveys. Journal of Nursing Care Quality, 24(2), 127-135.
VanGilder, C., Amlung, S., Harrison, P., & Meyer, S. (n.d.). Results of the 2008 – 2009
International Pressure Ulcer Prevalence™ Survey and a 3-year, acute care, unit-specific analysis. Ostomy and Wound Management. Retrieved September 15, 2011 from http://www.o-wm.com/content/results-2008-%E2%80%93-2009-international-pressure-ulcer-prevalence%E2%84%A2-survey-and-a-3-year-acute-care-
van Rijswijk, L. (2001). Epidemiology. In M.J. Morison & L. van Rijswijk (Eds.). The
prevention and treatment of pressure ulcers (pp. 7-15). St. Louis: Mosby. Wachter, R.M., Foster, N.E., & Dudley, R.A. (2008). Medicare’s decision to withhold
payment for hospital errors: The devil is in the details. Joint Commission Journal on Quality and Patient Safety, 34(2), 116-123
Whittington, K.T., & Briones, R. (2004). National prevalence and incidence study: 6-year
sequential acute care data. Advances in Skin and Wound Care, 17(9), 490-494. Wood, J. M., & Ross-Kerr, J.C. (2006). Basic steps in planning nursing research: From
question to proposal (6th ed.). Boston: Jones and Bartlett.
184