Submittal of Semi-Annual Effluent and Environmental ...Irigaray wellfield restoration operations...
427
............ ... :... : .. : .' .. :.: ": .. :. -:. "::.. :.:.:.:.:.... ..... COGEMA Mining, Inc. February 29, 2000 DOCKET NO. 40-8502 License No. SUA-1341 Dr. Blair Spitzberg Section Chief U. S. Nuclear Regulatory Commission Division of Nuclear Material Safety - Region IV 611 Ryan Plaza Drive, Suite 400 Arlington, Texas 76011-8064 RE. submittal of Semi-Annual Effluent and Environmental Monitoring Report, Irigary and Christensen Ranch Projects Dear Dr. Spitzberg: Pursuant to Condition Nos. 9.2 and 12.1 of Source Material License No. SUA-1341, please find attached two copies of the Semi-Annual Effluent and Environmental Monitoring Report covering July through December, 1999 for COGEMA Mining Inc.'s Irigary and Christensen Ranch ISL projects. Please contact me if you should have any questions regarding the attached report, or require additional information. Sincerely, T. W. Hardgrove Manager, Environmental and Regulatory Services Attachment ..... . .. • .. • , .. . cc: NRC/Headquarters - Rockville, MD WDEQ -R. Giurgevich, District III ... ~ .. .. ... COGEMA - DL. Wichers CMiGEMA- J. Vaselin, C. Toal 935 PENDELL BOULEVARD, P.O. BOX 730, MILLS, WYOMING 82644 TEL: (307) 234-5019 FAX: (307) 473-7306
Transcript of Submittal of Semi-Annual Effluent and Environmental ...Irigaray wellfield restoration operations...

............ ... :...
: .. : .' ..:.: ": .. :.
-:. "::.. :.:.:.:.:.... . . . . .
COGEMAMining, Inc.
February 29, 2000 DOCKET NO. 40-8502License No. SUA-1341
Dr. Blair SpitzbergSection ChiefU. S. Nuclear Regulatory CommissionDivision of Nuclear Material Safety - Region IV611 Ryan Plaza Drive, Suite 400Arlington, Texas 76011-8064
RE. submittal of Semi-Annual Effluent and Environmental Monitoring Report,Irigary and Christensen Ranch Projects
Dear Dr. Spitzberg:
Pursuant to Condition Nos. 9.2 and 12.1 of Source Material License No. SUA-1341, please findattached two copies of the Semi-Annual Effluent and Environmental Monitoring Report coveringJuly through December, 1999 for COGEMA Mining Inc.'s Irigary and Christensen Ranch ISLprojects.
Please contact me if you should have any questions regarding the attached report, or requireadditional information.
Sincerely,
T. W. HardgroveManager, Environmental and Regulatory Services
Attachment
..... . .. • . . • , . . .
cc: NRC/Headquarters - Rockville, MDWDEQ -R. Giurgevich, District III
... ~ .. .. ...
COGEMA - DL. WichersCMiGEMA- J. Vaselin, C. Toal
935 PENDELL BOULEVARD, P.O. BOX 730, MILLS, WYOMING 82644TEL: (307) 234-5019 FAX: (307) 473-7306

vCOGEMA7 Mining, Inc.
IRIGARAY AND CHRISTENSEN RANCH PROJECTS
SEMI-ANNUAL EFFLUENT REPORT (10 CFR 40.65)July 1, 1999 - December 31, 1999
NRC LICENSE SUA-1341Docket No. 40-8502
andPERMIT TO MINE No.478WDEQ
-wFebruary, 2000

COGEMA Mining, Inc.Irigaray and Christensen Ranch Projects
SEMI-ANNUAL EFFLUENT AND MONITORING REPORTJuly 1, 1999 through December 31, 1999
Source Material License No. SUA-1341Docket No. 40-8502
andWyoming Permit To Mine No. 478
February, 2000

SEMI-ANNUAL EFFLUENT AND MONITORING REPORTJuly 1, 1999 through December 31, 1999Irigaray and Christensen Ranch Projects
1.0 INTRODUCTION
In accordance with Section 12.1 of the NRC Source Material License No. SUA-1341, and-requirements of WDEQ Permit to Mine No. 478, COGEMA Mining, Inc. (COGEMA) herebysubmits the results of the Irigaray and Christensen Ranch Project effluent and environmentalmonitoring programs for the semi-annual report period of July 1, 1999 through December 31,1999.
2.0 OPERATIONAL MONITORING DATA
2.1 Operations Summary
2.1.1 Operations Summary - Irigaray Project
Irigaray plant production operations consisted of processing uranium loaded resin from theChristensen Ranch Project. This involves elution of the resin and. then precipitation, filtering anddrying of the yellowcake. During the 6 month report period, a total of 103,538 pounds of uraniumas U30 8 was captured. The plant restoration operations consisted of treating wellfieldgroundwater with reverse osmosis filtration units.
Irigaray wellfield restoration operations continued in Production Units 8 and 9, which are in thereverse osmosis filtration/permeate injection phase.
The layout of the Irigaray Project is shown on the Irigaray Project - General Location Map,located in Appendix 4.
2.1.2 Operations Summary - Christensen Ranch Project
Christensen plant production operations consisted of processing wellfield recovery solutionsthrough ion exchange resin columns, and then transporting the loaded resin to the IrigarayProject. The stripped resin is then transported back to the Christensen Ranch Project for reuse.The plant restoration operations consisted of treating wellfield groundwater with reverse osmosisfiltration units.
Christensen wellfield production operations were conducted in Mine Unit 5, wellfield modules5-1, 5-3, 5-5, and in Mine Unit 6, wellfield modules 6-2, 6-5 and 6-6. Wellfield restorationoperations continued in Production Unit 3, wellfield module 3-1, which is in the reverse osmosisfiltration/permeate injection phase.
The layout of the Christensen Ranch Project is shown on the Christensen Project - GeneralLocation Map, located in Appendix 4.
- I -

2.2 Injection and Recovery Activities
2.2. 1 Volumes Injected and Recovered
Volumes injected and recovered from the wellfields at the Irigaray and Christensen Ranch Projectsare listed in the following tables. All volumes injected or recovered at the Irigaray Project arefrom restoration activities. The average production recovery flow rate at the Christensen RanchProject was 1,841 gpm for the 6 month period. Note that the NRC and DEQ licenses authorizea maximum flow rate of 4,000 gallons per minute, exclusive of restoration flow. The averageproduction bleed at the Christensen Ranch Project was 38.2 gpm, which equaled 2.1 % of the totalproduction recovery.
Irigaray Project - Restoration Flow Volumes (Mine Units 8-9)
1999 Gallons Injected Gallons Recovered Average RecoveryMonth x 1,000 x 1,000 Flow Rate (gpm)
July 6,830 7,920 196
August 9,221 10,573 213
September 7,604 8,667 215
October 8,640 10,267 205
November 7,246 8,216 204
December 7,414 8,269 205
46,955 53,912 206total total 6 month average
Christensen Ranch Project - Production Flow Volumes (Mine Units 5 & 6)
1999 Gallons Injected Gallons Recovered Average RecoveryMonth x 1,000 x 1,000 Flow Rate (gpm)
July 59,531 60,694 1,505
August 89,461 90,715 1,827
September 77,364 78,398 1,960
October 91,883 95,775 1,904
November 75,299 76,525 1,902
December 76,757 78,153 1,938
470,295 480,260 1,841total total 6 month average
2-

Christensen Ranch Project - Restoration Flow Volumes (Mine Unit 3)
1999 Gallons Injected Gallons Recovered Average RecoveryMonth x 1,000 x 1,000 Flow Rate (gpm)
July 5,939 8,411 209
August 7,257 10,504 209
September 5,521 8,263 206
October 6,318 9,493 188
November 5,379 7,926 197
December 5,633 7,887 196
36,047 52,484 201total total 6 month average
2.2.2 Mechanism for Determining Volumes
Recovery and injection gallons from the Irigaray Project were calculated by totalizing flow meterson the recovery and injection trunklines.
At the Christensen Ranch Project, recovery and injection gallons were calculated by totalizing flowmeters on the plant recovery and injection trunklines. Individual well meters are also monitoredfor flow comparison, wellfield balance and backup purposes.
2.2.3 Injection Manifold Pressures
Injection manifold pressures are regulated to keep wellhead pressures from exceeding the limitsspecified in Section 11.1 of the NRC license (120 psi at the Irigaray Project and 140 psi at theChristensen Ranch Project). Section 11.1 of the NRC license also requires that the injectionmanifold pressures be recorded daily. However, to better monitor the injection pressures, chartrecorders continuously record the injection manifold pressures at each wellfield module.
The recorders at the Christensen Project showed occasional short-term pressure readings whichexceeded the 140 psi operating pressure limit, but remained below the maintenance limit of 168psi. These instances resulted from activities such as flow adjustments, electrical power failures,and injection pump stop and/or restart. Whenever an instance such as this occurs, the operatoror foreman makes a notation on the appropriate form explaining the exceedance.
No exceedances of the 120 psi operating pressure limit were recorded at the Irigaray Project.
-3

2.3 Waste Water Control
2.3.1 Evaporation Ponds
Weekly inspections were conducted at the eleven lined evaporation ponds at the Irigaray Project, andthe four lined evaporation ponds and one unlined permeate storage pond at the Christensen RanchProject. No freeboard exceedances were observed during this reporting period.
2.3.2 Deep Disposal Well
To date, a total of 23,174,496 gallons has been injected into COGEMA's Class I injection well,COGEMA DW No. 1, located at the Christensen Ranch Project.
2.4 Well Integrity Test Summary
Mechanical integrity testing was conducted on a total of 201 wells from Mine Units 6, 7, and 9 atthe Irigaray Project, and Mine Unit 3 at the Christensen Ranch Project. A total of 11 well failures(5.4%) were located. A plan for utilization or abandonment of these wells will be submitted to theNRC and DEQ. The testing was done to meet the requirement for well retesting after five years ofoperation. No new wells were tested since none were installed. A summary of all mechanicalintegrity test results is given in Appendix 1.
3.0 EFFLUENT AND ENVIRONMENTAL MONITORING DATA
3.1 Surface Water Monitoring Data
3.1.1 Routine Surface Water Monitoring
Requirements for surface water monitoring include quarterly grab samples from upstream anddownstream Willow Creek locations at both the Irigaray and Christensen Ranch Projects. Inaddition, Willow Creek samples are collected from Willow Creek immediately adjacent to theoperating wellfields at both projects. The sampling locations are given on the EnvironmentalMonitoring Station Locations map located in Appendix 4 of this report. The sample analysis dataare given in Table 1, located at the end of the text portion of this report along with all other tables.No abnormal results were found and no trends were noted. A Powder River sample is collected onan annual basis during late spring, therefore, none was conducted during this report period.
3.1.2 NPDES Monitoring Program
Surface discharge occurred at the Irigaray Project from discharge point #001 intermittently and wassampled in accordance with the provisions of Wyoming NPDES Permit No. WY0028801. Thedischarge consisted of treated groundwater sweep solutions generated during the aquifer restorationin Production Units 8 and 9, as well as treated water from the restoration ponds.
On August 23, 1999, the Wyoming Department of Environmental Quality, Water Quality Division's,Technical Support Section was notified that based on Part 2, A., 2, C., of COGEMA's NPDESDischarge Permit No. WY 0028801, an exceedance of permit effluent limitations occurred because
4-

of an unanticipated noncompliance due to an upset of the Irigaray reverse osmosis system (RO).
On August 21, 1999, during routine inspection of the Irigaray surface discharge RO system, the plantoperator discovered the conductivity of the surface discharge to be approximately 10,000 umhos/cm 2.The surface discharge was immediately discontinued. A sample of the surface discharge wascollected and delivered to the on-site laboratory and analyzed for conductivity and uranium. Theanalysis showed a conductivity of 9,730 um.hos/cm 2 and a natural uranium concentration of 51.3mg/l (as U). An investigation revealed that an inter-connector "0" ring in the RO had failed,allowing discharge water to by-pass the RO membrane. An exact determination of total gallonsdischarged was not possible since it could not be determined exactly when the failure occurred. Itis known that the surface discharge was started at 1:00 P.M. on August 21, 1999. If the assumptionis made that the failure occurred at the start-up of the RO, then the maximum amount of water thatcould have been discharged from start-up to the discovery of the high conductivity's would be 14,597gallons. The RO system was immediately repaired and has since operated properly.
The Discharge Monitoring Report for the month of August listed the maximum monthly average fortotal natural uranium at 25.7 mg/l. This average is not representative of the true monthly averagebut is the result of averaging the short duration, unanticipated noncompliance sample with theroutine monthly sample. The routine monthly sample listed the natural uranium concentration at0.1420 mg/l. The sample analysis data are given in Tables 2A and 2B. Note that no dischargeoccurred during-the report period at the Christensen Ranch Project (discharge point #002) under theWyoming NPDES Permit No. WY0033642.
3.1.3 Evaporation Pond Analysis
Sampling of the evaporation ponds is conducted on a quarterly basis. The sample analysis data aregiven in Table 3.
3.2 Groundwater Monitoring Program Results
3.2.1 lrigaray and Christensen Ranch Projects
Sampling of the monitor and trend wells is conducted on a weekly, biweekly, monthly or quarterlybasis at the Irigaray and Christensen Ranch Projects. The sample time frame is dependant on thestatus of the well, or wellfield in which it is located. Sample analysis data from the monitor andtrend wells are given in Appendix 2. Locations of the monitor and trend wells are found on theGeneral Location Maps, located in Appendix 4.
Ten monitor wells were on excursion status during this report period. Seven of these wells are atthe Irigaray Project, located within restored wellfields or wellfields undergoing restoration. Theother three wells are located at the Christensen Ranch Project, two of which were removed fromexcursion status and are summarized below.
Perimeter Ore Zone Monitor Well 6MW4: Christensen Production Unit 6.Date of Initial Excursion: July 9, 1999 Date of Excursion Termination: August 2, 1999
Interior Shallow Zone Monitor Well 6MW2 1: Christensen Production Unit 6.
-5-

Date of Initial Excursion: October 8, 1999 Date of Excursion Termination: December 6, 1999
Monthly and quarterly excursion status reports are submitted to the WDEQ and NRC, respectively.Therefore, the status of each monitor well which remained on excursion status will not be repeatedin this report.
3.2.2 Irigaray 517/USMT Test Site
Sampling of the 517/USMT site monitor wells is conducted on an annual basis during late spring,therefore, none was conducted during this report period.
3.2.3 Regional Groundwater Monitoring
Regional groundwater samples are collected on a quarterly basis from seven ranch wells at theChristensen Ranch Project and semi-annually from one ranch well at the Irigaray Project. Thesample analysis data are given in Table 4. No trends or abnormal results were noted. Note thatwater levels can not be obtained from any of the wells because they have closed plumbing systemswith no access for a water level probe. The sampling locations are provided on the EnvironmentalMonitoring Station Locations Map, located in Appendix 4.
3.3 Radiological Effluent Monitoring Data
3.3.1 Radon Gas
Radon gas is monitored continuously at six environmental air sampling locations at or near theIrigaray Project and at four locations at or near the Christensen Ranch Project. The samplinglocations are shown on the Environmental Monitoring Stations Location map, located in Appendix4. Outdoor air radon detectors are exchanged and analyzed quarterly by Landauer, Inc., aNVLAP accredited company. The sample analyses data are given in Table 5. No abnormal resultswere found.
In addition to the environmental radon monitoring, radon- release estimates are calculated for bothprojects during production and/or restoration operations. These estimates are based upon therelease rates given in the Calculation Of Annual Radon Emissions tables, of the approved licenseapplication. Table 7.3(A)-3, Christensen Ranch, lists a production release rate of 1,471 Ci/yearat a flow rate of 3,600 gpm (0.034 Ci/month/gpm), and a restoration release rate of 258 Ci/yearat a flow rate of 500 gpm (0.043 Ci/month/gpm). Table 7.3(A)-7, Irigaray, lists a restorationrelease rate of 351 Ci/year at a flow rate of 500 gpm (0.058 Ci/month/gpm). Using these factorsand the 6 month average flows listed in Section 2.2.1, the radon release to the environment duringthis report period is estimated as follows.
irigaray Project - Restoration (206 average gpm) 71.7 CuriesChristensen Ranch Project - Production (1,841 average gpm) 375.6 CuriesChristensen Ranch Project - Restoration (201 average gpm) 51.9 Curies
Total (July - December) 499.2 Curies
-6

3.3.2 Gamma Radiation
Gamma radiation is monitored continuously at five environmental air sampling locationssurrounding the Irigaray Project and at four locations surrounding the Christensen Ranch Project.TLDs are exchanged and analyzed quarterly by Thermo Nutech, a NVLAP accredited company.The dosimeter analysis data are given in Table 6. No abnormal results were found.
3.3.3 Dryer Stack Emissions
The yellowcake dryer operated for one campaign during the reporting period, for approximately35 days. A total of 173,101 pounds of yellowcake (as U308) were processed through the dryer.
Semi-annual isokinetic testing of the dryer stack for radiological and particulate emissions wasconducted by Western Environmental, Inc., on December 2, 1999. A copy of the emissions testreport is included as Appendix 3. A summary of the test results is as follows:
Constituent lbs./hour* 1 Ci/ml WDEQ Permit Limits
Total Particulate 0.014 (5 % of limit) --- 0.30 lbs/hour
Unat (Total as U308) 0.0107 6.67E- 10 ---
Thorium-230 (Total) --- 9.01E-14 ---
Radium-226 (Total) ... 1.53E-13 .--
Lead-210 (Total) --- 2.73E-12 ---
*Based on an average of analytical results from two tests.
3.3.4 Environmental Air Sampling
Environmental air particulate sampling was conducted on a continuous basis at five of the IrigarayProject environmental air sampling locations. Filters were changed weekly, then composited fora quarterly analysis of uranium, Radium-226, Thorium-230 and Lead-210. The sample analysisdata are given in Table 7A and 7B. All parameters were well below their effluent limits (<10%)given in Appendix B, Table 2, of 10 CFR Part 20. No trends or abnormal results were noted.
3.3.5 Soils and Vegetation
Soil and vegetation samples are collected on an annual basis during late spring, therefore, nonewas conducted during this report period.
4.0 CORRECTIVE ACTIONS/RECOMMENDATIONS
4.1 Wellfield Corrective Actions
Corrective actions for wellfields at the Irigaray and Christensen Ranch Projects consisted ofselected over-recovery, to draw back pockets of lixiviant to the weilfield. Over-recovery is
-7-

accomplished by reducing injection flow and/or increasing production flow, and is concentratednear monitor wells which show increasing trends or are on excursion status. Specific correctiveactions taken during the report period were given in the monthly and quarterly excursion statusreports submitted to the WDEQ and NRC, respectively.
5.0 OTHER INFORMATION REQUIRED BY NRC LICENSE SUA-1341
5.1 Bioassay Results
There were no employee urinalysis which exceeded the 15 ug/1 administrative level for uranium,specified in the Approved License Application.
6.0 RESTORATION PROGRESS: August 1999 - December 1999
6.1 Irigaray
Groundwater restoration activities at the Irigaray Site continued during this reporting period. Asummary of the status of each restoration area is provided below. A map of the Irigaray restorationwellfields is provided in Appendix 4.
0 Production Units 1 - 5: Restoration was completed in Units I through 3 in 1993. Restorationwas completed in Units 4 and 5 in August, 1998. No further actions have been' taken in thesewellfields pending submittal of the final restoration package for Production Units 1 through5. All -of Units 1 through 5 were mined with ammonium bicarbonate lixiviant, andCOGEMA feels it is best to present the restoration results of all Units 1 through 5 together.
0 Production Units 6 - 7: Units 6 and 7 are in a standby mode until the reverse osmosistreatment phase of restoration begins. The reverse osmosis treatment phase of restoration ison hold due to limitations of water storage at Irigaray.
* Production Units 8 - 9: Reverse osmosis treatment continued in Units 8 and 9 throughout thisreporting period. To date, 6.6 and 9.1 pore volume displacements, respectively, haveoccurred in Units 8 and 9 since the start of the reverse osmosis phase of restoration.Conductivity values have shown a steady and continuous decline since the start of the reverseosmosis phase of restoration in Units 8 and 9.
6.2 Christensen
Groundwater restoration activities at the Christensen site continued during this reporting period. Asummary of the status of each restoration area is provided below. A map of the Christensenrestoration wellfields is provided in Appendix 4.
Mine Unit 3: Reverse osmosis treatment continued in module 3-1. To date, 11.2 pore volumedisplacements have occurred in module 3-1. Conductivity values have shown a continuousdecline since the start of the reverse osmosis phase of restoration in module 3-1. The reverseosmosis phase of restoration will continue in modules 3-2, 3-3, and 3-4 on a module permodule basis dependent on the capability of disposing of water in the deep disposal wells and
-8

through pond evaporation.
* Mine Unit 2: A limited groundwater sweep continues in Mine Unit 2 at the time of thisreport. The reverse osmosis phase of restoration will follow in Unit 2 upon the completionof restoration efforts in Unit 3.
* Mine Unit 4: No restoration activities are currently being conducted in Mine Unit 4.
9-
TABLES

TABLE 1
COGEMA Mining, Inc.Semi-Annual Report, July - December, 1999NRC License SUA-1341
Date Collected:06-Aug-99Sample Location: IR-9, Downstream Willow Creek, IrigaraySample Type: Surface WaterAnalytical Laboratory: Energy Lab, Casper, WY.
ConcentrationRadionuclide (uCi/ml)
Error Estimate(uCi/ml)
LLD(uCi/ml)
Regulatory Guide4.14
LLD (uCi/ml)
10 CFR 20Appendix B
Table 2Limits (uCi/ml)
Effluent LimitExceedance
U (Total)Th-230 (Total)Ra-226 (Total)Pb-210 (Total)Po-210 (Total)
4.51 E-08<2.0 E-10<2.0 E-10<1.0 E-09<1.0 E-09
N/A (a) 2.0 E-102.0 E-102.0 E-101.0 E-091.0 E-09
2.0 E-102.0 E-102.0 E-101.0 E-091.0 E-09
3.0 E-071.0 E-076.0 E-081.0 E-084.0 E-08
NoNoNoNoNo
Concentration(mg/I)
Detection Limit(mg/I)
Regulatory Guide4.14
LLD (uCi/ml)
10 CFR 20Appendix B
Table 2Limits (uCi/ml)
Effluent LimitExceedanceChemical Parameters
Total AlkalinityClTDSSpecific ConductivityS04pHAsSe
Estimated Flow Rate: Low
116135
7360830046808.030.0040.032
11
211
0.010.0010.001
N/AN/AN/AN/AN/AN/AN/AN/A
N/AN/AN/AN/AN/AN/AN/AN/A
N/AN/AN/AN/AN/AN/AN/AN/A
Low = <5 cfsMedium = 5 - 50 cfsHigh = > 50 cfs
N/A = Not Applicable(a) Uranium is a chemical rather than radiometric analysis. With no counting times there is no error estimate.

TABLE 1 (contd)
COGEMA Mining, Inc.Semi-Annual Report, July - December, 1999NRC License SUA-1 341
Date Collected:06-Aug-99Sample Location: IR-14, Upstream Willow Creek, IrigaraySample Type: Surface WaterAnalytical Laboratory: Energy Lab, Casper, WY.
ConcentrationRadionuclide (uCi/ml)
Error Estimate(uCi/ml)
LLD(uCi/ml)
Regulatory Guide4.14
LLD (uCi/ml)
10 CFR 20Appendix B
Table 2Limits (uCi/ml)
Effluent LimitExceedance
U (Total)Th-230 (Total)Ra-226 (Total)Pb-210 (Total)Po-210 (Total)
1.24 E-08<2.0 E-10<2.0 E-10<1.OE-09<1.OE-09
N/A (a) 2.0 E-102.0 E-102.0 E-101.0 E-091.0 E-09
2.0 E-102.0 E-102.0 E-101.0 E-091.0 E-09
3.0 E-071.0 E-076.0 E-081.0 E-084.0 E-08
NoNoNoNoNo
Concentration(mg/I)
Detection Limit(mg/I)
Regulatory Guide4.14
LLD (uCi/ml)
10 CFR 20Appendix B
Table 2Limits (uCi/ml)
Effluent LimitExceedanceChemical Parameters
Total AlkalinityClTDSSpecific ConductivityS04pHAsSe
8384.54910567029608.000.0040.003
11
211
0.010.0010.001
N/AN/AN/AN/AN/AN/AN/AN/A
N/AN/AN/AN/AN/AN/AN/AN/A
N/AN/AN/AN/AN/AN/AN/AN/A
Estimated Flow Rate: Low
Low = <5 cfsMedium = 5 - 50 cfsHigh > 50 cfs
N/A = Not Applicable(a) Uranium is a chemical rather than radiometric analysis. With no counting times there is no error estimate.
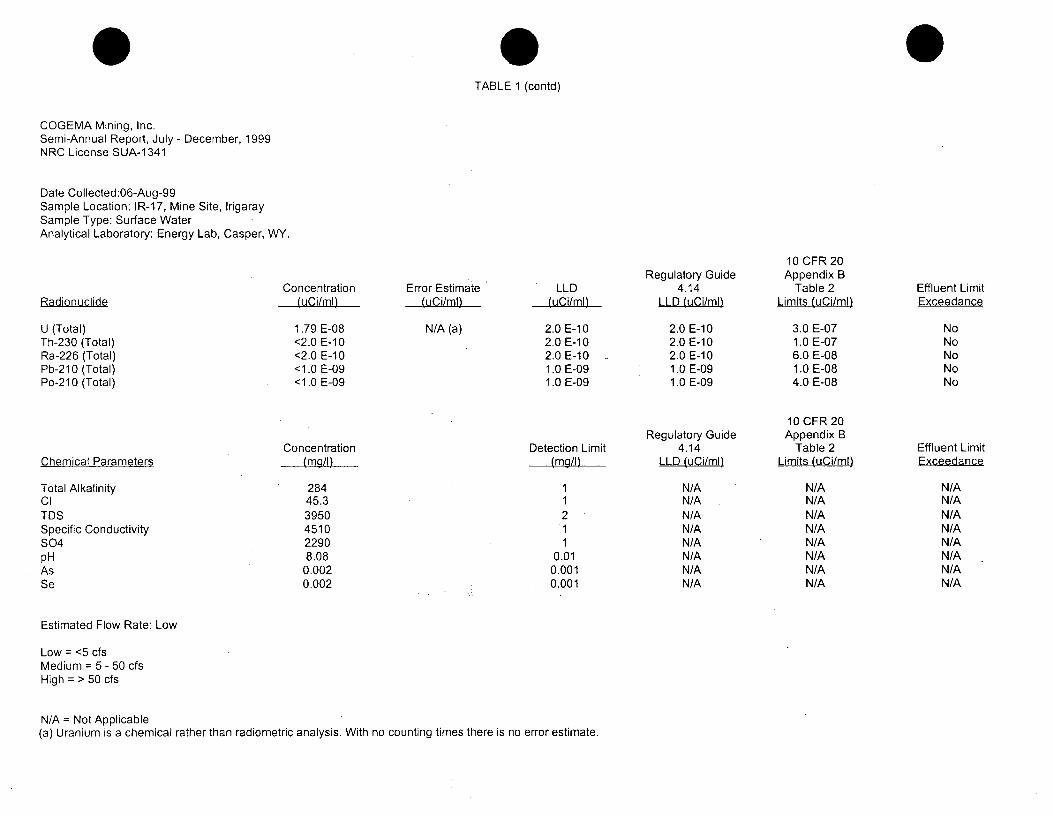
TABLE 1 (contd)
COGEMA Mining, Inc.Semi-Annual Report, July - December, 1999NRC License SUA-1 341
Date Collected:06-Aug-99Sample Location: IR-17, Mine Site, IrigaraySample Type: Surface WaterAnalytical Laboratory: Energy Lab, Casper, WY.
Radionuclide
U (Total)Th-230 (Total)Ra-226 (Total)Pb-210 (Total)Po-210 (Total)
Concentration(uCi/ml)
Error Estimate(uCi/ml)
LLD(uCi/ml)
Regulatory Guide4.14
LLD (uCi/ml)
10 CFR 20Appendix B
Table 2Limits (uCi/ml)
Effluent LimitExceedance
1.79 E-08<2.0 E-10<2.0 E-10<1.0 E-09<1.0 E-09
N/A (a) 2.0 E-102.0 E-102.0 E-101.0 E-091.0 E-09
2.0 E-102.0 E-102.0 E-101.0 E-091.0 E-09
3.0 E-071.0 E-076.0 E-081.0 E-084.0 E-08
NoNoNoNoNo
Concentration(mg/I)
Detection Limit(mg/I)
Regulatory Guide4.14
LLD (uCi/ml)
10 CFR 20Appendix B
Table 2Limits (uCi/ml)
Effluent LimitExceedanceChemical Parameters
Total AlkalinityClTDSSpecific ConductivityS04pHAsSe
Estimated Flow Rate: Low
Low = <5 cfsMedium = 5 - 50 cfsHigh = > 50 cfs
28445.33950451022908.080.0020.002
11
21
0.010.0010.001
N/AN/AN/AN/AN/AN/AN/AN/A
N/AN/AN/AN/AN/AN/AN/AN/A
N/AN/AN/AN/AN/AN/AN/AN/A
N/A = Not Applicable(a) Uranium is a chemical rather than radiometric analysis. With no counting times there is no error estimate.

TABLE 1 (contd)
COGEMA Mining, Inc.Semi-Annual Report, July - December, 1999NRC License SUA-1341
Date Collected:06-Aug-99Sample Location:CR GS-01, Downstream Willow Creek, ChristensenSample Type: Surface WaterAnalytical Laboratory: Energy Lab, Casper, WY.
Concentration(uCi/ml)
Error Estimate(uCi/ml)
LLD(uCi/ml)
Regulatory Guide4.14
LLD (uCi/ml)
10 CFR 20Appendix B
Table 2Limits (uCi/ml)
Effluent LimitExceedanceRadionuclide
U (Total)Th-230 (Total)Ra-226 (Total)Pb-210 (Total)Po-210 (Total)
4.3 E-08<2.0 E-10<2.0 E-10<1.0 E-09<1.0 E-09
N/A (a) 2.0 E-102.0 E-102.0 E-101.0 E-091.0 E-09
2.0 E-102.0 E-102.0 E-101.0 E-091.0 E-09
3.0 E-071.0 E-076.0 E-081.0 E-084.0 E-08
NoNoNoNoNo
Concentration(mg/I)
Detection Limit(mg/I)
Regulatory Guide4.14
LLD (uCi/ml)
10 CFR 20Appendix B
Table 2Limits (uCi/ml)
Effluent LimitExceedanceChemical Parameters
Total AlkalinityClTDSSpecific ConductivityS04pHAsSe
90222
118001220069407.870.0060.006
2
0.010.0010.001
N/AN/AN/AN/AN/AN/AN/AN/A
N/AN/AN/AN/AN/AN/AN/AN/A
N/AN/AN/AN/AN/AN/AN/AN/A
Estimated Flow Rate: Low
Low = <5 cfsMedium = 5 - 50 cfsHigh = > 50 cfs
N/A = Not Applicable(a) Uranium is a chemical rather than radiometric analysis. With no counting times there is no error estimate.

TABLE 1 (contd)
COGEMA Mining, Inc.Semi-Annual Report, July - December, 1999NRC License SUA-1341
Date Collected:06-Aug-99Sample Location: CR GS-03, Mine Site, ChristensenSample Type: Surface WaterAnalytical Laboratory: Energy Lab, Casper, WY.
ConcentrationRadionuclide (uCi/ml)
Error Estimate(uCi/ml)
LLD(uCi/ml)
Regulatory Guide4.14
LLD (uCi/ml)
10 CFR 20Appendix B
Table 2Limits (uCi/ml)
Effluent LimitExceedance
U (Total)Th-230 (Total)Ra-226 (Total)Pb-210 (Total)Po-210 (Total)
9.8 E-08<2.0 E-10<2.0 E-10<1.0 E-09<1.0 E-09
N/A (a) 2.0 E-102.0 E-102.0 E-101.0 E-091.0 E-09
2.0 E-102.0 E-102.0 E-101.0 E-091.0 E-09
3.0 E-071.0 E-076.0 E-081.0 E-084.0 E-08
NoNoNoNoNo
Chemical Parameters
Total AlkalinityClTDSSpecific ConductivityS04pHAsSe
Estimated Flow Rate: Low
Low = <5 cfsMedium = 5 - 50 cfsHigh = > 50 cfs
Concentration(mg/I)
Detection Limit(mg/I)
Regulatory Guide4.14
LLD (uCi/ml)
10 CFR 20Appendix B
Table 2Limits (uCi/ml)
Effluent LimitExceedance
163190
88801010054508.20
0.0030.014
2
0.010.0010.001
N/AN/AN/AN/AN/AN/AN/AN/A
N/AN/AN/AN/AN/AN/AN/AN/A
N/AN/AN/AN/AN/AN/AN/AN/A
N/A = Not Applicable(a) Uranium is a chemical rather than radiometric analysis. With no counting times there is no error estimate.

TABLE 1 (contd)
COGEMA Mining, Inc.Semi-Annual Report, July - December, 1999NRC License SUA-1341
Date Collected:06-Aug-99Sample Location: CR CG-05, Upstream Willow Creek, ChristensenSample Type: Surface WaterAnalytical Laboratory: Energy Lab, Casper, WY.
Concentration(uCi/m!)
Error Estimate(uCi/ml)
LLD(uCi/ml')
Regulatory Guide4.14
LLD (uCi/ml)
10 CFR 20Appendix B
Table 2Limits (uCi/ml)
Effluent LimitExceedance
U (Total)Th-230 (Total)Ra-226 (Total)Pb-210 (Total)Po-210 (Total)
2.04 E-08<2.0 E-10<2.0 E-10<1.0 E-09<1.0 E-09
N/A (a) 2.0 E-102.0 E-102.0 E-101.0 E-091.0 E-09
2.0 E-102.0 E-102.0 E-101.0 E-091.0 E-09
3.0 E-071.0 E-076.0 E-081.0 E-084.0 E-08
NoNoNoNoNo
Concentration(mg/I)
Detection Limit(mg/!)
Regulatory Guide4.14
LLD (uCi/ml)
10 CFR 20Appendix B
Table 2Limits (uCi/m!)
Effluent LimitExceedanceChemical Parameters
Total AlkalinityCITDSSpecific ConductivityS04pHAsSe
24920.92580315014008.11
0.003<0.001
2
0.010.0010.001
N/AN/AN/AN/AN/AN/AN/AN/A
N/AN/AN/AN/AN/AN/AN/AN/A
N/AN/AN/AN/AN/AN/AN/AN/A
Estimated Flow Rate: None
Low = <5 cfsMedium = 5 - 50 cfsHigh = > 50 cfs
N/A = Not Applicable(a) Uranium is a chemical rather than radiometric analysis. With no counting times there is no error estimate.

0TABLE 1 (contd)
COGEMA Mining, Inc.Semi-Annual Report, July - December, 1999NRC License SUA-1341
Date Collected:08-Oct-99Sample Location: IR-9, Downstream Willow Creek, IrigaraySample Type: Surface WaterAnalytical Laboratory: Energy Lab, Casper, WY.
ConcentrationRadionuclide (uCilml)
Error Estimate(uCi/ml)
LLD(uCi/ml)
Regulatory Guide4.14
LLD (uCi/mI)
10 CFR 20Appendix B
Table 2Limits (uCi/ml)
Effluent LimitExceedance
U (Total)Th-230 (Total)Ra-226 (Total)Pb-210 (Total)Po-210 (Total)
2.4 E-08<2.0 E-104.0 E-10
<1.0 E-09<1.0 E-09
N/A (a)
2.0 E-10
2.0 E-102.0 E-102.0 E-101.0 E-091.0 E-09
2.0 E-102.0 E-102.0 E-101.0 E-091.0 E-09
3.0 E-071.0 E-076.0 E-081.0 E-084.0 E-08
NoNoNoNoNo
Concentration(mag!/)
Detection Limit(mg/I)
Regulatory Guide4.14
LLD (uCi/ml)
10 CFR 20Appendix B
Table 2Limits (uCi/ml)
Effluent LimitExceedanceChemical Parameters
Total AlkalinityClTDSSpecific ConductivityS04pHAsSe
Estimated Flow Rate: Medium
Low = <5 cfsMedium = 5 - 50 cfsHigh = > 50 cfs
17384
5080537032107.85
<0.001<0.001
2
0.010.0010.001
N/AN/AN/AN/AN/AN/AN/AN/A
N/AN/AN/AN/AN/AN/AN/AN/A
N/AN/AN/AN/AN/AN/AN/AN/A
N/A = Not Applicable(a) Uranium is a chemical rather than radiometric analysis. With no counting times there is no error estimate.

TABLE 1 (contd)
COGEMA Mining, Inc.Semi-Annual Report, July - December, 1999NRC License SUA-1341
Date Collected:08-Oct-99Sample Location: IR-14, Upstream Willow Creek, IrigaraySample Type: Surface WaterAnalytical Laboratory: Energy Lab, Casper, WY.
ConcentrationRadionuclide (uCi/ml)
Error Estimate(uCi/ml)
LLD(uCi/ml)
Regulatory Guide4.14
LLD (uCi/ml)
10 CFR 20Appendix B
Table 2Limits (uCi/ml)
Effluent LimitExceedance
U (Total)Th-230 (Total)Ra-226 (Total)Pb-210 (Total)Po-210 (Total)
1.2 E-08<2.0 E-10<2.0 E-10<1.0 E-10<1.0 E-10
N/A (a) 2.0 E-102.0 E-102.0 E-101.0 E-091.0 E-09
2.0 E-102.0 E-102.0 E-101.0 E-091.0 E-09
3.0 E-071.0 E-076.0 E-081.0 E-084.0 E-08
NoNoNoNoNo
Concentration(mg/I)
Detection Limit(mr/I)
Regulatory Guide4.14
LLD (uCi/ml)
10 CFR 20Appendix B
Table 2Limits (uCi/ml)
Effluent LimitExceedanceChemical Parameters
Total AlkalinityClTDSSpecific ConductivityS04pHAsSe
Estimated Flow Rate: Low
Low = <5 cfsMedium = 5 - 50 cfsHigh = > 50 cfs
221116.04920546030208.120.002<0.001
1.1
211
0.010.0010.001
N/AN/AN/AN/AN/AN/AN/AN/A
N/AN/AN/AN/AN/AN/AN/AN/A
N/AN/AN/AN/AN/AN/AN/AN/A
N/A = Not Applicable(a) Uranium is a chemical rather than radiometric analysis. With no counting times there is no error estimate.

TABLE 1 (contd)
COGEMA Mining, Inc.Semi-Annual Report, July - December, 1999NRC License SUA-1341
Date Collected:08-Oct-99Sample Location: IR-17, Mine Site, IrigaraySample Type: Surface WaterAnalytical Laboratory: Energy Lab, Casper, WY.
ConcentrationRadionuclide (uCi/ml)
Error Estimate(uCi/m!)
LLD,(uCi/ml)
Regulatory Guide4.14
LLD (uCi/ml)
10 CFR 20Appendix B
Table 2Limits (uCi/ml)
Effluent LimitExceedance
U (Total)Th-230 (Total)Ra-226 (Total)Pb-210 (Total)Po-210 (Total)
2.1 E-08<2.0 E-10<2.0 E-10<1.0 E-10<1.0 E-10
N/A (a) 2.0 E-102.0 E-102.0 E-101.0 E-091.0 E-09
2.0 E-102.0 E-102.0 E-101.0 E-091.0 E-09
3.0 E-071.0 E-076.0 E-081.0 E-084.0 E-08
NoNoNoNoNo
Concentration(mrg/I)Chemical Parameters
Total AlkalinityClTDSSpecific ConductivityS04pHAsSe
Detection Limit(mg/I)
Regulatory Guide4.14
LLD (uCi/ml)
10 CFR 20Appendix B
Table 2Limits (uCi/ml)
Effluent LimitExceedance
33844.03980434025008.01
<0.001<0.001
11
2
0.010.0010.001
N/AN/AN/AN/AN/AN/AN/AN/A
N/AN/AN/AN/AN/AN/AN/AN/A
N/AN/AN/AN/AN/AN/AN/AN/A
Estimated Flow Rate: Low
Low = <5 cfsMedium = 5 - 50 cfsHigh = > 50 cfs
N/A = Not Applicable(a) Uranium is a chemical rather than radiometric analysis. With no counting times there is no error estimate.

TABLE 1 (contd)
COGEMA Mining, Inc.Semi-Annual Report, July - December, 1999NRC License SUA-1341
Date Collected:08-Oct-99Sample Location:CR GS-01, Downstream Willow Creek, ChristensenSample Type: Surface WaterAnalytical Laboratory: Energy Lab, Casper, WY.
ConcentrationRadionuclide (uCi/ml)
Error Estimate(uCi/ml)
LLD(uCi/ml)
Regulatory Guide4.14
LLD (uCi/ml)
10 CFR 20Appendix B
Table 2Limits (uCi/ml)
Effluent LimitExceedance
U (Total)Th-230 (Total)Ra-226 (Total)Pb-210 (Total)Po-210 (Total)
1.2 E-07<2.0 E-104.0 E-10<1.0 E-10<1.0 E-10
N/A (a)
3.0 E-10
2.0 E-102.0 E-102.0 E-101.0 E-091.0 E-09
2.0 E-102.0 E-102.0 E-101.0 E-091.0 E-09
3.0 E-071.0 E-076.0 E-081.0 E-084.0 E-08
NoNoNoNoNo
Concentration(mg/I)
Detection Limit(mg/I)
Regulatory Guide4.14
LLD (uCi/ml)
10 CFR 20Appendix B
Table 2Limits (uCi/ml)
Effluent LimitExceedanceChemical Parameters
Total AlkalinityClTDSSpecific ConductivityS04pHAsSe
Estimated Flow Rate: Low
Low = <5 cfsMedium = 5 - 50 cfsHigh = > 50 cfs
583807.04000030000268008.460.0090.005
11
211
0.010.0010.001
N/AN/AN/AN/AN/AN/AN/AN/A
N/AN/AN/AN/AN/AN/AN/A"N/A
N/AN/AN/AN/AN/AN/AN/AN/A
N/A = Not Applicable(a) Uranium is a chemical rather than radiometric analysis. With no counting times there is no error estimate.

TABLE 1 (contd)
COGEMA Mining, Inc.Semi-Annual Report, July - December, 1999NRC License SUA-1341
Date Collected:08-Oct-99Sample Location: CR GS03, Mine Site, ChristensenSample Type: Surface WaterAnalytical Laboratory: Energy Lab, Casper, WY.
ConcentrationRadionuclide (uCi/ml)
Error Estimate(uCi/ml)
LLD(uCi/m!)
Regulatory Guide4.14
LLD (uCi/ml)
10 CFR 20Appendix B
Table 2Limits (uCi/ml)
Effluent LimitExceedance
U (Total)Th-230 (Total)Ra-226 (Total)Pb-210 (Total)Po-21 0 (Total)
1.6 E-07<2.0 E-10<2.0 E-10<1.0 E-10<1.0 E-10
N/A (a) 2.0 E-102.0 E-102.0 E-101.0 E-091.0 E-09
2.0 E-102.0 E-102.0 E-101.0 E-091.0 E-09
3.0 E-071.0 E-076.0 E-081.0 E-084.0 E-08
NoNoNoNoNo
Concentration(mg/I)
Detection Limit(mg/I)
Regulatory Guide4.14
LLD (uCi/ml)
10 CFR 20Appendix B
Table 2Limits (uCi/ml)
Effluent LimitExceedanceChemical Parameters
Total AlkalinityCITDSSpecific ConductivityS04pHAsSe
Estimated Flow Rate: Low
360395.01550014000101007.990.0010.004
2
0.010.0010.001
N/AN/AN/AN/AN/AN/AN/AN/A
N/AN/AN/AN/AN/AN/AN/AN/A
N/AN/AN/AN/AN/AN/AN/AN/A
Low = <5 cfsMedium = 5 - 50 cfsHigh = > 50 cfs
N/A = Not Applicable(a) Uranium is a chemical rather than radiometric analysis. With no counting times there is no error estimate.

TABLE 1 (contd)
COGEMA Mining, Inc.Semi-Annual Report, July - December, 1999NRC License SUA-1341
Date Collected:08-Oct-99Sample Location: CR CG-05, Upstream Willow Creek, ChristensenSample Type: Surface WaterAnalytical Laboratory: Energy Lab, Casper, WY.
Radionuclide
U (Total)Th-230 (Total)Ra-226 (Total)Pb-210 (Total)Po-210 (Total)
Concentration(uCi/ml)
Error Estimate(uCi/ml)
LLD(uCi/ml)
Regulatory Guide4.14
LLD (uCi/ml)
10 CFR 20Appendix B
Table 2Limits (uCi/ml)
Effluent LimitExceedance
1.2 E-07<2.0 E-104.0 E-10<1.0 E-092.1 E-08
N/A (a)
2.0 E-10
4.4 E-09
2.0 E-102.0 E-102.0 E-101.0 E-091.0 E-09
2.0 E-102.0 E-102.0 E-101.0 E-091.0 E-09
3.0 E-071.0 E-076.0 E-081.0 E-084.0 E-08
NoNoNoNoNo
Chemical Parameters
Total AlkalinityClTDSSpecific ConductivityS04pHAsSe
Estimated Flow Rate: Low
Low = <5 cfsMedium = 5 - 50 cfsHigh = > 50 cfs
Concentration(mg/I)
70916.05240564030307.890.0040.002
Detection Limit(mg/I)
Regulatory Guide4.14
LLD (uCi/ml)
10 CFR 20Appendix B
Table 2Limits (uCi/ml)
Effluent LimitExceedance
1
21
0.010.0010.001
N/AN/AN/AN/AN/AN/AN/AN/A
N/AN/AN/AN/AN/AN/AN/AN/A
N/AN/AN/AN/AN/AN/AN/AN/A
N/A = Not Applicable(a) Uranium is a chemical rather than radiometric analysis. With no counting times there is no error estimate.

TABLE 2A
COGEMA Mining, Inc.DISCHARGE POINT 001Irigaray
PERMITREQUIREMENT
AVG. MAX.PARAMETER 7-99 8-99 9-99 10-99 11-99 12-99
Flow 0.092 0.069 0.084 0.089 0.111 0.127 N/A N/A(MGD) Average
Total Uranium (U) 0.1170 0.1420 0.0403 0.2190 0.0795 0.0559 2 4(mg/I)
Dissolved Radium-226 1.6 1.8 2.0 <0.2 1.3 2.5 3 10(pCi/I) Average
Total Suspended Solids 2.7 2.0 <1.0 <1.0 <1.0 <1.0 20 30(mg/I) (weekly avg.)
Total Dissolved Solids 1730 1500 622 1090 450 641 N/A 5000(mg/I)
OUARTWER:VANALYS.•.S: July 1999 October 1999Uranium Total 7.9 E-08 1.48 E-07 3E-07*
(uCi/ml)Radium 226 Total 1.6 E-09 2.0 E-10 6E-08*
(uCi/ml)Thorium-230 Total 2.3 E-09 <2.0 E-09 1 E-07*
(uCi/ml)Pb-210 Total <1.0 E-09 <1.0 E-09 1E&08*
(uCi/ml)Po-210 Total <1.0 E-09 <1.0 E-09 4E-08*
(uCi/ml)Zinc Total <0.01 <0.01 0.5 1.0
(mg/I)pH 7.00 6.20 6.00 9.00(units)
Selenium 0.017 0.007 N/A 0.05(mg/I)
N.D. - No DischargeN/A - Not Available* 10 CFR 20, Appendix B, Table II, Column II Effluent Limitations

TABLE 2B
COGEMA Mining, Inc.DISCHARGE POINT 002Christensen
PERMITREQUIREMENT
AVG. MAX.PARAMETER 07-99 08-99 09-99 10-99 11-99 12-99
Flow N.D. N.D. N.D. N.D. N.D. N.D. N/A N/A(MGD) Average
Total Uranium (U) N.D. N.D. N.D. N.D. N.D. N.D. 2 4(mg/I)
Dissolved Radium-226 N.D. N.D. N.D. N.D. N.D. N.D. 3 10(pCi/I) Average
Total Suspended Solids N.D. N.D. N.D. N.D. N.D. N.D. 20 30(mg/I) (weekly avg.) ,__
Total Dissolved Solids N.D. N.D. N.D. N.D. N.D. N.D. N/A 5000(mg/I) mg ................. Arl19
QUARTERL:Y ANALYSIfS i::!:::iiiJanuary 1999 Apri 1999Uranium Total N.D. N.D. N.D. N.D. N.D. N.D. 3E-07*
(uCi/ml)Radium 226 Total N.D. N.D. N.D. N.D. N.D. N.D. 6E-08*
(uCi/ml)Thorium-230 Total N.D. N.D. N.D. N.D. N.D. N.D. 1 E-07*
(uCi/ml)Pb-210 Total N.D. N.D. N.D. N.D. N.D. N.D. 1 E08*
(uCi/ml)Po-210 Total N.D. N.D. N.D. N.D. N.D. N.D. 4E-08*
(uCi/ml)Zinc Total N.D. N.D. N.D. N.D. N.D. N.D. 0.5 1.0
(mg/I)pH N.D. N.D. N.D. N.D. N.D. N.D. 6.00 9.00
(units) I ISelenium N.D. N.D. N.D. N.D. N.D. N.D. N/A 0.05
(mg/l) I I _ _ I
N.D. - No DischargeN/A - Not Available* 10 CFR 20, Appendix B, Table II, Column II Effluent Limitations

Table 3
QUARTERLY WASTE POND ANALYSISTHIRD QUARTER 1999, 07-30-99
SEMI-ANNUAL REPORT, 2000
IRIGARAY - mg/I
IR-2BIR-1 IR-2A IR-3 IR-A IR-B
CI 21,600 95,600 69,300 124,000 128,000 104,000
NH4as N 1.81 87.4 20.2 9.58 158 107
NO3 as N 0.11 0.28 0.17 0.88 2.93 2.82
PH 8.85 8.40 8.70 7.61 7.39 7.68
S04 12,900 19.500 14,000 18,800 13,000 13000
Conductivity 86,600 187,000 161,000 212,000 212,000 188,000
U 80.7 119 129 4.8 1.51 14.8
TDS 72,500 182,000 143,000 231,000 215,000 176000
Zinc <0.01 <0.01 <0.01 <0.01 <0.01 <0.01
IRa 226 (oCi/l) 26.3 +/- 1.8 20.8+/- 1.2 26.3+/- 1.8 16.0 +/- 0.6 193 +/- 4.6 92.0 +/- 3.1
IRIGARAY - mg/I
I R-C IR-D IR-E IR-RA IR-RB
CI 142,000 118,000 103,000 1,690 4,470
NH4 as N 429 75.7 39.1 0.44 1.29
N03 as N 22.6 0.50 2.14 0.19 <0.010
PH 6.16 7.63 6.07 8.65 8.97
S04 ".15,000 12,700 6,930 3,400 4,430
Conductivity 221,000 207,000 195,000 19,300 28,600.
.U 0.240 6.71 0.0160 27.4 80.5
TDS 286,000 202,000 195,000 14,900 22,000
Zinc <0.01 <0.01 <0.01 <0.01 <0.01
Ra 226 (pCi/I) 320 +/- 6.3 198 +/- 3.9 1,010 +/- 19.8 5.7 +/- 0.4 10.9 +/- 1.1
CHRISTENSEN - mg/I
CR-1 CR-2 CR-3 CR-4 CR-P1
CI 604 .500 322 185 18.0
NH4 as N 0.12 0.54 0.11 0.12 <0.05
N03 as N <0.10 <0.01 <0.01 0.16 <0.10
pH 8.59 8.33 9.11 8.16 8.51
S04 852 1,650 1,760 1,280 30.6
Conductivity 5,120 9,170 8,860 7,340 1,500
_U 4.5 1.7 1.33 0.700 0.0300
TDS 3,450 6,710 6,580 5,480 933
Zinc <0.01 <0.01 <0.01 <0.01 <0.01
Ra 226 (DCi/1) 136 +/- 3.0 87.8+/-2.3 3.8 +/- 0.3 208+/-4.1 <0.2

Table 3 (Cont.)
QUARTERLY WASTE POND ANALYSISFOURTH QUARTER 1999, 10-7-99
SEMI-ANNUAL REPORT. 2000
IRIGARAY - mg/I
IR-1 IR-2A IR-2B IR-3 IR-A IR-B
CI 94,800 172,000 156,000 124,000 165,000 83,400
NH4 as N 4.88 106 21.3 1.43 164 43.8
N03 as N 0.36 0.39 0.37 <0.10 0.95 1.10
pH 8.51 7.99 8.29 8.46 7.19 8.35
S04 16,200 17,700 15,500 15,800 17,900
Conductivity 120,000 129,000 131,000 123,000 127,000 114,0
U 554 337 265 191 113 70.2
TDS 195,000 320,000 275,000 233,000 299,300 0
Zinc 0.07 0.09 0.07 0.09 0.42 0.09
Ra 226 (pCi/l) 12.9 +/- 1.6 42.7 +/- 3.2 20.1 +/- 2.1 14.6 +/- 1.2 300.2 +1- 10.8 29.9 +/- 2.4
IRIGARAY - mg/I
IR-C IR-D IR-E IR-RA IR-RB
CI 149,000 145,000 142,000 2,880 4,040
NH4 as N '74.0 152 50.0 0.12 0.15
N03 as N 0.53 4.48 2.48 <0.10 <0.10
pH 7.88 7.01 6.40 8.69 8.79
S04 17,700 91190 12,300 4,240 4680
Conductivity 126,000 173,000 134,000 20,000 22,700
U 21.0 6.0 39.3 52.7 77.4
TDS 257,000 144,000 241,000 16,800 19,300
Zinc 0.30 <0.01 1.71 0.06 0.07
Ra 226 (1pCi/I) 197 +/- 7.1 529 +/- 6.6 1960 +/- 70.2 6.2 +/-0.6 6.3 +1- 0.7
CHRISTENSEN - mg/I
CR-1 CR-2 CR-3 CR-4 CR-P1
CI 632 395 140 207 10.8
NH4 as N 0.06 0.07 <0.05 <0.05 <0.05
NO3 as N <0.10 <0.10 <0.10 <0.10 <0.10
pH 8.36 8.70 7.94 8.36 8.34
S04 941 5,940 959 972 28.4
Conductivity 4,910 5,940 41890 5,250 1,460
U 8.63 2.12 0.36 0.41 0.004
TDS 3,310 4,480 3,613,830 866
Zinc 0.03 0.02 0.01 0.01 <0.01
Ra 226 (pCi/I) 104 +/- 4.1 42.9 +/- 2.6 61.6+/-3.1 76.2 +/- 3.5 1.0 +1- 0.3

COGEMA Mining, Inc.Semi-Annual Report, July - December, 1999NRC License SUA-1341
Date Collected:06-Aug-99Sample Location: Christensen Rancht House #3Sample Type: Regional Ground WaterAnalytical Laboratory: Energy Lab, Casper, WY.
Date Collected:06-Aug-99Sample Location: Christensen Middle ArtesianSample Type: Regional Ground WaterAnalytical Laboratory: Energy Lab, Casper, WY.
Radionuclide
U (Total)Th-230 (Total)Ra-226 (Total)Pb-210 (Total)Po-210 (Total)
Concentration(tiCi/ml)
1.77 E-08<20 E-101.0 E-09
<1.0 E-09<1.0 E-09
Error Estimate(uCi/ml)
N/A (a)
3.0 E-10
LLD_uCi/ml)
2.0 E-102.0 E-102.0 E-101.0 E-091.0 E-09
Radionoclide
U (Total)Th-230 (Total)Ra-226 (Total)Pb-210 (Total)Po-210 (Total)
ConcentrationWuCi/mIl
6.0 E-10<2.0 E-108.0 E-10<1.0 E-O9<1.0 E-09
Error EstimatefuCi/mlt
N/A (a)
3.0 E-10
LLDf2Ci/mE-
2.0 E-102.0 E-102.0 E-101.0 E-091.0 E-09
Date Collected:06-Aug-99Sample Location: Christensen Ellendale #4Sample Type: Regional Ground WaterAnalytical Laboratory: Energy Lab, Casper, WY.
Date Collected:06-Aug-99Sample Location: Chdstensen Del Gulch Lower #13Sample Type: Regional Ground WaterAnalytical Laboratory: Energy Lab, Casper, WY.
Radionuclide
U (Total)Th-230 (Total)Ra-226 (Total)PU-210 (Total)P0-210 (Total)
Concentration(uCi/aml
7.0 E-1O<2.0 E-10<2.0 E-10<1.0 E-09<1.0 E-09
Error Estimate(uCi/ml)
N/A (a)
LLDI uCi/mII
2.0 E-1i2.0 E-102.0 E-101.0 E-091.0 E-09
Rad onuclide
U (Total)Th-230 (Total)Ra-226 (Total)Pb-210 (Total)Po-210 (Total)
Concentration{uCi/ml)
1.2 EC-9<2.0 E-101.5 E-O9
<1.0 E-O93.5 E-09
Error Estimatef(Ci/mli
N/A (a)
4.0 E-10
1.3 E-09
LLDfoCi/mit
2.0 E-102.0 E-t02.0 E-101.0 E-091.0 E-09
Date Collected:06-Aug-99Sample Location: Christensen Willow Corral #32Sample Type: Regional Ground WaterAnalytical Laboratory: Energy Lab, Casper, WY.
Date Collected:06-Aug-99Sample Location:North Prong #21Sample Type: Regional Ground WaterAnalytical Laboratory: Energy Lab, Casper, WY.
Radionuclide
U (Total)Th-230 (Total)Ra-220 (Total)Pb-210 (Total)Po-210 (Total)
Concentration(uCi/mIl
2.0 E-10<2.0 E-10<2.0 E-10<1.0 E-O95.6 E-09
Error Estimate(uCi/ml)
N/A (a)
1.1 E-09
LLD(uC/0-1I
2.0 E-102.0 E-102.0 E-i0
1.0 E-09
Radionuclide
U (Total)Th-230 (Total)Ra-226 (Total)Pb-210 (Total)Po-210 (Total)
ConcentrationfuCi/ml)
2.0 E-10<2.0 E-10<2.0 E-10<1.0 E-O901.0 E-09
Error EstimateruCi/mlf
N/A (a)
LLDf2C /mit
2.0 E-102.0 E-102.0 EC-11.0 E-091.0 C-O9
Date Collected:06-Aug-99Sample Location: Christensen First Artesian Well #1Sample Type: Regional Ground WaterAnalytical Laboratory: Energy Lab, Casper, WY.
Date Collected:06-Aug-99Sample Location: IR Willow #2 (Semi-Annual)Sample Type: Regional Ground WaterAnalytical Laboratory: Energy Lab, Casper, WY.
Raedonuclide
U (Total)Th-230 (Total)Ra-226 (Total)Pb-210 (Total)Po-210 (Total)
Concentration(uCi/ml)
5.0 E-10<2.0 E-10<2.0 E-1001.0 E-0901.0 E-09
Error EstimateuCi/nml)
N/A (a)
LLDfoCi/mht
2.0 E-i02.0 E-102.0 E-I01 0 E-091.0 E-09
Radionuclide
U (Total)Th-230 (Total)Ra-226 (Total)Pb-210 (Total)Po-210 (Total)
Chemical ParametersChlorideConductivity
Concentration(UCi/ml)
2.0 E-10<2.0 E-10<2.0 E-10<1.0 E-09<1.0 E-09
Concentration
7.0526.0
Error EstimateluCi/mll
N/A (a)
LLDfrICi/mII
2.0 E-12.0 E-102.0 E-101.0 E-091.0 E-09
Detection Limit1.0a1.01.0N/A = Not Applicable
(a) Uranium is a chemical rather than radiometric analysis. With no counting times there is no error estimate.

COGEMA Mining, Inc.Semi-Annual Report, July- December, 1999NRC License SUA-1341
Date Collected: 08-Oct-99Sample Location: Christensen Ranch House #3Sample Type: Regional Ground WaterAnalytical Laboratory: Energy Lab, Casper, WY.
Date Collected: 08-Oct-99Sample Location: Christensen Middle ArtesianSample Type: Regional Ground WaterAnalytical Laboratory: Energy Lab, Casper, WY.
Radion•clide
U (Total)Th-230 (Total)Ra-226 (Total)Pb-210 (Total)Po-210 (Total)
Concentration(uCi/mlt
1.6 E-08<2.0 E-10<2.0 E-10<1.0 E-09<.0 E-09
Error EstimateluCi/ml)
N/A (a)
LLD2uC /mEt
2.0 E-102.0 E-102.0 E-101.0 E-091.0 E-09
Radionuclide
U (Total)Th-230 (Total)Ra-226 (Total)Pb-210 (Total)Po-210 (Total)
Concentration(uC/ml)
1.0 E-09<2.0 E-103.1 E-09
<1.0 E-09<1.0 E-09
Error Estimate(uCi/mlt
N/A (a)
4.0 E-10
LLD2 -C1/mt
2.0 E-102.0 E-102.0 E-101.0 E-091.0 E-09
Date Collected: 08-Oct-99Sample Location: Christensen Ellendale #4Sample Type: Regional Ground WaterAnalytical Laboratory: Energy Lab, Casper, WY.
Date Collected: 08-Oct-99Sample Location: Chrstensen Del Gulch Lower #13Sample Type: Regional Ground WaterAnalytical Laboratory: Energy Lab, Casper, WY.
Radionuclide
U (Total)Th-230 (Total)Ra-226 (Total)Pb-210 (Total)Po-210 (Total)
ConcentrationluCi/mll
7.0 E-10<2.0 E-10<2.0 E-10<1.0 E-09<1.0 E-09
Error EstimatefuCi/mlt
N/A (a)
LLD2uCi/mlt
2.0 E-102.0 E-102.0 E-101.0 E-091.0 E-09
Radlionuclide
U (Total)Th-230 (Total)Ra-226 (Total)Pb-210 (Total)Po-210 (Total)
ConcentrationtuCi/ml)
6.0 E-10<2.0 E-10
1.5 E-09<1.0 E-09<1.0 E-09
Error EstimatetuCi/mlt
N/A (a)
LLD2uCi/ll-
2.0 E-102.0 E-102.0 E-101.0 E-091.0 E-09
Date Collected: 08-Oct-99Sample Location: Christensen Willow Corral #32Sample Type: Regional Ground WaterAnalytical Laboratory: Energy Lab, Casper. WY.
Date Collected: 08-Oct-99Sample Location: Christensen North Prong #21RSample Type: Regional Ground WaterAnalytical Laboratory: Energy Lab, Casper, WY.
Radinnuclide
U (Total)Th-230 (Total)Ra-226 (Total)Pb-210 (Total)Po-210 (Total)
ConcentrationluCi/mhl
<2.0 E-10<2.0 E-10<2.0 E-10<1.0 E-09<1.0 E-09
Error Estimate(uCi/ml)
N/A (a)
LLDtC /ml 1
2.0 E-102.0 E-102.0 E-101.0 E-091.0 E-09
Rad onuclide
U (Total)Th-230 (Total)Ra-226 (Total)Pb-210 (Total)Po-210 (Total)
Concentration(uCi/mQ)
<2.0 E-10<2.0 E-10<2.0 E-10<1.0 E-09<1.0 E-09
Error Estimate(uCi/mll
N/A (a)
LLD20Ci/mEI
2.0 E-102.0 E-102.0 E-101.0 E-091.0 E-09
Date Collected: 08-Oct-99Sample Location: Christensen First Artesian Well #1Sample Type: Regional Ground WaterAnalytical Laboratory: Energy Lab, Casper, WY.
Date Collected:Semi-annual sample collected previous quarter.Sample Location:Willow #2, IrigaraySample Type: Regional Ground WaterAnalytical Laboratory: Energy Lab, Casper, WY.
Radionuclide
U (Total)Th-230 (Total)Ra-226 (Total)Pb-210 (Total)Po-210 (Total)
Concentration(/Ci/mll
7.0 E-10<2.0 E-10<2.0 E-10<1.0 E-09<1.0 E-09
Error EstimatetuCi/mnl
N/A (a)
LLD2uCi/m.l
2.0 E-102.0 E-10
1.0 E-091.0 E-09
Radionuclide
U (Total)Th-230 (Total)Ra-226 (Total)Pb-210 (Total)Po-210 (Total)
Chemical Parameters
ClSpecific Conductivity
(uCi/ml) (uCi/mlh Uci/mlt
N/A (a) 2.0 E-102.0 E-102.0 E-101.0 E-091.0 E-09
Concentration Detection Limittma/Il tine/It
0.51
N/A = Not Applicable(a) Uranium is a chemical rather than radiometric analysis. With no counting times there is no error estimate.

COGEMA Mining, Inc.Environmental Radon Monitoring - 1999
TABLE 5
Location 1st Quarter 2nd Quarter 3rd Quarter 4th Quarter Location Average % of Pt. 20, App. BuCi/ml uCi/ml uCi/ml uCi/ml uCi/ml Effluent Conc. Limit
1 E-8 uCi/mIIRIGARAY PROJECTIR-1 (Downwind of Restricted Area) 1.1 E-9 +/- 0.1 0.9 E-9 +/- 0.2 1.3 E-9 +/- 0.3 2.0 E-9 +/- 0.3 1.32 E-9 13.2 %
IR-3 (Upwind of Restricted Area) 1.7 E-9 +/- 0.2 0.9 E-9 +/- 0.2 2.0 E-9 +/- 0.3 1.4 E-9 +/- 0.3 1.50 E-9 15.0 %
IR-4 (North Road) 1.5 E-9 +/- 0.1 0.9 E-9 +/- 0.2 1.7 E-9 +/- 0.2 2.3 E-9 +/- 0.2 1.60 E-9 16.0%
IR-5 (Irigaray Ranch - nearest resident) 0 .5 E-9 +/- 0.1 < 0 .4 E-9 0 .9 E-9 +/- 0.3 1.3 E-9 +/- 0.2 0 .78 E-9 0.08 %
IR-6 (Ridge Road S.E. - background) 1.1 E-9 +/- 0.1 1.2 E-9 +/- 0.2 1.4 E-9 +/- 0.3 2.2 E-9 +/- 0.2 1.48 E-9 14.8 %
IR-13 (Employee House Trailer) 1.1 E-9 +/- 0.1 0.6 E-9 +/- 0.3 1.1 E-9 +/- 0.3 1.7 E-9+/- 0.3 1.12 E-9 11.2%CHRISTENSEN PROJECTAS-1 (Table Mountain - Background)) 1.0 E-9 +/- 0.1 0.9 E-9 +/- 0.2 1.0 E-9 +/- 0.2 1.2 E-9 +/- 0.3 1.02 E-9 10.2%
AS-5A (CR Plant Upwind S.E.) 1.1 E-9 +/- 0.1 1.1 E-9 +/- 0.2 1.1 E-9 +/- 0.2 2.0 E-9 +/- 0.3 1.32 E-9 13.2%
AS-5B (CR Plant Downwind N.W.) 1.1 E-9 +/- 0,1 0.4 E-9+/- 0.3 1.2 E-9+/- 0.2 1.9 E-9+/- 0.3 1.15 E-9 11.5%
AS-6 (Christensen Ranch-Nearest Resident) * NA 0.9 E-9 +/- 0.2 1.3 E-9 +/- 0.2 2.5 E-9 +/- 0.2 1.57 E-9 15.7%
Quarterly average 1.02 E-9
* sample voided since the detector had fallen on the ground
LLD = 0.3 pCi/I
0.82 E-9 1.30 E-9 1.85 E-9

COGEMA Mining, Inc.Environmental Gamma Monitoring - 1999
TABLE 6
Location 1st Quarter 2nd Quarter 3rd Quarter 4th Quarter Location Averagemrem/guarter mrem/guarter mrem/guarter mrem/guarter mrem/guarter
IRIGARAY PROJECTIR-1 (Downwind of Restricted Area) 61.4 + / - 28.8 39.2 +/- 8.4 47.8 + / - 12.4 43.4 +/- 5.9 48.0
IR-3 (Upwind of Restricted Area) 89.0 + / - 13.3 54.0 +/- 9.9 58.0 + / - 17.9 47.4 + / - 24.6 62.1
IR-4 (North Road) 63.2 +/- 41.2 35.8 +/- 10.8 43.4 +/- 7.0 37.2 +/- 18.4 44.9
IR-5 (Irigaray Ranch - nearest resident) 49.6 + / - 20.2 32.0 +./- 3.2 39.4 +I- 4.4 36.0 +I- 4.7 39.2
IR-6 (Ridge Road S.E. - Background) 60.2 +/- 13.8 32.8 +/- 6.2 45.2 +/- 10.8 38.0 +/- 7.1 44.0
IR-13 (Employee House Trailer) 64.0 +/- 28.5 41.2 +/- 4.6 49.8 +/- 8.0 38.6 +/- 11.4 48.4CHRISTENSEN PROJECTAS-1 (Table Mountain - Background) 58.2 +I- 26.1 34.2 +I- 3.8 43.4 +/- 5.4 *not available 45.3
AS-5A (CR Plant Upwind S.E.) 70.2 +/- 43.0 38.8 +I- 7.7 49.4 +I- 10.0 43.4 +/- 10.1 50.4
AS-5B (CR Plant Downwind N.W.) 79.2 +I- 29.2 37.6 +I- 5.0 48.6 +/- 8.3 40.2 +I- 5.0 51.4
AS-6 (Christensen Ranch - nearest resid.) 72.6 +I- 31.2 37.4 +I- 4.8 49.4 + I - 15.6 44.2 +/- 6.4 50.9
Quarterly average 66.8 38.3 47.4 40.9

COGEMA Mining, Inc. TABLE 7AWyoming OperationsQuarterly Air SamplesIrigaray Project, Third Quarter of 1999Sample Type: Composite of continuous weekly air sample filters
Irigaray Project Location Uranium Th-230 Ra-226 Pb-210Third Quarter (July, August, September) uCi / ml uCi / ml uCi / ml uCi / ml
IR-1 (Downwind of Restricted Area) 1.90 E-15 < 1.00 E-16 < 1.00 E-16 1.33 E-14 +/- .18% of Pt. 20, App. B, Effluent Limit < 0.1 % < 0.33 % < 0.1 % 2.2 %
IR-3 (Upwind of Restricted Area) 2.40 E-1 5 < 1.00 E-16 < 1.00 E-16 1.38 E-14 +/- .18% of Pt. 20, App. B, Effluent Limit < 0.1 % < 0.33 % < 0.1 % 2.3 %
IR-5 (Irigaray Ranch - nearest resident) 2.85 E-16 < 1.00 E-16 < 1.00 E-16 1.65 E-14 +/- .18% of Pt. 20, App. B, Effluent Limit < 0.1 % < 0.33 % < 0.1 % 2.8 %
IR-6 (Background) 1.93 E-15 < 1.00 E-16 < 1.00 E-16 1.39 E-14 +/- .20% of Pt. 20, App. B, Effluent Limit < 0.1% < 0.33 % < 0.1 % 2.3 %
IR-13 (Employee House Trailer) 1.00 E-15 < 1.00 E-16 < 1.00 E-16 1.40 E-14 +/- .18% of Pt. 20, App. B, Effluent Limit < 0.1 % < 0.33 % < 0.1 % 2.3 %
Analyses performed by Energy Laboratories, Incorporated (ELI), Casper, Wyoming* The activity for uranium is a mathematical calculation based on a chemical analysis, therefore, no precision estimate (error) is given.
Energy Lab LLD'sUranium = 1.0 E-16Th-230 =1.0 E-16Ra-226 = 1.0 E-1 6Pb-210 = 2.0 E-15
Pt. 20, App.B, Effluent Limits (uCi / ml)Uranium = 1.9 E-12 (50%D and 50% W)Th-230 = 3.0 E-14 (Y)Ra-226 = 9.0 E-13 (W)Pb-210 = 6.0 E-13 (D) LOTUS:\S-TABLES\AIR-7a

COGEMA Mining, Inc. TABLE 7BWyoming OperationsQuarterly Air SamplesIrigaray Project, Fourth Quarter of 1999Sample Type: Composite of continuous weekly air sample filters
Irigaray Project Location Uranium Th-230 Ra-226 Pb-210Fourth quarter (Oct., Nov., Dec.) uCi / ml uCi / ml uCi / ml uCi / ml
IR-1 (Downwind of Restricted Area) 1.18 E-15 < 1.00 E-16 < 1.00 E-16 6.77 E-15 +/- .8% of Pt. 20, App. B, Effluent Limit < 0.1% < 0.33 % < 0.01 % 1.1 %
IR:3 (Upwind of Restricted Area) 1.59 E-15 .1.27 E-16 +/- 1.1 < 1.00 E-16 1.14 E-14 +/- .1% of Pt. 20, App. B, Effluent Limit < 0.1 % 0.4 % < 0.01 % 1.9 %
IR-5 (Irigaray Ranch - nearest resident) 3.20 E-16 1.09 E-16 +/- 0.9 < 1.00 E-16 9.70 E-15 +/- .9% of Pt. 20, App. B, Effluent Limit < 0.1 % 0.4 % < 0.01 % 1.6 %
IR-6 (Background) 6.71 E-16 1.08 E-16 +/- 0.9 < 1.00 E-16 9.73 E-15 +/- .9% of Pt. 20, App. B, Effluent Limit < 0.1 % 0.4% < 0.01 % 1.6 %
IR-13 (Employee House Trailer) 8.79 E-16 < 1.00 E-16 < 1.00 E-16 1.06 E-14 +/- .1% of Pt. 20, App. B, Effluent Limit < 0.1 % < 0.33 % < 0.01 % 1 .8 %/o
Analyses performed by Energy Laboratories, Incorporated (ELI), Casper, Wyoming* The activity for uranium is a mathematical calculation based on a chemical analysis, therefore, no precision estimate (error) is given.
Energy Lab LLD'sUranium = 1.0 E-16Th-230 =1.0 E-16Ra-226 = 1.0 E-16Pb-210 =2.0 E-15
Pt. 20, App.B, Effluent Limits (uCi / ml)Uranium = 1.9 E-12 (50%D and 50% W)Th-230 = 3.0 E-14 (Y)Ra-226 = 9.0 E-13 (W)Pb-210 = 6.0 E-13 (D) LOTUS:\S-TABLES\AIR-7b

APPENDIX 1
Mechanical Integrity Test Results

IRIGARAY UNIT 6INTEGRITY TESTING SUMMARY - 1999
BottomCasing
LowerPackerDate Casing Initial Final I Pressure
Hole # Tested Type Depth Depth Pressure Pressure Loss % Loss Pass FailHP19B 01-Jun-99 YELLOWMINE 193 180 144 140 4 3 XH1191 01-Jun-99 PVC 208 200 144 139 5 4 XH131 01-Jun-99 PVC 307 300 144 141 3 2 XHP22 02-Jun-99 PVC 265 250 144 139 5 4 XH150 02-Jun-99 PVC 196 190 144 138 6 4 X
HP29B 02-Jun-99 YELLOWMINE 211 200 144 140 4 3 XH153 02-Jun-99 PVC 223 210 144 140 4 3 X
H154B 02-Jun-99 YELLOWMINE 196 190 144 138 6 4 XHP24 02-Jun-99 PVC 200 190 144 141 3 2 XH141 02-Jun-99 PVC 204 190 144 137 7 5 X
H142B 02-Jun-99 YELLOWMINE 199 190 144 140 4 3 XHP23 07-Jun-99 PVC 225 210 144 139 5 4 XH139B 07-Jun-99 PVC 208 200 144 137 7 5 XHP17B 07-Jun-99 YELLOWMINE 210 200 144 138 6 4 X
H126 08-Jun-99 PVC 196 190 144 142 2 1 XH127 08-Jun-99 PVC 197 190 144 138 6 4 X
HP13B 08-Jun-99 YELLOWMINE 194 180 144 138 6 4 XH115 08-Jun-99 PVC 247 240 144 138 6 4 X
HI14B 09-Jun-99 YELLOWMINE 202 190 144 139 5 4 XHP6 09-Jun-99 PVC 196 190 144 140 4 3 X
H1202 09-Jun-99 FIBERGLASS 226 220 144 137 7 5 XHP11 09-Jun-99 I PVC 222 210 144 139 5 4 XH1207 11-Jun-99 FIBERGLASS 298 290 144 141 3 2 XH122 11-Jun-99 PVC 212 200 144 140 4 3 XHP15 11-Jun-99 PVC 204 190 144 139 5 4 XHP9 11-Jun-99 PVC 197 190 144 138 6 4 X
H1198 11-Jun-99 PVC 203 190 144 142 2 1 XH17 11-Jun-99 PVC 216 210 144 137 7 5 XHP4 14-Jun-99 PVC 244 230 144 142 2 1 XHill 14-Jun-99 PVC 188 180 144 140 4 3 XHI3B 14-Jun-99 YELLOWMINE 256 240 144 140 4 3 XHP2 14-Jun-99 PVC 169 160 144 139 5 4 XHP87 14-Jun-99 PVC 194 180 144 141 3 2 XH1185 14-Jun-99 PVC 187 180 144 142 2 1 XHP82 16-Jun-99 PVC ... 188. 180. 144 138 6 . 4 X
HI102B 16-Jun-99. YELLOWMINE 160 150 144 140 4 3 XH189 16-Jun-99 PVC 194 180 144 137 7 5 X
H1205 17-Jun-99 FIBERGLASS 189 180 144 137 7 5 XHP39B 17-Jun-99 YELLOWMINE 191 180 144 141 3 2 XH1192 17-Jun-99 PVC 258 250 144 140 4 3 XHP45 17-Jun-99 PVC 177 170 144 138 6 4 XH188 17-Jun-99 PVC 189 180 144 139 5 4 XH194 21-Jun-99 PVC 285 270 144 100 44 30 XH192 21-Jun-99 PVC 300 290 144 140 4 3 XHI91 21-Jun-99 PVC 258 250 144 136 8 6 XH179 21-Jun-99 PVC 292 280 144 137 7 5 X
H1109 21-Jun-99 PVC 178 170 144 138 6 4 XHI151 22-Jun-99 PVC 305 290 144 140 4 3 XHP34 22-Jun-99 PVC 252 240 144 139 5 4 XHP41 22-Jun-99 PVC 286 270 144 137 7 5 XH172 22-Jun-99 PVC 198 190 144 140 4 3 XHP32 22-Jun-99 PVC 196 190 144 139 5 4 XH160 22-Jun-99 PVC 309 290 144 137 7 5 XH156 23-Jun-99 PVC 205 190 144 137 7 5 XH155 23-Jun-99 PVC 198 190 144 138 6 4 XH168 23-Jun-99 PVC 221 210 144 139 5 4 XHI71 23-Jun-99 PVC 228 220 144 100 44 30 XHP25 29-Jun-99 PVC 200 190 144 139 5 4 XH1197 29-Jun-99 PVC 199 190 144 138 6 4 XHP37 29-Jun-99 PVC 196 190 144 138 6 4 X
HP80B 29-Jun-99 YELLOWMINE 310 300 144 140 4 3 XH132B 29-Jun-99 YELLOWMINE 305 290 144 140 4 3 X

IRIGARAY UNIT 6INTEGRITY TESTING SUMMARY - 1999
Date CasingTested Type
BottomCasingDepth
LowerPackerDepth
Initial Final I PressureHole # Pressure I Pressure Loss % Loss Pass FailHP20 29-Jun-99 PVC 300 290 144 138 6 4 X
HP18B 30-Jun-99 YELLOWMINE 198 190 144 137 7 5 XH128 30-Jun-99 PVC 202 190 144 136 8 6 X
H129B 30-Jun-99 YELLOWMINE 194 180 144 100 44 30 XHP14B 30-Jun-99 YELLOWMINE 242 230 144 140 4 3 XH1209 06-Jul-99 FIBERGLASS 252 240 144 140 4 3 XH1161 06-Jul-99 PVC 247 240 144 139 5 4 XHP96 06-Jul-99 FIBERGLASS 245 230 144 138 6 4 XH140 06-Jul-99 PVC 218 210 144 143 1 1 XHI51 07-Jul-99 PVC 268 260 144 138 6 4 XH124 07-Jul-99 PVC 198 190 144 140 4 3 X
H1208 07-Jul-99 FIBERGLASS 229 220 144 141 3 2 XHP12 07-Jul-99 PVC 215 210 144 138 6 4 XHI9B 08-Jul-99 YELLOWMINE 221 210 144 137 7 5 XHI8 08-Jul-99 PVC 292 280 144 138 5 4 X
HP1O 08-Jul-99 PVC 291 280 144 138 6 4 XHI5 09-Jul-99 PVC 206 200 144 142 2 1 X
H1156 09-Jul-99 PVC 167 160 144 138 6 4 XH120 09-Jul-99 PVC 213 200 144 139 5 4 XH121 09-Jul-99 PVC 263 250 144 141 3 2 XHP3 09-Jul-99 PVC 208 200 144 100 44 30 X
H147B 12-Jul-99 YELLOWMINE 254 240 144 135 > 9 6 XH1199B 12-Jul-99 YELLOWMINE 207 200 144 137 7 5 XHI13B 13-Jul-99 YELLOWMINE 178 170 144 138 6 4 XHI12 13-Jul-99 PVC 184 170 144 139 5 4 X
H135B 13-Jul-99 YELLOWMINE 199 190 144 138 6 4 XHP21B 13-Jul-99 YELLOWMINE 161 150 144 137 7 5 XH1130 14-Jul-99 PVC 214 200 144 139 5 4 XHP57 14-Jul-99 PVC 283 270 144 136 8 6 XH1115 15-Jul-99 PVC 282 270 144 137 7 5 XH1132 16-Jul-99 PVC 284 270 144 140 4 3 XH1135 16-Jul-99 PVC 244 230 144 141 3 2 XHP95B 16-Jul-99 YELLOWMINE 161 150 144 137 7 5 XH1182 16-Jul-99 PVC 190 180 144 143 1 1 X
* H1181 16-Jul-99 PVC 204 190 144 139 5 4 .-..XH1184 16-Jul-99 PVC 186 180 144 142 2 1 XHP85 19-Jul-99 PVC 181 170 144 137 5 4 XH1136 19-Jul-99 PVC 180 170 144 138 6 4 XH181 19-Jul-99 PVC 164 150 144 141 3 2 XH152 19-Jul-99 PVC 220 210 144 140 4 3 X

IRIGARAY UNIT 7INTEGRITY TESTING SUMMARY - 1999
Bottom LowerDate Casing Casing Packer Initial Final Pressure
Tested Type Depth Depth Pressure Pressure Loss % Loss Passi T44 01-Jun-99 PVC 199 190 144 137 7 5 X

IRIGARAY UNIT 9INTEGRITY TESTING SUMMARY- 1999
Bottom LowerDate Casing Casing Packer Initial Final Pressure
Hole # Tested Type Depth Depth Pressure Pressure Loss % Loss Pass FailLP10 01-Jun-99 FIBERGLASS 237 220 144 140 4 3 XLI125 22-Sep-99 FIBERGLASS 244 230 144 136 8 6 X

CHRISTENSEN UNIT 3INTEGRITY TESTING SUMMARY - 1999
Date CasingTested I Tvoe
BottomCasingDeath
LowerPackerDeathHole #
Initial FinalPressure Pressure
PressureLoss % Loss Pass Fail
3L29-3 08-Sep-99 YELLOWMINE 276 260 168 166 2 1 X3L31-1 08-Sep-99 YELLOWMINE 273 260 168 128 40 24 X3L31-2 08-Sep-99 YELLOWMINE 239 220 168 162 6 4 X3K27-2 09-Sep-99 YELLOWMINE 250 240 168 166 2 1 X3L27-1 09-Sep-99 YELLOWMINE 237 225 168 164 4 2 X3M29-1 09-Sep-99 YELLOWMNE 229 215 168 166 2 1 X3K28-2 14-Sep-99 YELLOWMINE 279 265 168 162 6 4 X3L28-1 14-Sep-99 YELLOWMINE 233 220 168 162 6 4 X3K25-1 16-Sep-99 YELLOWMINE 278 265 168 164 4 2 X3K25-2 16-Sep-99 YELLOWMINE 237 225 168 164 4 2 X3J26-2 20-Sep-99 YELLOWMINE 256 245 168 148 20 12 X3J23-1 21-Sep-99 YELLOWMINE 260 250 168 164 4 2 X3J27-1 21-Sep-99 YELLOWMINE 282 270 168 168 0 0 X3J29-1 21-Sep-99 YELLOWMINE 301 290 168 162 6 4 X3J30-1 21-Sep-99 YELLOWMINE 247 235 168 164 4 2 X3J30-2 22-Sep-99 YELLOWMINE 248 235 168 162 6 4 X3K29-3 22-Sep-99 YELLOWMINE 280 270 168 144 24 14 X3K31-3 22-Sep-99 YELLOWMINE 257 245 168 160 8 5 X3K29-1 23-Sep-99 YELLOWMINE 243 230 168 0 168 100 X3J31-1 30-Sep-99 YELLOWMINE 289 220 168 162 6 4 X3J29-2 03-Oct-99 YELLOWMINE 248 238 168 160 8 5 X3K33-1 04-Oct-99 YELLOWMINE 304 220 168 162 6 4 X3D22-1 06-Oct-99 YELLOWMINE 276 265 168 165 3 2 X3E19-1 06-Oct-99 YELLOWMINE 250 240 168 162 6 4 X3E21-1 06-Oct-99 YELLOWMINE 275 265 168 156 12 7 X3E13-1 07-Oct-99 YELLOWMINE 277 265 168 164 4 2 X3E15-1 07-Oct-99 YELLOWMINE 270 260 168 164 4 2 X3E17-1 07-Oct-99 YELLOWMINE 257 245 168 164 4 2 X3E7-2 11-Oct-99 YELLOWMINE 286 275 168 164 4 2 X3F8-1 11-Oct-99 YELLOWMINE 284 270 168 164 4 2 X3E11-2 11-Oct-99 YELLOWMINE 284 270 168 168 0 0 X3F15-2 12-Oct-99 YELLOWMINE 278 265 168 168 0 0 X3G16-1 12-Oct-99 YELLOWMINE 255 245 168 160 8 5 X3H17-1 12-Oct-99 YELLOWMINE 256 210 168 164 4 2 X3D10-1 13-Oct-99 YELLOWMINE 285, 275 168 166 2 1. X3D17-1 13-Oct-99 YELLOWMINE 255 245 168 168 0 0 X3D20-2 13-Oct-99 YELLOWMINE 248 235 168 162 6 4 X3D18-2 18-Oct-99 YELLOWMINE 251 240 168 162 6 4 X3D19-1 19-Oct-99 YELLOWMINE 276 265 168 162 6 4 X3N26-2 02-Nov-99 YELLOWMINE 247 235 168 152 16 10 X3A12-3 03-Nov-99 YELLOWMINE 288 275 168 162 6 4 X3B12-1 03-Nov-99 YELLOWMINE 274 260 168 162 6 4 X3B11-1 04-Nov-99 YELLOWMINE 291 280 168 160 8 5 X3B13-2 04-Nov-99 YELLOWMINE 285 275 168 162 6 4 X3814-1 04-Nov-99 YELLOWMINE 273 260 168 162 6 4 X3B16-2 04-Nov-99 YELLOWMINE 280 270 168 158 10 6 X3B20-1 08-Nov-99 YELLOWMINE 274 260 168 162 6 4 X3C18-2 08-Nov-99 YELLOWMINE 280 270 168 162 6 4 X3C21-1 08-Nov-99 YELLOWMINE 291 280 168 162 6 4 X3D15-3 08-Nov-99 YELLOWMINE 265 255 168 160 8 5 X3D11-1 09-Nov-99 YELLOWMINE 295 285 168 160 8 5 X3D12-2 09-Nov-99 YELLOWMINE 276 265 168 160 8 5 X3D14-1 09-Nov-99 YELLOWMINE 278 265 168 160 8 5 X3C15-2 10-Nov-99 YELLOWMINE 277 267 168 162 6 4 X3C17-2 10-Nov-99 YELLOWMINE 273 260 168 162 6 4 X3D13-1 10-Nov-99 YELLOWMINE 272 260 168 160 8 5 X3F13-1 10-Nov-99 YELLOWMINE 277 265 168 162 6 4 X3F10-1 11-Nov-99 YELLOWMINE 283 270 168 162 6 4 X3G15-1 11-Nov-99 YELLOWMINE 262 250 168 160 8 5 X3E10-1 15-Nov-99 YELLOWMINE 287 275 168 162 6 4 X3F9-1 15-Nov-99 YELLOWMINE 298 285 168 0 168 100 1 X3E6-2 16-Nov-99 YELLOWMINE 287 210 168 164 4 2 X I

CHRISTENSEN UNIT 3INTEGRITY TESTING SUMMARY - 1999
BottomCasing
LowerPackerDate Casing Initial Final Pressure
Hole # Tested Type Depth Depth Pressure Pressure Loss % Loss Pass Fail3F11-2 16-Nov-99 YELLOWMINE 300 290 168 160 8 5 X3GI1-3 16-Nov-99 YELLOWMINE 277 265 168 164 4 2 X3D8-1 17-Nov-99 YELLOWMINE 301 290 168 160 8 5 X3F8-2 17-Nov-99 YELLOWMINE 288 275 168 164 4 2 X3F17-1 22-Nov-99 YELLOWMINE 264 250 168 162 6 2 X3B18-1 01-Dec-99 YELLOWMNE 291 280 168 160 8 5 X3E14-1 13-Dec-99 YELLOWMINE 273 260 168 163 5 3 X3E16-2 16-Dec-99 YELLOWMINE 264 250 168 165 3 2 X3019-3 20-Dec-99 YELLOWMINE 227 215 168 164 4 2 X3N23-3 20-Dec-99 YELLOWMINE 248 235 168 0 168 100 X3P25-3 27-Dec-99 YELLOWMINE 204 190 168 163 5 3 X3P23-1 27-Dec-99 YELLOWMINE 221 211 168 164 4 2 X3020-1 27-Dec-99 YELLOWMINE 225 215 168 163 5 3 X3Q21-1 27-Dec-99 YELLOWMINE 212 200 168 162 6 4 X3Q23-1 27-Dec-99 YELLOWMINE 220 210 168 162 6 4 X3P21-2 28-Dec-99 YELLOWMINE 228 210 168 163 5 3 X3R22-1 28-Dec-99 YELLOWMINE 222 210 168 163 5 3 X3R21-1 28-Dec-99 YELLOWMINE 209 200 168 162 6 4 X3S21-1 28-Dec-99 YELLOWMINE 202 190 168 161 7 4 X3R19-1 28-Dec-99 YELLOWMINE 223 210 168 161 7 4 X3R23-1 28-Dec-99 YELLOWMINE 214 200 168 160 .8 5 X3L24-2 29-Dec-99 YELLOWMINE 210 200 168 154 14 8 X3T21-4 29-Dec-99 YELLOWMINE 210 200 168 162 6 4 X3N21-3 29-Dec-99 YELLOWMINE 207 195 168 162 6 4 X3N23-5 29-Dec-99 YELLOWMINE 210 200 168 162 6 4 X3023-1 29-Dec-99 YELLOWMINE 215 200 168 166 2 1 X3S19-1 29-Dec-99 YELLOWMINE 209 199 168 162 6 4 X3T19-2 29-Dec-99 YELLOWMINE 212 200 168 0 168 100 X3M19-3 30-Dec-99 YELLOWMINE 228 215 168 161 7 4 X3N19-1 30-Dec-99 YELLOWMINE 207 195 168 162 6 4 X3N22-4 30-Dec-99 YELLOWMINE 215 205 168 164 4 2 X3R26-3 30-Dec-99 YELLOWMINE 231 220 168 160 8 5 X _
3Q28-1 30-Dec-99 YELLOWMINE 195 185 168 160 8 5 X3021-1 30-Dec-99 YELLOWMINE 221 210 168 161 7 4 X

APPENDIX 2
Individual Monitor and Trend Well Analytical Data

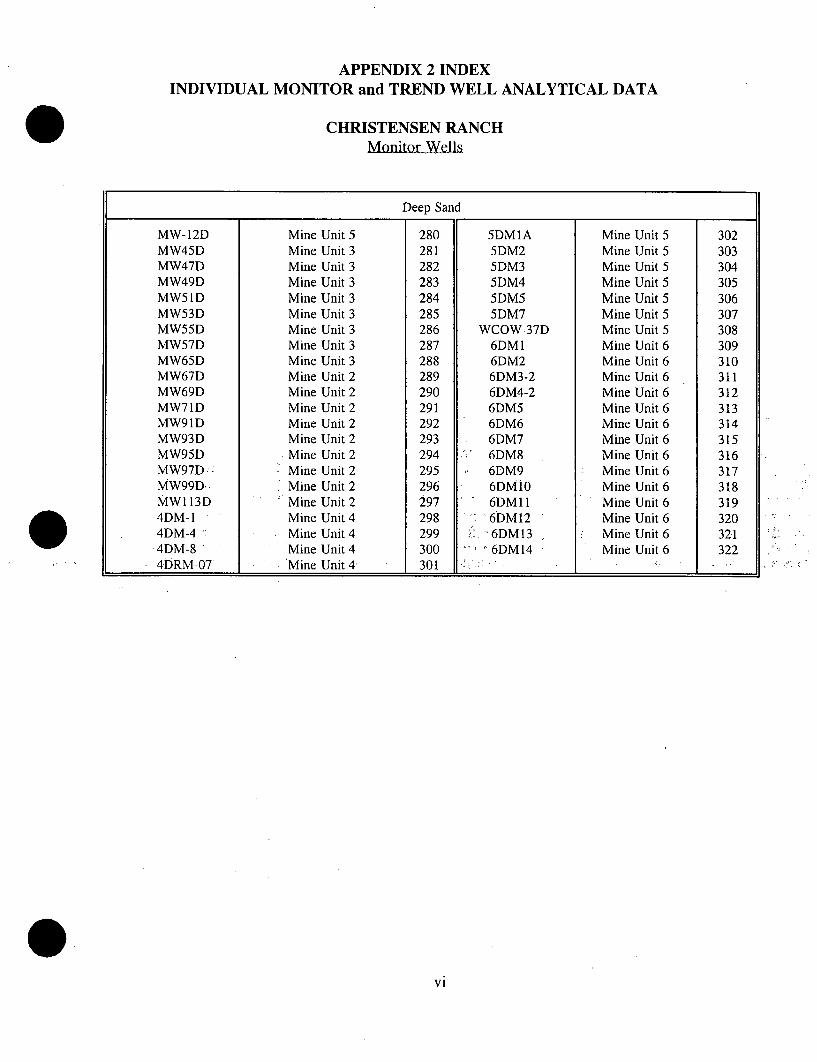
APPENDIX 2 INDEXINDIVIDUAL MONITOR and TREND WELL ANALYTICAL DATA
IRIGARAY RANCHMonitor Wells
Perimeter Ore Zone
Well Location Page Well Location PageNo. No. No. No.
M2 Mine Unit 2 1 M27 Mine Unit 7 12M4 Mine Unit 2 2 M28 Mine Unit 8 13M7 Mine Unit 1 3 M29 Mine Unit 8 14M10 Mine Unit 4 4 M30 Mine Unit 9 15M17 Mine Unit t 5 M31 Mine Unit 9 16M18 Mine Unit 1 6 M32 Mine Unit 9 17M19 Mine Unit 3 7 M33 Mine Unit 9 18M23 Mine Unit 5 8 T31 Mine Unit 1 19M24 Mine Unit 6 9 RS27 Mine Unit 5 20M25 Mine Unit 6 10 16-151 Mine Unit 9 21M26 Mine Unit 7 11
Shallow Sand
SSM2 Mine Unit 1 22 SSM19 Mine Unit 8 33SSM3 Mine Unit 2 23 SSM34 Mine Unit 9 34SSM4 Mine Unit 2 24 SSM35 Mine;Unit 9 35SSM5 Mine Unit 3 25 SSM36 Mine Unitl9 36SSM6 Mine Unit4 26 SSM37 Mine Unit.7 37SSM7 Mine Unit 5 27 SSM38 Mine Unit 7 38SSM8 Mine Unit 5 28 SSM39 Mine Unit.7 39SSM9 Mine Unit 6 29 SSM40 Mine Unit 8 40SSM1O Mine Unit 6 30 SSM41 Mine Unit 4 41SSM11 Mine Unit 6 31 SSM42 Mine Unit 3 42SSM18 Mine Unit 8 32 SSM43 Mine Unit 1 43
Deep Sand
DM1 Mine Unit 1 44 DM14 Mine Unit 8 53DM2 Mine Unit 1 45 DM15 Mine Unit 9 54DM3 Mine Unit 2 46 DM16 Mine Unit 9 55DM4 Mine Unit 4 47 DM17 Mine Unit 5 56DM5 Mine Unit 2 48 DM18 Mine Unit 4 57DM9 Mine Unit 5 49 DM19 Mine Unit 3 58DM10 Mine Unit 6 50 DM20 Mine Unit 3 59DM11 Mine Unit 7 51 DM21 Mine Unit 7 60DM13 Mine Unit 8 52 DM22 Mine Unit 6 61
i

APPENDIX 2 INDEXINDIVIDUAL MONITOR and TREND WELL ANALYTICAL DATA
IRIGARAY RANCHTrend Wells
ii

APPENDIX 2 INDEXINDIVIDUAL MONITOR and TREND WELL ANALYTICAL DATA
CHRISTENSEN RANCHMonitor Wells
Perimeter Ore Zone
Well Location Page Well Location PageNo. No. No. No.
MW17-2MW18MW19MW20MW23MW24MW25MW26MW27MW28MW29MW30MW31MW32MW35MW36MW37MW38MW39MW40MW41MW42MW43MW44MW45MW62MW63MW64MW73MW74MW75MW76MW77MW78MW79MW80MW81MW82MW83MW84MW85MW86
Mine Unit 3Mine Unit 3Mine Unit 3Mine Unit 3Mine Unit 3Mine Unit 3Mine Unit 3Mine Unit 3Mine Unit 3Mine Unit 3Mine Unit 3Mine Unit 3Mine Unit 3Mine Unit 3Mine Unit 3Mine Unit 3Mine Unit 3Mine Unit 3Mine Unit 3Mine Unit 3Mine Unit 3Mine Unit 3Mine Unit 3Mine Unit 3Mine Unit 3Mine Unit 3Mine Unit 3Mine Unit 3Mine Unit 2Mine Unit 2Mine Unit 2Mine Unit 2Mine Unit 2Mine Unit 2Mine Unit 2Mine Unit 2Mine Unit 2Mine Unit 2Mine Unit 2Mine Unit 2Mine Unit 2Mine Unit 2
6869707172737475767778798081828384858687888990919293949596979899100101102103104105106107108109
MW87MW88MW89MW90MW101MWI02MWI03MWI04MWI05MWI06MW107MWI08MW109MWl 10MW111MW1 14MW115MWI164MW-I4MW-24MW-34MW-44MW-54MW-64MW-74MW-84MW-94MW-1O4MW- Il4MW-124MW-134MW-144MW-154MW-164MW-174MW-184MW-194MW-204MW-214MW-224MW-234MW-24
Mine Unit 2Mine Unit 2Mine Unit 2Mine Unit 2Mine Unit 2Mine Unit 2Mine Unit 2Mine Unit 2Mine Unit 2Mine Unit 2Mine Unit 2Mine Unit 2Mine Unit 2Mine Unit 2Mine Unit 2
-Mine Unit 3'Mine Unit 3;Mine Unit 3Mine Unit 4Mine Unit 4-Mine Unit 4,Mine Unit 4Mine Unit 4Mine Unit 4Mine Unit 4Mine Unit 4Mine Unit 4Mine Unit 4Mine Unit 4Mine Unit 4Mine Unit 4Mine Unit 4Mine Unit 4Mine Unit 4Mine Unit 4Mine Unit 4Mine Unit 4Mine Unit 4Mine Unit 4Mine Unit 4Mine Unit 4Mine Unit 4
110111112113114115116117118119120121122123124125126127128
129130131132133134135136137138139140141142143144145146147148149150151
iii

APPENDIX 2 INDEXINDIVIDUAL MONITOR and TREND WELL ANALYTICAL DATA
CHRISTENSEN RANCHMonitor Wells
Perimeter Ore Zone (cont.)
4MW-255MWI5MW25MW35MW45MW55MW65MW75MW85MW105MW125MW145MW165MW185MW205MW30A5MW315MW32A5MW33'5MW345MW35A5MW365MW375MW385MW39A5MW405MW41A5MW425MW435MW445MW455MW465MW47B5MW485MW495MW505MW515MW525MW535MW545MW555MW56
Mine Unit 4Mine Unit 5Mine Unit 5Mine Unit 5Mine Unit 5Mine Unit 5Mine Unit 5Mine Unit 5Mine Unit 5Mine Unit 5Mine Unit 5Mine Unit 5Mine Unit 5Mine Unit 5Mine Unit 5Mine Unit 5Mine Unit 5Mine Unit 5Mine Unit 5Mine Unit 5Mine Unit 5Mine Unit 5Mine Unit 5Mine Unit 5Mine Unit 5Mine Unit 5Mine Unit 5Mine Unit 5Mine Unit 5Mine Unit 5Mine Unit 5Mine Unit 5Mine Unit 5Mine Unit 5Mine Unit 5Mine Unit 5Mine Unit 5Mine Unit 5Mine Unit 5Mine Unit 5Mine Unit 5Mine Unit 5
152153154155156157158159160161162163164165166167168169170171172173174175176177178179180181182183184185186187188189190191192193
5MW575MW585MW595MW605MW615MW625MW635MW645MW655MW665MW675MW696MW17-26MW196MW216MW236MW256MW276MW29
,:6MW31'"6MW33
6MW346MW356MW366MW376MW386MW396MW406MW416MW426MW436MW446MW456MW466MW476MW48-36MW496MW506MW516MW526MW536MW54
Mine Unit 5Mine Unit 5Mine Unit 5Mine Unit 5Mine Unit 5Mine Unit 5Mine Unit 5Mine Unit 5Mine Unit 5Mine Unit 5Mine Unit 5Mine Unit 5Mine Unit 6Mine Unit 6Mine Unit 6Mine Unit 6Mine Unit 6Mine Unit 6Mine Unit 6Mine Unit 6Mine Unit 6Mine Unit 6Mine Unit 6Mine Unit 6Mine Unit 6Mine Unit 6Mine Unit 6Mine Unit 6Mine Unit 6Mine Unit 6Mine Unit 6Mine Unit 6Mine Unit 6Mine Unit 6Mine Unit 6Mine Unit 6Mine Unit 6Mine Unit 6Mine Unit 6Mine Unit 6Mine Unit 6Mine Unit 6
194195196197198199200201202203204205206207208209210211212
. 213214215216
:'217
218219.220221222223224225226227228229230231232233234235
iv

APPENDIX 2 INDEXINDIVIDUAL MONITOR and TREND WELL ANALYTICAL DATA
CHRISTENSEN RANCHMonitor Wells
Shallow Sandr r I
Mine Unit 4 258MW-11SMW46SMW48SMW50SMW52SMW54SMW56SMW58SMW66S-2MW68SMW70SMW72SMW92SMW94SMW96SMW98SMW100SMWll2SMWl 17S4SM-14SM-44SM-8
Mine Unit 5Mine Unit 3Mine Unit 3Mine Unit 3Mine Unit 3Mine Unit 3Mine Unit 3Mine Unit 3Mine Unit 3Mine Unit 2Mine Unit 2Mine Unit 2Mine Unit 2Mine Unit 2Mine Unit 2Mine Unit 2Mine Unit 2Mine Unit 2Mine Unit 2Mine Unit 4'.Mine Unit 4Mine Unit14
236237238239240241242243244245246247248249250251252253254255256257
4SRM-075SM-15SM25SM35SM55SM65SM7
WCOW-046SM1
6SM26SM36SM46SM56SM66SM76SM86SM96SM106SMll6SM126SM 136SM14
Mine Unit 4Mine Unit 5Mine Unit 5Mine Unit 5Mine Unit 5Mine Unit 5Mine Unit 5Mine Unit 5Mine Unit 6Mine Unit 6Mine Unit 6Mine Unit 6Mine Unit 6Mine Unit 6Mine Unit 6Mine Unit 6Mine Unit 6'Mine Unit 6*Mine Unit 6Mine Unit 6Mine Unit 6Mine -Unit 6&
258259260261262263264265266267268269270271272273274275
276277278
S279
v
APPENDIX 2 INDEXINDIVIDUAL MONITOR and TREND WELL ANALYTICAL DATA
CHRISTENSEN RANCHMonitor Wells
Deep Sand
MW-12D 5DM1A Mine Unit 5 302
MW-12DMW45DMW47DMW49DMW51DMW53DMW55DMW57DMW65DMW67DMW69DMW71DMW91DMW93DMW95DMW97D-MW99D.MW1 13D
.4DM-14DM-4 '4DM-8"4DRM-07
Mine Unit 5Mine Unit 3Mine Unit 3Mine Unit 3Mine Unit 3Mine Unit 3Mine Unit 3Mine Unit 3Mine Unit 3Mine Unit 2Mine Unit 2Mine Unit 2Mine Unit 2Mine Unit 2Mine Unit 2Mine Unit 2Mine Unit 2Mine Unit 2Mine Unit 4Mine Unit 4Mine Unit 4Mine Unit 43
280281282283284285286287288289290291292293294295296297298299300301
5DMIA5DM25DM35DM45DM55DM7
WCOW-37D6DM1.6DM26DM3-26DM4-26DM56DM66DM76DM86DM96DMi06DMll
'6DM 136DM 14
Mine Unit 5Mine Unit 5Mine Unit 5Mine Unit 5Mine Unit 5Mine Unit 5Mine Unit 5Mine Unit 6Mine Unit 6Mine Unit 6Mine Unit 6Mine Unit 6Mine Unit 6Mine Unit 6Mine Unit 6Mine Unit 6Mine Unit 6Mine Unit 6Mine Unit 6Mine Unit 6Mine Unit 6
3023033043053063073083093103113123133143t5316317318319320321322
4DM-8 6DM14 Mine Unit 6 322
vi

APPENDIX 2 INDEXINDIVIDUAL MONITOR and TREND WELL ANALYTICAL DATA
CHRISTENSEN RANCHTrend Wells
Perimeter Ore Zone
Well Location Page Well Location PageNo. No. No. No.
MW78T Mine Unit 2 323 6TW2 Mine Unit 6 327MW87T Mine Unit 2 324 6TW3 Mine Unit 6 3285TW-1 Mine Unit 5 325 6TW4 Mine Unit 6 3296TW1 Mine Unit 6 326 6TW5 Mine Unit 6 330
Deep Sand
5DM8T Mine Unit 5 331 6DT1 Mine Unit 6 3335DM9T Mine Unit 5 332
vii

IRIGARAY RANCH
PERIMETER ORE ZONE MONITOR WELLS

NFCCDE02REP
COGEMA Mining Inc.
IRIGARAY RANCH
Mine Unit 2 PERIMETER ORE ZONE MONITOR WELL
2nd Half,1999Well I.D. W42
Water QualityParameters
SpecificConductance
TotalAlkalinityChloride pH Uranium
PiezometricElevation
Units mg/l g mho/cm mg/l as CaCO3 mg/l msl
Upper Control Limit 18 685 131.1
Date
17 AUG 1999
16 NOV 1999
16.7
17.4
788
804
90.8
92.2
8.4
8.5
4265.4
4263.0
* Values Exceed Upper Control Limit
Negative U308 Grades Indicate Less Than Detection Limit.
M2
I

N RCDEQ2REP
COGEMA Mining Inc.
IRIGARAY RANCH
PERIMETER ORE ZONE MONITOR WELLMine Unit 2
2nd Half, 1999Well I.D. M4
Water Quality Specific Total PiezometricParameters Chloride Conductance Alkalinity pH Uranium Elevation
Units mg/l I-i mho/cm mg/l as CaCO3 mg/l msl
Upper Control Limit 18.1 671 100.4
Date
18 AUG 1999 10.3 970 *
29 NOV 1999 10.6 986 *
• Values Exceed Upper Control Limit
Negative U308 Grades Indicate Less Than Detection Limit.
81.4
85.1
8.2
8.5
4281.0
4281.5
M4
2

NFZCDEQ2REP
COGEMA Mining Inc.
IRIGARAY RANCH
PERIMETER ORE ZONE MONITOR WELLMine Unit 1
Well I.D. M7 2nd Half, 1999
Water Quality Specific Total PiezometricParameters Chloride Conductance Alkalinity pH Uranium Elevation
Units mg/1 p mho/cm mg/I as CaCO3 mg/l msl
Upper Control Limit 17.5 679 109.8
Date
IS AUG 1999
29 NOV 1999
11.0
11.2
1907 *
1930 *
93.8
97.2
8.0
8.0
4286.2
4285.9
* Values Exceed Upper Control Limit
Negative U308 Grades Indicate Less Than Detection Limit.
M7

5NZCDEO2REP COGEMA Mining Inc.
IRIGARAY RANCH
PERIMETER ORE ZONE MONITOR WELLMine Unit 4
Well I.D. M1O2nd Half, 1999
Water Quality Specific Total PiezometricParameters Chloride Conductance Alkalinity pH Uranium Elevation
Units mg/i pL mho/cm mg/l as CaCO3 mg/i msl
Upper Control Limit 17.5 701 132.3
Date
18 AUG 1999
17 NOV 1999
15.4
15.9
648
648
113.4
114.5
8.4
8.6
4269.6
4267.8
* Values Exceed Upper Control Limit
Negative U308 Grades Indicate Less Than Detection Limit.
M1O
4

NFRCDEQ2REP
COGEMA Mining Inc.
IRIGARAY RANCH
PERIMETER ORE ZONE MONITOR WELLMine Unit I
2nd Half, 1999Well I.D. M17
Water Quality Specific Total PiezometricParameters Chloride Conductance Alkalinity pH Uranium Elevation
Units mg/l p mho/cm mg/i as CaCO3 mg/I msl
Upper Control Limit 17.1 724 112.9
Date
18 AUG 1999
29 NOV 1999
9.4
9-7
651
657
85.3
87.2
8.4
8.6
4277.6
4279.7
* Values Exceed Upper Control Limit
Negative U308 Grades Indicate Less Than Detection Limit.
M17
5

NRCDEQ2REP
COGEMA Mining Inc.
IRIGARAY RANCH
PERIMETER ORE ZONE MONITOR WELLMine Unit I
2nd Half, 1999Well I.D. M18
Water QualityParameters
Specific
Chloride ConductanceTotal
AlkalinityPiezometricElevationpH Uranium
Units mg/I p mho/cm mg/l as CaCO3 mg/l insl
Upper Control Limit 17 719 111.7
Date
18 AUG 1999
29 NOV 1999
10.4
10.5
1469
1557 *
85.0
92.2
8.0
8.2
4284.1
4284.2
* Values Exceed Upper Control Limit
Negative U308 Grades Indicate Less Than Detection Limit.
M18
6

NRCDEQ2REP
COGEMA Mining Inc.
IRIGARAY RANCH
PERIMETER ORE ZONE MONITOR WELLMine Unit 3
2nd Half, 1999Well I.D. M19
Water Quality Specific Total PiezometricParameters Chloride Conductance Alkalinity pH Uranium Elevation
Units mg/l p mho/cm mg/i as CaCO 3 mg/I msl
Upper Control Limit 17 651 116.7
Date
17 AUG 1999
17 NOV 1999
10.5
10.4
603
606
95.2
94-8
8.6
8.6
4279.0
4277.2
* Values Exceed Upper Control Limit
Negative U308 Grades Indicate Less Than Detection Limit.
M19
7

NRCDE02REP
COGEMA Mining Inc.
IRIGARAY RANCH
PERIMETER ORE ZONE MONITOR WELLMine Unit 5
22nd Half, 1999
Well I.D. M23
Water Quality Specific Total PiezometricParameters Chloride Conductance Alkalinity pH Uranium Elevation
Units mg/l p mho/cm mg/l as CaCO 3mg/1 msl
Upper Control Limit 17 614 106.6
Upper Control Limit 17 614 106.6
Date
17 AUG 1999 10.9 625 *
17 NOV 1999 10.7 625 *
* Values Exceed Upper Control Limit
Negative U308 Grades Indicate Less Than Detection Limit.
90.6
89.1
8.6
8.6
4278.5
4276.7
M23
8

NRCDEQ2REP
COGEMA Mining Inc.
1RIGARAY RANCH
Mine Unit 6 PERIMETER ORE ZONE MONITOR WELL
2nd Half, 1999Well I.D. M24
Water Quality Specific Total PiezometricParameters Chloride Conductance Alkalinity pH Uranium Elevation
Units mg/l ýL mho/cm mg/l as CaCO3 mg/I msl
Upper Control Limit 14.5 632 119.4
Date
15 JUL 1999
09 AUG 1999
14 SEP 1999
14 OCT 1999
10 NOV 1999
08 DEC 1999
8.7
8.2
8.4
8.9
8.8
8.8
505
501
502
506
503
496
111.9
106.4
106.4
110.9
110.7
112.2
8.8
8.7
8.6
8.7
8.7
8.7
4276.1
4276.2
4272.3
4272.8
4274.1
4277.2
* Values Exceed Upper Control Limit
Negative U308 Grades Indicate Less Than Detection Limit,
M24
9

NRCOEQ2REP
COGEMA Mining Inc.
[RIGARAY RANCH
Mine Unit 6 PERIMETER ORE ZONE MONITOR WELL
2nd Half,1999Well I.D. M25
Water Quality Specific Total PiezometParameters Chloride Conductance Alkalinity pH Uranium Elevatio
icn
Units mg/l pt mho/cm mg/I as CaCO3 mg/l msl
Upper Control Limit 15.5 692 111.9
Date
15 JUL 1999
09 AUG 1999
22 SEP 1999
14 OCT 1999
10 NOV 1999
08 DEC 1999
10.6
10.1
10.1
11.0
10.7
10.5
607
602
601
606
605
597
94.4
90.8
90.8
94.3
93.9
90.4
8.6
8.5
8.6
8.5
8.5
8.6
4269.5
4269.6
4266.1
4266.9
4267.7
4271.1
* Values Exceed Upper Control Limit
Negative U308 Grades Indicate Less Than Detection Limit.
M25
10

NF.CDEQ2REP
COGEMA Mining Inc.
IRIGARAY RANCH
Mine Unit 7 PERIMETER ORE ZONE MONITOR WELL
0Well I.D. M26 2nd Half,1999
Water QualityParameters
PiezometricSpecific
ConductanceTotal
AlkalinityChloride pHPiezometric
Uranium Elevation
mg/1 mslUnits mg/1 ýt mho/cm mg/l as CaCO,
Upper Control Limit 14.6 596 113.9
Date
15 JUL 1999
09 AUG 1999
14 SEP 1999
14 OCT 1999
09 NOV 1999
08 DEC 1999
9.3
8.8
9.0
9.4
9.0
9.4
538
535
536
540
536
531
103.6
99.4
99.1
102.2
104.3
101.2
8.6
8.6
8.6
8.6
8.7
8.6
4264.1
4264.4
4257.7
4258.2
4261.6
4265.6
* Values Exceed Upper Control Limit
Negative U308 Grades Indicate Less Than Detection Limit.
M26
11

NRCOEQ2REP
COGEMA Mining Inc.
IRIGARAY RANCH
PERIMETER ORE ZONE MONITOR WELLMine Unit 7
2nd Half, 1999Well I.D. M27
Water Quality Specific Total PiezometrParameters Chloride Conductance Alkalinity pH Uranium Elevatior
c
Units mg/1 [t mho/cm mg/l as CaCO 3mg/l msl
Upper Control Limit 15.2 625 105.8
Date
15 JUL 1999
10 AUG 1999
14 SEP 1999
14 OCT 1999
10 NOV 1999
08 DEC 1999
10.9
10.5
10.6
11.2
10.9
10.5
608
608
606
610
608
599
100.0
94.3
94.1
98.5
100.1
94.5
8.5
8.6
8.4
8.5
8.4
8.5
4254.8
4254.5
4246.7
4248.2
4252.6
4257.9
* Values Exceed Upper Control Limit
Negative U308 Grades Indicate Less Than Detection Limit.
M27
12

NICDEQ2REP
COGEMA Mining Inc.
IRIGARAY RANCH
Mine Unit 8 PERIMETER ORE ZONE MONITOR WELL
Well I.D. M28 2nd Half,1999
Water Quality Specific Total PiezometricParameters Chloride Conductance Alkalinity pH Uranium Elevation
Units mg/I [t mho/cm mg/i as CaCO3 mg/1 msl
Upper Control Limit 15.5 715 110.9
Date
15 JUL 1999
09 AUG 1999
14 SEP 1999
13 OCT 1999
09 NOV 1999
08 DEC 1999
10.8
10.1
10.4
10.5
10.5
10.7
628
623
626
626
627
615
93.5
90.2
88.4
90.6
93.9
90.5
8.6
8.6
8.5
8.6
8.7
8.6
4257.2
4260.5
4250.2
4249.1
4255.2
4259.1
* Values Exceed Upper Control Limit
Negative U308 Grades Indicate Less Than Detection Limit.
M28
13

NRCDEQ2REP
COGEMA Mining Inc.
IRIGARAY RANCH
Mine Unit 8 PERIMETER ORE ZONE MONITOR WELL
Well I.D. M29 2nd Half, 1999
Water Quality Specific Total PiezometricParameters Chloride Conductance Alkalinity pH Uranium Elevation
Units mg/l [t mho/cm mg/l as CaCO3 mg/l msl
Upper Control Limit 16.1 702 109.8
Date
15JUL 1999
10 AUG 1999
14 SEP 1999
14 OCT 1999
10 NOV 1999
08 DEC 1999
10.9
10.6
10.5
10.8
10.8
10.7
616
615
613
618
614
606
97.2
91.3
90.8
94.1
94.2
92.8
8.7
8.7
8.5
8.5
8.6
8.6
4253.1
4252.6
4243.1
4245.7
4251.6
4257.6
* Values Exceed Upper Control Limit
Negative U308 Grades Indicate Less Than Detection Limit.
M29
14

NFtCOEQ2REP
COGEMA Mining Inc.
IRIGARAY RANCH
Mine Unit 9 PERIMETER ORE ZONE MONITOR WELL
WWell I.D. M30 2nd Half,1999
Water QualityParameters
SpecificConductance
TotalAlkalinityChloride pH Uranium
PiezometricElevation
Units mg/l ti mho/cm mg/l as CaCO 3 mg/l msl
Upper Control Limit 15.2 704 105.5
Date
15 JUL 1999
09 AUG 1999
14 SEP 1999
13 OCT 1999
09 NOV 1999
08 DEC 1999
11.0
10.1
10.2
10.8
10.5
10.9
631
626
628
628
628
621
95.0
89.6
87.6
91.9
93.9
90.6
8.4
8.4
8.5
8.6
8.7
8.6
4263.8
4272.0
4264.0
4258.7
4261.8
4263.2
Values Exceed Upper Control Limit
Negative U308 Grades Indicate Less Than Detection Limit.
M30
15

NRCDEQ2REP
COGEMA Mining Inc.
IRIGARAY RANCH
PERIMETER ORE ZONE MONITOR WELLMine Unit 9
2nd Half, 1999Well I.D. M31
Water QualityParameters
SpecificConductance
TotalAlkalinity
PiezometricElevationChloride pH Uranium
Units mg/i li mho/cm mg/l as CaCO 3 mg/1 msl
Upper Control Limit 15.6 690 107.2
Date
15 JUL 1999
10 AUG '1999
14 SEP 1999
14 OCT 1999
10 NOV 1999
08 DEC 1999
12.9
12.4
12.4
12.8
13.1
127
634
631
630
639
635
625
104.7
99.5
100.2
104.1
105.5
100.9
8.5
8.5
8.2
8.5
8.4
8.5
4252.7
4253.5
4249.0
4251.1
4256.9
4260.9
* Values Exceed Upper Control Limit
Negative U308 Grades Indicate Less Than Detection Limit.
M31
16

NRCDEQ2REP
COGEMA Mining Inc.
IRIGARAY RANCH
Mine Unit 9 PERIMETER ORE ZONE MONITOR WELL
Well I.D. M322nd Half, 1999
Water Quality Specific Total PiezometricParameters Chloride Conductance Alkalinity pH Uranium Elevation
Units mg/l A rnho/cm mg/I as CaCO3 mg/l msl
Upper Control Limit 16.1 707 107.4
Date
15 JUL 1999
09 AUG 1999
14 SEP 1999
13 OCT 1999
09 NOV 1999
08 DEC 1999
11.0
10.1
10.5
10.8
10.5
10.5
630
624
627
629
629
621
95.9
90.1
90.1
92.3
94.4
89.7
8.5
8.4
8.4
8&5
8.6
8,5
4273.6
4277.1
4276.9
4276.1
4275.5
4276.9
* Values Exceed Upper Control Limit
Negative U308 Grades Indicate Less Than Detection Limit.
M32
17

NRCDEQ2REP
COGEMA Mining Inc.
IRIGARAY RANCH
Mine Unit 9 PERIMETER ORE ZONE MONITOR WELL
2nd Half,1999Well I.D. M33
Water Quality Specific Total PiezometrParameters Chloride Conductance Alkalinity pH Uranium Elevatioj
ric
n
-Units mg/l ýL mho/cm mg/l as CaCD 3mg/l msl
Upper Control Limit 15.9 686 112
Upper Control Limit 15.9 686 112
Date
15 JUL 1999
10 AUG 1999
14 SEP 1999
14 OCT 1999
10 NOV 1999
08 DEC 1999
10.9
10.6
10.7
10.8
10.8
10.5
618
616
615
621
615
607
97.1
93.1
90.8
94.8
94.8
91.3
8.5
8.6
8.4
8.5
8.5
8.6
4253.8
4255.3
4258.6
4258.3
4261.5
4264.1
* Values Exceed Upper Control Limit
Negative U308 Grades Indicate Less Than Detection Limit.
M33
18

NRCDEQ2REP
COGEMA Mining Inc.
IRIGARAY RANCH
PERIMETER ORE ZONE MONITOR WELLMine Unit 1
WWell I.D. T31I 2nd Half, 1999
Water Quality Specific Total PiezometricParameters Chloride Conductance Alkalinity pH Uranium Elevation
Units mg/l • mho/cm mg/l as CaCO3 mg/l msl
Upper Control Limit 21.8 779 106.1
Date
18 AUG 1999
29 NOV 1999
13.6
14.1
697
700
90.6
87.1
8.3
8.6
4268.0
4271.3
* Values Exceed Upper Control Limit
Negative U308 Grades Indicate Less Than Detection Limit.
T31
19

NRCDE02REP
COGEMA Mining Inc.
IRIGARAY RANCH
PERIMETER ORE ZONE MONITOR WELLMine Unit 5
2nd Half, 1999Well I.D. RS27
Water Quality Specific Total PiezometricParameters Chloride Conductance Alkalinity pH Uranium Elevation
Units mg/l p. mho/cm mg/1 as CaCO 3 mg/1 msl
Upper Control Limit 16.9 646 101.2
Date
18 AUG 1999 11.7 679 *
17 NOV 1999 11.9 694 *
* Values Exceed Upper Control Limit
Negative U308 Grades Indicate Less Than Detection Limit.
94.7
95.5
8.3
8.5
4271.6
4269.8
RS27
20

NRGCDEQ2REP
COGEMA Mining Inc.
IRIGARAY RANCH
Mine Unit 9 PERIMETER ORE ZONE MONITOR WELL
Well I.D. 16-151 2nd Half,1999
Water QualityParameters
SpecificConductance
TotalAlkalinityChloride pH Uranium
PiezometricElevation
Units mg/i ýt mho/cm mg/l as CaCO 3 mg/l msl
Upper Control Limit 16 702 110.2
Date
15 JUL 1999
10 AUG 1999
14 SEP 1999
14 OCT 1999
10 NOV 1999
08 DEC 1999
i0.8
10.5
10.4
10.9
10.8
10.7
608
609
605
613
607
599
92.8
88.9
88.3
91.7
91.9
89:5
8.6
8.7
8.4
8.6
8.6
8.5
4259.8
4262.0
4269.2
4267.2
4269.2
4270.6
* Values Exceed Upper Control Limit
Negative U308 Grades Indicate Less Than Dete~ction Limit.
16-151
21

IRIGARAY RANCH
INTERIOR SHALLOW SAND MONITOR WELLS

NF:CDE02REP
COGEMA Mining Inc.
IRIGARAY RANCH
Mine Unit I INTERIOR SHALLOW SAND MONITOR WELL
Well I.D. SSM2 2nd Half, 1999
Water Quality Specific Total PiezometricParameters Chloride Conductance Alkalinity pH Uranium Elevation
Units mg/l R mho/cm mg/i as CaCO3 mg/i msl
Upper Control Limit 20.3 2075 128.4
Date
18 AUG 1999
29 NOV 1999
22.6 * 1959 107.6
110.8
7.9
8.0
4304.5
4304.322.8 * 1979
* Values Exceed Upper Control Limit
Negative U308 Grades Indicate Less Than Detection Limit.
SSM2
22

NRCDE02REP
COGEMA Mining Inc.
IRIGARAY RANCH
INTERIOR SHALLOW SAND MONITOR WELLMine Unit 2
Well I.D. SSM3 2nd Half,1999
Water QualityParameters
SpecificChloride Conductance
TotalAlkalinity pH Uranium
PiezometricElevation
Units mg/l IA mho/cm mg/l as CaCO 3 mg/l msl
Upper Control Limit 38.5 1451 219.1
Date
07 JUL 1999
14 JUL 1999
20 JUL 1999
27 JUL 1999
04 AUG 1999
09 AUG 1999
17 AUG 1999
24 AUG 1999
30 AUG 1999
08 SEP 1999
14 SEP 1999
20 SEP 1999
28 SEP 1999
04 OCT 1999
13 OCT 1999
19 OCT 1999
28 OCT 1999
03 NOV 1999
09 NOV 1999
16 NOV 1999
22 NOV 1999
01 DEC 1999
07 DEC 1999
15 DEC 1999
20 DEC 1999
27 DEC 1999
54.2
52.2
53.1
52.3
47.4
51.3
53.9
52.7
53.3
52.4
52.4
53.9
50.9
52.6
55.3
53.9
55.0
53.5
52.8
54.0
53.8
53.9
54.6
54.7
54.6
54.5
* 1733
1754
* 1747
* 1745
* 1746
* 1740
* 1730
* 1741
* 1760
* 1747
* '1756
* 1742
* 1739
* 1755
* 1756
* 1762
* 1731
1755
* 1760
* 1767
* 1734
* 1754
* 1741
1768
* 1764
* 1756
* 158.8
* 153.8
* 157.7
* 156.2
* 138.7
* 151.9
* 155.9
* 150.2
* 140.4
* 151.4
* 147.9
* 157.4
* 148.6
* 154.2
* 156.7
* 157.4
* 155.6
* 156.6
* 155.9
* 154.5
* 155.2
* 151.4
* 152.7
* 148.6
* 154.7
* 148.2
4307.4
4307.2
4307.2
4307.1
4306.8
4306.9
4307.2
4307.1
4307.
4307.0
4306.9
4306.8
4306.6
4306.8
4306.8
4306.7
4306.8
4306.8
4306.7
4305.4
4305.4
4305.4
4305.4
4305.4
4305.4
4307.0
-1
-I
-l
-1
-1
-l
-I
-I
-I
* Values Exceed Upper Control Limit
Negative U308 Grades Indicate Less Than Detection Limit.
SSM3 0
23

NRCDEQ2REP
COGEMA Mining Inc.
IRIGARAY RANCH
Mine Unit 2 INTERIOR SHALLOW SAND MONITOR WELL
2nd Half, 1999Well I.D. SSM4
Water QualityParameters
Units
Specific
Chloride ConductanceTotal
AlkalinityPiezometricElevationpH Uranium
mg/l ýt mho/cm mg/1 as CaCO, mg/I msl
Upper Control Limit 23.5 883 275.5
Date
18 AUG 1999
29 NOV 1999
12.5
18.6
626
701
127.7
274.1
7.4
8.3
4300.2
4299.4
* Values Exceed Upper Control Limit
Negative U308 Grades Indicate Less Than Detection Limit.
SSM4
24

NRCDEQ2REP
COGEMA Mining Inc.
IRIGARAY RANCH
Mine Unit 3 INTERIOR SHALLOW SAND MONITOR WELL
2nd Half, 1999Well I.D. SSM5
Water Quality Specific Total PiezometricParameters Chloride Conductance Alkalinity pH Uranium Elevation
Units mg/i pa mho/cm mg/l as CaCO 3 mg/I msl
Upper Control Limit 21.5 825 254.9
Date
18 AUG 1999
29 NOV 1999
14.5
14.7
728
741
217.6
216.8
7.9
8.1
4304.8
4304.2
Values Exceed Upper Control Limit
Negative U308 Grades Indicate Less Than Detection Limit.
SSM5
25

NfCDEQ2REP
COGEMA Mining Inc.
IRIGARAY RANCH
Mine Unit 4 INTERIOR SHALLOW SAND MONITOR WELL
2nd Half,1999Well I.D. SSM6
Water QualityParameters
Specific
Chloride ConductanceTotal
Alkalinity pH UraniumPiezometric
Elevation
mslUnits mg/l p mho/cm mg/I as CaCO3 mg/i
Upper Control Limit 16.3 2445 122.2
Date
17 AUG 1999
17 NOV 1999
10.9
11.0
2056
2060
95.7
98.7
7.9
7.9
4306.5
4306.2
* Values Exceed Upper Control Limit
Negative U308 Grades Indicate Less Than Detection Limit.
SSM6
26

NRCDE02REP
COGEMA Mining Inc.
IRIGARAY RANCH
INTERIOR SHALLOW SAND MONITOR WELLMine Unit 5
Well I.D. SSM7 2nd Half,1999
Water QualityParameters
SpecificChloride Conductance
TotalAlkalinity pH Uranium
PiezometricElevation
Units mg/1 p- mho/cm mg/1 as CaCO3 mg/1 msl
Upper Control Limit 17.1 2604 119.4
Date
17 AUG 1999
17 NOV 1999
11.8
11.7
2305
2306
95.6
94.6
7.8
7.9
4307.1
4306.8
* Values Exceed Upper Control Limit
Negative U308 Grades Indicate Less Than Detection Limit.
SSM7
27

NF.CDEQ2REP
COGEMA Mining Inc.
IRIGARAY RANCH
INTERIOR SHALLOW SAND MONITOR WELLMine Unit 5
Well I.D. SSM8 2nd Half, 1999
Water Quality Specific Total PiezometricParameters Chloride Conductance Alkalinity pH Uranium Elevation
Units mg/i gt mho/cm mg/l as CaCO 3 mg/i msl
Upper Control Limit 16.6 2389 112.2
Date
17 AUG 1999
17 NOV 1999
11.8
12.3
1997
2014
91.6
92.5
7.7
7.8
4306.7
4306.4
* Values Exceed Upper Control Limit
Negative U308 Grades Indicate Less Than Detection Limit.
SSM8
28

N RCDEQ2REP
COGEMA Mining Inc.
IRIGARAY RANCH
Mine Unit 6 INTERIOR SHALLOW SAND MONITOR WELL
Well I.D. SSM9 2nd Half,1999
Water Quality Specific Total Piezometric
Parameters Chloride Conductance Alkalinity pH Uranium Elevation
Units mg/l p mho/cm mg/i as CaCO3 mg/1 msl
Upper Control Limit 15 2008 117.8
Date
20 JUL 1999
17 AUG 1999
22 SEP 1999
20 OCT 1999
10 NOV 1999
15 DEC 1999
9.7
9.1
8.5
8.9
9.0
9.0
1540
1531
1518
1526
1529
1531
96.2
93.1
91.2
95.3
93.7
91.8
7.5
7.9
7.9
7.9
7.8
7.9
4309.6
4309.5
4309.4
4309.3
4309.3
4309.4
* Values Exceed Upper Control Limit
Negative U308 Grades Indicate Less Than Detection Limit.
SSM9
29

NRICDEQ2REP
COGEMA Mining Inc.
IRIGARAY RANCH
Mine Unit 6 INTERIOR SHALLOW SAND MONITOR WELL
Well I.D. SSMI0 2nd Half, 1999
Water Quality Specific Total PiezometricParameters Chloride Conductance Alkalinity pH Uranium Elevation
Units mg/I t' mho/cm mg/I as CaCO3 mg/i msl
Upper Control Limit 15.5 1955 177.4
Date
20 JUL 1999
17 AUG 1999
23 SEP 1999
13 OCT 1999
10 NOV 1999
15 DEC 1999
12.6
11.8
10.9
11.6
11.4
11.4
1657
1640
1595
1625
1612
1610
120.3
115.8
110.4
113.2
112.8
110.0
7.7
7.9
8.0
8.0
7.8
8.0
4309.4
4309.3
4308.9
4308.9
4308.7
4309.3
* Values Exceed Upper Control Limit
Negative U308 Grades Indicate Less Than Detection Limit.
SSM10
30

NRCDEQ2REP
COGEMA Mining Inc.
IRIGARAY RANCH
Mine Unit 6 INTERIOR SHALLOW SAND MONITOR WELL
Well I.D. SSM1 I 2nd Half, 1999
Water QualityParameters
Specific
Chloride ConductanceTotal
AlkalinityPiezometric
ElevationpH Uranium
Units mg/l p rmho/cm mg/I as CaCO3 mg/l msl
Upper Control Limit 16.2 2784 122.9
Date
20 JUL 1999
17 AUG 1999
23 SEP 1999
20 OCT 1999
10 NOV 1999
15 DEC 1999
12.8
12.7
12.6
13.8
12.8
12.0
2409
2440
2410
2506
2436
2389
96.9
91.6
97.2
94.6
92.8
89.6
7.7
7.8
7.9
7.8
7.7
7.9
4310.7
4310.8
4310.5
4310.4
4310.6
4310.7
* Values Exceed Upper Control Limit
Negative U308 Grades Indicate Less Than Detection Limit.
SSM11
31

NF:CDE02REP
COGEMA Mining Inc.
IRIGARAY RANCH
Mine Unit 8 INTERIOR SHALLOW SAND MONITOR WELL
W .. 2nd Half,1999Well I.D. SSMI 9
Water Quality Specific Total PiezometricParameters Chloride Conductance Alkalinity pH Uranium Elevation
Units mg/l ý.t mho/cm mg/I as CaCO3 mg/1 msl
Upper Control Limit 14.7 1849 119.4
Date
07 JUL 1999 19.2 * 1722 152.4 * 7.7 -1 4310.9
14 JUL 1999 18.4 * 1715 149.1 * 7.8 -1 4310.9
20 JUL 1999 18.3 * 1714 149.1 * 7.9 -1 4310.8
27 JUL 1999 18.8 * 1723 152.8 * 7.8 -1 4310.7
04AUG 1999 17.3 * 1715 142.6 * 7.8 -1 4310.6
09 AUG 1999 17.9 * 1711 146.8 7.8 -1. 4310.6
17 AUG 1999 18.8 * 1726 150.4 * 7.8 -1 4310.7
24 AUG 1999 18.6 * 1715 148.4 * 8.0 -1 4310.7
30 AUG 1999 18.1 * 1729 148.3 * 7.8 -1 4310.7
08 SEP 1999 18.3 * 1726 147.6 * 7.6 -1 . 4310.5
14 SEP 1999 18.0 * 1721 144.9 7.6 -1 4310.5
20 SEP 1999 18.2 * 1706 151.7 7.7' -1 4310.5
28 SEP 1999 17.7 * 1709 145.9 * 7.7 -1 4310.3
04 OCT 1999 18.0 * 1716 148.5 * 7.7 -I 4310.5
13 OCT 1999 18.8 * 1721 150.2 * 7.8 -1 4310.5
19OCT 1999 18.3 * 1721 153.0 * 7.8 -1 4310.5
28 OCT 1999 18.0 * 1684 146.8 7.7 -1 4310.4
03 NOV 1999 17.9 * 1699 152.0 * 7.7 -1 4310.3
09 NOV 1999 17.8 * 1715 150.3 7.8 -I 4310.5
16 NOV 1999 18.6 * 1726 150.5 * 7.7 -1 4309.4
22 NOV 1999 18.3 * 1710 152.2 * 7.8 -1 4309.4
01 DEC 1999 18.6 * 1713 151.1 7.8 -1 4309.4
07 DEC 1999 18.5 * 1704 150.9 7.9 -1 4309.4
15 DEC 1999 18.4 * 1722 146.2 * 7.8 -I 4309.4
20 DEC 1999 18.6 * 1721 151.4 * 7.7 -1 4309.4
27 DEC 1999 18.3 * 1707 145.6 * 7.7 -1 4310.7
* Values Exceed Upper Control Limit SSM18
Negative U308 Grades Indicate Less Than Detection Limit.
32

NRCDEQ2REP
COGEMA Mining Inc.
IRIGARAY RANCH
INTERIOR SHALLOW SAND MONITOR WELLMine Unit 8
2nd Half, 1999Well I.D. SSM19
Water Quality Specific Total PiezometricParameters Chloride Conductance Alkalinity pH Uranium Elevation
Units mg/I ýi mho/cm mg/l as CaCO3 mg/l msl
Upper Control Limit 13.7 1636 114.1
Date
20 JUL 1999
10 AUG 1999
23 SEP 1999
19 OCT 1999
10 NOV 1999
08 DEC 1999
9.4
8.7
8.3
8.8
9.1
8.9
1503
1489
1488
1498
1496
1469
91.8
85.4
85.7
90.6
89.8
85.7
8.0
8.1
8.2
8.2
7.9
8.1
4311.4
4310.9
4311.4
4311.3
4310.5
4310.7
SSMI9* Values Exceed Upper Control Limit
Negative U308 Grades Indicate Less Than Detection Limit.
33

NF;CDEQ2REP
COGEMA Mining Inc.
IRIGARAY RANCH
Mine Unit 9 INTERIOR SHALLOW SAND MONITOR WELL
wll I.D. SSM34 2nd Half, 1999
Water Quality Specific Total PiezometricParameters Chloride Conductance Alkalinity pH Uranium Elevation
Units mg/l pi mho/cm mg/l as CaCO 3 mg/I msl
Upper Control Limit 13.2 1698 110.4
Date
20 JUL 1999
10 AUG 1999
22 SEP 1999
14 OCT 1999
10 NOV 1999
08 DEC 1999
9.2
8.7
8.4
8.9
8.9
8.9
1245
1222
1215
1229
1233
1209
94.9
89.9
88.0
91.9
91.4
89.2
7.9
8.1
8.0
8.0
8.0
8.1
4310.1
4310.1
4310.0
4310.0
4310.0
4310.2
* Values Exceed Upper Control Limit
Negative U308 Grades Indicate Less Than Detection Limit.
SSM34
34

N RCDEQ2REP
COGEMA Mining Inc.
IRIGARAY RANCH
Mine Unit 9 INTERIOR SHALLOW SAND MONITOR WELL
2nd Half, 1999Well I.D. SSM35
Water QualityParameters
SpecificConductance
TotalAlkalinity
PiezometricElevationChloride pH Uranium
Units mg/l pi mho/cm mg/1 as CaCO 3 mg/I msl
Upper Control Limit 14.4 1688 132.7
Date
20 JUL 1999
10 AUG 1999
22 SEP 1999
14 OCT 1999
10 NOV 1999
08 DEC 1999
9.1
8.5
8.4
8.7
8.7
8.6
1279
1273
1252
1266
1274
1259
106.1
98.9
99.3
101.3
101.9
98.9
8.0
8.2
8.1
8.1
8.0
8.1
4310.7
4310.6
4310.6
4310.5
4310.5
4310.7
* Values Exceed Upper Control Limit
Negative U308 Grades Indicate Less Than Detection Limit.
SSM35
35

NRCDE02REP
COGEMA Mining Inc.
IRIGARAY RANCH
Mine Unit 9 INTERIOR SHALLOW SAND MONITOR WELL
Well I.D. SSM36 2nd Half, 1999
Water QualityParameters
SpecificConductance
TotalAlkalinity
PiezometricElevationChloride pH Uranium
Units mg/i pt mho/cm mg/i as CaCO3 mg/i msl
Upper Control Limit 13.7 1565 119.6
Date
20 JUL 1999
10 AUG 1999
22 SEP 1999
14 OCT 1999
10 NOV 1999
08 DEC 1999
8.8
7.9
8.1
8.6
8.5
8.2
1285
1278
1265
1284
1278
1258
104.1
93.2
97.8
100.7
100.6
98.0
8.0
8.2
8.1
8.1
8.0
8.2
4312.4
4312.4
4312.3
4312.3
4312.1
4312.4
Values Exceed Upper Control Limit
Negative U308 Grades Indicate Less Than Detection Limit.
SSM36
36

NRCDEQ2REP
COGEMA Mining Inc.
IRIGARAY RANCH
Mine Unit 7 INTERIOR SHALLOW SAND MONITOR WELL
2nd Half, 1999Well I.D. SSM37
Water Quality Specific Total PiezometricParameters Chloride Conductance Alkalinity pH Uranium Elevation
Units mg/l gt mho/cm mg/l as CaCO 3 mg/l msl
Upper Control Limit 14.3 1813 120
Date
20 JUL 1999
10 AUG 1999
23 SEP 1999
19 OCT 1999
10 NOV 1999
15 DEC 1999
10.8
10.4
10.2
10.4
10.5
10.5
1615
1613
1616
1627
1630
1631
116.7
109.6
110.5
114.6
111.6
108.5
7.9
8.1
8.0
8.0
7.8
7.9
4306.6
4306.6
4306.4
4306.4
4306.3
4306.4
SSM37* Values Exceed Upper Control Limit
Negative U308 Grades Indicate Less Than Detection Limit.
37

NPRCDE02REP
COGEMA Mining Inc.
IRIGARAY RANCH
Mine Unit 7 INTERIOR SHALLOW SAND MONITOR WELL
Well I.D. SSM38 2nd Half, 1999
Water Quality Specific Total PiezometricParameters Chloride Conductance Alkalinity pH Uranium Elevation
Units mg/l p mho/cm mg/I as CaCO3 mg/i msl
Upper Control LimitI
16.2 2800 118.8
Date
20 JUL 1999
10 AUG 1999
23 SEP 1999
20 OCT 1999
10 NOV 1999
15 DEC 1999
11.3
10.6
10.4
10.6
10.8
10.4
2249
2239
2220
2204
2236
2212
103.3
97.3
96.7
99.9
98.7
100.9
7.8
8.0
8.0
7.9
7.8
7.9
4308.6
4308.7
4308.5
4308.5
4308.5
4308.7
* Values Exceed Upper Control Limit
Negative U308 Grades Indicate Less Than Detection Limit.
SSM38
38

NRCDEQ2REP
COGEMA Mining Inc.
IRIGARAY RANCH
Mine Unit 7 INTERIOR SHALLOW SAND MONITOR WELL
2nd Half,1999Well I.D. SSM39
Water Quality Specific Total PiezometricParameters Chloride Conductance Alkalinity pH Uranium Elevation
Units mg/l p mho/cm mg/l as CaCO 3 mg/1 msl
Upper Control Limit 14.5 2071 104.4
Date
20 JUL 1999
10 AUG 1999
22 SEP 1999
20 OCT 1999
10 NOV 1999
15 DEC 1999
12.7
11.8
11.1
11.9
12.0
11.9
1807
1796
1784
1795
1805
1812
110.9
103.6
102.0
107.6
106.3
102.4
7.9
8.0
7.9
7.9
7.7
7.9
4307.3
4307.3
4307.2
4307.1
4306.9
4307.2
*
*
* Values Exceed Upper Control Limit
Negative U308 Grades Indicate Less Than Detection Limit.
SSM39
39

NFZCDE02REP COGEMA Mining Inc.
IRIGARAY RANCH
Mine Unit 8 INTERIOR SHALLOW SAND MONITOR WELL
is 2nd Half, 1999Well I.D. SSM40
Water Quality Specific Total PiezometricParameters Chloride Conductance Alkalinity pH Uranium Elevation
Units mg/l g mho/cm mg/i as CaCO3 mg/1 msl
Upper Control Limit 13.6 1672 109.2
Date
07 JUL 1999 14.5 * 1481 114.6 * 8.1 -1 4312.6
14 JUL 1999 14.5 * 1494 114.5 * 8.0 -1 4312.6
20 JUL 1999 14.7 * 1529 116.5 * 8.0 -1 4312.5
27 JUL 1999 14.4 * 1498 114.8 8.0 -1 4312.3
04 AUG 1999 13.7 * 1506 109.7 8.1 -1 4309.4
09AUG 1999 15.3 * 1553 121.6 * 7.9 -1 4312.3
17AUG 1999 14.3 * 1532 113.2 8.0 -1 4312.4
24 AUG 1999 13.9 1489 109.8 * 8.3 -1 4312.4
30 AUG 1999 13.4 1506 107.9 8.1 -1 4312.3
08 SEP 1999 13.9 * 1520 110:3 7.8' -1 4312.2
14 SEP 1999 13.7 * 1508 10718 7.8 -1 4312.2
20 SEP 1999 14.1 * 1500 114.2 8.0 -1 4312.2
28 SEP 1999 13.3 1498 107.8 8.0 -1 4311".9
04OCT 1999 14.8 * 1536 118.8 * 7.9 -1 4312.2
13 OCT 1999 14.1 1491 111.6 8.0 -1 4312.2
19 OCT 1999 13.9 * 1511 114.0 8.1 -1 4312.1
28 OCT 1999 13.9 1465 111.1 * 8.1 -1 4312.2
03 NOV 1999 13.9 * 1507 114.3 * 7.9 -I 4312.1
09NOV 1999 14.0 * 1516 114.5 8.0 -1 4312.1
16 NOV 1999 14.0 * 1530 111.7 8.1 -1 4312.1
22 NOV 1999 14.7 * 1565 116.1 8.2 -1 4312.1
01 DEC 1999 14.3 * 1532 112.6 8.1 -I 4312.1
07 DEC 1999 14.2 * 1514' 111.7 8.2 -1 4312.1
15 DEC 1999 14.0 * 1509 107.9 8.1 -1 4312.1
20 DEC 1999 14.5 1517 114.7 8.1 -1 4312.1
27 DEC 1999 14.4 * 1530 111.3 8.0 -1 4312.3
Values Exceed Upper Control Limit SSM40
Negative U308 Grades Indicate Less Than Detection Limit.
40

IM R €2 FII= N •l•!c'P
COGEMA Mining Inc.
IRIGARAY RANCH
Mine Unit 4 INTERIOR SHALLOW SAND MONITOR WELL IWell I.D. SSM41 2nd Half,1999
Water Quality Specific Total PiezometricParameters Chloride Conductance Alkalinity pH Uranium Elevation
Units mg/l [t mho/cm mg/i as CaCO3 mg/i msl
Upper Control Limit 24.9 2566 126.8
Date
07 JUL 1999 33.1 * 2406 133.8 * 7.8 -1 4307.2
14 JUL 1999 32.1 * 2415 131.4 * 7.8 -1 4307.1
20 JUL 1999 32.7 * 2415 134.9 * 7.9 -1 4307.0
27 JUL 1999 32.4 * 2419 133.6 * 7.8 -1 4306.9
04 AUG 1999 30.1 * 2418 124.1 7.8 -1 4306.8
09 AUG 1999 30.7 * 2398 128.4 * 7.8 -1 4306.8
17 AUG 1999 31.9 * 2405 130.0 * 7.8 -1 4307.0
24AUG 1999 31.8 * 2404 128.2 * 7.9 -1 4117.
30 AUG 1999 30.9 * 2422 128.5 * 7.8 -1 4306!
08 SEP 1999 31.1 * 2411 128.0 * 7.7 -1 4306.8
14 SEP 1999 30.7 * 2412 126.4 7.7 -I 4306.8
20 SEP 1999 31.7 * 2401 134.6 * 7.8 -I 4306.8
28 SEP 1999 31.0 * 2396 127.6 * 7.8 -1 4306.6
04 OCT 1999 31.2 * 2415 130.6 * 7.8 -1 4306.7
13 OCT 1999 33.1 * 2420 132.5 * 7.8 -1 4306.7
19 OCT 1999 31.6 * 2417 132.8 * 7.9 -1 4306.7
28 OCT 1999 32.5 * 2386 131.8 * 7.8 -1 4306.7
03 NOV 1999 31.7 * 2408 134.8 * 7.8 -1 4306.7
09 NOV 1999 32.1 * 2416 136.3 * 7.8 -1 4306.6
16 NOV 1999 32.0 * 2318 131.5 * 7.8 -I 4306.9
22 NOV 1999 31.9 * 2398 131.7 * 7.9 -1 4306.9
01 DEC 1999 32.3 * 2411 130.7 * 7.8 -1 4306.9
07 DEC 1999 32.0 * 2394 131.6 * 7.8 -1 4306.9
15 DEC 1999 32.5 * 2427 129.0 * 7.9 -1 4306.9
20 DEC 1999 32.7 * 2410 134.4 * 7.8 -1 4306.9
27 DEC 1999 32.6 * 2405 129.6 * 7.8 -1 4307.0
• Values Exceed Upper Control Limit SSM41 4Negative U308 Grades Indicate Less Than Detection Limit.
41

NFzCDEQ2REP
COGEMA Mining Inc.
IRIGARAY RANCH
Mine Unit 3 INTERIOR SHALLOW SAND MONITOR WELL
ZVell I.D. SSM42 2nd Half,1999
Water Quality Specific Total PiezometricParameters Chloride Conductance Alkalinity pH Uranium Elevation
Units mg/l p mho/cm mg/1 as CaCO3 mg/l msl
Upper Control Limit 23.3 1571 213.2
Date
07 JUL 1999
14 JUL 1999
20 JUL 1999
27 JUL 1999
04 AUG 1999
09 AUG 1999
17 AUG 1999
24 AUG 1999
30 AUG 1999
08 SEP 1999
14 SEP 1999
20 SEP 1999
28 SEP 1999
04 OCT 1999
13 OCT 1999
19 OCT 1999
28 OCT 1999
03 NOV 1999
09 NOV 1999
16 NOV 1999
22 NOV 1999
01 DEC 1999
07 DEC 1999
15 DEC 1999
20 DEC 1999
27 DEC 1999
55.5
54.4
54.2
54.5
51.7
52.3
55.2
54.2
49.2
53.0
53.6
53.7
53.5
54.0
55.8
54.9
56.2
54.6
54.4
55.4
55.9
58.0
56.2
55.5
56.5
55.8
* 2264
* 2280
* 2282
* 2285
* 2283
* 2271
* 2274
* 2278
* 2297
* 2281
* 2300
2285
* 2274
* 2293
* 2282
* 2300
* 2260
* 2285
* 2288
* 2302
* 2271
* 2275
* 2265
* 2293
* 2287
* 2270
* 139.2
* 134.9
* 138.2
* 139.1
* 130.6
* 133.9
* .142.1
137.2
* 144.4
* .138.7
* . 135.8
* 139.5
* 134.0
* 137.5
* 136.7
* 139.4
* 138.4
* 138.1
* 138.7
* 135.5
* 138.7
* 141.8
* 137.0
* 130.7
* 138.0
* 132.9
7.8
7.8
7.8
7.7
7.6
7.7
7.6
7.6
7.8
7.7
7.6
7.8
7.8
7.8
7.8
7.9
7.8
7.7
7.8
7.7
7.9
7.8
7.8
7.8
7.8
7.7
4303.4
4303.3
4303.2
4303.1
4303.0
4303.0
,4303.2
4303.1
4303.0
4303.0
4302.9
4302.9
4302.8
4302.8
4302.8
4302.7
4302.8
4302.7
4302.6
4302.6
4302.6
4302.6
4302.6
4302.6
4302.6
4302.7
SSM42Values Exceed Upper Control Limit
Negative U308 Grades Indicate Less Than Detection Limit.
42

NRCDEQ2REP
COGEMA Mining Inc.
IRIGARAY RANCH
INTERIOR SHALLOW SAND MONITOR WELLMine Unit I
2nd Half, 1999Well I.D. SSM43
Water QualityParameters
SpecificConductance
TotalAlkalinity
PiezometricElevationChloride PH Uranium
Units mg/l p mho/cm mg/I as CaCO3 mg/I msl
Upper Control Limit 25.6 1456 170.4
Date
07 JUL 1999
14 JUL 1999
20 JUL 1999
27 JUL 1999
04 AUG 1999
09 AUG 1999
17 AUG 1999
24 AUG 1999
30 AUG 1999
08 SEP 1999
14 SEP 1999
20 SEP 1999
28 SEP 1999
04 OCT 1999
13 OCT 1999
19 OCT 1999
28 OCT 1999
03 NOV 1999
09 NOV 1999
16 NOV 1999
22 NOV 1999
01 DEC 1999
07 DEC 1999
15 DEC 1999
20 DEC 1999
27 DEC 1999
36.1
34.7
34.8
34.3
34.8
32.7
34.5
33.7
34.8
34.0
33.2
33.7
33.5
33.9
35.7
34.4
35.1
34.1
34.3
34.5
34.1
34.3
34.7
34.8
36.2
36.1
* 1700
* 1705
1709
* 1709
* 1707
* 1703
* 1689
* 1698
* 1710
* 1696
* 1703
* 1691
* 1686
* 1702
* 1703
* 1704
* 1674
* 1700
* 1705
1718
* 1693
1699
* 1687
* 1716
* 1704
* 1699
* 146.2
* 140.6
* 142.5
* 140.2
* 143.3
* 136.2
* 139.6
* 136.2
* 146.5
* 137.5
* 134.5
* "141.7
* 137.2
* 140.6
142.9
* 144.3
* 142.6
* 142.9
* 144.1
* 140.4
* 139.9
138.1
* 140.1
* 136.5
146.6
* 142.6
7.9
7.9
7.9
7.7
7.8
7.6
7.7
7.8
7.9
7.7-
7.7
7.9
7.8
7.8
7.9
8.1
7.9
7.9
7.9
7.9
8.0
8.0
8.0
8.0
8.0
7.9
4306.0
4305.9
4305.8
4305.7
4305.6
4305.6
4305.8
4305.7
4305.
4305.7
4305.6
4305.6
4305.5
4305.5
4305.6
4305.5
4305.5
4305.5
4305.4
4304.1
4304.1
4304.1
4304.1
4304.1
4304.1
4305.7
* Values Exceed Upper Control Limit
Negative U308 Grades Indicate Less Than Detection Limit.
SSM43
43

IRIGARAY RANCH
INTERIOR DEEP SAND MONITOR WELLS

NRCDEQ2REP
COGEMA Mining Inc.
IRIGARAY RANCH
INTERIOR DEEP SAND MONITOR WELLMine Unit 1
2nd Half, 1999Well I.D. DM1
Water Quality Specific Total Piezometric
Parameters Chloride Conductance Alkalinity pH Uranium Elevation
Units mg/l IA mho/cm mg/l as CaCO3 mg/1 msl
Upper Control Limit 16.2 609 207.4
Date
18 AUG 1999 9.1 482
29 NOV 1999 9.1 485
* Values Exceed Upper Control Limit
Negative U308.Grades Indicate Less Than Detection Limit.
113.8
114.9
8.2
8.6
4301.5
4300.7
DM1
44

NRCDE02REP
COGEMA Mining Inc.
IRIGARAY RANCH
Mine Unit 1 INTERIOR DEEP SAND MONITOR WELL
Well I.D. DM2 2nd Half, 1999
Water Quality Specific Total PiezometricParameters Chloride Conductance Alkalinity pH Uranium Elevation
Units mg/i g mho/cm mg/l as CaCO3 mg/l msl
Upper Control Limit 15.1 757 187.1
Date
18 AUG 1999
29 NOV 1999
8.5.
8.5
606
612
178.7
183.4
8.0
8.3
4285.4
4284.9
* Values Exceed Upper Control Limit
Negative U308 Grades Indicate Less Than Detection Limit.
DM2
45

NRCDEQ2REP
COGEMA Mining Inc.
IRIGARAY RANCH
INTERIOR DEEP SAND MONITOR WELLMine Unit 2
2nd Half,1999Well I.D. DM3
Water Quality Specific Total PiezometricParameters Chloride Conductance Alkalinity pH Uranium Elevation
Units mg/l p mho/cm mg/I as CaCO 3 mg/i msl
Upper Control Limit 15.8 677 240.9
Date
18 AUG 1999 12.9 568
29 NOV 1999 13.0, 573
* Values Exceed Upper Control Limit
Negative U308 Grades Indicate Less Than Detection Limit.
168.6
173.9
8.2
8-4
4287.5
4286.3
DM3
46

NRCDEQ2REP
COGEMA Mining Inc.
IRIGARAY RANCH
INTERIOR DEEP SAND MONITOR WELLMine Unit 4
2nd Half, 1999Well I.D. DM4
Water Quality Specific Total PiezometricParameters Chloride Conductance Alkalinity pH Uranium Elevation
Units mg/1 pt mho/cm mg/l as CaCO3 mg/1 msl
Upper Control Limit 14.4 603 117.6
Date
17 AUG 1999
17 NOV 1999
9.2
9.4
527
524
95.1
97.9
8.8
8.8
4280.8
4276.7
DM4* Values Exceed Upper Control Limit
Negative U308 Grades Indicate Less Than Detection Limit.
47

NIR.CDEQ2REPCOGEMA Mining Inc.
IRIGARAY RANCH
INTERIOR DEEP SAND MONITOR WELLMine Unit 2
2nd Half, 1999Well I.D. DM5
Water Quality Specific Total PiezometricParameters Chloride Conductance Alkalinity pH Uranium Elevation
Units mg/l g mho/cm mg/l as CaCO 3 mg/l msl
Upper Control Limit 15.7 675 206
Date
18 AUG 1999 8.5 619
29 NOV 1999 8.4 622
* Values Exceed Upper Control Limit
Negative U308 Grades Indicate Less Than Detection Limit.
195.7
198.0
8.1
8.2
4278.0
4277.6
DM5
48

NRCOEQ2REP
COGEMA Mining Inc.
IRIGARAY RANCH
INTERIOR DEEP SAND MONITOR WELLMine Unit 5
Well I.D. DM92nd Half, 1999
Water Quality Specific Total PiezometricParameters Chloride Conductance Alkalinity pH Uranium Elevation
Units mg/l p mho/cm mg/l as CaCO 3 mg/1 msl
Upper Control Limit 16.3 647 132.7
Date
17 AUG 1999
17 NOV 1999
9.2
9.4
532
531
97.4
99.1
8.8
8.7
4278.9
4277.8
* Values Exceed Upper Control Limit
Negative U308 Grades Indicate Less Than Detection Limit.
DM9
49

NR CDEW2REP
COGEMA Mining Inc.
IRIGARAY RANCH
Mine Unit 6 INTERIOR DEEP SAND MONITOR WELL
2nd Half, 1999Well I.D. DM10
Water Quality Specific Total PiezometricParameters Chloride Conductance Alkalinity pH Uranium Elevation
Units mg/1 Vt mho/cm mg/I as CaCO3 mg/I msl
Upper Control Limit 16.4 606 107.5
Date
07 JUL 1999
14 JUL 1999
20 JUL 1999
27 JUL 1999
04 AUG 1999
09 AUG 1999
17 AUG 1999
24 AUG 1999
30 AUG 1999
08 SEP 1999
14 SEP 1999
20 SEP 1999
28 SEP 1999
04 OCT 1999
13 OCT 1999
19 OCT 1999
28 OCT 1999
03 NOV 1999
09 NOV 1999
16 NOV 1999
22 NOV 1999
01 DEC 1999
07 DEC 1999
15 DEC 1999
20 DEC 1999
27 DEC 1999
18.4
18.2
18.4
18.5
17.2
17.9
18.3
17.8
17.8
17.6
17.8
18.2
17.5
18.3
18.6
19.0
18.9
19.2
19.3
19.2
18.9
19.1
20.0
20.2
21.1
20.0
* 739
* 747
* 746
* 747
* 737
* 747
* 747
* 739
* 750
* 735
* 748
* 745
* 749
754
* 747
* 761
* 741
* 761
.* 764
*' 768
* 766
* 756
* 760
* 780
* 777
* 776
* 174.5
* 173.5
* 177.3
* 176.7
* 167.3
* 173.2
* '174.4
* 168.8
* 170.4
* . 166.3
* :167.6
179.5
* "168.3
* 174.6
* 174.8
* 178.9
* 176.7
* 184.7
* 184.3
* 180.9
* 186.2
* 178.2
* 182.7
* 182.7
* 194.6
* 181.0
*
*
*
*
*
8.1
8.1
8.2
8.2
8.3
8.1
8.2
8.5
8.2
8.0
8.0
8.2
8.2
8.2
8.2
8.3
8.2
8.2
8.2
8.2
8.3
8.3
8.2
8.2
8.2
8.2
-1
-1
-1
-1
-1
-1
-1
-1
-1
-1
.1
-1
-1
-1
-l
-1
-l
-1
-1
-1
-1
-I
-1
-1
-I
4279.3
4280.3
4281.0
4280.3
4281.1
4280.6
4280:8
4279.4
4278.1
4277.3-
4277.7
4277.2
4277.0
4277.5
4277.8
4277.6
4277.3
4276.8
4278.7
4278.7
4278.7
4278.7
4278.7
4278.7
4278.7
4201.6
DM10Values Exceed Upper Control Limit
Negative U308 Grades Indicate Less Than Detection Limit.
50

NRCDEQ2REP
COGEMA Mining Inc.
IRIGARAY RANCH
Mine Unit 7 INTERIOR DEEP SAND MONITOR WELL
Well I.D. DM11 2nd Half, 1999
Water Quality Specific Total PiezometricParameters Chloride Conductance Alkalinity pH Uranium Elevation
Units mg/i p mho/cm mg/l as CaCO 3 mg/l msl
Upper Control Limit 15 607 104.7
Date
20 JUL 1999
30 AUG 1999
23 SEP 1999
20 OCT 1999
10 NOV 1999
15 DEC 1999
10.5
9.6
9.8
10.1
10.1
10.1
563
557
557
557
555
558
97.4
91.1
92.9
96.4
93.9
92.3
8.5
8.7
8.7
8.7
8.6
8.7
4281.3
4282.0
4279.2
4280.4
4279.7
4281.7
* Values Exceed Upper Control Limit
Negative U308 Grades Indicate Less Than Detection Limit.
DM11
51

NFCDEQ2REP
COGEMA Mining Inc.
IRIGARAY RANCH
Mine Unit 8 INTERIOR DEEP SAND MONITOR WELL
Well I.D. DM132nd Half, 1999
Water Quality Specific Total PiezometricParameters Chloride Conductance Alkalinity pH Uranium Elevation
Units mg/l ýt mho/cm mg/l as CaCO3 mg/l msl
Upper Control Limit 15.1 624 113.5
Date
20 JUL 1999
10 AUG 1999
23 SEP 1999
19 OCT 1999
10 NOV 1999
15 DEC 1999
10.4
9.6
9.5
9.8
10.0
10.0
558
553
554
556
554
555
99.1
92.0
93.5
97.3
95.2
93.9
8.4
8.7
8.6
8.7
8.5
8.6
4291.4
4291.3
4290.3
4290.1
4289.6
4291.1
* Values Exceed Upper Control Limit
Negative U308 Grades Indicate Less Than Detection Limit.
DM13
52

N RCDEQ2REP
COGEMA Mining Inc.
IRIGARAY RANCH
Mine Unit 8 INTERIOR DEEP SAND MONITOR WELL
Well I.D. DM14 2nd Half, 1999
Water Quality Specific .Total PiezometricParameters Chloride Conductance Alkalinity pH Uranium Elevation
Units mg/l g. mho/cm mg/l as CaCO3 mg/1 msl
Upper Control Limit 15.5 619 109.5
Date
20 JUL 1999
10 AUG 1999
23 SEP 1999
19 OCT 1999
10 NOV 1999
08 DEC 1999
10.5
10.1
9.8
9.9
10.2
10.2
568
563
565
567
564
556
96.3
90.9
93.2
96.6
94.1
91.9
8.5
8.7
8.8
8.8
8.6
8.7
4289.1
4289.3
4288.2
4288.2
4287.9
4288.9
* Values Exceed Upper Control Limit
Negative U308 Grades Indicate Less Than Detection Limit.
DM14
53

NRCDE02REP
COGEMA Mining Inc.
IRIGARAY RANCH
Mine Unit 9 INTERIOR DEEP SAND MONITOR WELL
2nd Half,1999Well I.D. DM15
Water Quality Specific Total PiezometricParameters Chloride Conductance Alkalinity pH Uranium Elevation
Units mg/1 ýt mho/cm mg/l as CaCO3 mg/l msli
Upper Control Limit 15.1 618 110.6
Date
20 JUL 1999
10 AUG 1999
22 SEP 1999
14 OCT 1999
10 NOV 1999
08 DEC 1999
10.6
10.2
9.8
10.5
10.3
10.3
570
565
562
567
567
558
96.2
92.3
91.3
96.7
94.7
93:8
8.5
8.7
8.6
8.7
8.6
8.8
4294.2
4294.0
4293.3
4293.2
4292.5
4293.4
* Values Exceed Upper Control Limit
Negative U308 Grades Indicate Less Than Detection Limit.
DM15
54

NRCDEQ2REP
COGEMA Mining Inc.
IRIGARAY RANCH
Mine Unit 9 INTERIOR DEEP SAND MONITOR WELL
Well I.D. DM162nd Half, 1999
Water QualityParameters
Specific
Chloride ConductanceTotal
Alkalinity pH UraniumPiezometric
Elevation
Units mg/I g mho/cm mg/I as CaCO 3 mg/I msl
Upper Control Limit 15.7 646 111
Date
20 JUL 1999
10 AUG 1999
22 SEP 1999
14 OCT 1999
10 NOV 1999
08 DEC 1999
10.8
10.1
10.0
10.5
10.4
10.2
574
570
568
576
572
561
94.9
89.6
88.9
93.6
93.8
90.0
8.6
8.8
8.9
8.8
8.8
8.8
4295.0
4294.9
4294.4
4294.2
4293.6
4294.4
* Values Exceed Upper Control Limit
Negative U308 Grades Indicate Less Than Detection Limit.
DM16
55

NRCDEQ2REP
COGEMA Mining Inc.
MRIGARAY RANCH
INTERIOR DEEP SAND MONITOR WELLMine Unit 5
2nd Half,1999Well I.D. DM17
Water Quality Specific Total PiezometricParameters Chloride Conductance Alkalinity pH Uranium Elevation
Units mg/i ýt mho/cm mg/1 as CaCO3 mg/1 msl
Upper Control Limit 15 618 108.2
Date
17 AUG 1999
17 NOV 1999
8.8
9.0
538
541
113.0 *
120.8 *
8.6
8.6
4276.5
4276.3
* Values Exceed Upper Control Limit
Negative U308 Grades Indicate Less Than Detection Limit.
DM17
56

NRCDEQ2REP
COGEMA Mining Inc.
IRIGARAY RANCH
INTERIOR DEEP SAND MONITOR WELLMine Unit 4
22nd Half, 1999
Well I.D. DM18
Water Quality Specific Total PiezometricParameters Chloride Conductance Alkalinity pH Uranium Elevation
Units mg/1 A mho/cm mg/i as CaCO3 mg/l msl
Upper Control Limit 14.5 598 105.6
Date
17 AUG 1999 9.2 531
17 NOV 1999 9.7 537
* Values Exceed Upper Control Limit
Negative U308 Grades Indicate Less Than Detection Limit.
93.8
97.8
8.6
8.6
4279.2
4277.1
DM18
57

NRICDEQ2REP
COGEMA Mining Inc.
IRIGARAY RANCH
INTERIOR DEEP SAND MONITOR WELLMine Unit 3
Well I.D. DM19 2nd Half, 1999
Water Quality Specific Total PiezometricParameters Chloride Conductance Alkalinity pH Uranium Elevation
Units mg/l ji mho/cm mg/I as CaCO3 mg/i msl
Upper Control Limit 31.7 1207 245.3
Date
18 AUG 1999
29 NOV 1999
10.l
10.3522
532
143.5
144.6
8.1
8.4
4251.7
4256.7
* Values Exceed Upper Control Limit
Negative U308 Grades Indicate Less Than Detection Limit.
DM19
58

NRCOEQ2REP
COGEMA Mining Inc.
IRIGARAY RANCH
INTERIOR DEEP SAND MONITOR WELLMine Unit 3
Well I.D. DM202nd Half,1999
Water Quality Specific Total PiezometricParameters Chloride Conductance Alkalinity pH Uranium Elevation
Units mg/l g mho/cm mg/l as CaCO3 mg/I msl
Upper Control Limit 17.5 609 135.6
Date
18 AUG 1999
29 NOV 1999
9.2
9.4
518
519
98.2
102.2
8.4
8.7
4281.5
4281.6
* Values Exceed Upper Control Limit
Negative U308 Grades Indicate Less Than Detection Limit.
DM20
59

NRCDEQ2REP
COGEMA Mining Inc.
IRIGARAY RANCH
Mine Unit 7 INTERIOR DEEP SAND MONITOR WELL
2nd Half,1999Well I.D. DM21
Water Quality Specific Total PiezorrParameters Chloride Conductance Alkalinity pH Uranium Eleva
jetriction
Units mg/1 ýi mho/cm mg/i as CaCO3 mg/l ms
Upper Control Limit 15.6 628 126.7
Date
20 JUL 1999
10 AUG 1999
23 SEP 1999
19 OCT 1999
10 NOV 1999
15 DEC 1999
10.7
10.0
10.7
10.1
10.2
10.0
565
560
562
562
560
559
97.4
91.6
93.3
98.0
94.5
91.3
8.5
8.7
8.6
8.7
8.5
8.7
4288.6
4288.7
4287.1
4286.9
4287.0
4288.9
* Values Exceed Upper Control Limit
Negative U308 Grades Indicate Less Than Detection Limit.
DM21
60

NRCDE02REP
COGEMA Mining Inc.
IRIGARAY RANCH
Mine Unit 6 INTERIOR DEEP SAND MONITOR WELL
Well I.D. DM22 2nd Half, 1999
Water Quality Specific Total PiezometricParameters Chloride Conductance Alkalinity pH Uranium Elevation
Units mg/i It mho/cm mg/l as CaCO3 mg/I msl
Upper Control Limit 15.1 654 117
Date
20 JUL 1999
10 AUG 1999
17 AUG 1999
23 SEP 1999
20 OCT 1999
10 NOV 1999
15 DEC 1999
10.7
10.0
9.9
9.4
9.7
9.8
10.0
551
556
544
541
545
543
546
100.9
92.8
95.7
94.8
98.3
95.7
95.6
8.2
8.7
8.6
8.5
8.8
8.4
8.7
4280.4
4280.4
4280.8
4276.8
4277.4
4279.2
4281.4
* Values Exceed Upper Control Limit
Negative U308 Grades Indicate Less Than Detection Limit.
DM22
61

IRIGARAY RANCH
INTERIOR COAL ZONE TREND WELLS

NRCDEQ2REP
COGEMA Mining Inc.
IRIGARAY RANCH
INTERIOR COAL ZONE TREND WELLMine Unit 3
Well I.D. RS192nd Half, 1999
Water Quality Specific Total PiezometricParameters Chloride Conductance Alkalinity pH Uranium Elevation
Units mg/l i mho/cm mg/l as CaCO3 mg/l msl
Re storation Target 56
Date
18 AUG 1999 17.7
29 NOV 1999 18.1
* Values Exceed Restoration Target
Negative U308 Grades Indicate Less Than Detection Limit.
8.4
8.5
4282.4
4281.6
RS 19
62

NRCDEQ2REP
COGEMA Mining Inc.
IRIGARAY RANCH
INTERIOR COAL ZONE TREND WELLMine Unit 2
22nd Half, 1999
Well I.D. RS34
Water Quality Specific Total PiezometricParameters Chloride Conductance Alkalinity pH Uranium Elevation
Units mg/l p mho/cm mg/I as CaCO 3 mg/1 msl
Restoration Target 56
Date
18 AUG 1999
29 NOV 1999
51.8
51.0
8.4
8.6
4277.7
4278.1
* Values Exceed Restoration Target
Negative U308 Grades Indicate Less Than Detection Limit.
RS34
63

NRGCDE02REP
COGEMA Mining Inc.
IRIGARAY RANCH
INTERIOR COAL ZONE TREND WELLMine Unit 3
Well I.D. RS392nd Half, 1999
Water Quality Specific Total PiezometricParameters Chloride Conductance Alkalinity pH Uranium Elevation
Units mg/1 p mho/cm mg/l as CaCO 3 mg/! msl
Restoration Target 56
Date
18 AUG 1999 34.4
29 NOV 1999 33.4
* Values Exceed Restoration Target
Negative U308 Grades Indicate Less Than Detection Limit.
7.7 4278.7
4279.07.9
RS39
64

N RCDEQ2REP
COGEMA Mining Inc.
IRIGARAY RANCH
Mine Unit 1 INTERIOR COAL ZONE TREND WELL
Well I.D. SMI 2nd Half, 1999
Water Quality Specific Total PiezometricParameters Chloride Conductance Alkalinity pH Uranium Elevation
Units mg/l p mho/cm mg/l as CaCO 3 mg/l msl
Restoration Target 56
Date
18 AUG 1999
29 NOV 1999
27.7
27.1
8.3
8.5
4284.2
4283.3
* Values Exceed Restoration Target
Negative U308 Grades Indicate Less Than Detection Limit.
SMI
65

NFZCDEQ2REP
COGEMA Mining Inc.
IRIGARAY RANCH
Mine Unit 1 INTERIOR COAL ZONE TREND WELL
Well I.D. SM2 2nd Half, 1999
Water Quality Specific Total PiezometricParameters Chloride Conductance Alkalinity pH Uranium Elevation
Units mg/1 pj mho/cm mg/i as CaCO3 mg/I msl
Restoration Target 56
Date
18 AUG 1999
29 NOV 1999
21.2
21.7
8.2
8.3
4281.8
4281.2
* Values Exceed Restoration Target
Negative U308 Grades Indicate Less Than Detection Limit.
SM2
66

NRCDEQ2REP
COGEMA Mining Inc.
IRIGARAY RANCH
INTERIOR COAL ZONE TREND WELLMine Unit 2
2nd Half, 1999Well I.D. SM7
Water Quality Specific Total PiezometricParameters Chloride Conductance Alkalinity pH Uranium Elevation
Units mg/i [t mho/cm mg/i as CaCO3 mg/i msl
Restoration Target 56
Date
18 AUG 1999
29 NOV 1999
76.0
76.0
* 8.3
8.6
4278.3
4277.6
* Values Exceed Restoration Target
Negative U308 Grades Indicate Less Than Detection Limit.
SM7
67

CHRISTENSEN RANCH
PERIMETER ORE ZONE MONITOR WELLS

NRCDEQ2REP
COGEMA Mining Inc.
CHRISTENSEN RANCH
Mine Unit 3 PERIMETER ORE ZONE MONITOR WELL
0Well I.D. MW17-2 2nd Half, 1999
Water Quality Specific Total PiezometricParameters Chloride Conductance Alkalinity pH Uranium Elevation
Units mg/1 p mho/cm mg/i as CaCO 3 mg/l msl
Upper Control Limit 13.4 777 129.7
Date
27 JUL 1999
24 AUG 1999
21 SEP 1999
12 OCT 1999
10 NOV 1999
19 DEC 1999
9.9
9.5
9.7
9.8
9.9
10.1
672
665
678
664
674
670
94.0
89.0
94.2
91.3
91.3
90.0
8.7
8.6
8.7
8.6
8.6
8.6
4492.2
4488.9
4489.3
4487.5
4497.8
4497.8
* Values Exceed Upper Control Limit
Negative U308 Grades Indicate Less Than Detection Limit.
MW17-2
68

NRCDEQ2REP
COGEMA Mining Inc.
CHRISTENSEN RANCH
Mine Unit 3 PERIMETER ORE ZONE MONITOR WELL
Well I.D. MW18 2nd Half, 1999
Water Quality Specific Total PiezometricParameters Chloride Conductance Alkalinity pH Uranium Elevation
Units mg/1 ýt mho/cm mg/i as CaCO3 mg/I msl
Upper Control Limit 13.4 777 129.7
Date
27 JUL 1999
24 AUG 1999
21 SEP 1999
12 OCT 1999
10 NOV 1999
19 DEC 1999
9.5
9.0
9.6
9.7
9.5
9.9
663
665
682
663
664
673
95.6
90.6
98.0
96.7
99.6
98.6
8.6
8.5
8.6
8.5
8.4
8.5
4491.7
4488.2
4488.8
4486:4
4491.6
4494.8
* Values Exceed Upper Control Limit
Negative U308 Grades Indicate Less Than Detection Limit.
MW18
69

NFCOE02REP
COGEMA Mining Inc.
CHRISTENSEN RANCH
Mine Unit 3 PERIMETER ORE ZONE MONITOR WELL
2nd Half, 1999Well I.D. MW19
Water QualityParameters
Specific
Chloride ConductanceTotal
Alkalinity pHPiezometric
Uranium Elevation
Units mg/1 [i mho/cm mg/1 as CaCO 3 mg/I rrusl
Upper Control Limit 13.4 777 129.7
Date
27 JUL 1999
24 AUG 1999
21 SEP 1999
12 OCT 1999
10 NOV 1999
19 DEC 1999
9.8
9.1
9.8
9.9
9.8
9.8
665
660
678
665
667
671
97.1
90.9
99.1
96.0
94.3
91.2
8.5
8.4
8.4
8.3
8.3
8.4
4477.9
4473.7
4475.9
4473.8
4477.7
4487.5
* Values Exceed Upper Control Limit
Negative U308 Grades Indicate Less Than Detection Limit.
MW19
70

NRCDE02REP
COGEMA Mining Inc.
CHRISTENSEN RANCH
PERIMETER ORE ZONE MONITOR WELLMine Unit 3
22nd Half, 1999
Well I.D. MW20
Water Quality Specific Total PiezometricParameters Chloride Conductance Alkalinity pH Uranium Elevation
Units mg/l R mho/cm mg/i as CaCO 3 mg/l msl
Upper Control Limit 13.4 777 129.7
Date
27 JUL 1999
24 AUG 1999
21 SEP 1999
12 OCT 1999
10 NOV 1999
19 DEC 1999
9.2
8.7
9.6
9.2
9.4
9.7
665
672
683
665
677
676
99.2
93.5
102.1
97.7
95.7
98.2
8.6
8.48.6
8.4
8.4
8.4
4501.1
4497.2
4497.8
4495.2
4503.1
4504.7
* Values Exceed Upper Control Limit
Negative U308 Grades Indicate Less Than Detection Limit.
MW20
71

NRCDEQ2REP
COGEMA Mining Inc.
CHRISTENSEN RANCH
Mine Unit 3 PERIMETER ORE ZONE MONITOR WELL
WWell I.D. MW23 2nd Half, 1999
Water Quality Specific Total PiezometricParameters Chloride Conductance Alkalinity pH Uranium Elevation
Units mg/1 g rnho/cm mg/1 as CaCO 3 mg/i msl
Upper Control Limit 13.4 777 129.7
Date
27 JUL 1999
24 AUG 1999
21 SEP 1999
12 OCT 1999
10 NOV 1999
19 DEC 1999
9.9
9.2
9.6
10.0
9.9
9.8
664
672
679
667
676
673
97.1
91.1
96.1
97.4
94.6
93.9
8.6
8.5
8.6
8.5
8.4
8.4
4504.8
4500.3
4500.1
4497.9
4500.9
4501.2
* Values Exceed Upper Control Limit
Negative U308 Grades Indicate Less Than Detection Limit.
MW23
72

NRCDEQ2REP
COGEMA Mining Inc.
CHRISTENSEN RANCH
Mine Unit 3 PERIMETER ORE ZONE MONITOR WELL
2nd Half, 1999Well I.D. MW24
Water Quality Specific Total PiezometricParameters Chloride Conductance Alkalinity pH Uranium Elevation
Units mg/l p mho/cm mg/l as CaCO 3 mg/1 msl
Upper Control Limit 13.4 777 129.7
Date
27 JUL 1999
24 AUG 1999
21 SEP 1999
12 OCT 1999
10 NOV 1999
19 DEC 1999
9.8
9.1
9.9
10.2
9.8
9.9
662
665
674
660
672
666
93.7
88.2
95.0
96.1
91.2
90.1
8.7
8.6
8.7
8.6
8.5
8.1
4499.9
4494.6
4494.3
4491.7
4487.8
4488.1
* Values Exceed Upper Control Limit
Negative U308 Grades Indicate Less Than Detection Limit,
MW24
73

NRCDEQ2REP
COGEMA Mining Inc.
CHRISTENSEN RANCH
Mine Unit 3 PERIMETER ORE ZONE MONITOR WELL
2nd Half, 1999Well I.D. MW25
Water QualityParameters
Specific
Chloride ConductanceTotal
Alkalinity pH UraniumPiezometric
Elevation
msl+
Units I mg/1 ýr mho/cm mg/l as CaCO 3 mg/1
Upper Control Limit 13.4 777 129.7
Date
27 JUL 1999
24 AUG 1999
21 SEP 1999
12 OCT 1999
10 NOV 1999
19 DEC 1999
9.9
9.7
9.5
9.7
9.8
9.7
661
668
672
656
669
666
95.7
95.3
94.2
92.9
91.4
89.9
8.6
8.5
8.6
8.5
8.4
8.5
4495.1
4489.5
4489.5
4487.2
4491.2
4491.8
* Values Exceed Upper Control Limit
Negative U308 Grades Indicate Less Than Detection Limit.
MW25
74

NRCDE02REP
COGEMA Mining Inc.
CHRISTENSEN RANCH
Mine Unit 3 PERIMETER ORE ZONE MONITOR WELL
2nd Half, 1999Well I.D. MW26
Water Quality Specific Total PiezometricParameters Chloride Conductance Alkalinity pH Uranium Elevation
Units mg/i [I mho/cm mg/l as CaCO 3 mg/i msl
Upper Control Linit 13.4 777 129.7
Date
27 JUL 1999
24 AUG 1999
21 SEP 1999
12 OCT 1999
10 NOV 1999
19 DEC 1999
10.2
9.4
9.6
9.9
10.1
9.9
657
664
668
654
665
663
93.3
87.3
91.6
90.2
90.2
88.0
8.6
8.5
8.6
8.5
8.5
8.5
4486.1
4479.7
4480.1
4477.9
4481.9
4482.5
* Values Exceed Upper Control Limit-
Negative U308 Grades Indicate Less Than Detection Limit.
MW26
75

NFCDE02REP
COGEMA Mining Inc.
CHRISTENSEN RANCH
Mine Unit 3 PERIMETER ORE ZONE MONITOR WELL
Well I.D. MW27 2nd Half, 1999
~1~
Units I mho/cm '~'l as CaCOWater Quality
ParametersSpecific
ConductanceTotal
AlkalinityChloride pH UraniumPiezometric
Elevation
Units mg/i p ma mg/1 msl
Upper Control Limit 13.4 777 129.7
Date
27 JUL 1999
24 AUG 1999
21 SEP 1999
12 OCT 1999
10 NOV 1999
19 DEC 1999
10.1
9.4
9.8
10.5
9.9
10.0
655
666
670
656
668
665
93.7
88.6
94.4
96.7
90.0
89.0
8.6
8.5
8.6
8.5
8.4
8.5
4473.5
4466.4
4466.6
4464.4
4473.3
4474.0
* Values Exceed Upper Control Limit
Negative U308 Grades Indicate Less Than Detection Limit.
MW27
76
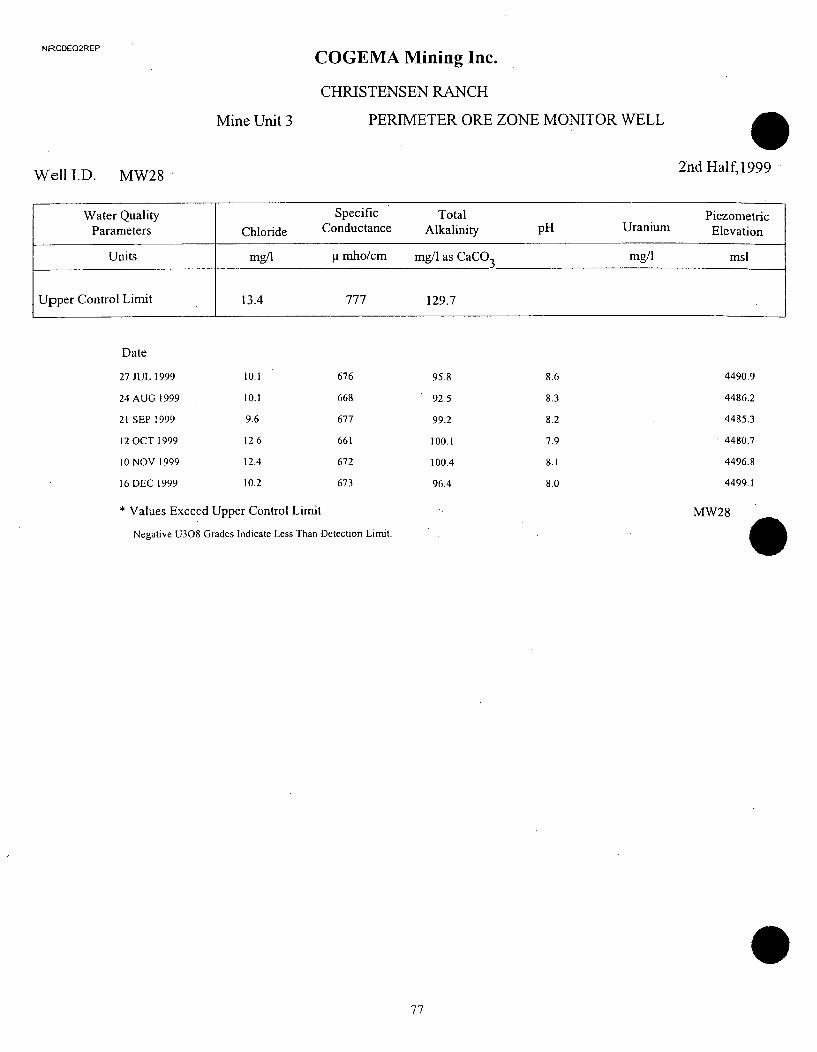
NRCDEQ2REP
COGEMA Mining Inc.
CHRISTENSEN RANCH
Mine Unit 3 PERIMETER ORE ZONE MONITOR WELL
2nd Half, 1999Well I.D. MW28
Water Quality Specific Total PiezometricParameters Chloride Conductance Alkalinity pH Uramnum Elevation
Units mg/l p mho/cm mg/1 as CaCO 3mg/l msl
Upper Control Limit 13.4 777 129.7
Upper Control Limit 129.7
Date
27 JUL 1999
24 AUG 1999
21 SEP 1999
12 OCT 1999
10 NOV 1999
16 DEC 1999
10.1
10.1
9.6
12.6
12.4
10.2
676
668
677
661
672
673
95.8
92.5
99.2
100.1
100.4
96.4
8.6
8.3
8.2
7.9
8.1
8.0
4490.9
4486.2
4485.3
4480.7
4496.8
4499.1
* Values Exceed Upper Control Limit
Negative U308 Grades Indicate Less Than Detection Limit.
MW28
77

NRCDEQ2REP
COGEMA Mining Inc.
CHRISTENSEN RANCH
Mine Unit 3 PERIMETER ORE ZONE MONITOR WELL
0Well I.D. MW29 2nd Half,1999
Water Quality Specific Total PiezometricParameters Chloride Conductance Alkalinity pH Uranium Elevation
Units mg/I p mho/cm mg/I as CaCO3 mg/l msl
Upper Control Limit 13.4 777 129.7
Date
27 JUL 1999
24 AUG 1999
21 SEP 1999
II OCT 1999
10 NOV 1999
16 DEC 1999
9.8
9.3
9.5
9.6
9.8
9.7
673
666
674
660
667
670
97.9
93.3
96.9
94.9
94.9
93.5
8.6
8.5
8.6
8.6
8.4
8.5
4500.5
4496.6
4495.0
4491.2
4507.0
4508.1
* Values Exceed Upper Control Limit
Negative U308 Grades Indicate Less Than Detection Limit.
MW29
78

N RCDE02REP
COGEMA Mining Inc.
CHRISTENSEN RANCH
PERIMETER ORE ZONE MONITOR WELLMine Unit 3
2nd Half, 1999Well I.D. MW30
Water Quality Specific Total PiezometricParameters Chloride Conductance Alkalinity pH Uranium Elevation
Units Ueg/ ftr mho/cm mg/I as CaCO1 3mg/i msl
Upper Control Lim-it { 13.4 777 129.7.
Date
27 JUL 1999
24 AUG 1999
21 SEP 1999
II OCT 1999
10 NOV 1999
16 DEC 1999
9.5
9.0
9.5
9.4
9.5
9.4
682
679
682
666
678
678
100.4
95.8
101.6
99.0
97.9
95.7
8.5
8.5
8.6
8.5
8.5
8.5
4515.3
4512.3
4510.5
4508.2
4517.1
4518.1
* Values Exceed Upper Control Limit
Negative U308 Grades Indicate Less Than Detection Limit.
MW30
79

NFCOEE2REP
COGEMA Mining Inc.
CHRISTENSEN RANCH
Mine Unit 3 PERIMETER ORE ZONE MONITOR WELL
Well I.D. MW31 2nd Half, 1999
Water Quality Specific Total PiezometricParameters Chloride Conductance Alkalinity pH Uranium Elevation
Units mg/1 p mho/cm mg/l as CaCO3 mg/I msl
Upper Control Limit 13.4 777 129.7
Date
27 JUL 1999
24 AUG 1999
21 SEP 1999
11 OCT 1999
10 NOV 1999
16 DEC 1999
9.4
9.1
9.2
9.3
9.4
9.3
681
676
685
672
678
679
100.7
96.3
101.1
98.8
98.5
102.6
8.7
8.5
8.6
8.6
8.5
8.5
4520.3
4517.8
4517.8
4517.8
4517.8
4522.2
* Values Exceed Upper Control Limit
Negative U308 Grades Indicate Less Than Detection Limit.
MW31
80

NRCDEQ2REP
COGEMA Mining Inc.
CHRISTENSEN RANCH
Mine Unit 3 PERIMETER ORE ZONE MONITOR WELL
2nd Half, 1999Well I.D. MW32
Water Quality Specific Total PiezometricParameters Chloride Conductance Alkalinity pH Uranium Elevation
Units mg/l tL mho/cm mg/i as CaCO 3 mg/l msl
Upper Control Limit 13.4 777 129.7
Date
26 JUL 1999
24 AUG 1999
21 SEP 1999
I 1 OCT 1999
10 NOV 1999
19 DEC 1999
9.1
9.0
8.8
9.3
9.4
9.2
673
679
672
680
681
677
101.2
96.3
96.1
102.8
99.1
96.6
8.7
8.4
8.5
8.2
8.5
8.3
4527.6
4530.9
4529.3
4528.4
4532.4
4532.4
* Values Exceed Upper Control Limit
Negative U308 Grades Indicate Less Than Detection Limit.
MW32
81

NRCDEQ2REP
COGEMA Mining Inc.
CHRISTENSEN RANCH
Mine Unit 3 PERIMETER ORE ZONE MONITOR WELL
Well I.D. MW35 2nd Half, 1999
Water QualityParameters
Units
SpecificConductance
TotalAlkalinityChloride pH Uranium
PiezometricElevation
Img/l R mho/cm mg/1 as CaCO3 mg/i msl
+
Upper Control Limit 13.4 777 129.7
Date
27 JUL 1999
24 AUG 1999
21 SEP 1999
11 OCT 1999
10 NOV 1999
19 DEC 1999
9.1
8.8
9.0
9.1
9.4
9.7
667
676
684
678
675
678
100.4
97.1
103.5
98.4
98.5
101.7
8.5
8.4
8.5
8.5
8.4
8.4
4525.6
4523.4
4522.4
4521.2
4524.9
4527.6
* Values Exceed Upper Control Limit
Negative U308 Grades Indicate Less Than Detection Limit.
MW35
82

NRCDE02REP
COGEMA Mining Inc.
CHRISTENSEN RANCH
Mine Unit 3 PERIMETER ORE ZONE MONITOR WELL
22nd Half, 1999
Well I.D. MW36
Water Quality Specific Total PiezometricParameters Chloride Conductance Alkalinity pH Uranium Elevation
Units mg/l ý' mho/cm mg/i as CaCO 3 mg/l msl
Upper Control Limit 13.4 777 129.7
Date
27 JUL 1999
24 AUG 1999
21 SEP 1999
12 OCT 1999
10 NOV 1999
19 DEC 1999
9.2
9.4
9.3
9.6
9.4
9.3
672
675
683
666
671
675
99.2
95.1
101.3
98.5
,97.9
95.:1
8.5
8.3
8.5
8.4
8.4
8.4
4524.5
4521.4
4520.2
4518.5
4521.5
4524.1
* Values Exceed Upper Control Limit
Negative U308 Grades Indicate Less Than Detection Limit.
MW36
83

NFZCDEQ2REP
COGEMA Mining Inc.
CHRISTENSEN RANCH
PERIMETER ORE ZONE MONITOR WELLMine Unit 3
2nd Half,1999Well I.D. MW37
Water Quality Specific Total PiezometricParameters Chloride Conductance Alkalinity pH Uranium Elevation
Units mg/l ýt mho/cm mg/l as CaCO 3 mg/I msl
Upper Control Limit 13.4 777 129.7
Date
27 JUL 1999
24 AUG 1999
21 SEP 1999
12 OCT 1999
10 NOV 1999
19 DEC 1999
9.4
9.1
9.4
9.8
9.7
9.7
677
674
682
666
671
676
100.6
95.8
100.8
100.4
97.6
98.4
8.5
8.3
8.5
8.4
8.4
8.4
4515.6
4512.5
4511.3
4509.3
4513.8
4517.9
* Values Exceed Upper Control Limit
Negative U308 Grades Indicate Less Than Detection Limit.
MW37
84

NRCDEQ2REP
COGEMA Mining Inc.
CHRISTENSEN RANCH
Mine Unit 3 PERIMETER ORE ZONE MONITOR WELL
Well I.D. MW38 2nd Half, 1999
Water Quality Specific Total Piezometric
Parameters Chloride Conductance Alkalinity pH Uranium Elevation
Units mg/I [. mho/cm mg/I as CaCO3 mg/l msl
Upper Control Limit 13.4 777 129.7
Date
27 JUL 1999
24 AUG 1999
21 SEP 1999
I1 OCT 1999
09 NOV 1999
16 DEC 1999
10.6
9.8
9.5
10.1
9.9
9.9
663
676
669
671
670
667
103.4
96.7
95.2
99.8
97.8
100.3
8.8
8.7
8.7
8.4
8.5
8.7
4519.1
4515.9
4514.3
4513.0
4517.9
4519.1
MW38* Values Exceed Upper Control Limit
Negative U308 Grades Indicate Less Than Detection Limit.
85
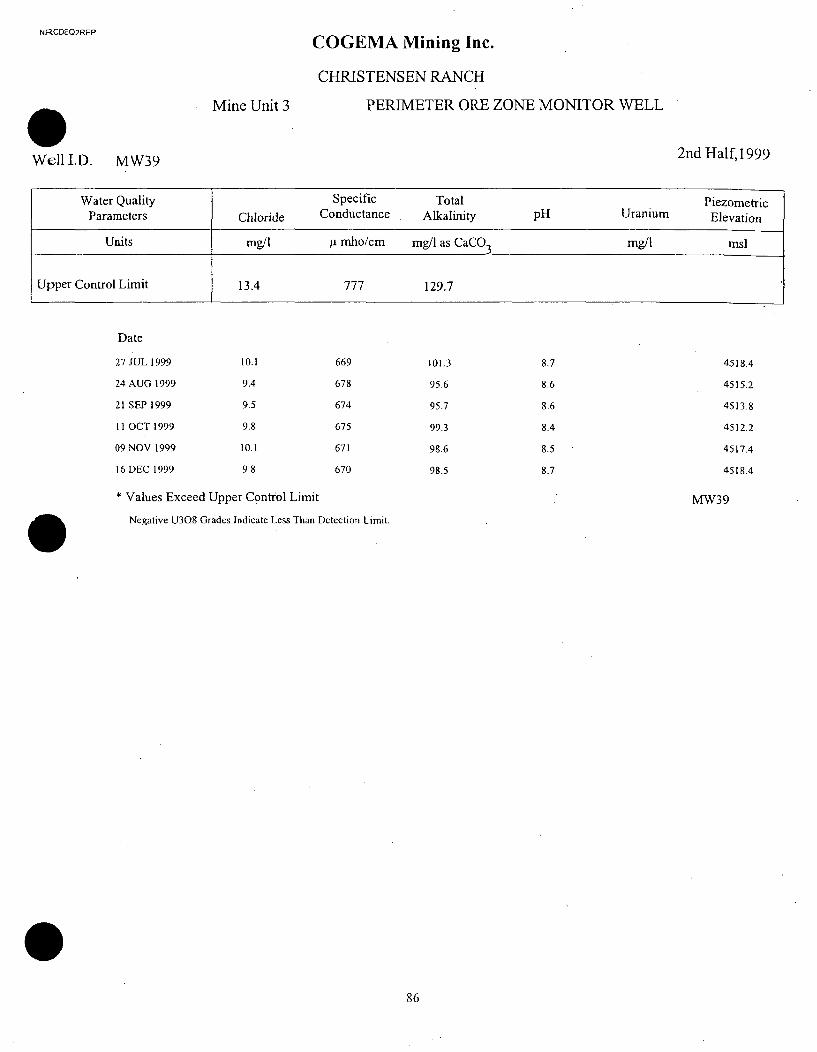
NFR.CDEQ2REP
COGEMA Mining Inc.
CHRISTENSEN RANCH
Mine Unit 3 PERIMETER ORE ZONE MONITOR WELL
Well ID. MW39 2nd Half, 1999
Water Quality Specific Total PiezometricParameters Chloride Conductance Alkalinity pH Uranium Elevation
Units mg/1 ý. mho/cm mg/i as CaCO 3 mg/i msl
Upper Control Limit 13.4 777 129.7
Date
27 JUL 1999
24 AUG 1999
21 SEP 1999
11 OCT 1999
09 NOV 1999
16 DEC 1999
10.1
9.4
9.5
9.8
10.1
9.8
669
678
674
675
671
670
101.3
95.6
95.7
99.3
98.6
98.5
8.7
8.6
8.6
8.4
8.5
8.7
4518.4
4515.2
4513.8
4512.2
4517.4
4518.4
* Values Exceed Upper Control Limit
Negative U308 Grades Indicate Less Than Detection Limit.
MW39
86

NRCDEQ2REP
COGEMA Mining Inc.
CHRISTENSEN RANCH
Mine Unit 3 PERIMETER ORE ZONE MONITOR WELL
Well I.D. MW40 2nd Half, 1999
Water Quality Specific Total Piezometric
Parameters Chloride Conductance Alkalinity pH Uranium Elevation
Units mg/l [L mho/cm mg/l as CaCO3 mg/l msl
Upper Control Limit 13.4 777 129.7
-Date
27 JUL 1999
24 AUG 1999
21 SEP 1999
11 OCT 1999
10NOV 1999
19 DEC 1999
9.5
8.8
9,1
9.3
9.7
10.0
664
675
669
665
674
676
99.8
93.8
94.4
97.5
97.5
101.8
8.6
8.5
8.5
8.6
8.5
8.5
4519.0
4516.0
4514.3
4512.8
4518.4
4519.1
* Values Exceed Upper Control Limit
Negative U308 Grades Indicate Less Than Detection Limit.
MW40
87

NRCDE02REP
COGEMA Mining Inc.
CHRISTENSEN RANCH
Mine Unit 3 PERIMETER ORE ZONE MONITOR WELL
2nd Half,1999Well I.D. MW41
Water Quality Specific Total PiezometricParameters Chloride Conductance Alkalinity pH Uranium Elevation
Units mg/i A mho/cm mg/l as CaCO3 mg/l msl
Upper Control Limit 13.4 777 129.7
Date
26 JUL 1999
24 AUG 1999
21 SEP 1999
I1 OCT 1999
10 NOV 1999
19 DEC 1999
9.4
8.6
8.9
9.2
9.5
9.2
679
677
678
687
685
679
103.6
98.6
99.9
107.0
103.6
98.7
8.6
8.5
8.5
8.4
8.4
8.4
4541.5
4539.3
4538.0
4537.3
4539.8
4539.8
* Values Exceed Upper Control Limit
Negative U308 Grades Indicate Less Than Detection Limit.
MW41
88

NRCDEQ2REP
COGEMA Mining Inc.
CHRISTENSEN RANCH
PERIMETER ORE ZONE MONITOR WELLMine Unit 3
Well I.D. MW42 2nd Half, 1999
Water Quality Specific Total PiezometricParameters Chloride Conductance Alkalinity pH Uranium Elevation
Units mg/l /a mho/cm mg/I as CaCO3 mg/l msl
Upper Control Limit 13.4 777 129.7
Date
26 JUL 1999
24 AUG 1999
21 SEP 1999
11 OCT 1999
10 NOV 1999
19 DEC 1999
9.5
9.0
9.0
9.4
9.4
9.9
671
670
670
683
673
661
99.4
93.4
93.6
99.9
97.8
92.7
8.8
8.6
8.6
8.6
8.7
8.6
4546.6
4544.4
4543.3
4543.0
4544.2
4544.2
Values Exceed Upper Control Limit
Negative U308Grades Indicate Less Than Detection Limit.
MW42
89

NPRCDEQ2REP
COGEMA Mining Inc.
CHRISTENSEN RANCH
Mine Unit 3 PERIMETER ORE ZONE MONITOR WELL
Well I.D. MW432nd Half, 1999
Water Quality Specific Total PiezometricParameters Chloride Conductance Alkalinity pH Uranium Elevation
Units mg/l ýt mho/cm mg/I as CaCO 3 mg/i msl
Upper Control Limit 13.4 777 129.7
Date
26 JUL 1999
24 AUG 1999
21 SEP 1999
I1 OCT 1999
10 NOV 1999
16 DEC 1999
9.1
8.9
8.8
9.2
9.3
9.1
671
675
670
677
673
673
100.0
95.2
94.8
102.7
96.9
95.0
8.7
8.5
8.5
8.5
8.5
8.5
4551.2
4549.3
4548.5
4548.2
4549.3
4549.8
* Values Exceed Upper Control Limit
Negative U308 Grades Indicate Less Than Detection Limit.
MW43
90

NRCOEQ2REP
COGEMA Mining Inc.
CHRISTENSEN RANCH
PERIMETER ORE ZONE MONITOR WELLMine Unit 3
2nd Half,1999Well I.D. MW44
Water QualityParameters
Specific
Chloride ConductanceTotal
AlkalinityPiezometric
ElevationpH Uranium
Units mg/i Ri mho/cm mg/l as CaCO3 mg/l msl
Upper Control Limit 13.4 777 129.7
Date
27 JUL 1999
24 AUG 1999
21 SEP 1999
II OCT 1999
10 NOV 1999
16 DEC 1999
9.5
9.0
9.2
9.3
9.4
9.3
673
675
684
676
676
678
100.1
96.0
99.3
103.3
97.2
94.3
8.5
8.3
8.5
8.4
8.3
8.4
4530.8
4528.7
4526.9
4526.7
4528.4
4528.5
* Values Exceed Upper Control Limit
Negative U308 Grades Indicate Less Than Detection Limit.
MW44
91

NRCDEQ2REP
COGEMA Mining Inc.
CHRISTENSEN RANCH
PERIMETER ORE ZONE MONITOR WELLMine Unit 3
2nd Half,1999Well I.D. MW45
Water Quality Specific Total PiezometricParameters Chloride Conductance Alkalinity pH Uranium Elevation
Units mg/1 ýt mho/cm mg/1 as CaCO 3 mg/l msl
Upper Control Limit 13.4 777 129.7
Date
27 JUL 1999
24 AUG 1999
21 SEP 1999
11 OCT 1999
10 NOV 1999
19 DEC 1999
9.2
8.8
9.4
9.3
9.4
9.6
669
674
684
674
671
680
99.8
94.7
101.8
98.0
97.0
97.5
8.5
8.4
8.5
8.5
8.3
8.3
4530.4
4527.6
4526.2
4525.9
4528.3
4528.3
* Values Exceed Upper Control Limit
Negative U308 Grades Indicate Less Than Detection Limit.
MW45
92

N RCDEQ2REP
COGEMA Mining Inc.
CHRISTENSEN RANCH
Mine Unit 3 PERIMETER ORE ZONE MONITOR WELL
2nd Half,1999Well I.D. MW62
Water Quality Specific Total PiezometricParameters Chloride Conductance Alkalinity pH Uranium Elevation
Units mg/l ýi mho/cm mg/I as CaCO 3 mg/i msl
Upper Control Limit 13.4 777 129.7
Date
27 JUL 1999
24 AUG 1999
21 SEP 1999
11 OCT 1999
10 NOV 1999
16 DEC 1999
9.7
9.1
9.3
9.7
9.2
9.5
676
674
680
672
678
674
93.3
90.3
94.5
94.5
92.5
88.7
9.1
9.0
9.1
9.0
9.1
9.0
4540.6
4538.1
4536.4
4536.3
4537.5
4537.8
MW62* Values Exceed Upper Control Limit
Negative U308 Grades Indicate Less Than Detection Limit.
93

NFZCDEQ2REP
COGEMA Mining Inc.
CHRISTENSEN RANCH
Mine Unit 3 PERIMETER ORE ZONE MONITOR WELL
Well I.D. MW63 2nd Half, 1999
Water Quality Specific Total PiezometricParameters Chloride Conductance Alkalinity pH Uranium Elevation
Units mg/l [i mho/cm mg/i as CaCO3 mg/l msl
Upper Control Limit 13.4 777 129.7
Date
26 JUL 1999
24 AUG 1999
21 SEP 1999
11 OCT 1999
09 NOV 1999
16 DEC 1999
9.1
8.8
9.2
9.5
9.3
9.2
666
668
679
677
672
671
88.4
87.6
93.4
98.0
90.8
88.1"
9.3
8.9
9.2
8.9
8.9
8.9
4545.7
4544.1
4542.7
4542.5
-4543.7
4543.8
* Values Exceed Upper Control Limit
Negative U308 Grades Indicate Less Than Detection Limit.
MW63
94

NRCDEQ2REP
COGEMA Mining Inc.
CHRISTENSEN RANCH
Mine Unit 3 PERIMETER ORE ZONE MONITOR WELL
Well I.D. MW64 2nd Half, 1999
Water Quality Specific Total PiezometricParameters Chloride Conductance Alkalinity pH Uranium Elevation
Units mg/l p mho/cm mg/l as CaCO3 mg/l msl
Upper Control Limit 13.4 777 129.7
Date
26 JUL 1999
24 AUG 1999
21 SEP 1999
11 OCT 1999
09 NOV 1999
16 DEC 1999
9.1
8.5
9.0
9.0
9.1
9.2
676
676
684
680
678
680
102.1
97.2
102.6
108.7
100.8
100.9
8.6
8.3
8.3
8.5
8.2
8.3
4550.9
4549.3
4548.4
4548.3
4549.6
4549.6
* Values Exceed Upper Control Limit
Negative U308 Grades Indicate Less Than Detection Limit.
MW64
95

NRCDEQ2REP
COGEMA Mining Inc.
CHRISTENSEN RANCH
Mine Unit 2 PERIMETER ORE ZONE MONITOR WELL
0Well I.D. MW73 2nd Half, 1999
Water QualityParameters
Specific
Chloride ConductanceTotal
Alkalinity pH UraniumPiezometric
Elevation
Units mg/l Ri mho/cm mg/i as CaCO3 mg/i msl
Upper Control Limit 13.6 823 121.3
Date
21 JUL1999
10 AUG 1999
13 SEP 1999
06 OCT 1999
02 NOV 1999
01 DEC 1999
9.4
9.1
9.3
9.6
9.5
9.2
679
679
681
679
673
672
102.0
94.4
96.3
97.9
99.3
95.2
8.7
8.6
8.5
8.7
8.6
8.8
4525.2
4522.9
4519.4
4518.2
4521.9
4522.9
* Values Exceed Upper Control Limit
Negative LJ308 Grades Indicate Less Than Detection Limit.
MW73
96

NRCDE02REP
COGEMA Mining Inc.
CHRISTENSEN RANCH
PERIMETER ORE ZONE MONITOR WELLMine Unit 2
Well I.D. MW74 2nd Half,1999
Water Quality Specific Total PiezometricParameters Chloride Conductance Alkalinity pH Uranium Elevation
Units mg/l tL mho/cm mg/l as CaCO3 mg/l msl
Upper Control Limit 13.6 823 121.3
Date
21 JUL 1999
10 AUG 1999
13 SEP 1999
06 OCT 1999
02 NOV 1999
01 DEC 1999
9.3
9.1
9.0
9.4
9.3
9.8
680
680
682
682
674
674
103.1
98.7
96.0
100.8
100.4
101.4
8.7
8.6
8.6
8.6
8.5
8.7
4526.7
4524.3
4521.0
4520.1
4523.1
4524.2
* Values Exceed Upper Control Limit
Negative U308 Grades Indicate Less Than Detection Limit.
MW74
97

NRCDEQ2RrP
COGEMA Mining Inc.
CHRISTENSEN RANCH
Mine Unit 2 PERIMETER ORE ZONE MONITOR WELL
Well I.D. MW75 2nd Half,1999
Water Quality Specific Total PiezometricParameters Chloride Conductance Alkalinity pH Uranium Elevation
Units mg/l 4i mho/cm mg/i as CaCO3 mg/l msl
Upper Control Limit 13.6 823 121.3
Date
21 JUL 1999
10 AUG 1999
13 SEP 1999
06 OCT 1999
02 NOV 1999
01 DEC 1999
9.3
9.1
9.0
9.4
9.4
9.4
679
678
680
680
674
675
99.7
94.6
94.3
98.2
99.3
96.5
8.8
8.5
8.6
8.5
8.5
8.7
4527.6
4525.3
4521.9
4521.0
4523.3
4524.7
* Values Exceed Upper Control Limit
Negative U308 Grades Indicate Less Than Detection Limit.
MW75
98

NRCDEQ2REP
COGEMA Mining Inc.
CHRISTENSEN RANCH
Mine Unit 2 PERIMETER ORE ZONE MONITOR WELL
Well I.D. MW76 2nd Half, 1999
Water Quality Specific Total PiezometricParameters Chloride Conductance Alkalinity pH Uranium Elevation
Units mg/l gt mho/cm mg/l as CaCO3 mg/l msl
Upper Control Limit 13.6 823 121.3
Date
21 JUL 1999
10 AUG 1999
13 SEP 1999
06 OCT 1999
02 NOV 1999
01 DEC 1999
8.4
8.1
8.2
8.9
8.6
8.6
731
730
725
725
711
713
97.0
93.1
91.1
96.5
96.3
93.9
8.5
8.3
8.5
8.5
8.4
8.6
4534.4
4532.3
4529.2
4528.7
4529.8
4531.1
* Values Exceed Upper Control Limit
Negative U308 Grades Indicate Less Than Detection Limit.
MW76
99

NRCDEQ2REP
COGEMA Mining Inc.
CHRISTENSEN RANCH
Mine Unit 2 PERIMETER ORE ZONE MONITOR WELL
Well I.D. MW77 2nd Half, 1999
Water Quality Specific Total PiezometricParameters Chloride Conductance Alkalinity pH Uranium Elevation
Units mg/1 Ri mho/cm mg/i as CaCO3 mg/I msl
Upper Control Limit 13.6 823 121.3
Date
21 JUL 1999
10 AUG 1999
13 SEP 1999
06 OCT 1999
02 NOV 1999
01 DEC 1999
8.7
8.3
8.2
8.4
8.4
8.4
733
731
734
735
726
729
97.9
92.9
90.8
92.7
94.6
92.3
8.4
8.3
8.3
8.3
8.2
8.5
4536.0
4533.8
4531.0
4530.3
4531.1
4532.4
* Values Exceed Upper Control Limit
Negative U308 Grades Indicate Less Than Detection Limit.
MW77
100

NRCDEQ2REP
COGEMA Mining Inc.
CHRISTENSEN RANCH
Mine Unit 2 PERIMETER ORE ZONE MONITOR WELL
2nd Half, 1999Well I.D. MW78
Water QualityParameters
Specific
Chloride ConductanceTotal
AlkalinityPiezometric
m ElevationpH Uraniu
Units mg/l ft mho/cm mg/l as CaCO 3 mg/l msl
Upper Control Limit 13.6 823 121.3
Date
22 JUL 1999
10 AUG 1999
13 SEP 1999
06 OCT 1999
02 NOV 1999
01 DEC 1999
9.3
8.6
8.5
8.8
8.7
9.0
715
713
715
716
707
710
97.4
92.4
92.2
98.7
94.5
96.4
8.5
8.4
8.4
8.4
8.6
8.5
4530.6
4530.7
4525.5
4524.6
4525.4
4526.8
* Values Exceed Upper Control Limit
Negative U308 Grades Indicate Less Than Detection Limit.
MW78
101

NRCDEQ2REP
COGEMA Mining Inc.
CHRISTENSEN RANCH
Mine Unit 2 PERIMETER ORE ZONE MONITOR WELL
Well I.D. MW79 2nd Half,1999
Water Quality Specific Total PiezometricParameters Chloride Conductance Alkalinity pH Uranium Elevation
Units mg/l 4 mho/cm mg/I as CaCO3 mg/1 msl
Upper Control Limit 13.6 823 121.3
Date
21 JUL 1999
10 AUG 1999
13 SEP 1999
06 OCT 1999
02 NOV 1999
01 DEC 1999
8.5
8.3
8.3
8.5
8.3
8.5
731
730
731
732
722
725
96.9
91.7
91.2
94.1
94.1
93.7
8.5
8.3
8.3
8.3
8.5
8.5
4531.5
4528.6
4526.4
4525.4
4525.0
4527.0
* Values Exceed Upper Control Limit
Negative U308 Grades Indicate Less Than Detection Limit.
MW79
102

N RCDEQ2REP
COGEMA Mining Inc.
CHRISTENSEN RANCH
PERIMETER ORE ZONE MONITOR WELLMine Unit 2
2nd Half,1999Well I.D. MW80
Water Quality Specific Total PiezometricParameters Chloride Conductance Alkalinity pH Uranium Elevation
Units mg/1 p mho/cm mg/1 as CaCO3 mg/1 msl
Upper Control Limit 13.6 823 121.3
Date
21 JUL 1999 9.1 701
10 AUG 1999 8.9 703
13 SEP 1999 8.6 700
06 OCT 1999 9.1 698.
02 NOV 1999 9.3 690
01 DEC 1999 9.4 695
* Values Exceed Upper Control Limit
Negative U308 Grades Indicate Less Than Detection Limit.
98.0
94.8
92.3
94.6
96.3
98.7
8.5
8.2
8.3
8.3
8.5
8.5
4532.1
4529.6
4527.4
4526.5
4526.3
4527.2
MW80
103

NRCDEQ2REP
COGEMA Mining Inc.
CHRISTENSEN RANCH
Mine Unit 2 PERIMETER ORE ZONE MONITOR WELL
2nd Half,1999Well I.D. MW81
Water Quality Specific Total PiezometricParameters Chloride Conductance Alkalinity pH Uranium Elevation
Units mg/l pL mho/cm r mg/I as CaCO3 mg/l msl
Upper Control Limit 13.6 823 121.3
Date
21 JUL 1999
10 AUG 1999
13 SEP 1999
06 OCT 1999
02 NOV 1999
01 DEC 1999
9.3
9.0
8.8
9.3
9.4
9.4
680
678
680
680
673
676
97.1
91.9
90.8
95.1
95.6
95.0
8.6
8.4
8.4
8.3
8.6
8.5
4534.1
4531.8
4529.8
4528.8
4529.2
4530.0
MW81* Values Exceed Upper Control Limit
Negative U308 Grades Indicate Less Than Detection Limit.
104

N RCDEQ2REP
COGEMA Mining Inc.
CHRISTENSEN RANCH
Mine Unit 2 PERIMETER ORE ZONE MONITOR WELL
Well I.D. MW82 2nd Half, 1999
Water Quality Specific Total PiezometricParameters Chloride Conductance Alkalinity pH Uranium Elevation
Units mg/i gi mho/cm mg/i as CaCO3 mg/i msl
Upper Control Limit 13.6 823 121.3
Date
22 JUL 1999
10 AUG 1999
13 SEP 1999
05 OCT 1999
02 NOV 1999
01 DEC 1999
10.1
9.3
9.5
9.8
9.8
9.7
670
667
658
673
661
666
96.3
91.3
91.0
95.6
94.1
93.3
8.5
8.4
8.4
8.4
8.6
8.5
4527.5
4525.1
4523.0
4522.1
4521.7
4522.7
* Values Exceed Upper Control Limit
Negative U308 Grades Indicate Less Than Detection Limit.
MW82
105
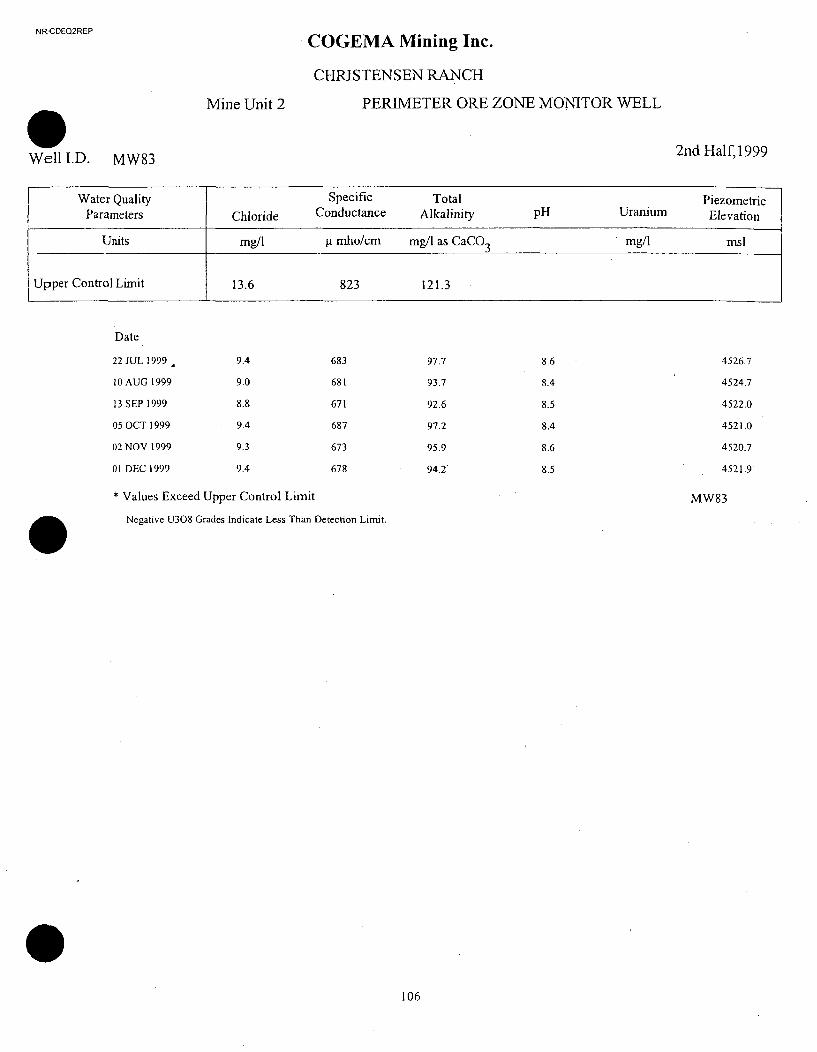
NRCOEQ2REP
COGEMA Mining Inc.
CHRISTENSEN RANCH
Mine Unit 2 PERIMETER ORE ZONE MONITOR WELL
Well I.D. MW832nd Half, 1999
Water Quality Specific Total PiezometricParameters Chloride Conductance Alkalinity pH Uranium Elevation
Units mg/1 ji mho/cm mg/l as CaCO 3 mg/I msl
Upper Control Limit 13.6 823 121.3
Date
22 JUL 1999
10 AUG 1999
13 SEP 1999
05 OCT 1999
02 NOV 1999
01 DEC 1999
9.4
9.0
8.8
9.4
9.3
9.4
683
681
671
687
673
678
97.7
93.7
92.6
97.2
95.9
94.2
8.6
8.4
8.5
8.4
8.6
8.5
4526.7
4524.7
4522.0
4521.0
4520.7
4521.9
* Values Exceed Upper Control Limit
Negative U308 Grades Indicate Less Than Detection Limit.
MW83
106

NRCDEQ2REP
COGEMA Mining Inc.
CHRISTENSEN RANCH
Mine Unit 2 PERIMETER ORE ZONE MONITOR WELL
2nd Half,1999Well I.D. MW84
Water Quality Specific Total PiezometricParameters Chloride Conductance Alkalinity pH Uranium Elevation
Units mg/l g mho/cm mg/l as CaCO3 mg/l msl
Upper Control Limit 13.6 823 121.3
Date
22 JUL 1999
10 AUG 1999
13 SEP 1999
05 OCT 1999
02 NOV 1999
01 DEC 1999
9.7
9.1
9.0
9.5
9.6
9.7
685
677
667
682
670
677
99.2
94.1
93.6
97.5
104.6
98.9
8.5
8.4
8.5
8.4
8.6
8.5
4525.5
4524.9
4520.7
4519.6
4519.3
4520.2
* Values Exceed Upper Control Limit
Negative U308 Grades Indicate Less Than Detection Limit.
MW84
107

NRCDEQ2REP
COGEMA Mining Inc.
CHRISTENSEN RANCH
Mine Unit 2 PERIMETER ORE ZONE MONITOR WELL
Well I.D. MW85 2nd Half, 1999
Water Quality Specific Total PiezometricParameters Chloride Conductance Alkalinity pH Uranium Elevation
Units mg/I [t mho/cm mg/l as CaCO3 mg/1 msl
Upper Control Lirit 13.6 823 121.3
Date
22 JUL 1999
10 AUG 1999
13 SEP 1999
05 OCT 1999
02 NOV 1999
01 DEC 1999
10.0
9.5
9.7
10.1
10.7
9.7
671
669
660
673
662
667
98.8
93.5
96.1
97.9
104.6
93.8
8.5
8.3
8.4
8.4
8.5
8.5
4522.4
4519.4
4517.1
4515.8
4516.2
4517.3
* Values Exceed Upper Control Limit
Negative U308 Grades Indicate Less Than Detection Limit.
MW85
108

NRCDEQ2REP
COGEMA Mining Inc.
CHRISTENSEN RANCH
Mine Unit 2 PERIMETER ORE ZONE MONITOR WELL
2nd Half,1999Well I.D. MW86
Water QualityParameters
Specific Total PiezometricSpecific
ConductanceTotal
AlkalinityChloride pH UraniumPiezometric
Elevation
Units mg/l jr mho/cm mg/i as CaCO3 mg/1 msl
Upper Control Limit 13.6 823 121.3
Date
21 JUL 1999
10 AUG 1999
13 SEP 1999
05 OCT 1999
02 NOV 1999
01 DEC 1999
9.7
9.4
9.4
9.9
9.9
9.7
678
670
661
674
663
668
97.8
93.3
93.4
96.3
96.9
101.5
8.5
8.3
8.4
8.3
8.5
8.5
4518.7
4515.2
4512.9
4511.5
4512.4
4513.6
* Values Exceed Upper Control Limit
Negative U308 Grades Indicate Less Than Detection Limit.
MW86
109

NRCDEQ2REP
COGEMA Mining Inc.
CHRISTENSEN RANCH
Mine Unit 2 PERIMETER ORE ZONE MONITOR WELL
Well I.D. MW87 2nd Half, 1999
Water Quality Specific Total PiezometricParameters Chloride Conductance Alkalinity pH Uranium Elevation
Units mg/I gi mho/cm mg/I as CaCO3 mg/i msl
Upper Control Limit 13.6 823 121.3
Date
21 JUL 1999
10 AUG 1999
13 SEP 1999
05 OCT 1999
02 NOV 1999
01 DEC 1999
9.8
9.4
9.9
9.8
9.7
9.5
673
670
661
674
665
668
99.3
93.8
99.9
96.3
96.7
94.2
8.5
8.3
8.4
8.3
8.5
8.4
4513.6
4509.9
4507.1
4505.7
4507.5
4508.4
* Values Exceed Upper Control Limit
Negative U308 Grades Indicate Less Than Detection Limit.
MW87
110

NRCDEQ2REP
COGEMA Mining Inc.
CHRISTENSEN RANCH
Mine Unit 2 PERIMETER ORE ZONE MONITOR WELL
2nd Half,1999Well I.D. MW88
Water Quality Specific Total PiezometricParameters Chloride Conductance Alkalinity pH Uranium Elevation
Units mg/I p. mho/cm mg/! as CaCO3 mg/l msl
Upper Control Limit 13.6 823 121.3
Date
21 JUL 1999
10 AUG 1999
13 SEP 1999
05 OCT 1999
02 NOV 1999
01 DEC 1999
9.6
9.4
10.0
9.6
9.6
9.4
673
672
662
677
667
669
99.3
94.2
100.5
96.3
97.2
100.6
8.5
8.3
8.4
8.4
8.5
8.4
4510.4
4506.9
4503.5
4501.2
4505.3
4505.9
* Values Exceed Upper Control Limit
Negaiive U308 Grades Indicate Less Than Detection Limit.
MW8 8
III

NRCDEQ2REP
COGEMA Mining Inc.
CHRISTENSEN RANCH
Mine Unit 2 PERIMETER ORE ZONE MONITOR WELL
2nd Half, 1999Well I.D. MW89
Water QualityParameters
SpecificConductance
TotalAlkalinity
PiezometricElevationChloride pH Uranium
Units mg/1 pi mho/cm mg/l as CaCO3 mg/i .nsl
Upper Control Limit 13.6 823 121.3
Date
06 JUL 1999
21 JUL 1999
10 AUG 1999
23 AUG 1999
08 SEP 1999
13 SEP 1999
05 OCT 1999
07 OCT 1999
11 OCT1999
18 OCT 1999
25 OCT 1999
02 NOV 1999
09 NOV 1999
15 NOV 1999
22 NOV 1999
29 NOV 1999
06 DEC 1999
13 DEC 1999
20 DEC 1999
27 DEC 1999
15.7
15.8
15.8
16.4
16.4
16.1
17.5
17.1
17.4
17.4
17.1
17.3
17.1
17.4
16.9
16.6
17.0
16.9
17.0
17.3
*. 734
* 730
* 738
* 727
742
* 735
756
* 740
* 752
* 756
750
750
*. 749
*. 753
* 755
* 745
* 753
*. 747
* 744
758
118.6
120.1
115.2
117.1
115.2
115.2
123.6 *
121.9 *
123.3 *
124.7 *
124.0 *
126.1 *
124.6 *
124.1 *
124.9 *
123.5 *
122.6 *
121.0
126.2 *
123.0 *
8.5
8.4
8.2
8.4
8.1
8.2
.8.2
8.2
7.6
8.4
8.3
8.3
8.3
8.3
8.3
8.3
8.3
8.3
8.3
8.3
4509.9
4505.1
4501.8
4499.6
4498.7
4497.8
4496.3
4496.9
4495.5
4495.5
4498.2
4502.0
4502.0
4501.6
4502.2
4501.5
4501.9
4501.5
4502.2
4502.8
* Values Exceed Upper Control Limit
Negative U308 Grades Indicate Less Than Detection Limit.
MW89
112

NRCDEQ2REP
COGEMA Mining Inc.
CHRISTENSEN RANCH
Mine Unit 2 PERIMETER ORE ZONE MONITOR WELL
22nd Half, 1999
Well I.D. MW90
Water Quality Specific Total PiezometricParameters Chloride Conductance Alkalinity pH Uranium Elevation
Units mg/i ji mho/cm mg/l as CaCO3 mg/I msl
Upper Control Limit 13.6 823 121.3
Date
21 JUL 1999
10 AUG 1999
13 SEP 1999
06 OCT 1999
02 NOV 1999
01 DEC 1999
9.3
9.0
8.9
9.2
9.5
9.5
687
685
689
686
682
681
97.6
92.7
91.2
94.4
96.7
97.2
8.5
8.4
8.4
8.3
8.5
8.5
4535.1
4531.6
4529.9
4528.9
4529.8
4531.0
* Values Exceed Upper Control Limit
Negative U308 Grades Indicate Less Than Detection Limit.
MW90
113

NRCOEQ2REP
COGEMA Mining Inc.
CHRISTENSEN RANCH
Mine Unit 2 PERIMETER ORE ZONE MONITOR WELL
Well I.D. MWI01 2nd Half, 1999
Water Quality Specific Total PiezometricParameters Chloride Conductance Alkalinity pH Uranium Elevation
Units mg/l gi mho/cm mg/I as CaCO3 mg/l msl
Upper Control Limit 11.6 778 124.6
Date
21 JUL 1999
1H1 AUG 1999
13 SEP 1999
05 OCT 1999
02 NOV 1999
01 DEC 1999
9.5
9.1
9.3
9.5
9.9
9.4
679
673
681
682
677
673
95.4
90.7
90.6
93.3
100.3
92.1
8.6
8.4
8.3
8.4
8.4
8.5
4536.4
4534.9
4533.1
4532.2
4531.2
4532.5
* Values Exceed Upper Control Limit
Negative U308 Grades Indicate Less Than Detection Limit.
MWI01
114

NRCDEQ2REP
COGEMA Mining Inc.
CHRISTENSEN RANCH
Mine Unit 2 PERIMETER ORE ZONE MONITOR WELL
2nd Half, 1999Well I.D. MWI02
Water Quality Specific Total PiezometricParameters Chloride Conductance Alkalinity pH Uranium Elevation
Units mg/l ýi mho/cm mg/l as CaCO 3 mg/I msl
Upper Control Limit 11.6 778 124.6
Date
21 JUL 1999
11 AUG 1999
13 SEP 1999
05 OCT 1999
02 NOV 1999
01 DEC 1999
9.5
9.3
9.4
9.9
9.5
9.5
676
663
669
672
667
665
94.1
89.2
89.1
96.2
91.5
91.0
8.6
8.4
8.3
8.4
8.4
8.6
4535.1
4533.6
4527.2
4526.4
4525.7
4526.2
* Values Exceed Upper Control Limit
Negative U308 Grades Indicate Less Than Detection Limit.
MW102
115

NFRCDEQ2REP
COGEMA Mining Inc.
CHRISTENSEN RANCH
Mine Unit 2 PERIMETER ORE ZONE MONITOR WELL
Well I.D. MW1032nd Half, 1999
Water Quality Specific Total PiezometricParameters Chloride Conductance Alkalinity pH Uranium Elevation
Units mg/l [L mho/cm mg/I as CaCO3 mg/l msl
Upper Control Limit 11.6 778 124.6
Date
21 JUL 1999
11 AUG 1999
13 SEP 1999
05 OCT 1999
02 NOV 1999
01 DEC 1999
9.4
9.0
9.6
9.5
9.9
9.4
675
670
663
676
672
670
93.2
88.7
94.5
92.0
98.0
91.1
8.7
8.5
8.7
8.6
8.5
8.7
4536.5
4535.4
4533.8
4532.9
4532.0
4532.5
* Values Exceed Upper Control Limit
Negative U308 Grades Indicate Less Than Detection Limit.
MWI03
116

NRCDEQ2REP
COGEMA Mining Inc.
CHRISTENSEN RANCH
Mine Unit 2 PERIMETER ORE ZONE MONITOR WELL
2nd Half,1999Well I.D. MW104
Water Quality Specific Total PiezometricParameters Chloride Conductance Alkalinity pH Uranium Elevation
Units mg/l Pi mho/cm mg/l as CaCO 3 mg/l msl
Upper Control Limit 11.6 778 124.6
Date
21 JUL 1999
I1 AUG 1999
13 SEP 1999
05 OCT 1999
02 NOV 1999
01 DEC 1999
9.2
8.8
9.2
9.6
9.2
8.8
698
691
683
696
694
691
94.5
89.1
91.0
98.0
93.9
89.8
8.7
8.3
8.5
8.3
8.4
8.5
4533.2
4532.0
4530.6
4529.9
4529.3
4529.8
* Values Exceed Upper Control Limit-
Negative U308 Grades Indicate Less Than Detection Limit.
MWI04
117

NRCDEQ2REP
COGEMA Mining Inc.
CHRISTENSEN RANCH
Mine Unit 2 PERIMETER ORE ZONE MONITOR WELL
2nd Half, 1999Well I.D. MW105
Water Quality Specific Total PiezometricParameters Chloride Conductance Alkalinity pH Uranium Elevation
Units mg/I gi mho/cm mg/1 as CaCO 3 mg/1 msl
Upper Control Limit 11.6 778 124.6
Date
21 JUL 1999
11 AUG 1999
13 SEP 1999
05 OCT 1999
02 NOV 1999
01 DEC 1999
9.7
9.1
9.3
9.9
9.6
9.4
688
681
684
685
678
676
96.9
91.5
91.6
98.1
94.9
91.2
8.6
8.3
8.2
8.3
8.3
8.5
4530.6
4529.6
4528.0
4527.1
4526.6
4527.5
Values Exceed Upper Control Limit
Negative U308 Grades Indicate Less Than Detection Limit.
MW105
118

NRCDEQ2REP
COGEMA Mining Inc.
CHRISTENSEN RANCH
Mine Unit 2 PERIMETER ORE ZONE MONITOR WELL
Well I.D. MW1062nd Half, 1999
Water Quality Specific Total PiezometricParameters Chloride Conductance Alkalinity pH Uranium Elevation
Units mg/1 p mho/cm mg/I as CaCO3 mg/i msl
Upper Control Limit 11.6 778 124.6
Date
21 JUL 1999
11 AUG 1999
13 SEP 1999
05 OCT 1999
02 NOV 1999
01 DEC 1999
9.5
9.2
9.3
10.1
9.7
9.8
677
674
678
680
675
676
93.7
89.5
89.2
97.3
92.1
94.3
8.6
8.4
8.3
8.4
8.4
8.5
4529.4
4528.2
4526.6
4525.5
4525.2
4526.3
* Values Exceed Upper Control Limit
Negative U308 Grades Indicate Less Than Detection Limit.
MWI06
119

NRCDEQ2REP
COGEMA Mining Inc.
CHRISTENSEN RANCH
Mine Unit 2 PERIMETER ORE ZONE MONITOR WELL
Well I.D. MW107 2nd Half,1999
Water QualityParameters
SpecificConductance
TotalAlkalinity
PiezometricElevationChloride pH Uranium
Units mg/I ýi mho/cm mg/1 as CaCO3 mg/i msl
Upper Control Limit 11.6 778 124.6
Date
21 JUL 1999
11 AUG 1999
13 SEP 1999
05 OCT 1999
02 NOV 1999
01 DEC 1999
9.8
9.4
9.5
9.8
9.8
9.7
664
659
665
667
660
660
92.3
88.4
87.2
91.4
91.0
89.1
85
8.3
8.2
8.3
8.4
8.5
4530.1
4529.0
4527.2
4526.3
4526.1
4527.4
* Values Exceed Upper Control Limit
Negative U308 Grades Indicate Less Than Detection Limit.
MW107
120

NRCDEQ2REP
COGEMA Mining Inc.
CHRISTENSEN RANCH
Mine Unit 2 PERIMETER ORE ZONE MONITOR WELL
22nd Half, 1999
Well I.D. MW108
Water Quality Specific Total Piezometric
Parameters Chloride Conductance Alkalinity pH Uranium Elevation
Units mg/I ýt mho/cm mg/l as CaCO3 mg/l msl
Upper Control Limit 11.6 778 124.6
Date
21 JUL 1999
11 AUG 1999
13 SEP 1999
05 OCT 1999
02 NOV 1999
01 DEC 1999
10.1
9.7
9.8
9.9
10.1
10.0
673
660
650
667
659
658
94.6
91.0
88.0
91.2
90.7
89.8
8.6
8.4
8.6
8.5
8.6
8.6
4528.7
4527.2
4525.5
4524.7
4524.1
4525.0
* Values Exceed Upper Control Limit
Negative U308 Grades Indicate Less Than Detection Limit.
MW108
121

NR.CDEQ2REP
COGEMA Mining Inc.
CHRISTENSEN RANCH
Mine Unit 2 PERIMETER ORE ZONE MONITOR WELL
Well I.D. MWI09 2nd Half,1999
Water Quality Specific Total PiezometricParameters Chloride Conductance Alkalinity pH Uranium Elevation
Units mg/l p. mho/cm mg/1 as CaCO 3 mg/1 msl
Upper Control Limit 11.6 778 124.6
Date
21 JUL 1999
I1 AUG 1999
13 SEP 1999
05 OCT 1999
02 NOV 1999
01 DEC 1999
10.1
9.7
10.1
10.1
10.2
10.4
660
655
647
663
656
657
91.7
88.0
91.0
90.0
89.5
91.8
8.5
8.2
8.3
8.3
8.5
8.5
4527.9
4526.4
4524.5
4523.6
4522.9
4523.8
* Values Exceed Upper Control Limit
Negative U308 Grades Indicate Less Than Detection Limit.
MWI09
122

NRCDEQ2REP
COGEMA Mining Inc.
CHRISTENSEN RANCH
PERIMETER ORE ZONE MONITOR WELLMine Unit 2
22nd Half, 1999
Well I.D. MW110
Water QualityParameters
SpecificConductance
TotalAlkalinity
PiezometricElevationChloride pH Uranium
Units mg/l pt mho/cm mg/I as CaCO3 mg/1 msl
Upper Control Limit 11.6 778 124.6
Date
21 JUL 1999
11 AUG 1999
13 SEP 1999
05 OCT 1999
02 NOV 1999
01 DEC 1999
9.8
9.3
9.4
9.7
9.6
9.7
670
662
654
668
663
662
91.6
88.1
88.6
91.2
90.6
88.6
8.6
8.4
8.5
8.4
8.6
7.9
4528.6
4526.9
4525.0
4523.9
4523.5
4524.4
* Values Exceed Upper Control Limit
Negative U308 Grades Indicate Less Than Detection Limit.
MW110
123
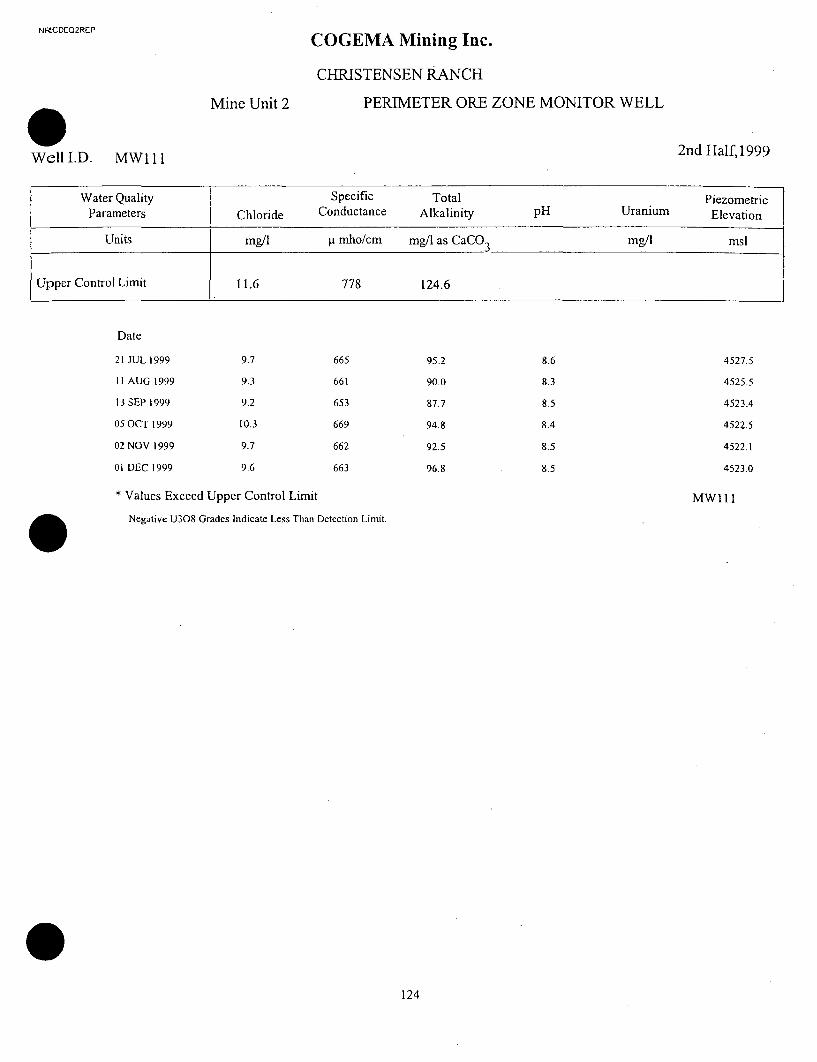
NRCDEQ2REP
COGEMA Mining Inc.
CHRISTENSEN RANCH
Mine Unit 2 PERIMETER ORE ZONE MONITOR WELL
Well I.D. MW11l 2nd Half, 1999
Water Quality Specific Total PiezometricParameters Chloride Conductance Alkalinity pH Uranium Elevation
Units mg/l p mho/cm mg/l as CaCO3 mg/l msl
Upper Control Limit 11.6 778 124.6
Date
21 JUL 1999
I1 AUG 1999
13 SEP 1999
05 OCT 1999
02 NOV 1999
01 DEC 1999
9.7
9.3
9.2
10.3
9.7
9.6
665
661
653
669
662
663
95.2
90.0
87.7
94.8
92.5
96.8
8.6
8.3
8.5
8.4
8.5
8.5
4527.5
4525.5
4523.4
4522.5
4522.1
4523.0
* Values Exceed Upper Control Limit
Negative U308 Grades Indicate Less Than Detection Limit.
MW lI
124

NRCDEQ2REP
COGEMA Mining Inc.
CHRISTENSEN RANCH
Mine Unit 3 PERIMETER ORE ZONE MONITOR WELL
Well I.D. MW1 14 2nd Half,1999
Water Quality Specific Total PiezometricParameters Chloride Conductance Alkalinity pH Uranium Elevation
Units mg/l ýi mho/cm mg/l as CaCO3 mg/1 msl
Upper Control Limit 13.4 777 129.7
Date
27 JUL 1999
24 AUG 1999
21 SEP 1999
12 OCT 1999
10 NOV 1999
19 DEC 1999
9.8
9.1
9.5
9.8
9.8
9.7
679
673
683
667
677
669
97,7
93.6
98.8
96.5
96.0
89.4
8.7
8.6
8.7
8.7
8.7
8:5
4501.9
4498.0
4498.4
4495.7
4499.2
4500.4
* Values Exceed Upper Control Limit
Negative U308 Grades Indicate Less Than Detection Limit.
MW114
125

NPRCDEQ2REP
COGEMA Mining Inc.
CHRISTENSEN RANCH
Mine Unit 3 PERIMETER ORE ZONE MONITOR WELL
2nd Half, 1999Well I.D. MW115
Water Quality Specific Total PiezometricParameters Chloride Conductance Alkalinity pH Uranium Elevation
Units mg/1 Ri mho/cm r mg/i as CaCO.3 mg/I msl-
Upper Control Limit 13.4 777 129.7
Date
27 JUL 1999
24 AUG 1999
21 SEP 1999
112 OCT 1999
10 NOV 1999
19 DEC 1999
9.8
9.0
9.8
9.4
9.2
9.5
681
676
685
668
679
681
99.5
95.5
99.0
97.7
96.8
102.3
8.5
8.3
8.5
8.4
8.4
8.2
4512.3
4508.8
4508.1
4506.0
4509.8
4509.8
* Values Exceed Upper Control Limit
Negative U308 Grades Indicate Less Than Detection Limit.
MW115
126

NRCOEQ2REP
COGEMA Mining Inc.
CHRISTENSEN RANCH
Mine Unit 3 PERIMETER ORE ZONE MONITOR WELL
2nd Half,1999Well I.D. MWI 16
Water Quality Specific Total PiezometricParameters Chloride Conductance Alkalinity pH Uranium Elevation
Units mg/i R mho/cm mg/l as CaCO 3 mg/l msl
Upper Control Limit 13.4 777 129.7
Date
27 JUL 1999
24 AUG 1999
21 SEP 1999
12 OCT 1999
10 NOV 1999
19 DEC 1999
9.5
9.1
9.5
9.7
9.7
9.5
678
673
682
665
677
676
98.3
95.2
101.1
99.5
103.4
95.2
8.6
8.5
8.6
8.5
8.5
8.5
4508.0
4503.1
4503.0
4500.7
4504.0
4504.8
* Values Exceed Upper Control Limit
Negative U308 Grades Indicate Less Than Detection Limit.
MW116
127

NRPCDEQ2REP
COGEMA Mining Inc.
CHRISTENSEN RANCH
PERIMETER ORE ZONE MONITOR WELLMine Unit 4
2nd Half, 1999Well I.D. 4MW-1
Water QualityParameters
SpecificConductance
TotalAlkalinityChloride pH Uranium
PiezometricElevation
Units mg/I gt mho/cm mg/1 as CaCO3 mg/1 msl
Upper Control Limit 11.1 825 116.9
Date
22 JUL 1999
17 AUG 1999
20 SEP 1999
.04 OCT 1999
17 NOV 1999
16 DEC 1999
9-5
8.7
9.0
9.1
9.1
8.9
677
665
667
663
674
670
97.0
91.9
92.6
95.8
95.4
91.9
8.5
8.6
8.5
8.6
8.5
8.6
4550.7
4548.5
4547.5
4547.1
4548.4
4548.4
* Values Exceed Upper Control Limit
Negative U308 Grades Indicate Less Than Detection Limit.
4MW-1
128

NRCDEQ2REP
COGEMA Mining Inc.
CHRISTENSEN RANCH
Mine Unit 4 PERIMETER ORE ZONE MONITOR WELL
Well I.D. 4MW-2 2nd Half,1999
Water Quality Specific Total PiezometrParameters Chloride Conductance Alkalinity pH Uranium Elevatio,
icn
Units mg/I p mho/cm mg/l as CaCO3 mg/l msl
Upper Control Limit 11.1 825 116.9
Date
22 JUL 1999
17 AUG 1999
20 SEP 1999
04 OCT 1999
17 NOV 1999
16 DEC 1999
9.4
8.8
8.8
8.7
.9.1
9.1
680
674
668
663
672
665
101.2
97.2
95.9
95.9
98.6
102.4
8.5
8.5
8.5
8.6
8.5
8.5
4555.6
4553.8
4552.9
4552.8
4553.7
4553.7
* Values Exceed Upper Control Limit
Negative U308 Grades Indicate Less Than Detection Limit.
4MW-2
129

NRCDEQ2REP
COGEMA Mining Inc.
CHRISTENSEN RANCH
Mine Unit 4 PERIMETER ORE ZONE MONITOR WELL
2nd Half,1999Well I.D. 4MW-3
Water Quality Specific Total PiezometricParameters Chloride Conductance Alkalinity pH Uranium Elevation
Units mg/l P mho/cm mg/i as CaCO3 mg/1 msl
Upper Control Limit 11.1 825 116.9
Date
22 JUL 1999
17 AUG 1999
20 SEP 1999
04 OCT 1999
17 NOV 1999
16 DEC 1999
9.3
8.9
8.8
8.8
9.1
9.1
673
660
662
662
669
665
93.7
91.6
91.6
92.5
93.8
89.9
8.6
8.6
8.6
8.7
8.6
8.7
4552.0
4549.6
4549.0
4548.4
4549.4
4549.4
* Values Exceed Upper Control Limit
Negative U308 Grades Indicate Less Than Detection Limit.
4MW-3
130
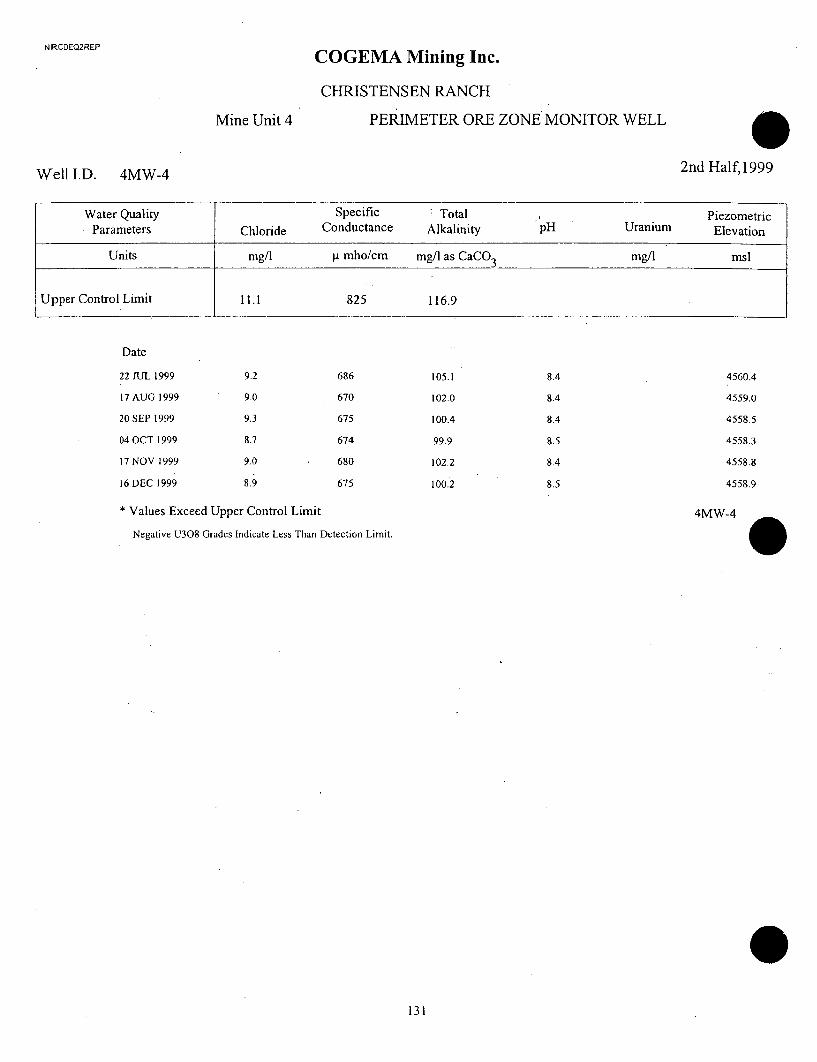
N RCDEQ2REP
COGEMA Mining Inc.
CHRISTENSEN RANCH
PERIMETER ORE ZONE MONITOR WELLMine Unit 4
2nd Half, 1999Well I.D. 4MW-4
Water Quality Specific ' Total PiezomParameters Chloride Conductance Alkalinity PpH Uranium Elevat
etric
ion
IUnits mg/l p mho/cm mg/l as CaCO3 mg/1 ms
Upper Control Limit 11.1 825 116.9
Date
22 JUL 1999
17 AUG 1999
20 SEP 1999
04 OCT 1999
17 NOV 1999
16 DEC 1999
9.2
9.0
9.3
8.7
9.0
8.9
686
670
675
674
680
675
105.1
102.0
100.4
99.9
102.2
100.2
8.4
8.4
8.4
8.5
8.4
8.5
4560.4
4559.0
4558.5
4558.3
4558.8
4558.9
* Values Exceed Upper Control Limit
Negative U308 Grades Indicate Less Than Detection Limit.
4MW-4
131

NRCCEQ2REP
COGEMA Mining Inc.
CHRISTENSEN RANCH
Mine Unit 4 PERIMETER ORE ZONE MONITOR WELL
Well I.D. 4MW-5 2nd Half, 1999
Water Quality Specific Total PiezometricParameters Chloride Conductance Alkalinity pH Uranium Elevation
Units mg/I I. mrho/cm mg/1 as CaCO3 mg/l msl
Upper Control Limit 11.1 825 116.9
Date
22 JUL 1999
17 AUG 1999
20 SEP 1999
04 OCT 1999
17 NOV 1999
16 DEC 1999
9.3
8.8
8.8
8.7
9.3
9.4
683
668
670
666
676
674
98.3
95.4
93.3
93.3
97.0
98.0
8.6
8.5
8.5
8.5
8.5
8.6
4554.2
4554.4
4553.5
4553.0
4552.3
4552.2
* Values Exceed Upper Control Limit
Negative U308 Grades Indicate Less Than Detection Limit.
4MW-5
132

NRCDEQ2REP
COGEMA Mining Inc.
CHRISTENSEN RANCH
PERIMETER ORE ZONE MONITOR WELLMine Unit 4
22nd Half, 1999
Well I.D. 4MW-6
Water Quality Specific Total PiezometricParameters Chloride Conductance Alkalinity pH Uranium Elevation
Units mg/l [t mho/cm mg/I as CaCO3 mg/l msl
Upper Control Limit 11.1 825 116.9
Date
22 JUL 1999
17 AUG 1999
20 SEP 1999
04 OCT 1999
17 NOV 1999
16 DEC 1999
9.1
8.7
8.9
8.4
9.0
8.9
679
663
669
669
676
667
102.1
97.1
96.6
95.7
99.2
97.5
8.6
8.6
8.5
8.6
8.5
8.6
4565.8
4564.7
4564.3
4564.2
4564.2
4563.0
* Values Exceed Upper Control Limit
Negative U308 Grades Indicate Less Than Detection Limit.
4MW-6
133

NRCDE02REP
COGEMA Mining Inc.
CHRISTENSEN RANCH
Mine Unit 4 PERIMETER ORE ZONE MONITOR WELL
Well I.D. 4MW-72nd Half, 1999
Water Quality Specific Total PiezometricParameters Chloride Conductance Alkalinity pH Uranium Elevation
Units mg/l gi mho/cm mg/1 as CaCO 3 mg/l msl
Upper Control Limit 11.1 825 116.9
Date
22 JUL 1999
17AUG 1999
20 SEP 1999
04 OCT 1999
17 NOV 1999
16 DEC 1999
9.1
8.7
8.8
8.5
9.0
8.9
663
656
667
665
660
666
88.5
90.9
91.9
91.4
87.4
92.4
8.9
8.7
8.7
8.8
8.9
8.6
4557.3
4556.5
4555.4
4555.1
4555.4
4555.6
* Values Exceed Upper Control Limit
Negative U308 Grades Indicate Less Than Detection Limit.
4MW-7
134

NRCDEQ2REP
COGEMA Mining Inc.
CHRISTENSEN RANCH
Mine Unit 4 PERIMETER ORE ZONE MONITOR WELL 02nd Half, 1999Well I.D. 4MW-8
Water Quality Specific Total PiezometricParameters Chloride Conductance Alkalinity pH Uranium Elevation
Units mg/l pL mho/cm mg/l as CaCO3 mg/I msl
Upper Control Limit 11.1 825 116.9
Date
22 JUL 1999
17 AUG 1999
20 SEP 1999
04 OCT 1999
17 NOV 1999
16 DEC 1999
9.4
8.7
8.9
8.6
8.9
9.0
689
671
674
673
681
675
104.8
99.1
99.9
99.4
101.9
99.7
8.5
8.5
8.5
8.5
8.4
8.5
4564.6
4563.6
4563.4
4563.4
4563.6
4563.3
* Values Exceed Upper Control Limit
Negative U308 Grades Indicate Less Than Detection Limit.
4MW-8
135

NRFCOEQ2REP
COGEMA Mining Inc.
CHRISTENSEN RANCH
Mine Unit 4 PERIMETER ORE ZONE MONITOR WELL
Well I.D. 4MW-92nd Half,1999
Water Quality Specific Total PiezometricParameters Chloride Conductance Alkalinity pH Uranium Elevation
Units mg/l g mho/cm. mg/1 as CaCO 3mg/1 msl
Units mg/i
Upper Control Limit 11.1 825 116.9
Upper Control Limit 11.1 825 116.9
Date
22 JUL 1999
17 AUG 1999
20 SEP 1999
04 OCT 1999
17 NOV 1999
16 DEC 1999
9.3
8.6
8.6
8.5
9.0
8.9
678
671
668
664
673
663
99.2
92.9
92.6
94.3
96.7
95.1
8.4
8.5
8.4
8.5
8.5
8.5
4559.5
4558.4
4558.0
4557.8
4557.9
4558.0
* Values Exceed Upper Control Limit
Negative U308 Grades Indicate Less Than Detection Limit.
4MW-9
136

NRCDEQ2REP
COGEMA Mining Inc.
CHRISTENSEN RANCH
Mine Unit 4 PERIMETER ORE ZONE MONITOR WELL
2nd Half, 1999Well I.D. 4MW-10
Water QualityParameters
SpecificConductance
TotalAlkalinityChloride pH Uranium
PiezometricElevation
Units mg/I gt mho/cm mg/l as CaCO3 mg/l msl
Upper Control Limit 11.1 825 116.9
Date
22 JUL 1999
17 AUG 1999
20 SEP 1999
04 OCT 1999
17 NOV 1999
16 DEC 1999
9.5
8.9
9.3
8.8
9.2
9.0
683
669
674
671
678
674
100.3
96.0
98.9
95.1
97.6
95.6
8.6
8.6
8.5
8.5
8.5
8.5
4565.8
4565.2
4565.2
4565.2
4565.2
4564.8
* Values Exceed Upper Control Limit
Negative U308 Grades Indicate Less Than Detection Limit.
4MW-10
137

NRCOEQ2REP
COGEMA Mining Inc.
CHRISTENSEN RANCH
Mine Unit 4 PERIMETER ORE ZONE MONITOR WELL
WellI.D. 4MW-11 2nd Half,1999
Water QualityParameters
Specific
Chloride ConductanceTotal
Alkalinity pH UraniumPiezometric
Elevation
Units mg/l ý. mho/cm mg/i as CaCO3 mg/I msl
Upper Control Limit 11.1 825 116.9
Date
22 JUL 1999
17 AUG 1999
20 SEP 1999
04 OCT 1999
17 NOV 1999
16 DEC 1999
9.9
9.1
9.2
8.8
9.5
9.3
672
655
668
667
671
664
93.2
88.0
95.5
90.1
92.1
90.2
8.6
8.6
8.5
8.6
8.6
8.6
4562.0
4561.2
4560.9
4560.8
4560.8
4560.8
* Values Exceed Upper Control Limit
Negative U308 Grades Indicate Less Than Detection Limit.
4MW- I1
138

NRCDEQ2REP
COGEMA Mining Inc.
CHRISTENSEN RANCH
Mine Unit 4 PERIMETER ORE ZONE MONITOR WELL
Well I.D. 4MW-12 2nd Half,1999
Water Quality Specific Total PiezometricParameters Chloride Conductance Alkalinity pH Uranium Elevation
Units mg/l g mho/cm mg/I as CaCO3 mg/l msl
Upper Control Limit 11.1 825 116.9
Date
22 JUL 1999
17 AUG 1999
20 SEP 1999
04 OCT 1999
17 NOV 1999
16 DEC 1999
9.5
8.8
9.3
8.7
9.2
9.1
683
668
674
673
670
673
99.5
94.0
97.4
92.6
100.5
93.8
8.9
8.8
8.8
8.8
8.8
8.8
4568.1
4568.0
4568.1
4568.2
4567.9
4567.7
* Values Exceed Upper Control Limit
Negative U308 Grades Indicate Less Than Detection Limit.
4MW- 12
139

NRCCDE02REP
COGEMA Mining Inc.
CHRISTENSEN RANCH
Mine Unit 4 PERIMETER ORE ZONE MONITOR WELL
Well I.D. 4MW-13 2nd Half, 1999
Water QualityParameters
Specific
Chloride ConductanceTotal
AlkalinityPiezometric
ElevationpH Uranium
Units mg/i ji mho/cm mg/i as CaCO 3 mg/1 msl
Upper Control Limit 11.1 825 116.9
Date
22 JUL 1999
17 AUG 1999
20 SEP 1999
04 OCT 1999
17 NOV 1999
16 DEC 1999
9.4
9.1
9.0
8.8
9.7
9.2
676
666
671
666
677
667
96.4
94.3
92.7
90.9
99.7
93.8
8.6
8.4
8.4
8.5
8.4
8.5
4564.0
4563.6
4563.4
4563.3
4563.1
4563.0
* Values Exceed Upper Control Limit
Negative U308 Grades Indicate Less Than Detection Limit.
4MW-13
140

NRCDEQ2REP
COGEMA Mining Inc.
CHRISTENSEN RANCH
PERIMETER ORE ZONE MONITOR WELLMine Unit 4
2nd Half,1999Well I.D. 4MW-14
Water QualityParameters
Specific
Chloride ConductanceTotal
Alkalinity pH
Piezometric
Uranium Elevation
mg/l mslUnits mg/I ti mho/cm mg/l as CaCO3
Upper Control Limit 11.1 825 116.9
Date
22 JUL 1999
17 AUG 1999
20 SEP 1999
04 OCT 1999
17 NOV 1999
16 DEC 1999
9.6
8.9
9.1
8.9
9.1
9.1
690
671
681
679
675
678
106.1
98.7
101.2
99.9
101.1
99.2
8.4
8.4
8.4
8.5
8.4
8.4
4570.3
4570.3
4570.7
4570.6
4570.3
4569.9
* Values Exceed Upper Control Limit
Negative U308 Grades Indicate Less Than Detection Limit.
4MIW-14
141

NRCDEQ2REP
COGEMA Mining Inc.
CHRISTENSEN RANCH
Mine Unit 4 PERIMETER ORE ZONE MONITOR WELL
Well I.D. 4MIW-152nd Half, 1999
Water Quality Specific Total PiezometricParameters Chloride Conductance Alkalinity pH Uranium Elevation
Units mg/l ýt mho/cm mg/1 as CaCO3 mg/l msl
Upper Control Limit 11.1 825 116.9
Date
22 JUL 1999
17 AUG 1999
20 SEP 1999
04 OCT 1999
17 NOV 1999
16 DEC 1999
9.5
9.2
9.0
9.0
9.1
9.6
692
674
688
683
692
685
103.1
99.5
99.9
101.4
105.2
103.1
8.6
8.5
8.4
8.4
8.4
8.5
4564.2
4564.4
4564.3
4564.2
4564.3
4564.0
* Values Exceed Upper Control Limit
Negative U308 Grades Indicate Less Than Detection Limit.
4MW-15
142

NRCDEQ2REP
COGEMA Mining Inc.
CHRISTENSEN RANCH
Mine Unit 4 PERIMETER ORE ZONE MONITOR WELL
Well I.D. 4MW-16 2nd Half,1999
Water Quality Specific Total PiezometricParameters Chloride Conductance Alkalinity pH Uranium Elevation
Units mg/l gt mho/cm mg/I as CaCO 3 mg/1 msl
Upper Control Limit 11.1 825 116.9
Date
22 JUL 1999
17 AUG 1999
20 SEP 1999
04 OCT 1999
17 NOV 1999
16 DEC 1999
8.9
8.6
9.1
8.7
9.0
9.2
683
675
670
671
670
674
104.1
98.8
104.8
102.1
107.9
99.5
8.6
8.5
8.4
8.5
8.4
8.4
4571.3
4571.9
4572.5
4571.5
4572.2
4571.5
* Values Exceed Upper Control Limit
Negative U308 Grades Indicate Less Than Detection Limit.
4MW-16
143

N-.CDEQ2REP
COGEMA Mining Inc.
CHRISTENSEN RANCH
Mine Unit 4 PERIMETER ORE ZONE MONITOR WELL
Well I.D. 4MW-172nd Half, 1999
Water Quality Specific Total PiezometricParameters Chloride Conductance Alkalinity pH Uranium Elevation
Units mg/1 j.t mho/cm mg/1 as CaCO3 mg/I msl
Upper Control Limit 11.1 825 116.9
Date
22 JUL 1999
17 AUG 1999
20 SEP 1999
04 OCT 1999
17 NOV 1999
16 DEC 1999
9.8
9.0
8.7
8.8
9.3
9.3
680
663
670
676
676
676
98.4
92.9
92.4
92.2
95.6
95.2
8.4
8.5
8.6
8.6
8.5
8.6
4542.6
4566.9
4567.1
4567.1
4566.9
4566.4
* Values Exceed Upper Control Limit
Negative U308 Grades Indicate Less Than Detection Limit.
4MW-17
144

NRCDEQ2REP
COGEMA Mining Inc.
CHRISTENSEN RANCH
Mine Unit 4 PERIMETER ORE ZONE MONITOR WELL
2nd Half,1999Well I.D. 4MW-18
Water Quality Specific Total PiezometricParameters Chloride Conductance Alkalinity pH Uranium Elevation
Units mg/1 pt mho/cm mg/l as CaCO 3 mg/i msl
Upper Control Limit 11.1 825 116.9
Date
22 JUL 1999
17 AUG 1999
20 SEP 1999
04 OCT 1999
17 NOV 1999
16 DEC 1999
9.7
9.0
9.4
8.8
9.4
9.2
690
673
683
682
676
683
104.9
98.1
103.9
98.0
102.2
98.5
8.4
8.5
8.6
8.5
8.5
8.5
4571.4
4572.4
4572.6
4572.6
4572.3
4571.7
4MW- 18* Values Exceed Upper Control Limit
Negative U308 Grades Indicate Less Than Detection Limit.
145

NRCDEQ2REP
COGEMA Mining Inc.
CHRISTENSEN RANCH
Mine Unit 4 PERIMETER ORE ZONE MONITOR WELL
2nd Half, 1999Well I.D. 4MW-19
Water Quality Specific Total PiezometricParameters Chloride Conductance Alkalinity pH Uranium Elevation
Units mg/I pt mho/cm mg/I as CaCO 3 mg/1 msl
Upper Control Limit 11.1 825 116.9
Date
22 JUL 1999
17 AUG 1999
20 SEP 1999
04 OCT 1999
17 NOV 1999
16 DEC 1999
9.4
9.1
8.8
8.8
9.5
9.4
679
665
676
673
678
676
100.0
95.0
95.0
93.5
97.1
97.1
8.5
8.4
8.5
8.5
8.3
8.4
4567.0
4567.1
4567.2
4567.2
4567.0
4566.7
* Values Exceed Upper Control Limit
Negative U308 Grades Indicate Less Than Detection Limit.
4MW-19
146

NRCDEQ2REP
COGEMA Mining Inc.
CHRISTENSEN RANCH
Mine Unit 4 PERIMETER ORE ZONE MONITOR WELL
Well I.D. 4MW-202nd Half,1999
Water Quality Specific Total PiezometricParameters Chloride Conductance Alkalinity pH Uranium Elevation
Units mg/l [r mho/cm mg/l as CaCO3 mg/l msil
Upper Control Limit 11.1 825 116.9
Date
22 JUL 1999
17 AUG 1999
20 SEP 1999
04 OCT 1999
17 NOV 1999
16 DEC 1999
8.9
8.6
8.2
8.2
9.0
8.9
685
672
680
680
676
682
105.9
99.5
98.1
98.5
103.9
103.0
8.6
8.4
8.5
8.5
8.4
8.5
4573.8
4575.0
4575.1
4574.9
4575.5
4574.6
* Values Exceed Upper Control Limit
Negative U308 Grades Indicate Less Than Detection Limit.
4MW-20
147

NP-CDE02REP
COGEMA Mining Inc.
CHRISTENSEN RANCH
Mine Unit 4 PERIMETER ORE ZONE MONITOR WELL
2nd Half, 1999Well I.D. 4MW-21
Water Quality Specific Total PiezometricParameters Chloride Conductance Alkalinity pH Uranium Elevation
Units mg/l ýi mho/cm r mg/1 as CaCO3 mg/1 msl
Upper Control Limit 11.1 825 116.9
Date
22 JUL 1999
17 AUG 1999
20 SEP 1999
04 OCT 1999
17 NOV 1999
16 DEC 1999
9.5
9.1
9.0
8.8
9.2
9.3
679
660
670
667
672
669
99.2
94.6
95.6
92.9
99.5
94.2
8.5
8.4
8.5
8.5
8.3
8.4
4567.8
4568.1
4568.3
4568.3
4568.0
4567.7
* Values Exceed Upper Control Limit
Negative U308 Grades Indicate Less Than Detection Limit.
4MW-21
148

NRCDEQ2REP
COGEMA Mining Inc.
CHRISTENSEN RANCH
Mine Unit 4 PERIMETER ORE ZONE MONITOR WELL
Well I.D. 4MvW-22 2nd Half, 1999
Water Quality Specific Total PiezometricParameters Chloride Conductance Alkalinity pH Uranium Elevation
Units mg/1 pi mho/cm mg/i as CaCO 3 mg/l msl
Upper Control Limit 11.1 825 116.9
Date
22 JUL 1999
17 AUG 1999
20 SEP 1999
04 OCT 1999
17 NOV 1999
16 DEC 1999
9.1
8.6
8.8
8.4
9.0
8.9
685
676
682
678
675
681
101.8
98.5
99.4
97.2
100.9
98.1
8.3
8.4
8.5
8.5
8.4
8.5
4573.5
4574.8
4575.5
4575.4
4575.1
4574.2
* Values Exceed Upper Control Limit
Negative U308 Grades Indicate Less Than Detection Limit.
4MW-22
149

NRCDEQ2REP
COGEMA Mining Inc.
CHRISTENSEN RANCH
Mine Unit 4 PERIMETER ORE ZONE MONITOR WELL
2nd Half, 1999Well I.D. 4MW-23
Water Quality Specific Total PiezometricParameters Chloride Conductance Alkalinity pH Uranium Elevation
Units mg/I pa mho/cm mg/l as CaCO3 mg/i msl
Upper Control Limit 11.1 825 116.9
Date
22 JUL 1999
17 AUG 1999
20 SEP 1999
04 OCT 1999
17 NOV 1999
16 DEC 1999
9.2
8.9
8.5
8.9
9.2
9.0
684
671
678
678
682
677
100.9
96.1
94.3
102.0
99.4
95.6
8.5
8.3
8.4
8.4
8.3
8.4
4569:5
4569.9
4570.4
4570.4
4570.0
4569.7
* Values Exceed Upper Control Limit
Negative U308 Grades Indicate Less Than Detection Limit.
4MW-23
150

NRCDEQ2REP
COGEMA Mining Inc.
CHRISTENSEN RANCH
Mine Unit 4 PERIMETER ORE ZONE MONITOR WELL
2nd Half, 1999Well I.D. 4MW-24
Water QualityParameters
SpecificConductance
TotalAlkalinity
PiezometricElevationChloride pH Uranium
Units mg/i p mho/cm mg/l as CaCO3 mg/l msl
Upper Control Limit 11.1 825 116.9
Date
22 JUL 1999
17 AUG 1999
20 SEP 1999
04 OCT 1999
17 NOV 1999
16 DEC 1999
9.3
9.0
8.5
8.6
9.0
8.9
683
670
679
677
672
676
102.8
95.2
94.8
95.4
100.2
95.8
8.5
8.4
8.5
8.5
8.4
8.5
4572.8
4573.8
4573.5
4574.4
4574.1
4573.3
* Values Exceed Upper Control Limit
Negative U308 Grades Indicate Less Than Detection Limit.
4MW-24
151

NRCDEQ2REP
COGEMA Mining Inc.
CHRISTENSEN RANCH
Mine Unit 4 PERIMETER ORE ZONE MONITOR WELL
2nd Half, 1999Well I.D. 4MW-25
Water Quality Specific Total PiezometricParameters Chloride Conductance Alkalinity pH Uranium Elevation
Units mg/I p mho/cm mg/l as CaCO 3 mg/1 msl
Upper Control Limit 11.1 825 116.9
Date
22 JUL 1999
17 AUG 1999
20 SEP 1999
04 OCT 1999
17 NOV 1999
16 DEC 1999
9.2
8.8
8.7
8.6
9.2
9.4
690
678
688
683
685
683
98.8
96.6
96.4
96.8
100.2
101.9
8.2
8.4
8.5
8.5
8.4
8.4
4571.4
4572.7
4572.5
4572.5
4572.3
4571.7
* Values Exceed Upper Control Limit
Negative U308 Grades Indicate Less Than Detection Limit.
4MW-25
152

NRCDE02REP
COGEMA Mining Inc.
CHRISTENSEN RANCH
PERIMETER ORE ZONE MONITOR WELLMine Unit 5
2nd Half,1999Well I.D. 5MWI
Water QualityParameters
Specific .
Chloride ConductanceTotal
Alkalinity pH UraniumPiezometricElevation
Units mg/l Rt mho/cm mg/l as CaCO3 mg/l msl
Upper Control Limit 22.7 1004 134.3
Date
13 JUL 1999
28 JUL 1999
10 AUG 1999
25 AUG 1999
08 SEP 1999
21 SEP 1999
05 OCT 1999
19 OCT 1999
02 NOV 1999
16 NOV 1999
30 NOV 1999
14 DEC 1999
28 DEC 1999
7.8
7.9
7.7
7.7
8.5
7.8
7.5
7.8
7.4
7.3
7.7
7.0
7.0
838
821
762
755
746
768
794
827
850
851
851
861
848
94.9
96.8
94.5
94.3
102.1
95.5
94.3
94.4
91.4
90.3
91.7
88.0
87.3
8.5
8.2
8.3
8.3
8.4
8.2
8.3
8.5
8.3
8.3
8.4
8.5
8.3
4608.9
4612.1
4614.2
4614.6
4616.0
4615.9
4615.4
4615
46144
4613.9
4612.9
4612.6
4611.9
* Values Exceed Upper Control Limit
Negative U308 Grades Indicate Less Than Detection Limit.
5MW 1
153

NR.CDEQ2REP
COGEMA Mining Inc.
CHRISTENSEN RANCH
PERIMETER ORE ZONE MONITOR WELLMine Unit 5
2nd Half, 1999Well I.D. 5MW2
Water QualityParameters
Specific Total PiezometricSpecific
ConductanceTotal
AlkalinityChloride pH UraniumPiezometric
Elevation
Units mg/l pt mho/cm mg/I as CaCO3 mg/1 msl
Upper Control Limit 22.7 1004 134.3
Date
14 JUL 1999
28 JUL 1999
10 AUG 1999
25 AUG 1999
09 SEP 1999
21 SEP 1999
05 OCT 1999
19 OCT 1999
02 NOV 1999
16 NOV 1999
30 NOV 1999
14 DEC 1999
28 DEC 1999
7.6
8.6
7.7
7.5
7.6
7.5
8.0
8.1
7.8
8.0
8.1
7.8
8.1
813
812
807
801
807
807
809
807
813
810
805
807
809
93.3
101.0
94.8
93.9
94.7
92.7
97.4
98.2
97.1
98.7
94.7
95.2
94.2
8.4
8.3
8.3
8.3
8.1
8.3
8.3
8.4
8.3
8.3
8.4
8.3
8.3
4596.2
4604.7
4607.1
4607.4
4609.6
4608.4
4608.0
4607.4
4606.2
4605.2
4604.2
4603.6
4602.8
* Values Exceed Upper Control Limit
Negative U308 Grades Indicate Less Than Detection Limit.
5MW2
154

NRCDEQ2REP
COGEMA Mining Inc.
CHRISTENSEN RANCH
Mine Unit 5 PERIMETER ORE ZONE MONITOR WELL
2nd Half,1999Well I.D: 5MW3
Water Quality Specific Total PiezometriParameters Chloride Conductance Alkalinity pH Uranium Elevation
ic
Units mig/ 4 mho/cm mg/l as CaCO3 mg/l msl
Upper Control Limit 22.7 1004 134.3
Upper Control Limit 22.7 134.3
Date
14 JUL 1999
28 JUL 1999
10 AUG 1999
25 AUG 1999
09 SEP 1999
21 SEP 1999
05 OCT 1999
19 OCT 1999
02 NOV 1999
16 NOV 1999
30 NOV 1999
14 DEC 1999
28 DEC 1999
8.4
8.6
7.6
7.7
8.0
7.8
8.3
8.4
8.5
8.3
8.5
8.1
8.3
741
750
751
741
751
752
750
748
754
749
746
741
741
102.8
103.9
96.6
96.7
98.0
95.9
99.5
101.3
103.3
101.1
97.7
97.4
97.6
8.3
8.3
8.2
8.2
8.1
8.2
8.2
8.3
8.2
8.3
8.3
8.3
8.2
4609.8
4612.2
4614.1
4614.5
4615.9
4615.8
4615.5
46154
4615w
4614.1
4613.4
4612.9
4612.2
* Values Exceed Upper Control Limit
Negative U308 Grades Indicate Less Than Detection Limit.
5MW3
155

NWCDEQ2REP
COGEMA Mining Inc.
CHRISTENSEN RANCH
Mine Unit 5 PERIMETER ORE ZONE MONITOR WELL
2nd Half,1999Well I.D. 5MW4
Water Quality Specific Total PiezometricParameters Chloride Conductance Alkalinity pH Uranium Elevation
Units mg/1 ji mho/cm mg/I as CaCO3 mg/l msl
Upper Control Limit 22.7 1004 134.3
Date
14 JUL 1999
28 JUL 1999
10 AUG 1999
25 AUG 1999
09 SEP 1999
21 SEP 1999
05 OCT 1999
19 OCT 1999
02 NOV 1999
16 NOV 1999
30 NOV 1999
14 DEC 1999
28 DEC 1999
8.3
8.7
8.2
7.9
8.2
8.2
8.6
8.9
8.6
8.8
8.9
8.8
8.7
730
727
725
721
723
722
724
,722
726
722
719
719
718
103.2
110.7
103.2
102.5
104.8
103.5
105.9
108.8
107.6
108.6
,,1043
'103.8
103.2
8.5
8.4
8.4
8.3
8.3
8.3
8.4
8.5
8.4
8.4
8.4
8.4
8.4
4601.7
4607.9
4610.5
4610.5
4612.2
4611.6
4611.2
4611.0
4610.1
4609.5
4608.2
4607.6
4607.2
* Values Exceed Upper Control Limit
Negative U308 Grades Indicate Less Than Detection Limit.
5MW4
156

NRCDEQ2REP
COGEMA Mining Inc.
CHRISTENSEN RANCH
Mine Unit 5 PERIMETER ORE ZONE MONITOR WELL
2nd Half,1999Well ID. 5MW5
Water QualityParameters
SpecificConductance
TotalAlkalinityChloride pH Uranium
Piezometric
Elevation
mslUnits mg/l g mho/cm mg/I as CaCO 3 mg/li
Upper Control Limit 22.7 1004 134.3
Date
13 JUL 1999
28 JUL 1999
10 AUG 1999
25 AUG 1999
08 SEP 1999
21 SEP 1999
05 OCT 1999
19 OCT 1999
02 NOV 1999
16 NOV 1999
30 NOV 1999
14 DEC 1999
28 DEC 1999
7-5
6.5
6.3
6.4
6.6
6.5
6.7
7.0
7.0
7.1
7.6
7.3
7.3
866
936
928
913
895
896
884
882
878
861
839
837
837
94.7
89.3
84.9
85.7
86.2
86.6
90.6
91.8
91.7
97.3
91.6
91.5
91.8
8.3
8.3
8.1
8.1
8.2
8.2
8.2
8.3
8.2
8.2
8.3
8.3
8.2
4609.1
4610.6
4612.3
4612.5
4613.8
4614.2
4614.0
4614.j
4613.
4612.7
4612.0
4611.5
4610.8
* Values Exceed Upper Control Limit
Negative U308 Grades Indicate Less Than Detection Limit.
5MW5
157

NRCDEQ2REP
COGEMA Mining Inc.
CHRISTENSEN RANCH
Mine Unit 5 PERIMETER ORE ZONE MONITOR WELL
2nd Half, 1999Well I.D. 5MW6
Water Quality Specific Total PiezometricParameters Chloride Conductance Alkalinity pH Uranium Elevation
Units mg/l [L mho/cm mg/l as CaCO 3mg/1 msl
Upper Control Limit 22.7 1004 134.3
Upper Control Limit 22.7 1004 134.3
Date
14 JUL 1999
28 JUL 1999
10 AUG 1999
25 AUG 1999
09 SEP 1999
21 SEP 1999
05 OCT 1999
19 OCT 1999
02 NOV 1999
16 NOV 1999
30 NOV 1999
14 DEC 1999
28 DEC 1999
8.8
9.1
8.7
8.5
8.8
9.2
9.2
9.2
8.9
9.1
9.3.
9.0
9.0
683
686
685
684
684
687
686
687
692
692
686
686
691
108.7
114.5
108.2
107.7
109.3
113.5
111.9
113.0
110.6
110.6
109.0
109.5
107.1
8.6
8.5
8.4
8.4
8.4
8.4
8.5
8.6
8.5
8.4
8.5:
8.5
8.5
4603.5
4608.5
4610.6
4610.9
4612.5
4612.0
4611.6
4611.6
4610.6
4610.0
4608.9
4608.5
4607.6
* Values Exceed Upper Control Limit
Negative U308 Grades Indicate Less Than Detection Limit.
5MW6
158

NRCDEQ2REP
COGEMA Mining Inc.
CHRISTENSEN RANCH
Mine Unit 5 PERIMETER ORE ZONE MONITOR WELL
22nd Half, 1999
Well I.D. 5MW7
Water Quality Specific Total PiezometricParameters Chloride Conductance Alkalinity pH Uranium Elevation
Units mg/l g mho/cm mg/I as CaCO3 mg/i msl
Upper Control Limit 22.7 1004 134.3
Date
13 JUL 1999
29 JUL 1999
10 AUG 1999
25 AUG 1999
09 SEP 1999
21 SEP 1999
05 OCT 1999
19 OCT 1999
02 NOV 1999
16 NOV 1999
30 NOV 1999
14 DEC 1999
28 DEC 1999
7.0
6.6
6.3
6.4
6.7
6.5
6.7
7.0
6.9
7.2
7.0
6.9
6.9
903
921
908
910
898
906
903
899
899
891
883
882
883
91.8
93.7
87.8
87.7
89.4
87.2
92.8
92.2
91.9
93.5
89.8'"
90.7
89.3
8.6
8.6
8.6
8.5
8.6
8.5
8.5
8.7
8.5
8.5
8.6
8.6
8.6
4608.0
4608.8
4610.5
4610.5
4611.7
4612.2
4612.2
4612.
4611 ".
4611.0
4610.0
4609.8
4608.9
* Values Exceed Upper Control Limit
Negative U308 Grades Indicate Less Than Detection Limit.
5MW7
159

NFRCDEQ2REP
COGEMA Mining Inc.
CHRISTENSEN RANCH
Mine Unit 5 PERIMETER ORE ZONE MONITOR WELL
2nd Half, 1999Well I.D. 5MW8
Water Quality Specific Total PiezometricParameters Chloride Conductance Alkalinity pH Uranium Elevation
Units mg/l ý.t mho/cm mg/i as CaCO3 mg/1 msl
Upper Control Limit 23 1423 122.5
Date
14 JUL 1999
28 JUL 1999
10 AUG 1999
25 AUG 1999
09 SEP 1999
21 SEP 1999
05 OCT 1999
19 OCT 1999
02 NOV 1999
16 NOV 1999
30 NOV 1999
14 DEC 1999
28 DEC 1999
9-3
9.1
9.4
9.1
9.8
10.7
11.6
12.9
12.9
12.9
13.2
13.5
13.5
691
699
734
754
822
844
808
800
788
773
769
781
795
106.3
113.6
112.7
113.8
121.3
125.1
131.0
138.4
138.3
138.0
-135.2
141.4
140.0
*
*
*
8.5
8.4
8.3
8.2
8.1
8.2
8.2
8.3
8.2
8.2
8.2,
8.2
8.1
4605.0
4608.8
4611.0
4611.0
4612.4
4612.3
4612.1
4612.2
4611.3
4610.6
4609A.
4609.3
4608.5
* Values Exceed Upper Control Limit
Negative U308 Grades Indicate Less Than Detection Limit.
5MWR
160

NRCDEQ2REP
COGEMA Mining Inc.
CHRISTENSEN RANCH
Mine Unit 5 PERIMETER ORE ZONE MONITOR WELL
Well I.D. 5MW10 2nd Half,1999
Water Quality Specific Total PiezometricParameters Chloride Conductance Alkalinity pH Uranium Elevation
Units mg/I .t mho/cm mg/l as CaCO 3 mg/l msl
Upper Control Limit 22.7 1004 134.3
Date
14 JUL 1999
28 JUL 1999
10 AUG 1999
25 AUG 1999
09 SEP 1999
21 SEP 1999
05 OCT 1999
19 OCT 1999
02 NOV 1999
16 NOV 1999
30 NOV 1999
14 DEC 1999
28 DEC 1999
8.5
9.3
11.4
12.6
13.7
12.2
11.2
10.8
9.4
8.8
9.2
8.7
8.9
720
733
756
764
802
793
765
756
743
733
722
723
724
99.3
107.9
108.5
114.5
123.3
122.2
118.1
116.9
110.2
107.2
107.6
104.0
102.8
8.5
8.4
8.4
8.3
8.2
8.3
8.3
8.5
8.4
8&4
8.5
8:4
8.4
4605.9
4608.6
4610.7
4610.8
4612.3
4612.3
4612.2
46121
4611 .
4610.9
4609.7
4609.3
4608.6
* Values Exceed Upper Control Limit
Negative U308 Grades Indicate Less Than Detection Limit.
5MW10
161

NPRCDEQ2REP
COGEMA Mining Inc.
CHRISTENSEN RANCH
Mine Unit 5 PERIMETER ORE ZONE MONITOR WELL
Well I.D. 5MW122nd Half, 1999
Water Quality Specific Total PiezometricParameters Chloride Conductance Alkalinity pH Uranium Elevation
Units mg/I ý. mho/cm mg/I as CaCO 3 mg/1 msl
Upper Control Limit 22.8 1725 145.4
Date
14 JUL 1999
28 JUL 1999
10 AUG 1999
25 AUG 1999
09 SEP 1999
21 SEP 1999
05 OCT 1999
19 OCT 1999
02 NOV 1999
16 NOV 1999
30 NOV 1999
14 DEC 1999
28 DEC 1999
8.5
8.6
8.0
8.0
8.1
7-9
8.6
8.7
8.3
8.4
8.5
8.5
8.6
1149
1128
1221
1194
1039
1240
1125
1118
1212
1199
1087
1055
1207
107.9
113.4
110.3
109.9
105.8
111.0
111.9
113.2
113.9
114.4
107.8
1,09.2 :
112.3
8.2
8.1
8.0
8.0
8.0
8.0
8.0
8.2
8.1
8.1
8.1.
8.1
8.0
4601.2
4604.0
4605.7
4607.3
4607.2
4607.6
4607.2
4607.3
4606.4
4605.7
4604.8
4604.5
4603.6
* Values Exceed Upper Control Limit
Negative U308 Grades Indicate Less Than Detection Limit.
5MW12
162

NRCDEQ2REP
COGEMA Mining Inc.
CHRISTENSEN RANCH
Mine Unit 5 PERIMETER ORE ZONE MONITOR WELL
2nd Half, 1999Well I.D. 5MW14
Water QualityParameters
Specific
Chloride ConductanceTotal
AlkalinityPiezometric
ElevationpH Uranium
Units mg/l P mho/cm mg/l as CaCO 3 mg/i msl
Upper Control Limit 22.7 1004 134.3
Date
14 JUL 1999
28 JUL 1999
10 AUG 1999
25 AUG 1999
09 SEP 1999
21 SEP 1999
05 OCT 1999
19 OCT 1999
02 NOV 1999
16 NOV 1999
30 NOV 1999
14 DEC 1999
28 DEC 1999
8.2
8.8
8.9
8.5
8.6
8.2
8.9
8.9
8.6
8.8
8.8
8.7
9.1
691
697
697
684
695
699
694
694
695
693
689
689
691
101.5
109.6
108.0
104.4
106.4
102.9
105.2
106.9
105.8
106.9
103.3
103.7
106.2
8.5
8.4
8.4
8.3
8.2
8.4
8.4
8.5
8.4
8.4
8.4
8.4
8.4
4601.2
4603.7
4605.5
4605.5
4606.9
4607.5
4607.4
4607.
466
4605.7
4604-5
4604.5
4603.6
* Values Exceed Upper Control Limit
Negative U308 Grades Indicate Less Than Detection Limit.
5MW14
163

NRzCDEQ2REP
COGEMA Mining Inc.
CHRISTENSEN RANCH
Mine Unit 5 PERIMETER ORE ZONE MONITOR WELL
Well I.D. SMW16 2nd Half, 1999
Water Quality Specific Total PiezometricParameters Chloride Conductance Alkalinity pH Uranium Elevation
Units mg/l ft mho/cm mg/l as CaCO3 mg/1 msl
Upper Control Limit 22.7 1004 134.3
Date
14 JUL 1999
20 JUL 1999
10 AUG 1999
25 AUG 1999
09 SEP 1999
21 SEP 1999
05 OCT 1999
19 OCT 1999
02 NOV 1999
16 NOV 1999
30 NOV 1999
14 DEC 1999
20 DEC 1999
8.2
8.1
7.7
7.6
7.7
7.7
8.2
8.3
8.2
8.1
8.3
8.3
8.3
753
784
777
758
766
769
759
756
753
740
737
739
741
96.5
102.1
96.9
97.2
103.8
98.4
100.4
102.1
102.3
101.2
99.3
99.8
99.6
8.4
8.3
8.2
8.2
8.1
8.3
8.3
8.4
8.3
8.4
8.4
8.3
8.3
4601.7
4603.8
4605.5
4605.5
4606.8
4607.1
4607.4
4607.4
4606.3
4605.9
4605.0
4604.8
4603.8
* Values Exceed Upper Control Limit
Negative U308 Grades Indicate Less Than Detection Limit.
5MW16
164

NRCDEQ2REP
COGEMA Mining Inc.
CHRISTENSEN RANCH
PERIMETER ORE ZONE MONITOR WELLMine Unit 5
2nd Half, 1999Well I.D. 5MW18
Water QualityParameters
Specific
Chloride ConductanceTotal
AlkalinityPiezometric
ElevationpH Uranium
Units mg/I ,t mho/cm mg/l as CaCO3 mg/l msl
Upper Control Limit 22.7 1004 134.3
Date
14 JUL 1999
28 JUL 1999
10 AUG 1999
25 AUG 1999
09 SEP 1999
21 SEP 1999
05 OCT 1999
20 OCT 1999
02 NOV 1999
16 NOV 1999
30 NOV 1999
14 DEC 1999
28 DEC 1999
6.4
7.0
6.8
6.8
6.9
6.9
7.2
7.5
7.3
7.8
7.5
7.3
7.6
913
923
921
889
883
880
869
863
859
847
848
849
847
92.9
93.4
88.4
90.2
92.5
90.8
93.8
94.3
94.9
100.0
91.3
92.0
92.9
8.3
8.3
8.2
8.2
8.1
8.2
8.3
8.4
8.3
8.3
8.3'
8.3
8.3
4600.4
4602.0
4603.8
4603.7
4604.9
4605.4
4605.0
4605.
4605.1
4604.8
4603.4
4603.0
4602.2
* Values Exceed Upper Control Limit
Negative U308 Grades Indicate Less Than Detection Limit.
5MW18
165

NR.CDEQ2REP
COGEMA Mining Inc.
CHRISTENSEN RANCH
Mine Unit 5 PERIMETER ORE ZONE MONITOR WELL
Well I.D. 5MW20 2nd Half,1999
Water Quality Specific Total PiezometricParameters Chloride Conductance Alkalinity pH Uranium Elevation
Units mg/I ýt mho/cm mg/1 as CaCO 3 mg/l msl
Upper Control Limnit' 22.7 1004 134.3
Date
13 JUL 1999
28 JUL 1999
10 AUG 1999
25 AUG 1999
08 SEP 1999
21 SEP 1999
05 OCT 1999
20 OCT 1999
02 NOV 1999
16 NOV 1999
30 NOV 1999
14 DEC 1999
28 DEC 1999
6.9
6.4
6.1
6.4
6.7
7.1
6.7
7.0
7.0
7.0
6.9
7.1
7.3
932
951
933
926
883
892
886
886
890
883
874
871
874
91.2
88.4
85.6
86.3
88.2
93.6
91.4
91.8
92.7
92.0
92.4
95.7.
90.8
8.4
8.4
8.3
•8.2
8.4
8.3
8.3
8.5
8.3
8.4
8.4
8.4
8.4
4604.7
4606.0
4607.7
4607.6
4608.9
4609.4
4609.6
4609.6
4609.0
4608.2
4607.3
4607.1
4606.0
* Values Exceed Upper Control Limit
Negative U308 Grades Indicate Less Than Detection Limit.
5MW20
166

NRCDEQ2REP
COGEMA Mining Inc.
CHRISTENSEN RANCH
Mine Unit 5 PERIMETER ORE ZONE MONITOR WELL
22nd Half, 1999
Well I.D. 5MW30A
Water Quality Specific Total PiezometricParameters Chloride Conductance Alkalinity pH Uranium Elevation
Units mg/1 pr mho/cm mg/I as CaCO 3 mg/1 msl
Upper Control Limit 22.7 1004 134.3
Date
14 JUL 1999
29 JUL 1999
10 AUG 1999
25 AUG 1999
09 SEP 1999
21 SEP 1999
05 OCT 1999
19 OCT 1999
02 NOV 1999
17 NOV 1999
30 NOV 1999
14 DEC 1999
28 DEC 1999
8.3
8.6
7.9
8.1
8.5
7.9
8.5
8.3
8.5
8.1
8.1
8.1
8.4
674
674
676
673
664
667
670
666
674
670
660
668
670
101.3
108.1
101.8
98.0
102.1
98.5
102.0
103.3
105.9
102.5
99.3
100.1
101.0
8.6
8.6
8.5
8.5
8.4
8.6
8.6
8.7
8.6
8.6
8.6
8.6
8.6
4582.1
4589.3
4591.6
4593.0
4595.0
4594.0
4593.2
4593.1
4591.•
4590.5
4588.6
4588.2
4588.2
* Values Exceed Upper Control Limit
Negative U308 Grades Indicate Less Than Detection Limit.
5MW30A
167

NRCDEQ2REP
COGEMA Mining Inc.
CHRISTENSEN RANCH
Mine Unit 5 PERIMETER ORE ZONE MONITOR WELL
Well I.D. 5MW31 2nd Half, 1999
Water Quality Specific Total PiezometricParameters Chloride Conductance Alkalinity pH Uranium Elevation
Units mg/l 4i mho/cm mg/l as CaCO3 mg/1 msl
Upper Control Limit 22.7 1004 134.3
Date
14 JUL 1999
29 JUL 1999
10 AUG 1999
25 AUG 1999
09 SEP 1999
21 SEP 1999
05 OCT 1999
19 OCT 1999
02 NOV 1999
17 NOV 1999
30 NOV 1999
14 DEC 1999
29 DEC 1999
8.4
8.2
8.0
8.2
7.9
7.8
8.3
8.3
8.1
8.0
8.3
8.1
8-5
665
667
672
671
665
672
668
668
674
671
662
659
671
98.9
105.0
101.7
100.4
102.5
101.0
103.9
105.4
103.7
103.9
101.8
102.0
101.9
8.6
8.6
8.4
8.4
8.3
8.5
8:5
8.6
8.5
8.5
8M6
8.5
8.5
4580.4
4589.6
4591.7
4593.1
4593.7
4594.2
4592.1
4592.8
4590.7
4590.8
4588.8
4588.8
4588.4
* Values Exceed Upper Control Limit
Negative U308 Grades Indicate Less Than Detection Limit.
5MW31
168

NRCDEQ2REP
COGEMA Mining Inc.
CHRISTENSEN RANCH
Mine Unit 5 PERIMETER ORE ZONE MONITOR WELL 02nd Half, 1999
Well I.D. 5MW32A
Water Quality Specific Total PiezometricParameters Chloride Conductance Alkalinity pH Uranium Elevation
Units mg/l At mho/cm mg/l as CaCO3 mg/l msl
Upper Control Limit 22.7 1004 134.3
Date
13 JUL 1999
28 JUL 1999
10 AUG 1999
23 AUG 1999
07 SEP 1999
20 SEP 1999
04 OCT 1999
19 OCT 1999
02 NOV 1999
16 NOV 1999
30 NOV 1999
14 DEC 1999
27 DEC 1999
8.5
8.3
7.7
7.7
7.9
7.7
8.2
8.4
8.2
8.1
7.8
8.1
8.5
691
692
681
683
669
680
677
674
680
683
674
671
672
109.4
107.8
102.8
101.8
103.7
102.2
109.3
106.1
10555
106.2
101.7
103.7
108.7
8.6
8.4
8.5
8.6
8.6
8.6
8.5
8.6
8.5
8.6
8.6
8.6
8.7
4578.7
4589.5
4591.8
4593.1
4595.1
4594.1
4593.5
459j
4591.
4590.5
4588.7
4588.0
4588.1
* Values Exceed Upper Control Limit
Negative U308 Grades Indicate Less Than Detection Limit.
5MW32A
169

NRCDEQ2REP
COGEMA Mining Inc.
CHRISTENSEN RANCH
Mine Unit 5 PERIMETER ORE ZONE MONITOR WELL
Well I.D. 5MW33 2nd Half, 1999
Water Quality Specific Total PiezometricParameters Chloride Conductance Alkalinity pH Uranium Elevation
Units mg/i A mho/cm mg/l as CaCO3 mg/l msl
Upper Control Limit 22.7 1004 134.3
Date
14 JUL 1999
29 JUL 1999
10 AUG 1999
25 AUG 1999
09 SEP 1999
21 SEP 1999
05 OCT 1999
19 OCT 1999
02 NOV 1999
17 NOV 1999
30 NOV 1999
14 DEC 1999
28 DEC 1999
8.6
8.3
8.3
8.1
8.0
8.0
8.5
8.3
8.2
8.2
8.4
8.7
8.5
668
672
677
674
664
675
668
669
670
671
665
662
673
105.6
104.6
101.6
99.4
101.1
100.0
102.7
102.9
102.5
103.8
100.0
106.2
99.8
8.5
8.5
8.3
8.4
8.2
8.5
8.4
8.5
8.4
8.5
8.5
8.5
8.4
4581.9
4590.5
4592.2
4593.7
4595.4
4594.8
4594.2
4593.7
4592.4
4591.5
4589.7
4589.7
4589.3
* Values Exceed Upper Control Limit
Negative U308 Grades Indicate Less Than Detection Limit.
5MW33
170

NRCDEQ2REP
COGEMA Mining Inc.
CHRISTENSEN RANCH
Mine Unit 5 PERIMETER ORE ZONE MONITOR WELL
Well I.D. 5MW34 2nd Half, 1999
Water Quality Specific Total PiezometricParameters Chloride Conductance Alkalinity pH Uranium Elevation
Units mg/i ii mho/cm mg/l as CaCO3 mg/i msl
Upper Control Limit 22.7 1004 134.3
Date
13 JUL 1999
28 JUL 1999
10 AUG 1999
23 AUG 1999
07 SEP 1999
20 SEP 1999
04 OCT 1999
19 OCT 1999
02 NOV 1999
16 NOV 1999
30 NOV 1999
14 DEC 1999
27 DEC 1999
8.6
8.3
7.7
7.7
7.8
7.7
8.3
8.6.
8.2
8.2
.7.8
8.1
8.2
694
695
688
687
679
686
683
679
686
684
680
673
678
111.6
110.9
104.5
105.8
106.9
105.0
110.4
110.9
108.6
108.3
104.9
106.6
105.6
8.5
8.3
8.4
8.4
8.5
8.4
8.5
8.5
8.4
8.5
8.5
8.5
8.5
4576.0
4590.2
4592.5
4593.9
4595.8
4594.9
4594.3
45931
4591 .
4590.7
4589.1
4588.4
4588.4
* Values Exceed Upper Control Limit
Negative U308 Grades Indicate Less Than Detection Limit.
5MW34
171

NRCDEQ2REP
COGEMA Mining Inc.
CHRISTENSEN RANCH
Mine Unit 5 PERIMETER ORE ZONE MONITOR WELL
Well I.D. 5MW35A 2nd Half,1999
Water Quality Specific Total PiezometricParameters Chloride Conductance Alkalinity pH Uranium Elevation
Units mg/1 jI mho/cm mg/1 as CaCO3 mg/1 msl
Upper Control Limit 22.7 1004 134.3
Date
14 JUL 1999
29 JUL 1999
10 AUG 1999
25 AUG 1999
09 SEP 1999
21 SEP 1999
05 OCT 1999
19 OCT 1999
02 NOV 1999
17 NOV 1999
30 NOV 1999
14 DEC 1999
28 DEC 1999
8.3
8.3
8.3
8.0
7.9
7.8
8.3
8.3
8.1
8.2
8.3
8.2
8.4
671
673
678
675
668
677
671
670
674
672
666
664
674
100.2
105.3
102.1
101.3
102.3
99.3
104.5
105.7
103.9
104.9
101.5
102.0
101.8
8.6
8.6
8.4
8.5
8.3
8.6
8.5
8.6
8.5
8.6
8.6'
8.6
8.5
4582.8
4591.9
4593.0
4594.9
4596.3
4595.2
4593.4
4593.9
4591.7
4591.6
45901
4589.6
4589.9
* Values Exceed Upper Control Limit
Negative U308 Grades Indicate Less Than Detection Limit.
5MW35A
172

NRCDEQ2REP
COGEMA Mining Inc.
CHRISTENSEN RANCH
Mine Unit 5 PERIMETER ORE ZONE MONITOR WELL
Well I.D. 5MW36 2nd Half,1999
Water Quality Specific Total PiezometricParameters Chloride Conductance Alkalinity pH Uranium Elevation
Units mg/l ýi mho/cm mg/1 as CaCO3 mg/l msl
Upper Control Limit 22.7 1004 134.3
Date
13 JUL 1999
28 JUL 1999
10 AUG 1999
23 AUG 1999
07 SEP 1999
20 SEP 1999
04 OCT 1999
19 OCT 1999
02 NOV 1999
16 NOV 1999
30 NOV 1999
14 DEC 1999
27 DEC 1999
8.6
8.3
7.9
7.6
7.9
7.8
8.4
8.6
8.2
8.4
8.1
8.2
8.7
695
698
694
690
682
689
686
682
688
687
682
673
678
113.6
112.7
107.2
105.4
108.3
106.8
,107.4
110.4
108.7
109.5
105.9
106.9
113.0
8.5
8.3
8.5
8.5
8.5
8.5
8.3
8.5
8.5
8.6
8.6
8.6
8.6
4579.7
4591.5
4593.1
4595.2
4596.8
4595.6
4595.0
4194I
4592 .1
4591.4
4589.4
4588.8
4588.9
* Values Exceed Upper Control Limit
Negative U308 Grades Indicate Less Than Detection Limit.
5MW36
173

NFCDE02REP
COGEMA Mining Inc.
CHRISTENSEN RANCH
Mine Unit 5 PERIMETER ORE ZONE MONITOR WELL
Well I.D. 5MW37 2nd Half,1999
Water Quality Specific Total PiezometricParameters Chloride Conductance Alkalinity pH Uranium Elevation
Units mg/i pi mho/cm mg/I as CaCO3 mg/1 msl
Upper Control Limit 22.7 1004 134.3
Date
14 JUL 1999
29 JUL 1999
10AUG 1999
25 AUG 1999
09 SEP 1999
21 SEP 1999
05 OCT 1999
19 OCT 1999
02 NOV 1999
17 NOV 1999
30 NOV 1999
14 DEC 1999
28 DEC 1999
7.9
8.1
8.0
8.1
8.0
7.9
8.4
8.2
8.2
8.1
8.3
8.1
8.3
669
674
673
674
667
674
669
668
673
669
664
661
672
102.0
108.8
104.2
101.9
105.1
103.9
107.2
106.2
106.9
106.5
103.3
104.6
103.3
8,6
8,6
8.4
8.4
8.3
8.5
8.5
8.6
8.5
8.5
8.6
8.6
8.5
4584.7
4593.0
4594.4
4596.0
4597.1
4595.8
4595.2
4595.1
4593.5
4592.3
4590.7
4588.5
4590.5
* Values Exceed Upper Control Limit
Negative U308 Grades Indicate Less Than Detection Limit.
5MW37
174

~J~rnen9p~zp
COGEMA Mining Inc.
CHRISTENSEN RANCH
Mine Unit 5 PERIMETER ORE ZONE MONITOR WELL
Well I.D. 5MW38 2nd Half,1999
Water Quality Specific Total PiezometricParameters Chloride Conductance Alkalinity pH Uranium Elevation
Units mg/i gi mho/cm mg/i as CaCO3 mg/l msl
Upper Control Limit 22.7 1004 134.3
Date
13 JUL 1999 13.0 791 157.7 * 8.3 4577.6
28 JUL 1999 12.7 783 149.5 * 8.1 4592.6
10 AUG 1999 11.6 773 142.1 * 8.3 4594.3
23 AUG 1999 11.7 774 143.5 * 8.2 4596.4
07 SEP 1999 12.1 767 147.7 * 8.2 4598.4
20 SEP 1999 12.1 785 146.8 * 8.2 4596.6
05 OCT 1999 12.2 774 155.7 * 8.2 4596.0
19 OCT 1999 12.0 762 143.7 * 8.3 4595.j
02 NOV 1999 12.3 773 145.6 * 8.2 4592.1
16 NOV 1999 11.8 765 143.3 * 8.3 4591.7
30 NOV 1999 12.1 764 142.3 * 8.3 4589.9
14 DEC 1999 12.4 756 143.6 * 8.3 4589.0
27 DEC 1999 12.1 761 149.9 * 8.3 4589.1
• Values Exceed Upper Control Limit . 5MW38
Negative U308 Grades Indicate Less Than Detection Limit.
175

NFCDEQ2REP
COGEMA Mining Inc.
CHRISTENSEN RANCH
Mine Unit 5 PERIMETER ORE ZONE MONITOR WELL
2nd Half, 1999Well I.D. 5MW39A
. Water QualityParameters
Specific Total PiezometricSpecific
ConductanceTotal
AlkalinityChloride pH Uranium
Piezometric.Elevation
Units mg/i ýt mho/cm mg/I as CaCO3 mg/1 msl
Upper Control Limit 22.7 1004 134.3
Date
14 JUL 1999
29 JUL 1999
11 AUG 1999
25 AUG 1999
09 SEP 1999
21 SEP 1999
05 OCT 1999
19 OCT 1999
02 NOV 1999
17 NOV 1999
30 NOV 1999
14 DEC 1999
29 DEC 1999
7.8
8.1
7.9
8.1
7.8
7.8
8.2
8.2
8.2
8.1
8.2
8.3
8.8
676
678
679
678
670
680
674
673
676
679
667
668
670
100.9
106.9
100.3
100.8
101.7
101.0
103.4
106.8
106.5
105.0
10311
105.4
110.8
8.5
8.5
8.4
8.4
8.3
8.5
8.5
8.6
8.5
8.5
8.5
8ý5
8.5
4587.8
4595.9
4595.4
4597.6
4598.0
4595.5
4595.1
4595.4
4593.1
4591.9
4590.0
4590.2
4590.4
* Values Exceed Upper Control Limit
Negative U308 Grades Indicate Less Than Detection LimiL
5MW39A
176

NRCDEQ2REP
COGEMA Mining Inc.
CHRISTENSEN RANCH
PERIMETER ORE ZONE MONITOR WELLMine Unit 5
02nd Half, 1999,
Well I.D. 5MW40
Water Quality Specific Total PiezometricParameters Chloride Conductance Alkalinity pH Uranium Elevation
Units mg/1 p mho/cm mg/l as CaCO3 mg/l msl
Upper Control Limit 22.7 1004 134.3
Date
13 JUL 1999
28 JUL 1999
10 AUG 1999
23 AUG 1999
07 SEP 1999
20 SEP 1999
05 OCT 1999
19 OCT 1999
02 NOV 1999
16 NOV 1999
30 NOV 1999
14 DEC 1999
27 DEC 1999
8.8
8.6
8.1
8.0
8.2
8.0
8.5
8.7
8.5
8.4
8.6
8.4
8.3
681
687
685
677
665
676
677
673
678
677
674
665
668
109.8
106.8
102.6
101.3
104.8
102.7
104.9
105.1
103.3
103.3
104.4
101.0
100.3
8.6
8.5
8.6
8.5
8.6
8.5
8.5
8.6
8.5
8.6
8.6
8.6
8.6
4580.6
4593.4
4595.1
4597.3
4599.4
4597.1
4596.8
4595.I
4592.1
4592.1
4589.9
4589.3
4589.2
* Values Exceed Upper Control Limit
Negative U308 Grades Indicate Less Than Detection Limit.
5MW40
177
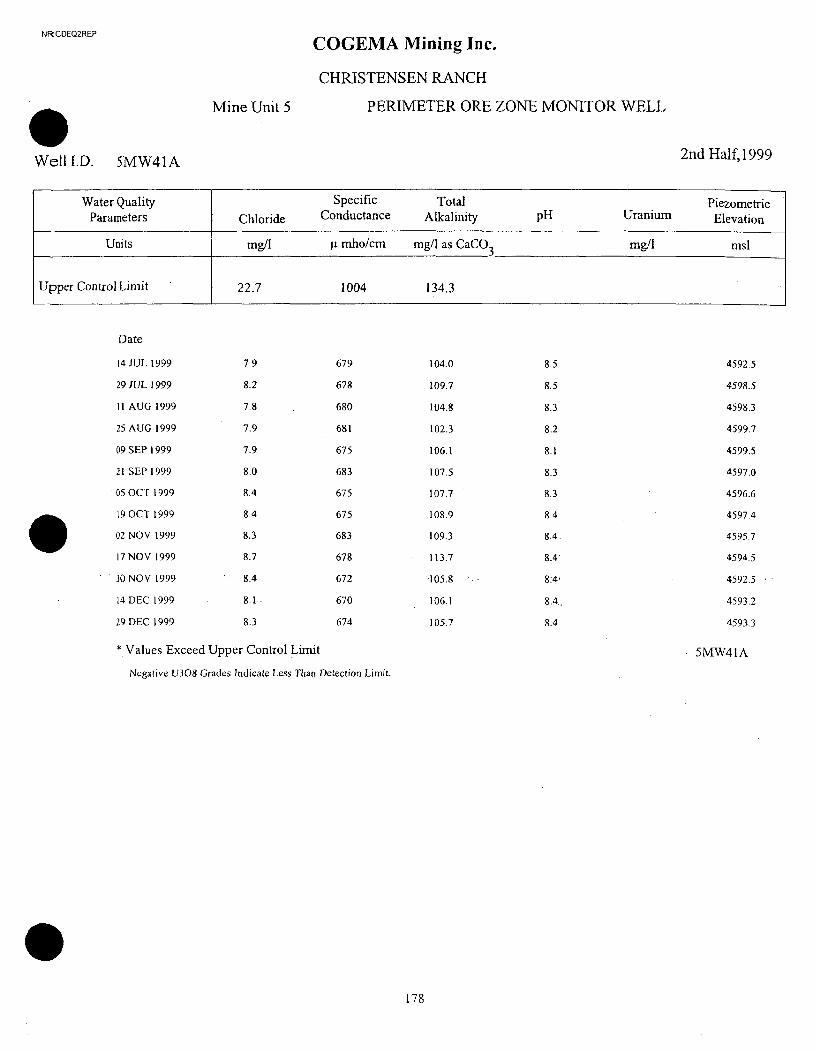
NRCDEQ2REP
COGEMA Mining Inc.
CHRISTENSEN RANCH
Mine Unit 5 PERIMETER ORE ZONE MONITOR WELL
Well I.D. 5MW41A 2nd Half, 1999
Water Quality Specific Total PiezometricParameters Chloride Conductance Alkalinity pH Uranium Elevation
Units mg/l pi mho/cm mg/l as CaCO3 mg/l msl
Upper Control Limit 22.7 1004 134.3
Date
14 JUL 1999
29 JUL 1999
I1 AUG 1999
25 AUG 1999
09 SEP 1999
21 SEP 1999
05 OCT 1999
19 OCT 1999
02 NOV 1999
17 NOV 1999
30 NOV 1999
14 DEC 1999
29 DEC 1999
7.9
8.2
7.8
7.9
7.9
8.0
8.4
8.4
8.3
8.7
8.4
8.1
8.3
679
678
680
681
675
683
675
675
683
678
672
670
674
104.0
109.7
104.8
102.3
106.1
107.5
107.7
108.9
109.3
113.7
105.8
106.1
105.7
8.5
8.5
8.3
8.2
8.1
8.3
8.3
8.4
8.4.
8.4
8:4
8.4,
8.4
4592.5
4598.5
4598.3
4599.7
4599.5
4597.0
4596.6
4597.4
4595.7
4594.5
4592.5
4593.2
4593.3
* Values Exceed Upper Control Limit
Negative U308 Grades Indicate Less Than Detection Limit.
5MW41A
178

N RCDEQ2REP
COGEMA Mining Inc.
CHRISTENSEN RANCH
Mine Unit 5 PERIMETER ORE ZONE MONITOR WELL
2nd Half,1999Well I.D. 5MW42
Water Quality Specific Total PiezometricParameters Chloride Conductance Alkalinity pH Uranium Elevation
Units mg/l p mho/cm mg/l as CaCO3 mg/1 msl
Upper Control Limit 22.7 1004 134.3
Date
13 JUL 1999
28 JUL 1999
10 AUG 1999
23 AUG 1999
07 SEP 1999
20 SEP 1999
04 OCT 1999
19 OCT 1999
02 NOV 1999
16 NOV 1999
30 NOV 1999
14 DEC 1999
27 DEC 1999
8.7
8.6
8.3
7.9
8.0
8.0
8.6
8.9
8.6
8.6
8.5
8.7
8.5
684
695
693
685
679
685
680
681
681
674
675
662
667
110.9
111.2
105.9
105.5
107.9
106.2
110.8
110.7
108.3
107.1
105.6
105.1
103.8
8.5
8.3
8.4
8.4
8.5
8.4
8.5
8.5
8.5
8.5
8.5
8.5
8.5
4584.4
4595.7
4596.7
4599.7
4602.2
4598.6
4598.3
4597j45931
4592:8
4590.7
4589.9
4589.9
* Values Exceed Upper Control Limit
Negative U308 Grades Indicate Less Than Detection Limit.
5MW42
179

NRCDEQ2REP
COGEMA Mining Inc.
CHRISTENSEN RANCH
Mine Unit 5 PERIMETER ORE ZONE MONITOR WELL
Well I.D. 5MW43 2nd Half, 1999
Water Quality Specific Total PiezometricParameters Chloride Conductance Alkalinity pH Uranium Elevation
Units mg/l p. mho/cm mg/l as CaCO3 mg/1 msl
Upper Control Limit 22.7 1004 134.3
Date
14 JUL 1999
29 JUL 1999
11 AUG 1999
25 AUG 1999
09 SEP 1999
21 SEP 1999
05 OCT 1999
19 OCT 1999
02 NOV 1999
17 NOV 1999
30 NOV 1999
14 DEC 1999
29 DEC 1999
7.7
8.0
7.7
7.9
8.2
7.6
8.1
8.0
8.0
8.1
8.2
7.9
8.2
686
684
685
686
684
687
679
683
690
682
676
675
679
107.8
112.5
107.3
106.0
114.5
106.7
110.6
110.3
110.4
111.3
106.7
108.0
109.5
8.7
8.6
8.4
8.5
8.4
8.5
8.5
8.6
8.5
8.5
8.6
8.5
8.5
4594.8
4600.7
4600.3
4601.2
4599.9
4596.4
4596.7
4598.0
4596.4
4595.2
4593.3
4594.2
4594.5
* Values Exceed Upper Control Limit
Negative U308 Grades Indicate Less Than Detection Limit.
5MW43
180

NRCDEQ2REP
COGEMA Mining Inc.
CHRISTENSEN RANCH
Mine Unit 5 PERIMETER ORE ZONE MONITOR WELL EWell I.D. 5MW44 2nd Half,1999
Water Quality Specific Total PiezometricParameters Chloride Conductance Alkalinity pH Uranium Elevation
Units mg/l Vt mho/cm mg/i as CaCO3 mg/i mnsl
Upper Control Limit 22.7 1004 134.3
Date
13 JUL 1999 9.0 680 108.7 8.6 4584.3
28 JUL 1999 8.8 683 106.6 8.4 4595.2
10 AUG 1999 8.4 684 102.5 8.5 4595.4
23 AUG 1999 8.2 677 101.7 8.5 4600.7
07 SEP 1999 8.3 668 106.2 8.5 4602.4
20 SEP 1999 7.9 680 103.8 8.5 4597.9
04 OCT 1999 8.3 678 108.4 8.4 4598.0
19 OCT 1999 8.5 678 107.9 8.6 4596.•
02 NOV 1999 8.8 671 107.5 8.7 4591.1
16 NOV 1999 8.6 670 103.4 8.5 4590.7
30 NOV 1999 8.7 666 108.2 8.6 4588M5
14 DEC 1999 8.6 656 102.7 -8.6 4587:3
27 DEC 1999 8.5 663 101.3 8.5 4587.8
• Values Exceed Upper Control Limit 5MW44
Negative U308 Grades Indicate Less Than Detection Limit.
181

NRCDEQ2REP
COGEMA Mining Inc.
CHRISTENSEN RANCH
Mine Unit 5 PERIMETER ORE ZONE MONITOR WELL
2nd Half,1999Well I.D. 5MW45
Water Quality Specific Total PiezometricParameters Chloride Conductance Alkalinity pH Uranium Elevation
Units mg/l p mho/cm mg/l as CaCO3 mg/l msl
Upper Control Limit 22.7 1004 134.3
Date
14 JUL 1999
29 JUL 1999
11 AUG 1999
25 AUG 1999
09 SEP 1999
21 SEP 1999
05 OCT 1999
19 OCT 1999
02 NOV 1999
17 NOV 1999
30 NOV 1999
14 DEC 1999
29 DEC 1999
8.2
7.8
7.6
7.8
7.6
7.5
8.4
8.0
7.8
8.0
8.6
8.4
8.8
688
684
684
685
686
688
681
683
686
683
677
675
678
115.0
113.2
108.4
107.6
109.5
107.4
116.8
112.2
110.5
111.8
110.6
110.0
114.6
8.4
8.4
8.3
8.4
8.3
8.4
8.4
8.5
8.4
8.4
8:5
8.4
8.4
4597.0
4602.6
4603.8
4604.1
4601.9
4597.0
4597.2
4599.3
4597.2
4595.6
4594.5,
4595.3
4595.4
* Values Exceed Upper Control Limit
Negative U308 Grades Indicate Less Than Detection Limit.
5MW45
182

NFRCDFO2RFP
COGEMA Mining Inc.
CHRISTENSEN RANCH
Mine Unit 5 PERIMETER ORE ZONE MONITOR WELL EWell I.D. 5MW46 2nd Half,1999
Water Quality Specific Total PiezometricParameters Chloride Conductance Alkalinity pH Uranium Elevation
Units mg/1 p mho/cm mg/i as CaCO 3 mg/I msl
Upper Control Limit 22.7 1004 134.3
Date
13 JUL 1999 8.7 672 108.6 8.5 4586.7
28 JUL 1999 8.5 685 106.3 8.2 4595.6
10 AUG 1999 8.0 683 102.4 8.3 4595.8
25 AUG 1999 8.1 683 104.5 8.3 4605.8
08 SEP 1999 8.0 689 107.3 8.5 4606.0
21 SEP 1999 7.7 692 106.3 8.4 4599.3
05 OCT 1999 7.9 693 109.6 8.4 4600.2
19 OCT 1999 8.2 690 111.6 8.5 45964
02 NOV 1999 8.2 678 106.0 8.4 4586
16 NOV 1999 8.4 677 105.1 8.5 4587.8
30 NOV 1999 8.9 671 108.5 8.5 4586.0
14 DEC 1999 8.5 660 101.7 8.4 4583.6
28 DEC 1999 8.5 664 102.5 8.4 4584.3
* Values Exceed Upper Control Limit 5MW46
Negative U308 Grades Indicate Less Than Detection Limit.
183

NFRCDE02REP
COGEMA Mining Inc.
CHRISTENSEN RANCH
Mine Unit 5 PERIMETER ORE ZONE MONITOR WELL
Well I.D. 5MW47B 2nd Half, 1999
Water QualityParameters
SpecificConductance
TotalAlkalinityChloride pH Uranium
PiezometricElevation
mslUnits mg/l ýt mho/cm mg/I as CaCO3 mg/l
Upper Control Limit 22.7 1004 134.3
Date
14 JUL 1999
29 JUL 1999
11 AUG 1999
25 AUG 1999
09 SEP 1999
21 SEP 1999
05 OCT 1999
19 OCT 1999
02 NOV 1999
17 NOV 1999
30 NOV 1999
14 DEC 1999
29 DEC 1999
8.0
7.9
7.5
7.7
7.5
7.6
8.0
8.0
7.7
8.0
8.0
7.8
8.1
688
689
687
687
686
694
682
684
693
685
681
680
681
115.1
116.0
109.2
108.3
108.7
109.9
112.9
113.4
110.8
113.7
109.0
109.4
119.3
8.4
8.4
8.3
8.4
8.2
8.4
8.3
8.4
8.4
8.4
8.4
8.4
8.4
4602.9
4606.5
4608.7
4614.5
4612.5
.4605.9
4606.1
4606.8
4604.5
4603.0
4601:7
4602.5
4601.7
* Values Exceed Upper Control Limit
Negative U308 Grades Indicate Less Than Detection Limit.
5MW47B
184

N RGOEQ2REP
COGEMA Mining Inc.
CHRISTENSEN RANCH
PERIMETER ORE ZONE MONITOR WELLMine Unit 5
2nd Half, 1999Well I.D. 5MW48
Water Quality Specific Total PiezometricParameters Chloride Conductance Alkalinity pH Uranium Elevation
Units mg/l p mho/cm mg/l as CaCO 3 mg/I msl
Upper Control Limit 22.7 1004 134.3
Date
13 JUL 1999
28 JUL 1999
10 AUG 1999
25 AUG 1999
08 SEP 1999
21 SEP 1999
05 OCT 1999
19 OCT 1999
02 NOV 1999
16NOV 1999
30 NOV 1999
14 DEC 1999
28 DEC 1999
8.7
8.4
8.2
8.0
8.1
8.8
8.8
11.1
9.2
9.7
9.8
10.1
9.3
684
690
682
685
676
660
670
570
647
637
632
624
631
121.9
121.8
117.9
111.7
112.8
112.4
132.8
218.4
150.8
162.2
161:2
164.2
155.8
8.4
8.3
8.3
8.4
8.4
8.4.
8.5
8.5
8.3
8.4
8.4
8.4
8.4
4596.7
4601.8
4599.8
4608.5
4608.0
4598.8
4599.8
45954
4587
4587.3
4585.4
4584.0
4584.3
*
*
*
*
*
*
* Values Exceed Upper Control Limit
Negative U308 Grades Indicate Less Than Detection Limit.
5MW48
185

NRCOEQ2REP
COGEMA Mining Inc.
CHRISTENSEN RANCH
PERIMETER ORE ZONE MONITOR WELLMine Unit 5
2nd Half,1999Well I.D. 5MW49
Water Quality Specific Total PiezometricParameters Chloride Conductance Alkalinity pH Uranium Elevation
Units mg/i .t mho/cm mg/1 as CaCO 3 mg/1 msl
Upper Control Limit 22.7 1004 134.3
Date
14 JUL 1999
29 JUL 1999
11 AUG 1999
25 AUG 1999
09 SEP 1999
21 SEP 1999
05 OCT 1999
19 OCT 1999
02 NOV 1999
17 NOV 1999
30 NOV 1999
14 DEC 1999
29 DEC 1999
8.0
8.0
7.6
7.6
7.7
7.7
8.1
8.2
7.9
7.9
8.1
7.9
8.1
690
693
688
689
688
696
682
685
691
685
680
683
680
114.8
114.6
109.0
112.6
110.6
110.2
111:9
114.2
111.7
112.4
109.0
110:1
110.7
8.4
8.4
8.3
8.3
8.2
8.3
8.3
8.4
8.4
8.4
8.4
814
8.4
4605.2
4607.6
4610-1
4617.8
4613.8
4607.3
4607.4
4607.6
4604.8
4603.0y
4602.0
4602.6
4601.6
* Values Exceed Upper Control Limit
Negative U308 Grades Indicate Less Than Detection Limit.
5MW49
186

NRCDEQ2REP
COGEMA Mining Inc.
CHRISTENSEN RANCH
Mine Unit 5 PERIMETER ORE ZONE MONITOR WELL J
2nd Half,1999Well I.D. 5MW50
Water Quality Specific Total PiezometricParameters Chloride Conductance Alkalinity pH Uranium Elevation
Units mg/I R mho/cm mg/l as CaCO 3 mg/l msl
Upper Control Limit 22.7 1004 134.3
Date
13 JUL 1999
28 JUL 1999
10 AUG 1999
25 AUG 1999
08 SEP 1999
21 SEP 1999
05 OCT 1999
19 OCT 1999
02 NOV 1999
16 NOV 1999
'30 NOV 1999
14 DEC 1999
28 DEC 1999
8.7
8.4
7.8
8.1
8.4
8.2
8.1
8.4
8.3
8.5
8.4
8.5.
8.4
685
699
687
692
696
700
697
694
694
691
682
670
672
116.6
114.8
108.5
107.2
111.4
111.3
114.3
114.0
113.0
112.3
109.3
108.0
106.2
8.4
8.3
8.3
8.3
8.5
8.4
8.4
8.5
8.4
8.4
8.4
8.4
8.4
4596.8
460i.0
4599.6
4606.4
4607.3
4596.9
4597.3
4594I
4588.1
4588.1
4586.3
4585.0
4585.4
* Values Exceed Upper Control Limit
Negative U308 Grades Indicate Less Than Detection Limit.
5MW50
187

NRCDEQ2REP
COGEMA Mining Inc.
CHRISTENSEN RANCH
Mine Unit 5 PERIMETER ORE ZONE MONITOR WELL
Well I.D. 5MW51 2nd Half, 1999
Water Quality Specific Total PiezometricParameters Chloride Conductance Alkalinity pH Uranium Elevation
Units mg/1 g. mho/cm mg/I as CaCO 3 mg/l msl
Upper Control Limit 22.7 1004 134.3
Date
14 JUL 1999
29 JUL 1999
11 AUG 1999
25 AUG 1999
09 SEP 1999
21 SEP 1999
05 OCT 1999
19 OCT 1999
02 NOV 1999
17 NOV 1999
30,NOV 1999
14 DEC 1999
29 DEC 1999
8.0
7.8
7.6
8.1
7.5
7.6
8.1
8.0
7.8
7.9
7.9
8.2
8.0"
690
694
689
689
690
696
690
682
690
687
681
681
682
113.6
113.7
108.9
106.2
108.6
109.5
112.5
112.2
111.1
112.0
108.5
114.2
109.7
8.3
8.4
8.2
8.2
8.1
8.3
8.3
8.3
8.3
8.3
8.4
8.3'
8.3
4608.7
4610.5
4612.2
4617.7
4616.2
4611.0
4610.3
4610.2
4608.3
4606.8
4605.3
4605.9
4605.4
* Values Exceed Upper Control Limit
Negative U308 Grades Indicate Less Than Detection Limit.
5MW51
188

NRCDEQ22REP
COGEMA Mining Inc.
CHRISTENSEN RANCH
Mine Unit 5 PERIMETER ORE ZONE MONITOR WELL
Well I.D. 5MW52 2nd Half,1999
Water Quality Specific Total PiezometricParameters Chloride Conductance Alkalinity pH Uranium Elevation
Units mg/l gt mho/cm mg/l as CaCO 3 mg/I msl+
Upper Control Limit 22.7 1004 134.3
Date
13 JUL 1999
28 JUL 1999
10 AUG 1999
25 AUG 1999
08 SEP 1999
21 SEP 1999
05 OCT 1999
19 OCT 1999
02 NOV 1999
16 NOV 1999
130 NOV 1999
14 DEC 1999
28 DEC 1999
9.3
9.1
8.8
9.1
9.3
8.8
9.0
9.1
9.1
9.0
9.0
8.5
8.7
696
707
704
701
710
707
702
702
703
701
694
685
684
119.6
118.6
112.2
110.9
118.9
111.6
119.1
116.0
116.2
115.3
116.8
110.3
112.8
8.4
8.2
8.3
8.2
* 8.4
8.3
8.3
8.5
8.3
8.3
8.4:
8.4
8.3
4595.1
4602.1
4599.0
4604.7
4608.1
4599.2
4598.9:14591.8
4589.9
4588.9
4589.2
* Values Exceed Upper Control Limit
Negative U308 Grades Indicate Less Than Detection Limit.
5MW52
189

NRCDEQ2REP
COGEMA Mining Inc.
CHRISTENSEN RANCH
Mine Unit 5 PERIMETER ORE ZONE MONITOR WELL
Well I.D. 5MW532nd Half,1999
Water Quality Specific Total PiezometricParameters Chloride Conductance Alkalinity pH Uranium Elevation
Units mg/l gi mho/cm mg/l as CaCO3 mg/l msl
Upper Control Limit 22.7 1004 134.3
Date
14 JUL 1999
29 JUL 1999
11 AUG 1999
25 AUG 1999
09 SEP 1999
21 SEP 1999
05 OCT 1999
19 OCT 1999
03 NOV 1999
17 NOV 1999
30 NOV 1999
14 DEC 1999
29 DEC 1999
8.0
8.1
7.6
8.0
7.7
7.7
8.2
8.2
8.1
8.2
8.4
8.4
8.8
693
694
692
692
695
698
689
686
693
693
690
684
683
114.1
115.8
109.1
108.2
111.6
110.2
112.1
112.6
114.1
113.4
110.7-
111.6
115.1
8.4
8.4
8.3
8.3
8.2
8.3
8.3
8.4
8.4
8.3
8.4
8.3
8.3
4609.9
4610.7
4612.6
4617.4
4616.6
4610.8
4610.1
4609.8
4607.8
4606.4,
4605.1.
4605.4
4604.9
* Values Exceed Upper Control Limit
Negative U308 Grades Indicate Less Than Detection Limit.
5MW53
190

N RCDE02REP
COGEMA Mining Inc.
CHRISTENSEN RANCH
Mine Unit 5 PERIMETER ORE ZONE MONITOR WELL
Well I.D. 5MW54 2nd Half, 1999
Water Quality Specific Total PiezometricParameters Chloride Conductance Alkalinity pH Uranium Elevation
Units mg/l pi mho/cm mg/i as CaCO, mg/I msl
Upper Control Limit 22.7 1004 134.3
Date
13 JUL 1999
28 JUL 1999
10 AUG 1999
25 AUG 1999
08 SEP 1999
21 SEP 1999
05 OCT 1999
19 OCT 1999
02 NOV 1999
16 NOV 1999
30 NOV 1999
14 DEC 1999
28 DEC 1999
17.8
21.2
18.6
19.3
21.3
19.9
19.6
20.5
19.8
19.2
19.0
17.9
17.6
749
782
769
773
783
785
781
774
772
766
752
740
739
126.0
126.5
119.3
121.5
126.8
125.1
125.1
127.1
124.6
122.5
121.7
118.1
118.5
8.4
8.2
8.3
8.2
8.3
8.4
8.3
8.5
8.4
8.4
8.4
8.5
8.4
4595.9
4602.8
4599.8
4604.9
4609.3
4600.0
4599.3
45971
4594.
4593.5
4591.3
4590.5
4590.4
* Values Exceed Upper Control Limit
Negative U308 Grades Indicate Less Than Detection Limit.
5MW54
191

NR COEQ2REP
COGEMA Mining Inc.
CHRISTENSEN RANCH
PERIMETER ORE ZONE MONITOR WELLMine Unit 5
Well ID. 5MW55 2nd Half,1999
Water Quality Specific Total PiezometricParameters Chloride Conductance Alkalinity pH Uranium Elevation
Units mg/i pt mho/cm mg/l as CaCO3 mg/i msl
Upper Control Limit 22.7 1004 134.3
Date
14 JUL 1999
29 JUL 1999
11 AUG 1999
25 AUG 1999
09 SEP 1999
21 SEP 1999
05 OCT 1999
19 OCT 1999
03 NOV 1999
17 NOV 1999
30 NOV 1999
14 DEC 1999
29 DEC 1999
8.4
8.6
7.9
8.3
7.9
8.1
8.6
8.7
8.4
8.2
8.5
8.4
8.4
692
693
691
692
693
697
689
688
690
690
687
684
682
112.8
114.4
107.5
106.4.
109.1
109.2
111.7
112.2
113.0
111.9
108:2 :'
107.2
109.1
8.3
8.4
8.2
8.3
8.2
8.3
8.3
8.3
8.4
8.3
8.4
8.3
8.3
4609.6
4609.1
4610.7
4616.1
4615.2
4607.3
4606.9
4606.2
4603.8
4602.4
•4600.9.
4601.1
4600.5
* Values Exceed Upper Control Limit
Negative U308 Grades Indicate Less Than Detection Limit.
5MW55
192

NRCDE02REP
COGEMA Mining Inc.
CHRISTENSEN RANCH
Mine Unit 5 PERIMETER ORE ZONE MONITOR WELL
22nd Half, 1999
Well I.D. 5MW56
Water Quality Specific Total PiezometricParameters Chloride Conductance Alkalinity pH Uranium Elevation
Units mg/i R mho/cm mg/i as CaCO 3 mg/l msl
Upper Control Limit 22.7 1004 134.3
Date
13 JUL 1999
28 JUL 1999
10 AUG 1999
25 AUG 1999
08 SEP 1999
21 SEP 1999
05 OCT 1999
19 OCT 1999
02 NOV 1999
16 NOV 1999
30 NOV 1999
14 DEC 1999
28 DEC 1999
8.8
8.6
8.1
8.3
8.2
8.4
8.2
8.5
8.6
8.6
8.8
8.3
8.4
693
703
703
695
694
701
696
689
702
700
697
688
691
115.8
113.2
108.3
106.6
107.3
110.6
111.1
111.8
111.2
112.3
112.4
108.1
108.0
8.5
8.3
8.4
8.3
8.4
8.4
8.3
8.5
8.4
8.4
8.4
8.5
8.4
4590.1
4601.5
4598.2
4603.1
4607.7
4601.6
4601.3
4599,1
4596
4595.7
4594.1
4593.3
4593.3
* Values Exceed Upper Control Limit
Negative U308 Grades Indicate Less Than Detection Limit.
5MW56
193

NRCDE02REP
COGEMA Mining Inc.
CHRISTENSEN RANCH
Mine Unit 5 PERIMETER ORE ZONE MONITOR WELL
0Well I.D. 5MW57 2nd Half, 1999
Water Quality Specific Total PiezometricParameters Chloride Conductance Alkalinity pH Uranium Elevation
Units mg/1 pi mho/cm mg/l as CaCO3 mg/l msl
Upper Control Limit 22.7 1004 134.3
Date
14 JUL 1999
29 JUL 1999
11 AUG 1999
25 AUG 1999
09 SEP 1999
21 SEP 1999
05 OCT 1999
19 OCT 1999
03 NOV 1999
17 NOV 1999
30 NOV 1999
14 DEC 1999
29 DEC 1999
8.4
8.4
7.9
8.1
8.0
8.4
8.5
8.4
8.4
8.3
8.5
8.4
8.5
696
698
695
694
696
704
691
691
695
695
688
687
688
112.3
113.2
108.1
106.8
108.5
113.0
110.5
111.0
112.6
111.1
108.8
108.3
109.0
8.4
8.4
8.2
8.3
8.2
8:3
8.2
8.3
8.4
8.3
8.4
8.3
8.3
4609.3
4608.7
4610.5
4614.5
4614.9
4607.0
4605.9
4605.5
4603.1
4601.8
4600.2"
4600.1
4599.6
* Values Exceed Upper Control Limit
Negative U308 Grades Indicate Less Than Detection Limit.
5MW57
194

•I•f•PNg•PP
COGEMA Mining Inc.
CHRISTENSEN RANCH
Mine Unit 5 PERIMETER ORE ZONE MONITOR WELL EWell I.D. 5MW58 2nd Half,1999
Water Quality Specific Total PiezometricParameters Chloride Conductance Alkalinity pH Uranium Elevation
Units mg/I g mho/cm mg/I as CaCO3 mg/l msl
Upper Control Limit 22.7 1004 134.3
Date
14 JUL 1999 8.7 692 113.9 8.5 4589.1
28 JUL 1999 9.0 697 113.9 8.4 4602.0
10 AUG 1999 8.6 693 108.5 8.3 4600.7
25 AUG 1999 8.2 691 106.9 8.4 4604.0
09 SEP 1999 8.4 696 110.5 8.3 4608.0
21 SEP 1999 9.0 693 115.0 8.4 4603.0
05 OCT 1999 8.9 691 115.9 8.4 4602.5
19 OCT 1999 8.6 694 111.4 8.6 4601..,
02 NOV 1999 8.5 700 110.6 8.5 4598. t
16 NOV 1999 8.6 695 112.3 8.5 4598.1
30 NOV 1999 8.6 690 107:9 8.5 4596.2
14 DEC 1999 8.5 690 108.3 8.5 4595.4
28 DEC 1999 8.6 686 110.6 8.5 4595.3
* Values Exceed Upper Control Limit 5MW58
Negative U308 Grades Indicate Less Than Detection Limit.
195

NRCDEQ2REP
COGEMA Mining Inc.
CHRISTENSEN RANCH
Mine Unit 5 PERIMETER ORE ZONE MONITOR WELL
Well I.D. 5MW59 2nd Half,1999
Water Quality Specific Total PiezometricParameters Chloride Conductance Alkalinity pH Uranium Elevation
Units mg/l [t mho/cm mg/l as CaCO 3 mg/I msl
Upper Control Limit 22.7 1004 134.3
Date
14 JUL 1999
29 JUL 1999
11 AUG 1999
25 AUG 1999
09 SEP 1999
21 SEP 1999
05 OCT 1999
19 OCT 1999
03 NOV 1999
17 NOV 1999
30 NOV 1999
14 DEC 1999
29 DEC 1999
8.5
8.5
8.1
8.0
8.1
8.6
8.6
8.6
8.4
8.3
8.4
.8.5
8.5
696
697
693
692
695
701
689
690
695
694
687
688
687
112.7
114.1
107.8
105.5
109.9
113.7
112.1
112.5
112.5
110.8
,108.7
108.4
108.5
8.4
8.5
8.3
8.3
8.2
8.3
8.3
8.4
8.5
8.4
8.5
8.3
8.4
4605.7
4606.4
4607.4
4610.4
4612.4
4603.6
4602.7
4601.7
4599.5
4598.4
4596.7
4596.4
4595.9
* Values Exceed Upper Control Limit
Negative U308 Grades Indicate Less Than Detection Limit.
5MW59
196

NRCDEQ2REP
COGEMA Mining Inc.
CHRISTENSEN RANCH
Mine Unit 5 PERIMETER ORE ZONE MONITOR WELL
Well I.D. 5MW60 2nd Half,1999
Water Quality Specific Total PiezometricParameters Chloride Conductance Alkalinity pH Uranium Elevation
Units mg/l ji mho/cm mg/l as CaCO3 mg/i msl
Upper Control Limit 23.7 779 191.3
Date
14 JUL 1999
28 JUL 1999
10 AUG 1999
25 AUG 1999
09 SEP 1999
21 SEP 1999
05 OCT 1999
19 OCT 1999
02 NOV 1999
16 NOV 1999
30 NOV 1999
14 DEC 1999
28 DEC 1999
10.2
10.4
10.1
9.7
9.1
9.4
9.3
9.6
9.4
9.6
9.5
9.3
9.4
616
607
607
674
733
725
741
755
764
757
758
779
787
215.4
213.5
201.0
187.0
178.5
183.1
187.5
186.4
184.5
186.9
177.0
176.3
* 185.5
*
*
8.2
8.3
8.3
8.1
8.1
8.2
8.3
8.3
8.2
8.2
8.3
8.2
8.3
4588.5
4602.3
4601.7
4604.5
4608.1
4604.3
4603.6
46021
4600.
4599.5
4597.9
4596.8
4596.9
* Values Exceed Upper Control Limit
Negative U308 Grades Indicate Less Than Detection Limit.
5MW60
197

NR.CDEQ2REP
COGEMA Mining Inc.
CHRISTENSEN RANCH
Mine Unit 5 PERIMETER ORE ZONE MONITOR WELL
Well I.D. 5MW612nd Half,1999
Water Quality Specific Total PiezometricParameters Chloride Conductance Alkalinity pH Uranium Elevation
Units mg/l jt mho/cm mg/1 as CaCO3 mg/i msl
Upper Control Limit 22.7 1004 134.3
Date
14 JUL 1999
29 JUL 1999
I1 AUG 1999
25 AUG 1999
09 SEP 1999
21 SEP 1999
05 OCT 1999
19 OCT 1999
03 NOV 1999
17 NOV 1999
30 NOV 1999
14 DEC 1999
29 DEC 1999
8.6
8.5
8.1
8.3
8.1
8.1
8.6
8.6
8.5
8.4
8.4
8.6
8.7
694
697
691
691
695
700
690
692
693
693
686
687
686
114.2
113.7
108.3
107.3
109.7
107.3
111.5
113.4
112.9
111.4
1083
109.2
112.1
8.2
8.3
8.2
8.2
8.0
8.2
8.2
8.4
8.4
8.3
8.3
8.2
8.2
4603.3
4608.5
4609.5
4611.4
4614.2
4608.7
4608.1
4607.0
4605.6
4604.7
4602.9
4602.4
4602.0
* Values Exceed Upper Control Limit
Negative U308 Grades Indicate Less Than Detection Limit.
5MW61
198

NRJCDFO2RFP
COGEMA Mining Inc.
CHRISTENSEN RANCH
Mine Unit 5 PERIMETER ORE ZONE MONITOR WELL I
Well I.D. 5MW62 2nd Half,1999
Water Quality Specific Total PiezometricParameters Chloride Conductance Alkalinity pH Uranium Elevation
Units mg/i ýt mho/cm mg/l as CaCO3 mg/1 mnsl
Upper Control Limit 22.7 1004 134.3
Date
14 JUL 1999 9.9 853 128.2 8.2 4588.0
28 JUL 1999 9.4 816 122.8 8.2 4601.7
11 AUG 1999 9.0 801 116.4 8.2 4602.5
25 AUG 1999 9.1 820 1173 8.2 4604.5
09 SEP 1999 10.5 856 125.5 8.1 4607.7
21 SEP 1999 10.2 867 128.6 8.1 4604.2
05 OCT 1999 10.7 884 136.1 * 8.1 4603.8
20 OCT 1999 11.3 896 141.0 * 8.2 4602.1
02 NOV 1999 11.2 909 140.6 * 8.0 4600.
16 NOV 1999 11.6 907 "145.3 * 8.1 4599.8
30 NOV 1999 11.5 905 139.4 * 8.1 4598.4
14 DEC 1999 11.4 908 141.5 8.0 4597.6
28 DEC 1999 11.8 900 143.7 * 8.0 4597.5
* Values Exceed Upper Control Limit 5MW62
Negative U308 Grades Indicate Less Than Detection Limit.
199

NRCDEQ2REP
COGEMA Mining Inc.
CHRISTENSEN RANCH
Mine Unit 5 PERIMETER ORE ZONE MONITOR WELL
Well I.D. 5MW63 2nd Half,1999
Water Quality Specific Total PiezometricParameters Chloride Conductance Alkalinity pH Uranium Elevation
Units mg/I gi mho/cm mg/l as CaCO3 mg/I msl
Upper Control Limit 22.7 1004 134.3
Date
13 JUL 1999
28 JUL 1999
10 AUG 1999
25 AUG 1999
08 SEP 1999
21 SEP 1999
05 OCT 1999
19 OCT 1999
02 NOV 1999
16 NOV 1999
30 NOV 1999
14 DEC 1999
28 DEC 1999
9.3
8.8
8.3
8.4
8.2
8.2
8.4
8.8
9.3
8.9
8.8
8.8
8.9
678
689
690
687
685
693
688
691
695
687
679
675
682
113.6
112.4
107.0
105.3
107.1
105.3
109.3
110.0
117.6
110.1
-107.8
,106.4
111.2
8.5
8.2
8.3
8.3
8.4
8.4
8.2
8.4
8.3
8.3
8.4
8.4
8.3
4600.9
4608.1
4609.6
4610.9
4613.4
4609.4
4608.7
4608.0
4606.5
4605.6
4604:2
4603,6
4603,2
* Values Exceed Upper Control Limit
Negative U308 Grades Indicate Less Than Detection Limit.
5MW63
200

NRCOE02REP
COGEMA Mining Inc.
CHRISTENSEN RANCH
PERIMETER ORE ZONE MONITOR WELLMine Unit 5
Well I.D. 5MW64 2nd Half, 1999
Water Quality Specific Total PiezomeParameters Chloride Conductance Alkalinity pH Uranium Elevati
tricon
Units mg/l p mho/cm mg/l as CaCO 3 mg/l msl
Upper Control Limit 22.7 1004 134.3
Date
14 JUL 1999
28 JUL 1999
11 AUG 1999
25 AUG 1999
09 SEP 1999
21 SEP 1999
05 OCT 1999
20 OCT 1999
02 NOV 1999
16 NOV 1999
30 NOV 1999
14 DEC 1999
28 DEC 1999
8.8
9.0
8.7
9.0
8.7
8.8
9.0
9.1
9.3
9.2
9.7
9.2
9.1
721
730
728
730
736
730
731
733
740
738
731
729
727
112.9
114.6
109.1
109.9
109.0
107.8
115.3
113.2
113.4
112.0
116.4
109.3
110.6
8.4
8.4
8.3
8.3
8.2
8.3
83
8.6
8.3
8.4
8.4
8.3
8.4
4591.1
4603.6
4605.4
4606.3
4608.9
4606.3
4606.1
4605.1
4603.
4602.8
4601.4
4600.7
4600.4
* Values Exceed Upper Control Limit
Negative U308 Grades Indicate Less Than Detection Limit.
5MW64
201

NPRCDEQ2REP
COGEMA Mining Inc.
CHRISTENSEN RANCH
Mine Unit 5 PERIMETER ORE ZONE MONITOR WELL
2nd Half, 1999Well I.D. 5MW65
Water Quality Specific Total PiezometricParameters Chloride Conductance Alkalinity pH Uranium Elevation
Units mg/i [i mho/cm mg/i as CaCO3 mg/1 msl
Upper Control Limit 24.9 734 128.1
Date
13 JUL 1999
28 JUL 1999
10 AUG 1999
25 AUG 1999
08 SEP 1999
21 SEP 1999
05 OCT 1999
19 OCT 1999
02 NOV 1999
16 NOV 1999
30 NOV 1999
14 DEC 1999
28 DEC 1999
10.0
9.9
9.0
9.3
9.1
9.0
9.4
9.8
9.7
10.0
9.7
9.8
9.7
699
709
702
702
698
705
688
697
701
692
689
683
687
114.9
114.0
109.4
108.1
109.8
106.6
115.0
11 0.0
109.9
110.1
'106.3
106.1
106.2
8.4
8.1
8.2
8.2
8.3
8.3
8.2
8.3
8.2
8.2
8.4
8.4
8.3
4601-4
4609.1
4611.4
4612.4
4614.3
4611.6
4611.2
4610.5
4609.3
4608.4
4607.1
4606.7
4606.1
* Values Exceed Upper Control Limit
Negative U308 Grades Indicate Less Than Detection Limit.
5MW65
202

NRCDEQ2REP
COGEMA Mining Inc.
CHRISTENSEN RANCH
Mine Unit 5 PERIMETER ORE ZONE MONITOR WELL
2nd Half, 1999Well I.D. 5MW66
Water QualityParameters
Specific
Chloride ConductanceTotal
Alkalinity pH
Piezometric
Uranium Elevation
mg/1 mslUnits mg/1 pt mho/cm mg/l as CaCO3
Upper Control Limit 22.7 1004 134.3
Date
14 JUL 1999 8.9 770
28 JUL 1999 9.1 775
11 AUG 1999 8.8 773
25 AUG 1999 9.4 774
09 SEP 1999 11.1 782
21 SEP 1999 9.7 781
05 OCT 1999 8.9 779
20 OCT 1999 9.0 777
02 NOV 1999 8.9 782
16 NOV 1999 8.9 778
30 NOV 1999 8.7 769
14 DEC 1999 8.7 773
28 DEC 1999 8.7 764
* Values Exceed Upper Control Limit
Negative U308 Grades Indicate Less Than Detection Limit.
105.4
107.8
102.9
105.1
114.1
105.8
105.3
104.3
103.3
102.8
99.6
100.2
100.5
8.2
8.3
8.1
8.2
8.1
8.2
8.2
8.4
8.2
8.3
8.3
8.3
8.2
4594.5
4605.1
4607.3
4607.8
4610.3
4608.5
4607.9
4607"2
4605.
4605.1
4603.7
4603.1
4602.6
5MW66
203

NRCDEQ2REP
COGEMA Mining Inc.
CHRISTENSEN RANCH
PERIMETER ORE ZONE MONITOR WELLMine Unit 5
2nd Half,1999Well I.D. 5MW67
Water Quality Specific Total PiezometricParameters Chloride Conductance Alkalinity pH Uranium Elevation
Units mg/I g. mho/cm mg/i as CaCO3 mg/I msl
Upper Control Limit 22.7 1004 134.3
Date
13 JUL 1999
28 JUL 1999
10 AUG 1999
25 AUG 1999
08 SEP 1999
21 SEP 1999
05 OCT 1999
19 OCT 1999
02 NOV 1999
16 NOV 1999
30 NOV 1999
14 DEC 1999
28 DEC 1999
7.6
7.2
6.8
7.0
7.3
7.1
6.9
7.2
7.3
7-4
7.3
7.3
7.3
852
846
843
840
832
848
842
849
842
849
841
834
837
93.4
92.3
88.4
86.5
93.5
87.2
90.1
90.7
92.7
91.5
88.4
88.7
88.1
8.2
8.1
8.1
8.1
8.2
8.1
8.1
8.3
8.1
8.2
8.3
8.2
8.2
4605.1
4610.8
4613.1
4614.1
4615.3
4614.0
4613.6
4613.0
4612.0
4611.1
4610.3
4609.8
4609.0
* Values Exceed Upper Control Limit
Negative U308 Grades Indicate Less Than Detection Limit.
5MW67
204

NRCDEQ2REP
COGEMA Mining Inc.
CHRISTENSEN RANCH
Mine Unit 5 PERIMETER ORE ZONE MONITOR WELL
Well I.D. 5MW692nd Half, 1999
Water Quality Specific Total PiezometricParameters Chloride Conductance Alkalinity pH Uranium Elevation
Units mg/l pt mho/cm mg/i as CaCO 3 mg/l msl
Upper Control Limit 22.7 1004 134.3
Date
13 JUL 1999
29 JUL 1999
10 AUG 1999
25 AUG 1999
08 SEP 1999
21 SEP 1999
05 OCT 1999
19 OCT 1999
02 NOV 1999
16 NOV 1999
30 NOV 1999
14 DEC 1999
28 DEC 1999
9.2
8.8
8.0
8.2
7.7
8.1
8.4
8.8
9.1
8.9
8.8
8.7
8.9
701
696
719
735
763
746
697
698
700
694
687
686
682
113.1
110.6
98.7
95.9
94.4
98.1
108.7
109.6
111.3
109.3
106.9
107.2
107.6
8.6
8.7
8.6
8.5
8.7
8.5
8.5
8.7
8.5
8.5
8.6
8.6
8.5
4607.1
4611.4
4613.6
4614.4
4615.7
4615.1
4614.5
4614.1
4613.
4612.7
4612.0
4611.4
4610.8
* Values Exceed Upper Control Limit
Negative U308 Grades Indicate Less Than Detection Limit.
5MW69
205

NFRCDEQ2REP
COGEMA Mining Inc.
CHRISTENSEN RANCH
PERIMETER ORE ZONE MONITOR WELLMine Unit 6
2nd Half, 1999Well I.D. 6MW17-2
Water Quality Specific Total PiezometricParameters Chloride Conductance Alkalinity pH Uranium Elevation
Units mg/1 pr mho/cm mg/l as CaCO3 mg/l msl
Upper Control Limit 20 1576 95.2
Date
08 JUL 1999
21 JUL 1999
03 AUG 1999
18 AUG 1999
30 AUG 1999
14 SEP 1999
28 SEP 1999
12 OCT 1999
26 OCT 1999
08 NOV 1999
23 NOV 1999
07 DEC 1999
20 DEC 1999
5.2
5.2
4.9
4.8
4.9
4.7
4.6
4.9
4.9
4.8
5.0
5.0
4.9
1329
1342
1317
1333
1322
1332
1339
1336
1324
1340
1323
1325
1330
72.3
71.0
65.6
67.6
69.0
66.7
66.1
69.0
•68.6
68:5
.70.3
.70.3
67.9
8.0
8.2
8.1
8.1
8.2
7.8
8.0
8.1
8.2
8.1
8.1
8.0
8.1
4580.3
4566.3
4565.9
4571.8
4568.8
4569.1
4576.1
4574.1
4573.0
4571.0
.4573.7.
4572.4.
4564.5
* Values Exceed Upper Control Limit
Negative U308 Grades Indicate Less Than Detection Limit.
6MW17-2
206

NRCDEQ2REP
COGEMA Mining Inc.
CHRISTENSEN RANCH
PERIMETER ORE ZONE MONITOR WELLMine Unit 6
2nd Half,1999Well I.D. 6MW19
Water QualityParameters
SpecificConductance
TotalAlkalinityChloride pH Uranium
PiezometricElevation
Units mg/l p mho/cm mg/l as CaCO 3 mg/l msl
Upper Control Limit 20 1576 95.2
Date
07 JUL 1999
21 JUL 1999
03 AUG 1999
18 AUG 1999
30 AUG 1999
14 SEP 1999
28 SEP 1999
12 OCT 1999
26 OCT 1999
08 NOV 1999
23 NOV 1999
07 DEC 1999
20 DEC 1999
6.2
6.2
5.5
5.7
5.5
5.5
5.8
6.0
5.7
5.6
5.5'
5.1
5.3
1467
1475
1452
1453
1443
1458
1450
1445
1439
1418
1353
1326
1353
72.6
71.9
68.0
67.8
67.4
67.2
70.5
72.9
69.4
68.6
74.1
69.9
70.0
8.0
8.2
8.0
8.0
8.2
7.8
8.0
8.0
8.1
8.0
81
8.1
8.2
4625.4
4616.8
4616.0
4616.5
4618.0
4618.4
4624.4
4624.
4621w
4619.8
4620.8
4618.6
4612.5
6MW19* Values Exceed Upper Control Limit
Negative U308 Grades Indicate Less Than Detection Limit.
207

NR.CDEQ2REP
COGEMA Mining Inc.
CHRISTENSEN RANCH
Mine Unit 6 PERIMETER ORE ZONE MONITOR WELL
0Well I.D. 6MW21 2nd Half, 1999
Water Quality Specific Total PiezometricParameters Chloride Conductance Alkalinity pH Uranium Elevation
Units mg/l [i mho/cm mg/1 as CaCO 3 mg/1 msl
Upper Control Limit 20 1576 95.2
Date
07 JUL 1999
21 JUL 1999
03 AUG 1999
18 AUG 1999
30 AUG 1999
14 SEP 1999
28 SEP 1999
12 OCT 1999
26 OCT 1999
28 OCT 1999
01 NOV 1999
08 NOV 1999
15 NOV 1999
22 NOV 1999
29 NOV 1999
06 DEC 1999
20 DEC 1999
6.0
5.4
4.9
4.9
4.9
4.8
6.5
18.4
32.2
29.2
30.9
25.6
21.6
17.3
15.3
12.2
10.5
1207
1306
1289
1285
1281
1300
1291
1489
* 1800
* 1746
* 1702
* 1555
* 1479
1421
1370
1356
1344
78.2
74.6
69.1
70.5
71.3
70.7
77.6
171.2 *
• 329.4 *
• 305.8 *
• 285.6
203.7 .*
170.9 *
143.6 *
133.6 *
110.7 *
108.3 *
8.2
8.3
8.1
8.1
8.2
7.9
8.1
7.8
7.1
7.3
7.6
7:7
7.9
7.9
8.0
7.9
8.0
-1
-1
-1
-1
-l
-1
4623.9
4624.1
4623.4
4624.6
4621.0
4626.6
4630.2
4632.0
4625.2
4618.5
4616.3
4614.9
4615.1
4615.1
4615.1
4614.1
4611.3
6MW21Values Exceed Upper Control Limit
Negative U308 Grades Indicate Less Than Detection Limit.
208

N R•nFO2RFP
COGEMA Mining Inc.
CHRISTENSEN RANCH
Mine Unit 6 PERIMETER ORE ZONE MONITOR WELL IWell I.D. 6MW23 2nd Half, 1999
Water Quality Specific Total PiezometricParameters Chloride. Conductance Alkalinity pH Uranium Elevation
Units mg/l ýi mho/cm mg/l as CaCO3 mg/l msl
Upper Control Limit 20 1576 95.2
Date
07 JUL 1999 5.5 1281 71.4 8.3 4620.3
21 JUL 1999 5.4 1291 76.0 8.4 4637.1
03 AUG 1999 4.9 1276 70.4 82 4642.1
18 AUG 1999 4.9 1277 72.5 8.2 4636.2
30 AUG 1999 4.9 1266 72.2 8.4 4627.7
14 SEP 1999 5.0 1285 74.0 8.0 4634.5
28 SEP 1999 5.0 1277 70.6 8.2 4634.5
12 OCT 1999 5.2 1279 75.4 8.2 4637j
26 OCT 1999 5.1 1259 73.0 8.3 46294
08 NOV 1999 5.5 1252 71.3 8.4 4616.8
23 NOV 1999 5.1 1245 72.7 8.4 4619.9
07 DEC 1999 5.1 1251 70.7 8.3 4616.1
20 DEC 1999 5.2 1262 70.4 8.4 4618.8
* Values Exceed Upper Control Limit 6MW23
Negative U308 Grades Indicate Less Than Detection Limit.
209

MrnPn9I•IP
COGEMA Mining Inc.
CHRISTENSEN RANCH
Mine Unit 6 PERIMETER ORE ZONE MONITOR WELL
SWell I.D. 6MW25 2nd Half,1999
Water Quality Specific Total PiezometricParameters Chloride Conductance Alkalinity pH Uranium Elevation
Units mg/l gi mho/cm mg/i as CaCO3 mg/l rnsl
Upper Control Limit 20 1576 95.2
Date
07 JUL 1999 5.9 1254 69.2 8.3 4617.5
21 JUL 1999 5.7 1251 71.6 8.4 4633.3
03 AUG 1999 5.5 1234 70.2 8.2 4636.8
18 AUG 1999 5.5 1231 70.2 8.1 4634.2
31 AUG 1999 5.2 1240 69.2 8.3 4622.8
14 SEP 1999 5.4 1236 69.5 8.0 4630.0
28 SEP 1999 5.4 1232 69.4 8.2 4630.7
12 OCT 1999 5.6 1231 72.8 8.2 4636.5
26 OCT 1999 5.6 1233 72.1 8.1 4632.0
09 NOV 1999 5.7 1227 .72.1 8.1 4627.2
23 NOV 1999 5.8 1221 72.7 8.2. 4632.4
07 DEC 1999 6.0 1221 73.8 8.1' 4626.8
20 DEC 1999 5.8 1228 69.3 8.0 4629.8
* Values Exceed Upper Control Limit 6MW25
Negative U308 Grades Indicate Less Than Detection Limit.
210
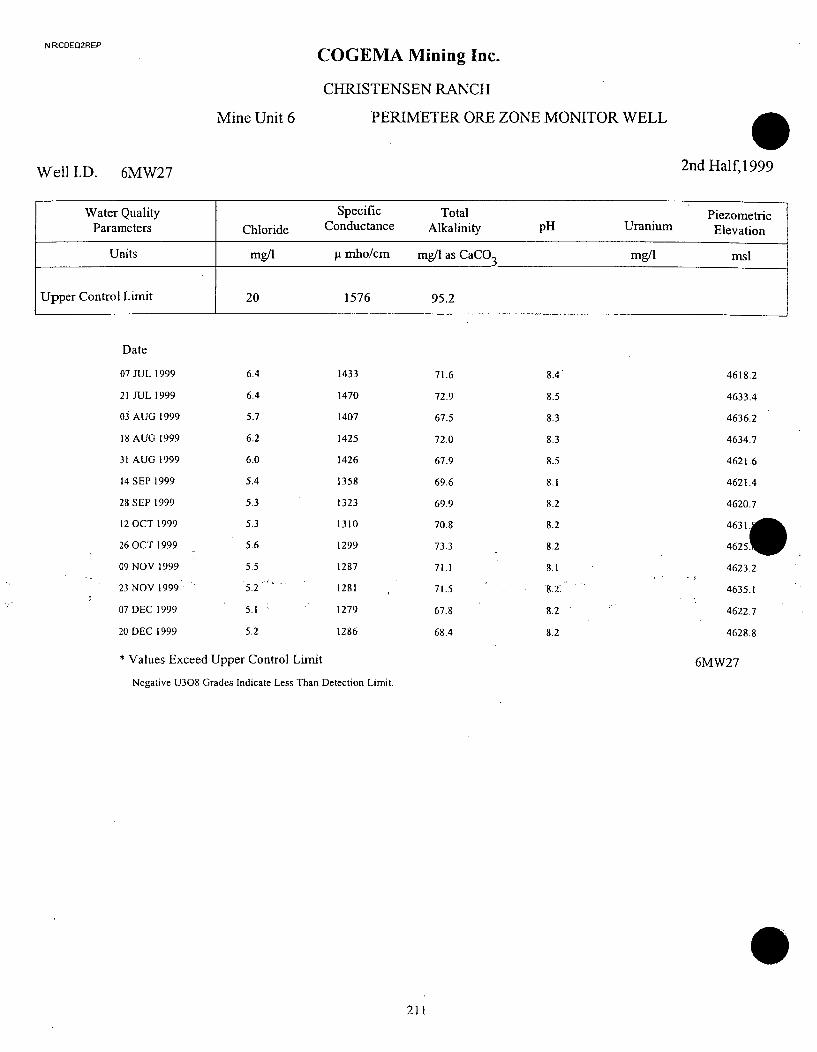
N RCDE02REP
COGEMA Mining Inc.
CHRISTENSEN RANCH
Mine Unit 6 PERIMETER ORE ZONE MONITOR WELL
Well I.D. 6MW27 2nd Half, 1999
Water Quality Specific Total PiezometricParameters Chloride Conductance Alkalinity pH Uranium Elevation
Units mg/l R mho/cm mg/l as CaCO3 mg/I msl
Upper Control Limit 20 1576 95.2
Date
07 JUL 1999
21 JUL 1999
03 AUG 1999
18 AUG 1999
31 AUG 1999
14 SEP 1999
28 SEP 1999
12 OCT 1999
26 OCT 1999
09 NOV 1999
23 NOV 1999
07 DEC 1999
20 DEC 1999
6.4
6.4
5.7
6.2
6.0
5.4
5.3
5.3
5.6
5.5
5.2
5.1
5.2
1433
1470
1407
1425
1426
1358
1323
1310
1299
1287
1281
1279
1286
71.6
72.9
67.5
72.0
67.9
69.6
69.9
70.8
73.3
71.1
71.5
67.8
68.4
8.4
8.5
8.3
8.3
8.5
8.1
8.2
8.2
8.2
8.1
8.2
8.2
8.2
4618.2
4633.4
4636.2
4634.7
4621.6
4621.4
4620.7
4631,
4625 .1
4623.2
4635.1
4622.7
4628.8
* Values Exceed Upper Control Limit
Negative U308 Grades Indicate Less Than Detection Limit.
6MW27
211

NrCDEQ2REP
COGEMA Mining Inc.
CHRISTENSEN RANCH
Mine Unit 6 PERIMETER ORE ZONE MONITOR WELL
Well I.D. 6MW29 2nd Half, 1999
Water Quality Specific Total PiezometricParameters Chloride Conductance Alkalinity pH Uranium Elevation
Units mg/1 pi mho/cm mg/i as CaCO 3 mg/l msl
Upper Control Limit 20 1576 95.2
Date
07 JUL 1999
21 JUL 1999
03 AUG 1999
18 AUG 1999
31 AUG 1999
14 SEP 1999
28 SEP 1999
12 OCT 1999
27 OCT 1999
09 NOV 1999
23 NOV 1999
07 DEC 1999
.20 DEC 1999
5.7
5.4
5.0
4.8
5.0
5:8
5.3
5.1
5.3
5.3
5.6
5.4
5.4
1295
1292
1288
1298
1286
1281
1274
1299
1293
1294
1286
1283
1297
65.8
71.8
67.8
67.3
71.5
66.3
65.4
70.0
69.8
69.4
71.1'
. 73.7
72.9
8.6
8.4
8.2
8.6
8.6
8.5
8.4
8.4
8.3
8.3
8.3
8.1
8.0
4619.7
4634.0
4645.4
.4637.7
4625.8
4613.1
4617.9
4631.4
4619.5
4619.0
4642.4,
4616.6.
4629.9
* Values Exceed Upper Control Limit
Negative U308 Grades Indicate Less Than Detection Limit.
6MW29
212

NJ~CrlFf2RFPP
COGEMA Mining Inc.
CHRISTENSEN RANCH
Mine Unit 6 PERIMETER ORE ZONE MONITOR WELL EWell I.D. 6MW31 2nd Half,1999
Water Quality Specific Total PiezometricParameters Chloride Conductance Alkalinity pH Uranium Elevation
Units mg/l g mho/cm mg/l as CaCO3 mg/1 msl
Upper Control Limit 20 1576 95.2
Date
08 JUL 1999 5.6 1282 71.6 8.1 4622.5
22 JUL 1999 5.1 1294 70.6 8.3 4621.5
03 AUG 1999 5.0 1309 67.2 8.0 4617.3
19 AUG 1999 4.8 1283 67.8 8.3 4612.4
01 SEP 1999 5.0 1283 68.5 8.2 4612.3
15 SEP 1999 4.9 1310 67.1 8.2 4612.6
29 SEP 1999 4.9 1304 66.7 8.1 4615.5
13 OCT 1999 5.2 1317 69.3 8.3 4620.j
27 OCT 1999 5.2 1291 69.5 8.2 4612.
09 NOV 1999 5.1 1289 69.1 8.1 4612.1
23 NOV 1999 5.1 . 1273 70.7 8.2 4618.2
08 DEC 1999 .5.0 1282 68.4 8:2 4612.8
20 DEC 1999 5.2 1294 67.1 8.2 4600.3
• Values Exceed Upper Control Limit 6MW31
Negative U308 Grades Indicate Less Than Detection Limit.
213

NR.CDEQ2REP
COGEMA Mining Inc.
CHRISTENSEN RANCH
Mine Unit 6 PERIMETER ORE ZONE MONITOR WELL
Well I.D. 6MW33 2nd Half, 1999
Water Quality Specific Total PiezometricParameters Chloride Conductance Alkalinity pH Uranium Elevation
Units mg/l V mho/cm mg/i as CaCO 3 mg/l msl
Upper Control Limit 20 1576 95.2
Date
08 JUL 1999
22 JUL 1999
04 AUG 1999
19 AUG 1999
01 SEP 1999
15 SEP 1999
29 SEP 1999
13 OCT 1999
27 OCT 1999
08 NOV 1999
22 NOV 1999
08 DEC 1999
20 DEC 1999
5.6
5.3
4.9
4.7
5.0
4.9
4.9
5.3
5.1
5.2
5.0
5.3
5.0
1265
1270
1280
1273
1272
1300
1292
1293
1281
1282
1277
1270
1282
73.8
74.1
70.3
69.7
70.6
70.9
71.4
73.2
72.5
73.8
.73.7
77.5
70.1
8.0
8.2
8.0
8.2
8.1
7.8
8.0
8.1
8.1
8.1
8.2
8.1
8.1
4622.9
4620.0
4612.3
4616.0
4612.2
4613.6
4613.6
4618.3
4610.6
4613.1
4616.5
4617.4
4602.3
* Values Exceed Upper Control Limit
Negative U308 Grades Indicate Less Than Detection Limit.
6MW33
214

NRCDEQ2REP COGEMA Mining Inc.
CHRISTENSEN RANCH
Mine Unit 6 PERIMETER ORE ZONE MONITOR WELL
Well I.D. 6MW34 2nd Half,1999
Water Quality Specific Total PiezometricParameters Chloride Conductance Alkalinity pH Uranium Elevation
Units mg/l R mho/cm mg/l as CaCO3 mg/I msl
Upper Control Limit 20 1576 95.2
Date
08 JUL 1999 5.0 1360 70.2 7.9 4627.3
21 JUL 1999 5.0 1360 70.5 8.1 4608.2
03 AUG 1999 4.7 1349 65.8 8.0 4608.3
18 AUG 1999 4.7 1364 66.5 8.0 4611.6
30 AUG 1999 4.7 1356 68.0 8.1 4608.6
14 SEP 1999 4.7 1359 65.7 7.8 4609.0
28 SEP 1999 4.7 1361 .66.1 7.9 4616.7
12 OCT 1999 4.8 1360 68.4 8.0 4614.f
26 OCT 1999 4.8 1364 67.8 8.1 46.
08 NOV 1999 4.9 1357 67.9 8:0 4615.1
23 NOV 1999 4.9 1343 68.8 8.0 4615.9
07 DEC 1999 4.9 1346 67:1 8:1 4614.8
20 DEC 1999 4.9 1356 68.3 8.1 4608.3
* Values Exceed Upper Control Limit 6MW34
Negative U308 Grades Indicate Less Than Detection Limit.
215

NR.CDE02REP
COGEMA Mining Inc.
CHRISTENSEN RANCH
Mine Unit 6 PERIMETER ORE ZONE MONITOR WELL
Well I.D. 6MW35 2nd Half,1999
Water Quality Specific Total PiezometricParameters Chloride Conductance Alkalinity pH Uranium Elevation
Units mg/l p mho/cm mg/l as CaCO 3 mg/1 msl
Upper Control Limit 20 1576 95.2
Date
08 JUL 1999
22 JUL 1999
04 AUG 1999
19 AUG 1999
01 SEP 1999
15 SEP 1999
29 SEP 1999
13 OCT 1999
27 OCT 1999
08 NOV 1999
22 NOV 1999
08 DEC 1999
20 DEC 1999
5.6
5.4
4.9
4.9
5.0
5.1
5.2
5.2
5.2
5.4
4.9
5.1
5.3
1271
1278
1281
1273
1270
1299
1289
1295
1278
1280
1275
1266
1279
73.2
73.7
69.6
70.8
69.6
72.4
73.0
72.1
71.8
72.0
.71E8
72.7
72.9
7.9
8.1
8.0
8.1
8.0
7.8
7.9
8.1
8.0
8.0
8.1
8.0
8.1
4620.7
4618.0
4609.3
4613.2
4611.4
4613.3
4612.2
4616.9
4611.8
4614.9
4617:2
4621.6
4607.2
* Values Exceed Upper Control Limit
Negative U308 Grades Indicate Less Than Detection Limit.
6MW35
216

NRCDEQ2REP
COGEMA Mining Inc.
CHRISTENSEN RANCH
Mine Unit 6 PERIMETER ORE ZONE MONITOR WELL
22nd Half, 1999
Well I.D. 6MW36
Water Quality Specific Total PiezometricParameters Chloride Conductance Alkalinity pH Uranium Elevation
Units mg/i ýt mho/cm mg/l as CaCO3 mg/l msl
Upper Control Limit 20 1576 95.2
Date
07 JUL 1999
21 JUL 1999
03 AUG 1999
18 AUG 1999
30 AUG 1999
14 SEP 1999
28 SEP 1999
12 OCT 1999
26 OCT 1999
08 NOV 1999
23 NOV 1999
07 DEC 1999
20 DEC 1999
6.2
6.2
5.8
5.7
5.8
6.0
5.8
6.1
5.7
5.9
5.5
5.4
6.0
1237
1225
1203
1205
1209
1208
1214
1218
1204
1210
1221
1242
1214
72.2
72.0
68.0
68.4
70.3
71.6
69.9
72.1
69.9
69.7
69.3
67.1
72.4
8.1
8.2
8.1
8:1
8.2
7.9
8.0
8.0
8.2
8.1.
8:1
8.1
8.2
4626.4
4607.1
4604.5
4605.6
4604.2
4603.9
4612.6
4610.1
4615.
4615.0
4614.1
4613.3
4607.6
* Values Exceed Upper Control Limit
Negative U308 Grades Indicate Less Than Detection Limit.
6MW36
217

NFZCDEQ2REP
COGEMA Mining Inc.
CHRISTENSEN RANCH
Mine Unit 6 PERIMETER ORE ZONE MONITOR WELL
Well I.D. 6MW37 2nd Half, 1999
Water Quality Specific Total PiezometricParameters Chloride Conductance Alkalinity pH Uranium Elevation
Units mg/l [L mho/cm mg/l as CaCO3 mg/i msl
Upper Control Limit 20 1576 95.2
Date
08 JUL 1999
22 JUL 1999
04 AUG 1999
19 AUG 1999
01 SEP 1999
15 SEP 1999
29 SEP 1999
13 OCT 1999
27 OCT 1999
08 NOV 1999
22 NOV 1999
08 DEC 1999
20 DEC 1999
5.5
5.1
4.9
4.8
4.9
4.9
4.9
5.2
5.2
5.2
4.9,'
4.9
5.3
1273
1279
1282
1277
1271
1297
1290
1299
1284
1281
1275
1267
1281
74.3
74.5
69.6
71.5
70.4
70.3
70.6
75.9
73.6
73.5
"22.9
70.8'
74.2
8.0
8.2
8.0
8.2
8.1
7.9
8.0
8.1
8.1
8.1,
8.2
8.1
8.1
4613.4
4611.7
4604.2
4606.8
4605.0
4606.3
4606.2
4610.0
4606.3
4609.5
4608:3,
4613.1.
4600.6
* Values Exceed Upper Control Limit
Negative U308 Grades Indicate Less Than Detection Limit.
6MW37
218

COGEMA Mining Inc.
CHRISTENSEN RANCH
Mine Unit 6 PERIMETER ORE ZONE MONITOR WELL 4Well I.D. 6MW38 2nd Half,1999
Water Quality Specific Total . Piezometric
Parameters Chloride Conductance Alkalinity pH Uranium Elevation
Units mg/i ga mho/cm mg/l as CaCO3 mg/I msl
Upper Control Limit 20 1576 95.2
Date
07 JUL 1999 5.2 1356 71.6 8.1 4624.5
21 JUL 1999 5.0 1370 70.5 8.2 4607.1
03 AUG 1999 4.6 1348 67.1 8.1 4600.6
18 AUG 1999 4.6 1349 67.5 8.1 4603.6
30 AUG 1999 4.6 1352 68.2 8.2 4600.8
14 SEP 1999 4.6 1353 67.5 7.9 4600.0
28 SEP 1999 4.6 1355 66.7 8.0 4608.4
12 OCT 1999 4.8 1349 70.7 8.1 4607.1
26 OCT 1999 4.9 1345 72.2 8.1 4611.
08 NOV 1999 4.9 1348 70.4 8.1 4611.9
23 NOV 1999 4.9 1338 69.9 8.1 4612.0
07 DEC 1999 4.8 1334 65.9 8.1 4611.5
20 DEC 1999 4.9 1345 67.2 8.1 4606.4
* Values Exceed Upper Control Limit 6MW38
Negative U308 Grades Indicate Less Than Detection Limit.
219

NRCDEQ2REP
COGEMA Mining Inc.
CHRISTENSEN RANCH
Mine Unit 6 PERIMETER ORE ZONE MONITOR WELL
Well I.D. 6MW39 2nd Half, 1999
Water Quality Specific Total PiezometricParameters Chloride Conductance Alkalinity pH Uranium Elevation
Units mg/i ji mho/cm mg/i as CaCO3 mg/l msl
Upper Control Limit 20 1576 95.2
Date
08 JUL 1999
22 JUL 1999
04 AUG 1999
19 AUG 1999
01 SEP 1999
15 SEP 1999
29 SEP 1999
13 OCT 1999
27 OCT 1999
08 NOV 1999
22 NOV 1999
08 DEC 1999
20 DEC 1999
5.6
5.2
5.0
4.9
4.9
5.0
5.3
5.5
5.1
5.3
5.2
5.1
5.5
1271
1256
1265
1248
1252
1276
1277
1281
1267
1259
1259
1255
1267
69.3
68.4
65.8
66.0
64.5
65.7
67.3
70.1
68.3
68.2
68.6
65.8
67.4
8.2
8.4
8.3
8.4
8.4
8.1
8.2
8.4
8.3
8.4
8.4'
8.3
8.3
4606.1
4605.2
4598.9
4603.5
4599.3
4600.0
4600.1
4603.1
4600.4
4603.3
4600.7
4604.4
4593.0
* Values Exceed Upper Control Limit
Negative U308 Grades Indicate Less Than Detection Limit.
6MW39
220

NRCDEQ2REP
COGEMA Mining Inc.
CHRISTENSEN RANCH
PERIMETER ORE ZONE MONITOR WELLMine Unit 6
22nd Half, 1999
Well I.D. 6MW40
Water Quality Specific Total PiezometricParameters Chloride Conductance Alkalinity pH Uranium Elevation
Units mg/i ýt mho/cm mg/1 as CaCO 3 mg/I msl
Upper Control Limit 20 1576 95.2
Date
08 JUL 1999
21 JUL 1999
03 AUG 1999
18 AUG 1999
30 AUG 1999
14 SEP 1999
28 SEP 1999
12 OCT 1999
26 OCT 1999
08 NOV 1999
23 NOV 1999
07 DEC 1999
20 DEC 1999
6.0
6.1
5.8
5.8
5.8
5.9
5.4
5.7
5.2
5.2
5.3
5.3
5.3
1375
1393
1372
1376
1388
1376
1376
1367
1359
1359
1356
1353
1359
80.5
84.9
80.1
82.6
85.3
82.3
76.2
78.5
73.9
70.6
76.1
73.8
74.0
8.0
8.3
8.1
8.1
8.2
7.9
8.0
8.0
8.1
8.1
8.1
8.1
8.2
4621.1
4603.8
4595.4
4599.6
4595.4
4596.8
4603.5
46021
4606 .
4606.8
4608.0
4608.1
4604.8
* Values Exceed Upper Control Limit
Negative U308 Grades Indicate Less Than Detection Limit.
6MW40
221

NRCDEQ2REP
COGEMA Mining Inc.
CHRISTENSEN RANCH
Mine Unit 6 PERIMETER ORE ZONE MONITOR WELL
2nd Half, 1999Well I.D. 6MW41
Water Quality Specific Total PiezometricParameters Chloride Conductance Alkalinity pH Uranium Elevation
Units mg/l p. mho/cm mg/l as CaCO 3 mg/1 msl
Upper Control Limit 20 1576 95.2
Date
08 JUL 1999
22 JUL 1999
04 AUG 1999
19 AUG 1999
01 SEP 1999
15 SEP 1999
29 SEP 1999
13 OCT 1999
27 OCT 1999
08 NOV 1999
22"NOV 1999
08 DEC 1999
20 DEC 1999
9.4
8.8
8.4
9.1
10.5
11.6
11.0
12.0
12.3
14.0
12.4
11.6
12.8
1372
1356
1358
1367
1394
1440
1432
1454
1454
1484
1459
1450
1470
142.0 *
132.5 *
122.5 *
133.8
149.9 *
153.4 *
156.1 *
168.0 *
172.8 *
19218 *
178.4
'166.0
176.9
8.0
8.1
7.9
8.0
7.9
7.7
7.9
7.9
7.9
7.9
7.9"
7.9
7.8
4604.9
4603.6
4595.9
4598.6
4597.1
4597.2
4597.7
4600.5
4598.0
4600.4
4597:0,
4603'2
4592:2
* Values Exceed Upper Control Limit
Negative U308 Grades Indicate Less Than Detection Limit.
6MW41
222

NRCDEQ2REP
COGEMA Mining Inc.
CHRISTENSEN RANCH
Mine Unit 6 PERIMETER ORE ZONE MONITOR WELL
2nd Half,1999Well I.D. 6MW42
Water Quality Specific Total PiezometiParameters Chloride Conductance Alkalinity pH Uranium Elevatio]
Units mg/l ýi mho/cm mg/l as CaCO3 mg/l ms!
,?lcn
Upper Control Limit 20 1576 95.2
Date
08 JUL 1999
21 JUL 1999
03 AUG 1999
18 AUG 1999
30 AUG 1999
14 SEP 1999
28 SEP 1999
12 OCT 1999
26 OCT 1999
09 NOV 1999
23 NOV 1999
07 DEC 1999
20 DEC 1999
5.1
5.0
4.9
4.9
4.8
4.7
4.9
5.1
4.9
5.2
5.1
5.1
5.1
1357
1375
1362
1358
1371
1353
1363
1351
1351
1345
1344
1342
1350
68.7
69.0
66.4
66.4
66.7
65.2
67.7
68.8
67.8
67:0
71.1
68.4'
65.6,
8.0
8.2
8.0
8.0
8.2
7.8
8.0
8.0
8.1
8.0
8.1
8.1
8.1
4620.8
4604.3
4596.3
4598.9
4596.0
4599.0
4603.9
4604ji
4607.4
4608.8
4609.1
4607.6
* Values Exceed Upper Control Limit
Negative U308 Grades Indicate Less Than Detection Limit.
6MW42
223

NRCDEQ2REP
COGEMA Mining Inc.
CHRISTENSEN RANCH
Mine Unit 6 PERIMETER ORE ZONE MONITOR WELL
Well I.D. 6MW43 2nd Half, 1999
Water QualityParameters
SpecificConductance
TotalAlkalinity
PiezometricElevationChloride pH Uranium
Units mg/I pt mho/cm mg/l as CaCO, mg/i msl
Upper Control Limit 20 1576 95.2
Date
08 JUL 1999
22 JUL 1999
04 AUG 1999
19 AUG 1999
01 SEP 1999
15 SEP 1999
29 SEP 1999
13 OCT 1999
27 OCT 1999
08 NOV 1999
22 NOV 1999
08 DEC 1999
20 DEC 1999
6.0
5.7
5.3
5.5.
5.6
5.8
5.4
5.6
5.3
5.3
5.3
5.4
5.4
1272
1271
1282
1275
1267
1293
1295
1295
1287
1285
1276
1273
1284
76.4
77.0
73.4
73.5
73.4
78.0
73.6
76.4
77.5
75.7.
76.6
79.4
76.9
7.9
8.1
8.1
8.1.'
8.0
7.8
8:0
8.0
8.1
8.1
8.2'
8.1
8.1
4603.6
4601.9
4593.9
4597.4
4593.9
4595.4
4595.6
4598.6
4596.0
4598.1
4596.1
4601.9
4590.4
* Values Exceed Upper Control Limit
Negative U308 Grades Indicate Less Than Detection Limit.
6MW43
224

N RCDE02REP
COGEMA Mining Inc.
CHRISTENSEN RANCH
PERIMETER ORE ZONE MONITOR WELLMine Unit 6
2nd Half,1999Well I.D. 6MW44
Water QualityParameters
Specific
Chloride ConductanceTotal
AlkalinityPiezometric
ElevationpH Uranium
Units mg/i Fi mho/cm mg/l as CaCO3 mg/I msl
Upper Control Limit 20 1576 95.2
Date
08 JUL 1999
22 JUL 1999
03 AUG 1999
18 AUG 1999
01 SEP 1999
14 SEP 1999
28 SEP 1999
12 OCT 1999
26 OCT 1999
09 NOV 1999
23 NOV 1999
07 DEC 1999
20 DEC 1999
5.4
4.9
4.9
4.6
4.8
4.7
5.1
4.8
4.9
4.9'
4.9
4.9
4.9
1364
1367
1373
1365
1356
1374
1347
1363
1364
1359
1344
1355
1360
69.6
67.5
63.4
64.0
64.3
64.0
66.4
67.2
67.3
66.1
67.7
65.7
64.8
7.9
8.2
8.1
83
8.2
8.0
8.1
8.2
8.2
8.1
8.1
8.1
8.1
4619.8
4601.1
4592.8
4595.6
4592.4
4598.1
4602.0
4603A
4607.0
4607.5
4608.5
4608.1
* Values Exceed Upper Control Limit
Negative U308 Grades Indicate Less Than Detection Limit.
6MW44
225

NRCDEQ2REP
COGEMA Mining Inc.
CHRISTENSEN RANCH
PERIMETER ORE ZONE MONITOR WELLMine Unit 6
2nd Half, 1999Well I.D. 6MW45
Water Quality Specific Total PiezometricParameters Chloride Conductance Alkalinity pH Uranium Elevation
Units mg/l gi mho/cm mg/i as CaCO3 mg/l msl
Upper Control Limit 20 1576 95.2
Date
08 JUL 1999
22 JUL 1999
04 AUG 1999
19 AUG 1999
01 SEP 1999
15 SEP 1999
29 SEP 1999
13 OCT 1999
27 OCT 1999
08 NOV 1999
22 NOV 1999
08 DEC 1999
20 DEC 1999
6.4
6.1
6.0
6.0
6.1
6.4
6.2
6.7
6.7
7.1
7.0
6.9
7.3
1274
1279
1282
1277
1268
1294
1295
1295
1280
1288
1284
1274
1285
75.7
75.3
72.2
72.2
73.1
75.4
72.7
76.8
76.5
75.5
:77.4'
75.4
75.9
7.9
8.1
8.0
8.1
8.1
7.8
8.0
8.1
8.1
8.0
8.1
8.0
8.1
4600.7
4637.3
4589.9
4593.3
4591.6
4590.1
4591.3
4593.9
4613.1
4615.0
4591.2
4600.3
4589.0
6MW45* Values Exceed Upper Control Limit
Negative U308 Grades Indicate Less Than Detection Limit.
226

NRCOE02REP
COGEMA Mining Inc.
CHRISTENSEN RANCH
PERIMETER ORE ZONE MONITOR WELLMine Unit 6
22nd Half, 1999
Well I.D. 6MW46
Water Quality Specific Total PiezometricParameters Chloride Conductance Alkalinity pH Uranium Elevation
Units mg/l R mho/cm mg/i as CaCO3 mg/1 msl
Upper Control Limit 20.6 2427 89.2
Date
08 JUL 1999
09 JUL 1999
09 JUL 1999
12 JUL 1999
19 JUL 1999
27 JUL 1999
03 AUG 1999
18 AUG 1999
01 SEP 1999
14 SEP 1999
28 SEP 1999
12 OCT 1999
26 OCT 1999
09 NOV 1999
23 NOV 1999
07 DEC 1999
20 DEC 1999
21.0
20.7
20.8
19.1
12.6
10.6
9.5
8.4
8.5
7.9
7.8:
7.8
8.0"
8.3
8.1
7.7
7.8
* 1651
* 1630
* 1633
1621
1525
1516
1528
1541
1556
1574
1518
1533
1524
1508
1506
1494
1509
197.0
202.6
203.7
177.6
119.7
107.2
94.3
87.8
88.0
84.7
86.1
94.1
89.1
91.7
90.2
87.4
93.0
*
*
*
*
*
*
7.5
7.6
7.5
7.8
8.0
8.0
7.9
7.9
7.9
7.7
7.9
7.9
8.0
7.8
7.9
8.0
8.0
-1
-1
-1
-I
-1
-1
4619.1
4611.1
4611.1
4601.3
4598.3
4589.4
4589.1
4592.
4589.1
4596.9
4600.5
4601.7
4604.8
4605.7
4606.3
4607.6
4608.8
6MW46
*
*
* Values Exceed Upper Control Limit
Negative U308 Grades Indicate Less Than Detection Limit.
227

NRCDEQ2REP
COGEMA Mining Inc.
CHRISTENSEN RANCH
Mine Unit 6 PERIMETER ORE ZONE MONITOR WELL
Well I.D. 6MW47 2nd Half, 1999
Water Quality Specific Total PiezometricParameters Chloride Conductance Alkalinity pH Uranium Elevation
Units mg/i PL mho/cm mg/i as CaCO3 mg/l msl
Upper Control Limit 20 1576 95.2
Date
08 JUL 1999
22 JUL 1999
04 AUG 1999
19 AUG 1999
01 SEP 1999
15 SEP 1999
29 SEP 1999
13 OCT 1999
27 OCT 1999
08 NOV 1999
22 NOV 1999
08 DEC 1999
20 DEC 1999
5.6
5.4
5.0
5.0
5.1
4.9
5.0
5.2
5.2
5.6
5.1
5.1
5.4
1270
1267
1274
1263
1268
1284
1268
1293
1278
1282
1280
1267
1274
72.1
73.0
69.6
70.1
70.5
69.4
69.9
77.3
73.3
71.5
73.7
70.4
72.8
8.0
8.2
8.1
8.2
8.1
7.9
8.1
8.1
81
8.1
8.2
8.1
8.2
4601.0
4598.3
4589.2
4593.4
4591.3
4590.2
4590.9
4593.2
4591.5
4593.8
4591.6
4603.0
4589.8
* Values Exceed Upper Control Limit
Negative U308 Grades Indicate Less Than Detection Limit.
6MW47
228

NRCDEQ2REP
COGEMA Mining Inc.
CHRISTENSEN RANCH
PERIMETER ORE ZONE MONITOR WELLMine Unit 6
2nd Half, 1999Well I.D. 6MW48-3
Water QualityParameters
SpecificConductance
TotalAlkalinityChloride pH
Piezometric
Uranium Elevation
mg/1 mslUnits mg/1 ý. mho/cm mg/l as CaCOI
Upper Control Limit 20 1576 95.2
Date
08 JUL 1999
22 JUL 1999
03 AUG 1999
18 AUG 1999
01 SEP 1999
14 SEP 1999
29 SEP 1999
13 OCT 1999
27 OCT 1999
08 NOV 1999
23 NOV 1999'
08 DEC 1999
20 DEC 1999
13.2
6.7
6.0
5.6
5.5
5.1
5.4
5.5
5.1
5.6
5.1
5.1
5.9
1392
1323
1335
1326
1316
1340
1326
1341
1332
1337
1333
1327
1329
124.4
77.9
69.4
68.5
68.2
66.7
69.2
70.6
69.0
72.9
69.1
66.9
73.6
,6 7.9
8.1
8.0
8.1
8.1
8.3
8.2
8.3
8.4
8.6
8.3
8.1
8.3
4620.6
4601.4
4592.3
4594.6
4592.1
4599.0
4602.3
4604 1
4606.
4607.3
4608.7
4609.6
4610.2
* Values Exceed Upper Control Limit
Negative U308 Grades Indicate Less Than Detection Limit.
6MW48-3
229

NF-CDEQ2REP
COGEMA Mining Inc.
CHRISTENSEN RANCH
Mine Unit 6 PERIMETER ORE ZONE MONITOR WELL
Well I.D. 6MW49 2nd Half,1999
Water Quality Specific Total PiezometricParameters Chloride Conductance Alkalinity pH Uranium Elevation
Units mg/l ýi mho/cm mg/l as CaCO3 mg/i msl
Upper Control Limit 20 1576 95.2
Date
08 JUL 1999
22 JUL 1999
04 AUG 1999
19 AUG 1999
01 SEP 1999
15 SEP 1999
29 SEP 1999
13 OCT 1999
27 OCT 1999
08 NOV 1999
22 NOV 1999
08 DEC 1999
20 DEC 1999
6.2
5.5
5.2
5.2
5.3
5.1
5.4
5.6
5.3
5.6
5.5
5.5
5.5
1278
1263
1268
1258
1260
1282
1283
1286
1275
1278
1276
1268
1280
74.2
74.3
71.2
71.8
71.1
70.7
70.8
75.0
73.8
73.4
75.6'
76.r6
75.1
8.1
8.2
8.0
8.1
8.1
7.8
8.0
8.1
8.1
8.0
8.2
8.0
8.1
4603.0
4599.6
4589.0
4595.4
4591.8
4590.2
4591.4
4593.7
4591.8
4593.9
4593:4
4607.7
4591.6
* Values Exceed Upper Control Limit
Negative U308 Grades Indicate Less Than Detection Limit.
6MW49
230

NRCDEQ2REP
COGEMA Mining Inc.
CHRISTENSEN RANCH
PERIMETER ORE ZONE MONITOR WELLMine Unit 6
Well I.D. 6MW50 2nd Half, 1999
Water Quality Specific Total PiezometricParameters Chloride Conductance Alkalinity pH Uranium Elevation
Units mg/l ji mho/cm mg/i as CaCO 3 mg/I msl
Upper Control Limit 20 1576 95.2
Date
08 JUL 1999
22 JUL 1999
03 AUG 1999
18 AUG 1999
01 SEP 1999
14 SEP 1999
29 SEP 1999
13 OCT 1999
27 OCT 1999
08 NOV 1999
23 NOV 1999
08 DEC 1999
20 DEC 1999
6.1
5.5
5.4
5.1
5.4
5.7
5.4
5.6
5.6
5.6
5.6
5.5
5.4
1271
1269
1284
1272
1263
1254
1261
1274
1266
1269
1250
1265
1262
74.0
71.6
69.1
68.1
69.8
72.5
69.1
71.3
71.0
70.1
72.1
71.2
70.0
8.2
8.1
7.9
8.1
8.1
7.9
8.0"
8.1
8.2
8.0
8.1
8.1
8.1
4617.0
4601.0
4591.1
4593.9
4593.5
4598.0
4600.1
4602.1O
4603.
4604.1
4604.1
4609.1
4608.2
* Values Exceed Upper Control Limit
Negative U308 Grades Indicate Less Than Detection Limit.
6MW50
231

NrCCDEQ2REP
COGEMA Mining Inc.
CHRISTENSEN RANCH
Mine Unit 6 PERIMETER ORE ZONE MONITOR WELL
Well I.D. 6MW51 2nd Half,1999
Water Quality Specific Total PiezometricParameters Chloride Conductance Alkalinity pH Uranium Elevation
Units mg/I i mho/cm mg/l as CaCO3 mg/1 msl
Upper Control Limit 20 1576 95.2
Date
08 JUL 1999
22 JUL 1999
04 AUG 1999
19 AUG 1999
01 SEP 1999
15 SEP 1999
29 SEP 1999
13 OCT 1999
27 OCT 1999
08 NOV 1999
22 NOV 1999
08 DEC 1999
20 DEC 1999
5.9
5.5
5.0
5.0
5.2
5.3
5.4
5.5
5.3
5.5
5.1
5.2
5.5
1293
1282
1287
1274
1274
1301
1300
1299
1290
1289
1289
1273
1286
73.1
71.8
68.4
69.3
69.2
68.0
68.5
71.3,
71.3
70.3
71:3
75.0
70.9
8.1
8.1
8.0
8.1
8.0
7.8
8.0
810
8.0
8.0
8.1
8.1
8.0
4600.9
4597.3
4587.6
4592.2
4590.2
4588.6
4589.5
4591.8
4590.3
4592.4
4592.3
4605.1
4592.5
* Values Exceed Upper Control Limit
Negative U308 Grades Indicate Less Than Detection Limit.
6MW51
232

NR~CDEO2REP
COGEMA Mining Inc.
CHRISTENSEN RANCH
Mine Unit 6 PERIMETER ORE ZONE MONITOR WELL EWell I.D. 6MW52 2nd Half,1999
Water Quality Specific Total Piezometric
Parameters Chloride Conductance Alkalinity pH Uranium Elevation
Units mg/l g mho/cm mg/I as CaCO3 mg/I msl
Upper Control Limit 20 1576 95.2
Date
08 JUL 1999 6.1 1241 71.1 8.4 4608.5
22 JUL 1999 5.6 1240 67.0 8.4 4598.9
03 AUG 1999 5.8 1245 70.6 8.2 4589.2
18 AUG 1999 5.6 1229 67.9 8.5 4593.4
01 SEP 1999 5.5 1221 67.3 8.3 4591.8
14 SEP 1999 5.3 1247 65.7 8.2 4591.8
29 SEP 1999 5.5 1239 68.3 8.3 4593.6
13 OCT 1999 5.7 1249 69.6 8.3 4596.d
27 OCT 1999 5.7 1230 69.4 8.4 4595.1
08 NOV 1999 6.0 1242 68.4 8.4 4597.2
23 NOV 1999 5.8 1236 " 69.9 8.4 4597.6
08 DEC 1999 5.4 1228 65.7 8.2 4609.5
20 DEC 1999 5.7 1245 67.4 8.3 4603.4
* Values Exceed Upper Control Limit 6MW52
Negative U308 Grades Indicate Less Than Detection Limit.
233

NiCDEQ2REP
COGEMA Mining Inc.
CHRISTENSEN RANCH
Mine Unit 6 PERIMETER ORE ZONE MONITOR WELL
Well I.D. 6MW53 2nd Half, 1999
Water QualityParameters
SpecificConductance
TotalAlkalinityChloride pH Uranium
PiezometricElevation
Units mg/I li mho/cm mg/l as CaCO3 mg/l msl
Upper Control Limit 20 1576 95.2
Date
08 JUL 1999
22 JUL 1999
04 AUG 1999
19 AUG 1999
01 SEP 1999
15 SEP 1999
29 SEP 1999
13 OCT 1999
27 OCT 1999
08 NOV 1999
22 NOV 1999
08 DEC 1999
20 DEC 1999
6.2
6.1
6.0
5.8
5.6
5.7
5.8
6.2
5.8
6.2
5.9
5.9
5.9
1210
1199
1195
1199
1195
1206
1193
1216
1202
1208
1204
1196
1204
69.2
68.4
58.3
66.4
65.6
64.3
63.3
68.6
66-3
66.1
65.6
67.1
65.2
8.5
8.6
8.6
8.5
8.5
8.3
84
8.3
8.3
8.4
84'
8.3
8.4
4598.5
4595.0
4586.7
4589.8
4588.5
4587.2
4587.9
4590.1
4589.2
4591.5
4590.8.
4599.3
4591.6
* Values Exceed Upper Control Limit
Negative U308 Grades Indicate Less Than Detection Limit.
6MW53
234

NRCDEQ2REP
COGEMA Mining Inc.
CHRISTENSEN RANCH
PERIMETER ORE ZONE MONITOR WELLMine Unit 6
22nd Half, 1999
Well I.D. 6MW54
Water Quality Specific Total PiezometricParameters Chloride Conductance Alkalinity pH Uranium Elevation
Units mg/l p mho/cm mg/l as CaCO 3 mg/l msl
Upper Control Limit 20 1576 95.2
Date
08 JUL 1999
22 JUL 1999
04 AUG 1999
18 AUG 1999
01 SEP 1999
14 SEP 1999
29 SEP 1999
13 OCT 1999
27 OCT 1999
08 NOV 1999
23 NOV 1999
08DEC 1999
20 DEC 1999
6.2
5.8
5.4
5.5
5.5
5.5
5.5
5.6
5.7
5.9
5.6
5.4
5.8
1243
1237
1233
1237
1232
1243
1238
1254
1223
1233
1219
1233
1235
67.9
68.1
61.8
61.5
68.1
61.6
60.9
67.8
63.9
64.3
67.6
66.8
66.3
8.2
8.3
8.2
8.3
8.3
8.1
8.2
8.2
8.4
8.2
8:3
8.1
8.2
4605.2
4598.4
4588.2
4591.3
4591.0
4589.9
4591.6
459311
4593'
4594.5
4595.7.
4607.3
4599.0
* Values Exceed Upper Control Limit
Negative U308 Grades Indicate Less Than Detection Limit.
6MW54
235

CHRISTENSEN RANCH
INTERIOR SHALLOW SAND MONITOR WELLS

NRCDEQ2REP
COGEMA Mining Inc.
CHRISTENSEN RANCH
Mine Unit 5 INTERIOR SHALLOW SAND MONITOR WELL
'lI.D. MW-11S2nd Half, 1999
Water Quality Specific Total PiezometricParameters Chloride Conductance Alkalinity pH Uranium Elevation
Units mg/l pi mho/cm mg/l as CaCO3 mg/i msl
Upper Control Limit 22.1 2922 316.6
Date
13 JUL 1999
28 JUL 1999
10 AUG 1999
23 AUG 1999
08 SEP 1999
20 SEP 1999
04 OCT 1999
19 OCT 1999
02 NOV 1999
16 NOV 1999
30 NOV 1999
14 DEC 1999
27 DEC 1999
7.1
6.9
6.3
6.3
7.0
6.2
6.7
6.9
6.9
6.6
6.6
6.6
6.7
1216
1223
1206
1220
1199
1208
1205
1193
1212
1224
1199
1195
1196
114.4
113.2
108.7
106.4
116.1
108.6
113.2
111.2
114.0
110.4
107.7:
108.1
108.6
• 8.2
8.0
8.1
8.1
8:2
8.1
8.0
8.2
8.0
8.2
8.2
8.2
8.2
4652.4
4652.6
4652.5
4652.5
4652.7
4652.9
4652.9
4652.8
4652.6
4653.0
4652.6
4653.0
4652.5
Values Exceed Upper Control Limit
Negative U308 Grades Indicate Less Than Detection Limit.
MW- IIS
236

NRCDE02REP
COGEMA Mining Inc.
CHRISTENSEN RANCH
Mine Unit 3 INTERIOR SHALLOW SAND MONITOR WELL
Well I.D. MW46S 2nd Half,19
Water Quality Specific Total PiezometricParameters Chloride Conductance Alkalinity pH Uranium Elevation
Units mg/l p mho/cm mg/1 as CaCO3 mg/l msl
Upper Control Limnit 13.5 1087 184.4
Date
27 JUL 1999 12.4. 1779 *
24 AUG 1999 11.4 1862 *
21 SEP 1999 1,1.5 1895 *
11 OCT 1999 .12.3 1894 *
09 NOV 1999 12.4 1888 *
16 DEC 1999 12.7 1893 *
* Values Exceed Upper Control Limit
Negative U308 Grades Indicate Less Than Detection Limit.
138.8
126.5
125.7
135.5
129.1
133.7
8.0
8.0
7.9
7.9
7.8
8.0
4552.5
4551.9
4551.5
4551.3
4551.3
4550.8
MW46S
237

NRCDEQ2REP
COGEMA Mining Inc.
CHRISTENSEN RANCH
Mine Unit 3 INTERIOR SHALLOW SAND MONITOR WELL
I.D. NIW48S 2nd Half,1999
Water QualityParameters
SpecificConductance
TotalAlkalinity
PiezometricUranium ElevationChloride pH
Units mg/i ji mho/cm mg/I as CaCO3 mg/I mnsl
Upper Control Limit 22.2 1775 268.3
Date
27 JUL 1999
24 AUG 1999
21 SEP 1999
11 OCT 1999
09 NOV 1999
16 DEC 1999
9.7
9.0
9.3
9.6
9.7
9.5
1842
1865
1846
1855
1851
1850
* 126.3
118.6
* 123.8
* 128.6
* 122.7
* 125.0
7.9
7.9
7.8
7.8
7.7
7.9
4555.4
4554.8
4554.5
4554.4
4554.3
4553.9
* Values Exceed Upper Control Limit
Negative U308 Grades Indicate Less Than Detection Limit.
MW48S
238

NRCDE02REP
COGEMA Mining Inc.
CHRISTENSENRANCH
Mine Unit 3 INTERIOR SHALLOW SAND MONITOR WELL
2nd Half, 1Well I.D. MW50S
Water Quality Specific Total PiezometricParameters Chloride Conductance Alkalinity pH Uranium Elevation
Units mg/I .t mho/cm mg/l as CaCO3 mg/1 msl
Upper Control Limit 22.2 1775 268.3
Date
27 JUL 1999
24 AUG 1999
21 SEP 1999
11 OCT 1999
09 NOV 1999
16 DEC 1999
9.6
9.7
8.9
10.4
8.9
8.7
1330
1362
1357
1359
1354
1340
171.0
162.2
164.2
162.3
152.9
156.4
8.1
8.0
7.9
7.9
7.8
8.1
4557.1
4556.5
4556.3
4556.2
4555.8
4555.7
MW50S* Values Exceed Upper Control Limit
Negative U308 Grades Indicate Less Than Detection Limit.
239

NRCDEQ2REP
COGEMA Mining Inc.
CHRISTENSEN RANCH
Mine Unit 3 INTERIOR SHALLOW SAND MONITOR WELL
2nd Half, 1999fI I.D. MW52S
Water QualityParameters
SpecificConductance
TotalAlkalinity
PiezometricElevationChloride pH Uranium
Units mg/1 ýt mho/cm mg/l as CaCO3 mg/i msl
Upper Control Limit 22.2 1775 268.3
Date
27 JUL 1999
24 AUG 1999
21 SEP 1999
12 OCT 1999
10 NOV 1999
19 DEC 1999
7.3
6.8
6.9
7.3
7.3
7.3
1402
1407
1418
1412
1438
1423
98.0
91.0
101.0
102.6
98.1
97.4
8.3
8.1
8.1
8.0
8.0
8.0
4549.6
4549.2
4548.9
4548.8
4548.7
4549.7
* Values Exceed Upper Control Limit
Negative U308 Grades Indicate Less Than Detection Limit.
MW52S
240

NRCDEQ2REP
COGEMA Mining Inc.
CHRISTENSEN RANCH
Mine Unit 3 INTERIOR SHALLOW SAND MONITOR WELL
Well I.D. MW54S2nd Half, 19
Water Quality Specific Total PiezometricParameters Chloride Conductance Alkalinity pH Uranum Elevation
Units mg/1 pa mho/cm mg/l as CaCO3 mg/l msl
Upper Control Limit 22.2 1775 268.3
Date
27 JUL 1999
24 AUG 1999
21 SEP 1999
11 OCT 1999
09 NOV 1999
16 DEC 1999
8.0
7.2
7.3
7.5
7.6
7.7
1474
1502
1495
1493
1494
1492
131.1
125.1
127.0
130.7
140.8
137.0
7.9
8.0
7.9
8.0
7.7
8.1
4561.1
4560.0
4559.5
4559.5
4559.6
4559.2
* Values Exceed Upper Control Limit
Negative U308 Grades Indicate Less Than Detection Limit.
MW54S
241

NR.CDEQ2REP
COGEMA Mining Inc.
CHRISTENSEN RANCH
Mine Unit 3 INTERIOR SHALLOW SAND MONITOR WELL
I.D. MW56S 2nd Half, 1999
Water Quality Specific Total PiezometricParameters Chloride Conductance Alkalinity pH Uranium Elevation
Units mg/1 p mho/cm mg/i as CaCO 3 mg/I msl
Upper Control Limit 13.5 1087 184.4
Date
27 JUL 1999
24 AUG 1999
21 SEP 1999
II OCT 1999
10 NOV 1999
16 DEC 1999
6.3
6.0
5.9
6.3
7.5
7.1
921
940
934
934
980
934
138.7
130.4
129.9
138.1
127.9
136.0
8.4
8.2
8.3
8.3
8.4
8.4
4559.7
4558.1
4557.7
4557.9
4557.7
4557.8
* Values Exceed Upper Control Limit
Negative U308 Grades Indicate Less Than Detection Limit.
MW56S
242

NRCDEQ2REP
COGEMA Mining Inc.
CHRISTENSEN RANCH
Mine Unit 3 INTERIOR SHALLOW SAND MONITOR WELL
2nd Half,1999Well I.D. MW58S
Water Quality Specific Total PiezometricParameters Chloride Conductance Alkalinity pH Uranium Elevation
Units mg/1 jt mho/cm mg/1 as CaCO3 mg/l msl
Upper Control Limit 13.5 1087 184.4
Date
27 JUL 1999
24 AUG 1999
21 SEP 1999
11 OCT 1999
10 NOV 1999
16 DEC 1999
7.5
6.8
8.4
7.4
6.5
7.2
936
961
954
955
954
968
119.8
119.1
119.6
126.5
148.3
122.4
8.3
8.4
8.4
8.5
7.8
8.6
4567.9
4567.3
4567.0
4566.9
4566.5
4566.4
* Values Exceed Upper Control Limit
Negative U308 Grades Indicate Less Than Detection Limit.
MW58S
243

NRCDEQ2REP
COGEMA Mining Inc.
CHRISTENSEN RANCH
Mine Unit 3 INTERIOR SHALLOW SAND MONITOR WELL
I.D. MW66S-2 2nd Half, 1999
Water Quality Specific Total PiezometricParameters Chloride Conductance Alkalinity pH Uranium Elevation
Units mg/1 p mho/cm mg/I as CaCO3 mg/I msl
Upper Control Limit 22.2 1775 268.3
Date
26 JUL 1999
24 AUG 1999
21 SEP 1999
11 OCT 1999
09 NOV 1999
16 DEC 1999
7.6
7A4
7.8
7.4
7.3
7.8
1480
1512
1501
1506
1502
1493
114.2
115.5
118.3
119.9
119.4
120.4
8.0
8.0
7.9
7.8
7.7
8.2
4573.5
4573.1
4573.0
4573.1
4572.7
4572.6
* Values Exceed Upper Control Limit
Negative U308 Grades Indicate Less Than Detection Limit.
MW66S-2
244

NRCDEQ2REP
COGEMA Mining Inc.
CHRISTENSEN RANCH
Mine Unit 2 INTERIOR SHALLOW SAND MONITOR WELL
2nd Half,1999Well I.D. MW68S
Water Quality Specific Total PiezometricParameters Chloride Conductance Alkalinity pH Uranium Elevation
Units mg/i pL mho/cm r mg/i as CaCO 3 mg/i msl
Upper Control Limit 23.5 3560 304
Date
22 JUL 1999
10 AUG 1999
13 SEP 1999
06 OCT 1999
02 NOV 1999
01 DEC 1999
14.0
14.5
15.1
15.5
14.1
14.4
2234
2174
2186
2205
2221
2199
178.9
170.1
173.3
179.2
179.4
183.9
7.7
7.5
7.5
7.5
7.4
7.6
4575.7
4575.5
4575.6
4575.5
4575.6
4576.2
MW68S* Values Exceed Upper Control Limit
Negative U308 Grades Indicate Less Than Detection Limit.
245

NRCEOEQ2REP
COGEMA Mining Inc.
CHRISTENSEN RANCH
Mine Unit 2 INTERIOR SHALLOW SAND MONITOR WELL
-11 I.D. MW70S 2nd Half, 1999
Water Quality Specific Total PiezometricParameters Chloride Conductance Alkalinity pH Uranium Elevation
Units mg/l ýL mho/cm mg/l as CaCO3 mg/l msl
Upper Control Limit 63.4 21365 5861.3
Date
22 JUL 1999
10 AUG 1999
13 SEP 1999
05 OCT 1999
02 NOV 1999
01 DEC 1999
11.0
10.4
10.2
10.5
10.5
10.4
1832
1928
1876
1889
1841
1802
75.5
91.6
81.0
87.6
80.6
68.8
10.7
10.8
10.8
10.8
10.8
10.7
-1
-1
-1
-1
-1
-I
4561.7
4557.7
4554.0
4554.1
4556.0
4556.0
* Values Exceed Upper Control Limit
Negative U308 Grades Indicate Less Than Detection Limit.
MW70S
246

NRCDEQ2REP
COGEMA Mining Inc.
Mine Unit 2
CHRISTENSEN RANCH
INTERIOR SHALLOW SAND MONITOR WELL
2nd Half, 1999Well I.D. MW72S
Water QualityParameters
Specific
Chloride ConductanceTotal
AlkalinityPiezometricElevationpH Uranium
Units mg/l pt mho/cm mg/1 as CaCO3 mg/1 msl
Upper Control Limit 63.4 21365 5861.3
Date
22 JUL 1999
10 AUG 1999
13 SEP 1999
05 OCT 1999
02 NOV 1999
01 DEC 1999
12.4
11.3
11.6
12.1
11.7
12.0
2151
2153
2167
2170
2145
2126
162.8
149.8
151.6
156.6
155.4
150.9
7.9
7.7
7.6
7.7
7.5
7.7
-1
-1
-1
-I
-1
-1
4568.0
4567.7
4567.4
4567.5
4567.9
4568.1
MW72S* Values Exceed Upper Control Limit
Negative U308 Grades Indicate Less Than Detection Limit.
247

NRCDEQ2REP
COGEMA Mining Inc.
CHRISTENSEN RANCH
Mine Unit 2 INTERIOR SHALLOW SAND MONITOR WELL
Pal I.D. MW92S 2nd Half,1999
Water Quality Specific Total PiezometricParameters Chloride Conductance Alkalinity pH Uranium Elevation
Units mg/l gi mho/cm mg/l as CaCO3 mg/l msl
Upper Control Limit 23.5 3560 304
Date
21 JUL 1999
10 AUG 1999
13 SEP 1999
06 OCT 1999
02 NOV 1999
01 DEC 1999
11.8
11.0
11.1
11.6
12.0
11.8
2398
2402
2413
2404
2382
2372
145.3
136.5
134.2
141.1
140.9
137.2
7.6
7.5
7.5
7.4
7.3
7.4
4572.7
4572.6
4572.7
4572.6
4572.6
4572.5
* Values Exceed Upper Control Limit
Negative U308 Grades Indicate Less Than Detection Limit.
MW92S
248

NRCDEQ2REP
COGEMA Mining Inc.
CHRISTENSEN RANCH
Mine Unit 2 INTERIOR SHALLOW SAND MONITOR WELL 42nd Half,1999
Well I.D. MW94S
Water Quality Specific Total PiezometricParameters Chloride Conductance Alkalinity pH Uranium Elevation
Units mg/l p mho/cm mg/i as CaCO3 mg/l msl
Upper Control Limit 23.5 3560 304
Date
22 JUL 1999
10 AUG 1999
13 SEP 1999
06 OCT 1999
02 NOV 1999
01 DEC 1999
14.1
12.8
13.0
12.9
13.4
13.7
2628
2638
2648
2643
2620
2607
197.7
185.9
184.5
181.7
189.6
187.6
7.4
7.5
7.4
7.4
7.3
7.4
4554.1
4553.8
4553.9
4553.9
4554.0
4554.0
* Values Exceed Upper Control Limit
Negative U308 Grades Indicate Less Than Detection Limit.
MW94S
249

NRFCDEQ2REP
COGEMA Mining Inc.
CHRISTENSEN RANCH
Mine Unit 2 INTERIOR SHALLOW SAND MONITOR WELL
2nd Half, 1999I.D. MW96S
Water Quality Specific Total PiezomeParameters Chloride Conductance Alkalinity pH Uranium Elevati
Units mg/1 4 mho/cm mg/i as CaCO3 mg/1 msl
tricon
Upper Control Limit 23.5 3560 304
Date
22 JUL 1999
10 AUG 1999
13 SEP 1999
06 OCT 1999
02 NOV 1999
01 DEC 1999
12.0
11.1
11.4
12.1
11.8
12.7
2731
2742
2759
2755
2742
2725
230.3
212.2
216.0
231.0
233.6
272.7
7.4
7.4
7.3
7.3
7.2
7.4
4569.0
4569.0
4568.9
4568.8
4568.8
4568.5
* Values Exceed Upper Control Limit
Negative U308 Grades Indicate Less Than Detection Limit.
MW96S
250

NRCDEQ2REP
COGEMA Mining Inc.
CHRISTENSEN RANCH
Mine Unit 2 INTERIOR SHALLOW SAND MONITOR WELL
2nd Half, 19Well I.D. MW98S
Water Quality Specific Total PiezometricParameters Chloride Conductance Alkalinity pH Uranium Elevation
Units mg/l pt mho/cm mg/l as CaCO3 mg/1 msl
Upper Control Limit 63.4 21365 5861.3
Date
22 JUL 1999
11 AUG 1999
13 SEP 1999
06 OCT 1999
02 NOV 1999
01 DEC 1999
13.4
12.1
12.8
13.6
13.8
12.9
2626
2634
2629
2644
2631
2620
169.2
156.2
162.1
170.6
177.4
163.6
7.7
7.4
7.5
7.6
7.6
7.5
-1
-1
-1
-.1
-1
-1
4558.8
4558.9
4558.7
4558.6
4558.7
4558.7
* Values Exceed Upper Control Limit
Negative U308 Grades Indicate Less Than Detection Limit.
MW98S
251

NRCDEQ2REP
COGEMA Mining Inc.
CHRISTENSEN RANCH
Mine Unit 2 INTERIOR SHALLOW SAND MONITOR WELL
MW100S 2nd Half,1999
Water Quality Specific Total PiezometricParameters Chloride Conductance Alkalinity pH Uranium Elevation
Units mg/l px mho/cm mg/I as CaCO3 mg/1 msl
Upper Control Limit 23.5 3560 304
Date
22 JUL 1999
11 AUG 1999
13 SEP 1999
06 OCT 1999
02 NOV 1999
01 DEC 1999
12.8
11.9
11.9
12.4
12.6
12.6
2586
2575
2563
2587
2576
2552
172.7
161.7
161.5
158.9
167.2
156.0
7.5
7.4
7.3
7.4
7.5
7.6
4556.2
4556.0
4555.9
4556.0
4556.1
4555.4
* Values Exceed Upper Control Limit
Negative U308 Grades Indicate Less Than Detection Limit.
MW100S
252

NRCDEQ2REP
COGEMA Mining Inc.
Mine Unit 2
CHRISTENSEN RANCH
INTERIOR SHALLOW SAND MONITOR WELL
2nd Half, 1999Well I.D. MW1 12S
Water Quality Specific Total PiezometrParameters Chloride Conductance Alkalinity pH Uranium Elevatior
ic
Units mg/l ýt mho/cm mg/1 as CaCO, mg/l msl
Upper Control Limit 63.4 21365 5861.3
Date
11 AUG 1999
13 SEP 1999
06 OCT 1999
02 NOV 1999
01 DEC 1999
12.5
12.3
13.5
9.3
12.4
3630
3732
3772
3765
3941
411.8
458.0
474.0
461.8
517.8
11.1
11.3
11.1
11.3
11.4
4554.0
4553.9
4553.8
4553.9
4553.6
* Values Exceed Upper Control Limit
Negative U308 Grades Indicate Less Than Detection Limit.
MW112S
253

NRCDE02REP
COGEMA Mining Inc.
CHRISTENSEN RANCH
Mine Unit 2 INTERIOR SHALLOW SAND MONITOR WELL
I.D. MWl17S 2nd Half,1999
Water Quality Specific Total PiezometricParameters Chloride Conductance Alkalinity pH Uranium Elevation
Units mg/l pi mho/cm mg/l as CaCO3 mg/I msl
Upper Control Limit 13.6 768 144.5
Date
22 JUL 1999
11 AUG 1999
13 SEP 1999
06 OCT 1999
02 NOV 1999
01 DEC 1999
8.1
7.5
7.5
7.8
8.7
8.1
735
730
724
735
727
727
139.2
129.6
129.9
132.5
143.6
131.5
8.1
8.1
8.3
8.0
8.4
8.3
4536.6
4536.4
4536.2
4535.6
4536.4
4536.4
* Values Exceed Upper Control Limit
Negative U308 Grades Indicate Less Than Detection Limit.
MWI17S
254

N RCDEQ2REP
COGEMA Mining Inc.
CHRISTENSEN RANCH
INTERIOR SHALLOW SAND MONITOR WELLMine Unit 4
2nd Half, 1999Well I.D. 4SM- 1
Water Quality Specific Total PiezometricParameters Chloride Conductance Alkalinity pH Uranium Elevation
Units mg/l p mnho/cm mg/I as CaCO3 mg/l msl
Upper Control Limit 8.8 1570 142.7
Date
22 JUL 1999
17 AUG 1999
20 SEP 1999
04 OCT 1999
17 NOV 1999
16 DEC 1999
6.5
6.4
6.2
6.1
6.6
6.6
1175
1166
1145
1154
1120
1155
99.2
88.8
94.9
92.3
101.9
91.5
8.2
8.2
8.2
8.2
8.1
4610.8
4610.7
4610.5
4610.7
4610.8
4610.7
* Values Exceed Upper Control Limit
Negative U308 Grades Indicate Less Than Detection Limit.
4SM- I
255

NRCDEQ2REP
COGEMA Mining Inc.
CHRISTENSEN RANCH
Mine Unit 4 INTERIOR SHALLOW SAND MONITOR WELL
I.D. 4SM-4 2nd Half,1999
Water Quality Specific Total PiezometricParameters Chloride Conductance Alkalinity pH Uranium Elevation
Units mg/i [i mho/cm mg/l as CaCO3 mg/I msl
Upper Control Limit 8.8 1570 142.7
Date
22 JUL 1999
17 AUG 1999
20 SEP 1999
04OCT 1999
17 NOV 1999
16 DEC 1999
6.6
6.4
6.8
6.7
8.7
7.6
1066
1079
1093
1082
1085
1091
106.0
116.8
127.9
112.2
139.6
116.0
7.8
7.9
8.3
8.0
8.1
8.0
4598.0
4597.9
4598.0
4597.9
4597.9
4597.9
* Values Exceed Upper Control Limit
Negative U308 Grades Indicate Less Than Detection Limit.
4SM-4
256

NRCDEQ2REP
COGEMA Mining Inc.
CHRISTENSEN RANCH
INTERIOR SHALLOW SAND MONITOR WELLMine Unit 4
Well I.D. 4SM-8 2nd Half, 1
Water Quality Specific Total PiezometricParameters Chloride Conductance Alkalinity pH Uranium Elevation
Units mg/i gi mho/cm mg/i as CaCO3 mg/i msl
Upper Control Limit 8.8 1570 142.7
Date
22 JUL 1999
17 AUG 1999
20 SEP 1999
04 OCT 1999
17 NOV 1999
16 DEC 1999
6.5
6.8
6.2
6.1
6.6
6.6
882
879
881
874
869
879
123.9
119.2
118.0
117.9
121.7
119.5
8.2
8M1
8.2
8.2
8.0
8.1
4594.7
4594.3
4594.4
4594.3
4594.2
4593.8
4SM-8* Values Exceed Upper Control Limit
Negative U308 Grades Indicate Less Than Detection Limit.
257

NRCDEQ2REP
COGEMA Mining Inc.
CHRISTENSEN RANCH
Mine Unit 4 INTERIOR SHALLOW SAND MONITOR WELL
I.D. 4SRM-07 2nd Half,1999
Water Quality Specific Total PiezometricParameters Chloride Conductance Alkalinity pH Uranium Elevation
Units mg/1 g mho/cm mg/i as CaCO3 mg/1 msl
Upper Control Limit 19.4 1175 447.1
Date
22 JUL 1999
17 AUG 1999
20 SEP 1999
04 OCT 1999
17 NOV 1999
16 DEC 1999
8.9
9.0
9.0
9.3
10.0
10.0
506
500
505
500
496
499
249.6
242.4
237.7
238.5
246.0
249.5
8.6
8.2
8.2
8.2
8.2
8.2
4587.3
4587.8
4587.3
4587.1
4587.0
4586.7
* Values Exceed Upper Control Limit
Negative U308 Grades Indicate Less Than Detection Limit.
4SRM-07
258

NRCDEQ2REP
COGEMA Mining Inc.
CHRISTENSEN RANCH
Mine Unit 5 INTERIOR SHALLOW SAND MONITOR WELL
2nd Half, 1Well I.D. 5SM1
Water Quality Specific Total PiezometricParameters Chloride Conductance Alkalinity pH Uranium Elevation
Units mg/1 g mho/cm mg/I as CaCO3 mg/I msl
Upper Control Limit 22.1 2922 316.6
Date
13 JUL 1999
28 JUL 1999
10 AUG 1999
23 AUG 1999
07 SEP 1999
20 SEP 1999
04 OCT- 1999
19 OCT 1999
03 NOV 1999
16 NOV 1999
30 NOV.1999
14 DEC. 1999
27 DEC 1999
7.8
8.1
8.2
8.4
8.0
7.8
8.2
8.1
7.5
7.3
7.4
7.5
7.5
1240
1252
1259
1260
1233
1245
1244
1249
1247
1246
1237
1229
1232
92.1
94.2
94.2
108.0
109.2
107.6
107.5
105.0
95.5
99.2
"100.2.
,90.6
-90.0
8.3
8.0
7.8
8.0
7.8
8.3
8.3
8.2
7.8
8.3
8.3
8.3
8.2
4632.5
4632.4
4632.5
4632.3
4632.2
4632.6
4632.7
4632.5
4632.A
4632 •
4632.7
4632.9
4632.6
* Values 'Exceed Upper Control Limit
Negative U308 Grades Indicate Less Than Detection Limit.
5SM1
259

NRCDE02REP
COGEMA Mining Inc.
CHRISTENSEN RANCH
INTERIOR SHALLOW SAND MONITOR WELLMine Unit 5
I.D. 5SM2 2nd Half,1999
Water Quality Specific Total PiezometricParameters Chloride Conductance Alkalinity pH Uranium Elevation
Units mg/i [ mho/cm mg/l as CaCO3 mg/l msl
Upper Control Limit 22.1 2922 316.6
Date
13 JUL 1999
28 JUL 1999
10 AUG 1999
23 AUG 1999
08 SEP 1999
21 SEP 1999
05 OCT 1999
19 OCT 1999
03 NOV 1999
16NOV 1999
30 NOV1999
'14-DEC 1999
28 DEC 1999
7.2
6.8
6.5
6.5
7.0
6.5
6.7
7.0
6.9
7.0
,6.8
6.7
6.6
1186
1199
1192
1196
1183
1196
1189
1191
1191
1194
1182
1174
1183
101.1
98.8
95.0
95.2
100.3
93.1
98.3
98.2
97.3
-.98.0
•96:3-
94.6
94.2
8.1
7.9
8.0
7.9
8.1
8.0
7.9
8.1
8.0
8.0
8.1
8.0
8.0
4677.9
4678.0
4677.9
4677.9
4677.8
4677.8
4677.8
4678.0
4677.7
4677.7
467,7.2
4677.5
4677.4
* Values Exceed Upper Control Limit
Negative U308 Grades Indicate Less Than Detection Limit.
5SM2
260

NRCDEQ2REP
COGEMA Mining Inc.
CHRISTENSEN RANCH
Mine Unit 5 INTERIOR SHALLOW SAND MONITOR WELL
2nd Half, 1Well I.D. 5SM3
Water Quality Specific Total PiezometricParameters Chloride Conductance Alkalinity pH Uranium Elevation
Units mg/l g mho/cm mg/1 as CaCO3 mg/l msl
Upper Control Limit 22.1 2922 316.6
Date
13 JUL 1999
28 JUL 1999
10 AUG 1999
25 AUG 1999
08 SEP 1999
21 SEP 1999
05 OCT 1999
19 OCT 1999
03 NOV 1999
16 NOV 1999
30 NOV 1999
14 DEC 1999
28 DEC 1999
7.8
7.3
7.0
7.0
7.0
7.0
7.0
7.5
7.3
7.3
7.3
7.1
7.3
1286
1306
1293
1288
1289
1302
1282
1293
1285
1298
1280
1269
1272
92.6
94.8
87.6
90.0
90.9
89.7
97.4
91.5
89.8
89.5
'87.6,
86.8
87.3
8.5
8.0
8.4
8.2
8.2
8.3
8.4
8.3
8.3
8.5
8.5,
.8:5;.
8A
4677.8
4677.6
4677.6
4677.3
4677.6
4677.6
4677.7
4677.4
4676.1
46775
467T7.
4677.3
4677.0
* Values Exceed Upper Control Limit
Negative U308 Grades Indicate Less Than Detection Limit.
5SM3
261

NRCDEQ2REP
COGEMA Mining Inc.
CHRISTENSEN RANCH
INTERIOR SHALLOW SAND MONITOR WELLMine Unit 5
I.D. 5SM5 2nd Half,1999
Water Quality Specific Total PiezometricParameters Chloride Conductance Alkalinity pH Uranium Elevation
Units mg/1 p mho/cm mg/l as CaCO3 mg/l msl
Upper Control Limit 22.1 2922 316.6
Date
13 JUL 1999
28 JUL 1999
10 AUG 1999
25 AUG 1999
08 SEP 1999
21 SEP 1999
05 OCT 1999
19 OCT 1999
03 NOV 1999
16 NOV 1999
30 NOV 1999
14 DEC 1999
28 DEC 1999
5.6
6.2
5.8
5.8
5.8
5.7
5.8
6.2
6.1
6.3
5.9
5.9
5.9
1388
1383
1378
1383
1391
1394
1374
1377
1370
1379
1396
1377
1371
105.3
111.3
107.6
109.1
110.5
106.4
116.3
109.5
110.9
111.8
11,1.8
110.8
109.8
7.8
7.7
7.8
7.6
7.9
7.8
7.7
7.7
7.7
7.8
7.8.
7.8
7.8
4684.7
4684.2
4684.0
4683.7
4683:8
4683.5
4683.5
4683.5
4683.3
4683.3
4683.3
4683.3
4683.3
* Values Exceed Upper Control Limit
Negative U308 Grades Indicate Less Than Detection Limit.
5SM5
262

NRCDEQ2REP
COGEMA Mining Inc.
CHRISTENSEN RANCH
INTERIOR SHALLOW SAND MONITOR WELLMine Unit 5
2nd Half, 1Well I.D. 5SM6
Water Quality Specific Total PiezometricParameters Chloride Conductance Alkalinity pH Uranium Elevation
Units mg/I pt mho/cm mg/i as CaCO 3 mg/l msl
Upper Control Limit 22.1 2922' 316.6
Date
13 JUL 1999
28 JUL 1999
10 AUG 1999
25 AUG 1999
08 SEP 1999
21 SEP 1999
. 05 OCT 1999
19 OCT 1999
03 NOV 1999
16NOV 1999
30 NOV 1999
14 DEC 1999
28 DEC 1999
8.8
9.5
8.9
8.9
9.0
9.0
9.3
9.5
9.4
9.3
9.4
9.4
9.6
658
655
654
652
652
659
646
655
653
654
648
647
644
177.8
183.9
182.1
179.5
181.6
181.5
187.0
185.7
189.4
185.2
179.0
182.9
182.2
8.5
8.3
8.4
8.4
8.5
8.3
8.4
8.4
8.3
8.4
8.5
8.4
8.4
4671.9
4672.1
4672.2
4672.1
4672.1
4672.1
4672.1
4671.9
4671.j
4671.
4671:8,
4671.8
4671.8
* Values Exceed Upper Control Limit
Negative U308 Grades Indicate Less Than Detection Limit.
5SM6
263
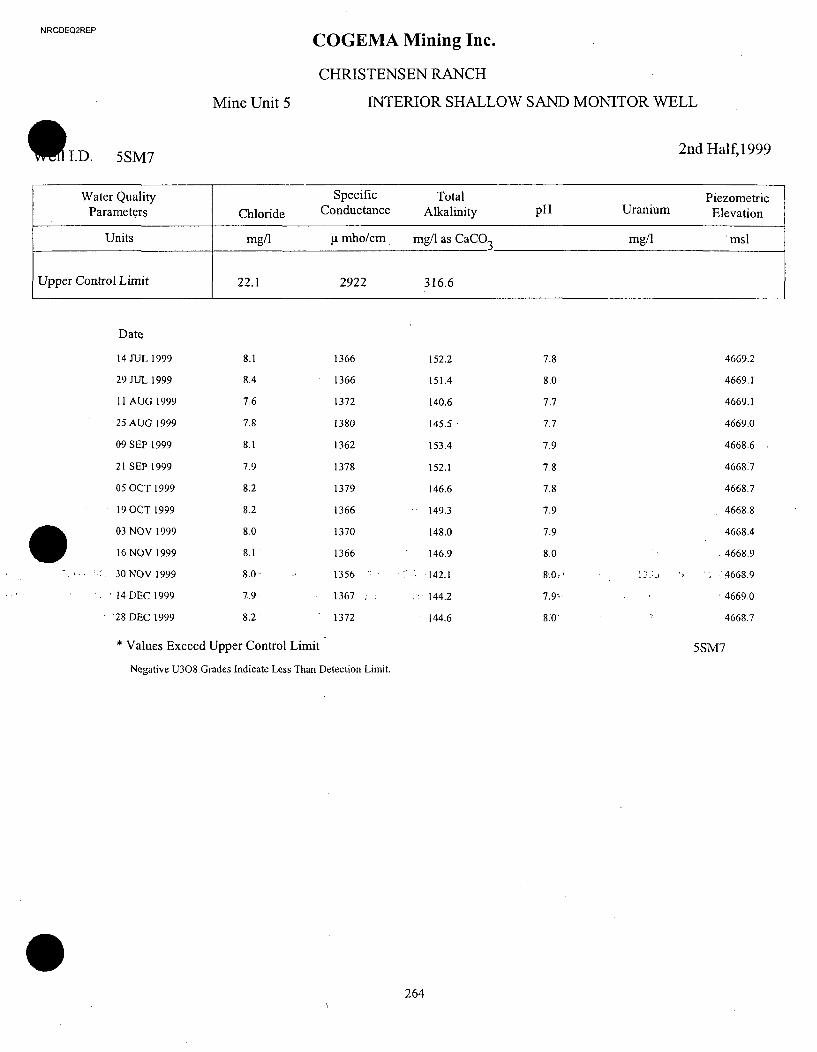
NRCDEQ2REP
COGEMA Mining Inc.
CHRISTENSEN RANCH
INTERIOR SHALLOW SAND MONITOR WELLMine Unit 5
I.D. 5SM7 2nd Half, 1999
Water Quality Specific Total PiezometricParameters Chloride Conductance Alkalinity pH Uranium Elevation
Units mg/i ýt mho/cm mg/l as CaCO3 mg/i msl
Upper Control Limit 22.1 2922 316.6
Date
14 JUL 1999
29 JUL 1999
11 AUG 1999
25 AUG 1999
09 SEP 1999
21 SEP 1999
05 OCT 1999
19 OCT 1999
03 NOV 1999
16 NOV 1999
30 NOV 1999
14 DEC 1999
128 DEC 1999
8.1
8.4
7.6
7.8
8.1
7.9
8.2
8.2
8.0
8.1
8.0
7.9
8.2
1366
1366
1372
1380
1362
1378
1379
1366
1370
1366
1356
1367
1372
152.2
151.4
140.6
145.5
153.4
152.1
146.6
149.3
148.0
146.9
142.1
144.2
144.6
7.8
8.0
7.7
7.7
7.9
7.8
7.8
7.9
7.9
8.0
8.0,:
7.94ý
8.0q
4669.2
4669.1
4669.1
4669.0
4668.6
4668.7
4668.7
4668.8
4668.4
4668.9
• - , ". , 4668.9
4669.0
4668.7
* Values Exceed Upper Control Limit
Negative U308.Grades Indicate Less Than Detection Limit.
5SM7
264

fflNfl9•P
COGEMA Mining Inc.
CHRISTENSEN RANCH
Mine Unit 5 INTERIOR SHALLOW SAND MONITOR WELL
Well I.D. WCOW-04 2nd Half,1
Water Quality Specific Total PiezometricParameters Chloride Conductance Alkalinity pH Uranium Elevation
Units mg/l ýt mho/cm mg/l as CaCO 3 mg/i msl
Upper Control Limit 22.1 2922 316.6
Date
13 JUL 1999 6.4 974 109.7 8.4 4654.1
28 JUL 1999 6.3 986 108.8 8.3 4654.2
10 AUG 1999 6.1 974 102.4 8.4 4654.0
23 AUG 1999 6.0 980 102.8 8.2 4654.0
08 SEP 1999 6.0 969 104.2 8.2 4654.4
20 SEP 1999 6.0 978 102.1 8.1 4654.4
04 OCT 1999 6.1 973 105.7 8.1 4654.8
19 OCT 1999 6.3 979 104.9 8.3 4654.6
03 NOV 1999 6.3 973 106.3 8.2 4654.j
16 NOV 1999 6.5 974 106.8 8.2 4654.
30 NOV 1999 6.3 975 104.0 , 8.3 . 4654.6,
14 DEC 1999 6.2 966 102.2 8.3 4654.7
27 DEC 1999 6.7 964 109.9 8.3 4654.4
• Values Exceed Upper Control Limit WCOW-04
Negative U308 Grades Indicate Less Than Detection Limit.
265

NRCDEQ2REP
COGEMA Mining Inc.
CHRISTENSEN RANCH
Mine Unit 6 INTERIOR SHALLOW SAND MONITOR WELL
,I.D. 6SM1 2nd Half, 1999
Water Quality Specific Total PiezometricParameters Chloride Conductance Alkalinity pH Uranium Elevation
Units mg/1 gt mho/cm mg/1 as CaCO3 mg/1 msl
Upper Control Limit 22 1966 289.1
Date
08 JUL 1999
22 JUL 1999
04 AUG 1999
19 AUG 1999
01 SEP 1999
15 SEP 1999
29 SEP 1999
13 OCT 1999
27 OCT 1999
08 NOV 1999
22 NOV 1999
08 DEC 1999
20 DEC 1999
7.9
7.8.
7.2
7.3
7.7
7.2
7.0
7.5
7.4
7.6
7.1
7.1
7.7
1164
1166
1175
1158
1165
1184
1178
1185
1164
1169
1132
1130
1175
100.5
100.3
97.6
98.1
105.4
98.1
96.4
100.4
100.8
102.8.
'98.4
-97.6 ,
,100.7
8.3
8.3
8.3
8.3
8.3
8.1
8.3
8.3
8.3
8.4
8.5
8.3
8.3
4703.9
4703.8
4703.7
4703.6
4703.7
4703.6
4703.9
4703.8
4703.9
4704.0
4700.5, .
4703.9
4703.6
* Values Exceed Upper Control Limit
Negative U308 Grades Indicate Less Than Detection Limit.
6SM1
266

COGEMA Mining Inc.
CHRISTENSEN RANCH
Mine Unit 6 INTERIOR SHALLOW SAND MONITOR WELL
Well I.D. 6SM2 2nd Half,l
Water Quality Specific Total PiezometricParameters Chloride Conductance Alkalinity pH Uranium Elevation
Units mg/1 p mho/cm mg/I as CaCO3 mg/1 msl
Upper Control Limit 24.2 3574 238.2
Date
08 JUL 1999 8.4 1996 89.1 7.9 4707.6
22 JUL 1999 7.7 1978 83.7 7.9 4707.4
04 AUG 1999 7.6 1986 83.8 7.8 4707.2
19 AUG 1999 7.7 1981 84.8 7.9 4707.3
01 SEP 1999 7.7 1976 84.8 7.8 4707.3
15 SEP 1999 7.4 2003 83.7 7.7 4707.6
29 SEP 1999 7.4 2000 82.5 7.8 4707.5
13 OCT 1999 8.0 2012 86.6 7.8 4707.6
27 OCT 1999 7.8 1978 86.0 7.9 4707.1
08 NOV 1999 8.0 1965 86.9 7.9 4708.
1ý 22 NOV 1999 7.6 . . 1969 .'86.8 8.0 . . 4707.8
08 DEC 1999 7.6 . . 1962 .837 7.9 . 4707.6
20 DEC 1999 8.2 1957 86.8 7.8 4707.5
* Values Exceed Upper Control Limit 6SM2
Negative U308 Grades Indicate Less Than Detection Limit.
267

NRCDEQ2REP
COGEMA Mining Inc.
CHRISTENSEN RANCH
Mine Unit 6 INTERIOR SHALLOW SAND MONITOR WELL
II.D. 6SM3 2nd Half,1999
Water Quality Specific Total PiezometricParameters Chloride Conductance Alkalinity pH Uranium Elevation
Units mg/i [t mho/cm mg/i as CaCO 3 mg/l msl
Upper Control Limit 24.2 3574 238.2
Date
08 JUL 1999
22 JUL 1999
04 AUG 1999
19 AUG 1999
01 SEP 1999
15 SEP 1999
29 SEP 1999
13 OCT 1999
27 OCT 1999
08 NOV 1999
22 NOV 1999
08 DEC 1999
20 DEC 1999
8.5
8.0
7.7
7.8
7.7
7.6
7.7
8.1
8.1
8.4
.7:8.
,,7:7,.
8.1
1970
1958
1972
1959
1958
2013
1986
1997
1946
1968
1969
1960
1967
65.5
64.1
62.0
62.9
65.2
69.3
65.4
66.5
66.6
68.8
,71.6
66.9
68.0
7.9
7.9
7.8
7.9
7.9
7.6
7.7
7.9
719
8.0
8.0Y
7.9
7.8
4716.2
4716.1
4716.1
4716.8
4716.1
4715.9
4715.9
4710.5
4710.1
4712.2
4715.8
4716.1
4716.3
* Values Exceed Upper Control Limit
Negative U308 Grades Indicate Less Than Detection Limit.
6SM3
268
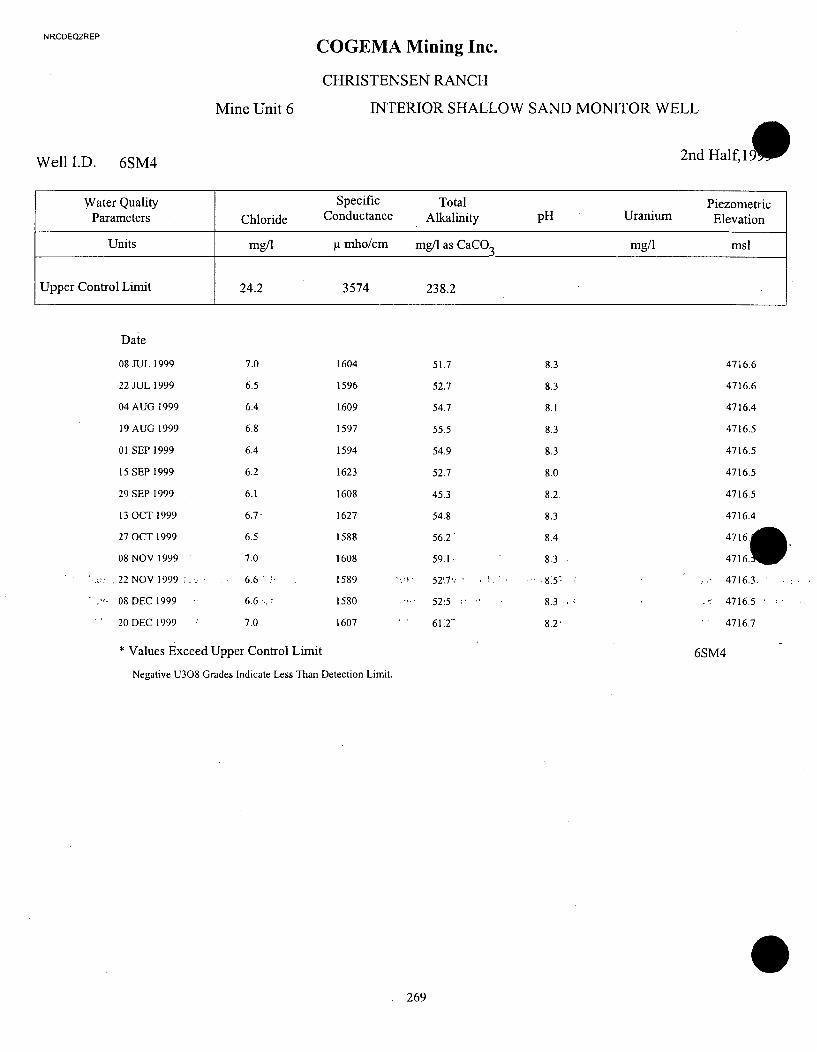
NRCOEQ2REP
COGEMA Mining Inc.
CHRISTENSEN RANCH
Mine Unit 6 INTERIOR SHALLOW SAND MONITOR WELL
2nd Half, 1Well I.D. 6SM4
Water Quality Specific Total PiezometricParameters Chloride Conductance Alkalinity pH Uranium Elevation
Units mg/i g mho/cm mg/l as CaCO3 mg/i msl
Upper Control Limit 24.2 3574 238.2
Date
08 JUL 1999
22 JUL 1999
04 AUG 1999
19 AUG 1999
01 SEP 1999
15 SEP 1999
29 SEP 1999
13 OCT 1999
27 OCT 1999
08 NOV 1999
22 NOV 1999
08 DEC 1999
20 DEC 1999
7.0
6.5
6.4
6.8
6.4
6.2
6.1
6.7-
6.5
7.0
6.6
6.6
7.0
1604
1596
1609
1597
1594
1623
1608
1627
1588
1608
1589
1580
1607
51.7
52.7
54.7
55.5
54.9
52.7
45.3
54.8
56.2
59.1
• 52T7v'
52!5
61.2-
8.3
8.3
8.1
8.3
8.3
8.0
8.2.
8.3
8.4
8.3
8•5
8.3
8.2'
4716.6
4716.6
4716.4
4716.5
4716.5
4716.5
4716.5
4716.4
4716-*
4716. W
4716.3.
4716:5
4716.7
* Values Exceed Upper Control Limit
Negative U308 Grades Indicate Less Than Detection Limit.
6SM4
269

•NnCOEQRPp
COGEMA Mining Inc.
CHRISTENSEN RANCH
Mine Unit 6 INTERIOR SHALLOW SAND MONITOR WELL
I.D. 6SM5 2nd Half, 1999
Water Quality Specific Total PiezometricParameters Chloride Conductance Alkalinity pH Uranium Elevation
Units mg/1 p mho/cm mg/1 as CaCO3 mg/l msl
Upper Control Limit 22 1966 289.1
Date
08 JUL 1999 8.2 1615 98.1 8.0 4712.8
22 JUL 1999 7.7 1602 94.8 8.0 4712.6
04 AUG 1999 7.4 1615 92.0 7.8 4712.8
19 AUG 1999 7.7 1611 94.8 7.9 4712.8
01 SEP 1999 7.3 1604 96.6 7.9 4712.4
15 SEP 1999 7.3 1632 95.8 7.7 4712.6
29 SEP 1999 7.4 1623 92.9 7.8 4712.6
13 OCT 1999 7.2 1637 99.8 8.0 4712.5
27 OCT 1999 8.0 1592 96.4 8.0 4712.4
08 NOV 1999 8.1 1599 95.6 8.0 4712.9
23 NOV 1999 7.8 1600 "95.8" 8.0,: 4712.7
.08 DEC 1999 7.5 1583 92.2 8.0 4712.4
20 DEC 1999 7.8 1603 94.0 8.0 4712.8
* Values Exceed Upper Control Limit 6SM5
Negative U308 Grades Indicate Less Than Detection Limit.
270

NJ~CflNlPCFP
COGEMA Mining Inc.
CHRISTENSEN RANCH
Mine Unit 6 INTERIOR SHALLOW SAND MONITOR WELL
Well I.D. 6SM6 2nd Half, I
Water Quality Specific Total PiezometricParameters Chloride Conductance Alkalinity pH Uranium Elevation
Units mg/i .t mho/cm mg/I as CaCO 3 mg/l msl
Upper Control Limit 22 1966 289.1
Date
08 JUL 1999 11.9 505 260.0 8.4 4695.6
22 JUL 1999 12.1 501 247.9 8.3 4695.3
03 AUG 1999 11.7 510 245.3 8.3 4695.1
19 AUG 1999 11.4 502 244.6 8.3 4695.1
01 SEP 1999 11.3 500 242.7 8.3 4694.9
15 SEP 1999 11.1 510 242.2 8.1 4694.8
29 SEP 1999 11.4 . 508 243.9 8.2 4694.7
13 OCT 1999 11.9 511 252.6 8.3 4694.3
27 OCT 1999 11.8 497 250.0 8.3 4694.41
09 NOV 1999 11.8 499 246.4 8.3 " -,4694.4
23 NOV 1999. . 11.5:', 491 . 246.0 - 8.3 . . 4695.0
08 DEC 1999 112' '. . 495 242.3 8.3 . .4694.6
20 DEC 1999 11.7 500 243.2 8.3 4694.9
• Values Exceed Upper Control Limit 6SM6
Negative U308 Grades Indicate Less Than Detection Limit.
271

NRCOEQ2REP
COGEMA Mining Inc.
CHRISTENSEN RANCH
Mine Unit 6 INTERIOR SHALLOW SAND MONITOR WELL
II.D. 6SM7 2nd Half,1999
Water Quality Specific Total PiezometricParameters Chloride Conductance Alkalinity pH Uranium Elevation
Units mg/I ýi mho/cm mg/l as CaCO 3 mg/1 msl
Upper Control Limit 25.6 889 330
Date
08 JUL 1999
22 JUL 1999
03 AUG 1999
19 AUG 1999
01 SEP 1999
15 SEP 1999
29 SEP 1999
13 OCT 1999
27 OCT 1999
09 NOV 1999
23 NOVW1999
08 DEC 1999
20 DEC1999
11.8
11.1
11.0
10.8
11.0
10.9
10.9
11.5
11.2
11.5
11:3
11.2
11.3
502
505
504
498
496
504
502
511
498
498
490
492
495
259.4
244.3
246.7
243.3
246.4
242.5
240.0
256.9
247.4
249.8
252.4
242.1`
242.8
8.4
8.3
8.3
8.4
8.4
8.2
8.3
8.4
8.4
8:4
-8A4
8:4
8.4
4695.5
4695.4
4695.1
4695.0
4694.7
4694.8
4694.4
4694.2
4694.3
4694.4
4694.4
4694.4'
4694.7
* Values Exceed Upper Control Limit
Negative U308 Grades Indicate Less Than Detection Limit.
6SM7
272

NRCDEQ2REP
COGEMA Mining Inc.
CHRISTENSEN RANCH
Mine Unit 6 INTERIOR SHALLOW SAND MONITOR WELL
2nd Half, IWell I.D. 6SM8
Water Quality Specific Total PiezometricParameters Chloride Conductance Alkalinity pH Uranium Elevation
Units mg/i ji mho/cm mg/l as CaCO3 mg/1 msl
Upper Control Limit 24.2 3574 238.2
Date
08 JUL 1999
22 JUL 1999
03 AUG 1999
18 AUG 1999
31 AUG 1999
14 SEP 1999
28 SEP 1999
12 OCT 1999
27 OCT 1999
09 NOV 1999
23 NOV 1999
, t. 07 DEC 1999
20 DEC 1999
10.7
10.2
9.8
9.7
9.8
9.8
9.8
10.1
10.5
10.3
10.3
10.6
10.9
2261
2254
2271
2260
2261
2272
2223
2254
2248
2246
2247
2225
2230
53.7
52.4
51.7
52.9
53.8
51.8
52.6
53.6
54.4
53.1
-:• .Z 54.1"
58.0.
53.5
7.7
7.9
7.6
7.7
7.7
7.4
7.7
7.6
7.9
7.7
7.9
7.8
7.7
4731.0
4731.2
4731.4
4731.5
4731.3
4731.2
4731.2
4731.2
4731'0
4731
4731.7
4731.T
4731.6
* Values Exceed Upper Control Limit
Negative U308 Grades Indicate Less Than Detection Limit.
6SM8
273

NRCDEQ2REP
COGEMA Mining Inc.
CHRISTENSEN RANCH
Mine Unit 6 INTERIOR SHALLOW SAND MONITOR WELL
SI.D. 6SM9 2nd Half, 1999
Water Quality Specific Total PiezometricParameters Chloride Conductance Alkalinity pH Uranium Elevation
Units mg/i p mho/cm mg/i as CaCO3 mg/l msl
Upper Control Limit 24.2 3574 238.2
Date
08 JUL 1999 10.0 2149 21.6 9.6 4732.0
22 JUL 1999 9.4 2167 21.5 9.7 4732.4
03 AUG 1999 9.3 2199 20.4 9.6 4732.3
18 AUG 1999 9.0 2187 20.4 9.8 4732.4
31 AUG 1999 9.1 2171 20.1 9.8 4732.2
14 SEP 1999 9.0 2201 21.9 9.6 4732.2
28 SEP 1999 9.3 2145 19.7 9.6 4732.1
12 OCT 1999. 9.4 2169 19.8 9.8 4732.3
27 OCT 1999 9.2 2173 18.7 9.7 4732.2
09 NOV 1999 9.4 2155 17.5 9.6 4732.6
*23 NOV 1999 9.3 2159. 20.7 9.9 ' .,. " 4732.6
07 DEC 1999 9.4 2146 19.6 9.91 . 4732.6
20 DEC 1999 9.6 2160 18.2 9.7 4732.6
* Values Exceed Upper Control Limit 6SM9
Negative U308 Grades Indicate Less Than Detection Limit.
274

NRCOEQ2REP
COGEMA Mining Inc.
CHRISTENSEN RANCH
INTERIOR SHALLOW SAND MONITOR WELLMine Unit 6
2nd Half, 1Well I.D. 6SM10
Water Quality Specific Total PiezometricParameters Chloride Conductance Alkalinity pH Uranium Elevation
Units mg/l gt mho/cm mg/l as CaCO3 mg/1 msl
Upper Control Limit 25.6 889 330
Date
08 JUL 1999
21 JUL 1999
03 AUG 1999
18 AUG 1999
31 AUG 1999
14 SEP 1999
28 SEP 1999
12 OCT 1999
26 OCT 1999
08 NOV 1999
23 NOV 1999
07 DEC 1999
20 DEC 1999
10.6
10.8
10.3
10.5
10.4
10.0
10.6
10.9
10.6
10.5""
10.i5
10.4
10.7
670
663
665
650
661
659
658
663
665
673
657
659
673
253.6
250.4
238.7
235.5
239.4
232.3
237.1
244.4
246.3
245.1
245.7
239.6
237.9
8.4
8.6
8.5
8.5
8.6
8.5
8.5
8.5
8.4
8.4
8.5:
8.4-
8.4
4689.5
4688.0
4687.5
4687.6
4687.3
4687.3
4687.3
4687.3
4687.4
4687.
4687.6
4688.0
4687.7
6SM10* Values Exceed Upper Control Limit
Negative U308 Grades Indicate Less Than Detection Limit.
275

NRCDEQ2REP
COGEMA Mining Inc.
CHRISTENSEN RANCH
Mine Unit 6 INTERIOR SHALLOW SAND MONITOR WELL
I.D. 6SM11 2nd Half, 1999
Water Quality Specific Total PiezometricParameters Chloride Conductance Alkalinity pH Uranium Elevation
Units mg/i p mho/cm mg/l as CaCO3 mg/I msl
Upper Control Limit 24.2 3574 238.2
Date
08 JUL 1999
21 JUL 1999
03 AUG 1999
18 AUG 1999
30 AUG 1999
14 SEP 1999
28 SEP 1999
12 OCT 1999
26 OCT 1999
08 NOV 1999
23"NOV 1999
07 DEC 1999
20 DEC 1999
13.7
13.5
13.1
13.0
13.2
13.0
13.2
13.5
13.8
13.2
13".9
13.2'
13.1
2581
2584
2608
2582
2596
2628
2621
2610
2594
2618
2605
2600
2620
48.6
58.7
58.7
56.5
61.4
60.8
61.0
66.8
76.7
65.1
68.9
82.0
74;.8
8.3
8.7
8.5
8.6
8.6
8.4
8.5
8.4
8.4
8.1
8.4.,
8.3
8.2
4732.2
4732.4
4732.7
4733.0
4733.0
4733.5
4733.5
4733.8
4733.6
4734.0
4734.2
4734.2
4734.3
* Values Exceed Upper Control Limit
Negative U308 Grades Indicate Less Than Detection Limit.
6SM11
276

NRCDEQ2REP
COGEMA Mining Inc.
CHRISTENSEN RANCH
Mine Unit 6 INTERIOR SHALLOW SAND MONITOR WELL
2nd Half, 1Well I.D. 6SM12
Water Quality Specific Total PiezometricParameters Chloride Conductance Alkalinity pH Uranium Elevation
Units mg/1 p mho/cm mg/I as CaCO3 mg/i msl
Upper Control Limit 24.2 3574 238.2 8.5
Date
08 JUL 1999
21 JUL 1999
03 AUG 1999
18 AUG 1999
30 AUG 1999
14 SEP 1999
28 SEP 1999
12 OCT 1999
26 OCT 1999
09NOV 1999
23 NOV 1999
07 DEC 1999
20 DEC 1999
12.6
12.0
12.1
12.8
12.7
12.7
11.7
12.2
12.8
13.1
13.0
12.7
12.6
2658
2658
2652
2643
2642
2666
2643
2666
2661
2674
2674
2667
2686
109.8
108.6
106.9
104.3
103.7
106.8
99.3
106.2
103.9
* 104.5.
"103.1
105.0
+ 108.9
7.7
7.8
7.8
7.6
7.8
7.5
7.6
7.7
7.7
7.7
7.6.
7.6
7.8
4731.4
4731.6
4731.5
4731.8
4731.7
4732.0
4731.8
4731.9
4731.
4732!
,,4732.4
4732.4
4732.4
* Values Exceed Upper Control Limit
Negative U308 Grades Indicate Less Than Detection Limit.
6SM12
277

NRCDEQ2REP
COGEMA Mining Inc.
CHRISTENSEN RANCH
INTERIOR SHALLOW SAND MONITOR WELLMine Unit 6
I.D. 6SM13 2nd Half, 1999
Water Quality Specific Total PiezometricParameters Chloride Conductance Alkalinity pH Uranium Elevation
Units mg/i g mho/cm mg/l as CaCO 3 mg/1 msl
Upper Control Limit 24.2 3574 238.2
Date
08 JUL 1999
22 JUL 1999
03 AUG 1999
18 AUG 1999
31 AUG 1999
14 SEP 1999
28 SEP 1999
12 OCT 1999
26 OCT 1999
09 NOV 1999
23 NOV 1999
07 DEC 1999
20 DEC 1999
12.8
12.1
11.9
11.6
11.9
11.8
12.1
12.6
12.3
12.3
12.0
12.1
12.2
2200
2210
2215
2208
2206
2224
2178
2195
2195
2192
2193
2183
2188
72.0
69.5
69.0
67.0
69.6
68.0
70.5
72.3
71.3
71.0
72.5
73.5
70.2
7.8
7.8
7.7
7.8
7.9
7.5
7.7
7.7
7.8
7.7
79:
7:8
7.8
4731.0
4731.3
4731.1
4731.5
4731.3
4731.2
4731.2
4731.2
4731.2
4731.7
4731.3
4731.5
4731.7
* Values Exceed Upper Control Limit
Negative U308 Grades Indicate Less Than Detection Limit.
6SM13
278

NRCDEQ2REP
COGEMA Mining Inc.
CHRISTENSEN RANCH
Mine Unit 6 INTERIOR SHALLOW SAND MONITOR WELL
2nd Half, 1Well I.D. 6SM14
Water Quality Specific Total PiezometricParameters Chloride Conductance Alkalinity pH Uranium Elevation
Units mg/1 [ mho/cm mg/i as CaCO 3 mg/1 msl
Upper Control Limit 22 1966 289.1
Date
08 JUL 1999
21 JUL 1999
03 AUG 1999
18 AUG 1999
31 AUG 1999
14 SEP 1999
28 SEP 1999
12 OCT 1999
26 OCT 1999
08 NOV 1999
23 NOV 1999
07 DEC 1999
20 DEC'1999
7.6
7.6
7.1
7.0
7.2
7.0
7.0
7.5
7.5
7.4
7.3,
7.4,
7.3
1105
1101
1104
1085
1103
1109
1097
1108
1112
1114
1111
1094
1109
129.2
128.9
121.1
120.6
124.1
121.9
122.6
126.7
127.4
126.3
126.1'
124.3 .
121.4
8.5
8.6
8.4
8.5
8.5
8.3
8.4
8.4
8.4
8.4
8.5 . .
8.5.
8.4
4712.5
4712.4
4712.2
4712.4
4712.5
4712.3
4712.4
4712.3
4712.
4712.4
4712.4
4712.7
4712.6
* Values Exceed Upper Control Limit
Negative U308 Grades Indicate Less Than Detection Limit.
6SM14
279

CHRISTENSEN RANCH
INTERIOR DEEP SAND MONITOR WELLS

NRCOE02REP
COGEMA Mining Inc.
CHRISTENSEN RANCH
Mine Unit 5 INTERIOR DEEP SAND MONITOR WELL
II.D. MW-12D 2nd Half,1999
Water Quality Specific Total PiezometricParameters Chloride Conductance Alkalinity pH Uranium Elevation
Units mg/i [t mho/cm mg/l as CaCO 3 mg/l msl
Upper Control Limit 22.8 1017 420.9
Date
13 JUL 1999
28 JUL 1999
10 AUG 1999
23 AUG 1999
08 SEP 1999
20 SEP 1999
04 OCT 1999
19 OCT 1999
02 NOV 1999
16 NOV 1999
30 NOV 1999
14 DEC 1999
27 DEC 1999
11.0
10.7
10.0
9.9
11.0
9.9
10.4
10.8
10.2
10.4
10.2
10.2
10.6
609
620
608
609
598
609
602
606
605
609
608
602
609
147.9
148.1
139.5
139.4
139.3
139.0
148.9
145.2
146.6
142.9
:139:.0
138.7
135.8
8.5
8.4
8.4
8.3
8.4
8.3
8.3
8.5
8.3
8.4
8.4
8.4
8.4
4608.1
4608.1
4608.0
4608.0
4608.1
4608.4
4608;2
4608.2
4608.0
4605.1
4608.2
4608.6
4608.3
* Values Exceed Upper Control Limit
Negative U308 Grades Indicate Less Than Detection Limit.
MW-12D
280

NRCDEQ2REP
COGEMA Mining Inc.
CHRISTENSEN RANCH
INTERIOR DEEP SAND MONITOR WELLMine Unit 3
Well I.D. MW45D 2nd Half, 1
Water Quality Specific Total PiezometricParameters Chloride Conductance Alkalinity pH Uranium Elevation
Units mg/I p mho/cm mg/l as CaCO3 mg/i msl
Upper Control Limit 13.7 753 153.3
Date
27 JUL1999 =
24 AUG 1999
21 SEP 1999
11 OCT 1999
09 NOV 1999
16 DEC 1999
.9.5
8.9
9.1
9.7
9.7
9.7
610
614
617
623
623
622
132.1
125.8
124.9
130.4
123.7
127.5
8.6
8.5
8.5
8.5
8.5
8.6
4539.8
4537.6
4538.6
4538.7
4540.8
4539.1
* Values Exceed Upper Control Limit
Negative U308'rades Indicate Less Than Detection Limit.
MW45D
281

NRCDEQ2REP
COGEMA Mining Inc.
CHRISTENSEN RANCH
Mine Unit 3 INTERIOR DEEP SAND MONITOR WELL
II.D. MW47D 2nd Half, 1999
Water Quality Specific Total PiezometricParameters Chloride Conductance Alkalinity pH Uranium Elevation
Units mg/1 ps mho/cm mg/l as CaCO3 mg/l msl
Upper Control Limit 13.7 753 153.5
Date
27 JUL 1999
24 AUG 1999
21 SEP 1999
11 OCT 1999
09 NOV 1999
16 DEC 1999
9.5
8.8
9.1
9.6
9.5
9.4
600
625
618
632
619
621
141.5
124.5
125.8
133.1
127.6
128.9
8.8
8.6
8.6
8.6
8.6
8.7
4540.9
4538.7
4539.6
4540.0
4540.2
4540.2
* Values Exceed Upper Control Limit
Negative U308 Grades Indicate Less Than Detection Limit.
MW47D
282

NRCDEQ2REP
COGEMA Mining Inc.
CHRISTENSEN RANCH
Mine Unit 3 INTERIOR DEEP SAND MONITOR WELL
2nd Half, 19ýWell I.D. MW49D
Water Quality Specific Total PiezomeParameters Chloride Conductance Alkalinity pH Uranium Elevati
tricon
Units mg/1 tL mho/cm mg/l as CaCO3 mg/l msli
Upper Control Limit 13.7 753 153.3
Date
27 JUL 1999
24 AUG 1999
21 SEP 1999
11 OCT 1999
09 NOV 1999
16 DEC 1999
9.4
8.8
9.1
9.2
9.5
9.6
609
616
620
623
620
619
136.1
130.0
127.2
128.0
128.8
137.3
8.7
8.5
8.5
8.5
8.5
8.6
4544.2
4541.7
4543.4
4543.2
4544.0
4543.1
* Values Exceed Upper Control Limit
Negative U308 Grades Indicate Less Than Detection Limit.
MW49D
283

NRCDEQ2REP
COGEMA Mining Inc.
CHRISTENSEN RANCH
Mine Unit 3 INTERIOR DEEP SAND MONITOR WELL
9 1I.D. MW51D2nd Half, 1999
Water Quality Specific Total PiezometricParameters Chloride Conductance Alkalinity pH Uranium Elevation
Units mg/l ýL mho/cm mg/l as CaCO 3mg/l mst
Upper Control Limit 13.7 753 153.3
Upper Control Limit 13.7 153.3
Date
27 JUL 1999
24 AUG 1999
21 SEP 1999
12 OCT 1999
10 NOV 1999
19 DEC 1999
10.0
9.3
10.0
10.5
10.2
10.0
629
633
655
644
658
639
123.4
115.3
116.2
111.6
110.3
112.4
8.8
9.0
8.9
8.5
9.0
8.7
4537.7
4536.5
4536.8
4536.6
4537.9
4537.7
* Values Exceed Upper Control Limit
Negative U308 Grades Indicate Less Than Detection Limit.
MW51D
284

NRCDEQ2REP
COGEMA Mining Inc.
CHRISTENSEN RANCH
Mine Unit 3 INTERIOR DEEP SAND MONITOR WELL
2nd Half, 1999Well I.D. MW53D
Water Quality Specific Total PiezometricParameters Chloride Conductance Alkalinity pH Uranium Elevation
Units mg/1 g mho/cm mg/l as CaCO3 mg/1 msl
Upper Control Limit 13.7 753 153.3
Date
26 JUL 1999
24 AUG 1999
21 SEP 1999
II OCT 1999
09 NOV 1999
16 DEC 1999
10.7
9.4
9.5
10.0
10.2
10.5
646
657
651
656
652
650
108.3
100.7
101.0
108.8
105.9
110.6
8.7
8.6
8.6
8.7
8.5
8.7
4547.2
4545.5
4546.0
4545.5
4545.6
4546.4
* Values Exceed Upper Control Limit
Negative U308 Grades Indicate Less Than Detection Limit.
MW53D
285

NRCOEQ2REP
COGEMA Mining Inc.
CHRISTENSEN RANCH
Mine Unit 3 INTERIOR DEEP SAND MONITOR WELL
i I.D. MW55D 2nd Half, 1999
Water Quality Specific Total PiezometticParameters Chloride Conductance Alkalinity pH Uranium Elevation
Units mg/i p mho/cm mg/1 as CaCO3 mg/1 msl
Upper Control Limit 13.7 753 153.3
Date
26 JUL 1999
24 AUG 1999
21 SEP 1999
11 OCT 1999
10 NOV 1999
16 DEC 1999
9.7
8.4
8.8
9-0
10.1
10.4
569
563
567
571
595
565
151.0
143.2
142.7
143.8
140.3
141.7
9.0
8.7
8.8
8.8
9.0
8.9
4544.7
4546.5
4546.6
4546.8
4547.5
4547.9
* Values Exceed.Upper Control Limit
Negative U308 Grades Indicate Less Than Detection Limit.
MW55D
286

NRCDE02REP
COGEMA Mining Inc.
CHRISTENSEN RANCH
Mine Unit 3 INTERIOR DEEP SAND MONITOR WELL
Well I.D. MW57D2nd Half, 1999
Water Quality Specific Total PiezometriParameters Chloride Conductance Alkalinity pH Uranium Elevation
C
Units mg/1 ,ti mho/cm mg/i as CaCO 3 mg/l msl
Upper Control Limit 13.7 753 153.3
Date
27 JUL 1999
24 AUG 1999
21 SEP 1999
11 OCT 1999
10NOV 1999
16 DEC 1999
10.2
10.1
10.4
11.0
11.1
11.6
646
644
636
643
646
639
106.0
104.2
103.1
109.6
106.7
110.9
8.6
8.5
8.5
8.6
8.5
8.7
4549.9
4550.9
4551.0
4550.8
4551.6
4552.4
* Values Exceed Upper Control Limit
Negative U308 Grades Indicate Less Than Detection Limit.
MW57D
287

NRCDEQ2REP
COGEMA Mining Inc.
CHRISTENSEN RANCH
Mine Unit 3 INTERIOR DEEP SAND MONITOR WELL
Pa I.D. MW65D 2nd Half, 1999
Water Quality Specific Total Piezometric
Parameters Chloride Conductance Alkalinity pH Uranium Elevation
Units mg/I ýi mho/cm mg/1 as CaCO3 mg/l msl
Upper Control Limit 13.7 753 153.3
Date
26 JUL 1999
24 AUG 1999
21 SEP 1999
I1 OCT 1999
09 NOV 1999
16 DEC 1999
8.3
8.7
9.0
8.6
9.2
8.3
535
594
584
552
605
533
170.3 *
123.0
127.6
154.2 *
123.0
150.8
9.0
9.1
9.1
9.1
9.0
9.2
4557.9
4558.5
4557.6
4557.5
4558.0
4558.6
* Values Exceed Upper Control Limit
Negative U308 Grades Indicate Less Than Detection Limit.
MW65D
288

NECDEQ2REP
COGEMA Mining Inc.
CHRISTENSEN RANCH
Mine Unit 2 INTERIOR DEEP SAND MONITOR WELL
22nd Half, 1999Well I.D. MW67D
Water Quality Specific Total Piezometric
Parameters Chloride Conductance Alkalinity pH Uranium Elevation
Units mg/l p mho/cm mg/l as CaCO 3 mg/l msl
Upper Control Limit 12.9 789 134
Date
22 JUL 1999
10 AUG 1999
13 SEP 1999
06 OCT 1999
02 NOV 1999
01 DEC 1999
9.1
8.7
9.3
9.0
9.1
9.3
573
577
573
573
567
563
169.1 *
162.1 *
163.3 *
169.5 *
168.9 *
166.1 *
8.9
8.8
8.8
8.8
8.8
8.8
4537.4
4536.9
4530.8
4530.1
4536.7
4536.6
* Values Exceed Upper Control Limit
Negative U308 Grades Indicate Less Than Detection Limit.
MW67D
289

NRCDEQ2REP
COGEMA Mining Inc.
CHRISTENSEN RANCH
Mine Unit 2 INTERIOR DEEP SAND MONITOR WELL
#I.D. MW69D 2nd Half,1999
Water Quality Specific Total PiezometricParameters Chloride Conductance Alkalinity pH Uranium Elevation
Units mg/i pL mho/cm mg/i as CaCO3 mg/I nisl
Upper Control Limit 12.9 789 134
Date
22 JUL 1999
10 AUG 1999
13 SEP 1999
05 OCT 1999
02 NOV 1999
01 DEC 1999
9.7
8.8
8.7
9.2
9.5
9.3
635
628
610
627
631
619
128.9
128.1
137.4
137.6
128.8
130.0
*
*
8.8
8.7
8.8
8.8
8.8
8.8
4528.6
4538.0
4531.6
4530.9
4537.8
4537.5
* Values Exceed Upper Control Limit
Negative U308 Grades Indicate Less Than Detection Limit.
MW69D
290

NRCDEQ2REP
COGEMA Mining Inc.
CHRISTENSEN RANCH
Mine Unit 2 INTERIOR DEEP SAND MONITOR WELL
Well I.D. MW71D 2nd Half, 1999
Water Quality Specific Total PiezometricParameters Chloride Conductance Alkalinity pH Uranium Elevation
Units mg/i gi mho/cm mg/i as CaCO 3 mg/I msl
Upper Control Limit 12.9 789 134
Date
22 JUL 1999
10 AUG 1999
13 SEP 1999
05 OCT 1999
02 NOV 1999
01 DEC 1999
9.6
9.0
9.0
9.7
9.3
9.6
645
647
644
648
641
631
123.1
117.5
119.6
127.4
121.7
126.2
8.9
8.8
8.8
8.9
8.8
8.9
4540.3
4539.7
4539.6
4538.7
4538.5
4538.6
* Values Exceed Upper Control Limit
Negative U308 Grades Indicate Less Than Detection Limit.
MW71D
291

NRCDEQ2REP
COGEMA Mining Inc.
CHRISTENSEN RANCH
Mine Unit 2 INTERIOR DEEP SAND MONITOR WELL
2nd Half, 1999I.D. MW91D
Water Quality Specific Total PiezometricParameters Chloride Conductance Alkalinity pH Uranium Elevation
Units mg/1 gt mho/cm mg/i as CaCO3 mg/l msl
Upper Control Limit 12.9 789 134
Date
21 JUL 1999
10 AUG 1999
13 SEP 1999
06 OCT 1999
02 NOV 1999
01 DEC 1999
9.1
8.8
8.9
9.7
9.1
9.6
567
585
587
602
589
585
172.6 *
147.9 *
146.8 *
147.6 *
147.2 *
150.5 *
8.6
8.5
8.4
8.4
8.6
8.6
4537.0
4536.4
4536.0
4535.8
4536.3
4535.9
* Values Exceed Upper Control Limit
Negative U308 Grades Indicate Less Than Detection Limit.
MW91D
292

NRCDEQ2REP
COGEMA Mining Inc.
CHRISTENSEN RANCH
Mine Unit 2 INTERIOR DEEP SAND MONITOR WELL
Well I.D. MW93D 2nd Half,19!
Water Quality Specific Total PiezometricParameters Chloride Conductance Alkalinity pH Urarnum Elevation
C
Units mg/i ýt mho/cm mg/l as CaCO3 mg/I msl
Upper Control Limit 12.9 789 134
Date
22 JUL 1999
10 AUG 1999
13 SEP 1999
06 OCT 1999
02 NOV 1999
01 DEC 1999
10.1
9.3
9.4
9.7
9.3
10.0
664
663
653
665
661
657
109.1
103.5
101.9
104.5
107.3
103.5
8.6
8.4
8.4
8.3
8.6
8.5
4535.4
4535.0
4534.8
4534.2
4535.0
4535.0
* Values Exceed Upper Control Limit
Negative U308 Grades Indicate Less Than Detection Limit.
MW93D
293

NRCDEQ2REP
COGEMA Mining Inc.
CHRISTENSEN RANCH
Mine Unit 2 INTERIOR DEEP SAND MONITOR WELL
I.D. MW95D 2nd Half, 1999
Water Quality Specific Total PiezometricParameters Chloride Conductance Alkalinity pH Uranium Elevation
Units mg/l ýt mho/cm mg/l as CaCO3 mg/I msl
Upper Control Limit 12.9 789 134
Upper Control Limit 12.9 789 134
Date
22 JUL 1999
10 AUG 1999
13 SEP 1999
06 OCT 1999
02 NOV 1999
01 DEC 1999
10.2
9.3
9.3
9.9
9.7
9.9
659
657
649
658
654
649
115.6
113.2
106.4
111.4
111.0
109.4
8.5
8.4
8.5
8.3
8.5
8.4
4536.1
4535.6
4535.5
4535.1
4535.6
4535.5
* Values Exceed Upper Control Limit
Negative U308 Grades Indicate Less Than Detection Limit.
MW95D
294

NRCDEQ2REP
COGEMA Mining Inc.
CHRISTENSEN RANCH
Mine Unit 2 INTERIOR DEEP SAND MONITOR WELL
2nd Half,1999Well I.D. MW97D
Water Quality Specific Total PiezometricParameters Chloride Conductance Alkalinity pH Uranium Elevation
Units mg/l pi mho/cm mg/I as CaCO 3 mg/i msl
Upper Control Limit 13.8 723 143.3
Date
22 JUL 1999
10 AUG 1999
13 SEP 1999
06 OCT 1999
02 NOV 1999
01 DEC 1999
10.9
10.0
10.1
10.3
10.5
10.4
633
636
618
619
613
610
114.0
106.6
109.4
114.0
115.0
114.3
8.5
8.4
8.4
8.4
8.6
8.4
4535.5
4535.2
4535.2
4534.7
4535.2
4535.1
* Values Exceed Upper Control Limit
Negative U308 Grades Indicate Less Than Detection Limit.
MW97D
295

NRCOEQ2REP
COGEMA Mining Inc.
CHRISTENSEN RANCH
Mine Unit 2 INTERIOR DEEP SAND MONITOR WELL
I.D. MW99D 2nd Half, 1999
Water Quality Specific Total PiezomeParameters Chloride Conductance Alkalinity pH Uranium Elevati
Units mg/i Ri mho/cm mg/l as CaCO3 mg/l msl
toncon
Upper Control Limit 13.8 723 143.3
Date
22 JUL 1999
I1 AUG 1999
13 SEP 1999
06 OCT 1999
02 NOV 1999
01 DEC 1999
10.9
9.8
9.8
10.4
10.6
10.1
562
589
570
582
576
563
166.3 *
129.0
143.4 *
141.3
142.5
149.5 *
8.6
8.5
8.6
8.4
8.6
8.6
4532.4
4532.2
4532,2
4531.7
4532,2
4531,7
* Values Exceed Upper Control Limit
Negative U308 Grades Indicate Less Than Detection Limit.
MW99D
296

NRCOEQ2REP
COGEMA Mining Inc.
CHRISTENSEN RANCH
Mine Unit 2 INTERIOR DEEP SAND MONITOR WELL
2nd Half,Well I.D. MWl 13D
Water Quality Specific Total. PiezometricParameters Chloride Conductance Alkalinity pH Uranium Elevation
Units mg/1 gi mho/cm mg/1 as CaCO 3 mg/l msl
Upper Control Limit 13.8 723 143.3
Date
22 JUL 1999
I1 AUG 1999
13 SEP 1999
06 OCT 1999
02 NOV 1999
01 DEC 1999
11.0
9.8
10.1
10.2
10.6
10.5
557
598
553
621
568
536
174.1 *
129.0
160.3 *
121.1
155.6 *
179.7 *
8.8
8.7
8.8
8.6
8.9
8.9
4532.8
4532.8
4532.7
4532.2
4532.6
4532.2
MWl13D* Values Exceed Upper Control Limit
Negative U308 Grades Indicate Less Than Detection Limit.
297

NRCDEQ2REP
COGEMA Mining Inc.
CHRISTENSEN RANCH
Mine Unit 4 INTERIOR DEEP SAND MONITOR WELL
I.D. 4DM-1 2nd Half, 1999
Water Quality Specific Total PiezometricParameters Chloride Conductance Alkalinity pH Uranium Elevation
Units mg/l ýL mho/cm mg/1 as CaCO, mg/l rnslUnits mg/I
Upper Control Limit 14.1 712 189.2
Date
22 JUL 1999
17 AUG 1999
20 SEP 1999
04 OCT 1999
17 NOV 1999
16 DEC 1999
8.7
8.5
8.5
8.7
8.4
8.5
574
565
569
566
561
568
124.0
120.6
121.8
125.1
119.4
119.7
8.7
8.6
8.7
8.6
8.6
8.6
4574.7
4573.6
4573.9
4574.9
4575.3
4574.9
* Values Exceed Upper Control Limit
Negative U308 Grades Indicate Less Than Detection Limit.
4DM-1
298

N RCDEQ2REP
COGEMA Mining Inc.
CHRISTENSEN RANCH
Mine Unit 4 INTERIOR DEEP SAND MONITOR WELL
2nd Half, 19Well I.D. 4DM-4
Water Quality Specific Total Piezom•Parameters Chloride Conductance Alkalinity pH Uranium Elevati
etricion
Units mg/1 pa mho/cm mg/l as CaCO3 mg/1 misl
Upper Control Limit 14.1 712 189.2
Date
22 JUL 1999
17 AUG 1999
20 SEP 1999
04 OCT 1999
17 NOV 1999
16 DEC 1999
8.0
7.7
7.9
7.4
8.1
7.9
515
507
515
512
510
514
144.6
139.6
143.3
137.5
143.0
138.6
8.8
8.6
8.7
8.7
8.7
8.6
4567.6
4566.2
4566.6
4566.2
4566.8
4566.7
* Values Exceed Upper Control Limit
Negative U308 Grades Indicate Less Than Detection Limit.
4DM-4
299

NRCDEQ2REP
COGEMA Mining Inc.
CHRISTENSEN RANCH
Mine Unit 4 INTERIOR DEEP SAND MONITOR WELL
Q .D. 4DM-8 2nd Half, 1999
Water QualityParameters
Specific
Chloride ConductanceTotal
AlkalinityPiezometric
ElevationpH Uranium
Units mg/l pi mho/cm mg/l as CaCO3 mg/i msl
Upper Control Limit 14.1 712 189.2
Date
22 JUL 1999
17 AUG 1999
20 SEP 1999
04 OCT 1999
17 NOV 1999
16 DEC 1999
8.7
8.5
8.3
8.2
8.7
8.6
524
517
522
517
515
520
150.7
144.9
141.9
142.6
147.7
143.4
8.9
8.6
8.7
8.6
8.6
8.6
4561.9
4560.2
4561.0
4561.0
4561.3
4561.5
* Values Exceed Upper Control Limit
Negative U308 Grades Indicate Less Than Detection Limit.
4DM-8
300

NRCDEQ2REP
COGEMA Mining Inc.
CHRISTENSEN RANCH
Mine Unit 4 INTERIOR DEEP SAND MONITOR WELL
2nd Half, 199Well I.D. 4DRM-07
Water Quality Specific Total PiezometricParameters Chloride Conductance Alkalinity pH Uranium Elevation
Units mg/I p rnho/cm mg/l as CaCO 3 mg/1 msl
Upper Control Limit 14.1 712 189.2
Date
22 JUL 1999
17 AUG 1999
20 SEP 1999
04 OCT 1999
17 NOV 1999
16 DEC 1999
8.3
8.4
7.7
7.8
8.2
8.3
534
524
531
529
524
529
136.8
130.5
130.0
129.0
133.7
139.9
8.7
8.5
8.6
8.6
8.6
8.5
4570.0
4569.9
4570.4
4570.4
4570.0
4570.3
* Values Exceed Upper Control Limit
Negative U308 Grades Indicate Less Than Detection Limit.
4DRM-07
301

NRCDEQ2REP
COGEMA Mining Inc.
CHRISTENSEN RANCH
Mine Unit 5 INTERIOR DEEP SAND MONITOR WELL
I.D. 5DM1A 2nd Half,1999
Water Quality Specific Total PiezometricParameters Chloride Conductance Alkalinity pH Uranium Elevation
Units mg/l pt mho/cm mg/I as CaCO3 mg/l msl
Upper Control Limit 22.8 1017 420.9
Date
13 JUL 1999
28 JUL 1999
10 AUG 1999
23 AUG 1999
07 SEP 1999
20 SEP 1999
04 OCT 1999
19 OCT 1999
03 NOV 1999
16 NOV 1999
30 NOV 1999
14 DEC 1999
27 DEC 1999
6.1
5.6
5.3
5.1
5.2
5.2
5.4
5.7
5.4
5.4
5.1
5.2
5.2
426
431
427
423
418
420
423
418
419
421
420
413
417
211.9
210.5
201.2
199.2
202.4
197.5
203.3
205.1
206.7
207.1
"202.0
197.5
199.0
9.0
9.1
9.0
8.7
8.8
8.7
8.8
8.9
8.8
8.9
8.9
8.8
8.9
4608.9
4609.0
4609.1
4609.0
4609.1
4609.0
4609.0
4609.1
4609.1
4609.4
4609.3
4609.5
4609.3
* Values Exceed Upper Control Limit
Negative U308 Grades Indicate Less Than Detection Limit.
5DM1A
302

NZRCDEQ2REP
COGEMA Mining Inc.
CHRISTENSEN RANCH
Mine Unit 5 INTERIOR DEEP SAND MONITOR WELL
Well I.D. 5DM2 2nd Half, 1999
Water Quality Specific Total . PiezometricParameters Chloride Conductance Alkalinity pH Uranium Elevation
Units mg/1 pr mho/cm mg/l as CaCO3 mg/1 msl
Upper Control Limit 22.8 1017 420.9
Date
13 JUL 1999
28 JUL 1999
10 AUG 1999
23 AUG 1999
08 SEP 1999
21 SEP 1999
05 OCT 1999
19 OCT 1999
03 NOV 1999
16 NOV 1999
30 NOV 1999
14 DEC 1999
28 DEC 1999
11.3
11.2
10.5
10.4
10.1
10.7
10.3
11.0
10.8
10.7
10.9
10.8
11.0
622
634
634
629
622
631
626
621
623
625
622
613
616
121.1
122.7
117.4
113.5
113.3
117.3
115.7
117.5
117.1
117.5
116.8
"114.5
119.9
8.8
8.8
9.2
8.6
8.8
8.6
8.7
8.8
8.7
8.7
8.7
8.7
8.6
4610.4
4610.6
4610.4
4610.1
4610.6
4610.8
4610.8
4610.7
46104
4610.8
4610.6
4611.2
4610.9
* Values Exceed Upper Control Limit
Negative U308 Grades Indicate Less Than Detection Limit.
5DM2
303
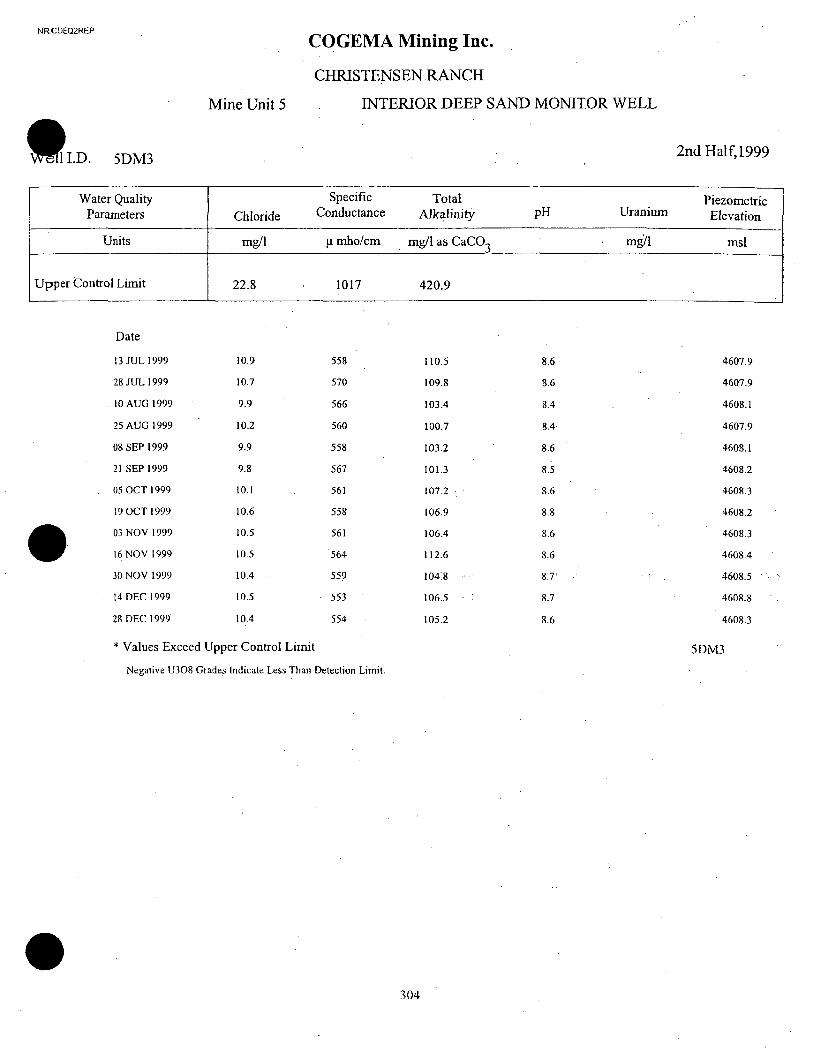
NRCDEQ2REP
COGEMA Mining Inc.
CHRISTENSEN RANCH
Mine Unit 5 INTERIOR DEEP SAND MONITOR WELL
* I.D. 5DM3 2nd Half, 1999
Water Quality Specific Total PiezometricParameters Chloride Conductance Alkalinity pH Uranium Elevation
Units mg/l p mho/cm mg/I as CaCO3 mgl msi
Upper Control Limit 22.8 1017 420.9
Date
13 JUL 1999
28 JUL 1999
10 AUG 1999
25 AUG 1999
08 SEP 1999
21 SEP 1999
05 OCT 1999
19 OCT 1999
03 NOV 1999
16 NOV 1999
30 NOV 1999
14 DEC 1999
28 DEC 1999
10.9
10.7
9.9
10.2
9.9
9.8
10.1
10.6
10.5
10.5
10.4
10.5
10.4
558
570
566
560
558
567
561
558
561
564
559
553
554
110.5
109.8
103.4
100.7
103.2
101.3
107.2
106.9
106.4
112.6
-104:8
106.5
105.2
8.6
8.6
8.4
8.4
8.6
8.5
8.6
8.8
8.6
8.6
8.7
8.7
8.6
4607.9
4607.9
4608.1
4607.9
4608.1
4608.2
4608.3
4608.2
4608.3
4608.4
4608.5
4608.8
4608.3
* Values Exceed Upper Control Limit
Negative U308 Grades Indicate Less Than Detection Limit.
5DM3
304

NRCOEQ2REP
COGEMA Mining Inc.
CHRISTENSEN RANCH
INTERIOR DEEP SAND MONITOR WELLMine Unit 5
2nd Half,19 IWell I.D. 5DM4
Water Quality Specific Total PiezometricParameters Chloride Conductance Alkalinity pH Uranium Elevation
Units mg/l p mho/cm mg/1 as CaCO3 mg/1 msl
Upper Control Limit 22.8 1017 420.9
Date
13 JUL 1999
28 JUL 1999
10AUG 1999
23 AUG 1999
08 SEP 1999
20 SEP 1999
04 OCT 1999
19 OCT 1999
03 NOV 1999
16 NOV 1999
30 NOV 1999
14 DEC 1999
27 DEC 1999
5.6
5.5
5.2
5.2
5.1
5.1
5.4
5.7
5.3
5.6
5.2
5.1
5.5
428
440
429
431
426
429
427
422
426
428
425
421
424
218.2
216.6
207.9
205.6
204.2
208.5
210.2
209.5
212.4
215.2
207.0
204.2
204.9
8.7
8.7
8.6
8.6
8.7
8.7
8.7
8.7
8.7
8.7
8.7
8.7
8.8
4608.1
4608.2
4608.3
4608.2
4608.5
4608.5
4608.5
4608.5
4608.7
4609.0
4608.6
* Values Exceed Upper Control Limit
Negative U308 Grades Indicate Less Than Detection Limit.
5DM4
305

NRCOEQ2REP
COGEMA Mining Inc.
CHRISTENSEN RANCH
Mine Unit 5 INTERIOR DEEP SAND MONITOR WELL
rI.D. 5DM5 2nd Half,1999
Water QualityParameters
SpecificConductance
TotalAlkalinity
PiezometricElevationChloride pH Uranium
Units mg/l ji mho/cm mg/i as CaCO3 mg/l msl
Upper Control Limit 22.8 1017 420.9
Date
13 JUL 1999
28 JUL 1999
10 AUG 1999
25 AUG 1999
08 SEP 1999
21 SEP 1999
05 OCT 1999
19 OCT 1999
03 NOV 1999
16 NOV 1999
30 NOV 1999
14 DEC 1999
28 DEC 1999
5.9
5.9
5.8
5.6
5.5
5.9
5.5
5.8
5.8
5.8
5.4.
5.6
5.5
453
454
453
449
447
452
445
445
447
454
449
440
439
239.1
236.3
230.3
223.2
223.0
222.9
228.6
233.4
234.7
233.2
.224.5
223:8
224.6
8.6
8.5
8.5
8.5
8.6
8.5
8.5
8.6
8.5
8.6
8.6-
8.6.
8.6
4605.8
4605.7
4605.7
4605.8
4605.8
4605.7
4606.0
4606.0
4606.0
4606.2
4606.2
4606.2
4606.2
* Values Exceed Upper Control Limit
Negative U308 Grades Indicate Less Than Detection Limit.
5DM5
306

NRCDEQ2REP
COGEMA Mining Inc.
CHRISTENSEN RANCH
Mine Unit 5 INTERIOR DEEP SAND MONITOR WELL
Well I.D. 5DM7 2nd Half, 1
Water Quality Specific Total PiezometricParameters Chloride Conductance Alkalinity pH Uranium Elevation
Units mg/1 p mho/cm mg/1 as CaCO3 mg/l msl
Upper Control Limit 22.8 1017 420.9
Date
14 JUL 1999
29 JUL 1999
11 AUG 1999
25 AUG 1999
09 SEP 1999
21 SEP 1999
05 OCT 1999
19 OCT 1999
03 NOV 1999
16 NOV 1999
30 NOV 1999"
14 DEC 1999
28 DEC 1999
7.1
7.9
7.0
6.9
6.9
6.9
7.2
7.2
7.2
7.1
7.0
7.0
7.4
520
518
517
516
521
523
519
514
521
518
519
520
518
243.9
251.2
235.6
234.4
237.7
237.9
242.5
240.9
244.6
241.8
234.7
235.9
236.3
8.3
8.6
8.3
8.4
8.4
8.4
8.5
8.7
8.6
8.6
8.7
8.6
8.5
4605.7
4605.9
4605.7
4605.7
4605.8
4605.6
4605.8
4606.0
4606 .4
4606.1
4606.1
4605.7
4605.8
* Values Exceed Upper Control Limit
Negative U308 Grades Indicate Less Than Detection Limit.
5DM7
307

NRCOE02REP
COGEMA Mining Inc.
CHRISTENSEN RANCH
Mine Unit 5 INTERIOR DEEP SAND MONITOR WELL
.1 I.D. WCOW-37D 2nd Half,1999
Water Quality Specific Total PiezometricParameters Chloride Conductance Alkalinity pH Uranium Elevation
Units mg/1 ji mho/cm mg/1 as CaCO3 mg/I rnsl
Upper Control Limit 22.8 1017 420.9
Date
13 JUL 1999
28 JUL 1999
10 AUG 1999
25 AUG 1999
08 SEP 1999
21 SEP 1999
05 OCT 1999
19 OCT 1999
03 NOV 1999
16 NOV 1999
30 NOV 1999
14 DEC 1999
28 DEC 1999
8.3
8.5
8.2
8.3
8.4
8.4
8.6
8.7
8.9
8.8
8.7
8.6
8.6
463
464
458
459
458
465
455
459
460
461
459
455
455
227.2
236.1
225.7
223.7
228.9
222.5
229.2
231.8
235.0
232.3
229.8
227.1
224.6
8.6
8.5
8.5
8.4
8.6
8.5
8.5
8.6
8.5
8.5
86'
8.6"
8.6
4604.2
4604.1
4604.1
4604.1
4604.3
4604.4
4606.4
4606.4
4604.5
4604.8
4604.6
4604.8
4604,6
* Values Exceed Upper Control Limit
Negative U308 Grades Indicate Less Than Detection Limit.
WCOW-37D
308

NRCDEQ2REP
COGEMA Mining Inc.
CHRISTENSEN RANCH
Mine Unit 6 INTERIOR DEEP SAND MONITOR WELL
Well I.D. 6DM1 2nd Half,19
Water Quality Specific Total Piezometric
Parameters Chloride Conductance Alkalinity pH Uranium Elevation
Units mg/l p mho/cm mg/l as CaCO3 mg/i msl
Upper Control Limit 21.9 1682 129.4
Date
08 JUL 1999
22 JUL 1999
04 AUG 1999
19 AUG 1999
01 SEP 1999
15 SEP 1999
29 SEP 1999
13 OCT 1999
27 OCT 1999
08 NOV 1999
22 NOV 1999
08 DEC 1999
20 DEC 1999
8.6
8.4
7.7
8.0
8.1
8.1
7.8
8.2
8.1
8.5
7.9
8.0
8.2
798
797
806
798
794
806
808
808
804
800
797
790
800
96.1
96.0
89.4
91.8
94.2
94.5
90.1
94.5
93.4
94.7
92.0
91.8
91.3
8.2
8.4
8.2
8.2
8.3
8.1
8.2
8.4
8.2
8.3
8.4
8.3
8.3
4593.8
4591.9
4587.3
4586.6
4586.8
4585.9
4586.6
4587.8
4588 4
4589.7
4589.2
4590.8
4588.7
* Values Exceed Upper Control Limit
Negative U308 Grades Indicate Less Than Detection Limit.
6DM 1
309

NFRCDEQ2REP
COGEMA Mining Inc.
CHRISTENSEN RANCH
Mine Unit 6 INTERIOR DEEP SAND MONITOR WELL
I.D. 6DM2 2nd Half,1999
Water Quality Specific Total PiezometricParameters Chloride Conductance Alkalinity pH Uranium Elevation
Units mg/l gi mho/cm mg/1* as CaCO3 mg/l msl
Upper Control Limit 21.9 1682 129.4
Date
08 JUL 1999
22 JUL 1999
04 AUG 1999
19 AUG 1999
01 SEP 1999
15 SEP 1999
29 SEP 1999
13 OCT 1999
27 OCT 1999
08 NOV 1999
22 NOV 1999
08 DEC 1999
20 DEC 1999
6.6
6.8
6.3
9.4
9.8
7.2
6.2
6.7
7.2
7.0
6.5
6.6
6.6
1132
1141
1140
1135
1128
1148
1139
1154
1116
1139
1131
1128
1140
67.7
68.9
60.7
68.7
65.9
65.2
61.2
67.4
67.5
.70.2
67.0
p65.0
65.5
9.2
93
9.1
9.4
9.4
9.1
9.3
9.4
9.4
9.1
9.3
9.3
9.1
4595.7
4593.2
4587.6
4588.4
4587.5
4586.6
4587.3
4588.9
4589.1
4589.8
4590.1
4592.6
4590.6
* Values Exceed Upper Control Limit
Negative U308 Grades Indicate Less Than Detection Limit.
6DM2
310

NRCDEQ2REP
COGEMA Mining Inc.
CHRISTENSEN RANCH
INTERIOR DEEP SAND MONITOR WELLMine Unit 6
2nd Half, 19Well I.D. 6DM3-2
Water Quality Specific Total PiezometricParameters Chloride Conductance Alkalinity pH Uranium Elevation
Units mg/1 ý' rnho/cm mg/i as CaCO3 mg/l msl
Upper Control Limit 21.9 1682 129.4
Date
08 JUL 1999
22 JUL 1999
04 AUG 1999
19 AUG 1999
01 SEP 1999
15 SEP 1999
29 SEP 1999
13 OCT 1999
27 OCT 1999
08 NOV 1999
22 NOV 1999
08 DEC 1999
20 DEC 1999
6.8
6.2
6.1
6.1
6.0
5.8
6.0
6.3
6.4
6.4
6.0
6.0
6.1
1142
1149
1155
1142
1140
1156
1155
1170
1140
1148
1148
1135
1147
80.3
75.8
74.8
74.8
74.0
72.9
73.1
77.2
79.8
76.376.8
73.6
73.7
8.0
8.1
8.0
8.0
8.2
7.9
8.1
8.1
8.2
8.2
8.3
8.2
8.1
4598.3
4594.7
4587.8
4588.8
4588.3
4587.3
4588.5
4590.4
45904
4591.3
4591.8
4595.8
4592.7
* Values Exceed Upper Control Limit
Negative U308 Grades Indicate Less Than Detection Limit.
6DM3-2
311

NRICDEQ2REP
COGEMA Mining Inc.
CHRISTENSEN RANCH
INTERIOR DEEP SAND MONITOR WELLMine Unit 6
I.D. 6DM4-2 2nd Half,1999
Water Quality Specific Total PiezometricParameters Chloride Conductance Alkalinity pH Uranium Elevation
Units mg/1 ý± mho/cm mg/I as CaCO3 mg/i msl
Upper Control Limit 21.9 1682 129.4
Date
08 JUL 1999
22 JUL 1999
04 AUG 1999
19 AUG 1999
01 SEP 1999
15 SEP 1999
29 SEP 1999
13 OCT 1999
27 OCT 1999
08 NOV 1999
22 NOV 1999
08 DEC 1999
20 DEC 1999
6.6
6.6
6.1
6.7
6.8
6.0
6.1
6.3
6.3
6.6
6:1
6.0
6.2
1151
1157
1154
1133
1133
1165
1155
1159
1144
1143
1152
1145
1152
76.9
76.3
71.5
73.7
76.1
72.2
73.4
73.1
75.1
76.8
75ý5
72.5
76.7
8.1
8.3
8.1
8.2
8.3
8.0
8.2
8.3
8.3
8.3
8.4
8.3
8.2
4599.3
4595.2
4588.9
4589.5
4589.1
4588.5
4589.4
4591.1
4591.3
4592.2
4592:7.
4595.6
4593.3
Values Exceed Upper Control Limit
Negative U308 Grades Indicate Less Than Detection Limit.
6DM4-2
312

N RCDEQ2REP
COGEMA Mining Inc.
CHRISTENSEN RANCH
Mine Unit 6 INTERIOR DEEP SAND MONITOR WELL
22nd Half, 1999Well I.D. 6DM5
Water Quality Specific Total PiezometricParameters Chloride Conductance Alkalinity pH Uranium Elevation
Units mg/i p mho/cm mg/1 as CaCO 3 mg/1 msl
Upper Control Limit 21.9 1682 129.4
Date
08 JUL 1999
22 JUL 1999
04 AUG 1999
19 AUG 1999
01 SEP 1999
15 SEP 1999
29 SEP 1999
13 OCT 1999
27 OCT 1999
08 NOV 1999
23 NOV 1999
08 DEC 1999
20 DEC 1999
6.6
6.3
5.8
6.0
6.1
6.2
6.1
6.6
6.4
6.6
6.5
6.6
6.3
1154
1162
1167
1160
1152
1176
1168
1180
1150
1156
1138
1145
1151
79.7
75.9
71.2
79.0
75.2
77.5
74.7
81.2
78.0
76.2
77.1
76.2
74-0
8.0
8.0
8.0
8.1
8.2
7.9
8.0
8.1
8.2
8.0
8.1
8.1
8.0
4602.5
4591.2
4589.9
4590.9
4590.4
4590.2
4591.3
4593.2
45934-
4594.7
4594 6
45983
4593.7
* Values Exceed Upper Control Limit
Negative U308 Grades Indicate Less Than Detection Limit.
6DM5
313

NRCDEQ2REP
COGEMA Mining Inc.
CHRISTENSEN RANCH
Mine Unit 6 INTERIOR DEEP SAND MONITOR WELL
'1 I.D. 6DM6 2nd Half, 1999
Water Quality Specific Total PiezometricParameters Chloride Conductance Alkalinity pH Uranium Elevation
Units mg/l t rgnho/cm mg/i as CaCO 3 mg/i msl
Upper Control Limit 21.9 1682 129.4
Date
07 JUL 1999
21 JUL 1999
03 AUG 1999
18 AUG 1999
31 AUG 1999
14 SEP 1999
28 SEP 1999
[2 OCT 1999
27 OCT 1999
09 NOV 1999
23 NOV 1999
07 DEC 1999
20 DEC 1999
7.8
7.5
7.3
7.1
7.2
7.4
7.3
7.4
7.6
7.8
7.5
7.4
7.4
837
823
845
838
828
839
825
845
831
833
824
825
831
91.8
92.3
86.2
85.4
88.4
87.8
86.0
89.2
90.4
94.4
89:9
88.0
* 87.9
8.6
8.7
8.5
8.5
8.6
8.3
8.4
8.5
8.6
8.5
8.6
8.5
8.5
4612.5
4603.2
4599.0
4597.9
4597.2
4597.4
4601.5
4601.8
4604.1
4603.7
4604:5
4603.6
4597.7
* Values Exceed Upper Control Limit
Negative U308 Grades Indicate Less Than Detection Limit.
6DM6
314

NRCDEO2REP COGEMA Mining Inc.
CHRISTENSEN RANCH
Mine Unit 6 INTERIOR DEEP SAND MONITOR WELL
Well I.D. 6DM7 2nd Half, I
Water Quality Specific Total PiezometricParameters Chloride Conductance Alkalinity pH Uranium Elevation
Units mg/l I1 mho/cm mg/l as CaCO3 mg/l msl
Upper Control Limit 21.9 1682 129.4
Date
07 JUL 1999 7.5 876 89.8 8.4 4623.6
21 JUL 1999 7.4 869 89.0 8.5 4606.1
03 AUG 1999 7.0 871 84.6 8.3 4605.3
18 AUG 1999 7.1 870 85.6 8.3 4606.6
30 AUG 1999 7.1 870 86.6 8.4 4605.2
14 SEP 1999 6.8 871 83.6 8.1 4606.6
28 SEP 1999 7.2 875 87.3 8.3 4613.3
12 OCT 1999 7.5 868 86.8 8.4 4611.1
26 OCT 1999 7.1 873 87.8 8.4 4613.4
08 NOV 1999 7.1 867 85.5 8:5' 4611.6
23 NOV 1999 71. " 863 87.0 8.4 4612.3
07 DEC 1999 7.0 858 84.4 8.4' 4611.1
20 DEC 1999 7.0 871 83.7 8.4 4604.9
* Values Exceed Upper Control Limit 6DM7
Negative U308 Grades Indicate Less Than Detection Limit.
315

NFRCDEQ2REP
COGEMA Mining Inc.
CHRISTENSEN RANCH
INTERIOR DEEP SAND MONITOR WELLMine Unit 6
I.D. 6DM82nd Half,1999
Water Quality Specific Total PiezometricParameters Chloride Conductance Alkalinity pH Uranium Elevation
Units mg/l V mho/cm . mg/1 as CaCO3 mg/1 msl
Upper Control Lirnit 21.9 1682 129.4
Upper Control Limit 21.9 1682 129.4
Date
07 JUL 1999
21 JUL 1999
03 AUG 1999
18 AUG 1999
31 AUG 1999
14 SEP 1999
28 SEP 1999
12 OCT 1999
26 OCT 1999
08 NOV 1999
23 NOV 1999
07 DEC 1999
20 DEC 1999
7.7
7.5
7.4
7.3
7.0
7.1
7.2
7.3
7.4
7.5
7.4
7.0
7.1
858
834
845
843.
838
843
846
847
847
845
846
836
851
91.4
88.9
86.8
86.5
84.8
84.6
83.8
87.7
86.4
88.2
90:2'
82.2
91.5
8.5
8.7
8.4
8.4
8.5
8.2
8.4
8.4
8.5
8.5
8.4
8.5
8.5
4617.8
4603.8
4600.9
4601.2
4599.5
4600.7
4605.8
4604.6
4608.0
4606.8
4607.1
4606.5-
4602.3
* Values Exceed Upper Control Limit
Negative U308 Grades Indicate Less Than Detection Limit.
6DM8
316

NRCDEQ2REP
COGEMA Mining Inc.
CHRISTENSEN RANCH
Mine Unit 6 INTERIOR DEEP SAND MONITOR WELL
Well I.D. 6DM9 2nd Half, 1,
Water Quality Specific Total PiezometricParameters Chloride Conductance Alkalinity pH Uranium Elevation
Units mg/i [L mho/cm mg/l as CaCO3 mg/l msl
Upper Control Limit 21.9 1682 129.4
Date
07 JUL 1999 7.9 852 93.2 8.3 4611.8
21 JUL 1999 7.4 844 91.2 8.5 4603.0
03 AUG 1999 7.2 842 85.4 8.2 4600.5
18 AUG 1999 7.3 842 87.5 8.2 4600.4
31 AUG 1999 7.0 847 86.7 8.4 4599.4
14 SEP 1999 7.0 842 86.0 8.0 4599.8
28 SEP 1999 7.1 845 85.6 8.2 4603.4
12 OCT 1999 7.3 839 88.0 8.3 4603.0
26 OCT 1999 7.5 846 90.1 8.3 4604.4
08 NOV 1999 7.4 846 88.8 8.3 4604.323 NOV 1999 7.8 840 93-.9 8.3 4604:7
07 DEC 1999 7.3 835 86.9 8.4 4604.3
20 DEC 1999 7.3 843 86.5 8.3: 4601.3
* Values Exceed Upper Control Limit 6DM9
Negative U308 Grades Indicate Less Than Detection Limit.
317

NICDEQ2REP
COGEMA Mining Inc.
CHRISTENSEN RANCH
Mine Unit 6 INTERIOR DEEP SAND MONITOR WELL
TI.D. 6DM10 2nd Half,1999
Water Quality Specific Total PiezometricParameters Chloride Conductance Alkalinity pH Uranium Elevation
Units mg/l P' mho/cm mg/il as CaCO3 mg/I msl
Upper Control Limit 21.9 1682 129.4
Date
07 JUL 1999
21 JUL 1999
03 AUG 1999
18 AUG 1999
31 AUG 1999
14 SEP 1999
28 SEP 1999
12 OCT 1999
26 OCT 1999
08 NOV 1999
23 NOV 1999
07 DEC 1999
20 DEC 1999
7.8
7.5
7.4
7.3
7.1
7.1
7.0
7.3
7.4
7.4
7.3
7.6
7.3
855
846
844
853
846
852
850
842
852
850
841
836
847
92.9
92.0
87.4
87.7
88.2
86.9
85.4
88.0
90.1
89.7
.93.3.
92.0
86.3
8.5
8.6
8.4
8.4
8.5
8.2
8.4
8.4
8.5
8.5
8.5
8.5
8.5
4612.1
4603.9
4600.4
4600.0
4598.8
4599.3
4602.6
4602.7
4604.6
4603.7
4605.2
4604.6
4602.0
* Values Exceed Upper Control Limit
Negative U308 Grades Indicate Less Than Detection Limit.
6DM10
318

NRCDEQ2REP
COGEMA Mining Inc.
CHRISTENSEN RANCH
Mine Unit 6 INTERIOR DEEP SAND MONITOR WELL
2nd Half, 194 9Well I.D. 6DM1 1
Water Quality Specific Total PiezometricParameters Chloride Conductance Alkalinity pH Uranium Elevation
Units mg/I ýt mho/cm mg/1 as CaCO3 mgi1 msl
Upper Control Limit 22.9 1101 385.3
Date
07 JUL 1999
21 JUL 1999
03 AUG 1999
18 AUG 1999
30 AUG 1999
14 SEP 1999
28 SEP 1999
12 OCT 1999
26 OCT 1999
08 NOV 1999
23 NOV 1999
07 DEC 1999
20 DEC 1999
9.2
9.0
8.4
8.7
8.9
9.2
8.9
8.9
10.1
8.8
8:8
8.7
8.9
622
611
600
601
598
596
601
596
598
605
595
596
605
182.3
183.7
180.5
185.9
189.4
190.4
190.3
197.4
193.1
186.3
199.0
192.5
183.7
9.0
9.1
8.9
8.9
8.9
8.8
8.7
8.8
8.9
8.8
8.7
8.8
8.8
4619.8
4608.5
4605.4
4604.1
4602.9
4603.4
4606.7
4606.1
4 609 4-
4610.3
4610.2
4609.9
4608.6
* Values Exceed Upper Control Limit
Negative U308 Grades Indicate Less Than Detection Limit.
6DMI I
319

NRCDEQ2REP
COGEMA Mining Inc.
CHRISTENSEN RANCH
Mine Unit 6 INTERIOR DEEP SAND MONITOR WELL
I.D. 6DM12 2nd Half,1999
Water Quality Specific Total Piezometric
Parameters Chloride Conductance Alkalinity pH Uranium Elevation
Units mg/1 g mho/cm mg/i as CaCO3 mg/1 msl
Upper Control Limit 22.9 1101 385.3
Date
07 JUL 1999
21 JUL 1999
03 AUG 1999
18 AUG 1999
30 AUG 1999
14 SEP 1999
28 SEP 1999
12 OCT 1999
26 OCT 1999
09 NOV 1999
23 NOV 1999
07 DEC 1999
20 DEC 1999
8.2
8.1
7.9
7.8
7.7
7.7
7.9
7.9
7.9
7.8
7.9
7.7
7.9
544
540
538
536
536
544
534
537
536
538
536.
532
538
122.7
124.2
118.4
116.9
118.9
121.3
120.7
119.0
121.5
120,1
119.7"
116.5
116.8
8.6
8.7
8.5
8.5
8.6
8.5
8.5
8.6
8.6
8.6
8:67
8.6"
8.6
4620.1
4609.7
4606.3
4605.1
4604.0
4604.0
4607.2
4607.0
4609.5
4610.9
4611.0
4611.0.
4609.8
* Values Exceed Upper Control Limit
Negative U308 Grades Indicate Less Than Detection Limit.
6DM12
320

NRCOEQ2REP
COGEMA Mining Inc.
CHRISTENSEN RANCH
INTERIOR DEEP SAND MONITOR WELLMine Unit 6
2nd Half, 19Well I.D. 6DM13
Water Quality Specific Total PiezometParameters Chloride Conductance Alkalinity pH Uranium Elevatio
icn
Units mg/i [t mho/cm mg/i as CaCO3 mg/l msl
Upper Control Limit 22.9 1101 385.3
Date
07 JUL 1999
22 JUL 1999
03 AUG 1999
18 AUG 1999
31 AUG 1999
14 SEP 1999
28 SEP 1999
12 OCT 1999
26 OCT 1999
09 NOV 1999
23NOV 1999
07 DEC 1999
20 DEC 1999
8.2
7.9
7.7
7.6
7.6
7.5
7.4
7.7
7.8
7.7
7.8
7.7
7.7
647
650
649
643
634
645
634
650
642
642
632
636
638
197.0
193.4
184.3
181.9
185.3
182.0
182.8
189.4
191.4
187.9
189.4
184.9
184.5
8.3
8.4
8.3
8.3
8.4
8.1
8.2
8.3
8.3
8.3
8.3
8.3
8.3
4617.1
4607.5
4604.3
4602.8
4601.6
4601.7
4604.4
4604.3
4606 4
4608.1
4608.2
4608.1
4607.3
* Values Exceed Upper Control Limit
Negative U308 Grades Indicate Less Than Detection Limit.
6DM13
321

NR.CDE02REP
COGEMA Mining Inc.
CHRISTENSEN RANCH
Mine Unit 6 INTERIOR DEEP SAND MONITOR WELL
F I.D. 6DM14 2nd Half,1999
Units ..j mg/I ~.t mho/cm mg/i as CaCOWater Quality
ParametersSpecific
ConductanceTotal
AlkalinityChloride pH UraniumPiezometric
Elevation
Units mg/l p_ mho/cm mg/l as CaCO3 mg/l msl
Upper Control Limit 21.9 1682 129.4
Date
07 JUL 1999
21 JUL 1999
03 AUG 1999
18 AUG 1999
31 AUG 1999
14 SEP 1999
28 SEP 1999
12 OCT 1999
26 OCT 1999
08 NOV 1999
23 NOV 1999
07 DEC 1999
20 DEC 1999
8.0
8.0
7.6
7.2
7.4
7.2
7.7
7.7
7.7
7.5
7.6
7.5
7.5
832
827
819
811
821
821
824
818
827
829
821
811
823
92.2
92.2
87.8
86.2
88.7
86.7
91.7
90.9
92.0
89.5
90.6
88.8
87.4
8.5
8.7
8.4
8.6
8.6
8.5
8.4
8.5
8.5
8.5
8.6.
8.6
8.5
4607.1
4601.1
4596.9
4596.5
4595.2
4595.2
4598.0
4598.6
4600.1
4600.2
4599.4
4600.8
4598.3
* Values Exceed Upper Control Limit
Negative U308 Grades Indicate Less Than Detection Limit.
6DM14
322

CHRISTENSEN RANCH
PERIMETER ORE ZONE TREND WELLS

NRCDE02REP
COGEMA Mining Inc.
CHRISTENSEN RANCH
Mine Unit 2 PERIMETER ORE ZONE TREND WELL
I.D. MW78T 2nd Half,1999
Water Quality Specific Total PiezometricParameters Chloride Conductance Alkalinity pH Uranium Elevation
Units mg/1 p mho/cm mg/I as CaCO3 mg/1 msl
Action Level 13.6 823 121.3
Date
21 JUL 1999
10 AUG 1999
13 SEP 1999
06 OCT 1999
02 NOV 1999
01 DEC 1999
8.9
8.6
8.8
8.8
8.9
9.2
703
702
704
705
698
700
98.3
94.0
92.4
94.0
96.5
97.5
8.6
8.4
8.3
8.2
8.6
8.4
4527.7
4524.9
4522.3
4521.2
4520.8
4523.4
* Values Exceed Action Level
Negative U308 Grades Indicate Less Than Detection Limit.
MW78T
323

NRCDEQ2REP
COGEMA Mining Inc.
CHRISTENSEN RANCH
PERIMETER ORE ZONE TREND WELLMine Unit 2
2nd Half,1Well I.D. MW87T
Water Quality Specific Total PiezometricParameters Chloride Conductance Alkalinity pH Uranium Elevation
Units mg/i [L mho/cm mg/i as CaCO3 mg/I msl
Action Level 13.6 823 121.3
Date
21 JUL 1999
10 AUG 1999
13 SEP 1999
05 OCT 1999
02 NOV 1999
01 DEC 1999
9.8
9.4
9.1
9.7
9.8
9.5
676
669
660
675
662
668
98.7
93.0
91.0
95.2
97.7
93.8
8.5
8.3
8.4
8.4
8.5
8.5
4513.3
4509.8
4506.9
4504.8
4507.8
4508.6
* Values Exceed Action Level
Negative U308 Grades Indicate Less Than Detection Limit.
MW87T
324

NRCDEQ2REP
COGEMA Mining Inc.
CHRISTENSEN RANCH
Mine Unit 5 PERIMETER ORE ZONE TREND WELL
I.D. 5TW-1 2nd Half,1999
Water Quality Specific Total PiezometricParameters Chloride Conductance Alkalinity pH Uranium Elevation
Units mg/i ýi mho/cm mg/i as CaCO3 mg/i msl
Upper Control Limit 22.7 1004 134.3
Date
15 JUL 1999
29 JUL 1999
11 AUG 1999
25 AUG 1999
09 SEP 1999
21 SEP 1999
05 OCT 1999
19 OCT 1999
03 NOV 1999
16 NOV 1999
30 NOV 1999
14 DEC 1999
29 DEC 1999
8.3
8.1
7.7
7.8
7.9
8.0
8.1
8.4
8.2
8.1
8.1
8.1
8.2
722
720
721
719
723
728
724
719
722
717
720
705
714
103.4
105.4
99.6
98.9
99.8
100.9
106.9
104.1
102.6
102.9
99.3
-, 97.6
107.4
8.8
8.6
8.6
8.7
8.4
8.5
8.4
8.7
8.6
8.6
8.6
8.5
8.5
4604.8
4607.1
4609.0
4609.3
4609.3
4611.0
4610.8
4610.9
4610.3
4609.8
,4608.7
.4608.4
4607.8
* Values Exceed Upper Control Limit
Negative U308 Grades Indicate Less Than Detection Limit.
5TW-1
325

NRCDEQ2REP
COGEMA Mining Inc.
CHRISTENSEN RANCH
Mine Unit 6 PERIMETER ORE ZONE TREND WELL
2nd Half, 1Well I.D. 6TW1
Water Quality Specific Total PiezometricParameters Chloride Conductance Alkalinity pH Uranium Elevation
Units mg/i g' mho/cm mg/I as CaCO3 mg/l msl
Upper Control Limit 20 1576 95.2
Date
08 JUL 1999
22 JUL 1999
03 AUG 1999
18 AUG 1999
31 AUG 1999
14 SEP 1999
22 SEP 1999
28 SEP 1999
12 OCT 1999
27 OCT 1999
' 09NOV 1999
23NOV 1999
07 DEC 1999
20 DEC 1999
6.0
6.3
11.8
32.8
27.1
44.3
55.6
54.9
52.5
28.4
21.8.
20.2
22.0
14.6
1348
1369
1516
* 2039
* 2151
* 2231
* 2404
* 2410
* 2371
* 1900
* 1707
* 1659
* 1662
1509
72.2
85.4
158.9 *
* 423.0 *
* 540.0 *
• 497.0 *
• 615.3 *
• 596.0 *
• 642.0 *
* 340.4 *
S ::257.6 *
• 227.0 *
• 233.8 *
153.3 *
8.1
7.9
7.7
7.0
6.9
6.9
6.7
6.5
6.7
7.2
7.2-
7.4
7.4
7.6
4620.6
4605.3
4595.3
4597.9
4594.2
4598.6
4602.3
4603.3
4605.1
4608.
4608.4
4609.8
4609.0
4606.2
* Values Exceed Upper Control Limit
Negative U308 Grades Indicate Less Than Detection Limit.
6TW1
326

NRCDEQ2REP
COGEMA Mining Inc.
CHRISTENSEN RANCH
PERIMETER ORE ZONE TREND WELLMine Unit 6
F I.D. 6TW 2 2nd Half, 1999
Water Quality Specific Total PiezometricParameters Chloride Conductance Alkalinity pH Uranium Elevation
Units mg/i [t mho/cm mg/i as CaCO 3 mg/i msl
Upper Control Limit 20 1576 95.2
Date
08 JUL 1999
22 JUL 1999
03 AUG 1999
19 AUG 1999
01 SEP 1999
15 SEP 1999
29 SEP 1999
13 OCT 1999
27 OCT 1999
09 NOV 1999
23 NOV 1999
08 DEC 1999
20 DEC 1999
9.7
7.1
6.7
6.2
6.1
6.0
5.7
5.9
6.2
6.3
,6.6
-6.2
6.1
1394
1374
1365
1339
1324
1345
1339
1344
1317
1319
.1328
1311
1322
101.0
85.7
80.8
79.1
76.0
74.1
71.9
77.1
74.8
74.3
78.1
71.0
71.0
8.2
8.0
8.0
8.0
8.0
7.7
7.9
7.9
8.0
7.9
"8.0
-7.9
7.9
4621.2
4618.8
4612.6
4609.4
4607.0
4610.6.
4614.8
4620.2
4622.0
4622.2
4626.8
4621.5
4622.0
* Values Exceed Upper Control Limit
Negative U308 Grades Indicate Less Than Detection Limit.
6TW2
327

NRCOEQ2REP
COGEMA Mining Inc.
CHRISTENSEN RANCH
Mine Unit 6 PERIMETER ORE ZONE TREND WELL
2nd Half, 1Well I.D. 6TW3
Water Quality Specific Total PiezometricParameters Chloride Conductance Alkalinity pH Uranium Elevation .
Units mg/l ýt mho/cm mg/I as CaCO 3 mg/1 msl
Upper Control Limit 20 1576 95.2
Date
08 JUL 1999
21 JUL 1999
03 AUG 1999
18 AUG 1999
31 AUG 1999
14 SEP 1999
28 SEP 1999
12 OCT 1999
26 OCT 1999
08 NOV 1999
23 NOV 1999
07 DEC 1999
20 DEC 1999
5.6
5.5
5.0
5.0
5.3
5.1
5.4
5.7
5.1
5.2
5.3
5.2
5.2
1292
1324
1310
1304
1317
1313
1308
1310
1317
1317
1311
1299
1307
74.7
70.6
67.6
66.3
67.5
67.4
68.2
69.7
68.1
68.1
'71.2
67:2
70.0
8.3
8.4
8.2
8.2
8.2
8.0
8.3
8.2
8.1
8.6
8.3
8.2:
8.2
4622.9
4616.1
4611.7
4615.6
4610.9
4614.2
4619.8
4623.4
462014616.0
4618.3
4615.2
4605.0
* Values Exceed Upper Control Limit
Negative U308 Grades Indicate Less Than Detection Limit.
6TW3
328

NRCDEQ2REP
COGEMA Mining Inc.
CHRISTENSEN RANCH
Mine Unit 6 PERIMETER ORE ZONE TREND WELL
I.D. 6TW4 2nd Half,1999
Water Quality Specific Total PiezometricParameters Chloride Conductance Alkalinity pH Uranium Elevation
Units mg/1 ýi mho/cm mg/i as CaCO3 mg/I msl
Upper Control Limit 20 1576 95.2
Date
08 JUL 1999
22 JUL 1999
03 AUG 1999
19 AUG 1999
01 SEP 1999
15 SEP 1999
29 SEP 1999
13 OCT 1999
27 OCT 1999
09 NOV 1999
23 NOV 1999
08 DEC 1999
20 DEC 1999
5.8
5.2
4.9
5.2
5.1
4.9
4.9
5.1
4.8
5.1
5.0
5.0
5.1
1351
1327
1334
1320
1310
1336
1328
1335
1315
1305
1288
1297
1311
73.7
72.2
67.6
69.0
68.9
68.3
67.2
70.6
71.6
69.6
70.3,
68.5
67.7
8.2
8.1
8.0
8.1
8.1
7.8
8.0
8.0
8.1
8.0
8.1
8.1
8.0
4620.9
4623.9
4619.6
4613.9
4611.2
4612.0
4616.0
4622.0
4621.0
4621.4
4628.3.
4621.1
4621.5
6TW4* Values Exceed Upper Control Limit
Negative U308 Grades Indicate Less Than Detection Limit.
329

NRCDEQ2REP
COGEMA Mining Inc.
CHRISTENSEN RANCH
PERIMETER ORE ZONE TREND WELLMine Unit 6
2nd Half, 190Well I.D. 6TW5
Water Quality Specific Total PiezometricParameters Chloride Conductance Alkalinity pH Uranium Elevation
Units mg/l R mho/cm mg/l as CaCO3 mg/l msl
Upper Control Limit 20 1576 95.2
Date
08 JUL 1999
22 JUL 1999
03 AUG 1999
18 AUG 1999
01 SEP 1999
14 SEP 1999
22 SEP 1999
28 SEP 1999
12 OCT 1999
26 OCT 1999
09 NOV 1999
23 NOV 1999
07 DEC 1999
20 DEC 1999
6.9
319.0
79.0
78.5
79.6
56.4
40.7
32.4
45.2
24.4
21.6;
17.9
17.9
20.0
1419
* 2832
* 3225
* 3299
* 3397
* 2815
* . 2338
* 2149
* 1990
* 1941
* . .1840
1759
1726
1749
81.4
* 762.7
* 922.0
* 948.0
* 1040.0
* 703.4
* 537.0
* 428.0
* 546.0
* 334.4
286.6
* 243.8
* 232.1
* 232.2
*
*
*
*
*
*
*
*
*
*
*
8.1
6.8
6.9
6.7
6.7
6.7
6.8
6.7
7.1
7.3
7.2.
7.4,-
7.4
7.6
4621.0
4602.1
4592.6
4594.4
4591.5
4596.1
4599.1
4601.0
4602.j
4605.
4606.0
4607.3
4607.1
4605.8
* Values Exceed Upper Control Limit
Negative U308 Grades Indicate Less Than Detection Limit.
6TW5
330

CHRISTENSEN RANCH
INTERIOR DEEP SAND TREND WELLS

NRCDEQ2REP
COGEMA Mining Inc.
CHRISTENSEN RANCH
Mine Unit 5 INTERIOR DEEP SAND MONITOR WELL
I,D. 5DM8T 2nd Half, 1999
Water Quality Specific Total PiezometricParameters Chloride Conductance Alkalinity pH Uranium Elevation
Units mg/1 p mnho/cm mg/i as CaCO3 mg/1 msl
Upper Control Limit 22.8 1017 420.9
Date
13 JUL 1999
28 JUL 1999
10AUG 1999
25 AUG 1999
08 SEP 1999
21 SEP 1999
05 OCT 1999
19 OCT 1999
03 NOV 1999
16 NOV 1999
30 NOV 1999
14 DEC 1999
28 DEC 1999
9.1
8.8
8.3
8.4
9.0
8.8
8.3
8.9
8.8
8.7
8:5
8.4
8.7
598
600
597
595
592
602
599
590
598
601
593
585
594
138.3
137.2
128.7
128.8
130.1
134.6
131.6
133.2
133.0
133.5
.127.9
127.9
132.4
8.4
8.1
8.4
8.3
8.5
8.4
8.4
8.5
8.5
8.4
8.5
8.5
8.4
4606.9
4606.7
4606.8
4607.5
4608.0
4608.3
4608.8
4609.0
4609.3
4609.3
4609.3.
4609.4
4608.9
* Values Exceed Upper Control Limit
Negative U308 Grades Indicate Less Than Detection Limit.
5DM8T
331

NRCDEQ2REP
COGEMA Mining Inc.
CHRISTENSEN RANCH
INTERIOR DEEP SAND MONITOR WELLMine Unit 5
Well I.D. 5DM9T 2nd Half,-1
Water Quality Specific Total PiezometricParameters Chloride Conductance Alkalinity pH Uranium Elevation
Units mg/i i mho/cm mg/1 as CaCO 3 mg/l msl
Upper Control Limit 22.8 1017 420.9
Date
13 JUL 1999
28 JUL 1999
10 AUG 1999
25 AUG 1999
08 SEP 1999
21 SEP 1999
05 OCT 1999
19 OCT 1999
03 NOV 1999
16 NOV 1999
30 NOV 1999
14 DEC 1999
28 DEC 1999
10.8
10.4
9.8
9.8
9.8
9.8
9.8
10.9
10.2
10.5
.10.1-
10.5-
10.2
521
523
519
518
516
521
512
511
521
514
512
505
505
121.9
128.7
119.8
115.3
118.5
112.2
114.6
118.7
131.8
117.7
11-3.0
115.3
115.3
8.7
8.5
8.6
8.5
8.6
8.5
8.5.
8.6
8.6
8.6
8:6
8.6,
8.6
4607.7
4608.1
4608.9
4609.5
4610.3
4610.6
4611.1
4611.2
4611.
46 11 1
461.1.1
4611.1
4610.5
5DM9T* Values Exceed Upper Control Limit
Negative U308 Grades Indicate Less Than Detection Limit.
332

NRCDEQ2REP
COGEMA Mining Inc.
CHRISTENSEN RANCH
Mine Unit 6 INTERIOR DEEP SAND MONITOR WELL
O I.D. 6DT12nd Half, 1999
Water Quality Specific Total PiezometricParameters Chloride Conductance Alkalinity pH Uranium Elevation
Units mg/i p mho/cm mg/l as CaCO3 mg/i msl
Upper Control Limit 21.3 1802 121.7
Date
08 JUL 1999
22 JUL 1999
04 AUG 1999
19 AUG 1999
01 SEP 1999
15 SEP 1999
29 SEP 1999
13 OCT 1999
27 OCT 1999
08 NOV 1999
22.NOV 1999
08 DEC 1999
20 DEC 1999
8.1
8.0
7.5
7.7
7.6
7.4
7.3
7.9
7.8
7.9
7.7
7.8
8.0
827
824
830
819
819
829
830
837
825
823
822
814
820
95.2
94.2
89.2
90.8
91.5
88.8
87.5
94.0
92.7
92.4
.- 91.9
90.2
91.1
8.3
8.4
8.2
8.3
8.3
8.1
8.3
8.4
8.3
8.4
8.5
8.3
8.4
4602.2
4598.4
4593.0
4592.3
4592.0
4591.7
4592.9
4594.6
4595.1
4595.6
4596.2
4597.6
4596.1
* Values Exceed Upper Control Limit
Negative U308 Grades Indicate Less Than Detection Limit.
6DT1
333

APPENDIX 3
Western Environmental Services and Testing, Inc.Dryer Stack Emissions Test Results
December 2, 1999

COGEMA RESOURCES COMPANYLYNCH, WYOMING
YELLOW CAKE DRYER STACK
December 2, 1999
File Number 99-1127
Prepared By
WESTERNENVIRONMENTAL
SERVICES ANDTESTING INC.
A Hawks Industrirs Company
913 Foster Road, Casper, WY 82601(307)2345511 Fax(307)234-8324
AM
Alan ýoylance
V0 PresidentDaniel Klassen
Air Quality Supervisor

TABLE OF CONTENTS
Page,I. INTRODUCTION AND SUMMARY OF RESULTS 1
H1. SUMMARY OF RESULTS 2
1IL TEST PARAMETERS 3
IV. TEST PROCEDURES 5
V. SOURCE DESCRIPTION 7
VL CALCULATIONS 8
List of Tables
Table 1: Permit No. OP254 Source Information I
Table 2: Test 'Paramete'rs and Particulate 3
Table 3: Radiochemistry Results 4
Table 4: Sampling Points 5
List of Figures
Figure 1: Method 5 Particulate Sample Train 6
APPENDICES:
A. Field Testing Data
B. Computer Data Entry
C. Analytical Data
D. Equipment Calibration
E. Chain of Custody
F. Resumes of Test Personnel

Cogema Resource Company Lynch, Wyoming
Yellow Cake Dryer
I. INTRODUCTION AND SUMMARY OF RESULTS
Cogema Resource Company contracted.Western Environmental Services and Testing, Inc.
(WEST) of Casper, Wyoming to conduct compliance testing at their uranium mill near Lynch,
Wyoming.
The Yellow Cake Dryer Stack was tested by EPA Methods 1, 2, 3, 4 and 5 to demonstrate
compliance with Wyoming Department of Environmental Quality (WYDEQ), Air Quality
Division (AQD) Permit Number OP254. Emissions of radium2 26, thorium20 , lead210, and uranium
were also determined by analyzing the particulate collected.
Mr. Bill Byrd and Mr. Sam Byrd of WEST conducted the particulate testing on December 2,
1999. Mr. Dexter Butteffield of;COGEMA was also present.
Within this report the term "U30 8' i s used generically to describe the uranium product emitted
from the dryer stack. The actual composition of the uranium portion of the product produced by
Cogema is 84% metastudite (U0 4 2H20) and 16% U0 3. The uranium trapped in the scrubber
water, and which is emitted from the stack, is 99.5% U0 3, and 0.5% U30 7. These chemical
compositions have been substantiated by Cogema through x-ray defraction work conducted at the
South Dakota School of Mines and Technology and Hazen Research, Inc. in Golden, Colorado.
Table 1'Yellowý Cake Dryer Source Information
Exit Height (feet above ground) approximately 40
Stack Diameter (Inches) 16
Port and Wall Thickness (Inches) 1/4
Upstream Diameters (Distance) from 9.5 diametersTest Ports toFlov Disturbance (12 ft., 11 in.)
DownAstream Diameters (Distance) from 15 diametersTest Ports to Flow Disturbance (20 ft.)
Plant Production Rate - During Test 155 lbs/hrDaily Rate 171 lbs/hr
Western Environmental Srv'ces and Testihig Inc. 99-1127

Cogema Resource Company Lynch, WyomingYellow Cake Dryer
II. SUMMARY OF RESULTS
The principal conclusions are:
1. The emissions of particulate matter from the Dryer Stack were 0.014 pounds per hour (0.0006
grains per dry standard cubic foot), based on averaging the two tests using the "front-half'
collections of the EPA type sampling train.
2. The two test average concentrations of Uranium-natural (U) were 6.67 x 10"1 p.Ci/ml, based
on the "front and back-half' collections of the EPA-type sampling train.
3. The two test average emissions of U308 from the Dryer Stack were 0.01073 pounds per hour,
based on the "front and back-half' collections of the EPA type sampling train.
4. The two test average emissions of Radium 226 from the Dryer Stack were 1.53 x 10"3 .tCi/ml,
based on the "front and back-half' collections of the EPA-type sampling train.
5. The two test average emissions of Thorium 230 from the Dryer Stack were 9.01 x 10⁻¹⁴ tCi/rml,
based on the "front and back-half' collections of the EPA-type sampling train.
6. The two test averageemissions of lead (Pb210) from the Dryer Stack were 2.73 x 10⁻¹² •Ci/ml,
based on the "front and back-half' collections of the EPA-type sampling train.
7. The allowable pafticulate maitter emission rate is 0.30 pound per hour, as stated in Cogema
Permit #OP-254. The particulate emissions averaged 4.7 percent of the allowable standard,
based on the "front-half' collections of two tests.
Western Enviromnental Srvices and Testing, Inc. 99-1127 .*

Cogema Resource Company Lynch, WyomingYellow Cake Dryer
Ill. TEST PARAMETERS
Table 2Test Parameters and Particulate Results
Run Number: 1Start Date/Time 12/2/99 11:12
Stop Date/Time 12/2/99 12:15Test ParametersPba (Barometric Pressure, absolute)Y (Dry Gas Meter Calibration Factor)Cp (Pitot tube Coefficient)D, (Diameter of Nozzle)0 (Total Sampling Time of Test)AH (Orifice Pressure Drop)Vm (Volume of Dry Gas Sampled - as measured)Tm (Gas Meter Temperature, avg.), .V,. (Condensate - impingeisand silica gel)m, (Mass of Particulate Collected)Location/Process ParametersA. (Cross-sectional Area of Stack)P. (Static Pressure of Stack Gas)T, (Temperature of Stack Gas)4 Ap (Sq. root of velocity head of gas)CO 2 (Carbon Dioxide)02 (Oxygen)N2 (Nitrogen)CalculationsV,•t (Gas Sampled, standard conditions (std))V,,,,d (Water Vapor in Gas Sampled, std)B,, (Water Vapor in Gas, Proportion by Vol.)Gd (Proportion of Dry Gas in stack),Md (Molecular Weight of Dry Stack Gas)M, (Molecular Weight of Wet Stack Gas)P. (Pressure of Stack Gas, Absolute)Iso (Percent of Isokinetic Sampling)Flow Results .V, (Average Stack Gas Velocity)
Q5,, (Dry Volumetric Flow Rate, std.)Q. (Measured Volumetric Flow Rate, Actual)Particulate ResultsC, (Particulate Concentrations - std;)_•, (Particulate Emission Rate)
UnitsIn. HgunitlessunitlessInches
MinutesIn. H20ft3 (dry)Degr. Fml or g
mg
ft2
In. H20Deg. FIn. H20
W
ft3ft3
lb/lb-molelb/lb-mole
In. Hg
ft/m (fpm)ft3/m (dscfm)
ft 3/m (cfm)
gr/dscflb/hr
25.251.0020.844
0.24060.001.56
44.24047
64.01.99
1.40-0.11134
0.75140.8
19.6
79.6
39.173.017.14
92.8628.9128.1325.24100.4
2976
28904160
0.0008
0.019
212/2/99 12:31
12/2/99 13:33
25.251.0020.849
0.24360.001.68
44.509
49
65.60.97
1.40-0.11135
0.75670.8
19.679.6
39.22
3.097.30
92.7028.9128.1225.24
97.0
3018
29204210
0.0004
0.010
Average
25.251.0020.847
0.24260.001.62
44.37548
64.801.48
1.40-0.11
134.830.75
0.80
19.6079.60
39.203.057.22
92.7828.9128.1225.2498.71
2997
29054185
0.0006
0.014r -
Western Environmental Srvices and Testing, Inc. 99-1127 3

('wem~i Re~niirc~ CnmnnnvCoverna Resource Comnanv Lynch, Wyoming
Yellow Cake Dryer
Table 3Radioch
Tac~t Pa romatare
S(dscf-stdconditions)!
(dscm - std conditions)
Q. (Stack Flow Rate, dscm/hr)(Stack Flow Rate, dscf/nin)
Radium226 Amount collected (pCilsample)Possible error (pCi).Lower level detected - LLD (pCi)
LLD concentration .(i.Ci/ml).Concentration, (.Ci/m!)Possible conc. error (i.tCi/ml)
Release Rate (Ci/Day)Release Rate Error (Ci/Day)
Thorium 2 30 Amount collected (pCi/sample)Possible error (pCi)Lower level detected - LLD (pCi)
LLD concentration (liCi/ml)Concentration, (pCi/mIl)Possible conc. error. (4.Ci/ml)
Release Rate (CU/DIy)Release Rate Error (Ci/Day)
temistry ResultsRun 1
Date: 2-Dec-99
39.171.11
49102890
Run 2
2-Dec-99
39.221.11
4961
2920
0.340.08
0.16008
1.44E-133.06E- 137.21E-14
Average
49352905
0.000.04
0.16008
1.44E-130.OOE+003.6 1E-14
0.OOE+001.32E-07
00.04
0.16008
1.44E-130.OOE+003.61E-14
0.OOE+001.32E-07
1.4423E-13
1.53E-135.41E-14
1. 3E-06 5.66E-072.66E-07 1.99E-07
0.20020.080080.16008
1.44E-131.80E-137.21E-14
6.65E-072.66E-07
1.44E-139.01E-145.41E-14
3.33E-071.99E-07
Pb 210 Ahi6unf cllected (pCi/sample)
Possible error (pCi)Lower level detected - LLD"(pCi)
LLD concentration (pCi/ml)(concentration, i.Ci/ml)(possible deviation/error, p.Ci/ml)
Release Rate (Ci/Day)Release Rate Error (Ci/Day)
mass collected, (pCi/sample)Lowerf levlF detected - LLD (pCi/ml)
LLDconcentration (XCi/ml)Concentration, (•Ci/ml)
Release Rate (ýCDayv)
lb/Hr
3.460.402.24
2.600.362.24
2.02E-123.12E-123.61E-13
1.14E-051.32E-06
2.02E- 122.34E-123.24E-13
2.02E-122.73E-123.43E-13
8.65E-06 1.OOE-051.20E-06 1.26E-06
Uranium Nat. 107114.01
111714.01
1.26E-1 I6.54E-10
2.35E-03
0.01045
1.26E-11 1.26E-116.81E-10 6.67E-10
2.48E-03 2.4 IE-03
0.01100 0.01073U309
Western Environmental Srvices and Testing, Inc. 99-1127 4

Cogema Resource Company Lynch, WyomingYellow Cake Dryer
IV. TEST PROCEDURES
A summary of the methods used to test the stack is shown below. Because standard EPA
methodology was followed, only a brief description of each method is provided. Detailed US
Environmental Protection Agency (EPA) methods are available in Title 40 of the Code of Federal
Regulations (CFR), Part 60.
Part 60, Appendix A
Method 1 "Sample and Velocity Traverses for Stationary Sources"Method 2 "Determination of Stack Gas Velocity and Volumetric Flow Rate"Method -3 - "Gas Analysis for the Determination of Dry Molecular Weight"Method 4 :. "Determination of Moisture Content in Stack Gas"Method 5 "Determination of Particulate Emissions from Stationary Sources"
Sampling Point Determination6 (Method 1)
EPA Method 1 was used to deiermine the location of sampling points. Stack sampling points
shown below were based on the 'stack diameter and the distance from the test ports to flow
disturbances. The stacks were circular with two ports at 900 to each other.
Table 4Sampling Points
Sample .. % of InchesPoint Number Diameter from Wall
. .. .... .... 4. 4 .. ....Point 2 14.6 2 /16
'2Point4 70.4 . 11 '/4
Point-6 95.6 15 S/16
Velocity and Flow Rate Determination (Method 2)Velocity and temperatire~was measured 'at the points determined by Method 1 during isokinetic
testing. Wind tunnel calibrated pitot tubes were used to measure velocity head. Type K
thermocouples with digital pyrometers were used to measure temperature.
Carbon Dioxide, Oxygen, and Dry Molecular Weight Determination (Method 3)A portion of the gas from the sampling trains was collected in tedlar bags. Analysis of carbon
dioxide (C0 2) and oxygen (02) was performed with an Orsat Gas Analyzer. Dry molecular
weight was calculated from CO2 and02 concentrations.
Western Environmental Srvices and Testing, Inc. 99-1127 5

Cogema Resource Company Lynch, WyomingYellow Cake Dryer
Moisture Content Determination (Method 4)Water entrained in the stack gas was condensed and collected in chilled impingers in conjunction
with the isokinetic sampling. The volume of gas sampled was measured with a calibrated dry gas
meter. Moisture content was calculated from the gas and liquid volumes.
Particulate Determination;.(Method 5)
Particulate matter was colledted before or on a filter with a Method 5 train. Sixty-minute
sampling runs were performedis.okinetically in conjunction with Methods 1-4 on the Yellow Cake
Dryer stack. Gas -was withdrawn from the stack through a stainless steel nozzle and a glass lined
probe before being drawn through a filter connected to the probe. Pre and posttest leak checks
were performed for each run. All surfaces in contact with the sample prior to the filter were
rinsed with acetone. The acetone was evaporated and then desiccated to a constant weight, along
with the filter. Pitot, thermocouple, and meter calibrations are included in the appendix. A
schematic of the sampling train is shown in Figure 1.
Heated Stainless , Temperature.Steel Probe - Sensors '
I/
- Figure 1Method 5 Particulate Sample Train
Western Environmental Srvices and Testing, Inc. 99-1127 6

Coi!ema Resource Comnanv Lynch, WyomingYellow Cake Dryer
V. SOURCE DESCRIPTION
In insitu uranium mining operations, uranium is extracted by leaching from an underground ore
deposit. The leach solution containing soluble uranium is then pumped through ion-exchange
resin, where the uranium is "loaded on the resin. The leaching solution is then reconstituted and
pumped back underground."
The uranium is stripped from the resin in a concentrated form and precipitated with hydrogen
peroxide in the form of uranyl peroxide. The uranyl peroxide is dried to form U0 4 2H 20 and
loaded into a 55-gallon,dm• forfshi'pment.
The Wyoming Air Quality permit for the Yellow Cake Dryer is OP-254.
Western Environmental Srviees and Testing, Inc. 99-1127 7

r^-n~% D-- r^- V.,
Yellvnch, Wyomingow Cake Dryer
VI. CALCULATIONS
The values used in the sample calculations have been taken from Run 1 on the Yellow Cake Dryer
Stack. Results shown'below arecomputer generated to eliminate rounding error and may be
slightly different if calculated with a calculator.
1. Volume of water collected (wscf):
V,•,,d) = K(Vj.)
= 0.04707(64)
= 3.01 wscf
2. Volume of gas metered, standard conditions (dscf)
= (K)(VmXPbar + "H XY)
(460 +Tm )
(17.647X44.24X)25.:25 +}ý4)(1.002)
(460 + 47)
=39.17dscf
V.(,ad = Volume (fi) of water collected, standard
conditions
V1,-= Volume of liquid condensed in impingers. mg or ml
K = 0.04707 Conversion factor (ftl/ml)
V. (,Id) = Volume (ft?) of gas through the dry gas meter, at
standard conditions
V. = Volume Wft,) of gas sample through the drv gas
meter, ambient conditions
Pba, = Barometric pressure (inches of Hg)
At Average pressure drop across meter orifice (in.H 20)
Y = Dry gas meter conversion factor
T, Average dry gas meter temperature (0F)
K 17.647 = Conversion factor (oR/inch Hg)
13.6 = Conversion factor (inch H20/inch Hg)
460 = Conversion constant (OF to OR)
3. Moisture content, %
VwWstd) X100%Vm.,Id) + Vw(td)
3.01 AlOO%
39.17+3.01:
=7.14 %
&, = Percent by volume of water vapor in the gas stream
Vý(,d) = Volume (ft) of water collected, at standard
conditions
Vý(,,d) = Volume (fe,) of gas through the dry gas meter, at
standard conditions
-~ I
Western Environmental Srvices and Testing, Inc. 99-1127 8

Covema Resource Company , : . Lynch, WyomingYellow Cake Dryer
4. Dry Gas,%
Gd= I00-B,.
= 100-(7.14)
= 92.86 %
5. Molecular weight of dry gas stream (b/lb-mole)
Md= Mco (%c02) +Moz (%02) + (MCOoroMN) (%CO + 9%N2)(100) (100) (100)
= 44.0 (0.8) +3• (19.6) + 28.0'(79.6)(100) (100) (100)
= 28.91 lb/Ibmole
6. Molecular weight of sample gas (IIIhb.mole)
K = (Md)(Gd/100)+(MHmo)(BJ 100)
= (28.91)(92.86/100)+(18)(7.14/100)
=28.13 lb/lbmole
7. Sample gas pressure (inches of Hg)'
=( (P ) .(N.)
+ T(13.6)
= (25.25)-ý (-0.i1)
(13.6)
=25.24 in. Hg
Gd = Percent of dr gas by volume in the gas stream
Bý, Percent by volume of water vapor in the gas stream
M = Dry molecular weight of sample gas (lb/lb.mole)
Mco2 = Molecular weight of carbon dioxide (lb/lb.mole)
Uo 2 = Molecular weight of oxygen (lb/lb.mole)
Mco oN2 = Molecular weight of CO or N2
(ablb/.nole) (Same)
C0 2 = Percent bv volume of C0 2 in the gas stream
02 = Percent by volume of oxygen, in the gas stream
CO+N2 = Percent ky volume of CO and N2 in the gas
stream
100 = Conversionfrom percent to decimal fraction
A, = Molecular weight of sample gas, wet (lb/lb.mole)
AKid = Dry molecular weight of sample gas (lb/lb.mole)
Gd= Percent of dry gas by volume in the gas stream
Bý, = Percent by volume of water vapor in the gas stream
A1H.o = Molecular weight of water (lb/Ib.mole)
P, = Absolute sample gas pressure (inches of Hg)
Pb, = Barometric pressure (inches of ig)
Pg = Sample gas static pressure (inches of H20)
13.6 = Conversion factor (inches HPO/inches of Hg)
Western Environmental Srvices and Testing, Inc. 99-1127 9

r 0 nr.),. fn-mn Tm
Yellrnch. Wyomingow Cake Dryer
8. Velocity of sample gas (ft/min)
v~~~~~=3 ( XcXo'{ +460]
= (85.49 X0.844 X6Qo1.07514) 134 + 460. (28.13)(25.24)
= 2,976 fpm
9. Total flow of sample gas (acfm)
Qa = (As)(Vs)
= (1.40)(2,976)
=4,160 cfm
10. Total flow of sample gas (dscfm)
(Q.)(Ps)(1 7 .6 4 . 7)( Gd
(TI' + 460)
(4,160)(25.2 4)(17.64 7)( 92.86 to
Cp = Pitot tube constant
Kp = Velocity pressure coefficient (dimensionless)
60 = Conversion factor (sec/min)
M, = Molecular weight of sample gas, wet (lb/Ib.mole)
P, = Absolute sample gas pressure (inches ofHg)
T, = Average sample gas temperature (MF)
V, = Sample gas velocity O./min)
=/F Avg. square roots ofstock gas velocity head (in H20)
460 = Conversion constant (IF to "R)
Q= Volumetric flow rate at actual conditions (acfin)
A, = Cross sectional area of sampling location (ft)
V,= Sample gas velocity (f't/min)
Q,,d = Volumetric flow rate at standard conditions, dry basis
(dscfn)
Q= Volumetticflow rate at actual conditions (acfm)
P,= Absolute sample gas pressure (inches of Hg)
Gd = Percent of dty gas by volume in the gas stream
T= Average sample gas temperature (7)
17.647 = Conversion factor ("R/inch Hg)
460 = Conversion constant (OF to 'R)
(134 + 460)
=2,890 dscf
11. Isokinetics
Isokinetics = (KXV.d)(TS +460)
p.,-s Xk n-.O- ),~ •)(a,
(0.0945)(39.17)(134 +460)2 2.976 1 6 (3".141 i'.240' 92,g6
= 100.4%
T,= Average sample gas temperature (F)
K 0.09450 = Conversion constant
V,,,d) = Standard volume (ft3) of gas through dry gas meter
P, = Absolute sample gas pressure (inches of Hg)
V, = Sample gas velocity (ft/min)
D,= Average diameter of nozzle (in)
0 = Total sampling time (min)
Gd = Percent of dry gas by volume in the gas stream
144 = conversion factor, square inches to square feet
Western Environmental Srvices and Testing, Inc. 99-1127 10

Cnt~em~ Re~niirce Comn~nvCopema Resource Cornnanv
12. Concentration of Particulate
C'= (K)(m.)Vm(,td)
_ (15.43)(0.00199)
39.17= 0.0008gr / dscf
13. Particulate emissions (lbs/hr)
E (C,)(Q,,d)(60)
7000(0.0008)(2890)(60)
7000=0.019lb/l•r
14. Radium 226 Lower Limit of Detection (LLD)concentration (.Ci/nil)
CLLD - (K,)(LLD)
V'm(Sta')( 2
S(I x 10"6)(0.16)
1.11(1 x 10⁶)
= 1.44x 10" 3 pCi / ml I (air).
Note. LLD, Actual and Possible error concentrations for Thorium230,
Lead 210 and Uranium Natural all calculated in a similar manner.
15. Release Rate of Lead 210 (Ci/month)
RRci/month = (Amt.Collected)(Q0 ,d)(K1 )(K 2 )(K,)
Vm('nd)
(3.46)(49 '0)(24)(3 1)(Ixl 0-12)': .1.11
= 1.14x10⁵ Ci/month
Note: Radium2,6, Thorin2jo and U Nat. calculated similarly
16. U30s emissions (bs/hr)
Ei = (amountu"0 "collected)l. 179(Qotd)(K,)(Vm,,d)(453.59x10⁶)
(1071)(1.179)(4910)(0.67)(1.11)(453.59x1 06)
=0.01045 lb/lr.
Western Environmental Srvices and Tesfiig, Inc.
Lynch, WyomingYellow Cake Dryer
C, Concentration of particulate in stack gas, gr/dscf
m= mass ofparticulate collected, grams
Vm(da) = Dry standard volume (fJ) of gas through meter
K = 15.43 = conversion factor (grains/gram)
Elb/hr Emission rate (lb/hr)
C, = Measured concentration in the gas stream (gr/dscJ)
Q,,d = Volumetric flow rate at standard conditions, dry basis
(dscfm)
60 = Conversion factor (min/hr)
7000 = Conversion factor (gr/lb)
CLLD = Radium2 26 Lower Level of Detected concentration,
ptCi/ml of air
LLD = Radium226 Lower Limit of Detection from lab*,pCi/sample
V,ý(a•) = Dry standard volume (m3) ofgas through meter
K, I x 10-6 m3/ml = conversion factor
K12 I x 106 pCi/ýtCi = conversion factor
*Uranium Natural LLD = 3.34, based on 5 mg/samplex 0.667pCi/mg
RR = Release rate (Ci/month)
Amount collected = Radium 226 in the sample (pCi)
Qd, = Dry standard volumetric flow rate (dsm3/hr)
K, = Conversion factor (24hr/day)
K2 = Conversion factor (1 X 10-12 Ci/pC()
K3 = Conversion factor (31 days/mont/)
Vm(,td) = Dry standard volume (W) of gas through meter
ETh/hr = Emission rate (lb/hr)
Amount collected uranium natural in the sample (pCi)
K, = 0. 67 pCi/p-g = Un. radioactivity to mass cony. factor
1.179 =fraction of uranium nat. as U308 (molecular wt. ofU30 8/ molecular wt. of3U,,., 842.0822/714.087)
Q,'d = Dry standard volumetric flow rate (dsm3/hr)
453.6x106 = Conversion factor (pgram/lb)
99-1127 11

I'
A. Field Testing Data
'I
B. Computer Data Entry:_'-,'F
Ui
0. Equipment Calibration
E`. Chainof-Custody .
"' P.,~ SUesunfii-,`T s[:: t'S; ll~ liir;::t•,,
* 2
'I FI
1
* 'I

APPENDIX A
FIELD TESTING DATA

Facility (cre-'o. Job No: ")H/27
Run No._ _ Dale: 12- ?-
So,,ce/i .D No. vr:6ý Y ,°.Stack: Area In? (A.)_•_.LL Dia (In. ,
,Operators ,
Meter Box #LL Calib. Faclor(Y) L1. O
Nozzle. # )0- 5 Diameter (Dj 0Pilot-i'D'. - Callb.Factor(Cp)_O..,_Y~y,/
Schematc of Stack Cross Secton
orUp ,
Western Environmental Services and Te: ling, Inc.K Factor -7 ,=P ' -2.
Barometric Pressure (Pb).•>.j? :
Amb. OI" Assumed Molsiure ___
Static Slack Pressure *H4O (+/-)------
Probe Length I Material . ,,..Before Mido u Affo
Pilot Tube Leak Check 5 •" -__ c 4.
Initial. Leak C " "Hg = ,O: fI3/mi'n
(Sd Field Data 3am Flow Out I In Final Leak / 0 '. ."Hg =_______ _
-Pump TemperatureF
PointClockTime
-Dry GasMeter (It3)
AP (Pitot)"H20
AH (Orflice) "H20
Desired] I Actual-.,PumpVac. "Hg Temoerature'OF:
_77-Probe I T. (stack) Tm .In TmQOul Filter Exit. ] *Whob.
Vac. "Hg Filter Exit I ~P4eN-Prebeh - t -- ~-~-~-~- 1 ---- I ~- - t t - I - t . I ~ I~ -~ - *B-C1 . 1/a, k/ýo ]/.3ýO AV ",2r" i
5 7/iT -,or 7~ Lfi 7'7 -___ __4
/~I .192Y. q Sf /•7 XVc 15r C2 z~< sy4(:~5
74 1 ' -T'.,aq - c.7- - -
11 /.20 -LIq) 49 3 /.A )2 fC 22 /13 / 77 7247' 5,7:__
//~.% 17. oo 7 r7• sr /,r& 4t 155 ,i,-7 .2' 41 F4
/ 0;fo )0 ,4 0 ,3 s-j -/7 ____r sl____ __
~~~)i .1;4* W1,f __2 _____ ____ ___ _5 _ _ _ __
= ) _- - =J -.<. I
I
1-~
I
Uncorrected V ttZ %C0 2o04 %CO..U_%O2L111 %N2 -7 9
Sample Purge: Initial _ FinalVolume Collected Vk, 6 Y. ml Sample Time, O._.• igl

Facility n Job No: *'=/-/27Run No.. Date: 1!2 - 2. - 9?Soutfce I.D. No. yt 116 t C.,L, t 111g seStack: Ahea in (A.)-2. Da (In)1i
Meler,'1ox #__44_CaIlIb. Factor(Y)MNoz &-? # -Diameter (Dj_.L._ePilot1.lD.. 4.-LZ/ CaIlIb.Faclor(Cp)_,.=.V?
___'____________Field Data
schemaftý $tM(MCr seoswa
SLA1/ '
or Up Gas Flow Out I tn
Western Environmental Services and Te; ling, Inc.K Factor ,2..7
Barometric Pressure (Pb)L.2JE±;j
Arab. OF__ . Assumed Molsiure %O
J 8tatic Stack PiesSUre ;H20 (+1-)0./I
Probe Length i Maeodfi1l"-"L-.__Blefore' M4do a Afte,
Pilot Tube Leak Check .. "lŽ -
Initial Leak @4-EI12/ - = =• ft3/min
Final Leak @_/q"Hg =11, 3 /hnin
I
Clock Dry Gas . &P (PRo) AH (orince) H2o Pump .. ,Temperature OF_ ..Point Time Meter (t'3 - "H20. Desired I Actual Vac. HgI Probe: IT stack) I 1f4TmOut Fiter Exit I .______.:_____._.I
_ ___... . __ _ _ ___ .. - . . .. .. .r% .. .. ,- . . .._,. .... J- •, ..... ... . .,.L .. .. I. ' .. ... .... ..
71/ 0. (4 ý LeP7 , -- 41 - •, ,.=
C _ 1:,/rl.,,o I ,I /,f? / , 4F 1 7 t/ ,.F /• -• _ I. 7 ---- "
II" L L JLL ....LLL '_1 ,... .. .' ' n/ ____
I);/L I Vf Z 0 ýt i.4r 1,2 7_/ 1;." . L :__
2 0131. /,2_-- .
37A/iL'~_ I
I _____________
Unco decled Vm 4491.• oil 13Corrected V,11
%C02 10 %CO :2-%0 2 /- C %N27•,
Sample Purge: nial______ FinalVolume Collected V,,, to'. ml Sample Time. 0__ iLih1

APPENDIX B
COMPUTER DATA ENTRY

CogemaLinch, WyomingYellow Cake Dryer Stack
Run: 1 Western EnvironmentalJob Number 99-1127
Particulate
Method: 5For Particulate
Area: 1.40 sq.ft.Time/Point: 5.0 min
Sample Time: 60.0 min.
Date/Start Time 12/2/99 11:12
Pretest Leak Rate 0.000 cfm @
Static Pressure: -0. 11 in. H20Barometric: 25.25 in. Hg
Silica Gel: 12.7gramsCondensate: 51.3grams
- Total Wt. 64.0grams
Meter No: 19Meter Correction Factor: 1.002
Sample Box No: ApexPitot Tube Cp: 0.844
Probe Tip Diameter 0.240Filter No: 3Q-410
% C0 2 0.8
Hg %0219.6
Date/Stop Time 12/2/99 12:154
15 in Hg Posttest Leak Rate 0.000 cfm @ 15 in,
PointB 6
54321
EndA6
54321
End
ClockTime1112111711:2211:2711:3211:3711:4211:4511:5011:5512:0012:0512:1012:15
Dry-Gas.Meter
267;216.2701750274.540278.330282.090285.840289.563289.563293.300297.000300.670304.280307.830311.456
Pitot(in. H20)
0.600.610.610.590.570.55
0.560.53.0.570.550.530.51
ActualA&H
1.501.651.651.601.651.60
1.601.551.551.501.451.40
1.5583
StackTemp.134134134135135134
134134135135135134
)ro Gas-Meter"TempInlet Outlet:46-, r46
.46 4646 " 4645 4546 -4646 46
":Vol. PPoint
,-3.79 I3,793.793.763.753.72
3.743.703.673.613.553.63
0.7750.7810.7810.7680,7550.742
0.7480.7280.7550.7420.7280.714
0.7514
Iso093.499.499.4
100.5101.8102.8
102.2103.899.499.599.5103.5
464747474848
464747474848
134 47 44.24

APPENDIX C
ANALYTICAL DATA

Lab Results
Volume of SampleRun IRun 2
2.0012.002
ParametersReported Activity conc. (pCi/liter)
Run IRun2
Reported Error conc. (pCi/liter)Run IRun 2
Calculated Amount collected (pCi/sample)Run IRun 2
Calculated Possible error (pCi)Run IRun 2
Lowest level detected LLD (pCi)Run IRun 2
* 1 pCi = 0.67lig
Radium 226 Thorium 230 Lead 210 Uranium Nat.
< 0.080.17
< 0.080.1o0
1.731.3
0.20.180.04
0.000.34
0.04
0.000.20
3.462.60
535.33*
558l1"I*
54.74*57.02*
1071.201117.34
109.53114.15
Estimated14.0114.01
0.040.08008
0.040.08008
0.40020.36036
Calculated2.242.24
0.160.16
0.160.16

Lab Number:99-5266-OICFebruary 23, 2000
WEST913 Foster RoadCasper, WY 2601Cogema - 99-1127Attention: Dan Klausen
Run 1 - HNO' Rinse / Back Half
Sample co1lected December 2, 1999 @ 11:12
Analysis Activity Error
Radium 226 <0.08 pCi/L
1.73 pCi/LLead 210
Total Uranium
+
+
+
+
0.2 pCi/L
81.7 pg/L799 pg/L
Thorium 230 <0.08 pCi/L
Submitted : 12/3/99Completed: 2/23/00Analyst: Out side Lab
Environmental Supervisor
Enviro i TestE 1 LABORATORIES LLC.C 0003
Limit of Liability: Although care and due diligence is taken in the performance of our services, our liability in all cases islimited to re-analysis at our expense or refunding the analytical costs charged for the work performed.

FILTER ANALYSIS
Job NumberClient NameUnit
99-1127CogemaYellowcake Dryer
Run Date 12/2/99
RUN i FILTER # 3Q-41 0 AVERAGE
Filter + ParticulateFilter TareParticulate Weight
0.32430.32320.0011
0.32430.32330.0010
0.32430.32330.0010
RUN 2 FILTER# 3Q-411 AVERAGE
Filter + ParticulateFilter TareParticulate Weight
0.33060.33000 W0006
0.33050.33010.0004
0.33060.33010.0005
BLANK
Filter + ParticulateFilter TareParticulate Weight
FiLTER #
0.3327
0.0002
30-412
0.33260.33220.0004
AVERAGE
0.33270.33240.0003
1216/991218199
Analyst GLH StartedCompleted
FINAL REPORTC, c~>

APPENDIX D
EQUIPMENT CALIBRATION

WESTERN ENVIRONMENTAL SERVICES AND TESTING INC.METER-BOX CALIBRATION FORM
Meter Box Num: 19 Average DGM Y = 1.002 Tech: TMPb = 24.65 Delta H@ = 1.783 Date: 10/7/99
Oufe I.D.. 48 KI= 0.3497 o I.D.= 55 Kin 0.4597
1 2 2
I M Final 331.215 . .. 333.476 336.497 339.493
328.958 3331M215 ,, , 33& ,5n .
___" 2.257' 2.61' I? 2.970emP In/Out 64 1 rll4 65 + 66 1 so I a ! 17
OPTmRIF _524 64 "525 65 526 68 527 67
H 0.51 0.51 0.91 0.91ime: 15.o3 . 5.001 50o21 5.004 459.87 4.M98 50.21 -. 54
71 71 71 7118.0 18.5 17.5 17.5
m (std) 1.877 1.877 2.461 2.481
cr st 1.871 1.872. 2.458 2.460
DGMCF Y 0.997 0.997 0.999 1.000
1tH M .709 1.706 1.762 1.760o,if,.iv.= 63 im 0o.5984 = om 7.- 3 Kim 0.8198
I_...1. 2 1 2
M Final 343.534 347.363 352.657 357.903
Initial 339.537 343.534 347.418 352.657
m 3.997 3.829 5.239 5.246
52g.Tr 8 68 528 68 529 69 530 70
DeaH 1.60 1.60 2.95 2.95514e: 1 3 5.224 4 9.88 4.9 459.96 5.000 4 5.96 4.999
71 71 72 7916.01 16.0 14.0 15.0
(Sid) 3.312 3.170 4.351 4.348
Vr (std) 3.333 3.189 4.380 4.352
CF Y 1.006 1.006 1.007 1.001
H 1.843 1.841 1.813 1.833
L~

WESTERN ENVIRONMENTAL SERVICES AND TESTING, INC.
NOZZLE CALIBRATION DATA
Date: 10/12/99
Technician: 'WP
."Page: 1 of 3
0.125
J--+-C > 0.125
Nozzle ID #
N-10.125
Random: 0.125 1 0.125
Average: 0.125. 0.125
Nozzle ID #:
N-2
0.184
0.185
0.184
0.85
(low) (hihRandom: 0.184 1 0.185
Average: 0.185
Nozzle ID #:
N-3
0.240
0.239
0.240 _1_
Random: 0.23
0.240 Average:
The difference, between the dhigh and low must be within 0.004 Inches.
lihlh39 I 0.240
0.240
I I
ID 09f2:1 :

WESTERN ENVIRONMENTAL
PITOT TUBE CALIBRATION
Pilot Tube ID No.:
Performed by:
Calibration Date:
A-4
SB
10/12199
High side calibration factor: 0.844
Low side calibration factor: 0.844
Comments:
,, A-Sde Cabatior h. side )rUP-(wT
(in.) (in.)H20,, H_20-_ _ _ _
0.93 .30-, 0.844 0.000
*.0.93 -1.30., 0.844 0.000
0.93 1.30 0.844 0.000
Average (Cp)_ 0.844 ..
B-Side Calibration (low side)
APS~' As' P ()r Dev.(in.) (in.)H 2 0 H 2 0
0.93 1.30., 0.844 0.0000.93 1••. ... :30~ o.44. , .00o
0.93 1.30 0.844 0.000
Average' (Cp') 0.844
Cp (S " " Cp s&I) d ': •:i! Temperature (°F)" 73
s Humidity (%)" 25
Dev.0 = Cp (S)a - Cp' (must be < 0.01) Date: 10/12/99
Cp' (A) - Cp' (8) 0.000: (must be <.0.01) Cp (std)*: 0.998
Cp (A) = 0.844 Cp' (B) = 0.844 Standard Pitot No.:. 2
-Cp (si) obtained from Dwyer Instumeat ar velociy calculator.
Cailbaons vm damn. ha cardwmcSwkh CWR TW*40, Pat W Appofit , i~, 94
.. 0005

APPENDIX E
CHAiN-OF-CUSTODY

'wVESTERN ENVIRONMENTAL SERVICES AND TESTING, INC.['•13 Foster Road, Casper, WY 82601 1jj P.O. Box 1626, San Marcos, TX 78667-1626 E" PO Box 754, Evanston, WY 82935 1:1 1959 S. 4130 W., Unit D, SLC, UT 84104' -" (307)234-5511 FAX (307)234-8324 (512)392-7788 FAX (512)392-7790 (307)789-6420 FAX (307)789-6446 801-886-1667 FAX 801-886-1669
CHAIN OF CUSTODY RECORD
PROJECT NO.: 7-//, 7 (06-6/1fA CONTACT NAME -,, / _
_Recovered By: Print Name -- Signature . , -- ,
TELEPHONE NO.
COMMENTS: /4// recdorlý alC7ý1-1- e9k-4/ A&4 Za lle'11ý6ý
Reli tdb Sgria ure) Cumpany
Company
Date Time
Date timeRelinquished by: (Signature)'
Dispatcled by: (Signature)
Method of Shipment:
Received by: (Signature)
Received by: (Signature)
Received , orlaboratory by
Company -
Company
Company
Date
Date
4i -3- -!ý",,
--- -rDato
Company Date [me
Time
Time0in
. I/
M00953 11/94WHITE COPY-WEST YELLOW COPY-CUSTOMER

APPENDIX F
RESUMES OF TEST PERSONNEL

"O*A
TechnicalExpertise:
TechnicalExperience:
Education:
Certification:
PROFESSIONAL PROFILE
WILLIAM A. BYRD IIIEnvironmental Specialist
S.Source Emission Testing
* ::QCalibration, and Maintenance of Sampling Equipment
Monito0ring Equipment Repair
* Hazardous Shipping
Mr. Byrd has provided source testing since early in 1999. His experience is with testsworking with EPA methods 1-5. Mr. Byrd has experience in sample recovery andchain-of-custody procedures for particulate. He has training and experience inhazardous materials shipping.
Mr. Byrd has completed college courses in Environmental Law, Environmental Ethics,Hazardous Materials and Waste, and Environmental Ecology.
MSHAH2SBEC (First'Responder for First Aid and CPR)DOT Training (without certification)
F 0001

APPENDIX 4
Maps

THIS PAGE IS ANOVERSIZED DRAWING OR
FIGURE,THAT CAN BE VIEWED AT THE RECORD
TITLED:"IRIGARAY PROJECT
GENERAL LOCATION MAPMINE UNIT 1 THRU 9"
PERMIT TO MINE No. 478.
WITHIN THIS PACKAGE... ORBY SEARCHING USING THE
D-01

THIS PAGE IS ANOVERSIZED DRAWING OR
FIGURE,THAT CAN BE VIEWED AT THE RECORD
TITLED:"CHRISTENSEN RANCH
AREA FACILITIES LOCATION MAP"PERMIT TO MINE No. 478.
WITHIN THIS PACKAGE... ORBY SEARCHING USING THE
D-02X