Sub Wet-Bulb Evaporative Chiller · sub wet bulb evaporative chiller (SWEC) technology has a...
28
Emerging Technologies Sub Wet-Bulb Evaporative Chiller ET15SCE7040 Prepared by: Emerging Products Customer Service Southern California Edison June 2015
Transcript of Sub Wet-Bulb Evaporative Chiller · sub wet bulb evaporative chiller (SWEC) technology has a...
Emerging Technologies
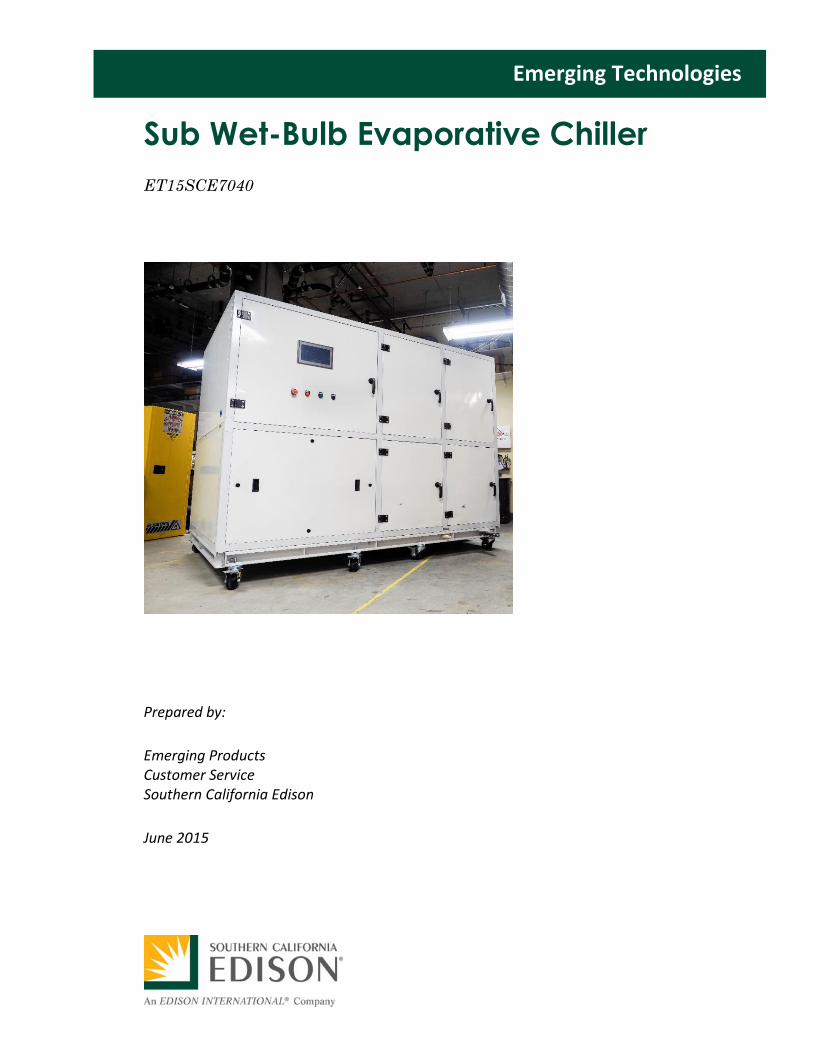
Sub Wet-Bulb Evaporative Chiller
ET15SCE7040
Prepared by:
Emerging Products Customer Service Southern California Edison
June 2015

Sub Wet-Bulb Evaporative Chiller ET15SCE7040
Southern California Edison Emerging Products June 2015
Acknowledgments
Southern California Edison’s Emerging Products (EP) group is responsible for this project. It
was developed as part of Southern California Edison’s Emerging Technologies Program under
internal project number ET15SCE7040, by University of California Davis’s (UC Davis) Western
Cooling Efficiency Center (WCEC). Jay Madden conducted this technology evaluation with
overall guidance and management from Jerine Ahmed. Contact [email protected] for
more information on this project.
Disclaimer
This report was prepared by Southern California Edison (SCE) and funded by California utility
customers under the auspices of the California Public Utilities Commission. Reproduction or
distribution of the whole or any part of the contents of this document without the express
written permission of SCE is prohibited. This work was performed with reasonable care and in
accordance with professional standards. However, neither SCE nor any entity performing the
work pursuant to SCE’s authority make any warranty or representation, expressed or implied,
with regard to this report, the merchantability or fitness for a particular purpose of the results
of the work, or any analyses, or conclusions contained in this report. The results reflected in
the work are generally representative of operating conditions; however, the results in any
other situation may vary depending upon particular operating conditions.
Sub Wet-Bulb Evaporative Chiller ET15SCE7040
Southern California Edison Page i Emerging Products June 2015
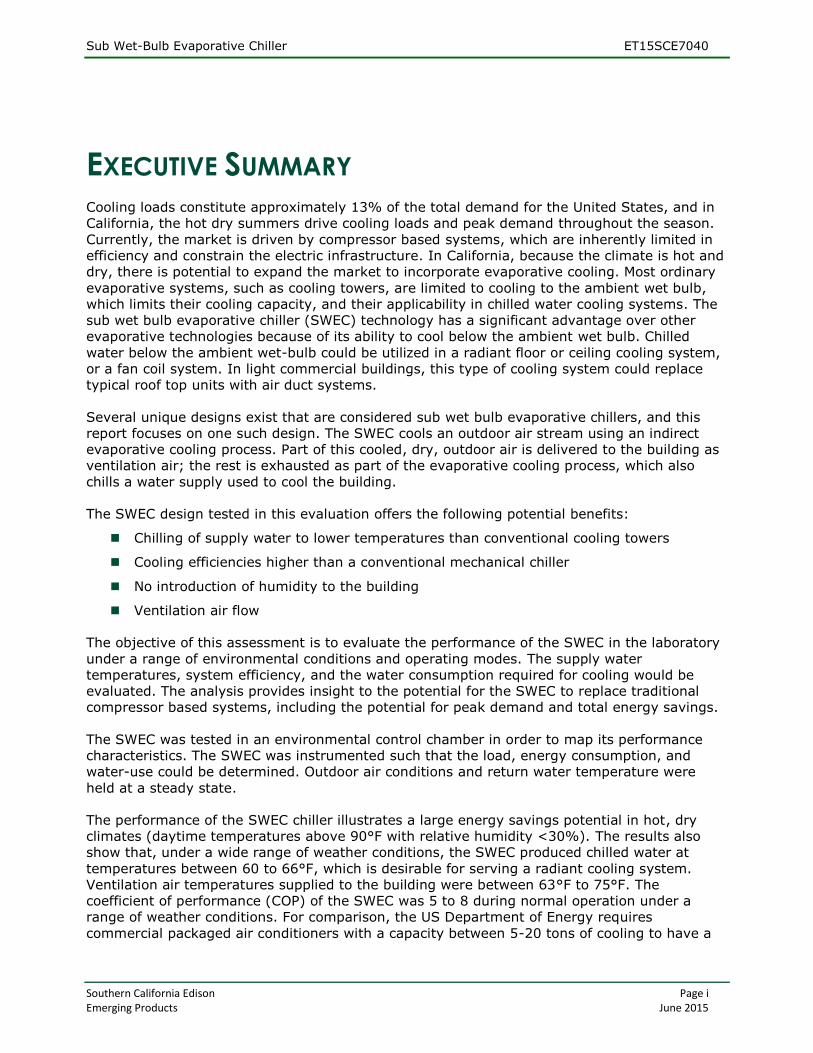
EXECUTIVE SUMMARY Cooling loads constitute approximately 13% of the total demand for the United States, and in
California, the hot dry summers drive cooling loads and peak demand throughout the season.
Currently, the market is driven by compressor based systems, which are inherently limited in
efficiency and constrain the electric infrastructure. In California, because the climate is hot and
dry, there is potential to expand the market to incorporate evaporative cooling. Most ordinary
evaporative systems, such as cooling towers, are limited to cooling to the ambient wet bulb,
which limits their cooling capacity, and their applicability in chilled water cooling systems. The
sub wet bulb evaporative chiller (SWEC) technology has a significant advantage over other
evaporative technologies because of its ability to cool below the ambient wet bulb. Chilled
water below the ambient wet-bulb could be utilized in a radiant floor or ceiling cooling system,
or a fan coil system. In light commercial buildings, this type of cooling system could replace
typical roof top units with air duct systems.
Several unique designs exist that are considered sub wet bulb evaporative chillers, and this
report focuses on one such design. The SWEC cools an outdoor air stream using an indirect
evaporative cooling process. Part of this cooled, dry, outdoor air is delivered to the building as
ventilation air; the rest is exhausted as part of the evaporative cooling process, which also
chills a water supply used to cool the building.
The SWEC design tested in this evaluation offers the following potential benefits:
Chilling of supply water to lower temperatures than conventional cooling towers
Cooling efficiencies higher than a conventional mechanical chiller
No introduction of humidity to the building
Ventilation air flow
The objective of this assessment is to evaluate the performance of the SWEC in the laboratory
under a range of environmental conditions and operating modes. The supply water
temperatures, system efficiency, and the water consumption required for cooling would be
evaluated. The analysis provides insight to the potential for the SWEC to replace traditional
compressor based systems, including the potential for peak demand and total energy savings.
The SWEC was tested in an environmental control chamber in order to map its performance
characteristics. The SWEC was instrumented such that the load, energy consumption, and
water-use could be determined. Outdoor air conditions and return water temperature were
held at a steady state.
The performance of the SWEC chiller illustrates a large energy savings potential in hot, dry
climates (daytime temperatures above 90°F with relative humidity <30%). The results also
show that, under a wide range of weather conditions, the SWEC produced chilled water at
temperatures between 60 to 66°F, which is desirable for serving a radiant cooling system.
Ventilation air temperatures supplied to the building were between 63°F to 75°F. The
coefficient of performance (COP) of the SWEC was 5 to 8 during normal operation under a
range of weather conditions. For comparison, the US Department of Energy requires
commercial packaged air conditioners with a capacity between 5-20 tons of cooling to have a

Sub Wet-Bulb Evaporative Chiller ET15SCE7040
Southern California Edison Page ii Emerging Products June 2015
minimum rated energy efficiency ratio of at least 11 at 95°F outdoor air temperature, which
equates to a COP of 3.22 [1]. Therefore, the tested technology could roughly double the
cooling efficiency delivered by standard packaged air conditioning equipment. The test results
showed that the water consumption of the SWEC under normal operating conditions was 1.0 to
2.5 gallons per ton-hour of cooling delivered.
The results of the lab evaluation of the SWEC technology show that it has great potential to
reduce energy use by 50% in hot dry climates. Although the technology shows great potential
there are also some significant barriers that need to be overcome. In general, radiant panels
add significant costs to any installation, and don’t have great market penetration. One or
multiple fan coil units can potentially replace a traditional evaporator coil, and also be more
cost-effective than a radiant system.
It is recommended that further research be done in order to determine the cost-effectiveness
of a SWEC with using fan coil units in a residential or multi-family building. The analysis should
determine if a fan coil thermal distribution system can meet the load in a residential building in
California climate zones, or if a small backup chiller would be needed to supplement the SWEC
cooling in some cases. The analysis should also determine whether the addition of a thermal
storage system makes economic sense as a peak demand reduction strategy.

Sub Wet-Bulb Evaporative Chiller ET15SCE7040
Southern California Edison Page iii Emerging Products June 2015
ABBREVIATIONS AND ACRONYMS
BTU British Thermal Unit
COP Coefficient of Performance
CS Cold Side
CFM Cubic Feet per Minute
DB Dry Bulb
DP Dew Point
EA Exhaust Air
GPM Gallon per Minute
HS Hot Side
Hz Hertz
NI National Instruments
OA Outside Air
RA Recirculated or Return Air
RTD Resistance Temperature Device
SA Supply Air
SCE Southern California Edison
SWEC Sub Wet bulb Evaporative Chiller
WB Wet bulb

Sub Wet-Bulb Evaporative Chiller ET15SCE7040
Southern California Edison Page iv Emerging Products June 2015
CONTENTS
EXECUTIVE SUMMARY ______________________________________________________ I
INTRODUCTION __________________________________________________________ 1
Background ................................................................................................................................ 1
Assessment Objectives............................................................................................................... 2
TECHNOLOGY DESCRIPTION ________________________________________________ 2
TECHNICAL APPROACH/TEST METHODOLOGY ___________________________________ 4
Overview .................................................................................................................................... 4
Test Plan ..................................................................................................................................... 4
Instrumentation Plan ................................................................................................................. 6
Water Temperature Measurements .................................................................................10
Evaporative Water Consumption Measurements .............................................................10
Differential Pressure and Airflow Measurements .............................................................10
Tracer Gas Measurements ................................................................................................10
Chamber Conditions Measurements .................................................................................11
Power Measurements .......................................................................................................11
Data Acquisition System ....................................................................................................11
Test Tolerances ........................................................................................................................11
Data Analysis ............................................................................................................................12
Capacity .............................................................................................................................12
Coefficient of Performance ...............................................................................................13
Uncertainty Analysis ..........................................................................................................13
Results ......................................................................................................................................14
Discussion .................................................................................... Error! Bookmark not defined.
CONCLUSIONS _________________________________ ERROR! BOOKMARK NOT DEFINED.
RECOMMENDATIONS _____________________________________________________ 19
REFERENCES ___________________________________ ERROR! BOOKMARK NOT DEFINED.
APPENDICES ___________________________________________________________ 21
Sub Wet-Bulb Evaporative Chiller ET15SCE7040
Southern California Edison Page v Emerging Products June 2015
FIGURES Figure 1. Simple schematic of SWEC operation..................................................... 3
Figure 2. Load rig used to provide building load to SWEC .................................... 7
Figure 3. Swec being moved into the chamber ..................................................... 7
Figure 4. Diagram of SWEC instrumentation locations. Instrumentation labels correspond to Table 4. ...................................................................... 8
Figure 5. Effects of varying return water temperature ....................................... 14
Figure 6. Effects of varying inlet air flow ............................................................. 15
Figure 7. Effects of varying Inlet dry bulb temperature ...................................... 16
Figure 8. Effects of varying inlet dry bulb temperature ...................................... 17
TABLES Table 1. Chiller test points ..................................................................................... 5
Table 2. Variation of parameters ........................................................................... 5
Table 3. Instrumentation models and accuracy .................................................... 9
Table 4.Test tolerances ........................................................................................ 12
Table 5: Baseline comparisons ................................ Error! Bookmark not defined.
Table 6.SWEC performance results ..................................................................... 21
EQUATIONS Equation 1. Tracer gas equation .......................................................................... 11
Equation 2. Capacity ............................................................................................ 12
Equation 3. Mass flow rate of water ................................................................... 12
Equation 4. Mass flow rate of air ........................................................................ 12
Equation 5. Coefficient Of Performance ............................................................. 13
Equation 6. Sequential Perturbation ................................................................... 13
Sub Wet-Bulb Evaporative Chiller ET15SCE7040
Southern California Edison Page 1 Emerging Products June 2015
INTRODUCTION This purpose of this project is to complete a laboratory evaluation of a sub wet-bulb
evaporative chiller (SWEC). The SWEC is an evaporative cooling technology that chills water to
cool a building in combination with a radiant or fan coil distribution system. In addition to
chilled water, the SWEC also provides cool ventilation air using indirect evaporative cooling
technology. (This is done so no humidity is added to the ventilation air). The SWEC technology
can be manufactured in different sizes and configurations. The unit tested in the laboratory
was designed to provide approximately 3 tons of cooling, including the 600 cubic feet per
minute (cfm) of ventilation air.
BACKGROUND Cooling loads constitute approximately 13% of the total demand for the United States, and in
California, the hot dry summers drive cooling loads and peak demand throughout the season.
Currently, the market is driven by compressor-based systems, which are inherently limited in
efficiency. In California, because the climate is hot and dry, there is potential to expand the
market to incorporate evaporative cooling. Most ordinary evaporative systems, such as cooling
towers, are limited to cooling to the ambient wet bulb, which limits their cooling capacity, and
their ability to be used in a radiant system. The SWEC technology has a significant advantage
over other evaporative technologies because of its ability to cool below the ambient wet bulb.
While sub wet-bulb cooling does exist on the market, the SWEC technology offers the potential
to advance beyond some of the challenges that the existing technology faces in the market.
The SWEC has the potential to be used as a stand-alone chiller, with no backup refrigerant
based system, meaning that it could reduce some of the initial expense associated with
evaporative cooling and eliminate the hazards associated with refrigerants in terms of
greenhouse gas emissions, ozone depletion, and global warming potential. Because
evaporative coolers are often paired with a backup cooling unit, this offers a significant
advantage to the SWEC. Other market barriers to the SWEC include the fact that retrofits can
be cost prohibitive, and that there is additional maintenance required for an evaporative
cooler.
The goal of this project is to test the SWEC under various outdoor air conditions, and analyze
the performance. The analysis provides insight to the potential for the SWEC to replace
traditional compressor-based systems, and the reduction of peak demand associated with
using a SWEC. The test points for the SWEC were based on expected conditions in the hot dry
climate zones of California. The outdoor air conditions covered common temperature and
humidity conditions in California summers, and the return water temperatures covered
expected return water temperatures for a residential or light commercial building with a fan
coil distribution or radiant system installed.
Sub Wet-Bulb Evaporative Chiller ET15SCE7040
Southern California Edison Page 2 Emerging Products June 2015
ASSESSMENT OBJECTIVES The objective of this assessment is to evaluate the performance of the SWEC in the laboratory
under a range of environmental conditions and operating modes. The supply water
temperatures, system efficiency, and the water consumption required for cooling would be
evaluated. The analysis provides insight to the potential for the SWEC to replace traditional
compressor based systems, including the potential for peak demand and total energy savings.
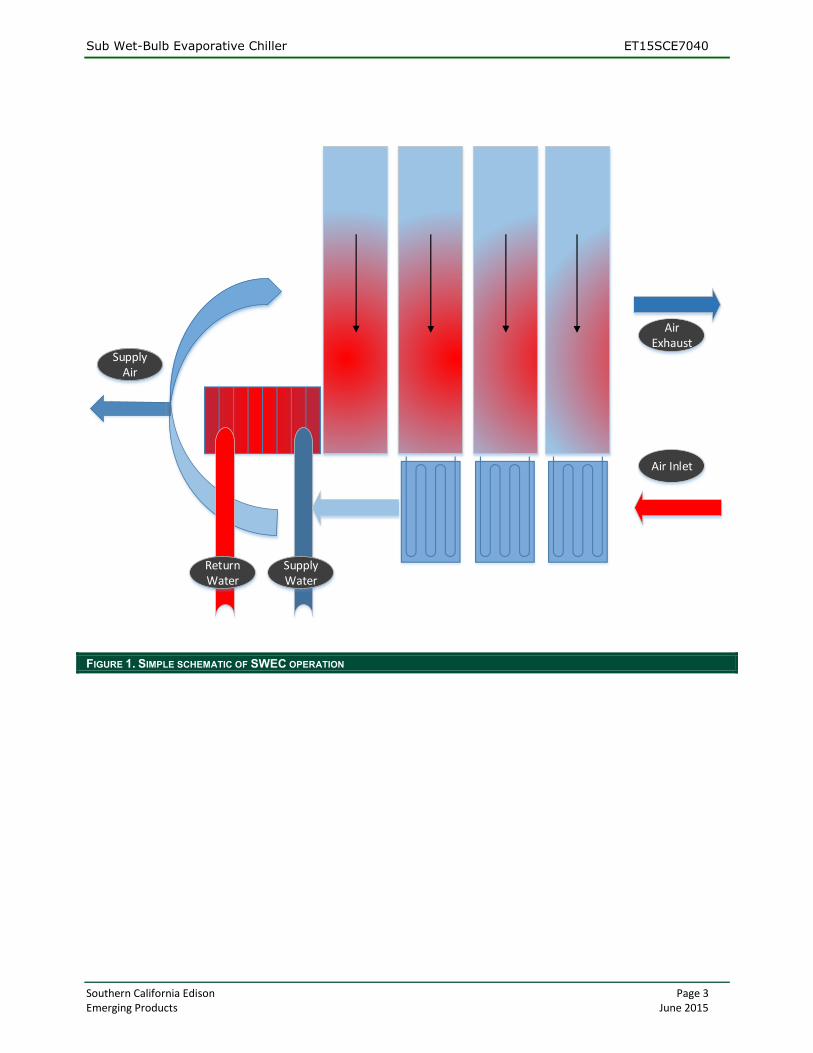
TECHNOLOGY DESCRIPTION The sub wet-bulb SWEC chills water through an evaporative cooling process for use in building
cooling systems Figure 1. Several unique designs exist that are considered chillers, and this
report focuses on one such design. The SWEC cools an outdoor air stream using an indirect
evaporative cooling process. Part of this cooled outdoor air is delivered to the building as
ventilation air; the rest is exhausted as part of the evaporative cooling process, which also
chills a water supply used to cool the building. The ratio of exhaust air to ventilation air is
controlled with a damper. Three water loops consist of an air-to-water heat exchanger and an
evaporative media. One water loop consists of a water-to-water heat exchanger to chill return
water from the building and an evaporative media.
The arrangement of the SWEC is such that the water loops are used to sensibly precool the
incoming air before it is used to evaporatively cool the water. Because the sensible cooling
reduces the wetbulb temperature of the air, the evaporative cooling process can chill air and
water below the ambient wet bulb temperature. The theoretical limit of the supply water
provided by the SWEC is the ambient dew point.
The water loops consist of a pump, an evaporative media, and a coil. Water is pumped to the
evaporative media, where the evaporative process chills the water. The water is then passed
through the coil, where it precools the inlet air, and then returns to the pump. Upon startup,
the process successively cools the water loops, and then the inlet air, until steady state is
reached. The water loops act independently, however there is a pipe that connects all of the
sumps to a water makeup valve. This pipe allows for sump balancing and some mixing takes
place as a result. The chiller has a built-in control system and an interface where the user can
change the fan speed and turn specific pumps on and off.
The SWEC design offers the following potential benefits:
Chilling of supply water to lower temperatures than conventional cooling towers
Cooling efficiencies higher than a conventional mechanical chiller
No introduction of humidity to the building
Ventilation air flow
Sub Wet-Bulb Evaporative Chiller ET15SCE7040
Southern California Edison Page 3 Emerging Products June 2015
Air Inlet
Air Exhaust
Supply Air
Return Water
Supply Water
FIGURE 1. SIMPLE SCHEMATIC OF SWEC OPERATION

Sub Wet-Bulb Evaporative Chiller ET15SCE7040
Southern California Edison Page 4 Emerging Products June 2015
TECHNICAL APPROACH/TEST METHODOLOGY
OVERVIEW The SWEC was manufactured in China and shipped to the laboratory for testing. The unit was
instrumented by WCEC to collect data in order to determine power consumption, water
consumption, cooling capacity, and efficiency for a selection of environmental conditions, and
equipment modes of operation. The test data was collected, analyzed, and reported.
TEST PLAN The SWEC was installed in the WCEC environmental chamber to simulate desired outdoor air
conditions. A load rig designed to supply a controlled water temperature was plumbed to the
return water connection. Measurements for the inlet, ventilation supply, and exhaust air
conditions were recorded with dew point and temperature sensors installed in the chamber.
Measurements of the supply air flow rate were measured using Tracer Gas Measurements.
The test plan was designed to measure the performance of the chiller under varying operating
loads, air, and water conditions.
In order to meet the testing goals the SWEC was tested with varying parameters (Table 1)
including:
Total air flow (1200-3300 CFM)
Ventilation air fraction (0-67%). Most tests were conducted at 33% ventilation air
fraction which was estimated to be the design ventilation air flow rate for a building
served by the SWEC.
Inlet air conditions (varying dry bulb and humidity)
Return water flow rate (9-13 Gallons per Minute (GPM)). Most tests were conducted at
9 GPM which was the design rate for the chiller. One test was completed at 13 GPM in
order to measure the maximum capacity that could be delivered by the chiller with the
available pump.
Return water temperature (64°F to 74°F)

Sub Wet-Bulb Evaporative Chiller ET15SCE7040
Southern California Edison Page 5 Emerging Products June 2015
TABLE 1.SWEC TEST POINTS
TEST
AMBIENT
TEMPERATURES
(°F DB/0F WB) RETURN WATER
TEMPERATURE (°F) AIR FLOW (CFM) WATER FLOW
(GPM)
NOMINAL
VENTILATION AIR
FRACTION
1 90/64 68 1652 9.3 33%
2 90/64 68 3265 12.9 33%
3 90/64 68 2732 9.3 33%
4 90/64 68 1202 9.3 33%
5 90/64 68 1716 9.2 0%
6 90/64 68 1770 9.3 50%
7 90/64 68 1684 9.3 67%
8 90/64 64 1700 9.3 33%
9 90/64 66 1701 9.3 33%
10 90/64 68 1714 9.5 33%
11 90/64 71 1694 9.3 33%
12 105/68.8 68 1660 9.3 33%
13 95/65.7 68 1660 9.3 33%
14 85/62.3 68 1646 9.4 33%
15 75/58.7 68 1613 9.3 33%
16 65/54.8 68 1598 9.4 33%
17 105/73 70 1744 9.2 33%
18 95/70.1 70 1654 9.3 33%
19 85/67.1 70 1638 9.3 33%
20 90/64 68 3309 9.2 0%
21 105/73 74 3315 9.2 0%
TABLE 2. VARIATION OF PARAMETERS
VARIED PARAMETER TESTS
Varied Air Flow; (90/64) Tw = 68, Vent. Air= 33% 1,3,4
Single test, max capacity (max air and water flow) 2
Varied Vent. Air Fraction; (90/64) Tw = 68 5,6,7
Varied Return Water Temp, (90/64), Vent. Air= 33% 1,8,9,10,11
Varied DB, DP = 47, Tw = 68, Vent Air = 33% 12,13,14,15,16
Varied DB, DP = 47, Tw = 70, Vent Air = 33% 17,18,19
Capacity, 0% Vent Air 20,21

Sub Wet-Bulb Evaporative Chiller ET15SCE7040
Southern California Edison Page 6 Emerging Products June 2015
INSTRUMENTATION PLAN In order to simulate a building load, a load rig capable of producing over 5 tons of heating was
connected to the chiller (Figure 2). The temperature of the chiller inlet water was controlled by
means of a proportional, integral, differential controller. The load rig is capable of changing
load by independently changing either temperature or water flow rate. The load cart includes a
Hall effect pulse meter to measure water flow rate and two resistance temperature detectors
(RTDs) to measure temperature that were connected directly to the chiller inlet and outlet. The
four internal water loops of the chiller were instrumented with RTDs to provide additional
information on chiller performance.
The chiller was installed in the environmental chamber, with the exhaust and ventilation supply
air ducted (Figure 3). The total airflow was measured by a calibrated air flow measurement
system using calibrated flow nozzles. The temperature and dew point of the inlet, ventilation
supply, and exhaust air streams were measured with RTDs and chilled mirror dew point
sensors. The exhaust air was ducted outside of the chamber, and the ventilation supply air was
ducted to a second chamber, where one-time air flow measurement was recorded using the
Tracer Gas Air Flow Measurement System. The ventilation supply air was controlled by means
of a manual damper, that was adjusted to allow a certain percentage of the total air to be
diverted for ventilation.
In order to ensure the airflows in the chiller were unaltered by attaching an exhaust duct, a
baseline air flow measurement was obtained for each operating condition to be tested. Two
curves were developed relating the un-ducted pressure drop across the air inlet of the chiller to
the air flow rate. For each test the air flow rate was determined by matching the pressure drop
across the air intake according to the operational mode. The operational parameters which
were varied and could affect air flow were chiller fan speed and ventilation damper position.
The power consumption of the chiller, fan, and cumulative pump power was monitored with
three phase true power meters. One of the four pumps arrived damaged and had to be
replaced. The replacement pump power reading was measured one time and added to the total
power consumption of the chiller. The water consumption was monitored by comparing the
absolute humidity of the inlet and exit air streams. While a water flow meter was installed on
the make-up water line to the chiller, a float valve controlled the make-up water flow and

Sub Wet-Bulb Evaporative Chiller ET15SCE7040
Southern California Edison Page 7 Emerging Products June 2015
introduced significant noise into the makeup water flow signal. Therefore, water consumption
calculated from a change in humidity of the air stream proved to be more reliable.
FIGURE 2. LOAD RIG USED TO PROVIDE BUILDING LOAD TO SWEC
FIGURE 3. SWEC BEING MOVED INTO THE CHAMBER
Sub Wet-Bulb Evaporative Chiller ET15SCE7040
Southern California Edison Page 8 Emerging Products June 2015
T2T4T6T8
T3T5T7
T9 T10
T1
P3P2
CP1
CM1
CM2
CM3
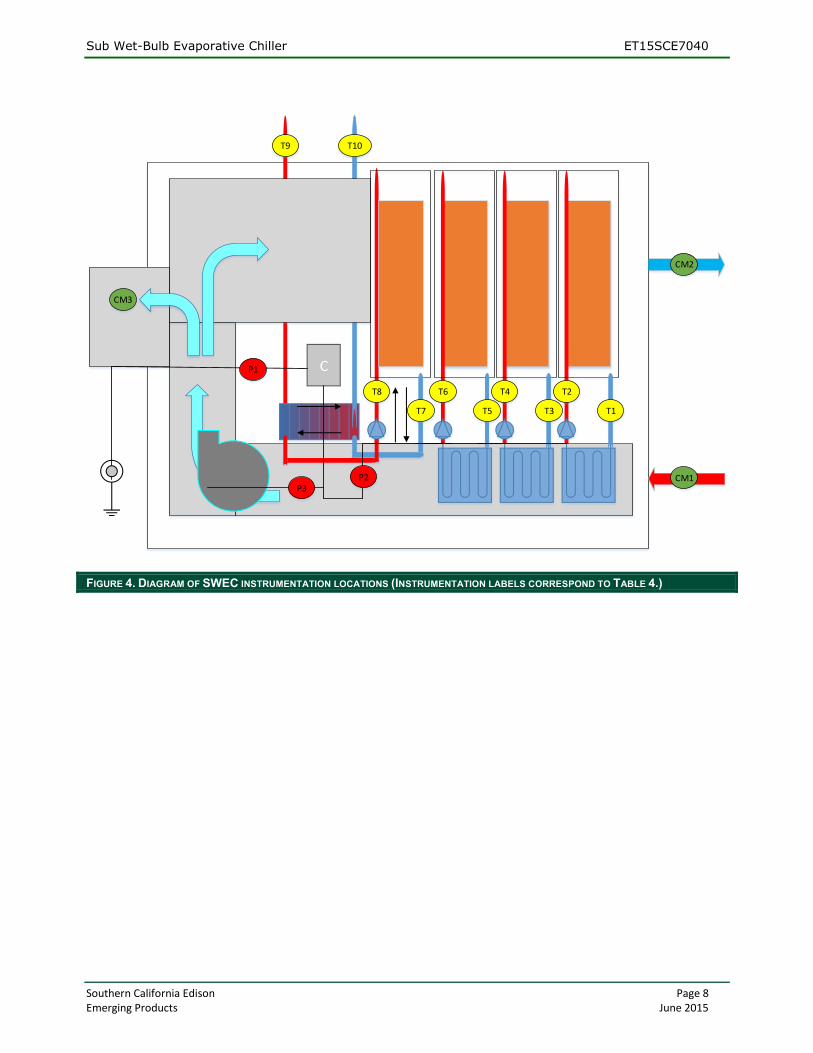
FIGURE 4. DIAGRAM OF SWEC INSTRUMENTATION LOCATIONS (INSTRUMENTATION LABELS CORRESPOND TO TABLE 4.)

Sub Wet-Bulb Evaporative Chiller ET15SCE7040
Southern California Edison Page 9 Emerging Products June 2015
TABLE 3. INSTRUMENTATION MODELS AND ACCURACY
ITEM # MEASUREMENT
TYPE MANUFACTURER
MODEL # TARGET
RANGE ACCURACY CALIBRATION
DATE DAQ
INFORMATION
CM1
Hot Chamber
Inlet Dry Bulb/Dew Point
GE Optisonde
2-1-1-1-1-0-0-0
(65 to 105)/
(45 to 60) (0F)
(+/- 0.26)/
(+/- 0.36) (0F)
03/2012 RS-232
CM2
Hot Chamber
Exit Dry Bulb/Dew Point
GE Optisonde
2-1-1-1-1-0-0-0
(75 to 85)/
(60 to 85) (0F)
(+/- 0.26)/
(+/- 0.36) (0F)
01/2014 RS-232
CM3 Ventilation Air
Dry Bulb/Dew Point
GE Optisonde
2-1-1-1-1-0-0-0
(60 to 85)/
(45 to 60) (°F)
(+/- 0.26)/
(+/- 0.36) (0F)
01/2014 RS-232
T1 Sump 1 Inlet Temperature
Omega RTD-NPT-72-E
60 to 85 (0F)
+/- 0.3 to 0.4 (0F)
NI 9217
T2 Sump 1
Outlet Temperature
Omega RTD-NPT-72-E
60 to 80 (0F)
+/- 0.3 to 0.4 (0F)
NI 9217
T3 Sump 2 Inlet Temperature
Omega RTD-NPT-72-E
60 to 85 (0F)
+/- 0.3 to 0.4 (0F)
NI 9217
T4 Sump 2
Outlet Temperature
Omega RTD-NPT-72-E
60 to 80 (0F)
+/- 0.3 to 0.4 (0F)
NI 9217
T5 Sump 3 Inlet
Temperature
Omega RTD-NPT-
72-E
60 to 75
(0F)
+/- 0.3 to
0.4 (0F) NI 9217
T6 Sump 3 Outlet Temperature
Omega RTD-NPT-72-E
60 to 70 (0F)
+/- 0.3 to 0.35 (0F)
NI 9217
T7 Sump 4 Inlet Temperature
Omega RTD-NPT-72-E
55 to 70 (0F)
+/- 0.3 to 0.35 (0F)
NI 9217
T8
Sump 4
Outlet Temperature
Omega RTD-NPT-72-E
55 to 65 (0F)
+/- 0.3 to 0.35 (0F)
NI 9217
T9 Chiller Inlet Temperature
Omega RTD-NPT-72-E
60 to 75 (0F)
+/- 0.3 to 0.4 (0F)
NI 9217
T10 Chiller Outlet
Temperature
Omega RTD-NPT-
72-E
55 to 70
(0F)
+/- 0.3 to
0.35 (0F) NI 9217
Q1 Load Cart Flow Rate
Omega FTB 4607 9 to 13 (gpm)
+/-1.5% of reading
NI-USB-6009
P1 System Power Dent Power Scout 3+
1000 to 4000 Watts
+/- 1% of reading
RS-485
P2 Pumps 1,3,4 Power
Dent Power Scout 3+
800 to 1000 Watts
+/- 1% of reading
RS-485

Sub Wet-Bulb Evaporative Chiller ET15SCE7040
Southern California Edison Page 10 Emerging Products June 2015
P3 Fan Power Dent Power Scout 3+
300 to 3000 Watts
+/- 1% of reading
RS-485
P4 Pump 2 Power (One Time)
Fluke 1735 65 Watts +/- 1.5% of reading
None
DP1 Air Inlet Differential Pressure
DG 500 0-300 Pa +/-1% of reading
RS-232
DP2 Flow Nozzle
Differential Pressure
Energy
Conservatory APT 8
100-500 (Pa)
+/- 1% of reading
RS-232
WATER TEMPERATURE MEASUREMENTS
Within the chiller, the temperature was measured at the inlet and outlet of each sump at the
locations labeled “Tx” in Figure 4. The RTDs were threaded into adapters which were placed in
the inlet pipes; the taps were made in the return pipes in which the RTDs were threaded
directly. The temperature conditions were used to check the system performance against that
predicted by the chiller designer to ensure the system was operating as intended. The
temperature of the water to the chiller to the inlet and outlet were used to monitor the real-
time capacity of the chiller.
EVAPORATIVE WATER CONSUMPTION MEASUREMENTS
The water consumed by the chiller was measured using the dew point readings from the chilled
mirrors and the measured flow rates of the inlet and exhaust air streams. The chilled mirrors
work by cooling a mirrored surface until the instrument detects the presence of dew which
begins to appear at the dew point. Makeup water was supplied to the chiller by means of a
connection to a tap water source which was controlled via a float valve. The sumps were
internally balanced so that a single float valve acted to fill all four sumps.
DIFFERENTIAL PRESSURE AND AIRFLOW MEASUREMENTS
The differential and static pressures for the environmental chamber were recorded using an
Energy Conservatory APT-8 pressure transducer with eight differential pressure channels. The
device was used to measure differential pressure across the intake air nozzle box and the
static pressure upstream of the nozzles to calculate airflow for the chamber according to
ANSI/ASHRAE 41.2-1987 [2]. The differential pressure across the chiller air inlet was
measured using an Energy Conservatory DG-500.
TRACER GAS MEASUREMENTS
The ventilation supply air flow rate was determined using a tracer gas airflow measurement,
conducted according to ASTM E2029 Standard Test Method for Volumetric and Mass Flow Rate
Measurement in a Duct Using Tracer Gas Dilution (ASTM 2011). This method mixes a
measured mass flow rate of CO2 into the supply air stream then measures the corresponding
Sub Wet-Bulb Evaporative Chiller ET15SCE7040
Southern California Edison Page 11 Emerging Products June 2015
rise in CO2 concentration downstream. The volume flow of air into which the tracer is mixed
can be calculated by the following equation:
EQUATION 1. TRACER GAS EQUATION
�̇�𝐴𝑖𝑟𝑓𝑙𝑜𝑤 = �̇�𝐶𝑂2
𝐶𝐶𝑂2 𝑑𝑜𝑤𝑛𝑠𝑡𝑟𝑒𝑎𝑚 − 𝐶𝐶𝑂2 𝑢𝑝𝑠𝑡𝑟𝑒𝑎𝑚
This method has many advantages compared to conventional air balance techniques, the most
significant of which is accuracy. The tracer gas airflow tools can measure with a calculated
uncertainty of less than ±2%.
The measurement was taken once the test reached steady state, but before any data was
collected. The target airflow rate was obtained by adjusting the damper position according to
the previous tracer gas measurement. Once the target air flow was reached the system was
allowed to reach steady state before beginning the test.
CHAMBER CONDITIONS MEASUREMENTS
During all tests the inlet air, ventilation supply air, and exhaust air were monitored with two
chilled mirror hygrometers. These sensors use an RTD to measure dry bulb temperature and
air from a chilled mirror hygrometer to measure dew point. Wet bulb temperature is then
calculated from the dry bulb temperature and dew point. Data is digitally output via serial
interface every second.
POWER MEASUREMENTS
Measurements for the chiller power, pump power for three pumps, and fan power were
recorded using PowerScout™ 3+ instruments with serial communication using a Modbus®
protocol. The power difference between the component power and the total power is consumed
by the electronics package on the unit. Finally, due to a malfunction of one of the original
pumps, a replacement pump was installed and a one time reading was taken for the power
use. This reading was taken using a Fluke 1735 Power Logger. Since the pump is single speed
and resistance in the water loop is constant, this measured power reading was assumed
constant for the duration of testing and added to the total chiller power consumption.
DATA ACQUISITION SYSTEM
All analog signals were acquired using National Instruments (NI) hardware at 0.3 hertz (Hz) or
greater, and both analog and digital signals were processed through NI software. All signals
were averaged every 30 seconds using LabVIEW software, and logged to a text file.
TEST TOLERANCES For each test all of the test condition parameters including outdoor air dry bulb and wet bulb
temperatures, inlet water temperatures, water flow rate, and air flow rate were controlled to
within the required range (Table 4). The set-point had to stay within the required range

Sub Wet-Bulb Evaporative Chiller ET15SCE7040
Southern California Edison Page 12 Emerging Products June 2015
tolerance for the entire 30-minute test; the last 15 minutes of data were then averaged. The
mean for each test point condition had to fall within the mean tolerance to be considered a
valid test. For example, for a test condition at 90°F outdoor air dry bulb temperature, the
temperature was required to be between 88°F-92°F for the 30-minute test, and the average of
the last 15 minutes had to be between 79.5°F-80.5°F.
TABLE 4.TEST TOLERANCES
TEST CONDITION RANGE TOLERANCE MEAN TOLERANCE
Outdoor Air Dry Bulb Temp ±2°F ±0.5°F
Outdoor Air Wet bulb Temp ±2°F ±0.5°F
Return Water Temp ±2°F ±1.5°F
Water Flow Rate +/-.35 GPM +/-.25 GPM
Air Flow Rate +/-100 CFM +/-30 CFM
DATA ANALYSIS The data was analyzed to calculate the cooling capacity and the coefficient of performance
(COP) of the SWEC. Both metrics are important because they describe the performance of the
unit as well as its efficiency. The uncertainties of the calculation of cooling capacity and COP
are also reported.
CAPACITY
The capacity of the chiller was calculated for each test, where the capacity is the sum of
cooling for both the water and the ventilation air, as described by Equation 2.
EQUATION 2. CAPACITY
𝑞 ̇ = �̇�𝑤𝑎𝑡𝑒𝑟 × 𝑐𝑝,𝑤𝑎𝑡𝑒𝑟 × (𝑇𝑤𝑎𝑡𝑒𝑟,𝑖𝑛 − 𝑇𝑤𝑎𝑡𝑒𝑟,𝑜𝑢𝑡) + 𝑚 ̇ 𝑎𝑖𝑟,𝑣𝑒𝑛𝑡 × 𝑐𝑝,𝑎𝑖𝑟 × (𝑇𝑎𝑖𝑟,𝑖𝑛 − 𝑇𝑎𝑖𝑟,𝑣𝑒𝑛𝑡)
where 𝑞 ̇ is capacity in British Thermal Units (BTU/hr). The subscripts “water” and “air” denote
water and air qualities respectively. The subscript “in” denote the inlet outside air and the
subscript “vent” denotes the supplied ventilation air. T refers to temperatures for either inlet or outlet in °F, 𝑐𝑝 is the specific heat, and �̇� refers to mass flow rate, which is derived from
volumetric flow rate according to Equation 3 and Equation 4.
EQUATION 3. MASS FLOW RATE OF WATER
�̇�𝑤 = 𝑄𝑤𝑎𝑡𝑒𝑟 ∗ 60 ∗ 𝜌𝑤𝑎𝑡𝑒𝑟
Equation 3 shows the derivation for mass flow rate of water used in Equation 2, where Q is
flow rate in gallons per minute, and ρ is density in pounds per gallon. Since Equation 2 is
expressed per hour 60 is used to convert from minutes to hours.
EQUATION 4. MASS FLOW RATE OF AIR
�̇�𝑎𝑖𝑟,𝑣𝑒𝑛𝑡 = 𝑄𝑎𝑖𝑟,𝑣𝑒𝑛𝑡 ∗ 60 ∗ 𝜌𝑎𝑖𝑟,𝑣𝑒𝑛𝑡
Sub Wet-Bulb Evaporative Chiller ET15SCE7040
Southern California Edison Page 13 Emerging Products June 2015
Equation 4 shows the derivation of mass flow rate for ventilation air used in Equation 2. Q
represents air flow in CFM and ρ is air density in pounds per cubic foot at the measured
temperature and pressure. As with Equation 3, the mass flow rate is expressed in pounds per
hour, so a multiplier of 60 is used to convert from minutes to hours.
COEFFICIENT OF PERFORMANCE
The coefficient of performance of the unit was calculated for each test using Equation 5.
EQUATION 5. COEFFICIENT OF PERFORMANCE
𝐶𝑂𝑃 =𝑞 ̇
𝑃𝑡𝑜𝑡𝑎𝑙
where 𝑞 ̇ is the capacity of the SWEC in BTU/hr and 𝑃𝑡𝑜𝑡𝑎𝑙 is the total power consumption of the
chiller power, converted from Watts to BTU/hr.
UNCERTAINTY ANALYSIS
The uncertainty of the capacity, power draw, and coefficient of performance was calculated
using the sequential perturbations method1 which is a widely accepted numerical method in
which a finite difference is used to approximate the sensitivity of the value to the possible error
in its dependent measurements. The method involves first calculating a desired value, Ro, and
perturbing the value one independent variable at a time. First the perturbations are performed
by adding the greatest possible uncertainty to each variable to find Ri+ for each independent
variable. Next, the perturbation is performed by subtracting the uncertainty from each
independent variable to find Ri-. The average perturbation value, δRi, for each independent
variable is found by averaging the absolute difference between Ro and the perturbation values,
Ri+ and Ri-. Finally, using Equation 3, the total uncertainty is calculated for each value.
EQUATION 6. SEQUENTIAL PERTURBATION
UR = ± [∑(δRi2)
L
i=1
]
12⁄

Sub Wet-Bulb Evaporative Chiller ET15SCE7040
Southern California Edison Page 14 Emerging Products June 2015
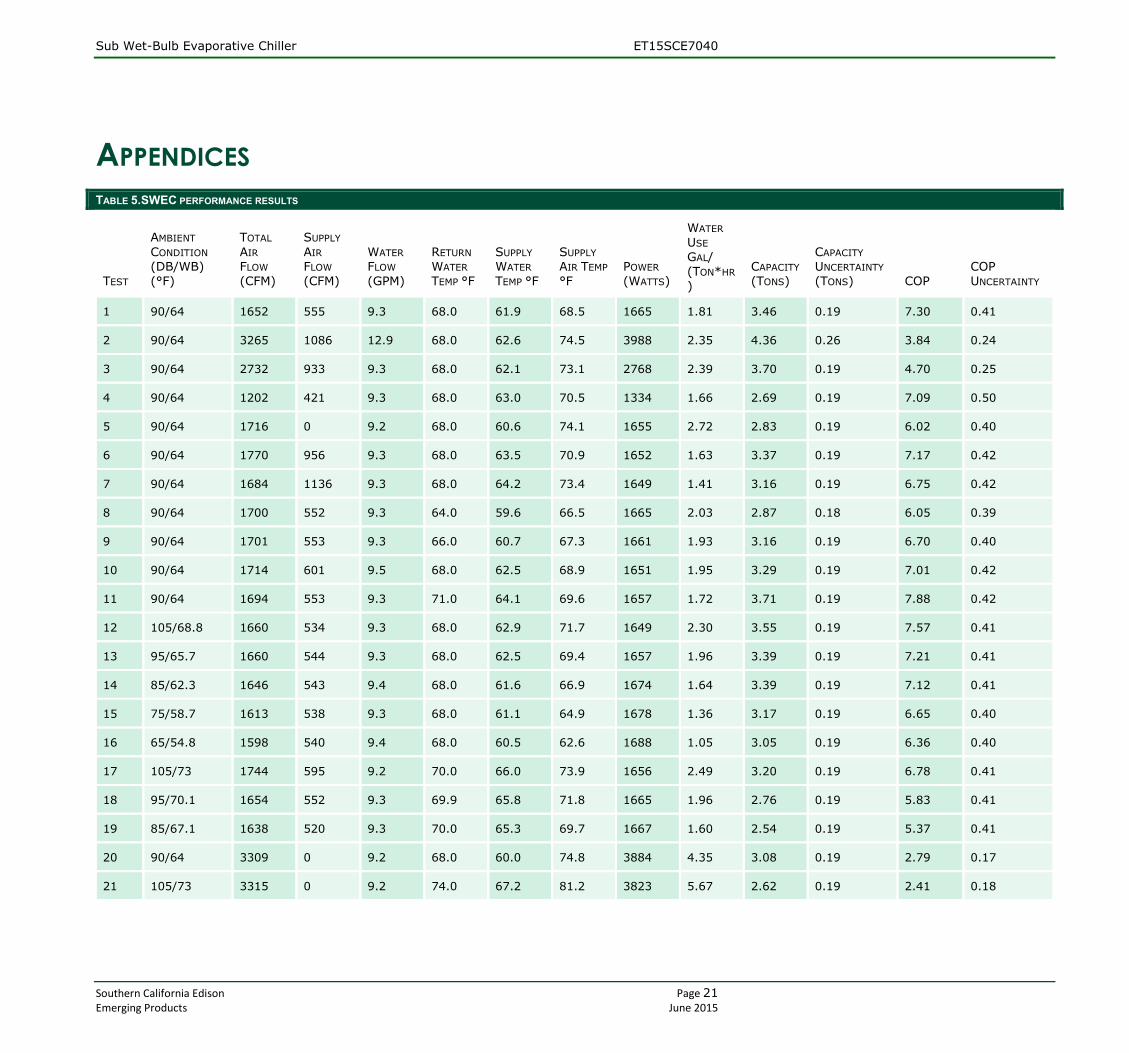
RESULTS Figure 5, Figure 6, and Figure 7 show the effects of varying parameters on the chiller efficiency
and supply temperatures from the chiller. The detailed results of the tests conducted are
tabulated in the Appendix (Table 5).
FIGURE 5.. EFFECTS OF VARYING RETURN WATER TEMPERATURE
Figure 5 shows the effects of varying the return water temperature on the performance of the
chiller. The tests were conducted at constant air inlet properties, 1700 CFM total air flow, and
33% ventilation air fraction. In all cases the chiller supplied water at or below the wet bulb
temperature of the air. The effect of the increased return water temperature is to raise both
the ventilation air temperature air and the supply water temperature. The water use increases
as the return water temperature is increased. The return temperature increase negatively
impacts the supply water temperature the chiller can achieve, however the efficiency the
system increases as the return water temperature increases. The temperature differential
0.0
1.0
2.0
3.0
4.0
5.0
6.0
7.0
8.0
55
57
59
61
63
65
67
69
71
73
75
63 64 65 66 67 68 69 70 71 72
CO
P o
r G
al/(
Ton
*Hr)
Tem
per
atu
re (
°F)
Return Water Temperature (°F)
Supply Air DB (F) Supply Water Temp (F)
COP Water Use (Gal/(Ton*Hr))
Outdoor Air = 90 °F Dry Bulb, 64 °F Wet bulbInlet Air Flow = 1700 CFMSupply Ventilation Air Flow Percentage =
Sub Wet-Bulb Evaporative Chiller ET15SCE7040
Southern California Edison Page 15 Emerging Products June 2015
between the return water temperature and supply water temperatures increases as the return
water temperature increases.
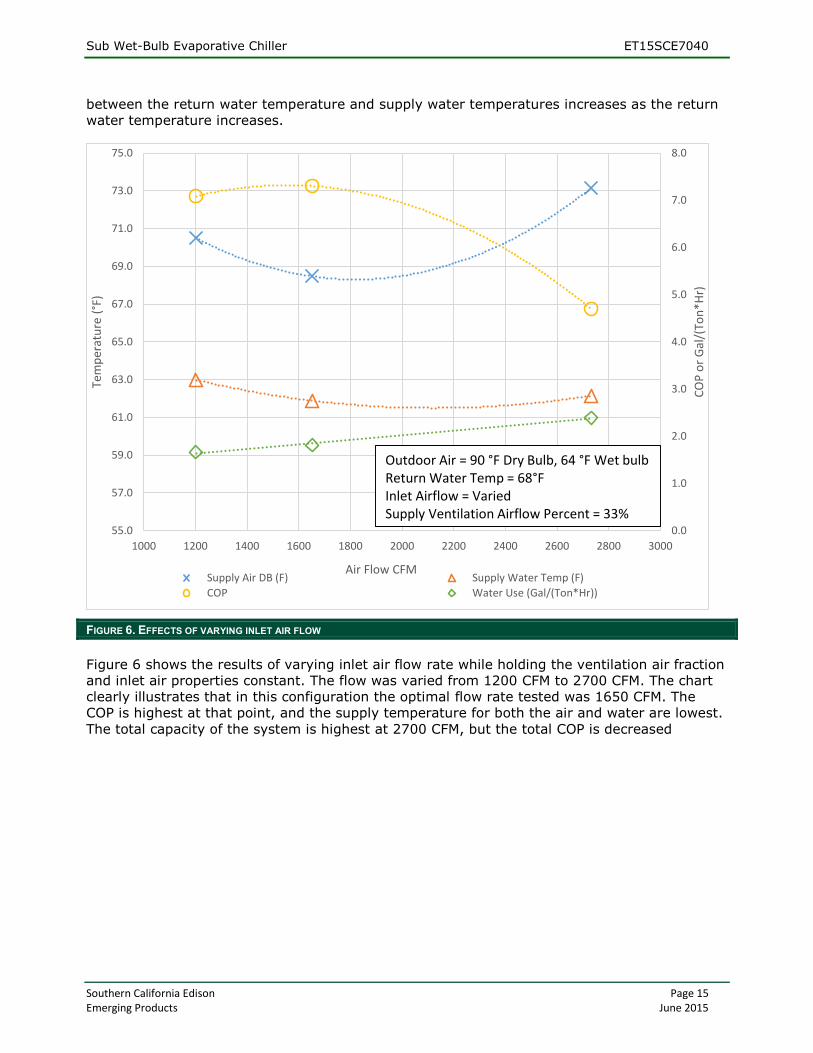
FIGURE 6. EFFECTS OF VARYING INLET AIR FLOW
Figure 6 shows the results of varying inlet air flow rate while holding the ventilation air fraction
and inlet air properties constant. The flow was varied from 1200 CFM to 2700 CFM. The chart
clearly illustrates that in this configuration the optimal flow rate tested was 1650 CFM. The
COP is highest at that point, and the supply temperature for both the air and water are lowest.
The total capacity of the system is highest at 2700 CFM, but the total COP is decreased
0.0
1.0
2.0
3.0
4.0
5.0
6.0
7.0
8.0
55.0
57.0
59.0
61.0
63.0
65.0
67.0
69.0
71.0
73.0
75.0
1000 1200 1400 1600 1800 2000 2200 2400 2600 2800 3000
CO
P o
r G
al/(
Ton
*Hr)
Tem
per
atu
re (
°F)
Air Flow CFMSupply Air DB (F) Supply Water Temp (F)
COP Water Use (Gal/(Ton*Hr))
Outdoor Air = 90 °F Dry Bulb, 64 °F Wet bulbReturn Water Temp = 68°FInlet Airflow = VariedSupply Ventilation Airflow Percent = 33%

Sub Wet-Bulb Evaporative Chiller ET15SCE7040
Southern California Edison Page 16 Emerging Products June 2015
because of the increased fan power. The water use exhibits a clear trend of increasing as the
air flow rate increases.
FIGURE 7. EFFECTS OF VARYING INLET DRY BULB TEMPERATURE
Figure 7 shows the effects of varying ambient dry bulb temperature while keeping the dew
point (46.9°F) and return water temperature (68°F) constant. The results show that the supply
ventilation air temperature is sensitive to the change in ambient dry bulb temperature. The
supply water temperature is less sensitive to the change in dry bulb temperature. Increasing
the outdoor air temperature from 65°F to 105°F increased the supplied water temperature
from 60.5°F to 63°F. However, the supply ventilation air temperature increased from 63°F to
72°F. The chiller COP increases with the ambient dry bulb, however the water use increases
0.0
1.0
2.0
3.0
4.0
5.0
6.0
7.0
8.0
55.0
57.0
59.0
61.0
63.0
65.0
67.0
69.0
71.0
73.0
75.0
60.0 65.0 70.0 75.0 80.0 85.0 90.0 95.0 100.0 105.0 110.0
CO
P o
r G
al/(
Ton
*Hr)
Tem
per
atu
re (
°F)
Inlet Dry Bulb Temperature (°F)
Supply Air DB (F) Supply Water Temp (F)
COP Water Use (Gal/(Ton*Hr))
Outdoor Air = Varied Dry Bulb, Dew Point 46.9°FReturn Water Temp = 68°FInlet Airflow = 1650 CFMSupply Ventilation Airflow Percent = 33%
Sub Wet-Bulb Evaporative Chiller ET15SCE7040
Southern California Edison Page 17 Emerging Products June 2015
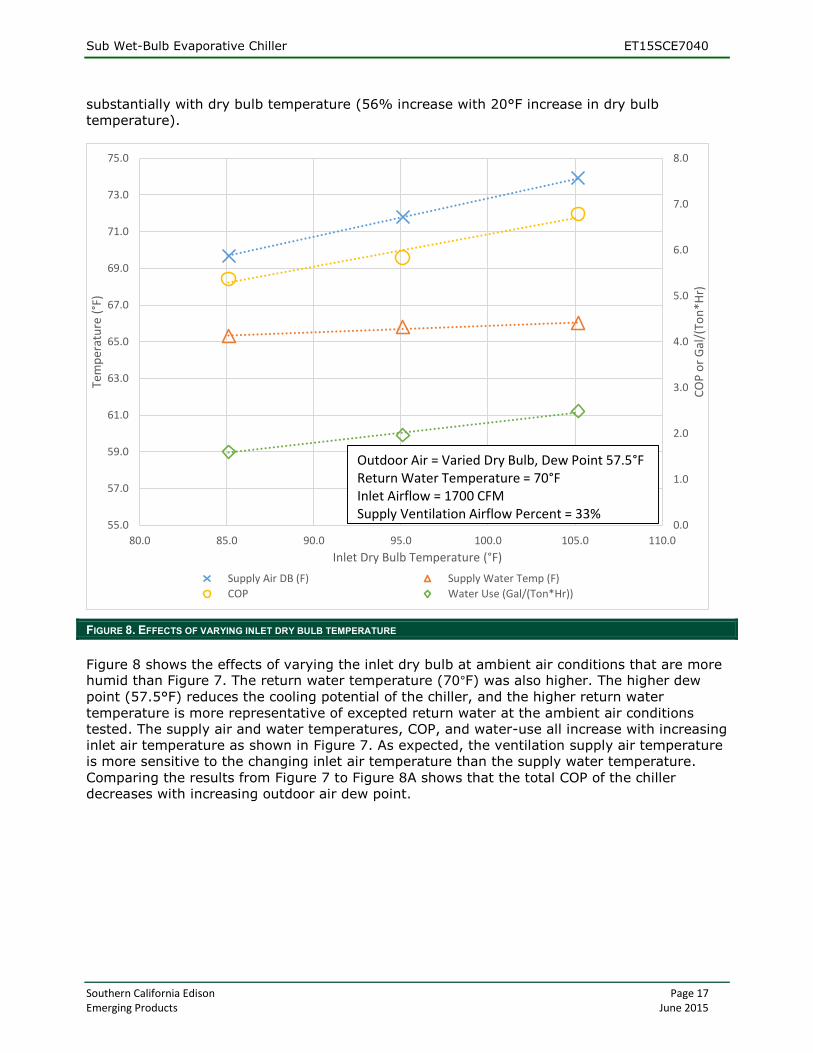
substantially with dry bulb temperature (56% increase with 20°F increase in dry bulb
temperature).
FIGURE 8. EFFECTS OF VARYING INLET DRY BULB TEMPERATURE
Figure 8 shows the effects of varying the inlet dry bulb at ambient air conditions that are more humid than Figure 7. The return water temperature (70°F) was also higher. The higher dew
point (57.5°F) reduces the cooling potential of the chiller, and the higher return water
temperature is more representative of excepted return water at the ambient air conditions
tested. The supply air and water temperatures, COP, and water-use all increase with increasing
inlet air temperature as shown in Figure 7. As expected, the ventilation supply air temperature
is more sensitive to the changing inlet air temperature than the supply water temperature.
Comparing the results from Figure 7 to Figure 8A shows that the total COP of the chiller
decreases with increasing outdoor air dew point.
0.0
1.0
2.0
3.0
4.0
5.0
6.0
7.0
8.0
55.0
57.0
59.0
61.0
63.0
65.0
67.0
69.0
71.0
73.0
75.0
80.0 85.0 90.0 95.0 100.0 105.0 110.0
CO
P o
r G
al/(
Ton
*Hr)
Tem
per
atu
re (
°F)
Inlet Dry Bulb Temperature (°F)
Supply Air DB (F) Supply Water Temp (F)
COP Water Use (Gal/(Ton*Hr))
Outdoor Air = Varied Dry Bulb, Dew Point 57.5°FReturn Water Temperature = 70°FInlet Airflow = 1700 CFMSupply Ventilation Airflow Percent = 33%

Sub Wet-Bulb Evaporative Chiller ET15SCE7040
Southern California Edison Page 18 Emerging Products June 2015
CONCLUSION The performance of the SWEC chiller illustrates a large energy savings potential in hot, dry
climates. The results also reveal that, under a wide range of weather conditions, the SWEC
produced chilled water at temperatures between 60 to 66 degrees, which is desirable for
serving a radiant cooling system.
The SWEC was able to consistently provide cooling loads efficiently, while operating under a
variety of climate conditions. The unit consistently provided anywhere from 2.5 to 4.5 tons of
cooling, with 3-4 tons being consistently typical and average. The variation in COP was seen to
be from 2 to 8, with 6 to 8 being an average and typical value. For comparison, the US
Department of Energy requires commercial packaged air conditioners with a capacity between
5-20 tons of cooling to have a minimum rated energy efficiency ratio of at least 11 at 95°F
outdoor air temperature, which equates to a COP of 3.22 [1]. Therefore, the tested technology
could roughly double the cooling efficiency delivered by standard packaged air conditioning
equipment. The test results showed that the water consumption of the SWEC under normal
operating conditions was 1.0 to 2.5 gallons per ton-hour of cooling delivered.
Current technologies that the SWEC may be able to functionally replace are refrigerant based
chillers, cooling towers, and residential and light commercial air conditioning units, especially
those that currently operate in California’s hot, dry climate zones. The advantage the SWEC
has over these units is the ability to provide most, if not all, the functionality of a refrigerant-
based system, while providing energy savings comparable to a cooling tower. Further, the
SWEC technology can replace a coupled cooling tower/refrigerant unit combination, leading to
lower capital costs, and decreased complexity for energy-conscious consumers. The SWEC
requires no refrigerant or compressors, which reduces complexities associated with
compressors and environmental hazards associated with refrigerants. However, because the
SWEC can only chill water to approximately 60°F (depending on climate), it will not work for
applications that require colder chilled water temperatures.
As with any evaporative cooling unit, there are additional complications associated with
running the SWEC, compared to a standard compressor based system. The main concern is
regular maintenance of the system in order to prevent corrosion or scale deposits. Current
methods to accomplish this include continuous water bleeds to reduce mineral concentration
and replacing the evaporative media every one to three years, depending on the hardness of
the water supply.
Sub Wet-Bulb Evaporative Chiller ET15SCE7040
Southern California Edison Page 19 Emerging Products June 2015
RECOMMENDATIONS The results of the lab evaluation of the SWEC technology show that it has great potential to
reduce energy use by 50% in hot dry climates. Although the technology shows great potential
there are also some significant barriers that need to be overcome. In general, radiant panels
add significant costs to any installation, and don’t have great market penetration. One or
multiple fan coil units can potentially replace a traditional evaporator coil, and also be more
cost-effective than a radiant system.
It is recommended that further research be done in order to determine the cost-effectiveness
of a SWEC when using fan coil units in a residential or multi-family building. The analysis
should determine if a fan coil thermal distribution system can meet the load in a residential
building in California climate zones, or if a small backup chiller would be needed to supplement
the SWEC cooling in some cases. Additional retrofit measures such as duct sealing, insulation,
and envelope sealing can be used to counter-act the reduction in capacity. Because the design
of the SWEC is based on simple off the shelf components, it is expected that large scale
manufacturing of the SWEC can be cost competitive in comparison to compressor-based air
conditioners. The analysis should also determine whether the addition of a thermal storage
system makes economic sense as a peak demand reduction strategy.
In new construction, a radiant cooling installation combined with the SWEC is likely to be cost
competitive with a compressor-based air conditioner with a ducted forced-air system. In China,
the SWEC technology has been installed with radiant cooling systems to cool over one million
square feet of commercial buildings.

Sub Wet-Bulb Evaporative Chiller ET15SCE7040
Southern California Edison Page 20 Emerging Products June 2015
REFERENCES
[1] US Department of Energy, "Small, Large, and Very Large Commercial Package Air Conditioners and Heat Pumps," [Online]. Available: https://www1.eere.energy.gov/buildings/appliance_standards/product.aspx/productid/77#standards. [Accessed 14 10 2015].
[2] ASHRAE, "Standard 41.2-1987 - Standard Methods for Laboratory Air Flow Measurement," ASHRAE, Atlanta, 1987.
Sub Wet-Bulb Evaporative Chiller ET15SCE7040
Southern California Edison Page 21 Emerging Products June 2015
APPENDICES
TABLE 5.SWEC PERFORMANCE RESULTS
TEST
AMBIENT
CONDITION
(DB/WB)
(°F)
TOTAL
AIR
FLOW
(CFM)
SUPPLY
AIR
FLOW
(CFM)
WATER
FLOW
(GPM)
RETURN
WATER
TEMP °F
SUPPLY
WATER
TEMP °F
SUPPLY
AIR TEMP
°F POWER
(WATTS)
WATER
USE
GAL/
(TON*HR
)
CAPACITY
(TONS)
CAPACITY
UNCERTAINTY
(TONS) COP COP
UNCERTAINTY
1 90/64 1652 555 9.3 68.0 61.9 68.5 1665 1.81 3.46 0.19 7.30 0.41
2 90/64 3265 1086 12.9 68.0 62.6 74.5 3988 2.35 4.36 0.26 3.84 0.24
3 90/64 2732 933 9.3 68.0 62.1 73.1 2768 2.39 3.70 0.19 4.70 0.25
4 90/64 1202 421 9.3 68.0 63.0 70.5 1334 1.66 2.69 0.19 7.09 0.50
5 90/64 1716 0 9.2 68.0 60.6 74.1 1655 2.72 2.83 0.19 6.02 0.40
6 90/64 1770 956 9.3 68.0 63.5 70.9 1652 1.63 3.37 0.19 7.17 0.42
7 90/64 1684 1136 9.3 68.0 64.2 73.4 1649 1.41 3.16 0.19 6.75 0.42
8 90/64 1700 552 9.3 64.0 59.6 66.5 1665 2.03 2.87 0.18 6.05 0.39
9 90/64 1701 553 9.3 66.0 60.7 67.3 1661 1.93 3.16 0.19 6.70 0.40
10 90/64 1714 601 9.5 68.0 62.5 68.9 1651 1.95 3.29 0.19 7.01 0.42
11 90/64 1694 553 9.3 71.0 64.1 69.6 1657 1.72 3.71 0.19 7.88 0.42
12 105/68.8 1660 534 9.3 68.0 62.9 71.7 1649 2.30 3.55 0.19 7.57 0.41
13 95/65.7 1660 544 9.3 68.0 62.5 69.4 1657 1.96 3.39 0.19 7.21 0.41
14 85/62.3 1646 543 9.4 68.0 61.6 66.9 1674 1.64 3.39 0.19 7.12 0.41
15 75/58.7 1613 538 9.3 68.0 61.1 64.9 1678 1.36 3.17 0.19 6.65 0.40
16 65/54.8 1598 540 9.4 68.0 60.5 62.6 1688 1.05 3.05 0.19 6.36 0.40
17 105/73 1744 595 9.2 70.0 66.0 73.9 1656 2.49 3.20 0.19 6.78 0.41
18 95/70.1 1654 552 9.3 69.9 65.8 71.8 1665 1.96 2.76 0.19 5.83 0.41
19 85/67.1 1638 520 9.3 70.0 65.3 69.7 1667 1.60 2.54 0.19 5.37 0.41
20 90/64 3309 0 9.2 68.0 60.0 74.8 3884 4.35 3.08 0.19 2.79 0.17
21 105/73 3315 0 9.2 74.0 67.2 81.2 3823 5.67 2.62 0.19 2.41 0.18