Su pport to SMEs - Inc reasing Research and vatio W P...
48
Su 200 pport and Operat Ex pos 07-2013, Fu t to S Inno W tional P st evalua , focusin und (ER CSIL SMEs vatio Deve Work P Program E Cas ation of ng on th DF) and Contract: Sep Su in partner - Inc on in S elopm Pack Poland mme 20 Econom se Stu Cohesio e Europ d the Coh : 2014CE1 ptember 20 ubmitted b rship with reasi SMEs ment kage 2 d 007-201 y udy on Policy ean Reg hesion F 16BAT002 015 by: CSES and ng Re s and 2 13 Inno y progra gional De Fund (CF d ZEW esear SME ovative ammes evelopm F) rch ment
Transcript of Su pport to SMEs - Inc reasing Research and vatio W P...

Su
200
pportand
Operat
Ex pos07-2013,
Fu
t to SInno
W
tional P
st evalua, focusinund (ER
CSIL
SMEs vatioDeve
Work
PProgram
E
Cas
ation of ng on thDF) and
Contract:
Sep
Su in partner
- Incon in Selopm
Pack
Polandmme 20Econom
se Stu
f Cohesioe Europ
d the Coh
: 2014CE1
ptember 20
ubmitted brship with
reasiSMEsment
kage 2
d 007-201y
udy
on Policyean Reghesion F
16BAT002
015
by: CSES and
ng Res and
2
13 Inno
y progragional DeFund (CF
d ZEW
esear SME
ovative
ammes evelopmF)
rch
ment

EUROPEAN COMMISSION
Directorate-General for Regional and Urban Policy Directorate B - Policy Unit B.2 Evaluation and European Semester
Contact: Marielle Riché E-mail: [email protected]
European Commission B-1049 Brussels

Operattional P
PoProgram
E
Sep
olanmme 20Econom
ptember – 2
nd 007-20
my
2015
13 Innoovativee

4
This report is part of a study carried out by a Team selected by the Evaluation Unit, DG Regional and Urban Policy, European Commission, through a call for tenders by open procedure No 2014CE16BAT002. The consortium selected comprises CSIL – Centre for Industrial Studies (lead partner, Italy), CSES – Centre for Strategy & Evaluation Services (UK) and ZEW – Centre for European Economic Research (Germany). Subcontracted companies are: CASE – Center for Social and Economic Research (Poland), INFYDE – Informatión y Desarrollo S.L. (Spain), Visionary Analytics (Lithuania) and WIFO – ÖsterreichischesInstitutfürWirtschaftsforschung (Austria). The Core Team comprises: Scientific Director: Massimo Florio, CSIL and University of Milan; Project Manager: Julie Pellegrin, CSIL; Advisory Committee: Brad Graeme Philip Astbury (University of Melburne), Harvey
Armstrong (University of Sheffield), David Audretsch (Indiana University), Mateja Dermastia (Anteja ECG) and Robert Picciotto (Kings College)
Senior experts: Laura Delponte (CSIL), Georg Licht (ZEW), James Rampton (CSES) and Davide Sirtori (CSIL)
Task managers: Silvia Vignetti (CSIL), Mike Coye (CSES), Emanuela Sirtori (CSIL), Mark Whittle (CSES), Julie Pellegrin (CSIL)
Statistical Experts: Donatella Cheri (CSIL), Stefania Pelizzari (CSIL) and Silvia Salini (CSIL and University of Milan)
Junior Experts: Chiara Pancotti (CSIL) Quality manager: Paola Govoni (CSIL). A network of Country Experts provides the geographical coverage for the field analysis. The authors of this report are Elena Jarocinska (CASE) and Jan Teresiński (CASE). Authors are grateful to all the programme managers, stakeholders and beneficiaries who provided data, information and opinions during the field work. The authors are grateful for the very helpful insights from the EC staff and particularly to Veronica Gaffey, Marielle Riché and other members of the Steering Group. They also express their gratitude to all stakeholders who agreed to respond to the team’s questions and contributed to the realisation of the case study. The authors are responsible for any remaining errors or omissions. Quotation is authorised as long as the source is acknowledged along with the fact that the results are provisional.

5
Table of Contents
LIST OF ABBREVIATIONS ................................................................................... 6
1. EXECUTIVE SUMMARY .................................................................................. 7
1.1. The objective and methodology .................................................................. 7 1.2. Context .................................................................................................. 7 1.3. Programme intervention logic .................................................................... 7 1.4. The main findings of the case study are: ..................................................... 8 1.5. Conclusions and lessons learned ................................................................. 9
2. CONTEXT AND BACKGROUND ..................................................................... 11
2.1. Socio economic context ........................................................................... 11 2.2. Regional industrial fabric and SMEs ........................................................... 13
3. ERDF STRATEGY ON SMES .......................................................................... 17
3.1. Objectives and priorities .......................................................................... 17 3.2. Synergies with other OPs ........................................................................ 19 3.3. Policy mix ............................................................................................. 19 3.4. Intervention logic ................................................................................... 22 3.5. Implementation and reprogramming ......................................................... 26
4. EVIDENCE ON ACHIEVEMENTS ................................................................... 30
4.1. Measuring achievements ......................................................................... 30 4.2. Characteristics of the assisted SMEs .......................................................... 31 4.3. Achievements ........................................................................................ 32 4.4. Mechanisms and conditions ...................................................................... 37
5. MAIN FINDINGS AND CONCLUSIONS ......................................................... 40
ANNEX .............................................................................................................. 41
REFERENCES ..................................................................................................... 44
LIST OF INTERVIEWEES ................................................................................... 47

6
LIST OF ABBREVIATIONS
AIR Annual Implementation Report ERDF European Regional development Fund ESF European Social Fund EU27 European Union 27 GDP Gross Domestic Product ICT Information and Communication Technology MA Managing Authority NOP National Operational Programme OP Operational Programme PPP Purchasing Power Parity R&D Research and Development RDI Research development and Innovation ROP Regional Operational Programme SBA Small Business Act for Europe SMEs Small Medium Enterprises

7
1. EXECUTIVE SUMMARY
1.1. The objective and methodology
The objective of this case study is to perform an ex-post evaluation of the policy instruments implemented by the Operational Programme ERDF Innovative Economy 2007-2013 addressed to SME innovation and growth. The scope of the analysis is 26 policy instruments that are specifically targeted at SMEs.
Following the realist approach of theory-based impact evaluation1, this case study, first, analyses the intervention logic of the implemented strategy by identifying the barriers and specific instruments that tackle those barriers and, second, discusses the main achievements and the mechanisms that facilitate or hamper them. The data comes from the monitoring system provided by the Managing Authorities, Polish Central Statistical Office, strategic and programming documents, annual implementation reports, evaluation studies and other literature, complemented by 27 face-to-face interviews with broad range of actors carried out during the period of March-April, 2015.
1.2. Context
Since Poland joined the European Union in 2004, it has been successfully catching up with the ‘old’ EU member countries. The Polish economy has been converging to EU-15, being the only EU economy that avoided a recession in 2008-2010. The economic crisis in Europe did not dampen the ongoing convergence. The country has benefited from low labour costs that stem from the low starting wages of a catching up economy and product specialisation that is biased towards low- or medium-low-technology goods.
However, in terms of innovation and R&D, Poland lags behind the Czech Republic and Hungary – its two closest regional peers. Expenditure in R&D increased over the recent decade, but remains low when compared to the EU average. The share of private sector which is known to have higher returns than public sector in R&D spending is particularly low. Moreover, R&D expenditures are concentrated in a few regions in Poland, including Mazowia (where the capital city Warsaw is located), Malopolska and Wielkopolska.
Concerning innovation, SMEs in Poland are less inclined than their EU peers to collaborate with each other; to innovate in-house; and to introduce any type of innovation, either for products and processes or marketing and organisational. They also perform less well in turning new products or processes into sales revenues.
Another weakness is related to low rankings of Polish universities and public research. Many university programmes do not meet demands of the industry, professors are underpaid and the research is mainly published in Polish, thus it does not get read or used abroad. In addition, industry has weak links with research institutions that do not translate into investments and joint projects.
1.3. Programme intervention logic
Against this background, OP Innovative Economy is the most extensive public scheme in Poland tailored to support innovation, with over EUR 5 billion allocated for SMEs. OP Innovative Economy aims at innovation-based growth through investing in innovative products and processes, facilitating technology transfer, stimulating the business environment, revamping the ICT infrastructure and improving cooperation between academia and the private sector. The majority of policy instruments in the OP Innovative Economy are targeted only or particularly on SMEs.
The analysis of the OP policy mix suggests that that there were too many policy instruments. As a result, the support was dispersed among these instruments instead of focusing on support for innovation and R&D. The largest interventions in terms of the allocation were investments with high innovative potential and support to investment of
1 For details of the applied methodology see the Inception Report and the First Intermediate report.

8
great significance to the economy. From the disaggregated analysis on the firm level it appears that policy instruments for innovation were mainly spent on capital investment for technological absorption.
To ensure additionality of ERDF2, all projects required co-financing by SMEs. R&D projects included cooperation between research entities and enterprises with an objective of commercialization and implementation of R&D results, as well as grants for R&D equipment and laboratories in firms and support to intellectual property right protection. Only limited amount of the OP was spent on equity-based financial instruments. To a smaller degree, OP supported cooperation among Polish SMEs through technology parks, clusters and innovation centres. Finally, OP facilitated exports by providing advice and legal services necessary to enter foreign markets and grants for business missions and participation in trade fairs.
In terms of mode of delivery, grants were by far the most common form. It seems that the wide use of grants is unjustified in the case of capital investment grants and projects in their later stages of innovation process. Grants should have been complemented by loans, given that these types of projects have stable and predictable cash that facilitates loan repayment.
1.4. The main findings of the case study are:
In the period 2007-2015 OP Innovative Economy supported approximately 13 thousand SMEs, representing around 1 percent of the total SMEs in Poland. More than half of all agreements were signed with micro enterprises, 28 percent with small enterprises and over 20 percent with medium enterprises.
The beneficiaries of the OP operate in different sectors and are located across the whole country.
In terms of technological intensity of OP beneficiaries, it is important to distinguish between industry and services. In industry, 63 percent of firms operate in low and medium-low technology sectors. The industries in this group include manufacturers of rubber and plastics products, wood and paper products, furniture, food and beverages, and textiles. On the other hand, more than 50 percent of beneficiaries in services operate in high-tech knowledge intensive services. These services included primarily computer programming, consultancy, information service activities, as well as telecommunications and scientific R&D.
There is some evidence suggesting that the ERDF support has had a positive impact on innovation and R&D in Poland. One evaluation study finds that more than half of recent growth in R&D expenditure as a share of GDP is driven by structural funds. It also finds that the recent increase in the share of high-tech products in Polish exports is driven mainly by the ERDF funds. However, we stress that this evidence is limited (i.e. based on one evaluation study) and should be confirmed by other studies.
Evidence on innovation from the monitoring system is scarce. In particular, no summary indicator on innovation is available from the monitoring system. For example, an indicator on the number of firms that implemented innovation is only available for one priority axis.
The introduced innovations were mainly product and process innovations, while the beneficiaries were mainly medium-size firms characterized by a well-established market position, with no concentration on particular sectors. According to the declarations of beneficiaries, one third of innovations were new to the world.
It appears that OP also enhanced R&D activities in SMEs. 42 percent of OP beneficiaries that did not performed R&D activities before the OP claim that engaging in R&D is a direct consequence of the OP intervention. When implementing results of R&D, firms additionally mobilized EUR 240 million, which
2 Co-financing is required by all OPs supporting SMEs.
9
accounts for approximately 4% in total expenditure of Polish firms on R&D3. This indicator is probably underestimates the total private spending on R&D because it only represents one policy measure of OP4.
OP fails to achieve the expected employment effects. An expected 7 thousand of new jobs in SMEs by the end of 2015 is far below the targets of the monitoring system. Nevertheless, beneficiaries of the OP seem to be more positive about the employment effects, claiming that the average employment is growing.
The mechanisms and conditions that facilitated or hampered the above achievements in Polish SMEs included reorientation in their business models towards innovation, the project selection criteria, bureaucracy, network effects and the quality of business support institutions. It seems that achievements in innovation were fostered by a behavioural change in firms-beneficiaries. Interviews suggest that many beneficiaries are now competing through innovation, instead of competing based on low costs. A group of innovation leaders has emerged who are not afraid to build up their competitive advantage on innovation. To ensure that the projects were able to provoke anticipated changes in the beneficiary SMEs it was necessary to set the relevant criteria for project evaluation and choose the right experts for their assessment. Bureaucracy related to the OP implementation is considered by beneficiaries as an important obstacle to obtain the support. Cooperative relations and cluster cooperation proven to be crucial for knowledge diffusion, but still Polish SMEs lack much social capital. Finally, business support institutions despite significant investments in their infrastructure and capacity offered services that were simple, supply-driven and not based on the needs of SMEs.
1.5. Conclusions and lessons learned
The case study of OP Innovative Economy provides interesting lessons for the policy makers on the role of ERDF in the support of SMEs.
First, the analysis of the OP policy mix shows that OP Innovative Economy is a step forward when compared to the OP Improvement of the Competitiveness of Enterprises in the previous financial framework (2004-2006) in that is it is more focused on innovation. Examples of successful policy instruments to support innovation include technological credit (N 11) and investments with high innovative potential (N 12). However, some experts5 have criticised the OP policy instruments for innovation in that they were mainly spent on capital investment for technological absorption. In our view, importing innovations from abroad was an efficient strategy for Poland given its current stage of development. In particular, the adoption of existing technologies by firms is a direct reflection of the fact that there is still substantial scope for catching up with the global technological frontier.
Second, the implementing bodies, and in particular PARP played an important role in projects implementation. Besides setting the criteria for project evaluation, they were responsible for organizing the assessment of projects to be financed by the OP, signing the agreements with the beneficiaries, managing funds, monitoring the realization of the OP, carrying out the evaluations, as well as communication and promotion of the OP among the potential beneficiaries. However, their risk aversion and bureaucratic procedures limited the effectiveness of the public intervention.
Third, in many cases the available evidence is very scarce and not systematic. The monitoring system does not produce a summary indicator on innovation and is biased to output indicators (e.g. number of projects). It should be also completed with additional indicators e.g. the returns from implemented innovation. Moreover, many evaluation studies lack rigorous methodology and do not include control groups, which means that they are unable to assess the actual additionality of each public zloty spent
3 Own calculations, based on GUS, accessed at http://strateg.stat.gov.pl/Home/Strateg. 4 Again, no common indicator is available. 5 See e.g. World Bank report (2013).

10
Finally, ERDF supported industrial firms that operate in low and medium-low technology sectors. In our view, supporting low-tech sectors is an efficient strategy given that it brings productivity gains. Our view is based on the evidence from the recent EBRD report (2014) showing that for countries still far removed from the technological frontier introducing innovation in low-tech sectors might actually yield the highest returns in terms of productivity gains. This is because firms in these countries manage to increase labour productivity by absorbing and benefiting from technologies developed elsewhere. Therefore, even though high-tech industries are the main growth drivers in developed economies, support for low-tech industries brings about more significant changes for the economies such as Poland.

2. CON
2.1. S
This seEconom
Figure
Since Pwith theGDP pe28 averEU-28 a
Figure
Source: o
The ecothe onlyhas slow(0.1 pesupport0.4 to 0
6 See e.g
NTEXT AN
Socio econo
ection briemy operates
1. Loc
Poland joinee ‘old’ EU
er capita, brage (See Faverage.
2. Poli
own elaboratio
onomic crisy EU econowed down tercent). Stted the eco0.8 percent
. Gorzelak an
ND BACKG
omic conte
efly describs.
ation of P
ed the Eurmember coased on puFigure 2). I
ish GDP pe
on on Eurosta
sis in Europomy that ato 1.6 perctudies showonomy in tht a year6.
d Kozak (201
GROUND
ext
bes the so
oland
ropean Uniountries. Asurchasing pIn 2013 GD
er capita i
t data
pe did not davoided a rcent in Polaw that larhe crisis yea
0).
11
ocio-econo
on in 2004s a result opower partyDP per capit
in PPP in 2
dampen therecession innd, but wa
rge cash tars and hav
mic conte
4, it has bof strong ey (PPP) hasta in PPP am
2004-2013
e ongoing cn 2008-201s still higheransfers frve increase
xt in whic
een succes
economic pes been convmounted to
3
convergenc10. In 2013er than therom the Eed GDP gro
ch OP Inn
ssfully catcerformanceverging to o 67 percen
ce. Poland 3 GDP growe average inEU cohesionwth on ave
novative
ching up e, Polish the EU-nt of the
remains wth rate n the EU n policy erage by

Over thAccordi2013 aswages towardsincome
Labour order taverageEU17 av
In termactivitielow wheThe cloR&D (1aiming
Figure
Source: o
Poland which ipanel). 2013 acof publi51 perexpendcapital employ(correspEurosta
As a rePolish Poland 2015).
In termlower eprogramresearcstudentwith tergraduatOECD,
he recent yng to Euros comparedof a catch
s low- or ladder, cos
productivitto catch upe labour prverage.
ms of spendes increaseen compare
osest region1.9 percentat increasin
3. R&Dsele201
own elaboratio
is also chas known to Private seccording toic sector inrcent in Pitures are city Wars
ed in R&pondingly, at).
esult of lowcompanies has a poo
ms of rankiend of the mmes do nch is mainlyts of seconrtiary qualites in scien2014).
years the Postat, averad to EUR 24hing up ecmedium-lo
st competit
ty has imprp with moroductivity
ding on R&d over theed to the Enal peers, t and 1.4 ng R&D spe
D expendiected CEE 13 (right p
on, based on
aracterised o have hig
ector expeno Eurostat a total R&D oland as concentratesaw is loc&D activitie 0.5 percen
w public an and rese
or 2015 In
ings of unmid-range not meet dy publisheddary level fications, a
nce and eng
Polish econage labour 4.6 in the Economy anow-technolotiveness wi
roved over re advanceper hour w
&D Poland le recent deEU-19 averaCzech Reppercent) in
ending up t
iture as p countries
panel)
Eurostat data
by a smalgher returnnditures on as compare expenditurcompared ed in a fewcated), Maes in Polnt and 1.1
d private Rarch institnovation U
iversities aof OECD c
demands ofd in Polish,rank well i
adults’ techgineering a
12
omy has la costs in P
EU-28. Low nd Poland’sogy goodsll deteriora
r the recented EU cou
worked (in P
lags behindcade to 0.9age of 2 peublic and Hn the samto 1.7 perce
percentages, in 2002-
ler share ons than pub R&D amoed to 1.3 pre in Polandto 33 pe
w regions inalopolska aland is a percent of
R&D expentutions to Union Score
and internacountries (Sf the indus, thus it doin Pisa sco
hnical problare far belo
argely benePoland amo labour coss product s. Howeverte in the fu
t years subntries. AccPPS) accou
d it regiona9 percent oercent of GHungary sp
me year. Poent by 202
e of GDP -2013 (lef
of private sblic R&D spunted to a percent for d is substaercent in n Poland, inand Wielkolso lower f the labou
nditure as wtranslate
eboard ran
ational pubSee Figure stry, profesoes not getres and in em-solving
ow the OEC
efited fromounted to Ests stem frospecialisatir, as Polanuture.
bstantially, cording to nted to aro
al peers. Exof GDP in 2DP (See Figpent about olish nation0.
in the Euft panel) a
sector in topending (S mere 0.4 the Euro antially highthe EU-28ncluding Mopolska. N
than ther force in 2
well as theinvestmentking (25 o
lications, P4, b and cssors are ut read or u science (Fg skills, andCD median
m low labouEUR 8 per om the low ion that isnd moves
but not enEurostat,
ound 40 pe
xpenditure2013, but gure 3, left twice as mnal authori
uro area-and by sec
otal R&D spSee Figure percent ofarea-19. Thher than in 8. Moreoveazowia (wh
Number of e EU-28 2012, acco
e weak capts into innout of 29,
Poland fallsc). Many ununderpaid used abroadFigure 4, v)d the share (Figure 4,
ur costs. hour in starting s biased
up the
nough in in 2012
ercent of
in R&D remains t panel). much on ties are
19 and ctors in
pending, 3, right
f GDP in he share the EU: er, R&D here the people average rding to
pacity of novation see EC,
s at the niversity and the d. While ), adults e of PhD t, u, w;
13
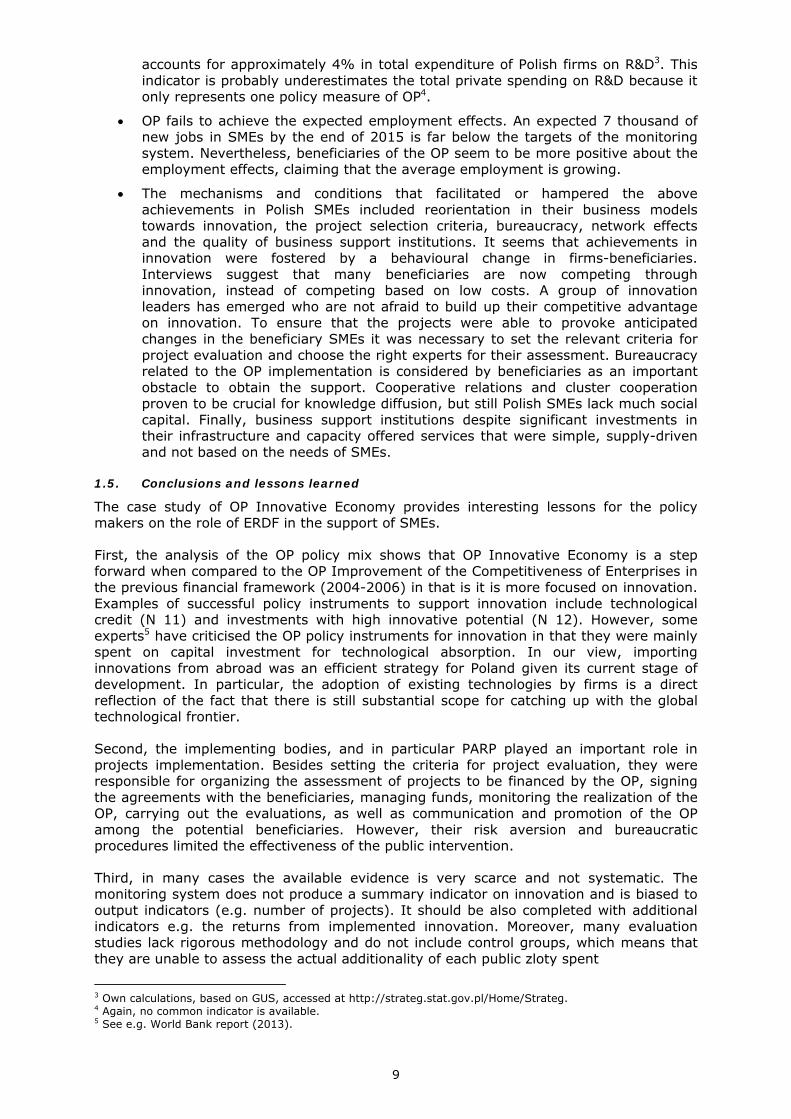
Figure 4. Comparative performance of national university and research system, 2014
Source: OECD Science, Technology and Industry Outlook 2014.
To sum up, Poland demonstrated sound performance in terms of economic growth over the recent decade, but needs more productive investment in innovation and improvement in public research to maintain growth in the future.
2.2. Regional industrial fabric and SMEs
This section addresses the main features important for understanding SME performance.
Over the last decade Poland has successfully upgraded its industry by adopting advanced technology, acquiring modern machinery and attracting foreign direct investment. The share of industry in gross value added amounted to 25 percent in Poland over the studied period, which is higher than the EU-28 average of 18 percent (Central Statistical Office (GUS) and Eurostat). However, Polish product specialisation is still biased towards low- or medium-low-technology goods. In manufacturing exports “low-tech” sector accounted to 25 percent of total exports in 2009, a much larger share when compared to its regional peers (14 percent in the Czech Republic and 11 percent in Hungary)7. Main exported products include: machinery and equipment, textiles, metals and metal products, chemicals.
The number of SMEs in Poland — in terms of its share of the total number of firms — does not differ significantly from the EU average, but the Polish SME sector has comparatively more micro enterprises and fewer small and medium companies (SBA factsheet for Poland, 2014). In 2013 there were around 1.8 million small and medium enterprises (SMEs) in Poland8. The majority of enterprises (95%) were micro-enterprises with 0-9 employees; 3% were small enterprises with 10-49 employees and less than 1% were medium enterprises with 50-249 employees (See Figure 5).
7 See OECD Economic Surveys: Poland 2010. 8 According to GUS data.

14
Figure 5. Number of enterprises by size and year in Poland, in thousand
Source: Own elaboration based on the data from GUS.
5.9 million people were employed by SMEs in Poland, with large shares employed in manufacturing and trade. Although the share of employees in Polish SMEs is slightly higher than the EU average, the value added that is generated is significantly below (according to GUS and Eurostat, Polish SMEs generated 50.9 of the total value added in 2012, UE27 – 57.9 percent). This suggests a somewhat lower productivity, but also a concentration of Polish micro enterprises in low value-added sectors (SBA factsheet for Poland, 2014). Micro enterprises generate just 15% of value-added while small and medium size companies generated 15% and 21% respectively of value added (SBA factsheet for Poland, 2014).
Polish SMEs are under-performing in R&D and innovation when compared to the EU-average. Concerning innovation, according to Innovation Union Scoreboard9, SMEs in Poland are less inclined than their EU peers to collaborate with each other; to innovate in-house; and to introduce any type of innovation, either for products and processes or marketing and organisational (See Figure 6). They also perform less well in turning new products or processes into sales revenues (2010: Poland: 4 %, EU: 9 %, EC 2013). In addition, Polish SMEs underperform their European peers in developing skills as only 22 percent of Polish firms train their employees versus the average of 66 percent in the EU (SBA factsheet for Poland, 2014).
Polish firms spend mostly on technology absorption through fixed capital investment. The share of non-R&D innovation expenditure is much higher than EU average share (See Figure 6). The share of expenditure on R&D in total expenditure of industrial firms is low but has been growing recently from 9 percent in 2006 to 19 percent in 201310. It seems that Polish firms are starting to realise the importance of R&D and innovation in spite of perceived technological and business risks. The most innovative sectors are considered to be automotive and aviation industries (Cieslik, 2014). Also, chemical, plastics and furniture industries spend more on innovation. Firms in these sectors often supply products for large concerns so the market puts pressure on them to innovate.
Polish SMEs in services sector also lags behind the EU-average in technological intensity. According to the European Commission Small Business Act for Europe (EC, 2013), only one in five of all service SMEs are knowledge-intensive in Poland (EU: 28%) providing just 18% of all services jobs (EU: 25%) and 23 percent of total value added in services (EU: 32%).
9 EC (2015). 10 According to GUS.
1500
1550
1600
1650
1700
1750
1800
1850
2004 2005 2006 2007 2008 2009 2010 2011 2012
Total Micro (0‐9)

Figure
Source: O
The ecoaverageproblemterms osupport
Figure
Source: o
In the reflecte
6. Innov
Own elaborati
onomic crise Europeams with expof value adt services s
7. WorPola
own elaboratio
area of eed in the in
ation Unio
on based on I
sis had a nn firm. Byports, and dded, SMEssector and c
rld Bank and and se
on on World B
ntrepreneuncrease in
on Scorebo
Innovation Un
negative imy 2013 Soverall unc
s have still constructio
overall coelected co
Bank’s ease of
rship Polanthe rank o
15
oard 2015
nion Scoreboa
mpact on PoMEs expercertainty in not reachn showing
ountry raountries
f doing busine
nd has beof the World
5, Poland
rd 2015.
olish SMEs,rienced den the busined their prthe largest
ank and r
ess index data
en improvd Bank’s e
, though leecline in dess climatere-2009 lev decline (E
anks in s
ing its regase of doin
ess severe domestic de (PARP, 20vels, with bC, 2013).
specific a
gulations, wng busines
than on demand, 013). In business
reas in
which is s index.

16
Currently, Poland ranks 32 ahead it regional peers, Hungary and the Czech Republic (see Figure 7)11. However in some areas e.g. starting a business and dealing with construction permits Poland has a very low rank (85 and 137, correspondingly).
Overall, in spite of a successful upgrade of the industry, product specialisation of Polish SMEs is still biased towards low- or medium-low-technology goods coupled with under-performing in innovation. On the positive side, we observe an increase in the share of R&D in investment expenditure and the improved business regulations.
11 A higher rank means the regulatory environment is more conducive to the starting and operation of a local firm.

17
3. ERDF STRATEGY ON SMES
The aim of this section is, first, to present the strategy and priorities of the OP, second, to show its synergies with other OPs, third, to describe the policy mix resulting from the strategy and goals of the OP, fourth, to discuss the intervention logic of specific instruments and, finally, to describe the process of translating these issues into mechanisms and actions related to the OP instruments’ implementation12.
3.1. Objectives and priorities
The strategy of the OP Innovative Economy is based on the Lisbon Strategy that focuses on growth and jobs, but also respects sustainable development goals13. The OP fits also into the Strategy Europe 202014, especially in terms of the knowledge-based economy. According to the description of the OP15, more than 90% of total OP spending is devoted to R&D, innovation and ICT.
The main goal of the OP is growth of the Polish economy based on innovative firms. This objective is based on the need to increase competitiveness of the Polish economy grounded on knowledge and innovativeness. As indicated in Section 2.2 above, Polish enterprises and SMEs are less knowledge-intensive than their European peers and base their competitiveness on low costs rather than advantages that stem from innovation. Polish firms need to change the way they compete on the market in order to enhance competitiveness of the Polish economy, hence the goal.
The main goal is achieved through a comprehensive set of actions supporting socio-economic development of Poland, especially the development of Polish enterprises in the area of innovation. Specific goals of the OP include: 1) to increase innovativeness of Polish enterprises; 2) to increase competitiveness of Polish public research; 3) to enhance the role of Polish research institutions in economic growth; 4) to increase the share of Polish innovative products on international market; 5) to create sustainable and better jobs, and 6) to increase the use of ICT. As the list of goals suggests, besides growth and innovation of SMEs, the OP aims at improving Polish research institutions and creating new jobs. However, it should be stressed that the main focus of the OP is on firms, and especially on SMEs. That is why even when research centers were direct beneficiaries of certain measures of the OP, they received public support because their research was later commercialized and sold by firms. Also, their laboratories were equipped from the EU funds so as to be used for business needs.
The OP strategy of SMEs support was built on addressing the barriers to growth that SMEs face in Poland. The following main barriers to growth were distinguished:
innovation backwardness
limited access to capital
lack of R&D and ICT infrastructure
insufficient cooperation among firms and between firms and research centres
low internationalization of Polish SMEs.
Based on the identified barriers, the OP’s support to SMEs was structured along the following priority axes: 1) R&D of modern technologies; 2) capital for innovation; 3)
12 For details on the methodology, and in particular on the Realist approach, see First Intermediate Report, Vol. 1: Synthesis Report. 13 http://eur-lex.europa.eu/legal-content/EN/TXT/PDF/?uri=CELEX:52005DC0024&from=EN, access 22.04.2015. 14 http://eur-lex.europa.eu/LexUriServ/LexUriServ.do?uri=COM:2010:2020:FIN:EN:PDF, access 22.04.2015. 15 Ministry of Infrastructure and Development, 2013, Operational Programme Innovative Economy, 2007-2013, p. 62, par 157.

18
investments in innovative undertakings; 4) diffusion of innovation; 5) Polish economy on the international market, and 6) information society. From the operational point of view, six out of nine priority axes (including technical assistance) were related to the support of SMEs growth and innovation.
In terms of allocation on SMEs-related instruments, the largest amount of funds was allocated to investments in innovative undertakings in firms, especially on implementing modern technologies in production, acquiring R&D equipment or building prototypes (See Table 1).
Table 1. Total allocation for SMEs-related instruments, in million euro
Priority axis
Tot. initial allocation for SMEs-related instruments
Tot. allocation for SMEs-related
instruments after
reprogramming
Share of total allocation for SMEs-related instruments
after reprogramming in relation to total
allocation of the OP I priority axis: Research and development of modern technologies
496 552 5%
III priority axis: Capital for innovation 340 293 3%
IV priority axis: Investments in innovative undertakings 3.4 3.4 34%
V - priority axis: Diffusion of innovation 399 445 4%
VI - priority axis: Polish economy on the international market 232 214 2%
VIII - priority axis: Information society – increasing innovation of the economy
1.05 895 9%
Source: Own elaboration based on the data from Managing Authorities.
When defining the strategy and priorities of the OP, public authorities took into account experience obtained in the previous programmes16. Although in case of Poland, as a new EU Member State (since 2004), the previous financial framework was short (2004-2006), the programmes of 2004-2006, as well as some instruments from pre-accession period provided some important lessons for the OP design. In particular, the previous OP – OP Improvement of the Competitiveness of Enterprises – supported simpler tasks and smaller projects, which were moved into regional programmes in the financial framework 2007-2013. In the current framework, the national OP Innovative Economy focuses on more advanced support to enterprises – based on innovation and R&D. The OP Improvement of the Competitiveness of Enterprises aimed at increasing the competitiveness of enterprises in a broad sense, whereas Innovative Economy aims at increasing their competitiveness through innovation. The next OP – Smart Growth – a successor of Innovative Economy aims at improving the competitiveness of firms through R&D. It shows that each of the subsequent OPs is more specific and focuses on more sustainable sources of competiveness.
According to the interviews with Managing Authorities, during the implementation of the OP Innovative Economy it turned out that supporting any type of innovation is not as effective as the support for R&D-based innovation. The Managing Authorities refer to the economy-level statistics that show that public support for innovation does not result in in the increase of the number of innovative enterprises, while supporting R&D does have a positive impact on private R&D spending. This means that public support is attractive mostly for innovative firms which have already produced innovative products before the
16 According to the interviews with the team at the Ministry of Infrastructure and Development who represent Managing Authorities of the OP.

19
support. In addition, by supporting R&D activities of innovative firms one can ensure that they will continue to produce innovative products even without the public support since they can benefit from their own research findings.
3.2. Synergies with other OPs
The goals of the OP Innovative Economy are also achieved through complementary actions from instruments of other OPs, particularly national OPs Human Capital and Infrastructure and Environment, supra-regional OP Development of Eastern Poland and regional OPs. Complementarity with the OP Human Capital relates to improving Polish human resources necessary for the development of innovative enterprises. The OP Infrastructure and Environment is complementary in terms of infrastructure for research entities (to provide services for entrepreneurs) and eco-friendly investments in firms. In case of the OP Development of Eastern Poland complementarity is reflected by instruments supporting R&D projects and ICT infrastructure taking place in this macro-region.
Complementarity of Innovative Economy with regional OPs is of a particular importance for the support of SMEs. There were a lot of SMEs-related instruments in regional OPs, but as indicated above they supported simpler activities and more region-specific ones. For example, regional OPs provided necessary infrastructure and supported investments, but these actions were often not related to innovation. There was also a division between financial engineering instruments. Innovative Economy focused on equity financing, while capital support from regional OPs was based on debt financing and loan guarantee systems. However, grants (and packages) were the most common mode of delivery for policy instruments in both national and regional OPs.
The synergies with the EU’s international programmes, such as the 7th Framework Programme were not clearly emphasized. It was not mentioned in the description of the OP neither in other OP documents. Some measures promote synergies indirectly (e.g. the “Promoting the potential of the Polish academia” funded by the OP Innovative Economy, but not included in the selected 26 policy instruments) by funding research with international partners and promoting international cooperation among researchers.
3.3. Policy mix
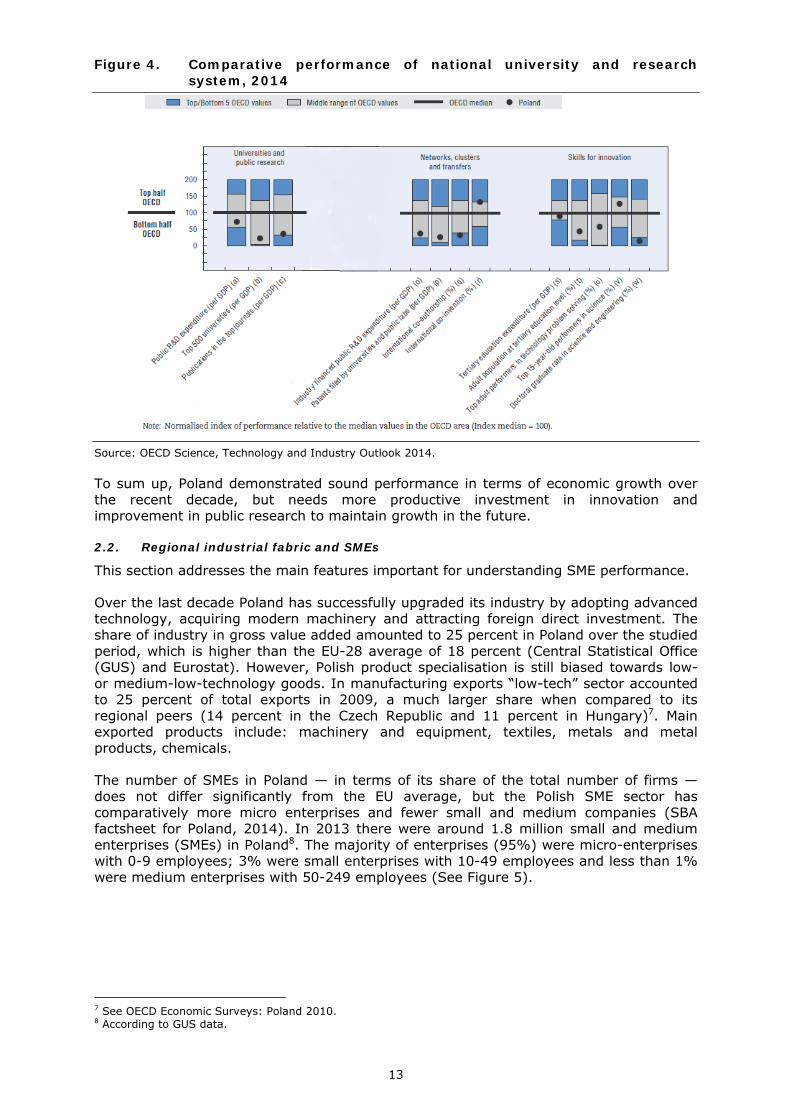
In the OP Innovative Economy we have identified 26 policy instruments17 that support growth and innovation in SMEs (see Annex for the detailed list of policy instruments). SMEs-related instruments accounted in total for EUR 5.8 million after reprogramming. The majority of instruments were either targeting SMEs or firms in general, but the majority of beneficiaries were SMEs anyway. As Figure 8 shows, innovation was the goal for the majority of instruments (15 instruments)18. It is even more visible if one takes into account allocation to these instruments – innovation-oriented measures accounted for three fourth of total allocation after reprogramming for identified instruments. There were 9 instruments targeting at growth and only 2 instruments with objective of both growth and innovation and they accounted for one fifth of the number of instruments and one twentieth of total allocation.
In terms of the type of instruments, the most numerous (5) were related to infrastructures and related services (See Figure 8, bottom panel). The next most important category was the support for R&D projects. This shows the importance of R&D-based innovation in the program structure. However in terms of allocation the share of funds for R&D was actually lower, accounting to 18% of total allocation after reprogramming. R&D projects included cooperation between research entities and enterprises with an objective of commercialization and implementation of R&D results, as well as grants for R&D equipment and laboratories in firms and support to intellectual property right protection. 17 Although not all of them were equally important in terms of the allocation – see below. 18 Here we follow CSIL’s classification that group instruments based on its main objective: growth; innovation; innovation and growth (both objectives are pursued); and territorial cohesion.
Figure
Source: O
The lartechnolinstrumfirms thFrom tinstrumabsorptfinanciatechnolfundingrisk of m
Anotheraccess allocatioinfrastrsmall ininternat
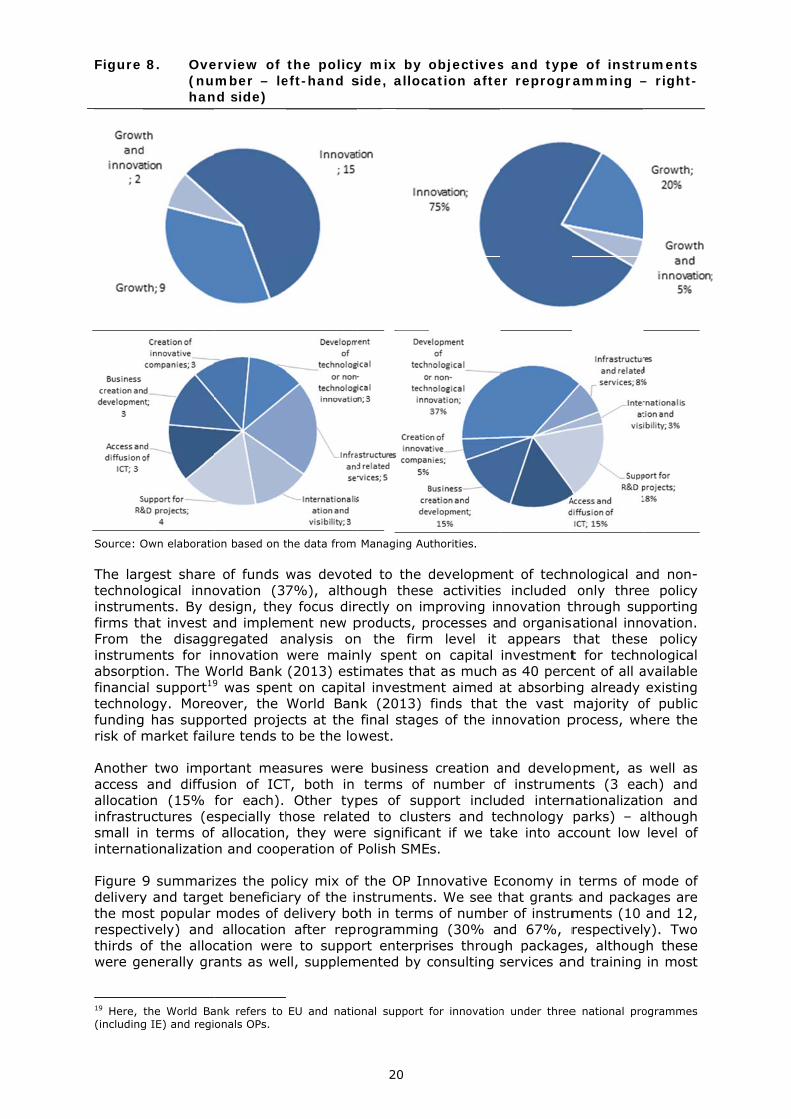
Figure 9deliverythe mosrespectthirds owere ge
19 Here, (including
8. Ove(nuhan
Own elaborati
rgest shareogical inno
ments. By dhat invest athe disagg
ments for intion. The Wal support19
ogy. Moreog has suppomarket failu
r two impoand diffus
on (15% uctures (en terms of tionalizatio
9 summariy and targest popular tively) and of the allocenerally gra
the World Bag IE) and regi
erview of mber – le
nd side)
on based on t
e of funds ovation (3design, theyand implemgregated annovation
World Bank 9 was spenover, the orted projeure tends t
ortant measion of ICTfor each). specially thf allocationn and coop
zes the poet beneficiamodes of d allocation cation wereants as we
ank refers to onals OPs.
the policyeft-hand s
the data from
was devote7%), althoy focus dir
ment new panalysis onwere main(2013) est
nt on capitaWorld Ban
ects at the o be the lo
asures wereT, both in Other typhose relate, they wer
peration of
licy mix ofary of the indelivery bo after repre to suppo
ell, supplem
EU and natio
20
y mix by side, alloc
Managing Au
ed to the dough theserectly on improducts, pn the firmnly spent otimates thaal investmenk (2013) final stagewest.
e business terms of pes of suped to clustre significanPolish SME
f the OP Innstruments
oth in termsrogramminort enterprmented by c
onal support
objectivesation afte
thorities.
developmee activitiesmproving inprocesses am level it on capital t as much
ent aimed afinds that
es of the in
creation anumber o
pport incluters and tent if we tas.
nnovative Es. We see ts of numbeng (30% aises througconsulting
for innovation
s and typeer reprogr
nt of techns included nnovation tnd organisappears
investmentas 40 percat absorbinthe vast
nnovation p
and develof instrumeded internechnology ake into ac
conomy in that grantser of instrumnd 67%, rgh packageservices an
n under three
e of instruramming –
nological aonly three
through supational innthat theset for techncent of all ang already majority o
process, wh
pment, as ents (3 eanationalizatparks) – a
ccount low
terms of ms and packaments (10 respectiveles, althougnd training
e national pro
uments – right-
nd non-e policy pporting ovation. e policy nological available existing
of public here the
well as ch) and ion and although level of
mode of ages are and 12, y). Two
gh these in most
ogrammes

21
of the cases, as summarized in the Table 2. Thus, grants were the main type of provided support.
In case of capital investment grants and projects in their later stages of innovation process grants should have been complemented by loans, given that these types of projects have stable and predictable cash that facilitates loan repayment. However, we still support some use of grants for innovative projects because the Polish firms have only recently started to undertake innovative projects so it is likely that the demand for loans could have been too low.
Table 2. Types of packages
Type of a package Number of instruments
Share in total allocation after reprogramming
Grant + consulting services 2 9% Grant + consulting services + provision of infrastructure and services 1 3%
Grant + consulting services + training 5 46% Grant + training 1 3% Consulting and accounting services + training + search of business partners 2 5%
Consulting services + training + search of business partners 1 1%
Packages – total 12 67% Source: Own elaboration based on the data from Managing Authorities and terminology developed by CSIL.
Analysis of target beneficiaries shows that the majority of instruments were targeted on either individual enterprises (5), single entrepreneurs (4) or individual SMEs (11). It is even more visible in terms of total allocation – in total 95% of funds were allocated to the above mentioned instruments. Note that category “individual enterprises” and “individual SMEs” overlap as “individual enterprises” include both SMEs and large firms. Only a few instruments – in terms of their number and allocated funds – were to support SMEs in specific sectors.
There were no instruments explicitly targeted on groups of enterprises – they were benefiting as a group indirectly in case of e.g. clusters or business parks, but in these cases the support was addressed through cluster managers. Although enhancing the cooperation among enterprises was one of the obstacles to be overcome by the OP, no explicit instruments targeting directly a group of enterprises were designed. Only 3 instruments (accounting for 1.8% of total allocation) were targeted at SMEs in partnership with research entities.

Figure
Source: O
To sumPolish Swere mimportinstage odirect rglobal t
Howeveinvestmhave bepredictathat theamong
3.4. I
The totaccount 20 Please,21 For a d22 The da
9. Ovebenrep
Own elaborati
m up, the poSMEs and mainly spenng innovat
of developmreflection otechnologic
er, it seemment grantseen compleable cash tere were t these instr
Interventio
tal expendted to ov , see a recent detailed discusta here and b
erview ofneficiary rogrammi
on based on t
olicy mix obarriers thnt on capions from a
ment20. In pof the fact al frontier.
ms that thes and projeemented bythat facilitaoo many pruments ins
on logic
diture on ver EUR 3 EBRD report ssion of the nuelow comes fr
the pol(number
ng – right
the data from
f the OP Iney faced. ital investmabroad wasparticular, tthat there
e wide usects in theiry loans, gi
ates loan repolicy instrustead of foc
policy inst3.7 billion2
(2014) for a dumber of instrrom the Mana
22
icy mix r – let-hand sid
Managing Au
nnovative EIt appearsment for ts an efficiethe adoptio is still sub
e of grantr later stagven that tepayment. uments21. Acusing on s
truments s22. Figure
discussion on ruments see Waging Authorit
by modeft-hand e)
thorities.
Economy to that polictechnologicent strategyon of existibstantial sc
ts is unjuses of innovhese types Another dAs a resultupport for
supporting 10 summ
this topic. WYG PSDB, 20ties.
of delivside, a
ook into accy instrume
cal absorpty for Polandng technoloope for cat
tified in thvation proces of projectrawback oft, the suppinnovation
SMEs at marizes the
011.
very and allocation
count the nents for inntion. In oud given itsogies by fitching up w
he case ofess. Grantsts have staf the policyport was d and R&D.
the end oe allocatio
target after
needs of novation ur view, current rms is a with the
f capital s should able and y mix is ispersed
of 2013 on after

23
reprogramming and actual expenditure for selected instruments under review. There are clear differences between instruments in terms of financial significance. The most important instruments are those related to innovation, as well as to R&D projects and their implementation. The highest expenditure (over EUR 1 billion) was dedicated to new investments of high innovative potential. The allocation of funds clearly reflects the focus of the OP on fostering innovation through instruments that directly increase the level of innovation in Polish SMEs. Significant share of funds was also devoted to ICT infrastructure expenditure and business support institutions development.
Figure 10. Total allocation and expenditure for selected policy instruments, 2013, million euro
Source: Own elaboration based on the data from the Managing Authorities.
Table 3 summarizes the intervention logic for the most significant policy instruments. They represent 90% of total allocation committed after reprogramming and 93% of total spending. Each instrument has an identification number that corresponds to numbers in the First Intermediate Report, Polish fiche.
199
372
324
53
34
14
32
82
25
249
105
817
1,725
433
186
321
71
194
447
80
228
250
28
13
8
7
40
9
195
47
511
1,142
330
149
171
75
132
325
0 200 400 600 800 1,0001,2001,4001,6001,8002,000
Support to providing the access to the broadbandInternet
Supporting eServices between enterprises (B2B)
Support to activities in the area of digital economy
Promotion of the Polish economy
Projects that support participations of Polishenterprises in promotion campaigns
Support to studies that prepare investment projects
Development of business assistance centres’ network
Passport to export
Management of intellectual property rights
Promoting innovation centres
Support for the development of supra‐regionalcooperative relations
Support to investment of great significance for theeconomy
New investments with high potential of innovation
Technological credit
Promoting R&D activities of enterprises
Implementation of results of R&D work
Support to capital funds
Starting the innovative activity
Support to R&TD projects
Paid Committed

24
Table 3. Key policy instruments and intervention logic N Name Description Logic of intervention Obj. Mode of delivery
1 Support to R&TD projects
The instrument supports R&D projects carried out by firms. Specifically, the projects should entail two phases: research phase and implementation phase. Firms can decide if they carry out the R&D activities on their own, or they outsource it.
Supporting R&D innovation in Polish firms, reducing the risk related to R&D, increasing private expenditure on R&D in Poland.
Innov. Grant
6 Support to capital funds
The aim is to establish a fund that supports capital investments in SMEs. The fund provides financing for innovative enterprises at early stages of development, including risky investment.
Providing financing for innovative endeavours, reducing the asymmetric information. Innov. Equity finance
9 Implementation of results of R&D work
Projects supported by this policy instrument are the continuation of the first policy instrument presented in this table. Entrepreneurs receive support for implementing the results of R&D in practice.
Supporting the implementation of R&D-based innovation in firms, reducing the risk related to R&D, increasing private expenditure on R&D
Innov. Grant
10 Promoting R&D activities of enterprises
The instrument supports individual projects which are aimed at increasing R&D activities of individual entrepreneurs and promoting use of industrial design.
Supporting the investments in R&D through reducing the under-provision of R&D infrastructures in Polish firms.
Innov. Package: grants +consulting services +training
11 Technological credit The instrument provides financing of individual projects from the Technological fund. Entrepreneurs from SMEs that implement new technologies are eligible for financing.
Supporting the implementation of new innovative technological solutions to reduce innovation backwardness of Polish SMEs.
Innov. Package: grants +consulting services
12 New investments with high potential of innovation
It supports new investments in new highly innovative organisational and technological solutions in production and services.
Supporting new innovative investments to reduce innovation backwardness of Polish SMEs. Innov.
Package: grants +consulting services +training
13
Support to investment of great significance for the economy
It supports new investments of enterprises from the production sector that use innovative solutions of great significance for economy due to the size of investments and number of new jobs created. Projects support investments in manufacturing and services.
Supporting significant investments to reduce innovation backwardness of Polish SMEs. Growth Grant
14
Support for the development of supraregional cooperative relations
The instrument supports the projects that promote cooperation networks of SMEs and business support institutions, including investment and consulting networks. These networks should promote diffusion of innovation within a network.
Supporting cooperative relations to reduce network and coordination failures and to increase cooperation among Polish SMEs.
Growth Package: grants +consulting services +training
17 Promoting innovation centres
The instrument support the projects that promote the creation of technological parks that are located in growth centres. Technological parks provide consulting and other services for SMEs.
Supporting innovation centres to reduce imperfect information on innovation opportunities and to increase their cooperation with research entities.
Innov. AND Growth
Package: consulting services +training +search of business partners
19 Passport to export This instrument finances participation of SMEs in international trade fairs and foreign business trips; supports search of foreign partners; provides consulting services to SMEs; etc.
Supporting internationalization of Polish SMEs to increase their presence on international market. Growth Package: grants+
consulting services
24 Support to activities in the area of digital economy
This instrument finances projects that provide e-services, e.g. e-commerce.
Supporting development of e-services to address the limited capabilities of Polish SMEs in this area. Innov.
Package: grants +consulting services +training
25 Supporting eServices between enterprises (B2B)
It finances the implementation of B2B communication system in SMEs. They lead to cooperation between enterprises in digital form.
Supporting B2B ICT system in SMEs to enable them to provide e-services. Innov.
Package: grants +consulting services +training
Source: Own elaboration based on the data from Managing Authorities.

25
The main barrier faced by Polish SMEs to be addressed by the whole OP was their innovation backwardness. That is why the majority of instruments concentrated on this issue and sought to enhance innovation of Polish SMEs. This choice was suitable, since before the OP was launched only a small part of Polish SMEs invested in innovation, particularly little in R&D-based innovation. Although low level of innovation is not a market failure, it was the main barrier to growth and development of Polish SMEs, given that it decreases firms’ competitive advantage on the market. As we discussed in the Section 2.2, Polish firms has built their competitive advantage on low costs, while the OP aimed at basing it on more sustainable grounds such as innovation.
In case of supporting innovation, three instruments are of particular importance. First, grants for investments with high innovative potential (N 12), which allowed SMEs to directly implement innovative solutions in their enterprises. Second, technological credit (N 11) helped firms to acquire state-of the-art innovative solutions and apply them to their production. Third, support to R&D (N 1, 9) allowed SMEs to perform R&D on their own or outsource them to research entities and later implement R&D results.
The last instrument - support to R&D (N 1, 9) is particularly important as it finances not all types of innovation, but R&D-based innovation, which directly addresses the problem of low level of private R&D expenditure in Poland. As supported firms are required to co-finance projects, private expenditure on R&D automatically would increase. Under this instrument firms were obliged to implement the solutions of successful R&D projects (i.e. stage 2: implementation). Interestingly, when the funds for the second stage were exhausted, the demand for the first phase (i.e. stage 1: R&D) did not fall23. That means that firms were eager to invest in the first (R&D) stage of the instrument, even without further support for implementation.
It is also worth to mention another instrument supporting R&D – grants for creating and equipping laboratories that allow SMEs to perform R&D (N 10). Although it was a smaller measure, it allowed firms to reduce the barrier of insufficient infrastructure to carry out R&D. The obstacle to growth related to the under-provision of necessary infrastructure was also addressed through ICT related instruments. They allowed SMEs to improve their ICT capabilities helping them to compete on B2B market, providing e-services.
Another barrier to be tackled by the OP was limited access to external financing. This issue is crucial especially for innovative projects, in which payoffs are uncertain, and at early stages of firm development, when enterprises do not have credit history and cannot obtain a loan. Limited access to capital for innovation was addressed through both the above mentioned grants and through equity-based financial instruments. There was a number of instruments that were targeting newly established innovative companies, as well as venture capital funds and business angels investing in such entities. Significant part of these measures constituted workshops, conferences and consulting services helping firms to find external investors.
Important share of support was devoted to the diffusion of innovation, with related instruments intended to enhance the cooperation among enterprises and between enterprises and research entities. This was done through support to technology parks, clusters and innovation centers in which the exchange of knowledge and best practices takes place. The issue of cooperation is crucial in Poland as social capital is low and there is a need for mental change in entrepreneurs’ minds. During the transition years firms had to learn how to compete on the market and now they need to learn how to cooperate with their competitors for mutual benefits.
Finally, low degree of internationalization of Polish SMEs was also tackled by the OP policy instruments. Internationalization is also key for further development of Polish SMEs, as often they are not interested in going international because of a large internal market in Poland. This attitude reduces the necessity of improving firm’s performance and becoming more competitive. Instruments of internationalization allow firms to enter
23 According to the Interviews with the MA.

26
foreign markets, face foreign competition, recognize world best practices and build better competitive advantages through implementation of innovative solutions. This was supposed to enhance productivity and, as a consequence, economic growth in Poland.
Overall, the intervention logic was relevant taking into account the barriers faced by Polish SMEs, as well as the level of development of the Polish economy. The focus on innovation would allow firms to build their competitive advantage on new products and processes instead of on low costs. As evaluation studies suggest24, the OP has indeed fostered innovation in the Polish economy (see 4.3.1 below). Other areas of intervention – equity financing, diffusion of innovation, internationalization and support to ICT were complementary to the core aim. To sum up, in our view the theory of change behind the selection of instruments has been realistic and based on the real needs of Polish SMEs.
3.5. Implementation and reprogramming
3.5.1. Role of implementing bodies
Because of the size of the OP, the role of the implementing bodies was a challenging one. They were responsible for organizing the assessment of projects to be financed by the OP, signing the agreements with the beneficiaries, managing funds on the level of measures, monitoring the realization of the OP, carrying out the evaluations of specific measures. They were also in charge of communication issues and promotion of the OP among the potential beneficiaries.
The most important implementing body in terms of SMEs support is the Polish Agency for Enterprise Development (PARP), responsible for the majority of instruments identified for the purpose of this report. The primary objective of the Agency is to develop the sector of small and medium-sized enterprises in Poland. Besides Innovative Economy, PARP is responsible for implementing measures under two other OPs – Human Capital and Development of Eastern Poland, which are complementary to the OP under analysis (see Section 3.2). This allows the agency to support SMEs in a better and more complementary way, taking advantage of synergies between different OPs.
Independent evaluation (World Bank, 2013, p. 41-42) suggests that legal constraints limit PARP’s capacity to take risk and stimulate innovation in Polish SMEs. Because of this risk aversion, PARP usually supports practices at later stages of the innovation process and the absorption of innovative solutions, while the selection procedure is too much reliant on a paper trail, rarely involving face-to-face interaction with applicants. Bureaucracy often hinders behavioural changes in Polish SMEs towards innovation, as in the selection procedure there is too much focus on details and not on the substance of the supported projects (see point 4.4.3).
It is important to note that it was a responsibility of the implementing bodies to set the criteria for project evaluation. The Managing Authorities prepared the strategy and general description of how the OP will be realized, while intermediate bodies were responsible for developing a detailed description of priorities, including how specific measures will be implemented and how projects will be assessed. Final criteria, though, were designed by the institutions that were organizing the call, i.e. an implementing body. However, selection criteria were developed in cooperation with other institutions, discussed and consulted by the Monitoring Committee, which is responsible for approving the criteria. In other words, implementing bodies were setting the criteria, but they needed to be approved by the Committee with the representatives of potential beneficiaries (see point 3.5.2 on consultation in policy design).
The projects were evaluated by experts recruited by the implementing bodies. Initially, the experts were working on the documents separately. Lately, the authorities have noticed that it is important to allow experts to talk with each other and exchange opinions (Interviews with the MA). They started to experiment with project assessment
24 See e.g. WYG PSDB 2014; World Bank 2013.

27
by a panel of experts. In a number of cases potential beneficiaries were invited to present their projects. It was stressed in the interviews that direct communication with firms helps to better evaluate projects. However, it is important to note that this procedure is costly and time-consuming, thus it might not be feasible when many firms participate in a competition.
To sum up, the implementing bodies, and in particular PARP played an important role in projects implementation. However, their risk aversion and bureaucratic procedures limited the effectiveness of the public intervention.
3.5.2. Partnership and consultation
Partnership and consultation were important elements of the programme design. Before the OP was launched there was a wide consultation with the involved stakeholders. A working group with representatives of enterprises – potential future beneficiaries – was created. As suggested by the interviews, the working group discussed proposed policy instruments in a lively way at the initial stage. When the first draft of the OP was ready, there were official consultations with firms’ representatives. This allowed to recognize the needs of Polish SMEs that were assessed earlier using a SWOT analysis approach.
At the next stage the Monitoring Committee of the OP was created in which the representatives of social partners, including enterprises, were represented. The Monitoring Committee was giving opinion on the criteria of projects selection. At this stage the final criteria for choosing projects were set which de facto determined which projects will be eventually financed. Social partners were the most active member of the Committee according to the Managing Authority.
It should be noted that at the policy design level SMEs and large enterprises were represented by chambers of commerce, as well as business and employers’ associations. Single firms did not take part in the consultation process. Single enterprises that could be able to participate in policy design did not emerge from the point of view of Managing Authorities. The same pattern of consultation was applied in the development of the successor of Innovative Economy – the OP Smart Growth.
3.5.3. Response rate
It is difficult to assess the popularity of instruments, as there is no agreed measure in this area. One way to assess the popularity is to compare the number of applications received with the number of contracts actually signed. According to the interviews with the Managing Authorities, the highest number of application was received for the implementation of B2B communication system in SMEs to enable them provide e-services. Lots of applications were also received for the instrument financing new investments of high innovative potential. Applications received and their success rate for SMEs-related priority axes are presented on Figure 11.

28
Figure 11. Applications received and success rate
Source: Own elaboration based on the data from Annual Implementation Report 2013.
It is clear from the graph that the highest number of applications was received for the priority axis 8, related to increasing the ICT capabilities of SMEs. Significant number of applications was also received for priority axis 6 (internationalization of SMEs) and 4 (investments in innovative undertakings). In case of priority axis 1 (R&D of modern technologies) the number of application does not necessary correspond with the number of SMEs applicants, as in this axis research entities were main beneficiaries. The lowest number of applications was received for priority axis 3 and 5, but these were more specific areas of intervention – equity financing of innovative enterprises at early stages of development and diffusion of innovation in cooperative relations and through business support institutions, respectively.
In terms of success rate – percentage of applications accepted over total formally correct applications received – priority axis 6 performs the best (44%). It might be the case that applying companies which wanted to go international were performing better than the average, thus their applications were of a better quality as well. Priority axis 4, characterized by the highest allocation for instruments with a large number of projects, also features a high success rate (42%). Somewhat lower, but still high success rate can be observed for priority axes 3 and 1 (38-39%).
The lowest success rates characterize priority axis 5 and 8 (28%). Low success rates might be related to low quality of applications. In fact, in case of priority axis 8, the initially very lax criteria were tightened after the intervention of the European Commission, which caused the success rate to drop, meaning that many applications were of low quality. In case of priority axis 5 this might be a reflection of problems of Polish SMEs to cooperate and apply for the support in this area.
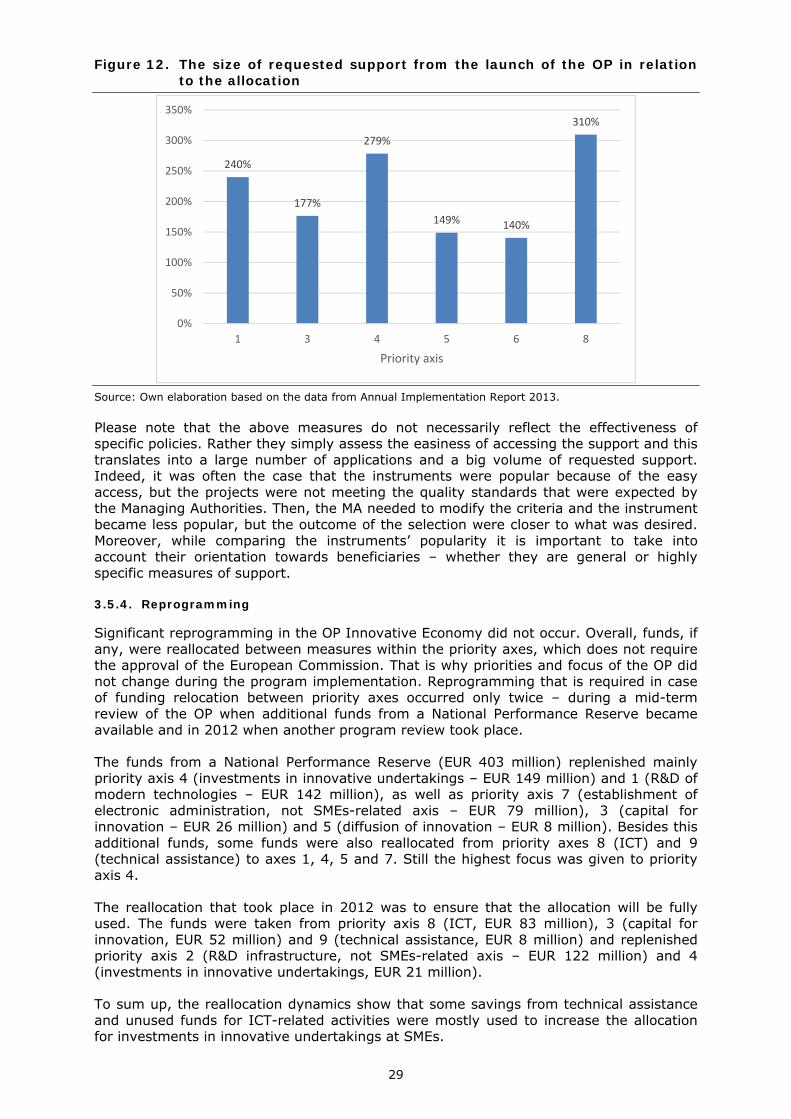
The popularity of instruments can also be analysed in terms of the amount that was requested by potential beneficiaries in relation to the actual allocation. Again this information is only available at the level of priority axis, not specific measures. The data are presented on Figure 12. As we can see, this relation is the highest for priority axes 8 and 4, where the applicants were applying for over and almost three times more funds than the allocation amount, respectively. This relation is the lowest for priority axes 6 and 5, although the requested support was still 1.5 bigger than the allocation for this axes. The interviews with the Managing Authorities indicate that the highest relation of requested funds to the allocation was for the instrument related to investments in innovative undertakings.
3624
798
4852
1551
9285
23891
38% 39%42%
28%
44%
28%
0%
5%
10%
15%
20%
25%
30%
35%
40%
45%
50%
0
5000
10000
15000
20000
25000
30000
1 3 4 5 6 8
Priority axis
Number of formally correct applications
% of application accepted over total formally correct applications received
29
Figure 12. The size of requested support from the launch of the OP in relation to the allocation
Source: Own elaboration based on the data from Annual Implementation Report 2013.
Please note that the above measures do not necessarily reflect the effectiveness of specific policies. Rather they simply assess the easiness of accessing the support and this translates into a large number of applications and a big volume of requested support. Indeed, it was often the case that the instruments were popular because of the easy access, but the projects were not meeting the quality standards that were expected by the Managing Authorities. Then, the MA needed to modify the criteria and the instrument became less popular, but the outcome of the selection were closer to what was desired. Moreover, while comparing the instruments’ popularity it is important to take into account their orientation towards beneficiaries – whether they are general or highly specific measures of support.
3.5.4. Reprogramming
Significant reprogramming in the OP Innovative Economy did not occur. Overall, funds, if any, were reallocated between measures within the priority axes, which does not require the approval of the European Commission. That is why priorities and focus of the OP did not change during the program implementation. Reprogramming that is required in case of funding relocation between priority axes occurred only twice – during a mid-term review of the OP when additional funds from a National Performance Reserve became available and in 2012 when another program review took place.
The funds from a National Performance Reserve (EUR 403 million) replenished mainly priority axis 4 (investments in innovative undertakings – EUR 149 million) and 1 (R&D of modern technologies – EUR 142 million), as well as priority axis 7 (establishment of electronic administration, not SMEs-related axis – EUR 79 million), 3 (capital for innovation – EUR 26 million) and 5 (diffusion of innovation – EUR 8 million). Besides this additional funds, some funds were also reallocated from priority axes 8 (ICT) and 9 (technical assistance) to axes 1, 4, 5 and 7. Still the highest focus was given to priority axis 4.
The reallocation that took place in 2012 was to ensure that the allocation will be fully used. The funds were taken from priority axis 8 (ICT, EUR 83 million), 3 (capital for innovation, EUR 52 million) and 9 (technical assistance, EUR 8 million) and replenished priority axis 2 (R&D infrastructure, not SMEs-related axis – EUR 122 million) and 4 (investments in innovative undertakings, EUR 21 million).
To sum up, the reallocation dynamics show that some savings from technical assistance and unused funds for ICT-related activities were mostly used to increase the allocation for investments in innovative undertakings at SMEs.
240%
177%
279%
149% 140%
310%
0%
50%
100%
150%
200%
250%
300%
350%
1 3 4 5 6 8
Priority axis

30
4. EVIDENCE ON ACHIEVEMENTS
4.1. Measuring achievements
The monitoring system of the OP recognizes three types of indicators – economy-level indicators, output indicators, and result indicators. Economy-level indicators come from public statistics, as the goals of the OP can be also measured on the level of the whole economy, and take into account the context of the intervention, not only effects of itself. Output and result indicators measure only the effects of the OP, they are reported by the beneficiaries and are recorded in the monitoring system.
The main shortcoming of the OP-level indicators is that no general indicators that assess innovation are available. For example, an indicator on the number of firms that implemented innovation is only available for one priority axis. In addition, it is not possible to aggregate the available indicators to the programme level because some of them overlap.
Overall, the monitoring system is biased to output indicators (e.g. number of projects), while there is only a limited number of result indicators which are not systematic. What is also important, many indicators are not yet realized – despite the fact that the OP is about to end – as many projects are still ongoing and indicators cannot be reported. This makes the evaluation of the OP somewhat tricky, as in many cases one needs to assess a project in terms of estimated realization that is based on the contracts signed (and not yet finalized). The differences between actual and estimated realization are often substantial.
The indicators collected at the level of measure are usually measure-specific. It means that they are designed so as to reflect the outcomes that are expected to be triggered by the specific instruments. For example, in terms of cooperation between firms the number of supported cooperative relations is reported, while for the instruments supporting export the system recognizes the number of entrepreneurs who increased exports. In terms of the main area of intervention, i.e. increasing the innovativeness of Polish enterprises, the number of enterprises which implemented innovation of different types is reported. However, the system does not record the returns the supported innovation activity has yielded. Therefore, one actually does not know how beneficial the implementation of innovation for the firm was.
It is also important to note that the monitoring system is not able to capture “soft” changes among Polish enterprises like mental changes or qualitative evidence. This qualitative information can be obtained from the interviews with the related stakeholders, allowing to better assess the achievements of particular instruments.
Important information can be also based on evaluation studies that are published regularly. These studies focus either on specific issues like the influence of the OP on the quality of business support institutions or on specific measures and instruments of the OP. Unfortunately, many evaluation studies lack rigorous methodology and do not include control groups, which means that they are unable to assess the actual additionality of each public zloty spent (The World Bank, 2013).
With regard to the monitoring system, ex ante evaluation study of the OP concludes that the indicators chosen are overall relevant in terms of the goals, but are sometimes too general and do not closely reflect what they should measure (CASE Advisors, 2008)25. The study also notes that classification into output and result indicators is not always clear. The design of indicators was assessed as accurate as long as their measurability was concerned – in general the system does not generate extra costs in terms of data acquisition. The evaluation also emphasizes the lack of a document containing the descriptions and definitions of the indicators used in the system, which opens the scope
25 “The analysis of the selection correctness of monitoring indicators of Innovative Economy Operational Programme (IE-OP) 2007-2013”, in Polish, CASE Advisors, 2008.

31
for various interpretations. To our knowledge, no ex post evaluation of the monitoring system is available.
4.2. Characteristics of the assisted SMEs
According to the most recent data, up to the end of June 2015 in total 17 428 agreements with SMEs were signed and 12 797 enterprises were supported. Over a half of all agreements were concluded with microenterprises, 28% with small enterprises and one fifth with medium enterprises. The size-structure of the supported firms corresponds with the general statistics for SMEs in Poland. The statistics for the OP are presented in Figure 13.
Figure 13. The number of supported SMEs by dimension
SMEs by size
Number Percentage
micro 6706 52% small 3544 28% medium 2547 20% Total 12797 100%
Source: Own elaboration based on the official data on the beneficiaries of the OP.
If it comes to the technological intensity of the OP beneficiaries, it is important to distinguish between industry and services. Figure 14 summarizes the statistics on technological intensity for these two broad categories of beneficiary enterprises. For industry, it turns out that the majority of supported firms operate in low and medium-low technology industry – both in terms of number of projects (63%) and share in financial support (65%). The industries in this group include manufacturers of rubber and plastics products, wood and paper products, furniture, non-metallic mineral products, food and beverages and textiles and wearing apparel. Only 9% of beneficiaries belong to high technology industry and their share in total support to enterprises accounted for less than 8%. This category included the producers of computers, electronic and optical products, as well as pharmaceuticals.
For the beneficiaries in services the picture is different. Here the majority of projects were realized in high-tech knowledge intensive services (47%), which accounted for over a half (53%) of funds supporting beneficiaries providing services. These services included primarily computer programming, consultancy, information service activities, as well as telecommunications and scientific research and development. Knowledge-intensive services accounted for one fifth of projects and 19% of the financial support and included mainly professional, scientific and technical activities. Less knowledge intensive services represented one third of services projects and 28% of total financial support for beneficiaries in services. Here the main category was the wholesale and retail trade.
In our view, supporting low-tech sectors is an efficient strategy given that it brings productivity gains. According to the report of the European Bank for reconstruction and Development (EBRD, 2014), for countries still far removed from the technological frontier introducing innovation in low-tech sectors might actually yield the highest returns in terms of productivity gains. Based on the firm-level data from 30 transition countries, EBRD estimates that introducing a new product leads to an increase in labour productivity of 126 per cent in medium-low-tech manufacturing sectors as compared to only 91 per cent in high-tech and medium-high-tech. Firms in these countries managed to increase labour productivity by absorbing and benefiting from technologies developed elsewhere. Therefore, even though high-tech industries are the main growth drivers in developed economies, support for low-tech industries brings about more significant changes for the economies such as Poland.
micro; 52%
small; 28%
medium; 20%

32
Figure 14. Assisted beneficiaries by technological intensity (share in the number of projects – left-hand side, share in financial support – right-hand side)
Source: Own elaboration based on the data from Annual Implementation Report 2013.
If it comes to services the supported sectors included mainly those related to ICT and this also should not be unexpected, as in these branches implementing innovation is cheap and fast, so they were mostly eager to apply for the support. It was also the case that these sectors were the main target of equity financing instruments – Polish business angels and venture capital funds, despite the name, are highly risk-averse, thus supporting ICT start-ups seems to be the safest option for them.
In general the beneficiaries of the OP came from various sectors and they were located across the country. This means that particular sectors or geographical regions were not favoured (except for sector-specific instruments). The population of the OP beneficiaries is in line with the Managing Authorities’ expectation, as confirmed by the interviews. The interviewees claimed that it could not vary much from what was anticipated, since the criteria for projects selection were set (or adjusted during the implementation) so that the expectations ex ante were fulfilled.
4.3. Achievements
4.3.1. Evidence on innovation and R&D
In line with the main objective of innovation-based growth, indicators on innovation and R&D are of crucial importance when assessing OP Innovative Economy.
There is some evidence suggesting that the ERDF support has had a positive impact on innovation and R&D in Poland. To our knowledge the only study that assesses the macro effects of ERDF support finds that more than half of recent growth in R&D expenditure as a share of GDP26 is driven by structural funds27. Results of the econometric model indicate that without the ERDF support, the share of R&D expenditure in GDP would have amounted to 0.7%, instead of actual 0.89% in 2012. In addition, they find that the recent increase in the share of high-tech (R&D-intensive) products in Polish exports is 26 R&D expenditure as a share of GDP increased from 0.57% in 2008 to 0.87% in 2013 (See Table 4). 27 See WYG PSDB, 2014, p. 58.
High technology industry,
9% Medium‐high
technology industry, 28%Medium‐
low and low
technology industry, 63%
High technology industry,
8%Medium‐high
technology industry, 27%
Medium‐low and low
technology industry, 65%
High‐tech knowledge intensive services, 47%
Knowledge intensive services, 20%
Less knowledge intensive services, 32%
High‐tech knowledge intensive services, 53%
Knowledge intensive services, 19%
Less knowledge intensive services, 28%

33
mainly driven by the ERDF funds. If there had been no support from the ERDF funds, the share of these products in exports would account for 3.78% in 2013, instead of 6.7% (WYG PSDB, 2014, p. 58).
Table 4. Selected innovation and R&D indicators in Poland
Indicator 2007 2008 2009 2010 2011 2012 2013 R&D expenditure as a percentage of GDP 0.57 0.6 0.67 0.72 0.75 0.89 0.87
Share of high-tech exports in total exports 3.0 4.3 5.7 6.0 5.1 6.0 6.7
Innovation expenditure of enterprises as a percentage of GDP n/a 2.77 2.3 2.4 2.05 2.27 1.98
Share of innovative enterprises in total number of manufacturing enterprises
n/a 21.4 18.1 17.1 16.1 16.5 17.1
Source: GUS (Polish Central Statistical Office).
On the other hand, some economy-level indicators of innovation show negative dynamics, but unfortunately we do not have evidence how these developments relate to the ERDF support. For example, firms’ expenditure on innovation as a percentage of GDP is reduced, though not significantly (See Table 4). We also observe a negative trend in the share of innovative enterprises in total number of manufacturing firms in Poland. One explanation to the negative trend in innovative activity is the economic crisis. As the survey of the Polish SMEs by PARP (2012a) shows, firms responded to the crisis by cutting costs, including spending on innovation.
Next, we discuss selected indicators from the monitoring system (See Table 5). Unfortunately, no summary indicator on innovation is available from the monitoring system. All indicators in Table 5 reflect achievements of a particular priority axis or policy instruments.
Table 5. Selected achievements of the OP in terms of innovation and R&D
Indicator Realization Target % of the target
Estimated realization
Number of SMEs that implemented innovation 920 650 142% 1417
Number of SMEs that started or developed R&D activities 471 60 785% 812
Number of R&D-related jobs created in enterprises 1818 1500 121% 4064
Amount of mobilized private funds when implementing results of R&D, in EUR million
240 260 92% 476
Number of R&D works’ results introduced on the market 467 800 58% 1148
Number of modernized or newly built laboratories 64 60 107% 67
Number of new products and services created thanks to technological credit 966 350 276% 1311
Number of improved products and services created thanks to technological credit
719 100 719% 915
Source: Own elaboration based on the data from Managing Authorities. The data is from December, 2014.
When compared to targets, indicators on innovation and R&D look promising. Although for some indicators their realization was below 100% of the target at the end of 2014, the estimated realization at the end of 2015 is well above these values. This shows that the target levels of the indicators will be realized, which means that the OP will achieve its goals, at least those measured by the indicators.
34
However, it might be misleading to measure achievements in terms of targets because some targets seem to be too low. This is the case with the target for indicator “Number of SMEs that started or developed R&D activities” (see Table 5). The target is set at 60, while it corresponds to the entire axis 4, with total allocation to R&D related activities for SMEs amounting to approximately EUR 224 million. A study by CASE Advisors Sp. z o.o. (2008) confirm that some targets we indeed set too low. Moreover, these indicators do not give a complete picture as they do not account for returns from innovative activity.
As we discuss in section 4.1, the only available indicator for number of SMEs that implemented innovation is on the priority axis level – 920 SMEs for priority axis IV (see Table 5). Thus, from the monitoring system we cannot really assess how many firms in total have implemented innovation as a result of OP IE. But even if we assume that the majority of OP beneficiaries have introduced innovation, this would amount to less than 0.5 percent of all SMEs in Poland, or a very low number. However, from the theory of innovation we know that the supported innovation should have positive spillovers on other firms (e.g. Grossman and Helpman, 1992). Not only the supported firms would perform better thanks to new implemented solutions, but also innovation may spill over to other companies, resulting in more knowledge in the economy.
The introduced innovations were mainly product and process innovations, while the beneficiaries were mainly medium-size firms characterized by a well-established market position, with no concentration on particular branches (WYG PSDB, 2014, p. 5). According to the declarations of beneficiaries, one third of innovations were new to the world (WYG PSDB, 2014, p. 6).
It is also important to notice that the OP enhanced R&D activities in SMEs and R&D-related jobs creation in Polish firms. Before the OP, it was not common for SMEs to take up such activities and the intervention changed it to some extent. As stated in the report by PARP (2013b, p. 151), 42% of beneficiaries of the OP that did not performed R&D activities before the OP claim that engaging in R&D is a direct consequence of the OP intervention. The OP also financed the acquisition of the equipment necessary to perform R&D at SMEs. Significant number of new solutions based on R&D activities were (or are to be) introduced on the market. Finally, lots of new or improved solutions were created thanks to the OP support.
The evaluation conducted by PARP (2014a) based on on-line surveys (Computer Assisted Web Interviewing) – Innovation Barometer – shows that innovation support of the OP is sustainable. Among the beneficiaries, the share of firms that introduced innovation after receiving the support is higher than before receiving the support. The average number of innovations introduced by beneficiaries after the support is increasing. On the other hand the growth of expenditure on innovative activity among beneficiaries is decelerating two years after project realization, which might also indicate that their commitment to embrace and pursue innovation in the long term is not strong.
4.3.2. Evidence on employment effects
The OP Innovative Economy was supposed to foster innovation at Polish SMEs, but also to create new jobs in the sector. According to AIR (2014), a total of 7 thousand new jobs will be created in SMEs by the end of 2015 as a result of the OP support. We would like to stress that a more detailed data is not available for all priority axes. In particular, the data for the priority axis 6 that relates to internationalization of SMEs is missing.
The available data by priority axis is presented in Table 6.

35
Table 6. Selected achievements of the OP in terms of employment in enterprises
Priority axis New jobs created in
enterprises Target
% of the
target
Estimated realization
I priority axis: Research and development of modern technologies 967 600 162% 2481
III priority axis: Capital for innovation 636 4 500 14% 2332
IV priority axis: Investments in innovative undertakings 17 840 42 550 42% 35 736
V - priority axis: Diffusion of innovation 20 1 350 1% 1 801
VIII - priority axis: Information society – increasing innovation of the economy 2 424 17 500 14% 4060
Source: Own elaboration based on the data from Managing Authorities; note that in the table the numbers are for jobs created in all enterprises, not only in SMEs.
When we compare new jobs created against the target, the effects of the OP in terms of the employment in firms are very modest. The number of new jobs is low relatively to the target, while in case of priority axis 5 only 20 new jobs have been created so far. The exception is priority axis 1, were the number of jobs is well above the target, but this might because of the low value that was set as the target, as well as the fact that after the reallocation of funds to this axis after reprogramming the target was not adjusted upwards.
A more promising picture arises from the data that is based on the contracts signed so far (See Table 6, column ‘estimated realization’). Still, though, if the estimates come true, the number of jobs created will only account for a half of the target in case of equity financing instruments, more than four fifths in case of innovative investments and only less than one fourth in case of ICT support. This is obviously below expectations.
From the analysis of the monitoring indicators it turns out that the OP, despite making Polish economy more innovative, fails to achieve the expected employment effects. In other words, the OP will not fulfil its goals related to employment, as shown in the indicators. Nevertheless, many jobs were actually created, the average employment among beneficiaries interviewed by PARP (2014a) is growing and beneficiaries that were interviewed during this case study also confirm that the OP is fully responsible for their employment growth.
4.3.3. Evidence on financing innovative enterprises at early stages of development
As we have seen from Figure 10, only limited amount was spent on equity financial instruments. The evidence from the evaluation study by WYG PSDB (2015) suggests that achievements in the area of equity financial instruments are rather poor. Disbursement rates to final recipients are low - until July 2014 the supported funds invested in SMEs only 22% of their capital28. Moreover, funds were waiting idle on the account of the fund manager and there was no link between the management fees and performance.
Surprisingly, available monitoring indicators do not show the apparent difficulties that financial instruments have experienced during their implementation (see Table 7). From Table 7 we cannot conclude how much OP resources have been invested as venture capital in innovative companies and how much private capital they leveraged.
28 See WYG PSDB (2015), p. 82.
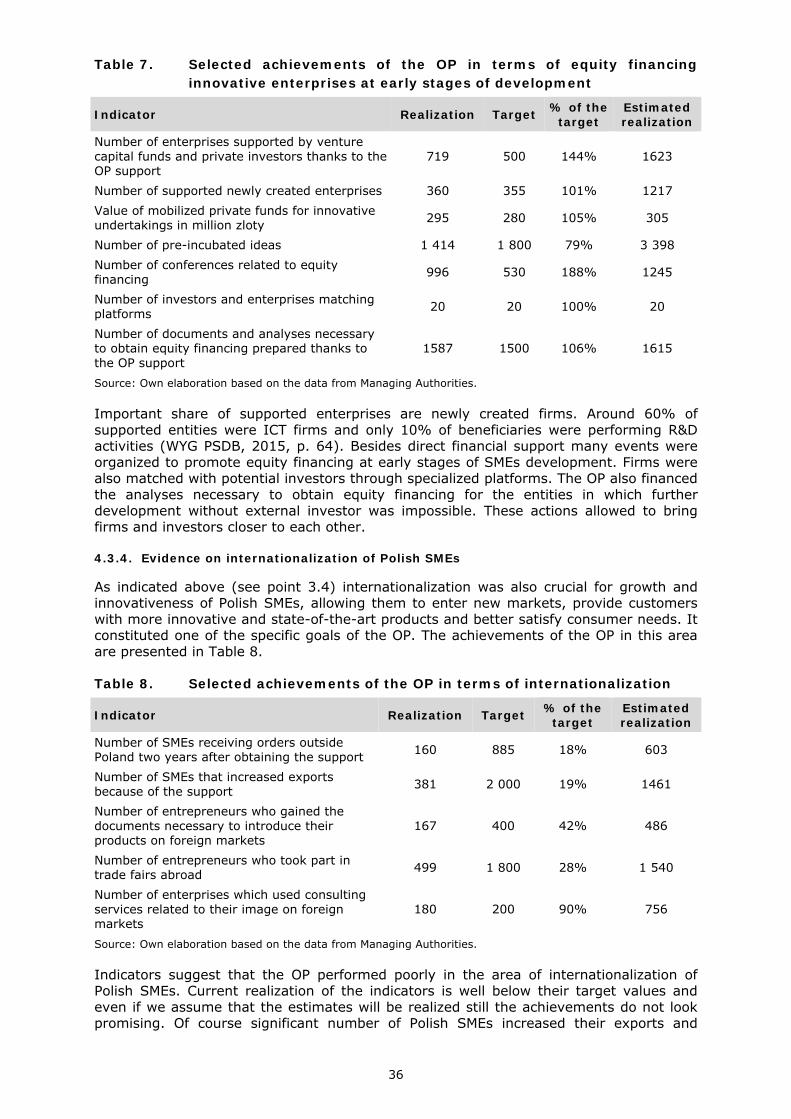
36
Table 7. Selected achievements of the OP in terms of equity financing innovative enterprises at early stages of development
Indicator Realization Target % of the target
Estimated realization
Number of enterprises supported by venture capital funds and private investors thanks to the OP support
719 500 144% 1623
Number of supported newly created enterprises 360 355 101% 1217 Value of mobilized private funds for innovative undertakings in million zloty 295 280 105% 305
Number of pre-incubated ideas 1 414 1 800 79% 3 398 Number of conferences related to equity financing 996 530 188% 1245
Number of investors and enterprises matching platforms 20 20 100% 20
Number of documents and analyses necessary to obtain equity financing prepared thanks to the OP support
1587 1500 106% 1615
Source: Own elaboration based on the data from Managing Authorities.
Important share of supported enterprises are newly created firms. Around 60% of supported entities were ICT firms and only 10% of beneficiaries were performing R&D activities (WYG PSDB, 2015, p. 64). Besides direct financial support many events were organized to promote equity financing at early stages of SMEs development. Firms were also matched with potential investors through specialized platforms. The OP also financed the analyses necessary to obtain equity financing for the entities in which further development without external investor was impossible. These actions allowed to bring firms and investors closer to each other.
4.3.4. Evidence on internationalization of Polish SMEs
As indicated above (see point 3.4) internationalization was also crucial for growth and innovativeness of Polish SMEs, allowing them to enter new markets, provide customers with more innovative and state-of-the-art products and better satisfy consumer needs. It constituted one of the specific goals of the OP. The achievements of the OP in this area are presented in Table 8.
Table 8. Selected achievements of the OP in terms of internationalization
Indicator Realization Target % of the target
Estimated realization
Number of SMEs receiving orders outside Poland two years after obtaining the support 160 885 18% 603
Number of SMEs that increased exports because of the support 381 2 000 19% 1461
Number of entrepreneurs who gained the documents necessary to introduce their products on foreign markets
167 400 42% 486
Number of entrepreneurs who took part in trade fairs abroad 499 1 800 28% 1 540
Number of enterprises which used consulting services related to their image on foreign markets
180 200 90% 756
Source: Own elaboration based on the data from Managing Authorities.
Indicators suggest that the OP performed poorly in the area of internationalization of Polish SMEs. Current realization of the indicators is well below their target values and even if we assume that the estimates will be realized still the achievements do not look promising. Of course significant number of Polish SMEs increased their exports and

37
started to receive orders from other countries, but these values are low relatively to the target.
There might be three explanations of this situation. First, Poland has a relatively large internal market and firms despite the incentives prefer to limit its operations to it and the OP intervention cannot do much here. Firms that are able to export already perform such activity, while others are reluctant to take it up and what they have now is good enough for them. Second, one must take into account that other countries were affected more severely by economic crisis, so their imports fell. This led to a decrease in exports from Poland, which affects the realization of indicators. Third, it might be too early to assess the achievements of the OP in the area of internationalization, as creating international trade ties is a gradual and long-term process. Over time we might observe enhanced exports of supported beneficiaries which is not clear when one looks at the already realized indicators.
The outcomes of the on-line survey among beneficiaries carried out by PARP (2012b), show that employment in firms supported by the instrument “passport to export” was actually falling after receiving the support. If beneficiaries were employing, they were using civil law contracts (contracts for specific services) instead of employment contracts. Fortunately, net revenues of beneficiaries on average were growing, especially those from exports.
4.4. Mechanisms and conditions
This section explores mechanisms and conditions related to a behavioural change within beneficiary SMEs and how the support was able to provoke the materialisation of significant changes in the development patterns of assisted SMEs.
4.4.1. Reorientation in business models – competing through innovation
Important mechanism in which the intervention of the OP affected the behaviour of Polish SMEs was a reorientation in their business models towards innovation. The goal was to change the way of competing from low costs into competing through innovative solutions. Of course this reorientation did not occur in every enterprise supported, but it took place in many of them, as confirmed by the interviews, and these changes are assumed to be sustainable.
The fall in the number of innovative enterprises is explained by the economic crisis that forced firms to cut their innovation expenditure. On the other hand it means that now innovative activity is concentrated in a smaller group of entities, which is a positive sign, as in this case innovation of better quality is implemented and now in Poland there is a group of innovation leaders. The OP allowed them to develop, consolidate and strengthen innovative attitudes. Now many Polish firms are not afraid to build up their competitive advantages on innovation. On the other hand, the intervention brings about unequal competition and for non-beneficiaries it might be more difficult to implement innovation.
4.4.2. Selection criteria
The criteria for project selection and the selection of experts evaluating projects constituted a crucial condition for the success of the OP instruments. Only the right and relevant criteria for project evaluation ensured that the projects fulfilled the OP objectives and that it was able to provoke anticipated changes in the beneficiary SMEs. Managing Authorities indicate that there was a trade-off between setting too specific and too general criteria – it was necessary to find the balance between the two, which not always occurred.
Evaluation studies and the interviews indicate that not all projects were of high quality and featured innovativeness. In project selection more emphasis was placed on transparency of the choice than real innovativeness assessment. Because of that not all implemented innovative solutions were particularly a novelty. Although they induced behavioural changes in supported enterprises they were not as ground-breaking as expected. It is important to indicate that the OP Innovative Economy was one of the

38
limited number of OPs, where the poor quality of selection criteria were subject to an official interruption in payments by the European Commission.
Another important issue that is related to project selection is the right choice of experts to assess them. The criteria alone are not enough to ensure that the right projects resulting in changes in enterprises will be chosen. They are crucial as the first stage of projects’ elimination, but in the case of further evaluation the experts’ views are key. Experts not only have to be knowledgeable, but also able to find the right balance between not being too rigorous and too lenient.
4.4.3. Bureaucracy
Important obstacle for obtaining the support raised by the beneficiaries in the interviews was bureaucracy related to the OP. The beneficiaries indicated that there was too much focus on details and not on the substance of the supported projects. During the application process for instance typos could contribute to project rejection. Over time, though, the beneficiaries were given the possibility to improve their application before the final assessment. Overall, the application process is considered too complicated, so that often the enterprises need to order preparing the applications at consulting firms.
The beneficiaries also claim that for them it was difficult to communicate with the officials, especially at regional level. They believe that lower-level officials do not understand the OP fully and that is why they generate unnecessary requirements related to controlling and reporting. There was also a claim that the indicators’ definitions were not clear and prone to different interpretations. It is then difficult for the beneficiaries to assess whether the indicator is already realized or not and whether it can be reported or not.
4.4.4. Network effects – SMEs and cooperation
It is important to take into account the fact that the economy will not become innovative if there is no innovation diffusion from more innovative entities to the other. Due to that network effects are crucial to ensure and consolidate behavioural changes in SMEs, especially related to innovation. The OP Innovative Economy also addressed these issues. The instruments supported both cooperation among enterprises and between enterprises and research entities.
It turns out that numerous enterprises were involved in cooperative relations and many new products were created thanks to this cooperation. Quantitatively this picture looks promising in general, but whether real mental changes in Polish SMEs occurred is hard to measure. The interviews indicate that many enterprises understand that it is beneficial for them to cooperate with each other and with research entities. Cluster cooperation is now in fashion in Poland.
Anyway, there is still a lot to be done in terms of social capital in Poland and these changes take place over time. The issue that seems problematic still is the business-university cooperation, but it appears that the problem lies not on the side of enterprises, but on the side of research entities. Some of the supported enterprises ordered R&D works abroad, because of the reluctance to cooperate in Polish research sector. It might be the case that Polish research needs a generational change, as younger researchers are eager to commercialize their research.
4.4.5. Business environment – business support institutions
To ensure behavioural changes in SMEs it is crucial not only to support them directly, but also to build the right environment in which they may operate. In this area there is a crucial role of business support institutions that should help behavioural changes in SMEs to occur. The need for appropriate business support institutions was also recognized and addressed through the OP instruments.
Thanks to the intervention, the significant infrastructural and capacity investments were made in business support institutions and the impressive number of firms (almost 9 thousand) used business support services that were offered. Unfortunately the quality of

39
these services was low, as they were in general simple, supply-driven and they were not corresponding to the expectations and needs of the companies. Polish business environment institutions failed to transform from low-quality entities providing simple services into innovation centres. This situation does not allow the supported SMEs to strengthen their innovation potential.
The main obstacle to enhancing the quality of business support institutions in the OP Innovative Economy is the fact that they are overly reliant on public funding. Nowadays, business support institutions offer services that were specified by the OP calls that is the supply side of these services is supported. In the next OP Smart Growth, which is the successor of Innovative Economy, the services will be financed from the demand side, i.e. the entrepreneurs will receive the funding and they will decide which services should be provided.

40
5. MAIN FINDINGS AND CONCLUSIONS
Over the last decade, the Polish economy has been converging to EU-15, being the only EU economy that avoided a recession in 2008-2010. Poland has built its impressive growth performance on low labour costs. However, as the country moves up the income ladder, cost competitiveness will deteriorate in the future. In order to grow further, Poland needs a new strategy aimed at enhancing competitiveness and productivity. As the experience of developed countries shows, such a strategy should be built on innovation and R&D. Currently, Poland lags behind its regional peers in innovation expenditure and innovation rankings, with private expenditure on R&D being especially low. As a result, specialisation of Polish SMEs is still biased towards low- or medium-low-technology goods.
Against this background, OP Innovative Economy is the most extensive public scheme tailored to support innovation in the EU in the years 2007-2013, with over EUR 5 billion allocated for SMEs. OP Innovative Economy aims at innovation-based growth through investing in innovative products and processes, facilitating technology transfer, stimulating the business environment, revamping the ICT infrastructure and improving cooperation between academia and the private sector. The majority of policy instruments in the OP Innovative Economy are targeted only or particularly on SMEs, taking into account their role in the economy and barriers to growth they face.
The analysis of the OP policy mix shows that OP Innovative Economy is a step forward when compared to the OP Improvement of the Competitiveness of Enterprises in the previous financial framework (2004-2006) in that is it is more focused on innovation. Examples of successful policy instruments to support innovation include technological credit and investments with high innovative potential. These instruments allowed firms to increase risk-taking by supporting early stage innovation projects and implement new innovative solutions, in particular product innovation. Support to R&D projects was also substantial, accounting to 18% of total allocation after reprogramming.
In terms of mode of delivery, grants were by far the most common form which was appropriate for the case of risky projects. In case of capital investment grants they should have been complemented by loans, given that these type of projects have stable and predictable cash that facilitates loan repayment.
The available evidence on the characteristics of the supported firms in industry suggests that most of them operate in low and medium-low technology sectors – both in terms of the number of projects (63 percent) and the share in the financial support (65 percent). On the contrary, in services the majority of firms operate in high-tech knowledge intensive sectors. Is there a rationale for focusing on the promotion of low-tech sectors? It appears that for countries still far removed from the technological frontier introducing innovation in low-tech sectors might actually yield the highest returns in terms of productivity gains. This is because firms in these countries manage to increase labour productivity by absorbing and benefiting from technologies developed elsewhere.
Overall, OP Innovative Economy has achieved some valuable results, in particular in fostering innovation and R&D in Poland. There is evidence that more than half of recent growth in R&D expenditure as a share of GDP is driven by ERDF. Moreover, studies suggest that the recent increase in the share of high-tech products in Polish exports is driven mainly by the ERDF funds.
The results are more modest in the area of jobs creation and internationalization of domestic firms. It should be noted that some indicators still might be improved given that many projects are on-going. Finally, it appears from interviews carried out during the evaluation that one intangible result is that the OP through numerous projects, workshops and conferences has created a kind of "fashion for innovation" among Polish firms.

41
ANNEX
List of policy instruments targeting SMEs
N Full name Measure Description Objective Mode of delivery Initial allocation (MEuro)
Reprogramming (MEuro)
1 Support to R&TD projects 1.4
The instrument supports R&D projects carried out by firms. Specifically, the projects should entail two phases: research phase and implementation phase. Firms can decide if they carry out the R&D activities on their own, or they outsource it.
Innovation Grant 390 447
2 Support to R&D projects in aviation sector - INNOLOT - Innovative aviation
1.5a The instrument gives support to R&D projects that develop new technologies for the aviation sector. Innovation Grant
105 105 3 Support to R&D projects in the TECH sector - Demonstrator+
1.5b
Support is given to projects that are carried out by firms and scientific consortia in the sector TECH. Sector TECH includes nanotechnology, new materials and technology, mechatronics, technology and chemical engineering.
Innovation Grant
4 Support to R&D projects in the INFO and BIO sectors - Demonstrator+
1.5c
Support is given to projects that are carried out by firms and scientific consortia in the sectors INFO and BIO. INFO and BIO sectors include advanced technologies in telecommunications, environment, agriculture and regenerative medicine.
Innovation Grant
5 Starting the innovative activity 3.1 Support is given to potential and newly created firms that are
built on innovation ideas, including spin offs. Innovation
Package: grants +consulting for newly created enterprises +provision of infrastructure and services
110 194
6 Support to capital funds 3.2
The instrument’s aim is to establish a fund that supports capital investments in SMEs. The fund provides financing for innovative enterprises at early stages of development, including risky investment.
Innovation Equity finance 180 71
7
Creation of a system that promotes investment in SMEs - Consulting services to SMEs
3.3a The instrument provides consulting services to SMEs in preparing documents and analyses for finding an external investor.
Growth Consulting, advice, technical assistance
50 29
8 A system project of the Polish Agency for Entrepreneurs Development
3.3b
Establishment and capitalization of the Fund for Innovation Financing. The Fund supports entrepreneurs and potential entrepreneurs with innovative ideas. Financing is given under the condition that entrepreneurs also find private investors/venture capital.
Innovation Grant

42
N Full name Measure Description Objective Mode of delivery Initial allocation (MEuro)
Reprogramming (MEuro)
9 Implementation of results of R&D work 4.1
Projects supported by this policy instrument are those support also by Policy Instrument 1. As such this instrument is a continuation of Instrument 1. Entrepreneurs receive support for accomplishing R&D work and implementing it in practice.
Innovation Grant 390 321
10 Promoting R&D activities of enterprises 4.2
The instrument supports individual projects which are aimed at increasing R&D activities of individual entrepreneurs and promoting use of industrial design.
Innovation Package: grants +consulting services +training
186 186
11 Technological credit 4.3 The instrument provides financing of individual projects from the Technological fund. Entrepreneurs from SMEs that implement new technologies are eligible for financing.
Innovation Package: grants +consulting services 410 433
12 New investments with high potential of innovation 4.4
The instrument supports the projects that support new investments in new highly innovative organisational and technological solutions in production and services.
Innovation Package: grants +consulting services +training
1420 1725
13 Support to investment of great significance for the economy
4.5
The instrument supports the projects that support new investments of enterprises from the production sector that use innovative solutions of great significance for economy due to the size of investments and number of new jobs created. Projects support investments in manufacturing and services.
Growth Grant 1024 817
14 Support to development of cooperative relations on a supra-regional scale
5.1
The instrument supports the projects that promote cooperation networks of SMEs and business support institutions, including investment and consulting networks. These networks should promote diffusion of innovation within a network.
Growth Package: grants +consulting services +training
104 105
15 Individual project "Academic incubators of entrepreneurship"
5.2a The instrument supports the projects aimed at incubation of business ideas and start-ups. Main group of beneficiaries consists of researchers that are starting their own business.
Innovation AND Growth
Package: consulting and accounting services +training +search of business partners
66 66
16 Projects aiming at developing institutions of business support
5.2b
The instrument provides financing to institutions of business support that provide entrepreneurs with consulting services, training. These institutions should help entrepreneurs in their innovative activities.
Growth Package: consulting services +training +search of business partners
17 Promoting innovation centres 5.3
The instrument support the projects that promote the creation of technological parks that are located in growth centres. Technological parks provide consulting and other services for SMEs.
Innovation AND Growth
Package: consulting and accounting services +training +search of business partners
190 249
18 Management of intellectual property rights 5.4
This instrument covers expenses of SMEs on registering patents. This leads to a better protection of intellectual and industrial property rights of entrepreneurs.
Innovation Grant 39 25

43
N Full name Measure Description Objective Mode of delivery Initial allocation (MEuro)
Reprogramming (MEuro)
19 Passport to export 6.1 This instrument finances participation of SMEs in international trade fairs and foreign business trips; supports search of foreign partners; provides consulting services to SMEs; etc.
Growth Package: grants +consulting services 122 82
20 Support to business assistance centres' network 6.2.1
This instrument supports the creation of business assistance centres (BAC) in cooperation with Marszalkowski regional government. BAC provides informational services to enterprises on exporting and foreign investment.
Growth Consulting, advice, technical assistance 12 32
21 Support to studies that prepare investment projects 6.2.2
This policy instrument supports studies that are aimed at development of investment projects, such as studies on land use for investment; geotechnical studies of land; studies on investment barriers and investment climate; etc.
Growth Grant 20 14
22
Projects that support participations of Polish enterprises in promotion campaigns
6.5.2 It support the projects aiming at supporting participation of Polish enterprises in promotion campaigns in different sectors of the economy.
Growth Grant 21 34
23 Promotion of the Polish economy on international markets
6.5.1
This policy instrument is aimed at improving the image of the Polish firms. This includes developing of the interactive information system for Polish entrepreneurs; informational and promotion campaigns abroad; sectoral promotional campaigns; etc.
Growth Information campaign, events, seminars 57 53
24 Support to activities in the area of digital economy 8.1 This instrument finances projects that provide e-services e.g. e-
commerce. Innovation Package: grants +consulting services +training
391 324
25 Supporting eServices between enterprises (B2B) 8.2
This instrument finances the implementation of B2B communication system in SMEs. They lead to cooperation between enterprises in digital form.
Innovation Package: grants +consulting services +training
461 372
26 Support to providing the access to the broadband Internet
8.4 This instrument finances SMEs that provide access to the broadband Internet in regions where this activity is economically unprofitable.
Innovation Package: grants +training 200 199

44
REFERENCES
CASE Advisors Sp. z o.o. (2008), „Analiza prawidłowości doboru wskaźników monitorowania dla PO IG”, in Polish.
CASE Advisors Sp. z o.o. (2010), „Ewaluacja funkcjonowania systemu oceny i wyboru projektów w ramach PO IG – etap II – po rozpoczęciu rund aplikacyjnych”, in Polish.
Central Statistical Office Poland (GUS) (2013), “Statistical Yearbook of the Republic of Poland, 2013”, Warszawa.
Central Statistical Office Poland (GUS) (2014), “Activity of non-financial enterprises in 2012”, Warszawa.
Central Statistical Office Poland (GUS) data, downloaded at http://stat.gov.pl/bdl/app/strona.html?p_name=indeks.
Cieślik, J. (2014), “Gazele polskie i amerykańskie”, in Polish, Gazele Biznesu.
European Bank for Reconstruction and Development (EBRD) (2014), “Transition report 2014. Innovation in Transition”.
European Commission (EC) (2014), “The Small Business Act (SBA) for Europe Fact Sheet - Poland”, Enterprise and Industry, European Commission.
European Commission (EC) (2015), “Innovation Union Scoreboard”, European Commission.
Eurostat data, downloaded at http://epp.eurostat.ec.europa.eu/portal/page/portal/statistics/themes.
Gorgol, P., Kotrasiński, J., Weremiuk, A. (2012), „Metaewaluacja wyników badań ewaluacyjnych Programu Operacyjnego Innowacyjna Gospod EXPERT EVALUATION
Gorzelak, G. and M. Kozak (2010) “Network delivering policy analysis on the performance of cohesion policy 2007-2013; Task 2: Country report on achievements of Cohesion Policy Poland, 2007-2013”, Warsaw.
Grossman, G., Helpman, E. (1992), Innovation and Growth in the Global Economy, MIT Press, Cambridge.
Millward Brown S.A. and Ośrodek Przetwarzania Informacji – Państwowy Ośrodek Badawczy (2014), „Ewaluacja instrumentów wsparcia B+R w ramach perspektywy finansowej 2007-2013”, in Polish.
Ministry of Infrastructure and Development (2013), “Operational Programme Innovative Economy, 2007-2013”, in Polish.
Ministry of Infrastructure and Development (2014), “Operational Programme Innovative Economy Annual Implementation Report 2013”, in Polish.
Ministry of Infrastructure and Development (2014), “Detailed description of priorities of the Operational Programme Innovative Economy, 2007-2013”, (nineteenth version), in Polish.
Ministry of Regional Development (2009), “Operational Programme Innovative Economy Annual Implementation Report 2008”, in Polish.
Ministry of Regional Development (2010), “Operational Programme Innovative Economy Annual Implementation Report 2009”, in Polish.

45
Ministry of Regional Development (2011), “Operational Programme Innovative Economy Annual Implementation Report 2010”, in Polish.
Ministry of Regional Development (2012), “Operational Programme Innovative Economy Annual Implementation Report 2011”, in Polish.
Ministry of Regional Development (2013), “Operational Programme Innovative Economy Annual Implementation Report 2012”, in Polish.
OECD (2010), “OECD Economic Surveys: Poland 2010”, OECD Publishing, Paris.
OECD (2014), “OECD Science, Technology and Industry Outlook 2014”, OECD Publishing. http://dx.doi.org/10.1787/sti_outlook-2014-en.
Policy & Action Group Uniconsult Sp. z o. o. (2011), “Ocena stanu realizacji 3, 4, 5 i 6 priorytetu PO IG w połowie okresu programowania”, in Polish.
Policy & Action Group Uniconsult Sp. z o. o. and Laboratorium Badań Społecznych Sp. z o. o. (2012), “Ewaluacja komplementarności i efektywności wsparcia instytucji otoczenia biznesu świadczących usługi dla przedsiębiorstw”, in Polish.
Policy & Action Group Uniconsult Sp. z o.o. and Taylor Economics sp. z o.o. (2013), “Ocena realizacji instrumentów inżynierii finansowej w ramach NSRO 2007-2013. Raport końcowy, in Polish.
Polish Agency of Enterprise Development (2012a), “Barometr Innowacyjności, Ewaluacja on-going Działań 1.4- 4.1, 3.3.2, 4.2, 4.4, 5.4.1, 6.1, 8.1 i 8.2 PO IG”, in Polish.
Polish Agency of Enterprise Development (2012b), “Barometr Innowacyjności, Ewaluacja on-going Działania 6.1 PO IG”, in Polish.
Polish Agency of Enterprise Development (2013a), “Raport o stanie sektora małych i średnich przedsiębiorstw w Polsce w latach 2011-2012”, in Polish, Warsaw.
Polish Agency of Enterprise Development (2013b), “Świt innowacyjnego społeczeństwa. Trendy na najbliższe lata”, in Polish, Warsaw.
Polish Agency for Enterprise Development (PARP) (2013c), “Spowolnienie gospodarcze oczami polskich przedsiębiorców”, in Polish, Warsaw.
Polish Agency of Enterprise Development (2013d), “Barometr Innowacyjności, Ewaluacja on-going Działań 1.4- 4.1, 3.3.2, 4.2, 4.4, 5.4.1, 6.1, 8.1 i 8.2 PO IG”, in Polish.
Polish Agency of Enterprise Development (2014a), “Barometr Innowacyjności, Ewaluacja on-going Działań 1.4- 4.1, 3.3.2, 4.2, 4.4, 5.4.1, 6.1, 8.1 i 8.2 PO IG”, in Polish.
Polish Agency of Enterprise Development (2014b), “Raport o stanie sektora małych i średnich przedsiębiorstw w Polsce w latach 2012–2013“, in Polish, Warsaw.
The World Bank (2013), “Poland enterprise innovation support review: from catching up to moving ahead”, Poland enterprise innovation support review.
The World Bank’s ease of doing business index data, downloaded at http://www.doingbusiness.org/rankings.
WYG PSDB Sp. z o.o. (2010), “Ocena realizacji PO IG w kontekście krajowych dokumentów strategicznych”, in Polish.
WYG PSDB Sp. z o.o. (2011), “Ocena komplementarności interwencji w ramach Programu Operacyjnego Innowacyjna Gospodarka z innymi programami finansowanymi z funduszy Unii Europejskiej”, in Polish.

46
WYG PSDB Sp. z o.o. (2014), “Ocena wpływu Programu Operacyjnego Innowacyjna Gospodarka na zwiększenie innowacyjności przedsiębiorstw. Raport końcowy”, in Polish.
WYG PSDB Sp. z o.o. (2015), “Uzupełniająca analiza ex ante dla instrumentu finansowego w obszarze otwartych innowacji. Raport końcowy”, in Polish.

47
LIST OF INTERVIEWEES Name Position Affiliation Date
Managing Authority
Katarzyna Kaczkowska Chief of the Individual Projects Division
Competitiveness and Innovation Department, Ministry of Infrastructure and Development
18.03.2015
Tomasz Kula Head of the Analysis and Evaluation Team
Competitiveness and Innovation Department, Ministry of Infrastructure and Development
18.03.2015
Agata Miętek Acting Chief of the Contracts and Public Assistance Division
Competitiveness and Innovation Department, Ministry of Infrastructure and Development
18.03.2015
Aneta Sobota-Białas Chief of the Monitoring Division Competitiveness and Innovation Department, Ministry of Infrastructure and Development
18.03.2015
Intermediate and Implementing Bodies
Małgorzata Szczepańska Director Department of Implementing Operational Programmes, Ministry of Economy
27.03.2015
Beata Lubos Chief of the Innovation Policy Division
Department of Innovation and Industry Ministry of Economy 17.03.2015
Dariusz Szymańczak Director Modern Economy Infrastructure Department, Polish Agency of Enterprise Development
18.03.2015
Radosław Runowski Director e-Economy Support Department, Polish Agency of Enterprise Development
19.03.2015
Maciej Ziarko Acting Director Innovation Support Department, Polish Agency of Enterprise Development
01.04.2015
Izabela Banaś Head of Section Department of R&D Business Support, Polish Agency of Enterprise Development
11.03.2015
Marcin Seniuk Head of Section Department of Business Environment Institutions Support, Polish Agency of Enterprise Development
12.03.2015
Marek Ulman Head of Section Department of Business Environment Institutions Support, Polish Agency of Enterprise Development
12.03.2015
Marta Mioduszewska Chief of the Management, Programming and Evaluation Division
Department of Implementing Operational Programmes Ministry of Economy
10.04.2015
Marzena Strojecka Chief of the Division for Receiving and Evaluation of Applications
Department of Implementing Operational Programmes Ministry of Economy
10.04.2015
Marzena Tymińska-Ładziak Deputy Director EU Programmes Department, Bank
Gospodarstwa Krajowego 13.04.2015
Economic and Social Partners
Jerzy Bujok Project Office Director Krajowa Izba Gospodarcza (business association) 02.04.2015
Norbert Pruszanowski Director of the EU Funds Team Związek Rzemiosła Polskiego (business association) 09.04.2015
Agnieszka Tomińska Expert at the EU Funds Department
Pracodawcy Rzeczypospolitej Polskiej (employers’ association) 09.04.2015
Kazimierz Siciński Member of the Presidium, National Science Section NSZZ “Solidarność” (trade union)
Final beneficiaries
Kamil Ziarnik Assistant to the Management Board for legal issues Globema sp. z o. o. 31.03.2015
Mariusz Budner Project Coordinator Feromedia 01.04.2015 Agnieszka Sowa Accountant Scansani sp. z o. o. 15.04.2015 Marek Gzowski TV-EURO-SAT 23.04.2015
Independent Experts/Journalists Marcin Piątkowski Senior Economist World Bank 25.03.2015 Adam Miller Competition Division Director WYG PSDB 07.04.2015 Monika Niewinowska Journalist Promedion 09.04.2015
Julian Zawistowski Chairman of the Management Board IMAPP 10.04.2015

Europe Direct is a service to help you find answers to your questions about the European Union.
Freephone number (*):
00 800 6 7 8 9 10 11
(*) The information given is free, as are most calls (though some operators, phone boxes or hotels may charge you).
LEGAL NOTICE
This document has been prepared for the European Commission however it reflects the views only of the authors, and the Commission cannot be held responsible for any use which may be made of the information contained therein.
More information on the European Union is available on the Internet (http://www.europa.eu).
© European Union, 2015 Reproduction is authorised provided the source is acknowledged.