Stylometry with R: A Package for Computational Text Analysis · CONTRIBUTED RESEARCH ARTICLES 108...
15
CONTRIBUTED RESEARCH ARTICLES 107 Stylometry with R: A Package for Computational Text Analysis by Maciej Eder, Jan Rybicki and Mike Kestemont Abstract This software paper describes ‘Stylometry with R’ (stylo), a flexible R package for the high- level analysis of writing style in stylometry. Stylometry (computational stylistics) is concerned with the quantitative study of writing style, e.g. authorship verification, an application which has considerable potential in forensic contexts, as well as historical research. In this paper we introduce the possibilities of stylo for computational text analysis, via a number of dummy case studies from English and French literature. We demonstrate how the package is particularly useful in the exploratory statistical analysis of texts, e.g. with respect to authorial writing style. Because stylo provides an attractive graphical user interface for high-level exploratory analyses, it is especially suited for an audience of novices, without programming skills (e.g. from the Digital Humanities). More experienced users can benefit from our implementation of a series of standard pipelines for text processing, as well as a number of similarity metrics. Introduction Authorship is a topic which continues to attract considerable attention with the larger public. This claim is well illustrated by a number of high-profile case studies that have recently made headlines across the popular media, such as the attribution of a pseudonymously published work to acclaimed Harry Potter novelist, J. K. Rowling (Juola, 2013), or the debate surrounding the publication of Harper Lee’s original version of To Kill a Mocking Bird and the dominant role which her editor might have played therein (Gamerman, 2015). The authorship of texts clearly matters to readers across the globe (Love, 2002) and therefore it does not come as a surprise that computational authorship attribution increasingly attracts attention in science, because of its valuable real-world applications, for instance, related to forensics topics such as plagiarism detection, unmasking the author of harassment messages or even determining the provenance of bomb letters in counter-terrorism research. Interestingly, the methods of stylometry are also actively applied in the Humanities, where multiple historic authorship problems in literary studies still seek a definitive solution – the notorious Shakespeare-Marlowe controversy is perhaps the best example in this respect. Authorship attribution plays a prominent role in the nascent field of stylometry, or the computa- tional analysis of writing style (Juola, 2006; Stamatatos et al., 2000; Stamatatos, 2009; Koppel et al., 2009; Van Halteren et al., 2005). While this field has important historical precursors (Holmes, 1994, 1998), recent decades have witnessed a clear increase in the scientific attention for this problem. Because of its emergent nature, replicability and benchmarking still pose significant challenges in the field (Stamatatos, 2009). Publicly available benchmark data sets are hard to come across, mainly because of copyright and privacy issues, and there are only a few stable, cross-platform software packages out there which are widely used in the community. Fortunately, a number of recent initiatives lead the way in this respect, such as the recent authorship tracks in the PAN competition (http://pan.webis.de), where e.g. relevant data sets are efficiently interchanged. In this paper we introduce ‘Stylometry with R’ (stylo), a flexible R package for the high-level stylistic analysis of text collections. This package explicitly seeks to further contribute to the recent development in the field towards a more advanced level of replicability and benchmarking in the field. Stylometry is a multidisciplinary research endeavor, attracting contributions from divergent scientific domains, which include researchers from Computer Science – with a fairly technical background – as well as experts from the Humanities – who might lack the computational skills which would allow them easy access to the state-of-the-art methods in the field (Schreibman et al., 2004). Importantly, this package has the potential to help bridge the methodological gap luring between these two communities of practice: on the one hand, stylo’s API allows to set up a complete processing pipeline using traditional R scripting; on the other hand, stylo also offers a rich graphical user interface which allows non-technical, even novice practitioners to interface with state-of-the-art methods without the need for any programming experience. Overview of stylometry Stylometry deals with the relationship between the writing style in texts and meta-data about those texts (such as date, genre, gender, authorship). Researchers in ‘stylochronometry’, for instance, are interested in inferring the date of composition of texts on the basis of stylistic aspects (Stamou, 2008; The R Journal Vol. 8/1, Aug. 2016 ISSN 2073-4859
-
Upload
trinhxuyen -
Category
Documents
-
view
218 -
download
3
Transcript of Stylometry with R: A Package for Computational Text Analysis · CONTRIBUTED RESEARCH ARTICLES 108...

CONTRIBUTED RESEARCH ARTICLES 107
Stylometry with R: A Package forComputational Text Analysisby Maciej Eder, Jan Rybicki and Mike Kestemont
Abstract This software paper describes ‘Stylometry with R’ (stylo), a flexible R package for the high-level analysis of writing style in stylometry. Stylometry (computational stylistics) is concerned with thequantitative study of writing style, e.g. authorship verification, an application which has considerablepotential in forensic contexts, as well as historical research. In this paper we introduce the possibilitiesof stylo for computational text analysis, via a number of dummy case studies from English and Frenchliterature. We demonstrate how the package is particularly useful in the exploratory statistical analysisof texts, e.g. with respect to authorial writing style. Because stylo provides an attractive graphical userinterface for high-level exploratory analyses, it is especially suited for an audience of novices, withoutprogramming skills (e.g. from the Digital Humanities). More experienced users can benefit from ourimplementation of a series of standard pipelines for text processing, as well as a number of similaritymetrics.
Introduction
Authorship is a topic which continues to attract considerable attention with the larger public. Thisclaim is well illustrated by a number of high-profile case studies that have recently made headlinesacross the popular media, such as the attribution of a pseudonymously published work to acclaimedHarry Potter novelist, J. K. Rowling (Juola, 2013), or the debate surrounding the publication of HarperLee’s original version of To Kill a Mocking Bird and the dominant role which her editor might haveplayed therein (Gamerman, 2015). The authorship of texts clearly matters to readers across the globe(Love, 2002) and therefore it does not come as a surprise that computational authorship attributionincreasingly attracts attention in science, because of its valuable real-world applications, for instance,related to forensics topics such as plagiarism detection, unmasking the author of harassment messagesor even determining the provenance of bomb letters in counter-terrorism research. Interestingly, themethods of stylometry are also actively applied in the Humanities, where multiple historic authorshipproblems in literary studies still seek a definitive solution – the notorious Shakespeare-Marlowecontroversy is perhaps the best example in this respect.
Authorship attribution plays a prominent role in the nascent field of stylometry, or the computa-tional analysis of writing style (Juola, 2006; Stamatatos et al., 2000; Stamatatos, 2009; Koppel et al., 2009;Van Halteren et al., 2005). While this field has important historical precursors (Holmes, 1994, 1998),recent decades have witnessed a clear increase in the scientific attention for this problem. Becauseof its emergent nature, replicability and benchmarking still pose significant challenges in the field(Stamatatos, 2009). Publicly available benchmark data sets are hard to come across, mainly because ofcopyright and privacy issues, and there are only a few stable, cross-platform software packages outthere which are widely used in the community. Fortunately, a number of recent initiatives lead the wayin this respect, such as the recent authorship tracks in the PAN competition (http://pan.webis.de),where e.g. relevant data sets are efficiently interchanged.
In this paper we introduce ‘Stylometry with R’ (stylo), a flexible R package for the high-levelstylistic analysis of text collections. This package explicitly seeks to further contribute to the recentdevelopment in the field towards a more advanced level of replicability and benchmarking in the field.Stylometry is a multidisciplinary research endeavor, attracting contributions from divergent scientificdomains, which include researchers from Computer Science – with a fairly technical background – aswell as experts from the Humanities – who might lack the computational skills which would allowthem easy access to the state-of-the-art methods in the field (Schreibman et al., 2004). Importantly,this package has the potential to help bridge the methodological gap luring between these twocommunities of practice: on the one hand, stylo’s API allows to set up a complete processing pipelineusing traditional R scripting; on the other hand, stylo also offers a rich graphical user interface whichallows non-technical, even novice practitioners to interface with state-of-the-art methods without theneed for any programming experience.
Overview of stylometry
Stylometry deals with the relationship between the writing style in texts and meta-data about thosetexts (such as date, genre, gender, authorship). Researchers in ‘stylochronometry’, for instance, areinterested in inferring the date of composition of texts on the basis of stylistic aspects (Stamou, 2008;
The R Journal Vol. 8/1, Aug. 2016 ISSN 2073-4859

CONTRIBUTED RESEARCH ARTICLES 108
Juola, 2007). Authorship studies are currently the most popular application of stylometry. Fromthe point of view of literary studies, stylometry is typically concerned with a number of recenttechniques from computational text analysis that are sometimes termed ‘distant reading’, ‘not reading’or ‘macroanalysis’ (Jockers, 2013). Instead of the traditional practice of ‘close reading’ in literaryanalysis, stylometry does not set out from a single direct reading; instead, it attempts to explore largetext collections using computational techniques (and often visualization). Thus, stylometry tries toexpand the scope of inquiry in the humanities by scaling up research resources to large text collectionsin order to find relationships and patterns of similarity and difference invisible to the eye of the humanreader.
Usually, stylometric analyses involve a complex, multi-stage pipeline of (i) preprocessing, (ii)feature extraction, (iii) statistical analysis, and finally, (iv) presentation of results, e.g. via visualization.To this end, researchers presently have to resort to an ad hoc combination of proprietary, language-dependent tools that cannot easily be ported across different platforms. Such solutions are difficultto maintain and exchange across (groups of) individual researchers, preventing straightforwardreplication of research results and reuse of existing code. stylo, the package presented, offers a rich,user-friendly suite of functionality that is ideally suited for fast exploratory analysis of textual corporaas well as classification tasks such as are needed in authorship attribution. The package offers animplementation of the main methods currently dominant in the field. Its main advantage therefore liesin the integration of typical (e.g. preprocessing) procedures from stylometry and statistical functionalityby other, external libraries. Written in the R language, the source code and binaries for the packageare freely available from the Comprehensive R Archive Network, guaranteeing a straightforwardinstallation process across different platforms (both Unix- and Windows-based operating systems).The code is easily adaptable and extensible: the developers therefore continue to welcome usercontributions, feedback and feature requests. Our code is open source and GPL-licensed: it is beingactively developed on GitHub.1
In the rest of this paper, we will first illustrate the functionality of the package for unsupervisedmultivariate analysis through the high-level function stylo(). Secondly, we will discuss a numberof graphical user interfaces which we provide for quick exploration of corpora, in particular bynovice users or students in an educational setting, as well as for scholars in the Humanities withoutprogramming experience. Next, we move on to the function classify(), implementing a number ofsupervised classification procedures from the field of Machine Learning. Finally, we concisely discussthe oppose(), rolling.delta() and rolling.classify() functionality which allow, respectively, toinspect differences in word usage between two subsets of a corpus, and to study the evolution of thewriting style in a text.
Overview of the package
Downloading, installing and loading stylo is straightforward. The package is available at CRAN andat GitHub repository. The main advantages and innovative features of stylo include:
Feature extraction
Crucial in stylometry is the extraction of quantifiable features related to the writing style of texts(Sebastiani, 2002). A wide range of features have been proposed in the literature, considerably varyingin complexity (Stamatatos, 2009). ‘Stylometry with R’ focuses on features that can be automaticallyextracted from texts, i.e. without having to resort to language-dependent preprocessing tools. Thefeatures that the package allows to extract are n-grams on token- and character level (Houvardasand Stamatatos, 2006; Kjell, 1994). Apart from the fact that this makes the package considerablylanguage-independent, such shallow features have been shown to work well for a variety of tasks instylometry (Daelemans, 2013; Kestemont, 2014). Moreover, users need not annotate their text materialsusing domain-specific tools before analyzing them with ‘Stylometry with R’. Apart from the standardusage, however, the package does allow the users to load their own annotated corpora, provided thatthis is preceded by some text pre-processing tasks. An example of such a non-standard procedurewill be shown below. Thus, stylo does not aim to supplant existing, more targeted tools and packagesfrom Natural Language Processing (Feinerer et al., 2008) but it can easily accommodate the output ofsuch tools as a part of its processing pipeline.
1https://github.com/computationalstylistics/stylo
The R Journal Vol. 8/1, Aug. 2016 ISSN 2073-4859
CONTRIBUTED RESEARCH ARTICLES 109
Metrics
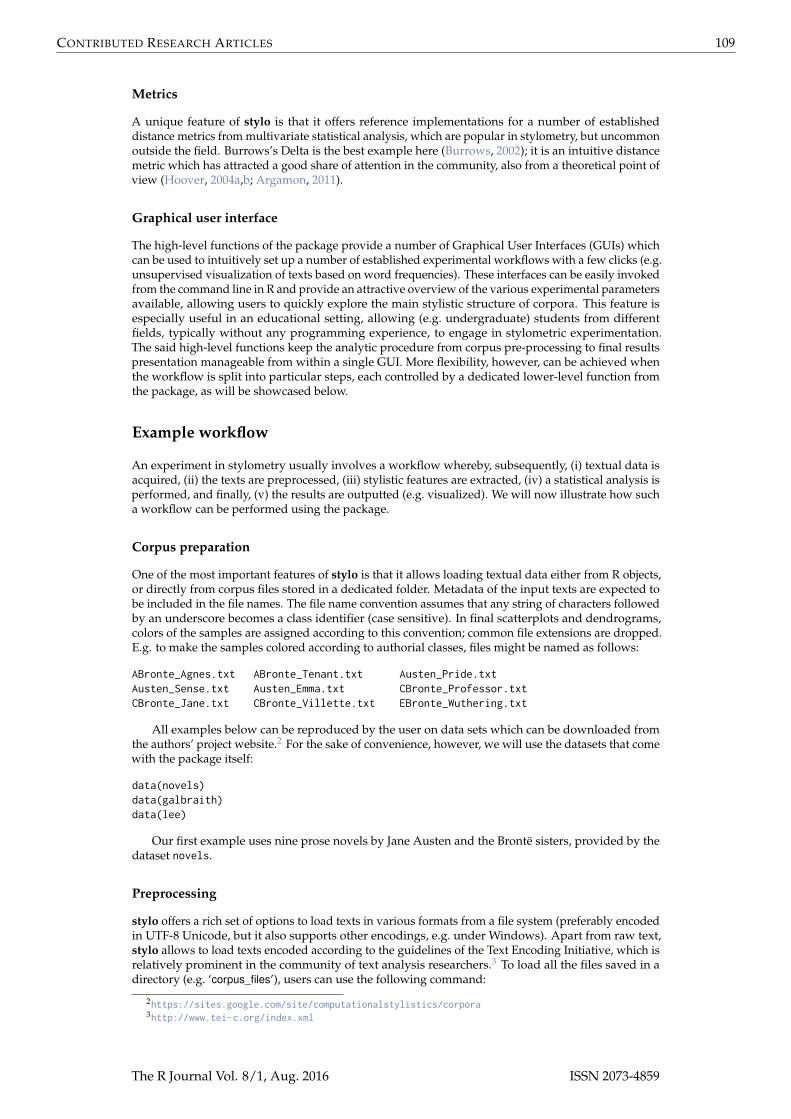
A unique feature of stylo is that it offers reference implementations for a number of establisheddistance metrics from multivariate statistical analysis, which are popular in stylometry, but uncommonoutside the field. Burrows’s Delta is the best example here (Burrows, 2002); it is an intuitive distancemetric which has attracted a good share of attention in the community, also from a theoretical point ofview (Hoover, 2004a,b; Argamon, 2011).
Graphical user interface
The high-level functions of the package provide a number of Graphical User Interfaces (GUIs) whichcan be used to intuitively set up a number of established experimental workflows with a few clicks (e.g.unsupervised visualization of texts based on word frequencies). These interfaces can be easily invokedfrom the command line in R and provide an attractive overview of the various experimental parametersavailable, allowing users to quickly explore the main stylistic structure of corpora. This feature isespecially useful in an educational setting, allowing (e.g. undergraduate) students from differentfields, typically without any programming experience, to engage in stylometric experimentation.The said high-level functions keep the analytic procedure from corpus pre-processing to final resultspresentation manageable from within a single GUI. More flexibility, however, can be achieved whenthe workflow is split into particular steps, each controlled by a dedicated lower-level function fromthe package, as will be showcased below.
Example workflow
An experiment in stylometry usually involves a workflow whereby, subsequently, (i) textual data isacquired, (ii) the texts are preprocessed, (iii) stylistic features are extracted, (iv) a statistical analysis isperformed, and finally, (v) the results are outputted (e.g. visualized). We will now illustrate how sucha workflow can be performed using the package.
Corpus preparation
One of the most important features of stylo is that it allows loading textual data either from R objects,or directly from corpus files stored in a dedicated folder. Metadata of the input texts are expected tobe included in the file names. The file name convention assumes that any string of characters followedby an underscore becomes a class identifier (case sensitive). In final scatterplots and dendrograms,colors of the samples are assigned according to this convention; common file extensions are dropped.E.g. to make the samples colored according to authorial classes, files might be named as follows:
ABronte_Agnes.txt ABronte_Tenant.txt Austen_Pride.txtAusten_Sense.txt Austen_Emma.txt CBronte_Professor.txtCBronte_Jane.txt CBronte_Villette.txt EBronte_Wuthering.txt
All examples below can be reproduced by the user on data sets which can be downloaded fromthe authors’ project website.2 For the sake of convenience, however, we will use the datasets that comewith the package itself:
data(novels)data(galbraith)data(lee)
Our first example uses nine prose novels by Jane Austen and the Brontë sisters, provided by thedataset novels.
Preprocessing
stylo offers a rich set of options to load texts in various formats from a file system (preferably encodedin UTF-8 Unicode, but it also supports other encodings, e.g. under Windows). Apart from raw text,stylo allows to load texts encoded according to the guidelines of the Text Encoding Initiative, which isrelatively prominent in the community of text analysis researchers.3 To load all the files saved in adirectory (e.g. ‘corpus_files’), users can use the following command:
2https://sites.google.com/site/computationalstylistics/corpora3http://www.tei-c.org/index.xml
The R Journal Vol. 8/1, Aug. 2016 ISSN 2073-4859

CONTRIBUTED RESEARCH ARTICLES 110
raw.corpus <- load.corpus(files = "all", corpus.dir = "corpus_files",encoding = "UTF-8")
If the texts are annotated in e.g. XML, an additional pre-processing procedure might be needed:
corpus.no.markup <- delete.markup(raw.corpus, markup.type = "xml")
Since the dataset that we will use has no annotation, the markup deletion can be omitted. We startthe procedure with making the data visible for the user:
data(novels)summary(novels)
To preprocess the data, stylo offers a number of tokenizers that support a representative set ofEuropean languages, including English, Latin, German, French, Spanish, Dutch, Polish, Hungarian,as well as basic support for non-Latin alphabets such as Korean, Chinese, Japanese, Hebrew, Arabic,Coptic and Greek. Tokenization refers to the process of dividing a string of input texts into countableunits, such as word tokens. To tokenize the English texts, e.g. splitting items as ‘don’t’ into ‘do’ and‘n’t’ and lowercasing all words, the next command is available:
tokenized.corpus <- txt.to.words.ext(novels, language = "English.all",preserve.case = FALSE)
The famous first sentence of Jane Austen’s Pride and Prejudice, for instance, looks like this in itstokenized version (the 8th to the 30th element of the corresponding vector):
tokenized.corpus$Austen_Pride[8:30]
[1] "it" "is" "a" "truth" "universally"[6] "acknowledged" "that" "a" "single" "man"[11] "in" "possession" "of" "a" "good"[16] "fortune" "must" "be" "in" "want"[21] "of" "a" "wife"
To see basic statistics of the tokenized corpus (number of texts/samples, number of tokens inparticular texts, etc.), one might type:
summary(tokenized.corpus)
For complex scripts, such as Hebrew, custom splitting rules could easily be applied:
tokenized.corpus.custom.split <- txt.to.words(tokenized.corpus,splitting.rule = "[^A-Za-z\U05C6\U05D0-\U05EA\U05F0-\U05F2]+",preserve.case = TRUE)
A next step might involve ‘pronoun deletion’. Personal pronouns are often removed in stylometricstudies because they tend to be too strongly correlated with the specific topic or genre of a text(Pennebaker, 2011), which is an unwanted artefact in e.g. authorship studies (Hoover, 2004a,b). Listsof pronouns are available in stylo for a series of languages supported. They can be accessed via forexample:
stylo.pronouns(language = "English")
[1] "he" "her" "hers" "herself" "him"[6] "himself" "his" "i" "me" "mine"[11] "my" "myself" "our" "ours" "ourselves"[16] "she" "thee" "their" "them" "themselves"[21] "they" "thou" "thy" "thyself" "us"[26] "we" "ye" "you" "your" "yours"[31] "yourself"
Removing pronouns from the analyses (much like stopwords are removed in Information Retrievalanalyses) is easy in stylo, using the delete.stop.words() function:
corpus.no.pronouns <- delete.stop.words(tokenized.corpus,stop.words = stylo.pronouns(language = "English"))
The above procedure can also be used to exclude any set of words from the input corpus.
The R Journal Vol. 8/1, Aug. 2016 ISSN 2073-4859
CONTRIBUTED RESEARCH ARTICLES 111
Features
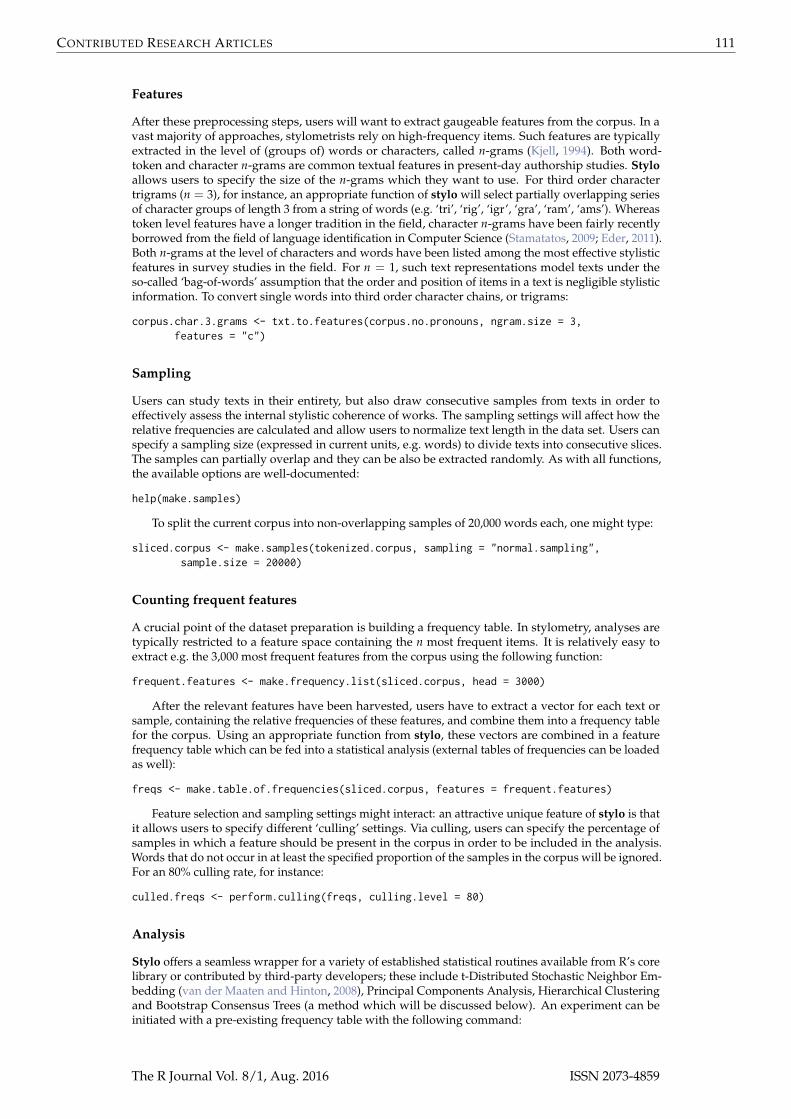
After these preprocessing steps, users will want to extract gaugeable features from the corpus. In avast majority of approaches, stylometrists rely on high-frequency items. Such features are typicallyextracted in the level of (groups of) words or characters, called n-grams (Kjell, 1994). Both word-token and character n-grams are common textual features in present-day authorship studies. Styloallows users to specify the size of the n-grams which they want to use. For third order charactertrigrams (n = 3), for instance, an appropriate function of stylo will select partially overlapping seriesof character groups of length 3 from a string of words (e.g. ‘tri’, ‘rig’, ‘igr’, ‘gra’, ‘ram’, ‘ams’). Whereastoken level features have a longer tradition in the field, character n-grams have been fairly recentlyborrowed from the field of language identification in Computer Science (Stamatatos, 2009; Eder, 2011).Both n-grams at the level of characters and words have been listed among the most effective stylisticfeatures in survey studies in the field. For n = 1, such text representations model texts under theso-called ‘bag-of-words’ assumption that the order and position of items in a text is negligible stylisticinformation. To convert single words into third order character chains, or trigrams:
corpus.char.3.grams <- txt.to.features(corpus.no.pronouns, ngram.size = 3,features = "c")
Sampling
Users can study texts in their entirety, but also draw consecutive samples from texts in order toeffectively assess the internal stylistic coherence of works. The sampling settings will affect how therelative frequencies are calculated and allow users to normalize text length in the data set. Users canspecify a sampling size (expressed in current units, e.g. words) to divide texts into consecutive slices.The samples can partially overlap and they can be also be extracted randomly. As with all functions,the available options are well-documented:
help(make.samples)
To split the current corpus into non-overlapping samples of 20,000 words each, one might type:
sliced.corpus <- make.samples(tokenized.corpus, sampling = "normal.sampling",sample.size = 20000)
Counting frequent features
A crucial point of the dataset preparation is building a frequency table. In stylometry, analyses aretypically restricted to a feature space containing the n most frequent items. It is relatively easy toextract e.g. the 3,000 most frequent features from the corpus using the following function:
frequent.features <- make.frequency.list(sliced.corpus, head = 3000)
After the relevant features have been harvested, users have to extract a vector for each text orsample, containing the relative frequencies of these features, and combine them into a frequency tablefor the corpus. Using an appropriate function from stylo, these vectors are combined in a featurefrequency table which can be fed into a statistical analysis (external tables of frequencies can be loadedas well):
freqs <- make.table.of.frequencies(sliced.corpus, features = frequent.features)
Feature selection and sampling settings might interact: an attractive unique feature of stylo is thatit allows users to specify different ‘culling’ settings. Via culling, users can specify the percentage ofsamples in which a feature should be present in the corpus in order to be included in the analysis.Words that do not occur in at least the specified proportion of the samples in the corpus will be ignored.For an 80% culling rate, for instance:
culled.freqs <- perform.culling(freqs, culling.level = 80)
Analysis
Stylo offers a seamless wrapper for a variety of established statistical routines available from R’s corelibrary or contributed by third-party developers; these include t-Distributed Stochastic Neighbor Em-bedding (van der Maaten and Hinton, 2008), Principal Components Analysis, Hierarchical Clusteringand Bootstrap Consensus Trees (a method which will be discussed below). An experiment can beinitiated with a pre-existing frequency table with the following command:
The R Journal Vol. 8/1, Aug. 2016 ISSN 2073-4859
CONTRIBUTED RESEARCH ARTICLES 112
stylo(frequencies = culled.freqs, gui = FALSE)
When the input documents are loaded directly from text files, the default features are most frequentwords (MFWs), i.e. 1-grams of frequent word forms turned into lowercase. Also, by default, a standardcluster analysis of the 100 most frequent features will be performed. To perform e.g. a PrincipalComponents Analysis (with correlation matrix) of the 200 most frequent words, and visualize thesamples position in the space defined by the first two principal components, users can issue thefollowing commands:
stylo(corpus.dir = "directory_containing_the_files", mfw.min = 200, mfw.max = 200,analysis.type = "PCR", sampling = "normal.sampling", sample.size = 10000,gui = FALSE)
In Fig. 1, we give an example of how Principal Components Analysis (the first two dimensions)can be used to visualize texts in different ways, e.g. with and without feature loadings. Becauseresearchers are often interested in inspecting the loadings of features in the first two componentsresulting from such an analysis, stylo provides a rich variety of flavours in PCA visualizations. For anexperiment in the domain of authorship studies, for instance, researchers will typically find it usefulto plot all texts/samples from the same author in the same color. The coloring of the items in plots canbe easily controlled via the titles of the texts analyzed across the different R methods that are used forvisualization – a commodity which is normally rather painful to implement across different packagesin R. Apart from exploratory, unsupervised analyses, stylo offers a number of classification routinesthat will be discussed below.
The examples shown in Fig. 1 were produced using the following functions:
stylo(frequencies = culled.freqs, analysis.type = "PCR",custom.graph.title = "Austen vs. the Bronte sisters",pca.visual.flavour = "technical",write.png.file = TRUE, gui = FALSE)
stylo(frequencies = culled.freqs, analysis.type = "PCR",custom.graph.title = "Austen vs. the Bronte sisters",write.png.file = TRUE, gui = FALSE)
stylo(frequencies = culled.freqs, analysis.type = "PCR",custom.graph.title = "Austen vs. the Bronte sisters",pca.visual.flavour = "symbols", colors.on.graphs = "black",write.png.file = TRUE, gui = FALSE)
stylo(frequencies = culled.freqs, analysis.type = "PCR",custom.graph.title = "Austen vs. the Bronte sisters",pca.visual.flavour = "loadings",write.png.file = TRUE, gui = FALSE)
Return value
Stylo makes it easy to further process the objects returned by an analysis. To cater for the needs of lesstechnical users, the results returned by an analysis are saved by default to a number of standard filesand outputted on screen. Advanced users can easily use the returned objects in subsequent processing:
stylo.results = stylo() # optional arguments might be passed
print(stylo.results)summary(stylo.results)
The list of features created, for instance, can be easily accessed (and manipulated) subsequently,and the same applies to tables of frequencies or other results:
stylo.results$featuresstylo.results$table.with.all.freqsstylo.results$distance.tablestylo.results$pca.coordinates
The R Journal Vol. 8/1, Aug. 2016 ISSN 2073-4859

CONTRIBUTED RESEARCH ARTICLES 113
Figure 1: Illustration of different visualization options for the first two dimensions outputted by aPrincipal Components Analysis (applied to 9 novels by 4 authors from our dummy corpus). Fourdifferent visualization flavours are presented: ‘Technical’ (Fig. 1a), ‘Classic’ (Fig. 1b), ‘Symbols’ (Fig.1c) and ‘Loadings’ (Fig. 1d). Users whose file names follow stylo’s naming conventions can easilyexploit different coloring options.
GUI mode
Apart from the various functions to perform actual stylometric tasks, the package comes with a seriesof GUIs that can be used to set up typical experimental workflows in a quick and intuitive fashion.This unique feature renders stylo especially useful in educational settings involving students andscholars without programming experience. The cross-platform graphical user interface (automaticallyinstalled along with the rest of the package) has been written for Tcl/Tk and can be easily invokedfrom the command line. Four GUIs are currently available, which all come with extensive tooltips tohelp users navigate the different options. In this section, we will illustrate the use of these GUIs via anunsupervised stylometric experiment involving Bootstrap Consensus Trees.
The currently most widely used GUI component of ‘Stylometry with R’ is the eponymous GUI forstylo(), which is useful for the unsupervised stylistic exploration of textual corpora. It can be easilyinvoked using a single intuitive command (without the need to specify additional arguments):
stylo()
The various tabs of the stylo GUI (see Figure 2) present in a clear fashion the various parameterswhich can be specified before running the analysis by clicking the OK button. Users can freely switchbetween tabs and revisit them before running an experiment. Moreover, stylo will remember theexperimental settings last used, and automatically default to these when users re-launch the GUI(which is useful for authors running a series of consecutive experiments with only small changes inparameters).
To illustrate the GUI mode, we will now concisely discuss a sample experiment involving BootstrapConsensus Trees (BCT, selectable under the STATISTICS tab in the GUI). In stylometry, BCT exploits the
The R Journal Vol. 8/1, Aug. 2016 ISSN 2073-4859

CONTRIBUTED RESEARCH ARTICLES 114
Figure 2: The Graphical User Interface for stylo (FEATURES tab). The high-level functions of styloprovide Graphical User Interfaces (GUIs) to intuitively set up experimental workflows. This featureis especially useful in an educational setting, allowing students without programming experience toengage in stylometric exploration and experimentation.
idea that the results become stable when one divides the list of MFW in non-identical, yet potentiallyoverlapping frequency bands and analyzes these independently from each other (Eder, 2012). BCTwere originally borrowed by Eder from the field of Language Evolution and Genetics; since a numberof successful applications of the technique have been reported in the literature (Rybicki and Heydel,2013; van Dalen-Oskam, 2014; Stover et al., 2016). If the user specifies that different frequency bandsshould be used on the FEATURES tab, the bootstrap procedure will run different (virtual) clusteranalyses and aggregate the results into a single (unrooted) consensus tree. This visualization willonly consider nodes for which there exists a sufficiently large consensus among the individual clusteranalyses. The user in the corresponding text field (e.g. 0.5, which comes down to a majority vote forthe cluster nodes). As such, users can assess the similarities between texts across different frequencybands.
Under the FEATURES tab, users can define the minutes of the MFW division and samplingprocedure, using the increment, the minimum and maximum parameters. For minimum = 100, maximum =3000, and increment = 50, stylo will run subsequent analyses for the following frequency bands: 100MFW, 50–150 MFW, 100–200 MFW, ..., 2900–2950 MFW, 2950–3000 MFW. This is an attractive featurebecause it enables the assessment of similarities between texts across different bands in the frequencyspectrum. A parallel logic underpins the CULLING text fields, where experiments will be carried outiteratively for different culling rates.
We illustrate the working of the BCT procedure in stylo using the recently covered case studyon Go Set a Watchman, the second novel by Harper Lee, written before To Kill a Mockingbird. Thenovel itself attracted a reasonable attention worldwide, also because of its alleged authorship issues.Suspicion resurfaced about the strange fact that one of the greatest bestsellers in American historywas its author’s only completed work; Lee’s childhood friendship with Truman Capote (portrayed asDill in To Kill A Mockingbird) and their later association on the occasion of In Cold Blood fueled morespeculations on the two Southern writers’ possible, or even just plausible, collaboration; finally, therole of Tay Hohoff, Lee’s editor on her bestseller, was discussed.
The stylometric study on this novel, featured in Wall Street Journal (Gamerman, 2015), revealed thatthe truth proved to be at once much less sensational than most of the rumors. Very strong stylometricevidence shows clearly that Harper Lee is the author of both To Kill A Mockingbird and Go Set AWatchman. In our replication of the experiment, the following code was used to produce the plots:
data(lee)
stylo(frequencies = lee, analysis.type = "CA",write.png.file = TRUE, custom.graph.title = "Harper Lee",gui = FALSE)
stylo(frequencies = lee, analysis.type = "CA",mfw.min = 1500, mfw.max = 1500, custom.graph.title = "Harper Lee",write.png.file = TRUE, gui = FALSE)
stylo(frequencies = lee, analysis.type = "BCT",mfw.min = 100, mfw.max = 3000, custom.graph.title = "Harper Lee",write.png.file = TRUE, gui = FALSE)
The R Journal Vol. 8/1, Aug. 2016 ISSN 2073-4859

CONTRIBUTED RESEARCH ARTICLES 115
Figure 3: Analysis of the corpus of 28 novels by Harper Lee, Truman Capote as well as a numberof comparable control authors writing in the American South. A frequency table of this corpus isprovided by the package stylo, so that all our experiments can be replicated. In all plots, Lee’s writingstyle is clearly very consistent, even if for some input parameters Lee’s novels are close to Capote’s.Figure panel 3a-3b: Traditional dendrograms outputted by cluster analyses with Burrows’s ClassicDelta Metric for 100 MFW and 1,500 MFW respectively (default settings; entire novels). Figure panel3c: Bootstrap consensus tree for 100 MFW to 3,000 MFW (with an incremental step size of 50 words).Unrooted tree which combines clade information from analyses such as the ones presented in Fig.1a-1b. The tree collapses nodes which were observed in at least 50% of the underlying trees (majorityvote).
Classify
Apart from the already-discussed explanatory multivariate tests and the associated visualizations,stylometry has borrowed a number of advanced classification methods from the domain of MachineLearning. Some of them have simply been transferred to stylometry (e.g. Support Vector Machines orNaïve Bayes Classifier); others have been tailored to the needs of humanities researchers. The bestexample in this respect is Delta, a so-called ‘lazy’ learner developed by Burrows (Burrows, 2002). Thestylo package offers an interface to a selection of established classifiers: including Burrows’s originalDelta and other distance-based classifiers, Nearest Shrunken Centroids, Support Vector Machines andNaïve Bayes Classifier. These are available through a single function:
classify() # optional arguments might be passed
If any non-standard text preprocessing procedures are involved, the above function can be fedwith the result of a multi-stage custom pipeline. Combining the function classify() with spreadsheettables of frequencies is also possible.
In a typical classification experiment, the analysis is divided in two stages. In the first stage,representative text samples for each target category (e.g. authorial group) are collected in a trainingcorpus. The remaining samples form the test corpus. The first set, being a collection of texts, e.g.written by known authors (‘candidates’), serves as a sub-corpus for fine-tuning the hyperparameters ofa classifier and model architecture selection. The second set is a pool that consists of test texts of known
The R Journal Vol. 8/1, Aug. 2016 ISSN 2073-4859

CONTRIBUTED RESEARCH ARTICLES 116
authorship and anonymous texts of disputed authorial provenance. The classifier’s performance canbe measured by applying a standard evaluation metric to the classifier’s output on the test set (e.g. thenumber of correct attributions to authors in the the training set). In stylo, users can divide their dataover two subdirectories (or input custom-created R objects using the low-level functions discussedabove); one directory should contain the training samples, the other the test samples. Other optionscan be specified via the parameters that run parallel to those of the stylo() function, such as thedesired feature type or culling rate. Function-specific parameters for classify() include the numberof cross-validation folds or the type of classifier (e.g. Support Vector Machine).
We illustrate the performance of classification methods in stylo using the well-known case study ofthe pseudonymous author Galbraith/Rowling, which recently attracted a good deal of press attention.In July 2013, the Sunday Times (UK) revealed that J. K. Rowling, the successful author behind thebestselling series of Harry Potter novels, had published a new detective novel (The Cuckoo’s Calling)under the pseudonym of ‘Robert Galbraith’. (The paper had received an anonymous tip with respectto this pen name over Twitter). For covering this case study, the Sunday Times has collaborated withPatrick Juola, an authority in the field of authorship attribution, and Peter Millican (Juola, 2013).They reported in a blog post on the Language Log that their stylometric analysis showed the writingstyle (e.g. on the level of function words) found in The Cuckoo’s Calling to be broadly consistent withRowling’s writing in other works. Below, we report on a dummy attribution experiment whichillustrates a supervised procedure.
In this experiment we will confront Galbraith’s The Cuckoo’s Calling with 25 other fantasy novelsand thrillers by 4 famous novelists: H. Coben (e.g. Tell No One), C. S. Lewis (e.g. The Chronicles ofNarnia), J. R. R. Tolkien (e.g. the Lord of the Rings trilogy) and J. K. Rowling (e.g. the Harry Potter series).Our replication experiments indeed confirm that Galbraith’s writing style is more consistent with thatof Rowling than that of any other author included. Instead of loading particular text files, we willuse a computed table of frequencies provided by the package; the table has to be split into two tables(training set and test set). As an illustration, we specify the training set manually (with two trainingtexts per class):
# specify a table with frequencies:data(galbraith)freqs <- galbraith
# specify class labels:training.texts <- c("coben_breaker", "coben_dropshot", "lewis_battle",
"lewis_caspian", "rowling_casual", "rowling_chamber","tolkien_lord1", "tolkien_lord2")
# select the training samples:training.set <- freqs[(rownames(freqs) %in% training.texts),]
# select remaining rows as test samples:test.set <- freqs[!(rownames(freqs) %in% training.texts),]
To perform Delta on the Rowling corpus (50 MFWs, no sampling), we type:
classify(training.frequencies = training.set, test.frequencies = test.set,mfw.min = 50, mfw.max = 50, classification.method = "delta",gui = FALSE)
The results are automatically outputted to a log file ‘final_results.txt’:
galbraith_cuckoos --> rowling rowling coben
50 MFW, culled @ 0%, 17 of 17 (100%)
General attributive success: 17 of 17 (100%)
MFWs from 50 to 50 @ increment 100Culling from 0 to 0 @ increment 20Pronouns deleted: FALSE; standard classification
The overall performance of the classifier for our dummy corpus is optimal, since 100% of thetest samples were correctly attributed to the correct authors. The experiment adds support to theidentification of the author of The Cuckoo’s Calling as Rowling. To combat model overfitting, cross-validation on the training data can be applied. It has been shown that for linguistic datasets a standard
The R Journal Vol. 8/1, Aug. 2016 ISSN 2073-4859

CONTRIBUTED RESEARCH ARTICLES 117
10-fold cross validation might overestimate the performance of models, especially if languages otherthan English are assessed (Eder and Rybicki, 2013). To neutralize class imbalance, stylo thereforeprovides stratified cross-validation protocols for stylometric experiments. To perform a classificationwith a ‘plain vanilla’ 20-fold CV, using Nearest Shrunken Centroids classification and a series of testsfor 50, 100, 150, 200, . . . , 500 MFWs, one might type:
results <- classify(training.frequencies = training.set,test.frequencies = test.set,mfw.min = 50, mfw.max = 500, mfw.incr = 50,classification.method = "nsc", cv.folds = 20, gui = FALSE)
To inspect the classification accuracy for particular cross-validation folds, the user can type:
results$cross.validation.summary
Average scores of the cross-validation outcome (note that the overall performance is now slightlyworse, ca. 95%) can be accessed via:
colMeans(results$cross.validation.summary)
Miscellaneous other functions
Apart from the above discussed functions, the package offers miscellaneous other, less establishedfunctions to stylometrically analyze documents. With the oppose() function, users can contrasttwo sets of documents and extract the most characteristic features in both sets of texts. The mostdiscriminative features can be visualized and fed into other components of the package as part ofa pipeline. Several metrics are implemented that can select features which display a statisticallysignificant difference in distributions between both sets. Craig’s Zeta, for instance, is an extension ofthe Zeta metric originally proposed by Burrows (Burrows, 2007), which remains a popular choice inthe stylometric community to select discriminative stylometric features in binary classification settings(Craig and Kinney, 2009). An example of another more widely used metric for feature selection incorpus linguistics is the Mann-Whitney ranks test (Kilgariff, 2001). As a dummy example, we canconfront the above mentioned texts; be it the novels by Jane Austen and Anne Brontë:
data(novels)
corpus.all <- txt.to.words.ext(novels, language = "English.all",preserve.case = TRUE)
corpus.austen <- corpus.all[grep("Austen", names(corpus.all))]corpus.abronte <- corpus.all[grep("ABronte", names(corpus.all))]
zeta.results <- oppose(primary.corpus = corpus.austen,secondary.corpus = corpus.abronte, gui = FALSE)
As can be seen in the results (first 20 most discriminating words), Jane Austen is an enthusiastuser of terms related to socio-cultural phenomena (e.g. situation, opinion, party, engaged, ...), whereasAnne Brontë’s vocabulary can be characterized by a variety of auxiliary verbs with contractions, aswell as religious and light-related vocabulary (e.g. bright, dark).
zeta.results$words.preferred[1:20]
[1] "Her" "farther" "behaviour" "opinion" "party"[6] "point" "perfectly" "afterwards" "Colonel" "directly"[11] "spirits" "situation" "settled" "hardly" "Jane"[16] "Emma" "equal" "family" "engaged" "They"
zeta.results$words.avoided[1:20]
[1] "don^t" "I^m" "I^ll" "beside" "Arthur"[6] "can^t" "I^ve" "it^s" "won^t" "Huntingdon"[11] "presence" "Helen" "face" "bright" "God"[16] "mamma" "further" "heaven" "dark" "feet"
Of course, the above results of this simple feature selection tool can be fed into one of the package’sclassification routines:
The R Journal Vol. 8/1, Aug. 2016 ISSN 2073-4859

CONTRIBUTED RESEARCH ARTICLES 118
Figure 4: The Rolling Stylometry visualization. The medieval French allegoric story Roman de la Roseassessed using Rolling SVM and 100 MFWs; window size: 5,000 words, sample overlap: 4,500 words.Sections attributed to Guillaume de Lorris are marked red, those attributed to Jean de Meun aregreen. The level of certainty of the classification is indicated by the thickness of the bottom stripe. Thecommonly-accepted division into two authorial parts is marked with a vertical dashed line ‘b’.
combined.features <- c(zeta.results$words.preferred[1:20],zeta.results$words.avoided[1:20])
stylo(parsed.corpus = corpus.all, features = combined.features, gui = FALSE)
Other functionality worth mentioning are rolling.delta() and rolling.classify(). Thesefunctions implement a procedure meant to progressively analyze the development of a style in atext, using e.g. one of the stylometric distance metrics discussed (Rybicki et al., 2014; Eder, 2016). Inmany works, specific parts of the text are conjectured to have been plagiarized or contributed byother authors: rolling.delta() and rolling.classify() offer an easy way to visualize local stylisticidiosyncrasies in texts. In Fig. 4 we have plotted a rolling.classify() analysis of the well-knownFrench allegorical romance Roman de la Rose from the Middle Ages. It has been written by two authors:Guillaume de Lorris is the author of the opening 4,058 lines (ca. 50,000 words), and the second partby Jean de Meun consists of 17,724 lines (ca. 218,000 words). This knowledge is supported by thetext itself, since Jean de Meun explicitly points out the takeover point (it is marked with a dashedvertical line ‘b’ in Fig. 4). In this example, the aim is to verify whether two authorial styles can indeedbe discerned in the text, that is, before and after the authorial takeover. First a Support Vector Machineclassifier is trained on four 5,000-word samples: two extracted from the beginning of the text andtwo near the middle of the text (yet well beyond the hypothesized takeover: they are marked withthe dashed line ‘a’ and ‘c–d’, respectively). Next, we apply a windowing procedure and we extractconsecutive and partially overlapping samples from the entire text. Finally, the trained classifier isapplied to each of these ’windows.’ In Fig. 4 we plot the respective classification scores for bothauthors in each sample: in this case, these scores represent the probability, estimated by a SupportVector Machine, that a particular sample should be attributed to one of the two authors involved.Although the result is not flawless, a clear shift in authorial style can be discerned around the positionof the takeover, as indicated verbatimly in the text by one the authors.
The dataset to replicate the test can be downloaded from this page: https://sites.google.com/site/computationalstylistics/corpora/Roman_de_la_Rose.zip. The following code shouldbe typed to perform the classification:
# unzipping the datasetunzip("Roman_de_la_Rose.zip")
# changing working directorysetwd("Roman_de_la_Rose")
rolling.classify(write.png.file = TRUE, classification.method = "svm", mfw = 100,training.set.sampling = "normal.sampling", slice.size = 5000,slice.overlap = 4500)
The R Journal Vol. 8/1, Aug. 2016 ISSN 2073-4859
CONTRIBUTED RESEARCH ARTICLES 119
Conclusion
‘Stylometry with R’ targets two distinct groups of users: experienced coders and beginners. Noviceusers have found it useful to work with the intuitive Graphical User Interface (GUI), which makes iteasy to set and explore different parameters without programming experience. We wish to emphasize,however, that stylo is useful beyond these high-level functions and GUIs: it also offers experiencedusers a general framework that can be used to design custom processing pipelines in R, e.g. in othertext-oriented research efforts. The current version of stylo (version number 0.6.3) is available fromGitHub under a GPL 3.0 open-source licence; binary installation files are available from CRAN. stylohas been used in a number of innovative studies in the field of computational stylistics (Kestemontet al., 2013; van Dalen-Oskam, 2014; Lauer and Jannidis, 2014; Anand et al., 2014; Oakes and Pichler,2013; Boot, 2013), and we encourage the future application of stylo to challenging new problems andlanguages in stylometry.
Acknowledgments
We would like to thank the users of stylo for the valuable feedback and feature requests which wehave received over the past years. MK was partially founded for this research as a postdoctoral fellowby The Research Foundation of Flanders (FWO). ME was partially supported by Poland’s NationalScience Centre (grant number 2014/12/W/ST5/00592).
Bibliography
S. Anand, A. K. Dawn, and S. K. Saha. A statistical analysis approach to author identification usinglatent semantic analysis. notebook for PAN at CLEF 2014. In CLEF2014 Working Notes, pages1143–1147, Sheffield, UK, 2014. CLEF. [p119]
S. Argamon. Interpreting Burrows’s Delta: Geometric and probabilistic foundations. Literary andLinguistic Computing, 23(2):131–147, 2011. [p109]
P. Boot. Online boekdiscussie van een afstand gelezen. TNTL. Journal of Dutch Linguistics and Literature,129(4):215–232, 2013. [p119]
J. Burrows. ‘Delta’: A measure of stylistic difference and a guide to likely authorship. Literary andLinguistic Computing, 17(3):267–287, 2002. [p109, 115]
J. Burrows. All the way through: testing for authorship in different frequency strata. Literary andLinguistic Computing, 22(1):27–48, 2007. [p117]
H. Craig and A. Kinney, editors. Shakespeare, Computers, and the Mystery of Authorship. CambridgeUniversity Press, 2009. [p117]
W. Daelemans. Explanation in computational stylometry. In Proceedings of the 14th InternationalConference on Computational Linguistics and Intelligent Text Processing – Volume 2, CICLing’13, pages451–462, Berlin, Heidelberg, 2013. Springer-Verlag. ISBN 978-3-642-37255-1. [p108]
M. Eder. Style-markers in authorship attribution: a cross-language study of the authorial fingerprint.Studies in Polish Linguistics, 6:99–114, 2011. URL http://www.wuj.pl/page,art,artid,1923.html.[p111]
M. Eder. Computational stylistics and biblical translation: how reliable can a dendrogram be? InT. Piotrowski and Ł. Grabowski, editors, The Translator and the Computer, pages 155–170. WSF Press,Wrocław, 2012. [p114]
M. Eder. Rolling stylometry. Digital Scholarship in the Humanities, 31(3):457–469, 2016. [p118]
M. Eder and J. Rybicki. Do birds of a feather really flock together, or how to choose training samplesfor authorship attribution. Literary and Linguistic Computing, 28(2):229–236, 2013. [p117]
I. Feinerer, K. Hornik, and D. Meyer. Text mining infrastructure in R. Journal of Statistical Software, 25(5):1–54, 3 2008. ISSN 1548-7660. URL http://www.jstatsoft.org/v25/i05. [p108]
E. Gamerman. Data miners dig into ‘Watchman’. Wall Street Journal, page D5, July 2015. [p107, 114]
D. Holmes. Authorship attribution. Computers and the Humanities, 28(2):87–106, 1994. [p107]
The R Journal Vol. 8/1, Aug. 2016 ISSN 2073-4859

CONTRIBUTED RESEARCH ARTICLES 120
D. Holmes. The evolution of stylometry in Humanities scholarship. Literary and Linguistic Computing,13(3):111–117, 1998. [p107]
D. Hoover. Testing Burrows’s Delta. Literary and Linguistic Computing, 19(4):453–475, 2004a. [p109,110]
D. Hoover. Delta prime. Literary and Linguistic Computing, 19(4):477–495, 2004b. [p109, 110]
J. Houvardas and E. Stamatatos. N-gram feature selection for authorship identification. In J. Euzenatand J. Domingue, editors, Proceedings of Artificial Intelligence: Methodologies, Systems, and Applications,pages 77–86. Springer Verlag, 2006. [p108]
M. Jockers. Macroanalysis: Digital Methods and Literary History. Topics in the Digital Humanities.University of Illinois Press, 2013. ISBN 9780252094767. [p108]
P. Juola. Authorship attribution. Foundations and Trends in Information Retrieval, 1(3):233–334, 2006.[p107]
P. Juola. Becoming Jack London. Journal of Quantitative Linguistics, 14(2):145–147, 2007. [p108]
P. Juola. Rowling and “Galbraith”: an authorial analysis, 2013. URL http://languagelog.ldc.upenn.edu/nll/?p=5315. [p107, 116]
M. Kestemont. Function words in authorship attribution: From black magic to theory? In Proceedings ofthe 3rd Workshop on Computational Linguistics for Literature (CLFL), pages 59–66, Gothenburg, Sweden,April 2014. Association for Computational Linguistics. URL http://www.aclweb.org/anthology/W14-0908. [p108]
M. Kestemont, S. Moens, and J. Deploige. Collaborative authorship in the twelfth century: A stylomet-ric study of Hildegard of Bingen and Guibert of Gembloux. Literary and Linguistic Computing, 28:1–15, 2013. doi: doi:10.1093/llc/fqt063. [p119]
A. Kilgariff. Comparing corpora. International Journal of Corpus Linguistics, 6(1):97–133, 2001. [p117]
B. Kjell. Discrimination of authorship using visualization. Information Processing and Management, 30(1):141–50, 1994. [p108, 111]
M. Koppel, J. Schler, and S. Argamon. Computational methods in authorship attribution. Journal of theAmerican Society for Information Science and Technology, 60(1):9–26, 2009. [p107]
G. Lauer and F. Jannidis. Burrows’s delta and its use in German literary history. In M. Erlin andL. Tatlock, editors, Distant Readings. Topologies of German Culture in the Long Nineteenth Century, pages29–54. Rochester, New York, 2014. [p119]
H. Love. Attributing authorship. An introduction. Cambridge University Press, Cambridge, 2002. [p107]
M. Oakes and A. Pichler. Computational stylometry of Wittgenstein’s ‘Diktat für Schlick’. BergenLanguage and Linguistics Studies, 3(1):221–240, 2013. [p119]
J. Pennebaker. The Secret Life of Pronouns: What our Words Say about Us. Bloomsbury Press, New York,2011. [p110]
J. Rybicki and M. Heydel. The stylistics and stylometry of collaborative translation: Woolf’s ‘Nightand Day’ in Polish. Literary and Linguistic Computing, 28(4):708–717, 2013. [p114]
J. Rybicki, D. Hoover, and M. Kestemont. Collaborative authorship: Conrad, Ford and rolling delta.Literary and Linguistic Computing, 29(3):422–431, 2014. [p118]
S. Schreibman, R. Siemens, and J. Unsworth, editors. A companion to Digital Humanities. Blackwell,2004. URL http://www.digitalhumanities.org/companion/. [p107]
F. Sebastiani. Machine Learning in automated text categorization. ACM Computing Surveys, 34(1):1–47,2002. [p108]
E. Stamatatos. A survey of modern authorship attribution methods. Journal of the American Society forInformation Science and Technology, 60(3):538–556, 2009. [p107, 108, 111]
E. Stamatatos, N. Fakotakis, and G. Kokkinakis. Automatic text categorization in terms of genre andauthor. Computational Linguistics, 26(4):471–495, 2000. [p107]
The R Journal Vol. 8/1, Aug. 2016 ISSN 2073-4859
CONTRIBUTED RESEARCH ARTICLES 121
C. Stamou. Stylochronometry: stylistic development, sequence of composition, and relative dating.Literary and Linguistic Computing, 23(2):181–199, 2008. [p107]
J. Stover, Y. Winter, M. Koppel, and M. Kestemont. Computational authorship verification method at-tributes new work to major 2nd century African author. Journal of the American Society for InformationScience and Technology, 67(1):239–242, 2016. [p114]
K. van Dalen-Oskam. Epistolary voices: The case of Elisabeth Wolff and Agatha Deken. Literary andLinguistic Computing, 29(3):443–451, 2014. [p114, 119]
L. van der Maaten and G. Hinton. Visualizing data using t-SNE. The Journal of Machine LearningResearch, 9(2579–2605):85, 2008. [p111]
H. Van Halteren, H. Baayen, F. Tweedie, M. Haverkort, and A. Neijt. New machine learning methodsdemonstrate the existence of a human stylome. Journal of Quantitative Linguistics, 12(1):65–77, 2005.[p107]
Maciej EderInstitute of Polish LanguagePolish Academy of Sciencesal. Mickiewicza 31, 31-120 Krakó[email protected]
Jan RybickiInstitute of English StudiesJagiellonian Universityal. Mickiewicza 9A, 31-120 Krakó[email protected]
Mike KestemontDepartment of LiteratureUniversity of AntwerpPrinsstraat 13, B-2000 [email protected]
The R Journal Vol. 8/1, Aug. 2016 ISSN 2073-4859