The Human Population Chapter 9 1. Section 1: Studying Human Populations 2.

1
Studying the Genetic Structure of Sponge Populations
by
Evelyn Lise Jensen
A REPORT SUBMITTED IN PARTIAL FULFILMENT OF THE
REQUIREMENTS FOR BIOL 499
Supervisor: Dr. Sally Leys
Co-supervisor: Dr. Corey Davis
UNIVERSITY OF ALBERTA
2011

Genetic Structure of Sponge Populations Evelyn Lise Jensen
2
Abstract
The sponge reefs, found only off the coast of British Columbia, Canada, are a unique and
alien deep sea ecosystem that is not well understood and is threatened by human activities. Here
I developed a genetic barcode to differentiate between the two most common sponges on the
reefs, Aphrocallistes vastus and Heterochone calyx. I also developed microsatellite and
mitochondrial marker systems to determine the population genetics of A. vastus to see if there is
genetic structure at the reef level in the Strait of Georgia. Both the microsatellite and
mitochondrial markers indicate that the reefs in the Strait of Georgia are all part of a single
genetically homogeneous population. It does not appear that asexual reproduction in A. vastus is
a significant process in the growth of reefs. To determine the mechanisms by which gene flow is
occurring between reefs, further investigations into larval behaviour are needed.
Introduction
Sponge taxonomy is currently undergoing a “splitting” phase. Researchers are finding that
even very small morphological differences, such as colour, can actually be an indication of
species-level differentiation (Boury-Esnault and Solé-Cava 2004). Based on this finding, there is
increased interest in the population genetics of sponges. It is believed that sponge populations are
highly structured as a result of limited dispersal ability and strong exclusion from habitats which
do not meet specific microclimate requirements (Boury-Esnault and Solé-Cava 2004). Structured
and reproductively isolated populations of sponges are likely to be, or evolve into distinct
species. If we know how populations are genetically structured, we can begin to make inferences
about systematics and evolution, and make informed conservation decisions.
The reproductive biology of sponges has been studied extensively in a few species; however
there is great variability in reproductive process among species, so generalizations are not easy to
make (Bergquist 1978). Regular sampling over long periods of time are required to determine the
reproductive cycle of a species, which is difficult to achieve, particularly in subtidal or deep sea
sponges (Bergquist 1978). All known sponges are capable of sexual reproduction, and in general
are hermaphroditic. Most sponges are also capable of asexual reproduction through gemmule
formation, budding and dripping tissue (Bergquist 1978).

Genetic Structure of Sponge Populations Evelyn Lise Jensen
3
One of the questions of interest in sponge population genetics is how common is asexual
reproduction? If it is a common process, is it an important factor is structuring populations? The
sessile nature of sponges means that dispersal only occurs during reproductive processes, and
knowing the relative occurrence of sexual and asexual reproduction would provide a lot of
insight into sponge biology. For example, if populations are established through asexual
reproduction, the population may not have the genetic diversity to be able to withstand change in
their environment. Also, if the dispersal ability of sexually produced larvae is limited, then local
populations may be genetically isolated and be likely to diverge from other isolated populations.
On the other hand, sponge populations may be genetically homogeneous over large spatial
scales, as was found in the species Chondrosia reniformis (Lazoski et al. 2001), despite sponges
being generally thought to have limited dispersal abilities. This could have implications for the
way that sponge reproduction is studied, as well as inform recommendations for sponge
conservation.
The purpose of the experiments I completed as part of my honours project was to determine
the extent to which asexual reproduction was contributing to the dynamics of populations. I did
this by looking at two different species of sponge using two totally different approaches. The
focus of this paper is the population genetics of reef forming glass sponges (class
Hexactinellida), but a short description of the experiments performed on the other species,
Suberites sp., can be found in Appendix 1.
In 1986 in the Queen Charlotte Sound, a regional geographic survey found an acoustic
anomaly on the ocean floor (Conway 1991). Subsequent investigations in the following years
discovered massive reefs made of glass sponges, several kilometers long, at depths between
150m and 250m (Conway 1991). The reefs in the Queen Charlotte Sound cover more than 700
km2 of discontinuous ocean floor (Conway 1991). Since then, at least 7 major reefs have been
found in the Strait of Georgia and the Hecate Strait, each covering between 2 and 10 km2
(Leys
et al. 2004). Glass sponge reefs were common during the Mesozoic, but until the discovery of
these reefs, it had been thought that the reef forming habit had gone extinct during the Cenozoic
Conway 1991). The west coast of B.C. is the only place in the world that sponge reefs are found
in the modern (Conway 1991). For this reason, the reefs have been referred to as “living fossils”,
and may provide insight into the ecology of ancient reef analogues (Conway 2001).

Genetic Structure of Sponge Populations Evelyn Lise Jensen
4
In the Strait of Georgia there are two species of glass sponge which are the reef builders:
Aphrocallistes vastus and Heterochone calyx (Leys et al. 2004). They belong to closely related
genera within the family Aphrocallistidae (Dohrmann et al. 2008). There are several other
species of sponge which live on the reefs, but as their skeletons disarticulate after death, they are
not an important part of the reef building process (Leys et al. 2004). Both A. vastus and H. calyx
have dictyonine skeletons, where the spicules fuse to form large ridged skeletons which persist
after the death of the sponge and serve to baffle sediment and act as settlement substrate for
sponge larvae (Krautter et al. 2006). The sponge reefs are home to many species of crustacean,
euphausids and commercially valuable rockfish (Conway 2001).
The west coast of B.C. is a commercially active zone with fishing and trawling occurring
around the reefs. It is estimated that half of the reefs in the Strait of Georgia have been damaged
by trawling activity (Cook et al. 2008). Observations of damaged sponges indicate that their
healing potential is limited, and that sponges cut or otherwise broken do not survive (Austin et al.
2007). Austin et al. (2007) surveyed for baby A. vastus in the Saanich Inlet and concluded that
they were very rare, implying recruitment is not occurring at a rate that will replace broken
individuals. It may take hundreds of years for the reefs to recover from recent trawling damage,
if recovery is possible at all (Cook et al. 2008). Reefs in the Hectate Strait have no-trawl zones
around them, and it has been recommended that the Strait of Georgia reefs receive the same
protection (Cook et al. 2008).
Besides the desire to better understand the reproduction of reef forming sponges, population
genetics also has practical, conservation applications in this context. If each reef is a genetically
isolated population, then each reef has greater intrinsic conservation value than if there are many
reefs which are part of a single genetically homogeneous population. To assess the population
structure of A. vastus on the reefs in the Strait of Georgia, I used both nuclear and mitochondrial
molecular markers.
Microsatellites are regions of typically non-coding nuclear DNA which contain a repeating
sequence. The most commonly used repeats are di-nucleotide, such as CT, but tri- and tetra-
nucleotide repeats also exist. Because of the nature of DNA replication, mutations occur more
frequently over these repeating sequences, resulting in an insertion or deletion of a repeat unit

Genetic Structure of Sponge Populations Evelyn Lise Jensen
5
(See figure 2 in Ellegren 2004). Alleles of microsatellites are different copies of the repeating
sequence, which have a different number of repeats. Because the mutations occur with the
insertion or deletion of a repeat unit, alleles differ in the length of the microsatellite by multiples
of two nucleotides for a di-nucleotide repeat. Instead of sequencing the microsatellite to count
the number of repeat units to determine the allele, it is possible to just measure the length of the
microsatellite by running PCR product on a gel or through a sequencer set to a fragment analysis
program. When this is done, the presence of a microsatellite of a particular length can be
identified. Microsatellites are co-dominant, so if only one length appears on the gel or sequencer,
then that individual is a homozygote for that allele of the microsatellite. Microsatellites are
inherited the same way that other nuclear genes are, and therefore they can be used to trace
parentage and determine relatedness (Ellegren 2004). Microsatellites are useful for population
level studies because they are super-variable, and many alleles may exist for each locus. For a
discussion of why microsatellites are preferred over other types of molecular techniques, see
Jarne and Logoda (1996). In this study, I also used sequence data from three mitochondrial genes
to assess population structure.
Traditionally, sponge taxonomy has been largely based on spicule chemistry and
morphology (Bergquist 1978). Because the skills of a sponge taxonomy expert are often required
to be able to identify specimens to the species level, phylum Porifera is a good candidate for the
practical application of DNA barcoding. In 2002, Hebert put forth the cytochrome c oxidase
subunit 1 (COI) mitochondrial gene as a universal marker for animal species identification.
Currently in the Barcode of Life Data systems (BOLD) database (Ratnasingham and Hebert
2007), there are only 150 species of sponge with a barcode, and in the whole class Hexactinellida
only one specimen has been barcoded. Barcoding has many practical applications and could be
used more widely in the study of sponge biology. For example, on the reefs, individuals of A.
vastus and H. calyx are intermixed and cannot be distinguished based on macro-scale
morphology. The main species of interest in this study was A. vastus however, because the two
species were indistinguishable at the time of collection, some individuals of H. calyx were
inadvertently sampled. This led to the desire to find a molecular way of distinguishing between
the two, and the study was expanded to include H. calyx for the purpose of barcoding.
Staurocalyptus sp. is another Hexactinellid found on the reefs in the Strait of Georgia, and was
used as an outgroup for the barcode analysis. As part of my honours thesis, I sequenced the COI

Genetic Structure of Sponge Populations Evelyn Lise Jensen
6
gene for each of these species, and characterized their barcodes, providing a molecular tool
which can definitively identify them in the absence of morphological data.
Methods
Collections
For all the experiments described below, the tissue samples used were collected during a
cruise in the Strait of Georgia in 2007 at depths between 69m and 175m. A legend of the reef
names and the code used to identify tissue samples collected from each site can be found in
Table 1. A map showing the locations of reefs can be seen in Figure 1. Tissue samples were
collected by ROV, and the precise depth and GIS coordinates for each sample were recorded.
Groups of branches which appeared separate from other branches were considered an individual.
Samples were collected from separate individuals between 0.3 and 5m apart which were part of a
mound, and several mounds were sampled on each reef. The tissue samples were stored in 95%
ethanol at -20˚C. The DNA was extracted using a Qiagen DNeasy blood and tissue kit from a
piece of tissue approximately 0.75cm x 0.5cm x 0.75cm and was diluted to 20ng/µl.
Microsatellites
Developing the Library
The microsatellite library was developed from DNA from a single individual of A. vastus
using the SNX linker system (Hamilton et al. 1999). The only deviation made from Hamilton et
al.’s protocol was that the DNA was not enzymatically digested as a first step, because it was
already of appropriate lengths. The library was enriched for CT repeats using magnetic beads
with CT probes. The plasmids from positive colonies were sequenced on an ABI3730 sequencer.
Five candidate loci were chosen, and primers were designed for the region flanking the
microsatellite and were ordered from ABI (Table 2).
Testing the Primers
The five sets of direct labelled primers were tested on a panel of 7 individuals of A.
vastus. The PCR mix contained approximately 50ng of template DNA in a 15 µl reaction with:
1X PCR buffer (50 mM Tris-Cl, pH 9.2, 1.8 mM MgCl2, 10 mM (NH4)2(SO4)), 0.16 mM
dNTPs, 0.03 µM of each of the forward and reverse primers, and 0.1 µl of Taq DNA polymerase

Genetic Structure of Sponge Populations Evelyn Lise Jensen
7
(made by the department).The PCR conditions were as follows: 94˚C for 2 minutes, (94˚C for 30
sec, 52˚C for 20 sec, 72˚C for 10 sec)x 33, 72˚C for 10 minutes.
Two of the primer sets (GS10 and GS169) amplified more than two fragment lengths in
several of the individuals. The presence of more than two fragment lengths was an indication that
non-specific amplification was occurring. A gradient PCR was performed to try an increase the
specificity of the primers; the variables tested were combinations of Mg from 1.5 to 2.5mMol
and annealing temperature from 48˚Cto 58˚C. The gradient PCR did not improve the
amplification, and more than 2 fragments were still present. For this reason, those two primer
sets were rejected for use on the larger panel.
Typing Individuals
The remaining three primer sets (GS3, GS21 and GS119) were used on all 83 individuals
of A. vastus collected in 2007, and fragments were visualized on an ABI 3730 sequencer. On this
larger panel of individuals it was found that these three primer sets also produce more than two
fragment lengths in some individuals; as many as four fragment lengths were found in an
individual (Figure 2).
Analysing the Fragment Data
The traditional analyses used to determine population substructure are Wright’s F-
statistics (Wright 1951). These tests require the calculation of estimates of gene frequencies,
which cannot be done for the microsatellite data here, because there is no way to determine the
number of copies of an allele an individual has. When only two fragments are detected, it is
possible that that individual has three copies of one allele, and one copy of the other, but there is
no way to know for sure.
To analyse the data, the genotype for each individual was coded as the presence or
absence of each of the 35 possible fragment lengths. A matrix of presence or absence of each of
the 35 possible fragments for each individual was made (Appendix 2). From this, a pairwise
matrix was created using the Excel add-in GenAlEx (Peakall and Smouse 2006), which
described the number of instances where the presence or absence of a fragment is not the same
between two individuals (i.e. present in one individual but absent in the other). This number was
divided by 35 to represent the proportion of fragments where the character state was different

Genetic Structure of Sponge Populations Evelyn Lise Jensen
8
between two individuals. Using GenAlEx (Peakall and Smouse 2006), the mean proportion of
difference of individuals within a reef was calculated, as well as the mean proportion of
differences between individuals from different reefs (Table 3).
Barcoding
Developing the Primers
Primers to amplify the COI gene (Table 4) were developed specifically for A. vastus
using the mitochondrial genome accessed through Genbank (Accession number: EU000309.1).
Amplification and Sequencing
The COI gene was sequenced in the same 83 individuals of A. vastus used in the
mircrosatellite experiment, as well as in 11 individuals of H. calyx and a single individual of
Staurocalyptus sp. The PCR amplification contained: approximately 50ng of template DNA in a
10 µl reaction with 1X PCR buffer (50 mM Tris-Cl, pH 9.2, 1.8 mM MgCl2, 10 mM
(NH4)2(SO4)), 0.2 mM dNTPs, 0.5 µM of each of the forward and reverse primers, and 1U of
Taq DNA polymerase (made by the department). The PCR conditions were as follows: 94˚C for
4 minutes, (94 ˚C for 15 sec, 50 ˚C for 30 sec, 72 ˚C for 45 sec)x 30, 72 ˚C for 5 minutes.
The forward and reverse sequences were assembled in SeqMan (DNASTAR) and aligned
in MegAlign (DNASTAR). A pairwise matrix of sequence distances was made. From this, the
mean percent sequence difference within and between species was calculated in Excel (2010).
Mitochondrial Markers
Developing the Primers
The ATPase 6 (ATP6) and Cytochrome oxidase c subunit 2 (COII) genes were suggested
by Rua et al. (2011) as mitochondrial markers which would be variable enough within species to
be suitable for population genetics and phylogeography studies. Primers to amplify the ATP6
and COII genes (Table 4) were developed specifically for A. vastus using the mitochondrial
genome accessed through Genbank (Accession number: EU000309.1).
Amplification and Sequencing
The ATP6 and COII genes were sequenced in 83 individuals of A. vastus collected during
the 2007 cruise. The sequences were run on an ABI3730 sequencer.

Genetic Structure of Sponge Populations Evelyn Lise Jensen
9
Analysis
The forward and reverse sequences of COII and ATP6, as well as COI were assembled in
SeqMan (DNASTAR) and aligned in MegAlign (DNASTAR). The mean percent sequence
differences for individuals within a reef, as well as between reefs were calculated in Excel
(2010).
The sequences from the COI, COII and ATP6 genes were concatenated for each
individual where a full length read of each gene was produced (n=34). These concatenated
sequences were aligned in MegAlign (DNASTAR) and exported to PAUP (Swofford 2003,
version 4.0).
In MegAlign (DNASTAR), a pairwise matrix of sequence distances was created from the
concatenated sequences and haplotypes were identified by hand.
Results
Microsatellites
If two individual sponges have the same trait for each of the 35 characters (fragments),
then the proportion of difference between them is 0.000, if they have a different trait for each of
the characters, the proportion of difference between them is 1.000. Within reefs, the proportion
of differences ranged from 0.185 to 0.215. Between reefs, the proportion differences ranged from
0.187 to 0.221.
There is no correlation between the geographic distance between two sponges and how
different they are genetically (Figure 3). The genetic difference between pairs of sponges which
are located within 150m of each other is normally distributed (Figure 4), and has roughly the
same mean and spread as the genetic difference between all pairs of sponges, up to 70km apart
(Figure 4)
Barcoding
The sequence difference of the COI gene within A. vastus (n=83) was 0.121%. The
sequence difference of the COI gene within H.calyx (n=11) was 0.148%. The sequence
difference between A. vastus (n=83) and H. calyx (n=11) is 11.69% (SD=0.1672) in the COI
gene. Staurocalyptus sp was used as an outgroup (n=1), the sequence difference between it and

Genetic Structure of Sponge Populations Evelyn Lise Jensen
10
A. vastus and H. calyx was 24.13% (SD=0.2637) and 23.55% (SD=0.0934) respectively. A
distance based phylogeny to graphically display these differences was created in MegAlign
(DNASTAR) (Figure 6).
Mitochondrial Markers
For the COI, COII and ATP6 genes individually, the mean percent sequence differences
within reefs was less than the between reef differences in some instances (Tables 5, 6 and 7).
The concatenated data set contained 1771 characters, 1761 of which were constant, of the
variable characters 7 were parsimony uninformative and three were parsimony informative.
Maximum parsimony trees were created from a heuristic search in PAUP (Swofford 2003,
version 4.0). There were 5 best trees, each with a tree length of 11.The maximum parsimony
trees of the concatenated sequences did not show clear grouping of individuals from the same
population (Figure 7).
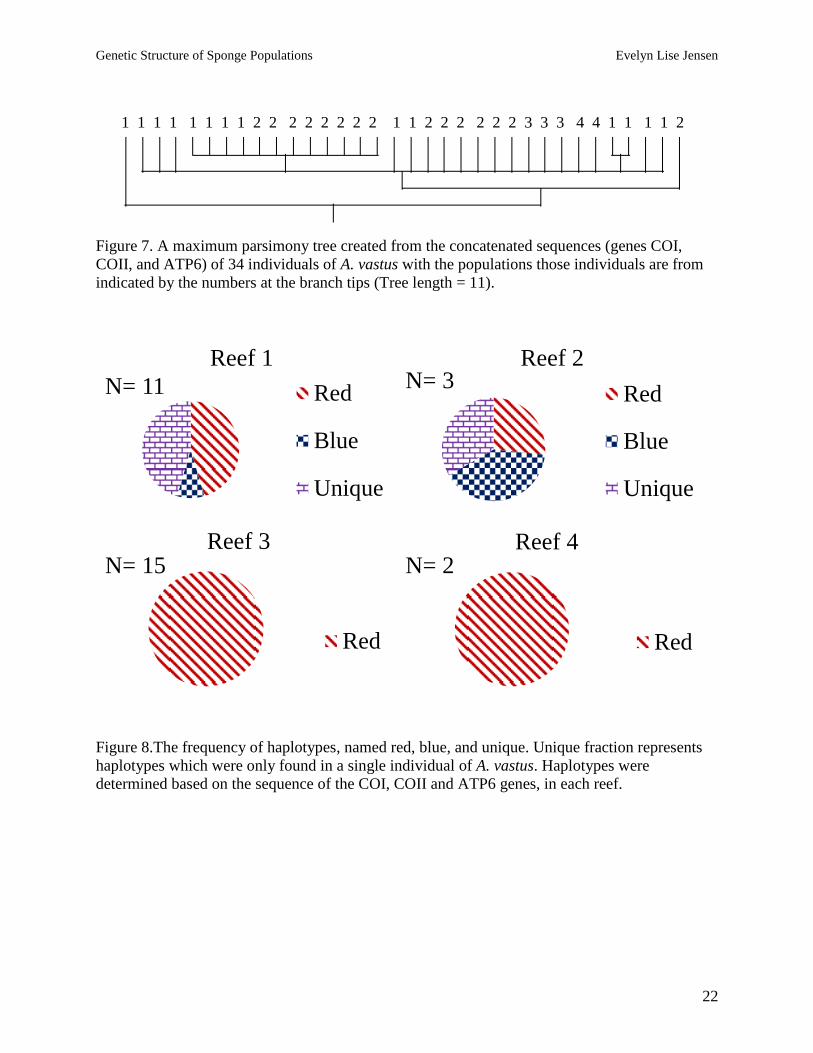
There were 11 haplotypes among the 34 individuals, two which were shared by more
than one individual. The two shared haplotypes were named red and blue. There were 9 unique
haplotypes which were only found in a single individual. The haplotype frequencies found in
each reef can be seen in Figure 8.
Discussion
Microsatellites
Based on the microsatellite data, there is no indication of within reef population structure
for A. vastus in the Strait of Georgia region, because there are instances where the between reef
differentiation is less than the within reef differentiation. The isolation by distance plot (Figure
3) shows no trend that individuals of A. vastus which are geographically close are more similar
genetically based on the microsatellite markers. In genetically structured populations, there
would have been a positive relationship between genetic differences and increasing geographic
distance. Based on the microsatellite data, there is no indication that neighbours are more likely
to be related than individuals tens of kilometers apart. The distribution of genetic differences
between pairs of A. vastus individuals is almost identical at two extreme geographic scales (150
m apart, up to 70 km apart). This further indicates that there is no reef level population structure.

Genetic Structure of Sponge Populations Evelyn Lise Jensen
11
Barcoding
The amount of sequence difference within a species is usually less than 1% (Avise 2000).
In this study, the within species sequence difference at the COI gene was much less than 1%,
which indicates that A. vastus and H. calyx are “good” species. The standard amount of sequence
difference required to delineate separate species in the COI gene is 2% (Hebert 2003). The
sequence difference between A. vastus and H. calyx is almost 12%, so the COI gene is very
capable of differentiation these two species. The traditional method of using spicule morphology
to identify sponges requires a trained eye, if not a taxonomy expert to correctly identify species.
Before the samples were sequenced for the COI gene, I identified each as A. vastus, H. calyx or
Staurocalyptus sp. based on spicule morphology. These identifications were independently
corroborated by Dr. Henry Reiswig, a Hexactinellida taxonomy expert. The species identification
based on sequence data and morphology of the spicules agreed in every instance. This result
gives support to the morphological differences between species being representative of true
genetic differences.
Whenever genetic work is done on H. calyx there is always some question as to whether
the DNA is contaminated with DNA from its hydrozoan symbiont Brinckmannia
hexactinellidophilia (Schuchert and Reiswig 2006). I am confident that the DNA used in this
study was not contaminated by B. hexactinellidophilia DNA. A. vastus and H. calyx had the
same common ancestor at the time when they diverged from the ancestor of Staurocalyptus
(Dohrmann et al. 2008), and one would expect A. vastus and H. calyx to have very similar
sequence differences to Staurocalyptus sp., which was the result found here. If the H. calyx DNA
were contaminated by B. hexactinellidophilia DNA then H. calyx and Staurocalyptus sp. would
have had a much greater sequence difference than A. vastus and Staurocalyptus sp.
Mitochondrial Markers
Concurrent with the results from the microsatellite analyses, some of the between reef
sequence differences are less than the within reef sequence differences for each of the three
mitochondrial genes. There is also no reef level trend in the occurrence of haplotypes (Figure 8),
or in the grouping of haplotypes (Figure 7). These analyses further support the idea that there is
no reef level population structure within the Strait of Georgia region. However, conclusions
drawn based on the analyses performed with the concatenated sequences are limited by the

Genetic Structure of Sponge Populations Evelyn Lise Jensen
12
extremely small sample size, particularly in reefs 3 and 4. It is likely that with greater sampling
at those reefs, unique haplotypes would be found, and with even greater sampling at all reefs,
individuals which share the “unique” haplotypes would be found. There is no reason to expect
that with increased resolution, a geographic pattern to the occurrence of haplotypes would
emerge.
Conclusions
Based on both the nuclear and mitochondrial the marker systems developed during this
study, there is no indication of reef level population structure in A. vastus in the Strait of Georgia
Region. This indicates that there is gene flow or exchange of individuals among reefs. It is likely
that it is not gametes which are being exchanged, but that larvae are dispersing from one reef to
another. A. vastus are hermaphroditic and are thought to release sperm into the water. Although
developing embryos have only been found once, it is believed that they brood eggs, which
become fertilized within the adult sponge (Leys et al. 2007). It is not known how long the larvae
live in the water column until they settle, but in other Hexactinellida it can be up to 7 days (Leys
et al. 2007). One week may be sufficient time for larvae to move with the currents from one reef
to another, but further information about deep water currents in the Strait of Georgia would be
needed to determine this.
Asexual reproduction in A. vastus does not appear to be a factor in the development of
reefs. Although observations have indicated that budding by “dripping” tissue may be occurring
(Austin 2003), no genetically identical pairs of individuals were found in this study. As an
internal control to this study, at the time of sampling, pieces of tissue were divided into two
collection tubes and labelled as separate samples. Only these double sampled individuals were
found to have identical genotypes for the microsatellites. If asexual reproduction by budding was
occurring, clones would likely be in close proximity to each other. The sampling method of
selecting individuals within the same mound should have picked up at least one instance of
clones, if asexual reproduction was an ecologically significant process.
Microsatellites have been used to assess the population structure of sponge species in other
parts of the world. For example, seven microsatellite loci were identified in Scopalina
lophyropoda, a demosponge found in the Mediterranean, which allowed researchers to conclude

Genetic Structure of Sponge Populations Evelyn Lise Jensen
13
that asexual reproduction was not an important factor in that species (Blanquer and Uriz 2010).
The sequence of COI has also been used to assess the population structure of Rhopaloeides
odorabile on the Great Barrier Reef (Whalan et al. 2008). Three haplotypes were identified in R.
odorabile, one of which was present in all populations at frequencies between 0.55 and 1.00
(Whalan et al. 2008), much like the red haplotype identified in this study.
Further molecular analyses are needed to provide more evidence as to the population
genetics of A. vastus in the Strait of Georgia. Efforts should be made to isolate microsatellites
which are not duplicated in the nuclear genome. To do this, I would recommend creating a
library which is enriched for repeats other than CT. In molluscs, difficulties in developing
microsatellite markers have been due to the microsatellite locus being located within a
transposon, with as many as 19 copies of the transposon found within 14.7 kilobases of genome
(McInerney et al. 2011). It is possible that a similar mechanism is responsible for the duplication
of the microsatellite loci developed in this study. If that is the case, then it should be possible to
identify other non-duplicated microsatellites. If unduplicated microsatellite loci are not found,
than a marker system based on SNPs (single nucleotide polymorphism) could be developed as an
alternative. Once a good set of markers is developed, they could be applied to reefs outside the
Strait of Georgia, such as the northern reefs in the Queen Charlotte Sound. Currently ongoing
attempts to find larvae of A. vastus should continue. It would be of great advantage to know how
long they stay in the water column before they settle, so that it can be determined if it is possible
for them to travel with the currents from one reef to another in that timeframe.
Even though A. vastus on all reefs are part of a genetically homogeneous population, the
results of this study do not reflect on the genetic structure of other organisms living on the reefs.
Therefore, this study does not conclude that each reef is equal to the others in overall genetic
diversity. There could be genetic structure at the reef level for H. calyx populations, or for any of
the other species of sponge or other animals. Further study into the population genetics of the
other reef-dwelling organisms should be performed before recommendations can be made as to
the conservation of particular reefs in the Strait of Georgia based on the premise of preserving
genetic diversity.

Genetic Structure of Sponge Populations Evelyn Lise Jensen
14
Acknowledgments
I would like to thank my excellent supervisors for their advice in troubleshooting,
positive attitudes and patience; the staff and students at BMSC, particularly Siobhan Gray, for all
their help during the fall semester; Dr. Henry Reiswig for identifying Suberites sp. as well as the
glass sponge specimens; Dr. Dave Coltman and his lab for hosting and advising me; and Jackson
Chu for helping with GIS.
Note: See appendix 3 for the list of procedures which were carried out by Dr. Corey Davis.

Genetic Structure of Sponge Populations Evelyn Lise Jensen
15
References
Austin et al., In prep. Some New and Old Hadromerida (Porifera: Demospongiae) from British
Columbia and Adjacent Waters. Zootaxa.
Austin, W. C. 2003. Sponge Gardens: A hidden treasure in British Columbia
http://mareco.org/khoyatan/spongegardens
Austin, W. C., Conway, K. W., Barrie, J. V., Krautter, M. 2007. Growth and morphology of a
reef-forming glass sponge, Aphrocallistes vastus (Hexactinellida), and implications for
recovery from widespread trawl damage. Porifera Research: Biodiversity, Innovation
and Sustainability. 139-145
Avise, J. C. 2000 Phylogeography. The history and formation of species. Cambridge, MA:
Harvard University Press
Bergquist, P. R. 1978. Sponges. Berkley, CA: University of California Press
Blanquer, A., Uriz, M. J. 2010. Population genetics at three spatial scales of a rare sponge living
in fragmented habitats. BMC Evolutionary Biology. 10:13
Boury-Esnault, N., Solé-Cava, A. M., 2004. Recent contribution of genetics to the study of
sponge systematics and biology. Boll. Mus. Ist. Biol. Univ. Genova. 68:3-18
Conway, K. W., Barrie, J. V., Austin, W. C., Luternauer, J. L. 1991. Holocene sponge bioherms
on the western Candaian continental shelf. Continental Shelf Research. 11(8-10): 771-790
Conway, K. W., Kruatter, M., Barrie, J. V., Neuweiler, M. Hexactinellid sponge reefs on the
Canadian continental shelf: A unique “living fossil”. Geoscience Canada. 28(2): 71-78
Cook, S. E., Conway, K. W., Burd, B. 2008. Status of the glass sponge reefs in the Georgia
Basin. Marine Environmental Research. 66:S80-S86
Dohrmann, M., Janussen, D., Reitner, J., Collins, A. G., Worheide, G. 2008.Phylogeny and
Evolution of Glass Sponges (Porifera, Hexactinellida).Systematic Biology. 57(3): 388-
405
Ellegren, H. 2004. Microsatellites: Simple sequences with complex evolution. Nature Reviews
Genetics. 5: 435-445
Gaino, E., Bavestrello, G., Magnino, G., 1999. Self/non-self recognition in sponges. Italalian
Journal of Zoolology. 66:299-315
Hamilton, M. B., Pincus, E. L., Di Fiore, A., Fleischer, R. C. 1999. Universal linker and ligation
procedures for construction of genomic DNA libraries enriched for microsatellites.
BioTechniques. 27:500-507
Hebert, P. D. N., Cywinska, A., Ball, S. L., deWaard, J. R. 2002. Biological identifications
through DNA barcodes. Proceedings of the Royal Society of London. DOI
10.1098/rspb.2002.2218
Herbert, P. D. N., Ratnasingham, S., deWaard, J. R. 2003. Barcoding animal life: cytochrome c
oxidase subunit 1 divergences among closely related species. Proceedings of the Royal
Society of London, Biological Letters Supplement
Jarne, P., Lagoda, P. J. L. 1996. Microsatellites, from molecules to populations and back. Tree.
11(10): 424-429

Genetic Structure of Sponge Populations Evelyn Lise Jensen
16
Kaye, H., Oritz, T., 1981. Strain specificity in a tropical marine sponge. Marine Biology. 63:
165-173
Krautter, M., Conway, K. W., Barrie, J. V. 2006.Recent Hexactinosidan sponge reefs (silicate
mounds) off British Coloumbia, Canada: Frame building processes. Journal of Paleontology.
80(1): 38-48
Lazoski, C., Solé-Cava, A. M., Boury-Esnault, N., Klautau, M., Russo, C. A. M., 2001. Cryptic
speciation in a high gene flow scenario in the oviparous marine sponge Chondrosia
reniformis. Marine Biology. 139:421-429
Leys, S. P., Mackie, G. O., Reiswig, H. M. 2007. The biology of glass sponges. Advances in
Marine Biology. 52: 1-145
Leys, S. P., Wilson, K., Holeton, C. Reiswig, H. M., Austin, W. C., Tunnicliffe, V. 2004.
Patterns of glass sponge (Porifera, Hexactinellida) distribution in coastal waters of British
Columbia, Canada. Marine Ecology Progress Series. 283: 133-149
McInerney, C. E., ALlock, A. L., Johnson, M. P., Bailie, D. A., Prodohl, P. A. 2011.
Comparative gonomic analysis reveals species-dependent complexities that explain
difficulties with microsatellite marker development in moluscs. Heredity. 106: 78-87
Müller, W. E. G., Steffen, R., Lorenz, B., Batel, R., Kruse, M., Krasko, A., Müller, I. M.,
Schröder, H. C., 2001. Suppression of allograft rejection in the sponge Suberites domuncula
by FK506 and expression of genes encoding FK506-binding proteins in allografts. Journal of
Experimental Biology. 204:2197-2207
Peakall, R., Smouse, P.E. 2006. GENALEX 6: genetic analysis in Excel. Population genetic
software for teaching and research. Molecular Ecology Notes. 6, 288-295
Ratnasingham, S., Hebert, P. D. N. 2007. BOLD : The Barcode of Life Data System
(www.barcodinglife.org).Molecular Ecology Notes 7, 355–364. DOI: 10.1111/j.1471-
8286.2006.01678.x
Rua, C. P. J., Zilberberg, C., Sole-Cava, A. M. New polymorphic mitochondrial markers for
sponge phylogeography. Journal of the Marine Biological Association of the United
Kingdom. DOI: 10.1017/S0025315410002122
Schuchert, P., Reiswig, H. M. 2006. Brinckmannia hexactinellidophila, n. gen., n. sp.: a hydroid
living in tissues of glass sponges of the reefs, fjords, and seamounts of Pacific Canada
and Alaska. Canadian Journal of Zoology. 84: 564-572
Swofford, D. L. 2003. PAUP*. Phylogenetic Analysis Using Parsimony (*and Other Methods).
Version 4. Sinauer Associates, Sunderland, Massachusetts
Wilson, H. V., 1907. On some phenomena of coalescence and regeneration in sponges. J. Exp.
Zool. 5:245-258
Whalan, S., de Nys, R., Smith-Keune, C., Evans, B. S., Battershill, C., Jerry, D. R. 2008. Low
genetic variability within and among populations of the brooding sponge Rhopaloeides
odorabile on the central Great Barrier Reef. Aquatic Biology. 3: 11-119
Wright, S. 1951. The genetical structure of populations. Annals of Eugenics. 15: 323-354

Genetic Structure of Sponge Populations Evelyn Lise Jensen
17
Tables
Table 1. Legend of Reef numbers and Sample names
Number Location Name Number of Samples Sample IDs
Reef 1 Fraser Reef 27 R10, R11, R17, R18
Reef 2 Galiano Reef 34 R12, R13, R14
Reef 3 McCall Bank 14 R15
Reef 4 Howe Sound 8 R16
Table 2. Microsatellites markers isolated from Aphrocallistes vastus, characteristics are based on
83 individuals. Locus Forward Primer Reverse Primer Repeat
motif
Allele
size
range
No. of
alleles
GS3 GCATAATCCTAATCGGTCCT ACCGTCTTCCAGGTACTAGC CT 265-
322
10
GS10 GACTTCTTCATCCCGATTTC TTTTGCAGTTGGATTGTCTT CT NA NA
GS21 ATTTTCAGGATGCAACAAAG ATTTTTGTCATCGCCTTACA CT 133-
159
11
GS119 GGGAACCTGATCGCTTATGA GAGGGATAGAATCTCAGCAACTG CT 208-
239
14
GS169 GCACGAAATCGGAACTTCA CAACATAAACGCGGCTGATA CT NA NA
Table 3.The mean proportion difference of fragment occurrence within and between reefs of
Aphrocallistes vastus.
Reef 1 Reef 2 Reef 3 Reef 4
Reef 1 0.19367
(SD 0.070489)
Reef 2 0.205495
(SD 0.064078)
0.215432
(SD 0.062426)
Reef 3 0.187127
( SD 0.062267)
0.206363
(SD 0.058398)
0.185243
(SD 0.059531)
Reef 4 0.196978
(SD 0.067217)
0.221218
(SD 0.059972)
0.196429
(SD 0.064532)
0.187755
(SD 0.057894)
Table 4. Mitochondrial primers used for barcoding Aphrocallistes vastus, Heterochone calyx and
Staurocalyptus sp., and determining population structure in A. vastus. All primers were
developed using the published mitochondrial sequence of A. vastus.
Gene Primer Sequence Product length
COI F: ATTCAACAAAACCACAAAGATATAGG
R:TATACTTCTGGATGTCCAAAGAATCA
569
COII F:CCTGCCTCTCCTACAATGGA
R:CGCCGCATAATTCTGAACAT
577
ATP6 F:CTATTCTCAGTTTCAGAAATCTCTCC
R:AGTAATGTGAATACATAGGCTTGGA
625

Genetic Structure of Sponge Populations Evelyn Lise Jensen
18
Table 5. The mean percent sequence difference within and between reefs of A. vastus in the COI
gene.
Reef 1 Reef 2 Reef 3 Reef 4
Reef 1 0.119088 (SD
0.106665)
Reef 2 0.12342 (SD
0.109457)
0.114973 (SD
0.108515)
Reef 3 0.112169 (SD
0.107096)
0.128782 (SD
0.107954)
0.112088 (SD
0.106286)
Reef 4 0.122685 (SD
0.116516)
0.134926 (SD
0.107611)
0.116071 (SD
0.11897)
0.139286 (SD
0.119689)
Table 6. The mean percent sequence difference within and between reefs of A. vastus in the COII
gene.
Reef 1 Reef 2 Reef 3 Reef 4
Reef 1 0.074462 (SD
0.106546)
Reef 2 0.056824 (SD
0.097149)
0.038793 (SD
0.082375)
Reef 3 0.038462 (SD
0.079204)
0.019355 (SD
0.05937)
0 (SD 0)
Reef 4 0.095604 (SD
0.120232)
0.076498 (SD
0.108229)
0.057143 (SD
0.092009)
0.114286 (SD
0.119523)
Table 7. The mean percent sequence difference within and between reefs of A. vastus in the
ATP6 gene.
Reef 1 Reef 2 Reef 3 Reef 4
Reef 1 0.098095 (SD
0.1074)
Reef 2 0.064167 (SD
0.0962)
0.024793 (SD
0.066183)
Reef 3 0.078095 (SD
0.103757)
0.040952 (SD
0.082852)
0.05714 (SD
0.092582)
Reef 4 0.053333 (SD
0.089443)
0.0125 (SD
0.048925)
0.028571 (SD
0.071714)
0 (SD 0)

Genetic Structure of Sponge Populations Evelyn Lise Jensen
19
Figures
Figure 1. Map of the reefs where tissue samples were collected during the 2007 cruise in the
Strait of Georgia.
Figure 2. Examples of genotypes at the GS119 locus in A. vastus, the top panel individual has
four fragments (Alleles: 210, 216, 224 and 230), the bottom panel individual has three fragments
(Alleles: 210, 214, and 232). The smaller peaks around the larger peak are stutter bands produced
when Taq DNA polymerase slips when replicating the DNA. The allele is the largest peak.

Genetic Structure of Sponge Populations Evelyn Lise Jensen
20
Figure 3. An isolation by distance graph showing the proportional genetic difference between
each pair of sponges on the y-axis and the geographic distance between each pair of sponges on
the x-axis.
Figure 4.A histogram depicting the frequency of each level of genetic difference from the
pairwise comparison of all sponges within 150m of one another.
Figure 5.A histogram depicting the frequency of each level of genetic difference from the
pairwise comparison of all sponges sampled in 2007.

Genetic Structure of Sponge Populations Evelyn Lise Jensen
21
Figure 6. The distance based phylogeny of the COI gene with the percent of the sequence
difference that is represented by the branching point indicated at the nodes, and within species
sequence difference indicated at the tips.
Nucleotide Substitutions (x100)
0
15.3
2468101214
R11_0038
R16_0002
R15_0012
R17_0002
R10_0004
R10_0006
R12_0002
R13_0016
R13_0022
R13_0028
R15_0002
R15_0007
R15_0013
R16_0001
R16_0018
R17_0009
R18_0016
R11_0019
R11_0034
R11_0030
R13_0009
R13_0017
R13_0024
R13_0034
R15_0004
R15_0010
R15_0015
R16_0009
R17_0001
R17_0010
R18_0007
R17_0008
R16_0010
R15_0017
R15_0011
R15_0005
R14_0030
R13_0026
R13_0018
R13_0012
R11_0039
R10_0005
R10_0003
R10_0002
R11_0017
R11_0032
R11_0021
R11_0024
R11_0026
R11_0028
R11_0027
R13_0020
R11_0036
R12_0003
R12_0004
R12_0005
R12_0006
R13_0010
R13_0015
R13_0019
R13_0025
R13_0027
R13_0029
R13_0031
R13_0033
R13_0036
R13_0047
R14_0021
R14_0024
R14_0025
R14_0026
R14_0027
R14_0028
R15_0008
R15_0009
R15_0014
R15_0016
R16_0016
R16_0017
R18_0011
R18_0012
R16_0008
R13_0007
1148_0005
1149_0004
1151_0007
R15_0001
R10_0007
1155_0011
1279_0012
1283_0092
R11_0025
R15_0003
1283_0091
R14_0008
H. calyx
A. vastus
Staurocalyptus sp.
23.84 %
11.69 %
N= 11
0.148 %
N= 83
0.121 %
Genetic Structure of Sponge Populations Evelyn Lise Jensen
22
Figure 7. A maximum parsimony tree created from the concatenated sequences (genes COI,
COII, and ATP6) of 34 individuals of A. vastus with the populations those individuals are from
indicated by the numbers at the branch tips (Tree length = 11).
Figure 8.The frequency of haplotypes, named red, blue, and unique. Unique fraction represents
haplotypes which were only found in a single individual of A. vastus. Haplotypes were
determined based on the sequence of the COI, COII and ATP6 genes, in each reef.
Population 1
Red
Blue
Unique
Population 2
Red
Blue
Unique
Population 3
Red
Population 4
Red
N= 11
1 1 1 1 1 1 1 1 2 2 2 2 2 2 2 2 1 1 2 2 2 2 2 2 3 3 3 4 4 1 1 1 1 2
Reef 1 Reef 2
Reef 4 Reef 3
N= 3
N= 15 N= 2

Genetic Structure of Sponge Populations Evelyn Lise Jensen
23
Appendix 1
Using tissue grafting as a proxy for genetic identity to understand population structure in a
Demosponge, Suberites sp.
A simple grafting method has been devised for testing whether two individuals are of the
same genetic strain, based on the classic cell dissociation studies of Wilson (1907). By grafting
tissue from one sponge onto tissue of another, it is possible to test whether the individuals are
from the same genetic strain or are clones (Gaino et al. 1999). If the grafted region fuses and the
tissues look as if they will become one functional sponge, then the two individuals involved in
the graft are of the same strain. If the graft does not fuse, then the two individuals were not
genetically similar. Graft rejection can be characterised by the development of ectosome on each
individual at the graft site, or a cytotoxic reaction resulting in necrosis of one or both individuals
at the graft site. The rejection is an immune reaction induced in response to the detection of non-
self tissue. A graft between two sponges of the same stain is accepted because the tissues
recognize each other as self. There is plenty of evidence supporting the idea that it is an immune
response, for example, an immunosuppressant, such as FK506, can be used to force graft
acceptance between two unrelated conspecific sponges (Müller et al. 2001). This grafting method
has been used in sponge population studies both in the field and the lab (e.g. Kay and Oritz 1981)
I set out to determine how many strains (or clonal types) were present in a population of
Suberites sp. (soon to be described by Austin et al. in prep). This species was chosen because it
is convenient to access and individuals have discrete margins. I set up grafts in the lab between
individuals within a population, and between individuals from different populations. The goal
was to find out how common asexual reproduction was within a population, and to see if
different populations were the same genetic strain.
The sponges observed for this study are of a soon to be described species in the genus
Suberites (identification by Henry Reiswig, description in Austin et al. in press, Fig.1). They are
from class Demospongiae, order Hadromerida, family Suberitidae. Suberites sp. is common in
the shallow subtidal on rocky substrate between 3 and 10 meters deep in moderately exposed to
very exposed areas in Barkley Sound.

Genetic Structure of Sponge Populations Evelyn Lise Jensen
24
The main result of this study is that all individuals of Suberites sp. sampled from seven sites
were compatible enough with all other individuals for the tissues to apparently fuse. Why the
species of Suberites studied here did not react to foreign conspecific tissue as expected has two
possible explanations. First, all of the individuals sampled, despite being from sites up to almost
9 kilometers apart, could be of the same genetic strain. Alternatively, this particular species of
Suberites may not express a histoincompatibility reaction with conspecifics, regardless of
genotype.
This study on the importance of asexual reproduction in Suberites sp. populations relates to
the rest of my honours project in the following way. Similar grafting experiments have
previously been performed on live tissue of A. vastus, to see if asexual reproduction is a major
structuring factor in the formation of sponge reefs. The results of that study were opposite to
what I found here: all of the allografts failed to fuse. I have taken that study on A. vastus to the
next step, which is molecular analysis. I was unable to follow up the Suberites sp. study in the
same way due to time constraints.

25
Appendix 2
Table of the presence (1) or absence (0) of each of the possible fragment lengths (row 1) for the three microsatellite loci in all individuals of A. vastus
collected in 2007.
Sample Reef 133 135 137 141 145 147 149 151 153 157 159 208 210 212 214 216 221 223 227 229 231 233 235 237 239 265 267 269 308 310 312 314 316 320 322
R10_0002 1 1 0 0 0 0 1 1 0 0 0 0 0 1 0 1 0 0 1 0 0 0 0 0 0 0 1 0 0 0 0 0 0 0 0 0
R10_0003 1 1 0 0 0 0 1 1 0 0 0 0 0 1 0 1 0 0 1 0 0 0 0 0 0 0 1 0 0 0 0 0 0 0 0 0
R10_0004 1 0 0 0 0 0 1 0 0 0 0 0 0 0 0 1 0 0 0 0 0 1 0 0 0 0 1 0 0 0 0 1 0 0 0 0
R10_0005 1 0 0 0 0 0 1 1 1 0 0 0 0 1 0 0 0 0 0 0 0 0 0 0 1 0 0 0 0 0 0 1 0 0 0 0
R10_0006 1 0 0 0 0 0 1 1 1 0 0 0 0 1 0 0 0 0 0 0 0 0 0 0 1 0 0 0 0 0 0 1 0 0 0 0
R11_0017 1 0 0 0 0 0 0 1 0 0 0 0 0 0 0 0 0 1 0 0 1 0 0 0 0 0 1 0 0 0 0 0 0 0 0 0
R11_0019 1 0 0 0 0 0 1 0 0 0 0 0 0 1 0 1 0 0 0 0 0 0 0 1 0 0 1 0 0 0 0 0 0 0 0 0
R11_0021 1 0 0 0 0 0 1 1 0 0 0 0 0 1 0 0 0 0 0 0 0 0 0 1 0 1 0 0 0 1 0 0 0 0 0 0
R11_0024 1 0 0 0 0 0 1 0 1 0 0 0 1 1 1 1 0 0 0 0 0 0 0 0 0 0 1 0 0 0 0 1 0 0 0 0
R11_0026 1 0 0 0 0 0 1 0 1 0 0 0 1 1 1 1 0 0 0 0 0 0 0 0 0 0 1 0 0 0 0 1 0 0 0 0
R11_0027 1 0 0 0 0 0 1 0 0 0 0 0 0 1 0 1 0 0 0 0 0 0 0 0 0 0 0 0 0 0 0 0 0 0 0 0
R11_0028 1 0 1 0 0 0 1 0 1 0 0 0 0 1 1 0 1 0 0 1 0 0 0 0 0 0 0 1 0 1 0 0 0 0 0 0
R11_0030 1 0 1 0 0 1 1 0 0 0 0 0 0 1 0 1 0 0 0 0 0 0 1 0 0 0 0 0 0 1 0 0 0 0 0 0
R11_0032 1 0 0 0 0 0 0 1 0 0 0 0 0 1 0 1 0 0 0 0 0 0 0 0 0 0 0 0 0 0 0 0 0 0 0 0
R11_0034 1 0 0 0 0 0 1 1 0 0 0 0 0 1 0 0 0 0 0 0 0 0 0 0 0 0 1 0 0 0 0 0 0 0 0 0
R11_0036 1 0 1 0 0 0 1 0 1 0 0 0 0 1 0 0 0 0 0 1 0 1 0 0 0 0 0 0 0 0 0 0 0 0 0 0
R11_0038 1 0 0 0 0 0 1 0 0 0 0 0 0 1 0 1 1 0 0 0 0 0 0 0 0 0 1 0 0 0 0 0 0 1 0 0
R11_0039 1 0 0 0 0 0 1 1 0 0 0 0 0 1 0 0 0 0 0 0 1 0 0 0 0 0 0 0 0 0 0 0 0 1 0 0
R12_0002 2 0 0 0 1 0 1 1 0 0 0 0 0 1 0 1 0 0 0 0 1 0 0 0 0 0 1 0 0 0 1 0 1 0 0 0
R12_0003 2 0 0 0 1 0 1 1 0 0 0 0 0 1 0 0 1 0 0 0 0 1 0 0 0 0 0 0 0 0 0 1 0 0 0 0
R12_0004 2 0 0 0 0 0 0 0 0 0 0 0 0 1 0 1 0 0 0 0 1 0 0 0 0 0 0 0 0 0 0 0 0 0 0 0
R12_0005 2 0 0 0 0 0 1 1 1 0 0 0 0 1 0 0 1 0 0 0 0 1 0 0 0 0 0 0 0 0 0 1 0 0 0 0
R12_0006 2 0 0 0 0 0 1 0 0 0 0 0 0 0 0 0 0 0 0 1 0 0 0 0 0 0 0 0 0 0 0 0 0 0 0 0
R13_0007 2 0 0 0 0 0 1 1 0 1 0 0 0 1 0 1 0 0 0 1 0 0 0 0 0 0 1 0 0 0 0 0 0 0 0 0
R13_0009 2 0 0 1 0 0 1 1 0 0 0 0 0 0 0 1 0 0 0 1 0 0 0 1 1 0 1 0 0 1 0 0 0 0 0 0
R13_0010 2 0 0 0 0 0 1 1 0 0 0 0 0 1 1 1 0 0 0 0 0 0 0 0 0 0 0 0 0 0 0 1 0 0 0 0
R13_0012 2 0 1 0 0 0 1 0 0 0 1 0 0 1 0 1 0 0 0 0 1 0 0 1 0 0 1 0 0 0 0 1 0 0 0 0
R13_0015 2 0 1 0 0 0 1 1 1 0 0 0 0 1 0 1 0 0 0 0 0 0 1 0 0 0 1 0 0 0 0 0 0 0 0 0
R13_0016 2 0 0 0 0 0 1 1 0 0 0 0 0 1 1 0 0 0 0 0 0 1 0 0 0 0 1 0 0 0 0 1 0 0 0 0
R13_0017 2 0 0 0 0 0 1 1 0 0 0 0 0 0 1 1 0 0 0 1 0 0 0 0 0 0 1 0 0 1 0 1 0 0 0 0
R13_0018 2 0 0 0 0 0 1 1 0 0 0 0 0 1 1 0 0 0 0 0 0 1 0 0 0 0 1 0 0 0 0 1 0 0 0 0
R13_0019 2 0 0 1 0 0 1 0 0 0 0 0 0 1 0 1 0 0 0 0 0 1 0 0 0 0 0 0 0 0 0 0 0 0 0 1
R13_0020 2 0 1 0 0 0 1 1 0 0 0 0 0 1 0 1 0 0 0 1 0 0 0 0 0 0 1 0 0 0 1 0 0 0 0 0
R13_0022 2 0 0 0 1 1 0 1 0 0 0 0 0 0 0 1 0 0 0 0 0 1 0 0 0 0 1 0 0 0 1 0 0 0 0 0
R13_0024 2 0 0 0 0 0 1 1 0 0 0 0 0 0 1 1 0 0 0 0 0 0 0 1 0 0 0 0 0 0 1 0 0 0 0 0
R13_0025 2 0 0 0 1 0 1 0 0 0 0 0 0 1 0 1 0 0 0 0 0 0 0 0 0 0 1 0 1 0 0 0 0 1 0 0
R13_0026 2 0 1 0 0 0 1 1 0 0 0 0 0 1 0 1 0 0 0 0 0 0 0 0 0 0 0 0 0 0 0 0 0 0 0 0
R13_0027 2 0 0 0 1 0 1 1 0 0 0 0 0 1 0 1 0 0 0 0 0 0 1 0 0 0 0 0 0 1 0 0 0 0 0 0
R13_0028 2 0 1 1 0 0 1 0 0 0 0 0 0 1 0 1 0 0 0 0 0 1 0 0 0 0 1 0 0 0 0 0 0 0 0 0
R13_0029 2 0 1 0 0 1 0 1 1 0 0 0 0 1 0 1 0 0 0 0 0 0 1 0 0 0 0 0 0 0 0 0 0 0 1 0
R13_0031 2 0 0 0 0 0 1 1 0 0 0 0 0 1 0 0 0 0 0 0 1 0 1 1 0 0 0 0 0 0 0 1 0 0 0 0

Genetic Structure of Sponge Populations Evelyn Lise Jensen
26
R13_0033 2 0 0 0 0 0 1 1 1 0 0 0 0 1 0 0 0 0 0 0 1 0 0 0 0 1 0 0 0 1 0 1 1 0 0 0
R13_0034 2 0 1 0 0 0 1 1 0 0 0 0 0 1 0 0 0 0 0 0 0 1 0 0 1 0 0 0 0 0 1 0 0 0 0 0
R13_0036 2 0 1 0 0 0 1 0 0 0 0 0 0 1 0 1 0 0 0 0 0 0 0 0 0 0 1 0 0 0 0 0 0 0 0 0
R13_0047 2 0 0 0 0 0 0 1 0 0 0 0 0 1 0 1 0 0 0 0 0 0 1 0 0 0 0 0 0 0 0 0 0 0 0 0
R14_0021 2 0 0 0 0 0 1 0 1 0 0 0 0 0 1 0 0 0 0 1 0 0 0 0 1 0 1 0 0 0 0 0 0 1 0 0
R14_0024 2 0 0 0 0 0 1 1 0 1 0 0 0 1 1 1 0 0 0 0 0 0 0 0 0 0 0 1 0 0 1 0 0 0 0 0
R14_0025 2 0 0 0 0 0 1 0 0 0 0 0 0 1 0 1 0 0 0 0 0 1 0 1 0 0 0 0 0 1 1 0 0 0 0 0
R14_0026 2 0 0 0 0 0 1 1 0 1 0 0 0 1 1 1 0 0 0 0 0 0 0 0 0 0 0 1 0 0 1 0 0 0 0 0
R14_0027 2 0 0 0 0 0 1 1 0 0 0 0 0 0 0 0 0 0 0 1 0 0 1 0 1 1 1 0 0 0 0 0 0 0 0 0
R14_0028 2 0 0 0 0 0 1 1 0 1 0 0 0 1 0 1 0 1 0 0 1 0 0 0 0 0 0 0 0 0 1 0 0 0 0 0
R14_0030 2 0 0 0 0 0 1 0 0 0 0 0 0 0 1 1 0 0 0 1 0 0 0 0 0 0 0 0 0 1 0 0 0 0 0 0
R15_0002 3 0 0 0 0 0 1 0 0 0 0 0 0 1 0 1 0 0 0 0 0 0 0 0 0 0 0 0 0 0 0 0 0 0 0 0
R15_0004 3 0 0 0 0 0 0 1 1 0 0 0 0 1 0 1 0 0 0 0 0 0 0 1 0 0 1 0 0 0 1 0 0 0 0 0
R15_0005 3 0 0 0 0 0 1 0 0 0 0 1 0 1 0 0 0 0 0 0 0 1 0 0 1 0 0 0 0 0 0 0 1 0 0 0
R15_0007 3 0 0 0 0 0 1 0 1 0 0 0 0 1 0 0 1 0 0 0 0 0 0 0 0 0 1 0 0 0 0 0 0 0 0 0
R15_0008 3 0 0 0 0 0 1 0 0 0 0 0 0 0 0 1 0 0 0 0 0 1 0 0 0 0 0 0 0 0 0 1 1 1 0 0
R15_0009 3 0 1 0 0 0 1 0 0 0 0 0 0 1 0 0 0 0 0 1 0 0 0 0 0 0 0 0 0 1 0 0 0 1 0 0
R15_0010 3 0 0 0 0 0 1 1 0 0 0 0 0 1 0 0 0 0 0 0 0 1 0 0 0 1 0 0 0 0 1 0 0 0 0 0
R15_0011 3 0 1 0 0 0 0 0 1 0 0 0 0 1 0 0 0 0 0 0 0 0 0 0 1 0 0 0 0 0 0 1 0 0 0 0
R15_0012 3 0 0 0 0 1 1 0 0 0 0 0 0 1 1 1 1 0 0 0 0 0 0 0 0 0 0 0 0 0 0 1 0 0 0 0
R15_0013 3 0 0 0 0 0 1 0 1 0 0 0 0 1 0 0 0 0 0 0 0 0 0 0 0 0 0 0 0 0 0 0 0 0 0 0
R15_0014 3 0 0 0 0 0 1 1 0 0 0 0 0 0 0 0 1 0 0 0 0 1 0 0 0 0 0 0 0 0 0 0 0 0 0 0
R15_0015 3 0 1 0 0 0 1 0 0 0 0 0 0 1 1 0 0 0 0 0 0 0 0 0 0 0 0 0 0 1 0 0 0 0 0 0
R15_0016 3 0 0 0 0 0 1 1 0 0 0 0 0 1 0 0 0 0 0 0 0 0 0 0 0 0 1 0 0 0 0 0 0 0 0 0
R15_0017 3 0 1 0 0 0 1 1 0 0 0 0 0 1 0 0 0 0 0 1 0 0 0 1 0 0 1 0 0 0 0 0 0 0 0 0
R16_0001 4 0 0 0 0 0 0 1 0 0 0 0 0 0 0 1 0 1 0 0 0 0 0 0 0 0 0 0 0 0 0 1 0 0 0 0
R16_0002 4 1 0 0 0 0 1 0 0 0 0 0 0 1 0 0 0 0 0 0 0 0 1 0 0 0 0 0 0 0 0 0 1 0 0 0
R16_0008 4 0 0 0 0 0 0 1 0 0 0 0 0 0 0 0 0 0 0 1 1 0 0 0 0 0 0 0 0 0 1 1 1 1 0 0
R16_0009 4 0 0 0 0 0 1 0 0 0 0 0 0 0 0 0 1 0 0 0 0 0 0 0 0 0 0 0 0 0 0 0 0 0 0 0
R16_0010 4 0 0 0 0 0 1 0 0 0 0 0 0 0 0 0 1 0 0 0 0 0 0 0 1 0 0 0 0 0 0 0 0 0 0 0
R16_0016 4 0 0 0 0 0 0 0 1 0 0 0 0 0 0 1 0 0 0 0 0 0 0 0 0 0 0 0 0 0 0 0 0 1 0 0
R16_0017 4 0 0 0 0 0 1 0 0 0 1 0 0 0 0 1 0 0 0 0 1 0 0 0 0 0 0 0 0 0 0 0 0 1 0 0
R16_0018 4 0 0 0 0 0 1 1 0 0 0 0 0 1 0 1 0 0 0 0 0 0 0 1 0 0 0 0 0 0 0 0 0 0 0 0
R17_0001 1 0 0 0 0 1 1 1 0 0 0 0 0 0 0 1 0 0 0 0 1 0 0 0 0 0 0 0 0 1 0 0 0 0 0 0
R17_0002 1 0 0 0 0 1 1 1 0 0 0 0 0 0 0 1 0 0 0 0 1 0 0 0 0 0 0 0 0 1 0 0 0 0 0 0
R17_0008 1 0 0 0 0 0 0 0 0 0 0 0 0 0 0 1 0 0 0 0 0 0 0 0 0 0 0 0 0 0 1 0 0 0 0 0
R17_0009 1 0 1 0 0 0 0 0 0 0 0 0 0 0 0 0 0 0 0 1 0 1 0 0 1 0 1 0 0 0 0 0 1 0 0 0
R17_0010 1 0 0 0 0 0 1 0 0 1 0 0 0 0 0 0 1 1 0 0 1 0 0 0 0 0 1 0 0 1 0 0 0 0 0 0
R18_0007 1 0 1 0 0 0 1 0 0 0 0 0 0 0 0 1 0 0 0 0 0 1 0 0 0 0 0 0 0 0 0 0 0 1 0 0
R18_0011 1 0 0 0 0 0 1 1 0 0 0 0 0 1 0 1 0 0 0 0 0 0 0 0 0 0 0 0 0 0 0 1 0 0 0 0
R18_0012 1 0 0 0 0 0 1 1 0 0 0 0 0 1 0 1 0 0 0 0 0 0 0 0 0 0 0 0 0 0 0 1 0 0 0 0
R18_0016 1 0 1 0 0 0 1 0 0 0 0 0 0 1 0 0 0 0 0 0 0 0 1 0 0 0 0 0 0 0 0 1 0 0 0 0

27
Appendix 3
The parts of this project which were performed by Dr. Corey Davis:
Development of the microsatellite library and primer design
Final typing reactions for microsatellites
Primer design for COI, COII and ATP6
Amplification and sequencing of mitochondrial markers
Contiging for COI