STUDYING BOOM-BUST CYCLES IN NATURAL GAS PRODUCTION …
16
1 STUDYING BOOM-BUST CYCLES IN NATURAL GAS PRODUCTION ASSETS INVESTMENTS Joël Enderlin * ENGIE, Strategy Division, Center of Expertise in Economic and Modeling Studies 1 et 2 Place Samuel de Champlain, Faubourg de l’Arche, 92930 Paris La Défense, France [email protected] BIEE 11 th Oxford Research Conference, 21-22 September 2016, Oxford, United Kingdom Key words: natural gas markets, news investment-specific shocks, agent-based modeling, path- dependence, dynamic disequilibrium, irreversibility, boom-bust cycles. Abstract During the past decade, the global natural gas market has witnessed a series of critical upheavals: increasing market volatility, greater geopolitical risks, ever-growing hazardous market cycles,... In this disrupted environment, the use of models capable of representing the genuine dynamic of gas market fundamentals has become decisive for the gas industry to generate the most reliable long-term forecasts. However, conventional natural gas models usually neglect the effects of dynamic path-dependence and independent agent behaviors by assuming that the market stands in a permanent state of equilibrium. The new model therefore aims at exploiting these two disregarded concepts to represent the natural gas market as an evolving and complex system. To this end, the new approach consists in building the dynamic path resulting from the progressive realization of the natural gas market with an advanced rolling optimization model. In accordance with the principle of causality, the non-coordinated an irreversible investment decisions in natural gas production assets made by independent market players at a given date have a direct and structural impact on the market configuration over the following years. Associated with a thorough representation of the progressive depletion of existing natural gas resources, the model may lead to market conditions which deviate from equilibrium. More specifically, the model can exhibit endogenous boom-bust cycles characterized by a succession of oversized expansion periods followed by critical contraction periods. The aim of this new rolling model is to help decision makers in the natural gas sector to better assess incoming risks and opportunities by providing them with the most likely market forecasts rather than with market forecasts fulfilling ideal but not realistic market conditions. Beyond this specific application, this innovative approach could be readily applied to oil or power fundamental models. * The views expressed are those of the author and do not necessarily reflect the views of ENGIE.
Transcript of STUDYING BOOM-BUST CYCLES IN NATURAL GAS PRODUCTION …

1
STUDYING BOOM-BUST CYCLES
IN NATURAL GAS PRODUCTION ASSETS INVESTMENTS
Joël Enderlin*
ENGIE, Strategy Division, Center of Expertise in Economic and Modeling Studies
1 et 2 Place Samuel de Champlain, Faubourg de l’Arche, 92930 Paris La Défense, France
BIEE 11th Oxford Research Conference, 21-22 September 2016, Oxford, United Kingdom
Key words: natural gas markets, news investment-specific shocks, agent-based modeling, path-
dependence, dynamic disequilibrium, irreversibility, boom-bust cycles.
Abstract
During the past decade, the global natural gas market has witnessed a series of critical upheavals:
increasing market volatility, greater geopolitical risks, ever-growing hazardous market cycles,... In this
disrupted environment, the use of models capable of representing the genuine dynamic of gas market
fundamentals has become decisive for the gas industry to generate the most reliable long-term forecasts.
However, conventional natural gas models usually neglect the effects of dynamic path-dependence and
independent agent behaviors by assuming that the market stands in a permanent state of equilibrium.
The new model therefore aims at exploiting these two disregarded concepts to represent the natural gas
market as an evolving and complex system. To this end, the new approach consists in building the
dynamic path resulting from the progressive realization of the natural gas market with an advanced
rolling optimization model.
In accordance with the principle of causality, the non-coordinated an irreversible investment decisions in
natural gas production assets made by independent market players at a given date have a direct and
structural impact on the market configuration over the following years. Associated with a thorough
representation of the progressive depletion of existing natural gas resources, the model may lead to
market conditions which deviate from equilibrium. More specifically, the model can exhibit endogenous
boom-bust cycles characterized by a succession of oversized expansion periods followed by critical
contraction periods.
The aim of this new rolling model is to help decision makers in the natural gas sector to better assess
incoming risks and opportunities by providing them with the most likely market forecasts rather than
with market forecasts fulfilling ideal but not realistic market conditions. Beyond this specific application,
this innovative approach could be readily applied to oil or power fundamental models.
* The views expressed are those of the author and do not necessarily reflect the views of ENGIE.

2
Introduction
The objective of this effort is to initially build a framework that allows the observation of endogenous
disequilibrium in Natural Gas (NG) markets. These phenomenon emerge as an endogenous consequence
of the dynamic evolution of NG markets combined with the independence of market players and the
irreversibility of their investment decisions.
In this respect, the first section describes the theoretical limitations of the current economic paradigm to
address market disequilibrium. Then, the second and third sections respectively present the new
theoretical solution and its technical implementation with an innovative simulation model. Finally, the
last section provides the preliminary results of the model focusing on generating a series of Boom-Bust
cycles in NG production assets investments.
1. Current theoretical limitations in addressing market disequilibrium
Context
Global NG markets have shown significant developments over the last couple of years. First of all, the
emergence of shale gas in the United States has upset the historical panel of global NG market players.
For decades, conventional NG reserves were indeed developed field by field with significant
development periods. This paradigm is now over with the arrival of several thousand new US shale gas
producers incrementing production capacities on a well by well basis at a much faster rate. Under
pressure of this massive source of supply, the Henry Hub spot price recently hit historical lows and the
country is now expected to become a major Liquefied Natural Gas (LNG) exporter in the coming years.
Furthermore, the secondary effects of the 2011 nuclear accident of Fukushima on NG markets have now
reached their consequential climax. Initially, the immediate and mass substitution of nuclear power
production by NG-fired power production boosted both Asian NG import prices and expected forward
prices. As a consequence, a large series of investment decisions were made on the basis of optimistic
medium-term forecasts to supply this newly-expected increase in LNG demand as seen from 2012-2013.
Thus, most of these liquefaction plants will be commissioned in the coming years, adding to the already
significant LNG supply from the US.
If we also consider the additional NG exports expected from Iran following the end of international
sanctions as well as doubts on China increase in NG demand, global NG prices should remain low. If the
combination of these events is particularly complex, at least one conclusion appears from this quick
analysis: global NG markets are arguably out of a long-term equilibrium.

3
The aftermaths of this situation are severe: in the medium term, recent investments’ profitability is
directly threatened as revenues from NG are not sufficient to cover the full costs of capital. This concern
appears in several regions around the world even in historical oil and gas producing countries such as e.g.
Russia (Yamal LNG). As a result, major investment projects which have not yet been sanctioned are now
postponed while waiting for better days to come. In the longer term, strong upward pressure on NG
markets resulting from a combination of producing assets depletion and likely underinvestment cannot be
excluded. For these reasons, the use of models capable to represent the genuine dynamic of NG markets
fundamentals has become decisive for the NG industry to generate the most reliable long-term forecasts.
Limitations of the paradigm on market equilibrium
Most of commodity economic modeling systems rely on the assumption that a competitive market tends
to an endogenous state of equilibrium. In this paradigm, demand and supply quantities of a commodity
are both considered as functions of price and the market price is established through competition such
that the volume bid and the volume asked are equalized. This market equilibrium is assumed to be stable
and to occur at any time scale in such a manner that economic market players’ plans are in equilibrium.
This optimal approach results in the complete coordination of each market player decision to minimize
costs and to maximize total welfare. By construction, this approach prevents the development of any
endogenous market disequilibrium in general and the occurrence of business cycles in particular.
This classical approach suffers from two important limitations which are closely linked. First, it neglects
the effect of time or in other words, the physical principle of causality whereby the cause precedes the
consequence. Indeed, in the classical endogenous equilibrium framework, the problem is equivalent to
considering an omniscient global planner who makes the most relevant choices to minimize the global
cost to satisfy the demand both in space and time. For example, a decrease in demand will result in an
alternative static equilibrium by assuming that a competitive market generates by itself the necessary
forces to return the system to equilibrium. Unfortunately, the dynamic path used by the system to move
from the initial to the final states is not taken into account. That is to say, the path used by different
market players to step forward in time by adapting their own situations to the new market conditions is
considered as immediately solved, and of no consequence.
The second limitation is related to the high heterogeneity of market players: a commodity market brings
together many different types of market players with different individual opportunities, constraints,
motives and strategies at various time scales. For illustration, a commodity producer who expects to
make an industrial investment profitable in the long term will not adjust its position to a decrease in the
demand as easily as a commodity trader who can balance its positions on a highly liquid spot market.
However, these market players are not interchangeable and both are required to ensure the effective
functioning of the market.
4
In their preliminary works on supply shock propagation in the US natural gas market, Outkin et al.
(2014) provide a synthetic review of some attempts which are emerging to challenge the paradigm of
general and partial equilibrium. Among them, the approach to planning and optimization of energy
networks by Beck et al. (2008) is of special interest as it focuses on the combination of a global
optimization system with Agent-Based Modeling (ABM) tools to model the inherent complexity of an
energy network development. Furthermore, Lee and Yao (2013) demonstrate the relevance of using
ABM systems to model the endogenous penetration of technology in an evolving economic environment.
Finally, Chappin et al. (2010) propose an innovative combination of equation based modeling and ABM
modeling to exhibit the endogenous emergence of a spot market within the LNG market.
Beyond the debate on equilibrium within the market, many efforts have been underway to study the
impact of news shocks on macroeconomic fluctuations on the basis of Beaudry et al. (2006) work. While
providing evidence from forecast data to validate this concept, Miyamoto et al. (2014) define news
shocks as information about future fundamentals that does not affect current fundamentals. When
economic agents become aware of such forthcoming changes, they adjust their positions accordingly, and
thus cause economic fluctuations on realized data. At this level, it has to be noticed that the physical
succession of events over time is difficult to challenge. Furthermore, Fisher (2006) demonstrates that
specific investment shocks drive the majority of macroeconomic business cycles. Benati (----) explores
the combination of both concepts and concludes that news investment-specific shocks play the most
important role to explain the succession of upward and downward macroeconomic fluctuations.
This paper: methodology, motivation and preliminary results
This paper presents the implementation of an innovative combination of ABM and system dynamics to
explore the endogenous emergence of disequilibrium within the global NG market. Whereas the study of
disturbances propagation generally focuses on the resilience of a market in the aftermath of exogenous
shocks (eg. the increase in LNG demand following the 2011 Fukushima nuclear accident), the new
approach aims at analyzing the endogenous trend generated by the NG market itself (eg. the reasons why
the market currently moves toward a LNG liquefaction overcapacity on its own). These disequilibria
appear as the consequence of the propagation of news investment-specific disturbances. These
disturbances are endogenously generated by the imbrications at different time scales of non-reversible
investment decisions made by independent market players with the maximum information available at a
specified date. The main features which support this approach have been listed by Outkin et al. (2014).
This paper relies on four of these features:
Non-equilibrium: NG market has recently experienced major structural transformations. Several
evolutions can be mentioned at this point like the emergence of US shale gas resources which
upsets the worldwide NG supply, the further growth of the LNG supply from Australia with the

5
commissioning of large-scale liquefaction plants such as Golar LNG (GLNG) or Australia
Pacific LNG (APLNG)… As a result, the global NG market is apparently out of a long-term
equilibrium.
Independence: at a given date, economic agents make their decisions independently of one
another with the willingness to beat the market. Nevertheless, an obvious link appears between
all players a posteriori as every decision impacts the market during its implementation.
Path-dependence and emergence: the market configuration at a given date ensues from the
combination of all decisions made in the past. Thus, the market goes forward step by step and the
evolution of the entire system traces a path which may exhibit emergence phenomena.
Heterogeneous time scales: the evolution of a commodity market results from the interaction of
different market players trying to fulfil objectives at different time horizons. Schematically, a
trader focuses on his short term profits and losses whereas a NG producer has a special interest
in the long term direction of the market.
Finally, the paper presents the preliminary results provided by this simulation system based on a limited
dataset. It shows to which extent the combination of investment decisions in NG production assets made
by independent players trigger endogenous news investment-specific shocks which will cause structural
and endogenous disequilibrium to develop in the market. In particular, the simulation exhibits the
emergence of boom-bust cycles properties characterized by a succession of oversized expansion periods
followed by sudden and critical contraction periods.
2. Theoretical model
An step by step description of observed NG economic rules
This description consists in analyzing the NG market as the combination of two aspects which
complement each other along the arrow of time.
The first process involves all activities associated with the allocation of NG physical flows to satisfy
demand at the least cost. These flows are allocated in the short term by considering a given and fixed set
of production capacities and constraints such as e.g. transportation infrastructures and contracts which
have been commissioned or entered into in the past. Since investment decisions are irreversible, these
assets will be available in a configuration considered much earlier in the past to supply the NG market
and so long as NG prices meet the variable cost of operation commonly known as the OPEX regime.
Indeed, should prices fall so much that a given asset can no longer repay the debt obligations to the
creditors, the asset will not be demolished. It will be put under administration and sold out at the value
of its expected discounted cash flow given the depressed prices which will at the lowest be its OPEX
regime. Only if prices fall structurally below the OPEX regime will the foreclosed capacity be
mothballed or abandoned.

6
The second aspect of the NG market relates to investment dynamics which are based on medium and
long term NG market forecasts. Most of NG market forecasts achieved at a year 𝑌𝑖 currently assume that
the market is in a stable and static equilibrium. These forecasts are then massively used to supply a series
of business plans studies, in particular, in NG production assets investments. These business plans
mainly rely on the thorough examination of micro-economic indicators such as e.g. the Net Present
Value (NPV) or the Internal Rate of Return (IRR). Assuming no capital rationing, two options are then
possible for each business plan: either the business plan fulfils all financial constraints leading to an
irreversible Final Investment Decision (FID) or the project is not validated. In the latter situation
mentioned, the project remains in the developer's portfolio but it is postponed from year to year so long
as the successive market forecasts are not favorable. It should be pointed out that any investment project
aims at generating a positive margin by repaying at least all fixed and variable costs. For this reason, all
projects submitted to an investment committee are tested against their full cost of production. All these
investment decisions are made independently from each other by autonomous market players who try to
maximize their own expected profit by relying on market forecasts as the best view of the future they
may have during the year 𝑌𝑖. The FID decisions in the real world are made even more binding due to the
significant use of third party contracts and debt in the NG sector to build and finance projects
development. Should prices collapse during a project’s construction phase, contracts and loans made
earlier with contractors and bankers are binding.
The aggregation of irreversible decisions in investing or postponing production projects generates news
investment-specific shocks which appear throughout the proceeding of time and propagate within the
market. In parallel, the flow allocation of the year 𝑌𝑖 leads to the physical depletion of some NG
resources whereas some other resources have been postponed because they did not prove sufficient
economic performance to be produced. In consequence, market players take into account these both
achieved and forthcoming evolutions to adjust their own position accordingly as early as the year 𝑌𝑖+1. In
the current way to proceed, this will constitute the basis of a new static market forecast which will be
used to invest in new production capacities,...
This short and pragmatic description of reality provides with two significant insights. Firstly, a dynamic
market description is necessary to ensure a good understanding of the whole process. Again due to the
principle of causality, series of events follow each other and the market configuration which will be
available in 20 years will result from the specific path followed by the progressive realization of the
market along these 20 years. Secondly, market players are independent and do not coordinate their
investment decisions. For this reason, a system based on ABM is crucial to deliver a relevant market
forecast.

7
Taking time into consideration
The first step consists in defining different levels of temporal projections within the model. For this
purpose, the set of observed economic rules described above is represented through a 2 temporal
dimensions prism: the first temporal dimension [0] is the actual realization of the market through the
allocation of physical flows. The second temporal dimension [1] corresponds to the market forecast
achieved by analysts at a given date from the temporal dimension [0] to evaluate investment
opportunities. By nature of a forecast, nothing guarantees the achievement in reality (or in the temporal
dimension [0]) of the market evolutions described within the temporal dimension [1].
Figure 1 Conceptualization of observed economic rules within two temporal dimensions
The new approach aims at endogenising the observed economic rules by considering the imbrications of
the above described two temporal dimensions into a third one [2]. In other word, the new model is based
on a rolling system of endogenous forecasts [2] which will probably never be achieved within the
temporal dimension [1]. In accordance with the description of observed economic rules, it has to be
noticed that these forecasts assume a market equilibrium both in the short and long term.
Figure 2 Imbrications of observed economic rules within an additional temporal dimension

8
The model then increments time forward one year after another in the temporal dimension [1] and for
each step, the model generates a medium-term forecast in the temporal dimension [2]. These forthcoming
evolutions then lead market players to adjust their positions from the following year in dimension [1]. By
doing so, their decisions impact the market configuration over the following years both from the
temporal dimensions [1] and [2] and a specific path emerges from the market simulation. In other words,
news shocks take the form of the implication of medium-term forecasts generated in the temporal
dimension [2]. Finally, the forecast as seen from the time space [0] is obtained through the concatenation
of all steps on the path followed within the temporal dimension [1].
This being said, it is now possible to better represent the three temporal dimensions by positioning
ourselves in an expected temporal dimension [-1], or in a word, extract ourselves from the imbrications
of temporal dimensions and take the helicopter view as summarized below. Hopefully, it will be the task
of actual NG analysts in the coming years should they use this type of model.
Figure 3 Temporal imbrications matrix as perceived from the temporal dimension [-1], a.k.a. ‘helicopter view’
In this paper, the approach is limited to a representation of time in three dimensions. More precisely, the
model remains relevant in forecasting market evolutions so long as its user exploits exactly one temporal
dimension more than other market players do.
Which choices for which economic agents?
Within the timeframe presented above, the simulation model endogenously generates different types of
market evolutions to dynamically move from the market configuration as seen from the year 𝑌𝑖 to the
market configuration as seen from the year 𝑌𝑖+1.
Market evolutions occurring in the temporal dimension [1]: they are achieved by players
operating NG production assets which were already invested in the past. This means that no
9
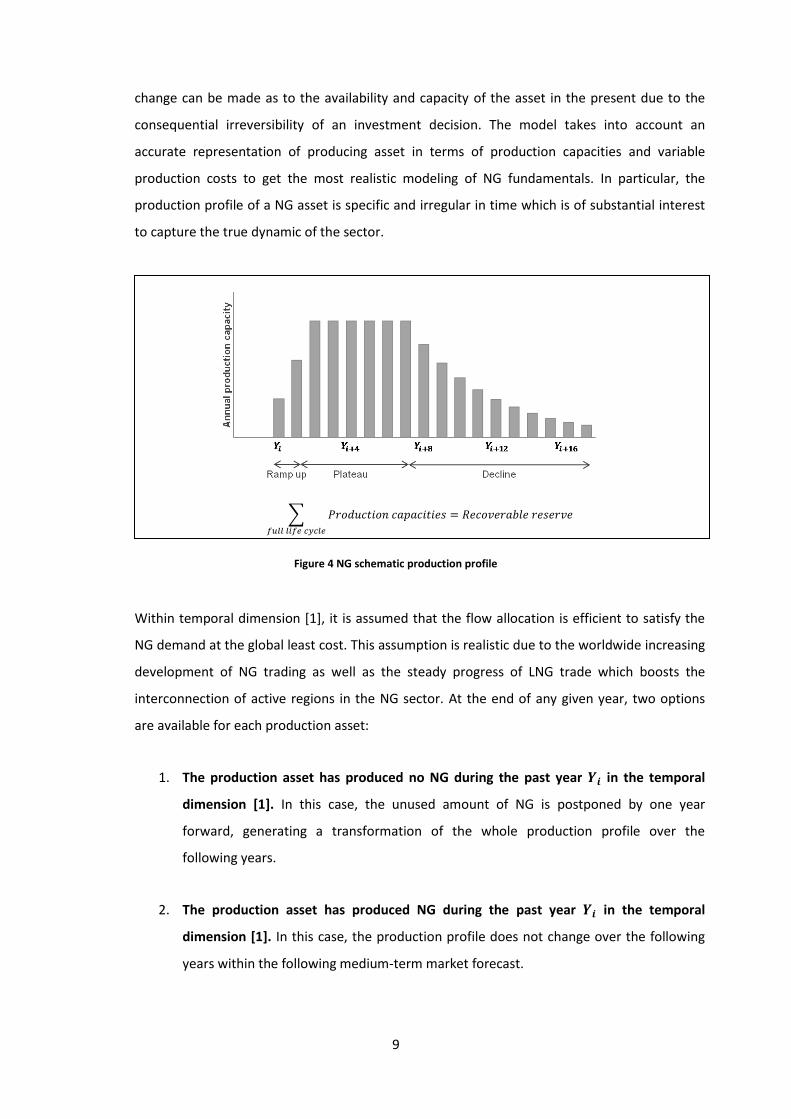
change can be made as to the availability and capacity of the asset in the present due to the
consequential irreversibility of an investment decision. The model takes into account an
accurate representation of producing asset in terms of production capacities and variable
production costs to get the most realistic modeling of NG fundamentals. In particular, the
production profile of a NG asset is specific and irregular in time which is of substantial interest
to capture the true dynamic of the sector.
∑ 𝑃𝑟𝑜𝑑𝑢𝑐𝑡𝑖𝑜𝑛 𝑐𝑎𝑝𝑎𝑐𝑖𝑡𝑖𝑒𝑠
𝑓𝑢𝑙𝑙 𝑙𝑖𝑓𝑒 𝑐𝑦𝑐𝑙𝑒
= 𝑅𝑒𝑐𝑜𝑣𝑒𝑟𝑎𝑏𝑙𝑒 𝑟𝑒𝑠𝑒𝑟𝑣𝑒
Figure 4 NG schematic production profile
Within temporal dimension [1], it is assumed that the flow allocation is efficient to satisfy the
NG demand at the global least cost. This assumption is realistic due to the worldwide increasing
development of NG trading as well as the steady progress of LNG trade which boosts the
interconnection of active regions in the NG sector. At the end of any given year, two options
are available for each production asset:
1. The production asset has produced no NG during the past year 𝒀𝒊 in the temporal
dimension [1]. In this case, the unused amount of NG is postponed by one year
forward, generating a transformation of the whole production profile over the
following years.
2. The production asset has produced NG during the past year 𝒀𝒊 in the temporal
dimension [1]. In this case, the production profile does not change over the following
years within the following medium-term market forecast.

10
Figure 5 Dynamic depletion of producing assets within the temporal dimension [1]
By doing so, the model insures the consistency between NG recoverable reserves and the sum of
all production capacities while allowing a dynamic representation of resources depletion.
Market evolutions occurring in the temporal dimension [2]: these evolutions are linked to
players assessing investment opportunities in production assets within the model. The choice of
investing or not is made by the model on the basis of microeconomic indicators as a realist
investment committee would. This evaluation combines the key characteristics of the
production asset in terms of costs (CAPEX, OPEX, taxes) and technical aspects (NG production
profile, NG reserves) with the static market price forecasted within the medium-term forecast
market prices generated in the temporal dimension [2] to estimate NG expected revenues. For
each asset, the model is currently able to study the assessment of a primary and three secondary
indicators identified as reference indicators for assessing an investment by Brealey et al. (2013):
1. Primary indicator: the net present value (NVP).
2. Secondary indicator: the internal rate of return (IRR).
3. Secondary indicator: the profitability index (PI).
4. Secondary indicator: the payback period (PP).
These indicators are then compared with criteria which represent the decision rules of the
projects portfolio manager. These criteria may vary from one actor to another. The conclusion is
then Boolean:

11
1. At least one investment criterion is not validated: in this case, the project remains in
the portfolio but it is postponed by one year. The investment will be assessed again the
following year upon considering the updated medium-term market forecasts of the
temporal dimension [2] generated in 𝑌𝑖+1. As long as the investment is not validated, the
project is postponed and will only appear in market forecast of the temporal dimension
[2]. Consistently with the investment criteria aiming at recovering the full costs over the
full life cycle of the project, the asset is assessed against its full cost of production within
the temporal dimension [2].
2. The microeconomic evaluation validates all investment criteria: in this case, the
investment decision is irreversibly sanctioned. As soon as the period between the FID
date and the asset commissioning date has elapsed in the temporal dimension [1], the
production capacity of this project becomes subject to the short term market
evolutions occurring within the temporal dimension [1]. It has to be noticed that the
completion period varies from asset to asset depending from their size and their
environment, from a few months for a shale well to a decade for large Russian fields.
Figure 6 Dynamic representation of investment
Considering that market players make choices at a given date by looking forward at news investment-
specific shocks propagation, a macro-supply development plan therefore emerges from micro-economic
foundations combining realistic analytical accounting and corporate finance. All investment
opportunities are evaluated independently one from another as market players make their decisions in a
non-concerted manner.

12
3. Technical description of the simulation model
The new approach is based on the use of an existing global NG fundamental model which represents NG
markets with a series of nodes associated with static NG supply and/or demand curves. Nodes are
interlinked together with transmission infrastructures including both pipes and LNG chain (liquefaction,
shipping and regasification). Each production and transmission infrastructure asset is associated with
relevant costs. The model then optimizes NG flows allocation to satisfy the demand of each node at the
global least cost by using a Mix-Integer Linear Program (MILP). The market price of each consumption
node is then defined as the marginal cost of supply of the given node. In accordance with the observed
NG economic rules described above, this traditional model is used to generate medium-term forecasts
assuming a static equilibrium over the time horizon.
Year by year running within the temporal dimension [1], the outputs from the optimization model are
read and subsequently analyzed by a Python program. This program first focuses on the possible non-
utilization of producing assets to consequently postpone their production profile by one year. The
program then analyses each node’s NG price forecast to feed-in production assets business plans which
will be evaluated for FID. The inputs of the following run by the optimization model are then totally
reconfigured according to theses analyses.
4. Preliminary results on the emergence of Boom-Bust cycles
Understanding Boom-Bust cycles dynamics
Various justifications have been investigated to understand and explain Boom-Bust cycles, that is to say
in the present case, periods in which NG prices rise and then crash. Such behaviors are usually assumed
to require a combination of temporal and social myopic behaviors. According to Rey (2014), the
temporal dimension of myopic behavior is presented as the a priori limitation in estimating the long-term
consequences of short-term decisions whereas the social myopic behavior is described as the a priori
knowledge limitation of decisional entities in a decentralized market. Together, these concepts result in a
non-optimal organization of the market and thus in market disequilibrium.
We believe another fundamental aspect is at play here. For this purpose, an analogy with the observer
effect commonly used in physics is of special relevance. It occurs when observation cannot be achieved
without affecting the system. By analogy in the above described new approach on NG markets modeling,
the system physical evolution is described within the temporal dimension [1] whereas observations relate
to the market forecasts in dimension [2]. Thus, any observation of current market conditions by a player
part of the game will alter his expectations, hence his decisions (whether to invest or postpone the
project) which will in turn alter the market. This causality loop binds the sequential succession of

13
observations, the consequential evolution of expectations, the investment decisions, and finally the
impact on the market. It is impossible to build a model free from this causality loop unless making
chicken and egg type assumptions as to which player plays first. As a consequence, a fundamental
property of this model is that market players can either know the state of the market or know which
investment decisions they will make but no both at the same time. The awesome powers of this property
are demultiplied as the number of nodes, players and project increases.
Figure 7 The causality loop
It has to be noticed that the hereby proposed framework assumes no a priori social myopic behavior as
described above. There is no limitation of knowledge linked to a narrower visibility of the entire system
as all market players share the same forecast. Nevertheless, as suggested above, a partial knowledge
frontier emerges from the independence of market players making their investment decisions in a non-
concerted manner. By construction, the temporal dimension of myopic behavior is effective through the
causality loop.
Objectives and assumptions of the simulation
The objectives of this preliminary simulation is to observe the dynamics of a series of boom-bust cycles
within a theoretical and limited dataset. The simulation test is based on an isolated node associated with a
NG demand curve and a series of NG production assets.
The NG demand is static, steadily increasing.
The production capacities as perceived from the year 𝑌0 are split into two groups: the first group
includes all production assets which were sanctioned in the past and which are immediately
available within the temporal dimension [1]. The second group includes a series of forthcoming
production assets which are available for investment within the temporal dimension [2].
Observation Market evolutions in dimension [1]
Evolution of expectations Market forecast in dimension [2]
Impact on the market Assessment of business plans

14
Figure 8 Assumptions on NG demand (left) and NG production capacities (right) as seen from year Y0 (bcm/y)
The simulation model is then launched over a 18 year-long period in the temporal dimension [1] coupled
with a series of 20 year-long forecasts in the temporal dimension [2]. In this first simulation, we consider
a strictly positive NPV as the minimal constraint to sanction an investment.
Results
Figure 9 Results on NG prices ($/MMBtu)
The output of the model shows two boom-bust cycles in the temporal dimension [1]. Within the 7 first
years of this temporal dimension, most of available production projects are postponed year by year
because the successive NG price forecasts of the temporal dimension [2] are not high enough to sanction
these investments. For this reason, the NG demand of the temporal dimension [1] has to be satisfied with
supply sources which were sanctioned in the past but which present a higher cost of use. As a
consequence, the NG prices of the following years within the temporal dimension [1] are systematically
higher than previously expected. This dynamic is strengthened over time with the progressive depletion
of the NG resources used within the temporal dimension [1]. In other words, the system runs in under-
capacity regime, progressively generating the Boom effect corresponding to an increase in NG prices due
to a lack of investment.

15
The market forecast generated from the year 𝑌6 reaches record levels in comparison with the previous
ones. This optimistic view of future then attracts investors and all production projects which were
postponed until then are suddenly sanctioned. Upon entering into service, those newly-commissioned
capacities force the NG price to collapse as the market of the temporal dimension [1] is suddenly
provided with abundant production capacities with low variable costs of using. This first wave of
investments causes a contraction period which corresponds to the Bust phenomenon. These depressed
market conditions then result in a freeze of investments in new production assets which drives prices up
again, thus leading the market to a new Boom-Bust cycle etc. The results on NG production assets
investments and use are in line with observed prices and industry behavior. In particular, the two waves
of sanctioned investments are clearly visible.
Figure 10 NG production capacities as seen from year Y0 (left)
awarded production capacities in dimension[1] (center) physical flows allocation in the temporal dimension [1] (right)
Conclusions and next steps
This paper highlights the relevance of merging agent-based modeling with dynamic market modeling in
order to represent the genuine dynamics of NG market fundamentals. In this respect, we demonstrate the
possibility of endogenous market disequilibria emergence from the temporal imbrications of irreversible
investment decisions made by independent market players on the basis of micro-economic foundations.
The preliminary results of the simulation models show the occurrence of Boom-Bust cycles which are
characterized by a succession of oversized expansion periods followed by critical contraction periods.
Additional works have already been completed to pursue this new path. These developments include the
dynamic modeling of the price elasticity of NG demand, the dynamic modeling of market power of
strategic NG producers and the dynamic modeling of investments in NG transportation infrastructures
(pipes and LNG). On top of the above, other development works have been undertaken such as the study
of exogenous shocks propagating within the simulation model, the adaptation of this new framework to
other commodity markets (power, oil) and finally, the simultaneous combination of such commodity
models (multi-energy demand, power, oil, NG).

16
Acknowledgment
The author is grateful to Jean-Baptiste Dubreuil, Benoît Dal Ferro, Roman Simcik, Adrien Soudan,
Andreas Ehrenmann and Audrey Giffard for their helpful comments and insightful feedback on this work
and this paper.
References
Beaudry P., Portier F., 2006, Stock prices, News, and Economic Fluctuations, American Economic
Review, 96(4), 1293-1307.
Beck J., Kempener R., Cohen B. and Petrie J., 2008, A Complex Systems Approach to Planning,
Optimization and Decision Making for Energy Networks, Energy Policy, 36, pp.2795-2805.
Benati L., ----, Investment-Specific and Neutral News Shocks and Macroeconomic Fluctuations,
University of Bern.
Brealey R., Myers S., Allen F., 2013, Principles of Corporate Finance, 11th edition, McGraw-Hill/Irwin.
Chappin E.J.L, Praet R. and Kijkema G.P.J, 2010, Transition in LNG Markets: Combining Agent-Based
Modeling and Equation Based Modeling, IAEE Conference, Rio de Janeiro, Brazil.
Fisher, J.D., 2006, The Dynamic Effect of Neutral and Investment-Specific Technology Shocks, Journal
of Political Economy, 114, 413-451.
Lee T., Yao R., 2013, Incorporating Technology Buying Behavior into UK-Based Long Term Domestic
Stock Energy Models to Provide Improved Policy Analysis, Energy Policy, 52, pp. 363-372.
Miyamoto W., Nguyen T.L., 2014, News Shocks and Business Cycles: Evidence from Forecast Data,
Columbia University.
Outkin A.V., Vargas V., Barter G.E., 2014, An Agent-Based Modeling Approach to non-Equilibrium
Dynamics of Natural Gas Supply Shock Propagation, IAEE Conference, New York City, USA.
Rey Z.R., 2014, Reducing Myopic Behavior in FMS Control: a Semi-Heterarchical Simulation
Optimization Approach, Université de Valenciennes et du Hainaut-Cambresis.