STUDY UNIT SEVEN AUDIT SAMPLING - Gleim … UNIT SEVEN AUDIT SAMPLING ... methods that permit a...
38
STUDY UNIT SEVEN AUDIT SAMPLING (23 pages of outline) 7.1 Fundamentals of Probability ................................................ 217 7.2 Statistics ............................................................... 221 7.3 Statistical Sampling ....................................................... 224 7.4 Sampling ............................................................... 226 7.5 Attribute Sampling ........................................................ 230 7.6 Variables Sampling -- Classical .............................................. 232 7.7 Variables Sampling -- Monetary-Unit .......................................... 234 7.8 Selecting the Sampling Method .............................................. 235 7.9 Process Control Techniques ................................................ 235 The results of internal auditing work often have some uncertainty because resource limitations require internal auditors to use sampling. The costs of a complete review of records, transactions, events, performance of control procedures, etc., may exceed both the benefits and the available resources. In these cases, sampling must be done. Thus, internal auditors may apply statistical methods that permit a quantitative assessment of the accuracy and reliability of the sample results. In this way, the internal auditors can evaluate their hypotheses about the matters tested and reduce uncertainty to an acceptable level. 7.1 FUNDAMENTALS OF PROBABILITY Overview 1. Probability is important to management decision making because of the unpredictability of future events. According to definitions adopted by some writers, a. Decision making under conditions of risk occurs when the probability distribution of the possible future states of nature is known. b. Decision making under conditions of uncertainty occurs when the probability distribution of possible future states of nature is not known and must be subjectively determined. 2. Probability provides a method for mathematically expressing doubt or assurance about the occurrence of an event. The probability of an event varies from 0 to 1. a. A probability of 0 means the event cannot occur. A probability of 1 means the event is certain to occur. b. A probability between 0 and 1 indicates the likelihood of the event’s occurrence. For example, when a fair coin is flipped, the probability that it will land with a given side up is 0.5. 3. Subjective probabilities are based on judgment. In business, subjective probability may indicate the degree of confidence a person has that a certain outcome will occur. a. For example, a manufacturer projecting demand for its product is developing expectations about the overall economy. Management estimates the probability of 1% growth in GDP to be high, 1.5% growth to be medium, and 2% growth to be low. 217
Transcript of STUDY UNIT SEVEN AUDIT SAMPLING - Gleim … UNIT SEVEN AUDIT SAMPLING ... methods that permit a...

STUDY UNIT SEVENAUDIT SAMPLING
(23 pages of outline)
7.1 Fundamentals of Probability . . . . . . . . . . . . . . . . . . . . . . . . . . . . . . . . . . . . . . . . . . . . . . . . 2177.2 Statistics . . . . . . . . . . . . . . . . . . . . . . . . . . . . . . . . . . . . . . . . . . . . . . . . . . . . . . . . . . . . . . . 2217.3 Statistical Sampling . . . . . . . . . . . . . . . . . . . . . . . . . . . . . . . . . . . . . . . . . . . . . . . . . . . . . . . 2247.4 Sampling . . . . . . . . . . . . . . . . . . . . . . . . . . . . . . . . . . . . . . . . . . . . . . . . . . . . . . . . . . . . . . . 2267.5 Attribute Sampling . . . . . . . . . . . . . . . . . . . . . . . . . . . . . . . . . . . . . . . . . . . . . . . . . . . . . . . . 2307.6 Variables Sampling -- Classical . . . . . . . . . . . . . . . . . . . . . . . . . . . . . . . . . . . . . . . . . . . . . . 2327.7 Variables Sampling -- Monetary-Unit . . . . . . . . . . . . . . . . . . . . . . . . . . . . . . . . . . . . . . . . . . 2347.8 Selecting the Sampling Method . . . . . . . . . . . . . . . . . . . . . . . . . . . . . . . . . . . . . . . . . . . . . . 2357.9 Process Control Techniques . . . . . . . . . . . . . . . . . . . . . . . . . . . . . . . . . . . . . . . . . . . . . . . . 235
The results of internal auditing work often have some uncertainty because resource limitationsrequire internal auditors to use sampling. The costs of a complete review of records, transactions,events, performance of control procedures, etc., may exceed both the benefits and the availableresources. In these cases, sampling must be done. Thus, internal auditors may apply statisticalmethods that permit a quantitative assessment of the accuracy and reliability of the sample results.In this way, the internal auditors can evaluate their hypotheses about the matters tested and reduceuncertainty to an acceptable level.
7.1 FUNDAMENTALS OF PROBABILITY
Overview
1. Probability is important to management decision making because of the unpredictability offuture events. According to definitions adopted by some writers,
a. Decision making under conditions of risk occurs when the probability distribution ofthe possible future states of nature is known.
b. Decision making under conditions of uncertainty occurs when the probabilitydistribution of possible future states of nature is not known and must be subjectivelydetermined.
2. Probability provides a method for mathematically expressing doubt or assurance about theoccurrence of an event. The probability of an event varies from 0 to 1.
a. A probability of 0 means the event cannot occur. A probability of 1 means the event iscertain to occur.
b. A probability between 0 and 1 indicates the likelihood of the event’s occurrence. Forexample, when a fair coin is flipped, the probability that it will land with a given sideup is 0.5.
3. Subjective probabilities are based on judgment. In business, subjective probability mayindicate the degree of confidence a person has that a certain outcome will occur.
a. For example, a manufacturer projecting demand for its product is developingexpectations about the overall economy. Management estimates the probability of1% growth in GDP to be high, 1.5% growth to be medium, and 2% growth to be low.
217

4. Objective probabilities are based on logic or actual experience.
a. For example, in rolling fair dice, each face on a single die is equally likely to turn up.Thus, the probability of that event is one in six (.166667).
Coin TossOutcome Chances DecimalSide A 1 in 2 0.5Side B 1 in 2 0.5Total 1.0
Die RollOutcome Chances Decimal1 Dot 1 in 6 0.1666672 Dots 1 in 6 0.1666673 Dots 1 in 6 0.1666674 Dots 1 in 6 0.1666675 Dots 1 in 6 0.1666676 Dots 1 in 6 0.166667Total 1.000000
Card DrawOutcome Chances Decimal2 of Clubs 1 in 52 0.0192313 of Clubs 1 in 52 0.0192314 of Clubs 1 in 52 0.0192315 of Clubs 1 in 52 0.0192316 of Clubs 1 in 52 0.0192317 of Clubs 1 in 52 0.0192318 of Clubs 1 in 52 0.0192319 of Clubs 1 in 52 0.019231Any other card 44 in 52 0.846154Total 1.000000
Types of Probability
5. Two events are mutually exclusive if they cannot occur simultaneously.
a. For example, a flipped coin cannot land with both sides up.
6. Two events are independent if the occurrence of one has no effect on the probability of theother.
a. For example, when two dice are rolled, the result of one does not affect the result ofthe other.
7. The conditional probability of two events is the probability that one will occur given that theother has already occurred.
a. For example, the probability of drawing the queen of clubs from a 52-card deck is 1 in52 (0.019231). But if the ace of spades has been removed from the deck, theprobability of drawing the queen of clubs is higher (1 in 51 or 0.019608).
8. The joint probability for two events is the probability that both will occur. It equals theprobability (Pr) of the first event times the conditional probability of the second event, giventhat the first has already occurred.
EXAMPLE
If 60% of the students at a university are male, Pr(male) is 6 in 10 (.6). If 1 in 6 of the male students has a B average,Pr(B average given that a student is male) is 1 in 6 (.166667). Thus, the probability that any given student (male or female)selected at random is both male and has a B average is
Pr(male ∩ B) = Pr(male) × Pr(B|male)= .6 × .166667= .10
218 SU 7: Audit Sampling

9. The probability that either one or both of two events will occur equals the sum of theirseparate probabilities minus their joint probability.
EXAMPLE
Assume that one side of a fair coin is heads and the other tails. If two such coins are flipped, the probability that at leastone will come up heads is calculated as follows:
Pr(one or both coins heads) = Pr(coin 1 heads) + Pr(coin 2 heads) – Pr(coin 1 heads and coin 2 heads)= .5 + .5 – (.5 × .5)= 1.0 – .25= .75
EXAMPLE
In the earlier example, if 1 in 3 (.33334) of all students, male or female, has a B average [Pr(B average) is .33334], theprobability that any given student is male and has a B average is .2 (.6 × .33334). Accordingly, the probability that anygiven student either is male or has a B average is
Pr(male or has B avg.) = Pr(male) + Pr(B avg.) – Pr(B ∩ male)= .6 + .33334 – .2= .7333
The term Pr(B ∩ male) must be subtracted to avoid double counting those students who belong to both groups.
10. The sum of the probabilities of all possible mutually exclusive outcomes of a singleexperiment is 1.0.
EXAMPLE
If two fair coins (H = heads, T = tails) are flipped, four outcomes are possible:
Probability ofCoin #1 Coin #2 This Combination
H H .25H T .25T H .25T T .25
1.00 (certainty)
Expected Value
11. The expected value of a decision (a choice among options) is a weighted average of thepayoffs. Each weight is the probability of the related payoff.
a. The highest expected value is optimal.
1) The decision is under the manager’s control.2) A state of nature is a future event associated with a payoff.3) A payoff is the financial result of (a) the manager’s decision and (b) the state of
nature.
SU 7: Audit Sampling 219

b. The expected value of a decision is calculated by multiplying the probability of eachstate of nature by its payoff and adding the products.
EXAMPLE
Manager is considering the purchase of two identically priced pieces of property, Bivens Tract and Newnan Tract. Theirvalues will change if a road is built.
The following are the states of nature and their probabilities:
Future Stateof Nature (SN) Event Probability
SN 1 No road is ever built. .1SN 2 A road is built this year. .2SN 3 A road is built more than 1 year from now. .7
The following are estimates of values for each state of nature:
Property SN 1 SN 2 SN 3
Bivens Tract US $10,000 US $40,000 US $35,000Newnan Tract $20,000 $50,000 $30,000
The following are the expected values:
ExpectedValue
Bivens Tract: .1(US $10,000) + .2($40,000) + .7($35,000) = US $33,500Newnan Tract: .1(US $20,000) + .2($50,000) + .7($30,000) = US $33,000
Thus, the Bivens Tract is the better investment.
This calculation is a payoff table.
Core Concepts
■ Subjective probabilities are based on judgment. Objective probabilities are based on logic oractual experience.
● Two events are mutually exclusive if they cannot occur simultaneously.● Two events are independent if the occurrence of one has no effect on the probability of
the other.● The conditional probability of two events is the probability that one will occur given that
the other has already occurred.● The joint probability for two events is the probability that both will occur.
■ The sum of the probabilities of all possible mutually exclusive outcomes of a singleexperiment is 1.0.
■ The expected value of a decision (a choice among options) is a weighted average of thepayoffs associated with states of nature (future events). Each weight is the probability ofthe related payoff.
Stop and review! You have completed the outline for this subunit. Study multiple-choicequestions 1 and 2 on page 240.
220 SU 7: Audit Sampling

7.2 STATISTICS
1. A probability distribution specifies the values of a random variable and their respectiveprobabilities. Certain standard distributions seem to occur frequently in nature and haveproven useful in business. These distributions may be classified according to whether therandom variable is discrete or continuous.
a. If the relative frequency of occurrence of the values of a variable can be specified, thevalues taken together constitute a function, and the variable is a random variable.
b. A variable is discrete if it can assume only certain values in an interval. For example,the number of customers served is a discrete random variable because fractionalcustomers do not exist. Probability distributions of discrete random variables includethe following:
1) Uniform distribution. All outcomes are equally likely, such as the flipping ofone coin or even of two coins, as in the example under item 9. in Subunit 7.1.
2) Binomial distribution. Each trial has only two possible outcomes, e.g., acceptor reject. This distribution shows the likelihood of each of the possiblecombinations of trial results. It is useful in quality control.
3) Poisson distribution. An event may occur more than once with randomfrequency during a given period. Examples of applications are the arrival ofcustomers at a service window and the frequency with which trucks areinvolved in traffic accidents.
c. A random variable is continuous if no gaps exist in the values it may assume. Forexample, the weight of an object is a continuous variable because it may beexpressed as an unlimited continuum of fractional values as well as whole numbers.
1) The normal distribution is the most important of all distributions and describesmany physical phenomena. It has a symmetrical, bell-shaped curve centeredabout the mean (see Figure 7-1 on the next page).
2. The shape, height, and width of a population’s curve are related to its measures of centraltendency.
a. The mean is the arithmetic average of a set of numbers.b. The median is the halfway value if raw data are arranged in numerical order from
lowest to highest. Thus, half the values are smaller than the median and half arelarger. It is the 50th percentile.
c. The mode is the most frequently occurring value. If all values are unique, no modeexists.
EXAMPLE
An investor has eight investments and calculates the measures of central tendency for returns on the portfolio.
Mean = Arithmetic average of population values= (US $43,500 + $52,100 + $19,800 + $41,600 + $52,100 + $66,700 + $33,900 + $54,900) ÷ 8= US $364,600 ÷ 8= US $45,575
Median = Midpoint between two central-most population valuesValues ranked: US $19,800; $33,900; $41,600; $43,500; $52,100; $52,100; $54,900; $66,700
= (US $43,500 + $52,100) ÷ 2= US $95,600 ÷ 2= US $47,800
Mode = Most frequent value in population= US $52,100
SU 7: Audit Sampling 221
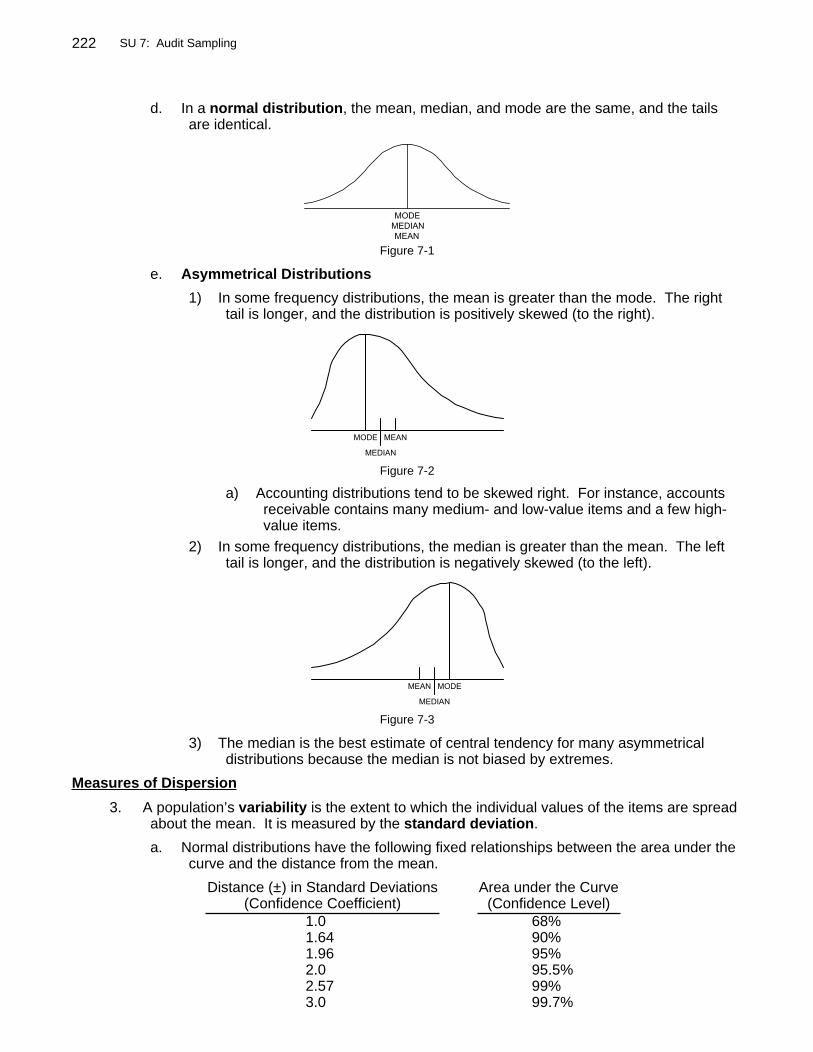
d. In a normal distribution, the mean, median, and mode are the same, and the tailsare identical.
Figure 7-1
e. Asymmetrical Distributions
1) In some frequency distributions, the mean is greater than the mode. The righttail is longer, and the distribution is positively skewed (to the right).
Figure 7-2
a) Accounting distributions tend to be skewed right. For instance, accountsreceivable contains many medium- and low-value items and a few high-value items.
2) In some frequency distributions, the median is greater than the mean. The lefttail is longer, and the distribution is negatively skewed (to the left).
Figure 7-3
3) The median is the best estimate of central tendency for many asymmetricaldistributions because the median is not biased by extremes.
Measures of Dispersion
3. A population’s variability is the extent to which the individual values of the items are spreadabout the mean. It is measured by the standard deviation.
a. Normal distributions have the following fixed relationships between the area under thecurve and the distance from the mean.
Distance (±) in Standard Deviations Area under the Curve(Confidence Coefficient) (Confidence Level)
1.0 68%1.64 90%1.96 95%2.0 95.5%2.57 99%3.0 99.7%
222 SU 7: Audit Sampling

b. The area under the curve is referred to as the confidence level because a personselecting an item at random from a normally distributed population can be, e.g.,95.5% confident that the item will fall between 2 standard deviations of the mean(the mean is defined in item 2.a. on page 221.
EXAMPLE
A certain species of pine tree has an average adult height of 20 feet, with each standard deviation representing 1 foot.The conclusion from the distribution below is that 68% of all trees of this species will reach a height between 19 and 21 feet(1 standard deviation), 95.5% will be between 18 and 22 feet (2 standard deviations), and 99.7% will be between17 and 23 feet (3 standard deviations).
Figure 7-4
Core Concepts
■ A probability distribution specifies the values of a random variable and their respectiveprobabilities.
■ A variable is discrete if it can assume only certain values in an interval. Probabilitydistributions of discrete random variables include the following:
● Uniform distribution● Binomial distribution● Poisson distribution
■ A random variable is continuous if no gaps exist in the values it may assume.■ The shape, height, and width of a population’s curve are related to its measures of central
tendency.
● The mean is the arithmetic average of a set of numbers. The median is the halfwayvalue if raw data are arranged in numerical order from lowest to the highest. Themode is the most frequently occurring value.
● In a normal distribution, the mean, median, and mode are the same, and the tails areidentical.
■ In some frequency distributions, the mean is greater than the mode. The right tail is longerand the distribution is positively skewed (to the right). Accounting distributions tend to beskewed right. In some frequency distributions, the median is greater than the mean. Theleft tail is longer and the distribution is negatively skewed (to the left).
■ A population’s variability is the extent to which the individual values of the items are spreadabout the mean. It is measured by the standard deviation.
Stop and review! You have completed the outline for this subunit. Study multiple-choicequestions 3 and 4 beginning on page 240.
SU 7: Audit Sampling 223

7.3 STATISTICAL SAMPLING
1. Audit testing of every item in a population often is not feasible.
a. For instance, examining every payment voucher for an entity with annual sales ofUS $1 billion would require more time than any auditor could devote to it.
1) Moreover, even if a 100% audit is feasible, the additional reduction of audit riskmay not be meaningful.
2) Fortunately, sampling permits the auditor to state conclusions about thepopulation with measurable reliability.
b. The main issue in sampling is choosing a sample that is representative of thepopulation. Valid conclusions then may be stated about the population.
c. The central limit theorem states that, regardless of the distribution of the populationfrom which random samples are drawn, the shape of the sampling distribution of themean approaches the normal distribution as the sample size is increased.
1) Thus, whenever a process includes the average of independent samples of thesame sample size from the same distribution, the normal distribution can beused as an approximation of that process even if the underlying population isnot normally distributed. The central limit theorem explains why the normaldistribution is so useful.
2) The auditor’s expectation is that a random sample (i.e., one in which everyitem has an equal and nonzero chance of being selected) is representative ofthe population. Thus, the expected value of a random sample of any size is thepopulation mean.
3) The standard error of the mean is the standard deviation of the distribution ofsample means. The standard error is used to compute precision (theconfidence interval; see item 4.a. on the next page). The larger the standarderror, the wider the interval.
a) The auditor may estimate the standard error using a pilot sample.
2. Attribute Sampling and Variables Sampling
a. In attribute sampling, each item in the population has an attribute of interest that isexamined by the auditor. This type of sampling is appropriate for tests of controls,i.e., when there are two possible outcomes (compliance/noncompliance).
1) Because attributes are discrete variables, populations for attribute sampling tendto display the uniform, binomial, and Poisson distributions (see item 1.b. inSubunit 7.2).
b. In variables sampling, each item in the population has a continuous variable that canbe measured. This type of sampling is appropriate for tests of balances, i.e., whenthe outcome is within a monetary range.
1) Conclusions about populations for variables sampling are based on the normaldistribution [see item 1.c.1) in Subunit 7.2].
3. Parametric vs. Nonparametric Statistics
a. A parametric statistic (or parameter) is a numerical characteristic of a populationcomputed using all its elements.
1) The measures of central tendency (mean, median, and mode) are examples ofparameters of a population.
224 SU 7: Audit Sampling

b. A nonparametric (distribution-free) statistic is applied to problems for which rankorder is known, but the specific distribution is not. For instance, a population maycontain various metals ranked in order of hardness but not contain any measure ofhardness.
1) Nonparametric statistics are useful when information about the populationdistribution is lacking.
4. Statistical Calculations Relevant to Sampling
a. Basic precision (also known as the confidence interval) is the range around thesample statistic that is expected to contain the true population parameter.
1) Achieved precision for variables sampling is a function of the standarddeviation based on a pilot sample, the specified confidence level, and thesample size.
a) For attribute sampling, the achieved precision is a function of theachieved upper error rate and the sample rate. (Attribute sampling isconcerned with error rates, so the measure of interest is the upper rate.)
i) The achieved upper error rate is customarily determined from astandard table. It is the intersection of the sample size and thenumber of deviations.
ii) The difference between the upper error rate and the sample rate isthe achieved precision.
b. The confidence level is the percentage of times that one would expect the sample toadequately represent the population. Thus, a confidence level of 90% should resultin samples that adequately represent the population 90% of the time.
1) In other words, given repeated random sampling from a normally distributedpopulation, 90% of the confidence intervals that may be constructed fromsimple random samples will contain the population mean.
c. Testing a null hypothesis is one method for determining whether the tolerabledeviation rate (for attribute testing) or tolerable misstatement (for variables testing)has been exceeded. The null hypothesis is formulated so that rejecting it allows theauditor to make some statement about the population with a specified degree ofconfidence.
1) For example, a quality control department wants to be 95% confident that acertain component operates properly at all pressure levels below 80 kilogramsper square centimeter. The null hypothesis is that the average failure pressureis at least equal to 80 kilograms per square centimeter.
a) If the sample result exceeds a critical value determined for a 95%confidence level, the null hypothesis cannot be rejected.
2) Testing for this condition is far less expensive and time consuming than testingevery component.
d. The t-distribution (also known as Student’s distribution) is a special distribution usedwith small samples (usually fewer than 30) when the population variance isunknown.
1) A t-test can only be applied to a parametric statistic, i.e., some numeric valuethat is calculated for all items in the population.
2) The t-distribution is useful in business because large samples are often tooexpensive. For a small sample, the t-statistic (from a t-table) provides a betterestimate of the standard deviation than that from a table for the normaldistribution.
SU 7: Audit Sampling 225
e. The chi-square distribution is used in testing the fit between actual data and thetheoretical distribution. In other words, it tests whether the sample is likely to be fromthe population, based on a comparison of the sample variance and the estimatedpopulation variance. The chi-square test is useful in business for testing hypothesesabout populations.
1) If the variance of a process is known and a sample is tested to determinewhether it has the same variance, the chi-square statistic may be calculated.
2) A calculated value of the chi-square statistic greater than the critical value in thechi-square table indicates that the sample chosen comes from a population withgreater variance than the hypothesized population variance.
a) The chi-square test is appropriately applied to nominal data, meaning datathat simply distinguish one from another, as male from female.
Core Concepts
■ A sample should be representative of the population. Valid conclusions then may be statedabout the population.
■ The auditor’s expectation is that a random sample (i.e., one in which every item has anequal and nonzero chance of being selected) is representative of the population. Thus, theexpected value of a random sample of any size is the population mean. The standard errorof the mean is the standard deviation of the distribution of sample means.
● In attribute sampling, each item in the population has an attribute of interest that isexamined by the auditor. This type of sampling is used for tests of controls, i.e.,when two outcomes are possible (compliance/noncompliance).
● In variables sampling, each item in the population has a continuous variable that canbe measured. This type of sampling is appropriate for tests of balances, i.e., whenthe outcome is within a monetary range.
■ Basic precision (also known as the confidence interval) is the range around the samplestatistic that is expected to contain the true population parameter. Confidence level is thepercentage of times that one would expect the sample to adequately represent thepopulation.
■ The t-distribution (also known as Student’s distribution) is a special distribution used withsmall samples (usually fewer than 30) when the population variance is unknown. A t-testcan only be applied to a parametric statistic. The t-distribution is useful in businessbecause large samples are often too expensive.
■ The chi-square distribution is used in testing the fit between actual data and the theoreticaldistribution. In other words, it tests whether the sample is likely to be from the population,based on a comparison of the sample variance and the estimated population variance. Thechi-square test is useful in business for testing hypotheses concerning populations.
Stop and review! You have completed the outline for this subunit. Study multiple-choicequestions 5 through 9 beginning on page 241.
7.4 SAMPLING
Definitions
1. Sampling applies an engagement procedure to fewer than 100% of the items under reviewfor the purpose of drawing a conclusion about some characteristic of the population.
a. Nonsampling risk is audit risk not related to sampling. A common audit risk is theauditor’s failure to detect an error in a sample.
1) Nondetection of an error in a sample can be caused by auditor inattention orfatigue. It also can be caused by application of an inappropriate auditprocedure, such as looking for the wrong approvals in a sample of documents.
226 SU 7: Audit Sampling
b. Sampling risk is the risk that a sample is not representative of the population.An unrepresentative sample may result in an incorrect conclusion.
1) One advantage of statistical sampling is that it allows the auditor to quantifysampling risk. An auditor should never attempt to quantify the sampling risk ofa nonstatistically drawn sample.
2. Nonstatistical vs. Statistical Sampling
a. Judgment (nonstatistical) sampling is a subjective approach to determining thesample size and sample selection.
1) This subjectivity is not always a weakness. The internal auditor, based on otherwork, may be able to test the most material and risky transactions and toemphasize the types of transactions subject to high control risk.
b. Statistical (probability or random) sampling is an objective method of determiningsample size and selecting the items to be examined.
1) Unlike judgment sampling, it provides a means of quantitatively assessingprecision or the allowance for sampling risk (how closely the sample representsthe population) and reliability or confidence level (the probability the sample willrepresent the population).
a) Statistical sampling is applicable to tests of controls (attribute sampling)and substantive testing (variables sampling).
2) For example, testing controls over sales is ideal for random selection. This typeof sampling provides evidence about the quality of processing throughout theperiod.
3) However, a sales cutoff test is an inappropriate use of random selection. Theauditor is concerned that the sales journal has been held open to record thenext period’s sales. The auditor should select transactions from the latter partof the period and examine supporting evidence to determine whether they wererecorded in the proper period.
3. Types of Sampling Risk
a. The risk of a Type I error is the risk that the auditor will reject a value that is in factcorrect. This type of error relates to audit efficiency.
b. The risk of a Type II error is the risk that the auditor will accept a value that is in factincorrect. This type of error relates to audit effectiveness and is therefore the moreserious of the two types.
Levels of Sampling Risk
4. The internal auditor controls sampling risk by specifying the acceptable levels of itscomponents when developing the sampling plan.
a. For tests of controls (an application of attribute sampling), sampling risk includes thefollowing:
1) The risk of assessing control risk too low is the risk that the actual control riskis greater than the assessed level of control risk based on the sample. This riskrelates to engagement effectiveness (a Type II error).
2) The risk of assessing control risk too high is the risk that actual control risk isless than the assessed level of control risk based on the sample. This riskrelates to engagement efficiency (a Type I error).
SU 7: Audit Sampling 227

b. For substantive tests (an application of variables sampling), sampling risk includesthe following:
1) The risk of incorrect acceptance is the risk that the sample supports theconclusion that the amount tested is not materially misstated when it ismaterially misstated. This risk relates to engagement effectiveness(a Type II error).
2) The risk of incorrect rejection is the risk that the sample supports theconclusion that the amount tested is materially misstated when it is not. Thisrisk relates to engagement efficiency (a Type I error).
a) If the cost and effort of selecting additional sample items are low, a higherrisk of incorrect rejection may be acceptable.
c. The confidence level (the reliability level) is the complement of the applicablesampling risk factor.
1) Thus, for a test of controls, if the risk of assessing control risk too low is 5%, theinternal auditor’s confidence level is 95% (1.0 – .05).
2) For a substantive test conducted using classical variables sampling, if the risk ofincorrect rejection is 5%, the auditor’s confidence level is 95% (1.0 – .05).
Major Statistical Sampling Methods
5. Random sampling is the most basic statistical sampling method. The term random in thiscontext means that every item in the population has an equal and nonzero chance of beingselected. Computer software greatly simplifies this process.
a. For example, an auditor can enter a range of invoice numbers into a computer-basedrandom number generator. The software ensures that the selection of the invoicenumbers is unbiased.
6. Systematic (interval) sampling is only appropriate when the auditor has reason to believethat deviations or misstatements are evenly distributed throughout the population.
a. Systematic sampling divides the population by the sample size and selects every nthitem after a random start in the first interval [e.g., population of 1,000 items, samplesize of 35, select every 28th item (1,000 ÷ 35 = 28.57)].
b. Systematic sampling is appropriate when, for instance, an auditor wants to testwhether controls were operating throughout an entire year (a random sample mightresult in all items being selected from a single month).
7. Stratified sampling divides the population into subpopulations with similar characteristics.This has the effect of reducing variability within each subpopulation while reducing samplesize for a specified confidence level.
a. A common example is stratifying accounts receivable by outstanding balance.High-monetary-value items can be separated and given extra scrutiny. However, anauditor also considers inherent risk as well as the amounts of monetary items.
8. For very large populations, the absolute size of the sample affects the precision of itsresults more than its size relative to the population. Thus, for populations over 5,000 items,the sample size generally does not increase.
a. This phenomenon is graphically depicted in Figure 7-5 on the next page for a 95%confidence level, a 1% expected deviation rate, and a 5% tolerable deviation rate:
228 SU 7: Audit Sampling

Figure 7-5
Core Concepts
■ Sampling applies an engagement procedure to fewer than 100% of the items under reviewfor the purpose of drawing a conclusion about some characteristic of the population.
● Nonsampling risk is audit risk not related to sampling. A common audit risk is theauditor’s failure to detect an error in a sample.
● Sampling risk is the risk that a sample is not representative of the population.■ Judgment (nonstatistical) sampling is a subjective approach to determining the sample size
and sample selection. Statistical (probability or random) sampling is an objective method ofdetermining sample size and selecting the items to be examined.
● Statistical sampling allows the auditor to quantify sampling risk. An auditor shouldnever attempt to quantify the sampling risk of a nonstatistically drawn sample.
■ The risk of a Type I error is the risk that the auditor will reject a value that is in fact correct.This type of error relates to audit efficiency. The risk of a Type II error is the risk that theauditor will accept a value that is in fact incorrect. This type of error relates to auditeffectiveness and is therefore the more serious of the two types.
● For tests of controls (an application of attribute sampling), sampling risk includes therisk of assessing control risk too low (a Type II error) and the risk of assessing controlrisk too high (a Type I error).
● For substantive tests (an application of variables sampling), sampling risk includes therisk of incorrect acceptance (a Type II error) and the risk of incorrect rejection(a Type I error).
■ The confidence level (reliability level) is the complement of the applicable sampling riskfactor. For a test of controls, if the risk of assessing control risk too low is 5%, the internalauditor’s confidence level is 95% (1.0 – .05). For a substantive test conducted usingclassical variables sampling, if the risk of incorrect rejection is 5%, the auditor’s confidencelevel is 95% (1.0 – .05).
■ Major statistical sampling methods include the following:
● Sampling is random if every item has an equal and nonzero chance of being selected.● Systematic (interval) sampling divides the population by the sample size and selects
every nth item after a random start in the first interval.● Stratified sampling divides the population into subpopulations with similar
characteristics. It reduces variability within each subpopulation and the requiredsample size.
SU 7: Audit Sampling 229
Stop and review! You have completed the outline for this subunit. Study multiple-choicequestions 10 through 15 beginning on page 242.
7.5 ATTRIBUTE SAMPLING
1. Uses
a. In attribute sampling, each item in the population has an attribute of interest to theauditor, e.g., evidence of proper authorization. Thus, attribute sampling isappropriate for tests of controls, i.e., when two outcomes are possible (compliance ornoncompliance).
2. Determining the Sample Size
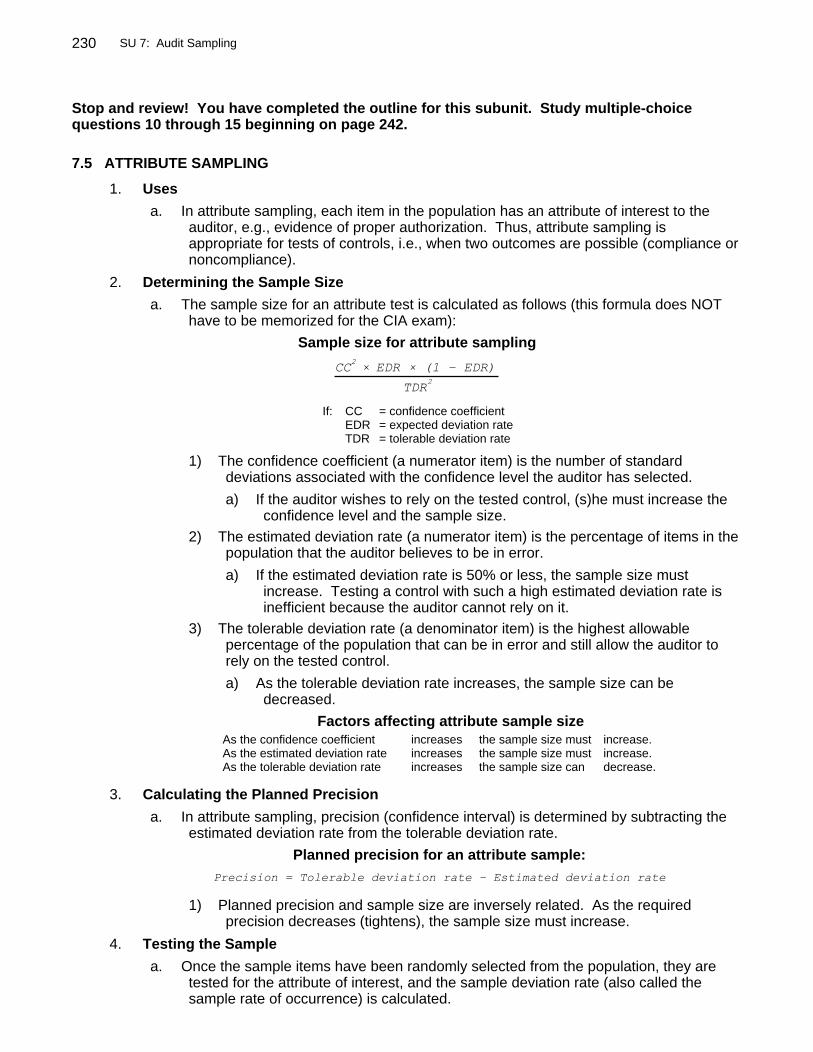
a. The sample size for an attribute test is calculated as follows (this formula does NOThave to be memorized for the CIA exam):
Sample size for attribute sampling
If: CC = confidence coefficientEDR = expected deviation rateTDR = tolerable deviation rate
1) The confidence coefficient (a numerator item) is the number of standarddeviations associated with the confidence level the auditor has selected.
a) If the auditor wishes to rely on the tested control, (s)he must increase theconfidence level and the sample size.
2) The estimated deviation rate (a numerator item) is the percentage of items in thepopulation that the auditor believes to be in error.
a) If the estimated deviation rate is 50% or less, the sample size mustincrease. Testing a control with such a high estimated deviation rate isinefficient because the auditor cannot rely on it.
3) The tolerable deviation rate (a denominator item) is the highest allowablepercentage of the population that can be in error and still allow the auditor torely on the tested control.
a) As the tolerable deviation rate increases, the sample size can bedecreased.
Factors affecting attribute sample sizeAs the confidence coefficient increases the sample size must increase.As the estimated deviation rate increases the sample size must increase.As the tolerable deviation rate increases the sample size can decrease.
3. Calculating the Planned Precision
a. In attribute sampling, precision (confidence interval) is determined by subtracting theestimated deviation rate from the tolerable deviation rate.
Planned precision for an attribute sample:
1) Planned precision and sample size are inversely related. As the requiredprecision decreases (tightens), the sample size must increase.
4. Testing the Sample
a. Once the sample items have been randomly selected from the population, they aretested for the attribute of interest, and the sample deviation rate (also called thesample rate of occurrence) is calculated.
230 SU 7: Audit Sampling

5. Calculating the Achieved Precision and Interpreting the Results
a. The achieved degree of precision for an attribute test is calculated as follows (thisformula does NOT have to be memorized for the CIA exam):
Achieved precision in attribute sampling
If: CC = confidence coefficientSDR = sample deviation rate
1) The confidence coefficient (a numerator item)
a) As the auditor increases the confidence level, the precision of the samplewidens.
2) The sample deviation rate (a numerator item)
a) As the sample deviation rate increases, the precision of the samplewidens.
3) The sample size (a denominator item)
a) As the sample size increases, the precision of the sample tightens.b. The auditor compares planned and achieved precision and decides whether to rely on
the tested control.
1) If the achieved precision is equal to or less than planned precision, the auditorcan conclude that the sample is representative of the population. At the level ofconfidence specified by the auditor, the control can be deemed reliable.
2) If the achieved precision is greater than planned precision, the auditor mustconclude that the tested control cannot be relied upon at the specifiedconfidence level.
6. Two Other Attribute Sampling Methods
a. Discovery sampling is a form of attribute sampling that is appropriate when even asingle deviation would be critical.
1) The occurrence rate is assumed to be at or near 0%, and the method cannot beused to evaluate results statistically if deviations are found in the sample.
2) The sample size is calculated so that it will include at least one instance of adeviation if deviations occur in the population at a given rate.
b. The objective of stop-or-go sampling, sometimes called sequential sampling, is toreduce the sample size when the auditor believes the error rate in the population islow.
1) The auditor examines only enough sample items to be able to state that thedeviation rate is below a specified rate at a specified level of confidence. If theauditor needs to expand the sample to obtain the desired level of confidence,(s)he can do so in stages.
2) Because the sample size is not fixed, the internal auditor can achieve thedesired result, even if deviations are found, by enlarging the samplesufficiently. In contrast, discovery sampling uses a fixed sample size.
Stop and review! You have completed the outline for this subunit. Study multiple-choicequestions 10 through 16 beginning on page 244.
SU 7: Audit Sampling 231

7.6 VARIABLES SAMPLING -- CLASSICAL
1. Uses
a. Attribute sampling is used for discrete variables. Variables sampling is used forcontinuous variables, such as weights or monetary amounts. Variables samplingprovides information about whether a stated amount (e.g., the balance of accountsreceivable) is materially misstated.
1) Thus, variables sampling is useful for substantive tests. The auditor candetermine, at a specified confidence level, a range that includes the true value.
b. In variables sampling, both the upper and lower limits are relevant (a balance, such asaccounts receivable, can be either under- or overstated).
1) In attribute sampling, auditors are concerned only with the upper deviation limit,i.e., with the risk of assessing control risk too low.
c. Auditors employ four classical variables sampling techniques:
1) Unstratified mean-per-unit2) Stratified mean-per-unit3) Difference estimation4) Ratio estimation
NOTE: Each method is covered in this subunit following a discussion of sampleselection and interpretation.
2. Determining the Sample Size
a. The sample size for a classical variables test is calculated as follows (this formuladoes NOT have to be memorized for the CIA exam):
Sample size for classical variables sampling
If: CC = confidence coefficientESD = estimated sample deviation
1) The confidence coefficient (a numerator item)
a) If the auditor needs a more precise estimate of the tested amount, (s)hemust increase the confidence level and the sample size.
b) The confidence coefficient serves the same function as in attributesampling. But in variables sampling it corresponds to a range around thecalculated amount rather than an estimate of the maximum error rate.
2) The estimated standard deviation of the population (a numerator item)
a) The standard deviation is a measure of the variability of the amounts in thepopulation. An increase in the estimated standard deviation increases thesample size. The estimate is based on a pilot sample.
3) The population size (a numerator item)
a) The larger the population, the larger the sample.4) The tolerable misstatement (a denominator item)
a) The tolerable misstatement is based on the auditor's judgment aboutmateriality.
b) This factor is desired precision. The narrower the precision, the larger thesample.
232 SU 7: Audit Sampling
b. The precision of sample results in a variables sampling application is inverselyproportional to the square root of the sample size. Thus, increasing the sample by afactor of four decreases (tightens) the precision by a factor of two.
Factors affecting classical variables sample sizeAs the confidence coefficient increases the sample size must increase.As the estimated standard deviation increases the sample size must increase.As the population size increases the sample size must increase.As the tolerable misstatement increases the sample size can decrease.
3. Calculating the Achieved Precision and Interpreting the Results
a. The achieved degree of precision for a classical variables test is calculated as follows(this formula does NOT have to be memorized for the CIA exam):
Achieved precision in classical variables sampling
If: CC = confidence coefficient
1) The confidence coefficient (a numerator item)
a) As the auditor increases the confidence level, the precision of the samplewidens.
2) The standard deviation of the sample (a numerator item)
a) As the standard deviation of the sample increases, the precision of thesample widens.
3) The square root of the sample size (a denominator item)
a) As the sample size increases, the precision of the sample tightens.b. The auditor compares the achieved precision with planned precision and decides
whether the true value of the tested variable is within the stated range.
1) If the achieved precision is smaller (tighter) than planned precision, the auditorcan conclude, at the stated confidence level, that the true amount is within therange.
2) For example, an auditor has tested a variables sample with precision of ±4% anda confidence level of 90% and concluded that the true balance in the account isUS $1,000,000.
a) The precision of ±4% gives the boundaries of the computed range: 4% ofUS $1,000,000 equals US $40,000, resulting in a range of US $960,000to US $1,040,000.
b) The auditor can conclude that there is only a 10% chance that the truebalance lies outside this range.
4. Unstratified Mean-per-Unit (MPU) Sampling
a. Unstratified MPU is appropriate when unit carrying amounts are unknown or the totalis inaccurate.
1) Unstratified MPU involves calculating the mean and standard deviation of theobserved amounts of the sample items. The mean is then multiplied by thenumber of items in the population to estimate the population amount.
2) Precision is determined using the mean and standard deviation of the sample.
SU 7: Audit Sampling 233

5. Stratified Mean-per-Unit (MPU) Sampling
a. Stratified MPU is a means of increasing audit efficiency by separating the populationinto logical groups, usually by various ranges of the tested amount.
1) By creating multiple populations, the variability within each is reduced, allowingfor a smaller overall sample size.
b. The following is an example of an accounts receivable population divided into strata:
Number ofBalance Ranges Accounts
US $100,000 to US $499,999 12US $ 10,000 to US $ 99,999 455US $ 0 to US $ 9,999 6,806
1) The auditor can now efficiently gain assurance regarding the recorded total ofreceivables by testing all of the balances in the top stratum and statisticalsamples of those in the other two strata.
6. Difference Estimation
a. Difference estimation is a means of estimating the misstatement of an amount bycalculating the differences between the observed and recorded amounts for items inthe sample. The auditor then calculates the mean difference and multiplies the meanby the number of items in the population.
1) This method is appropriate only when per-item carrying amounts and their totalare known. Also, the auditor need not stratify the population when (a) thepopulation contains many nonzero differences, (b) the number of over- andunderstatements is roughly equal, and (c) the differences are relativelyuniform.
2) Precision is calculated using the mean and standard deviation of thedifferences.
7. Ratio Estimation
a. Ratio estimation is a method of estimating the misstatement of an amount bymultiplying the recorded total of the population by the ratio of the total observedamount of the sample items to their total recorded amount.
1) The requirements for efficient difference estimation also apply to ratioestimation. But this method can be used only when all carrying amounts arepositive.
a) Ratio estimation is preferable to unstratified MPU when the standarddeviation of the distribution of ratios is less than the standard deviation ofthe sample item amounts.
b) Ratio estimation is preferable to difference estimation when differences arenot relatively uniform.
Stop and review! You have completed the outline for this subunit. Study multiple-choicequestions 17 through 24 beginning on page 247.
7.7 VARIABLES SAMPLING -- MONETARY-UNIT
1. Application
a. Monetary-unit sampling (MUS) is also called probability-proportional-to-size, or PPS,sampling. It applies attribute sampling methods to reach a conclusion about theprobability of overstating an account balance.
1) Under MUS, a monetary unit is the sampling unit. Thus, the item containing thesampled monetary unit is selected for testing.
234 SU 7: Audit Sampling

b. MUS is appropriate for a population that may include only a few overstated items, suchas inventory and receivables.
1) A systematic selection method is used (every nth monetary unit is selected).The larger an amount in the population, the more likely it will be selected.
2) MUS is not used when the primary engagement objective is to search forunderstatements, e.g., of liabilities. Moreover, if many misstatements (over-and understatements) are expected, classical variables sampling is moreefficient.
c. In contrast, the classical approach to variables sampling is not always appropriate.
1) When only a few differences between recorded and observed amounts arefound, difference and ratio estimation sampling may not be efficient.
2) MPU sampling also may be difficult in an unstratified sampling situation.
Stop and review! You have completed the outline for this subunit. Study multiple-choicequestions 25 through 27 beginning on page 249.
7.8 SELECTING THE SAMPLING METHOD
Many of the audit sampling questions that a candidate will encounter on the CIA exam focus onselection of the correct method for a given circumstance rather than on the mechanics of applying it.This subunit consists entirely of such questions. Please review Subunits 7.4 through 7.9, payingspecial attention to the nature and purpose of each sampling method before attempting to answer thequestions in this subunit.
Stop and review! You have completed the outline for this subunit. Study multiple-choicequestions 33 through 39 beginning on page 250.
7.9 PROCESS CONTROL TECHNIQUES
1. Statistical quality control determines whether a shipment or production run of units lies withinacceptable limits. It is also used to determine whether production processes are out ofcontrol.
a. Items are either good or bad, i.e., inside or outside of control limits.b. Statistical quality control is based on the binomial distribution.
Acceptance Sampling
2. This method determines the probability that the rate of defective items in a batch is less thana specified level.
EXAMPLEAssume a sample is taken from a population of 500. According to standard acceptance sampling tables, if the sampleconsists of 25 items and none are defective, the probability is 93% that the population deviation rate is less than 10%.If 60 items are examined and no defectives are found, the probability is 99% that the deviation rate is less than 10%. If twodefectives in 60 units are observed, the probability is 96% that the deviation rate is less than 10%.
Statistical Control Charts
3. These are graphic aids for monitoring the status of any process subject to acceptable orunacceptable variations during repeated operations. They also have applications of directinterest to auditors and accountants, for example, (a) unit cost of production, (b) direct laborhours used, (c) ratio of actual expenses to budgeted expenses, (d) number of calls by salespersonnel, or (e) total accounts receivable.
4. A control chart consists of three lines plotted on a horizontal time scale.
a. The center line represents the overall mean or average range for the process beingcontrolled. The other two lines are the upper control limit (UCL) and the lower controllimit (LCL).
SU 7: Audit Sampling 235

b. The processes are measured periodically, and the values (X) are plotted on the chart.
1) If the value falls within the control limits, no action is taken.2) If the value falls outside the limits, the result is abnormal, the process is
considered out of control, and an investigation is made for possible correctiveaction.
c. Another advantage of the chart is that it makes trends and cycles visible.
EXAMPLE
The chart below depicts 2 weeks of production by a manufacturer who produces a single precision part each day. To besalable, the part can vary from the standard by no more than +/– 0.1 millimeter.
Figure 7-6
The part produced on the 20th had to be scrapped, and changes were made to the equipment to return the process to thecontrolled state for the following week’s production.
5. Other Chart Types
a. P charts are based on an attribute (acceptable/not acceptable) rather than a measureof a variable. Specifically, it shows the percentage of defects in a sample.
b. C charts also are attribute control charts. They show defects per item.c. An R chart shows the range of dispersion of a variable, such as size or weight. The
center line is the overall mean.d. An X-bar chart shows the sample mean for a variable. The center line is the average
range.
Variations
6. Variations in a process parameter may have several causes.
a. Random variations occur by chance. Present in virtually all processes, they are notcorrectable because they will not repeat themselves in the same manner.Excessively narrow control limits will result in many investigations of what are simplyrandom fluctuations.
b. Implementation deviations occur because of human or mechanical failure to achievetarget results.
c. Measurement variations result from errors in the measurements of actual results.d. Model fluctuations can be caused by errors in the formulation of a decision model.e. Prediction variances result from errors in forecasting data used in a decision model.
Benchmarks
7. Establishing control limits based on benchmarks is a common method. A more objectivemethod is to use the concept of expected value. The limits are important because they arethe decision criteria for determining whether a deviation will be investigated.
236 SU 7: Audit Sampling
Cost-Benefit Analysis
8. An analysis using expected value provides a more objective basis for setting control limits.The limits of controls should be set so that the cost of an investigation is less than or equalto the benefits derived.
a. The expected costs include investigation cost and the cost of corrective action.
b. The benefit of an investigation is the avoidance of the costs of continuing to operate anout-of-control process. The expected value of benefits is the probability of being outof control multiplied by the cost of not being corrected.
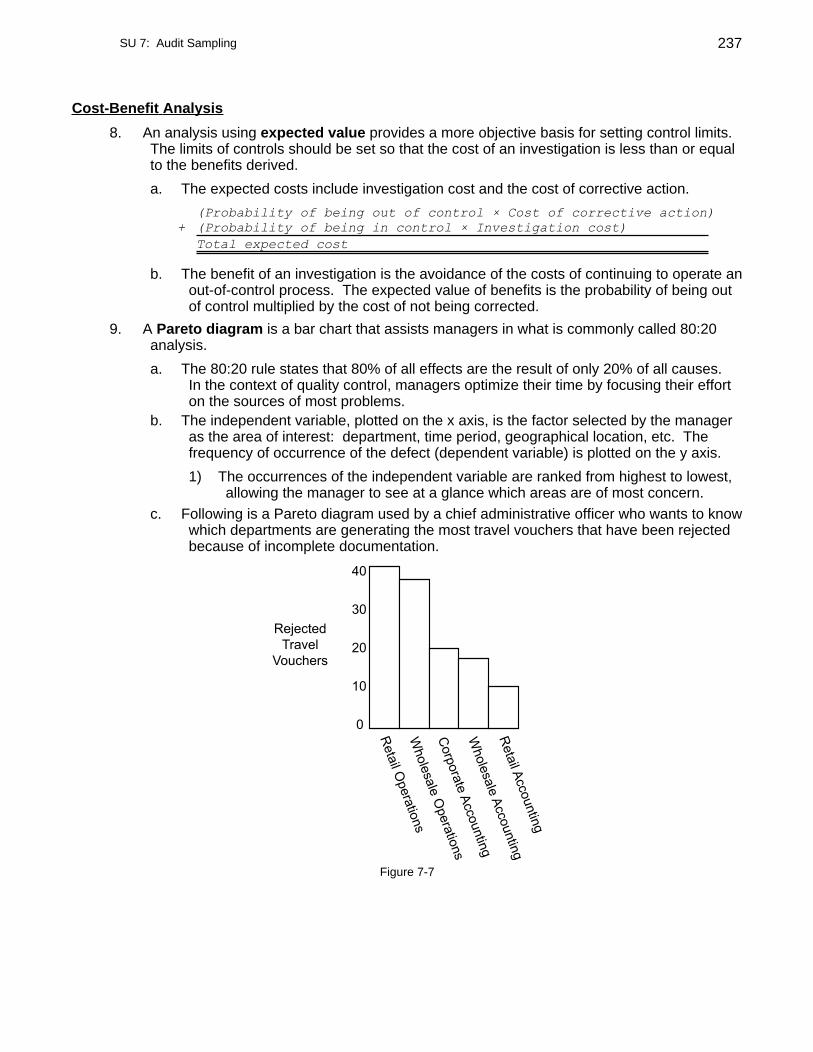
9. A Pareto diagram is a bar chart that assists managers in what is commonly called 80:20analysis.
a. The 80:20 rule states that 80% of all effects are the result of only 20% of all causes.In the context of quality control, managers optimize their time by focusing their efforton the sources of most problems.
b. The independent variable, plotted on the x axis, is the factor selected by the manageras the area of interest: department, time period, geographical location, etc. Thefrequency of occurrence of the defect (dependent variable) is plotted on the y axis.
1) The occurrences of the independent variable are ranked from highest to lowest,allowing the manager to see at a glance which areas are of most concern.
c. Following is a Pareto diagram used by a chief administrative officer who wants to knowwhich departments are generating the most travel vouchers that have been rejectedbecause of incomplete documentation.
Figure 7-7
SU 7: Audit Sampling 237
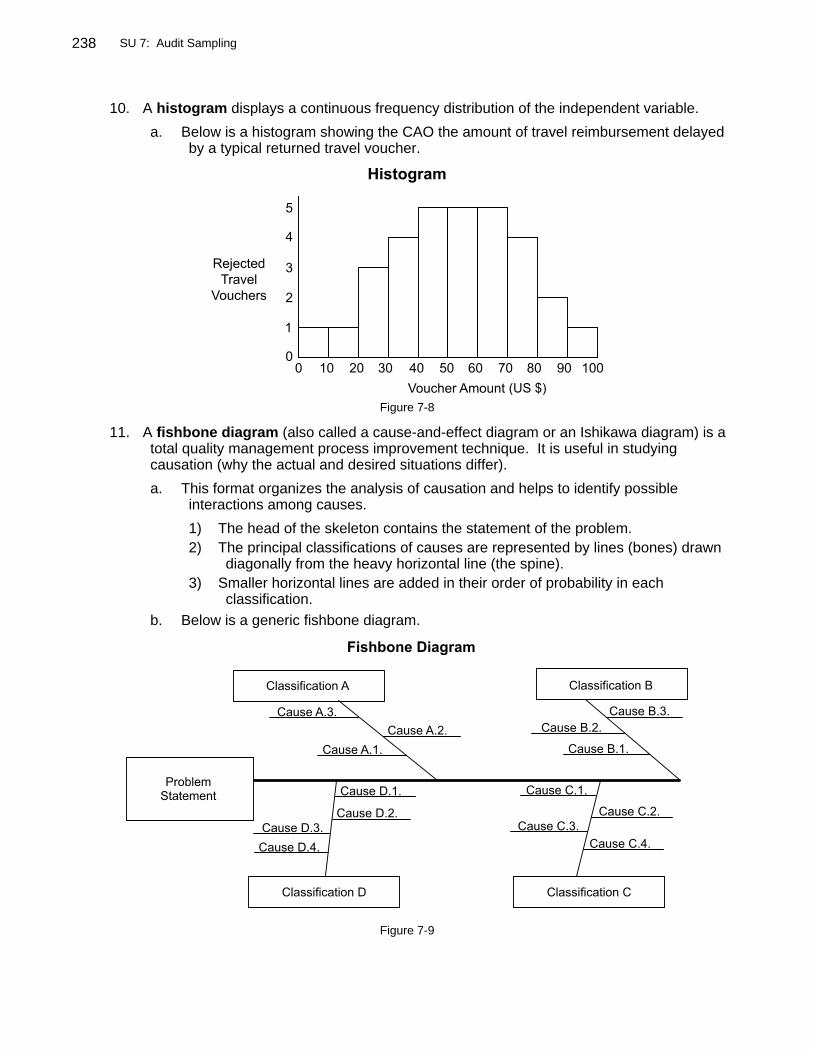
10. A histogram displays a continuous frequency distribution of the independent variable.
a. Below is a histogram showing the CAO the amount of travel reimbursement delayedby a typical returned travel voucher.
Figure 7-8
11. A fishbone diagram (also called a cause-and-effect diagram or an Ishikawa diagram) is atotal quality management process improvement technique. It is useful in studyingcausation (why the actual and desired situations differ).
a. This format organizes the analysis of causation and helps to identify possibleinteractions among causes.
1) The head of the skeleton contains the statement of the problem.2) The principal classifications of causes are represented by lines (bones) drawn
diagonally from the heavy horizontal line (the spine).3) Smaller horizontal lines are added in their order of probability in each
classification.b. Below is a generic fishbone diagram.
Figure 7-9
238 SU 7: Audit Sampling

Core Concepts
■ Statistical quality control is a method of determining whether a shipment or production run ofunits lies within acceptable limits. It is also used to determine whether productionprocesses are out of control.
■ Acceptance sampling determines the probability that the rate of defective items in a batch isless than a specified level.
■ Statistical control charts are graphic aids for monitoring the status of any process subject toacceptable or unacceptable variations during repeated operations. A control chart consistsof three lines plotted on a horizontal time scale.
● The center line represents the overall mean or average range for the process beingcontrolled. The other two lines are the upper control limit (UCL) and the lower controllimit (LCL).
● The processes are measured periodically, and the values (X) are plotted on the chart.If the value falls outside the limits, the process is considered out of control, and aninvestigation is made for possible corrective action.
■ A cost-benefit analysis using expected value provides a more objective basis for settingcontrol limits. The limits of controls should be set so that the cost of an investigation is lessthan or equal to the benefits derived.
Stop and review! You have completed the outline for this subunit. Study multiple-choicequestion 40 on page 252.
SU 7: Audit Sampling 239

QUESTIONS
7.1 Fundamentals of Probability
1. An organization uses two major material inputs inits production. To prepare its manufacturingoperations budget, the organization has to project thecost changes of these material inputs. The costchanges are independent of one another. Thepurchasing department provides the followingprobabilities associated with projected cost changes:
Cost Change Material 1 Material 23% increase .3 .55% increase .5 .4
10% increase .2 .1
The probability that there will be a 3% increase in thecost of both Material 1 and Material 2 is
A. 15%
B. 40%
C. 80%
D. 20%
Answer (A) is correct. (CIA, adapted)REQUIRED: The probability of joint increases.DISCUSSION: The joint probability of occurrence of two
independent events equals the product of their individualprobabilities. The probability that the cost of Material 1 willincrease by 3% is .3. The probability that the cost of Material 2will increase by 3% is .5. The probability that both will occur is.15 (.3 × .5).
Answer (B) is incorrect. It represents the average of theprobabilities of a 3% increase in the costs of Material 1 andMaterial 2. Answer (C) is incorrect. It represents the sum of theprobabilities of a 3% increase in the costs of Material 1 andMaterial 2. Answer (D) is incorrect. It represents the differencebetween the probabilities of an increase in the costs of Material 1and Material 2.
2. The internal auditor is attempting to evaluate thepotential monetary effect of a control breakdown inthe sales cycle. Two controls are involved. Theprobability that control A will fail is 10%, and theprobability that control B will fail is 5%. The controlsare independent such that the failure of one does notaffect the failure of the other. In evaluating thepotential exposure to the organization, the internalauditor determines that the cost of control A’s failureis US $10,000, the cost of control B’s failure isUS $25,000, and the cost of failure of both controlprocedures at the same time is an additionalUS $200,000. If the control procedures are not mademore effective, the expected cost to the organizationis
A. US $1,000
B. US $32,250
C. US $2,250
D. US $3,250
Answer (D) is correct. (CIA, adapted)REQUIRED: The expected cost to the organization.DISCUSSION: The expected value is the sum of the
products of the possible outcomes and their respectiveprobabilities. Moreover, the joint probability that independentevents will occur simultaneously is the product of theirprobabilities. Accordingly, the expected cost is US $3,250{($10,000 × 10%) + ($25,000 × 5%) + [$200,000 × (10% × 5%)]}.
Answer (A) is incorrect. US $1,000 is the cost of asimultaneous failure. Answer (B) is incorrect. US $32,250assumes that the joint probability is .15, not .005. Answer (C) isincorrect. US $2,250 omits the cost of a simultaneous failure.
7.2 Statistics
3. An organization with 14,344 customersdetermines that the mean and median accountsreceivable balances for the year are US $15,412 andUS $10,382, respectively. From this information, theinternal auditor can conclude that the distribution ofthe accounts receivable balances is continuous and
A. Negatively skewed.
B. Positively skewed.
C. Symmetrically skewed.
D. Evenly distributed between the mean andmedian.
Answer (B) is correct. (CIA, adapted)REQUIRED: The conclusion drawn from information about
the mean and median of accounts receivable.DISCUSSION: The mean is the arithmetic average, and the
median corresponds to the 50th percentile. Thus, half the valuesare greater and half are smaller. The auditor can conclude thatthe distribution is positively skewed (to the right) because themean is greater than the median and the distribution iscontinuous.
Answer (A) is incorrect. The mean is greater than themedian and the distribution is continuous, so the distribution ispositively skewed (to the right). Answer (C) is incorrect.“Symmetrically skewed” is a contradiction. A symmetricaldistribution is not skewed. In a symmetrical distribution, themean, median, and mode (the most frequently occurring value)are equal. Answer (D) is incorrect. Distributions spread evenlybetween two values are uniform distributions.
240 SU 7: Audit Sampling
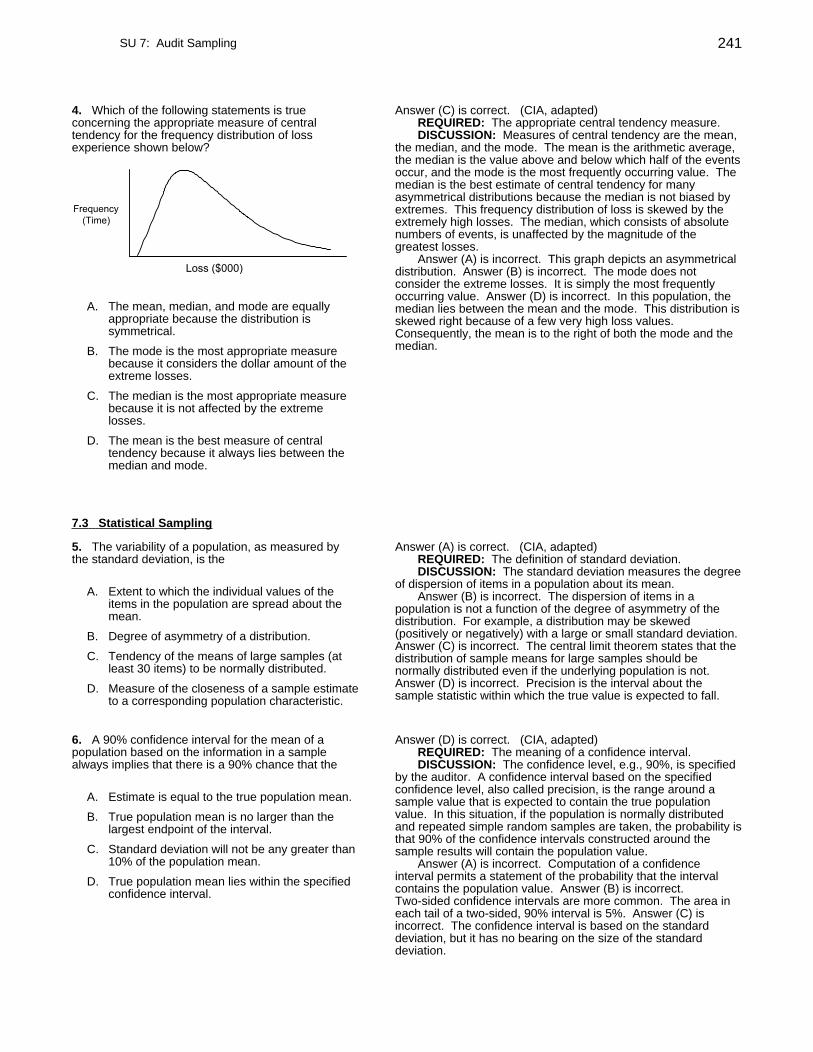
4. Which of the following statements is trueconcerning the appropriate measure of centraltendency for the frequency distribution of lossexperience shown below?
A. The mean, median, and mode are equallyappropriate because the distribution issymmetrical.
B. The mode is the most appropriate measurebecause it considers the dollar amount of theextreme losses.
C. The median is the most appropriate measurebecause it is not affected by the extremelosses.
D. The mean is the best measure of centraltendency because it always lies between themedian and mode.
Answer (C) is correct. (CIA, adapted)REQUIRED: The appropriate central tendency measure.DISCUSSION: Measures of central tendency are the mean,
the median, and the mode. The mean is the arithmetic average,the median is the value above and below which half of the eventsoccur, and the mode is the most frequently occurring value. Themedian is the best estimate of central tendency for manyasymmetrical distributions because the median is not biased byextremes. This frequency distribution of loss is skewed by theextremely high losses. The median, which consists of absolutenumbers of events, is unaffected by the magnitude of thegreatest losses.
Answer (A) is incorrect. This graph depicts an asymmetricaldistribution. Answer (B) is incorrect. The mode does notconsider the extreme losses. It is simply the most frequentlyoccurring value. Answer (D) is incorrect. In this population, themedian lies between the mean and the mode. This distribution isskewed right because of a few very high loss values.Consequently, the mean is to the right of both the mode and themedian.
7.3 Statistical Sampling
5. The variability of a population, as measured bythe standard deviation, is the
A. Extent to which the individual values of theitems in the population are spread about themean.
B. Degree of asymmetry of a distribution.
C. Tendency of the means of large samples (atleast 30 items) to be normally distributed.
D. Measure of the closeness of a sample estimateto a corresponding population characteristic.
Answer (A) is correct. (CIA, adapted)REQUIRED: The definition of standard deviation.DISCUSSION: The standard deviation measures the degree
of dispersion of items in a population about its mean.Answer (B) is incorrect. The dispersion of items in a
population is not a function of the degree of asymmetry of thedistribution. For example, a distribution may be skewed(positively or negatively) with a large or small standard deviation.Answer (C) is incorrect. The central limit theorem states that thedistribution of sample means for large samples should benormally distributed even if the underlying population is not.Answer (D) is incorrect. Precision is the interval about thesample statistic within which the true value is expected to fall.
6. A 90% confidence interval for the mean of apopulation based on the information in a samplealways implies that there is a 90% chance that the
A. Estimate is equal to the true population mean.
B. True population mean is no larger than thelargest endpoint of the interval.
C. Standard deviation will not be any greater than10% of the population mean.
D. True population mean lies within the specifiedconfidence interval.
Answer (D) is correct. (CIA, adapted)REQUIRED: The meaning of a confidence interval.DISCUSSION: The confidence level, e.g., 90%, is specified
by the auditor. A confidence interval based on the specifiedconfidence level, also called precision, is the range around asample value that is expected to contain the true populationvalue. In this situation, if the population is normally distributedand repeated simple random samples are taken, the probability isthat 90% of the confidence intervals constructed around thesample results will contain the population value.
Answer (A) is incorrect. Computation of a confidenceinterval permits a statement of the probability that the intervalcontains the population value. Answer (B) is incorrect.Two-sided confidence intervals are more common. The area ineach tail of a two-sided, 90% interval is 5%. Answer (C) isincorrect. The confidence interval is based on the standarddeviation, but it has no bearing on the size of the standarddeviation.
SU 7: Audit Sampling 241

7. Management of a large computer manufacturerhas been much concerned about the consistencyacross departments in adhering to new and unpopularpurchasing guidelines. An internal auditor has a listthat rank-orders all departments according to thepercentage of purchases that are consistent with theguidelines and indicates which division thedepartment is from. The internal auditor performs at-test for differences in means on the average rank ofdepartments in divisions A and B to determinewhether there is any difference in compliance with thepolicy and finds that division A (which has moredepartments) has a significantly higher (i.e., better)average rank than division B. Which one of thefollowing conclusions should be drawn from thisanalysis?
A. Division A is complying better with the newpolicy.
B. A random sample of departments should bedrawn and the analysis recalculated.
C. A t-test is not valid when the tested groupsdiffer in size.
D. A t-test is inappropriate for this data, andanother type of analysis should be used.
Answer (D) is correct. (CIA, adapted)REQUIRED: The true statement about application of a t-test
to rank-ordered data.DISCUSSION: A t-test can only be applied to a parametric
statistic (some numeric value that is calculated for all items in thepopulation). However, rank order is nonparametric. The actualcompliance percentages on which the rankings were establishedwould be valid statistics for use with a t-test (they areparametric).
Answer (A) is incorrect. A t-test is not valid in this case.Answer (B) is incorrect. The auditor already has a list of theentire population and no sampling is needed. Answer (C) isincorrect. A t-test can be used with groups that differ in size.
8. An internal auditor is interested in determiningwhether there is a statistically significant differenceamong four offices in the proportion of female versusmale managers. A Chi-square test is beingconsidered. A principal advantage of this testcompared with a t-test in this circumstance is that
A. Generally available software exists for thechi-square test.
B. The chi-square can both detect a relationshipand measure its strength.
C. The chi-square can be applied to nominaldata.
D. The chi-square is a parametric, and thereforestronger, test.
Answer (C) is correct. (CIA, adapted)REQUIRED: The principal advantage of the chi-square test
over the t-test.DISCUSSION: The chi-square test is used in determining
the goodness of fit between actual data and the theoreticaldistribution. In other words, it tests whether the sample is likelyto be from the population, based on a comparison of the samplevariance and the estimated population variance. The chi-squaretest is appropriately applied to nominal data, meaning data thatsimply distinguish one item from another, as male from female.The chi-square statistic is calculated and compared with thecritical value in the chi-square table.
Answer (A) is incorrect. Software for the t-test is widelyavailable. Answer (B) is incorrect. The chi-square test cannotmeasure the strength of a relationship. Answer (D) is incorrect.The chi-square test is nonparametric. It is applied to problems inwhich a parameter is not calculated.
7.4 Sampling
9. The degree to which the auditor is justified inbelieving that the estimate based on a randomsample will fall within a specified range is called
A. Sampling risk.
B. Non-sampling risk.
C. Confidence level.
D. Precision.
Answer (C) is correct. (CIA, adapted)REQUIRED: The degree to which an auditor is justified in
believing an estimate will fall within a specified range.DISCUSSION: The confidence level is the percentage of
times that one would expect the sample to adequately representthe population. Thus, a confidence level of 90% should result insamples that adequately represent the population 90% of thetime. In other words, given repeated random sampling from anormally distributed population, 90% of the confidence intervalsthat may be constructed from simple random samples will containthe population mean.
Answer (A) is incorrect. Sampling risk is the complement ofthe confidence level. Answer (B) is incorrect. Non-sampling riskis the risk of improperly auditing the sampled items. It cannot bequantified. Answer (D) is incorrect. Precision is the confidenceinterval.
242 SU 7: Audit Sampling

10. An important difference between a statistical anda judgmental sample is that with a statistical sample,
A. No judgment is required because everything iscomputed according to a formula.
B. A smaller sample can be used.
C. More accurate results are obtained.
D. Population estimates with measurablereliability can be made.
Answer (D) is correct. (CIA, adapted)REQUIRED: The important difference between a statistical
and a judgmental sample.DISCUSSION: Judgment (nonstatistical) sampling is a
subjective approach to determining the sample size and sampleselection. This subjectivity is not always a weakness. Theinternal auditor, based on other work, may be able to test themost material and risky transactions and to emphasize the typesof transactions subject to high control risk. Statistical (probabilityor random) sampling is an objective method of determiningsample size and selecting the items to be examined. Unlikejudgment sampling, it provides a means of quantitativelyassessing precision or the allowance for sampling risk (howclosely the sample represents the population) and reliability orconfidence level (the probability that the sample will represent thepopulation).
Answer (A) is incorrect. Judgment is needed to determineconfidence levels and sample unit definition. Answer (B) isincorrect. A statistical sample may result in either a smaller orlarger sample. Answer (C) is incorrect. Either method mayproduce greater accuracy.
11. In internal auditing sampling applications, Type Iand Type II errors may occur. These risks
A. Result directly from the chance that the sampleobtained by the internal auditor isunrepresentative of the population.
B. Can be decreased by using more reliable,albeit more expensive, audit procedures.
C. Have a magnitude based only on the economicconsequences of incorrect sample-basedconclusions.
D. Refer respectively to the risks that (1) internalcontrols will fail and (2) the resultant error willgo undetected.
Answer (A) is correct. (CIA, adapted)REQUIRED: The true statement about Type I and Type II
errors.DISCUSSION: Sampling risk is the risk that a sample is not
representative of the population. Type I and Type II errors aretypes of errors inherent in the practice of sampling. They refer,respectively, to the rejection of a result that is in fact correct (anaudit efficiency error) and acceptance of a result that is in factincorrect (an audit effectiveness error).
Answer (B) is incorrect. Nonsampling risk is dependent onthe quality of engagement procedures. Answer (C) is incorrect.These risks do not inherently depend on economicconsequences. Answer (D) is incorrect. Audit risk includescontrol risk and detection risk.
12. An internal auditor wants to select a statisticallyrepresentative sample from a population of 475inventory control sheets. Each sheet lists thedescription, physical count, bar code, and unit cost for50 inventory items. The auditor uses a randomnumber table to construct the sample; the first twocolumns are listed below. 14326 is the randomlychosen starting point; the sample’s first item is foundon page 143, line 26. (The route used by the internalauditor is down Column A to the top of Column B.)
Column A Column B
75233 0685214326 4290476562 6485428123 0497864227 3315080938 0430122539 4124029452 69521
Where is the fifth item in the sample located?
A. Page 809, line 38.
B. Page 429, line 04.
C. Page 331, line 50.
D. Page 068, line 52.
Answer (C) is correct. (CIA, adapted)REQUIRED: The fifth usable number in a random number
table.DISCUSSION: The fifth usable number is on page 331,
line 50. The numbers 76562, 64227, 80938, 29452, 06852,64854, 04978, and 69521 are not usable because either the firstthree digits exceed 475 or the last two digits exceed 50. The firstnumber in Column A (75233) is not usable not only for thisreason but also because it precedes the random start.
Answer (A) is incorrect. Page 809, line 38 is the fifth randomnumber but not the fifth usable number. Answer (B) is incorrect.Page 429, line 04 is the fourth usable number. Answer (D) isincorrect. Page 068, line 52 is not usable since each page hasonly 50 lines.
SU 7: Audit Sampling 243

13. Using random numbers to select a sample
A. Is required for a variables sampling plan.
B. Is likely to result in an unbiased sample.
C. Results in a representative sample.
D. Allows auditors to use smaller samples.
Answer (B) is correct. (CIA, adapted)REQUIRED: The reason to use random numbers to select a
sample.DISCUSSION: Auditors often use random numbers to select
sample items because this method enables each sampling unitand each combination of sampling units to have an equal andnonzero probability of selection. Thus, the sample is likely to beunbiased.
Answer (A) is incorrect. Although random-number samplingmay be used for a variables sampling plan, it is not required.Systematic selection is also acceptable unless the population isnot randomly organized. Answer (C) is incorrect. The use ofrandom numbers does not always result in a representativesample. Statistical methods allow auditors to estimate theprobability that a random sample is not representative.Answer (D) is incorrect. The use of random numbers does notaffect sample size.
14. An internal auditor is designing a stratified,mean-per-unit variables sampling plan for itemsstated in foreign currency units (FCs). To which oneof the following strata should the internal auditorallocate the largest proportion of the overall samplesize?
ExpectedNumber Expected Standard Totalof Items Mean Deviation FC Value
A. 2,000 FC100 FC9 FC200,000
B. 2,250 FC200 FC4 FC450,000
C. 3,000 FC80 FC2 FC240,000
D. 3,100 FC150 FC1 FC465,000
Answer (A) is correct. (CIA, adapted)REQUIRED: The stratum to be allocated the largest
proportion of the overall sample size.DISCUSSION: Stratified sampling divides the population
into subpopulations with similar characteristics. The effect is toreduce variability within each subpopulation compared with thevariability in the total population while maintaining the specifiedconfidence level. After stratification, the auditor is likely to devotethe most attention to the highest-risk stratum, that is, the one withthe largest expected standard deviation.
7.5 Attribute Sampling
15. When planning an attribute sampling application,the difference between the expected error rate andthe maximum tolerable error rate is the planned
A. Precision.
B. Reliability.
C. Dispersion.
D. Skewness.
Answer (A) is correct. (CIA, adapted)REQUIRED: The difference between the expected error rate
and the maximum tolerable error rate.DISCUSSION: The precision of an attribute sample (also
called the confidence interval or allowance for sampling risk) isan interval around the sample statistic that the auditor expects tocontain the true value of the population. In attribute sampling(tests of controls), precision is determined by subtracting theexpected error rate from the tolerable error rate in thepopulation.
Answer (B) is incorrect. Reliability is the confidence level.It is the percentage of times that repeated samples will berepresentative of the population from which they are taken.Answer (C) is incorrect. Dispersion is the degree of variation in aset of values. Answer (D) is incorrect. Skewness is the lack ofsymmetry in a frequency distribution.
244 SU 7: Audit Sampling

16. The size of a given sample is jointly a result ofcharacteristics of the population of interest anddecisions made by the internal auditor. Everythingelse being equal, sample size will
A. Increase if the internal auditor decides toaccept more risk of incorrectly concluding thatcontrols are effective when they are in factineffective.
B. Double if the internal auditor finds that thevariance of the population is twice as large aswas indicated in the pilot sample.
C. Decrease if the internal auditor increases thetolerable rate of deviation.
D. Increase as sampling risk increases.
Answer (C) is correct. (CIA, adapted)REQUIRED: The true statement about the effect on the
sample size resulting from a change in a relevant variable.DISCUSSION: In an attribute test, the tolerable deviation
rate is inversely related to sample size. If it is increased, samplesize will decrease.
Answer (A) is incorrect. An increase in allowable riskdecreases sample size. Answer (B) is incorrect. Doubling thevariability of the population will cause the sample size to morethan double. Answer (D) is incorrect. Sampling risk increases asthe sample size decreases.
17. An internal auditor is planning to use attributesampling to test the effectiveness of a specific internalcontrol related to approvals for cash disbursements.In attribute sampling, decreasing the estimatedoccurrence rate from 5% to 4% while keeping all othersample size planning factors exactly the same wouldresult in a revised sample size that would be
A. Larger.
B. Smaller.
C. Unchanged.
D. Indeterminate.
Answer (B) is correct. (CIA, adapted)REQUIRED: The sample size effect of decreasing the
estimated occurrence rate.DISCUSSION: In an attribute test, the expected deviation
rate is directly related to sample size. If it is decreased, samplesize will decrease.
Answer (A) is incorrect. Increasing the expected error rateincreases the sample size. Answer (C) is incorrect. Changingone variable while holding all other factors constant changes thesample size. Answer (D) is incorrect. Decreasing the expectederror rate while holding all other factors constant decreases thesample size.
18. If all other sample size planning factors wereexactly the same in attribute sampling, changing theconfidence level from 95% to 90% and changing thedesired precision from 2% to 5% would result in arevised sample size that would be
A. Larger.
B. Smaller.
C. Unchanged.
D. Indeterminate.
Answer (B) is correct. (CIA, adapted)REQUIRED: The sample size effect of decreasing the
confidence level and widening the desired precision interval.DISCUSSION: In an attribute test, the confidence level is
directly related, and the precision is inversely related, to samplesize. Thus, if the confidence level is reduced and precision iswidened, sample size will be smaller.
Answer (A) is incorrect. Increasing C and narrowing P wouldresult in a larger sample size. Answer (C) is incorrect.Decreasing C and widening P decreases the sample size.Answer (D) is incorrect. The revised sample size isdeterminable.
SU 7: Audit Sampling 245

19. An auditor has to make a number of decisionswhen using attribute sampling. The term efficiency isused to describe anything that affects sample size.The term effectiveness is used to describe thelikelihood that the statistical sample result will be amore accurate estimate of the true population errorrate. Assume an auditor expects a control procedurefailure rate of 0.5%. The auditor is making a decisionon whether to use a 90% or a 95% confidence leveland whether to set the tolerable control failure rate at3% or 4%. Which of the following statementsregarding efficiency and effectiveness of an attributesample is true?
A. Decreasing the confidence level to 90% anddecreasing the tolerable control failure rate to3% will result in both increased efficiency andeffectiveness.
B. Decreasing the tolerable failure rate from 4%to 3% will increase audit efficiency.
C. Increasing the confidence level to 95% anddecreasing the tolerable control failure rate to3% will increase audit effectiveness.
D. Increasing the confidence level to 95% willincrease audit efficiency.
Answer (C) is correct. (CIA, adapted)REQUIRED: The true statement about the efficiency and
effectiveness of an attribute sample.DISCUSSION: In an attribute test, confidence level and
expected deviation rate are directly related to sample size. At thesame time, the tolerable deviation rate is inversely related tosample size. Hence, increasing the confidence level increasesthe sample size, and decreasing the tolerable rate also increasesthe sample size. Thus, both changes improve auditeffectiveness.
Answer (A) is incorrect. Decreasing the confidence leveldecreases effectiveness. Answer (B) is incorrect. Decreasingthe tolerable failure rate decreases efficiency. Answer (D) isincorrect. Increasing the confidence level decreases auditefficiency.
20. An auditor applying a discovery-sampling planwith a 5% risk of overreliance may conclude that thereis
A. A 95% probability that the actual rate ofoccurrence in the population is less than thecritical rate if only one exception is found.
B. A 95% probability that the actual rate ofoccurrence in the population is less than thecritical rate if no exceptions are found.
C. A 95% probability that the actual rate ofoccurrence in the population is less than thecritical rate if the occurrence rate in the sampleis less than the critical rate.
D. Greater than a 95% probability that the actualrate of occurrence in the population is lessthan the critical rate if no exceptions arefound.
Answer (B) is correct. (CIA, adapted)REQUIRED: The sound conclusion drawn by an auditor
applying discovery sampling.DISCUSSION: Discovery sampling is a form of attribute
sampling that is appropriate when even a single deviation wouldbe critical. The sample size is calculated so that it will include atleast one instance of a deviation if deviations occur in thepopulation at a given rate. If no exceptions are found, the correctconclusion is that the probability is 95% that the occurrence rateis less than the critical rate.
Answer (A) is incorrect. The probability is 95% that theactual rate of occurrence is equal to or greater than the criticalrate if one exception is found. Answer (C) is incorrect. Theprobability is 95% that the actual rate is equal to or exceeds thecritical rate if any exceptions are found. Answer (D) is incorrect.The probability does not increase if no exceptions are found.
21. What is the chief advantage of stop-or-gosampling?
A. The error rate in the population can beprojected to within certain precision limits.
B. Stop-or-go sampling may reduce the size ofthe sample that needs to be taken from apopulation, thus reducing sampling costs.
C. Stop-or-go sampling allows sampling analysisto be performed on populations that are nothomogeneous.
D. Stop-or-go sampling allows the sampler toincrease the confidence limits of the analysiswithout sacrificing precision.
Answer (B) is correct. (CIA, adapted)REQUIRED: The chief advantage of stop-or-go sampling.DISCUSSION: The objective of stop-or-go sampling,
sometimes called sequential sampling, is to reduce the samplesize when the auditor believes the error rate in the population islow. Thus, it may reduce the sample size because sample itemsare examined only until enough evidence has been gathered toreach the desired conclusion.
Answer (A) is incorrect. In stop-or-go sampling, only enoughitems are examined to permit the auditor to state that the errorrate is below a prespecified rate with a prespecified level ofconfidence. Although other methods also accomplish this result,stop-or-go sampling has the advantage of greater efficiency.Answer (C) is incorrect. Stratified sampling is more appropriatefor heterogeneous populations. Stop-or-go sampling might thenbe used for each stratum. Answer (D) is incorrect. Theconfidence limits define precision. An increase in the confidencelimits will result in a loss of precision (assuming constant samplesize).
246 SU 7: Audit Sampling

7.6 Variables Sampling -- Classical
22. In a variables sampling application, which of thefollowing will result when confidence level is changedfrom 90% to 95%?
A. Standard error of the mean will not beaffected.
B. Nonsampling error will decrease.
C. Sample size will increase.
D. Point estimate of the arithmetic mean willincrease.
Answer (C) is correct. (CIA, adapted)REQUIRED: The effect of raising the confidence level.DISCUSSION: In any sampling application, attribute or
variables, an increase in the confidence level requires a largersample.
Answer (A) is incorrect. The standard error of the mean isthe standard deviation of the distribution of sample means. Thelarger the sample, the lower the degree of variability in thesample. An increase in confidence level from 90% to 95%requires a larger sample. Thus, the standard error of the meanwill be affected. Answer (B) is incorrect. By definition,nonsampling error is unaffected by changes in sampling criteria.Answer (D) is incorrect. The estimate of the mean may increaseor decrease if sample size changes.
23. An auditor is considering a sample size of 50 toestimate the average amount per invoice in a largetrucking company. How would the precision of thesample results be affected if the sample size wasincreased to 200?
A. The larger sample would be about two timesas precise as the smaller sample.
B. The larger sample would be about four timesas precise as the smaller sample.
C. Although precision would not be increased thatmuch, a possible downward bias in theestimate of the average per invoice would becorrected.
D. Since both sample sizes are larger than 30, theincrease would not have that much of an effecton precision.
Answer (A) is correct. (CIA, adapted)REQUIRED: The effect on precision of increasing the
sample size.DISCUSSION: The achieved precision of sample results in
a variables sampling application is inversely proportional to thesquare root of the sample size. Thus, increasing the sample by afactor of four decreases (tightens) the precision by a factor oftwo.
Answer (B) is incorrect. The precision of sample resultsdoes not increase at the same rate as sample size. Answer (C)is incorrect. The expected value of the sample mean is the sameregardless of sample size. Answer (D) is incorrect. Precisionwould tighten by a factor of two.
24. If all other factors in a sampling plan are heldconstant, changing the measure of tolerablemisstatement to a smaller value will cause the samplesize to be
A. Smaller.
B. Larger.
C. Unchanged.
D. Indeterminate.
Answer (B) is correct. (CIA, adapted)REQUIRED: The effect on sample size of decreasing
tolerable misstatement.DISCUSSION: The size of the precision interval in a
variables test is based upon the tolerable misstatement that isdetermined by materiality judgments. As this value decreases,for example, because of a decrease in tolerable misstatement,the size of the required sample increases accordingly, and viceversa. Hence, tolerable misstatement (precision) and samplesize are inversely related.
25. In a variables sampling application, if theachieved monetary precision range of the statisticalsample at a given confidence level is greater than thedesired monetary precision range, this is an indicationthat the
A. Occurrence rate was smaller than expected.
B. Occurrence rate was greater than expected.
C. Standard deviation was less than expected.
D. Standard deviation was greater thanexpected.
Answer (D) is correct. (CIA, adapted)REQUIRED: The implication if the achieved monetary
precision range is greater than the desired monetary precisionrange.
DISCUSSION: Three factors determine the achievedprecision of a variables sample: the confidence coefficient, thestandard deviation of the sample, and the square root of thesample size. If the achieved monetary precision was greater(i.e., wider) than the desired range, then, holding other factorsconstant, the standard deviation of the sample was greater thanexpected.
Answer (A) is incorrect. The occurrence rate is relevant toattribute sampling. Answer (B) is incorrect. The occurrence rateis relevant to attribute sampling. Answer (C) is incorrect. Thestandard deviation was greater than expected.
SU 7: Audit Sampling 247

26. An auditor is using the mean-per-unit method ofvariables sampling to estimate the correct total valueof a group of inventory items. Based on the sample,the auditor estimates, with precision of ±4% andconfidence of 90%, that the correct total isUS $800,000. Accordingly,
A. There is a 4% chance that the actual correcttotal is less than US $720,000 or more thanUS $880,000.
B. The chance that the actual correct total is lessthan US $768,000 or more than US $832,000is 10%.
C. The probability that the inventory is notsignificantly overstated is between 6% and14%.
D. The inventory is not likely to be overstated bymore than 4.4% (US $35,200) or understatedby more than 3.6% (US $28,800).
Answer (B) is correct. (CIA, adapted)REQUIRED: The proper interpretation of the sample
results.DISCUSSION: A 90% confidence level implies that 10% of
the time the true population total will be outside the computedrange. Precision of ±4% gives the boundaries of the computedrange: 4% times US $800,000 equals US $32,000. Hence, therange is US $768,000 to US $832,000.
Answer (A) is incorrect. The precision, not the confidencelevel, is ±4%. Answer (C) is incorrect. Precision is a range ofvalues, not the probability (confidence level) that the true valuewill be included within that range. Answer (D) is incorrect. Theprecision percentage is not multiplied by the confidencepercentage.
27. Difference estimation sampling would beappropriate to use to project the monetary error in apopulation if
A. Subsidiary ledger book balances for someindividual inventory items are unknown.
B. Virtually no differences between the individualcarrying amounts and the audited amountsexist.
C. A number of nonproportional differencesbetween carrying amounts and auditedamounts exist.
D. Observed differences between carryingamounts and audited amounts are proportionalto carrying amounts.
Answer (C) is correct. (CIA, adapted)REQUIRED: The condition for use of difference estimation
sampling.DISCUSSION: Difference estimation of population error
entails determining the differences between the audit andcarrying amounts for items in the sample, calculating the meandifference, and multiplying the mean by the number of items inthe population. This method is used when the populationcontains sufficient misstatements to provide a reliable sampleand when differences between carrying and audit amounts arenot proportional. If differences are proportional, ratio estimationis used. A sufficient number of nonproportional errors must existto generate a reliable sample estimate.
Answer (A) is incorrect. Individual carrying amounts must beknown to use difference estimation. Answer (B) is incorrect.Sufficient misstatements must exist to generate a reliablesample. Answer (D) is incorrect. Ratio estimation is appropriatefor proportional differences.
28. Ratio estimation sampling would beinappropriate to use to project the monetary error in apopulation if
A. The recorded carrying amounts and auditedamounts are approximately proportional.
B. A number of observed differences existbetween carrying amounts and auditedamounts.
C. Observed differences between carryingamounts and audited amounts are proportionalto carrying amounts.
D. Subsidiary ledger book balances for someinventory items are unknown.
Answer (D) is correct. (CIA, adapted)REQUIRED: The inappropriate use of ratio estimation
sampling.DISCUSSION: Ratio estimation is similar to difference
estimation except that it estimates the population error bymultiplying the carrying amount of the population by the ratio ofthe total audit amount of the sample items to their total carryingamount. It has been demonstrated that both ratio and differenceestimation are reliable and efficient when small errorspredominate and the errors are not skewed. Moreover, auditamounts should be proportional to carrying amounts.Consequently, ratio estimation requires that carrying amounts beknown.
Answer (A) is incorrect. Proportional relationships tend tosupport the use of ratio estimation. Answer (B) is incorrect.A minimum number of differences must be present to use ratioestimation. Answer (C) is incorrect. The existence ofproportional differences favors the use of ratio estimation.
248 SU 7: Audit Sampling
7.7 Variables Sampling -- Monetary-Unit
29. When an internal auditor uses monetary-unitstatistical sampling to examine the total value ofinvoices, each invoice
A. Has an equal probability of being selected.
B. Can be represented by no more than onemonetary unit.
C. Has an unknown probability of being selected.
D. Has a probability proportional to its monetaryvalue of being selected.
Answer (D) is correct. (CIA, adapted)REQUIRED: The effect of using monetary-unit sampling to
examine invoices.DISCUSSION: Monetary-unit sampling, also called
probability-proportional-to-size sampling, results in the selectionof every nth monetary unit. Thus, a 1,000 monetary unit item is1,000 times more likely to be selected than a 1 monetary unititem. The probability of selection of a sampled item is directlyproportional to the size of the item.
Answer (A) is incorrect. Each monetary unit, but not eachinvoice, has an equal probability of being selected unless allinvoices are for the same amount. Answer (B) is incorrect. It ispossible for two or more monetary units to be selected from thesame item; e.g., a 4,500 item will be represented by fourmonetary units if every 1,000th monetary unit is selected.Answer (C) is incorrect. The probability of selection can becalculated using the monetary value of the item and the monetaryvalue of the population.
30. Monetary-unit sampling (MUS) is most usefulwhen the internal auditor
A. Is testing the accounts payable balance.
B. Cannot cumulatively arrange the populationitems.
C. Expects to find several material misstatementsin the sample.
D. Is concerned with overstatements.
Answer (D) is correct. (CIA, adapted)REQUIRED: The circumstances in which monetary-unit
sampling is most useful.DISCUSSION: MUS, also called probability-proportional-
to-size (PPS) sampling, is a modified version of attributesampling that relates deviation rates to monetary amounts. Ituses the monetary unit as the sampling unit. MUS sampling isappropriate for testing account balances, such as those forinventory and receivables, in which some items may be far largerthan others in the population. In effect, it stratifies the populationbecause the larger account balances have a greater chance ofbeing selected. MUS is most useful if few misstatements areexpected. Moreover, it is designed to detect overstatements.It is not effective for estimating understatements because thegreater the understatement, the less likely the item will beselected. Special design considerations are required if theauditor anticipates understatements or zero or negativebalances.
Answer (A) is incorrect. An audit of accounts payable isprimarily concerned with understatements. Answer (B) isincorrect. The items in the population must be arranged bycumulative monetary total. The first monetary unit is chosenrandomly, the second equals the random start plus the sampleinterval in monetary units, etc. Answer (C) is incorrect. As theexpected amount of misstatement increases, the MUS samplesize increases. MUS may also overstate the upper misstatementlimit when misstatements are found. The result might berejection of an acceptable balance.
31. An internal auditor is planning to use monetary-unit sampling for testing the monetary value of a largeaccounts receivable population. The advantages ofusing monetary-unit sampling (MUS) include all of thefollowing except that it
A. Is an efficient model for establishing that a lowerror rate population is not materiallymisstated.
B. Does not require the normal distributionapproximation required by variables sampling.
C. Can be applied to a group of accountsbecause the sampling units are homogenous.
D. Results in a smaller sample size than classicalvariables sampling for larger numbers ofmisstatements.
Answer (D) is correct. (CIA, adapted)REQUIRED: The item not an advantage of MUS.DISCUSSION: MUS, also called probability-proportional-to-
size (PPS) sampling, is a modified version of attribute samplingthat relates deviation rates to monetary amounts. It uses amonetary unit as the sampling unit. MUS is appropriate fortesting account balances, such as those for inventory andreceivables, in which some items may be far larger than others inthe population. In effect, it stratifies the population because thelarger account balances have a greater chance of beingselected. MUS is most useful if few misstatements areexpected. Moreover, it is designed to detect overstatements.It is not effective for estimating understatements because thegreater the understatement, the less likely the item will beselected. Furthermore, as the number of expectedmisstatements increases, MUS requires a larger sample sizethan classical variables sampling.
Answer (A) is incorrect. MUS is efficient when fewmisstatements are expected. Answer (B) is incorrect. MUS doesnot assume normally distributed populations. Answer (C) isincorrect. MUS uses monetary units as sampling units.
SU 7: Audit Sampling 249

7.8 Selecting the Sampling Method
32. An internal auditor has taken a large samplefrom a population that is skewed in the sense that itcontains a large number of small balances and asmall number of large balances. Given this, theinternal auditor can conclude
A. The sampling distribution is not normal; thus,PPS sampling based on the Poissondistribution more accurately defines the natureof the population.
B. The sampling distribution is normal; thus, theZ score value can be used in evaluating thesample results.
C. The sampling distribution is not normal; thus,attribute sampling is the only alternativestatistical tool that can appropriately be used.
D. None of the answers are correct.
Answer (B) is correct. (CIA, adapted)REQUIRED: The auditor’s conclusion about a skewed
population.DISCUSSION: The central limit theorem states that,
regardless of the distribution of the population from whichrandom samples are taken, the shape of the sampling distributionof the means approaches the normal distribution as the samplesize increases. Hence, Z values (the number of standarddeviations needed to provide specified levels of confidence) canbe used. Z values represent areas under the curve for thestandard normal distribution.
Answer (A) is incorrect. The Poisson distribution isapplicable to attribute, not variables, sampling. Answer (C) isincorrect. Attribute sampling is not appropriate for testingmonetary balances. Answer (D) is incorrect. The samplingdistribution is normal, so the Z value can be used in evaluatingthe results.
Questions 33 through 35 are based on the followinginformation. An auditor is testing on a company’slarge, normally distributed accounts receivable file.The objectives of the audit are to test end-of-periodmonetary balances and accounts receivable postingexception (error) rates.
33. The accounts receivable file contains a largenumber of small monetary balances and a smallnumber of large monetary balances, and the auditorexpects to find numerous errors in the accountbalances. The most appropriate sampling techniqueto estimate the monetary amount of errors is
A. Difference or ratio estimation.
B. Unstratified mean-per-unit.
C. Probability-proportional-to-size.
D. Attribute.
Answer (A) is correct. (CIA, adapted)REQUIRED: The most appropriate sampling technique to
estimate the dollar amount of errors.DISCUSSION: Difference estimation calculates the average
difference between the audit and book values of sample itemsand multiplies by the number of items in the population. Ratioestimation multiplies the book value of the population by the ratioof the audit value of the sample to the book value. Thesemethods are useful when small errors predominate and theerrors are not skewed. If the number of errors is small, a verylarge sample is required to provide a representative differencebetween audit and book values.
Answer (B) is incorrect. Mean-per-unit estimation is used toproject a total monetary value by multiplying the mean samplevalue by the number of items in the population. Unstratifiedmeans that the population is not divided into subpopulations.This method is inappropriate when many small balance accounterrors exist. Answer (C) is incorrect. Probability-proportional-to-size sampling is used for estimating monetary values of errorswhen the expected error frequency is low. Because the samplingunit is the monetary unit, this method increases the likelihood ofselecting large items. Answer (D) is incorrect. Attribute samplingdoes not involve estimation of monetary amounts.
34. The expected population exception rate is 3% forthe accounts receivable posting processes. If theauditor has established a 5% tolerable rate, theauditor would use which sampling plan for testing theactual exception rate?
A. Difference or mean per unit estimation.
B. Discovery.
C. Stratified.
D. Attribute.
Answer (D) is correct. (CIA, adapted)REQUIRED: The sampling plan used to test the actual
exception rate.DISCUSSION: The accounts receivable posting exception
rate would be determined using attribute sampling. Attributesampling is used for applications involving binary (yes-no orright-wrong) propositions. Whether an item has been postedrequires a yes-no answer.
Answer (A) is incorrect. Difference or mean estimation isused when sampling for monetary values. Answer (B) isincorrect. Discovery sampling is only used when exception ratesare expected to be very low. Answer (C) is incorrect. Stratifiedsampling arranges populations for more efficient sampling.
250 SU 7: Audit Sampling

35. To test the accounts receivable file to computean estimated monetary total, the auditor could useany one of the following sampling techniques except
A. Difference or ratio estimation.
B. Unstratified mean-per-unit estimation.
C. Probability proportional to size.
D. Attribute.
Answer (D) is correct. (CIA, adapted)REQUIRED: The sampling technique that would not be
used to compute an estimated dollar total.DISCUSSION: Attribute sampling is used for applications
involving binary (yes-no or right-wrong) propositions. Attributesampling does not involve estimation of monetary amounts.
Answer (A) is incorrect. Difference or ratio estimation can beused to estimate population dollar values. Both methods involvedetermining the difference between the audit and book values ofitems in the sample. Answer (B) is incorrect. Mean-per-unitestimation averages audit values and multiplies them by the unitsin the population to estimate the account balance. Answer (C) isincorrect. Probability-proportional-to-size sampling uses themonetary as the sampling unit. It is a means of testing accountbalances.
36. An auditor is conducting a survey of perceptionsand beliefs of employees concerning an organizationhealth care plan. The best approach to selecting asample is to
A. Focus on people who are likely to respond sothat a larger sample can be obtained.
B. Focus on managers and supervisors becausethey can also reflect the opinions of the peoplein their departments.
C. Use stratified sampling where the strata aredefined by marital and family status, age, andsalaried/hourly status.
D. Use monetary unit sampling according toemployee salaries.
Answer (C) is correct. (CIA, adapted)REQUIRED: The best approach for sampling employee
beliefs.DISCUSSION: Stratified sampling divides a population into
subpopulations, thereby permitting the application of differenttechniques to each stratum. This approach reduces the effect ofhigh variability if the strata are selected so that variability amongthe strata is greater than variability within each stratum. Forexample, one expects to find greater similarities among marriedpeople than between married people and unmarried people.
Answer (A) is incorrect. This convenience sample is likely toemphasize people with the time to respond at the expense ofemployees who are too busy with company work to respond.Answer (B) is incorrect. Managers and supervisors often do nothave the same needs and perceptions as their subordinates andalso often misperceive the views of employees. Answer (D) isincorrect. The survey tests perceptions and beliefs, not monetaryamounts.
37. When an internal auditor’s sampling objective isto obtain a measurable assurance that a sample willcontain at least one occurrence of a specific criticalexception existing in a population, the samplingapproach to use is
A. Random.
B. Discovery.
C. Probability-proportional-to-size.
D. Variables.
Answer (B) is correct. (CIA, adapted)REQUIRED: The sampling approach used to obtain a
measurable assurance that a sample will contain at least oneoccurrence of a specific critical exception.
DISCUSSION: Discovery sampling is a form of attributesampling used to identify critical deviations in a population. Theoccurrence rate is assumed to be at or near 0%, and the methodcannot be used to evaluate results statistically if deviations arefound in the sample. Hence, discovery sampling is used for testsof controls, but it is appropriate only when one deviation iscritical. The sample size is calculated so that the sample willcontain at least one example of a deviation if it occurs in thepopulation at a given rate.
Answer (A) is incorrect. Random sampling is a method usedto choose the sample. Answer (C) is incorrect. Probability-proportional-to-size (monetary-unit) sampling is a modifiedversion of attribute sampling that relates deviation rates tomonetary amounts. Answer (D) is incorrect. Variables samplingis used to estimate the value of a population, not the occurrencerate of deviations.
SU 7: Audit Sampling 251

38. Variability of the monetary amount of individualitems in a population affects sample size in which ofthe following sampling plans?
A. Attribute sampling.
B. Monetary-unit sampling.
C. Mean-per-unit sampling.
D. Discovery sampling.
Answer (C) is correct. (CIA, adapted)REQUIRED: The sampling plan in which variability of the
monetary amount of individual items affects the sample size.DISCUSSION: Variables sampling applies to monetary
values or other quantities in contrast with the binary propositionstested by attribute sampling. Mean-per-unit sampling is a form ofvariables sampling. It averages the observed values of thesample items and multiplies the average by the number of itemsin the population to estimate the population value. Precision isthen determined. The formula for the size of a mean-per-unitsample equals the square of the confidence coefficient times thesquare of the standard deviation, with the product divided by thesquare of the per-unit precision. The standard deviationmeasures variability. Thus, the larger the standard deviation (anumerator item), the larger the sample size that is required toachieve specified levels of precision and confidence.
Answer (A) is incorrect. Attribute sampling tests binary(yes/no) propositions. It is not used for tests of monetaryamounts, so the variability of monetary amounts is not an issue indetermining sample size. Answer (B) is incorrect. Monetary-unit(probability-proportional-to-size) sampling neutralizes variabilityby defining the sampling unit as an individual monetary unit.Answer (D) is incorrect. The objective of discovery sampling is toselect items until at least one item is discovered with a particularcharacteristic, such as evidence of fraud.
7.9 Process Control Techniques
39. A health insurer uses a computer application tomonitor physician bill amounts for various surgicalprocedures. This program allows the organization tobetter control reimbursement rates. The X-bar chartbelow is an example of the output from thisapplication.
Select the interpretation that best explains the dataplotted on the chart.
A. Random variation.
B. Abnormal variation.
C. Normal variation.
D. Cyclic variation.
Answer (B) is correct. (CIA, adapted)REQUIRED: The interpretation that best explains the data
plotted on the chart.DISCUSSION: Statistical quality control charts are graphic
aids for monitoring the status of any process subject to randomvariations. For example, an X-bar chart depicts the samplemeans for a variable. If the values fall within the upper and lowercontrol limits, no action is taken. Accordingly, values outsidethese limits are abnormal and should be investigated for possiblecorrective action.
Answer (A) is incorrect. Random variations should fall withinrealistically determined control limits. Answer (C) is incorrect.Normal variations should fall within realistically determinedcontrol limits. Answer (D) is incorrect. In time series analysis,cyclic variation is the fluctuation in the value of a variable causedby change in the level of general business activity.
252 SU 7: Audit Sampling
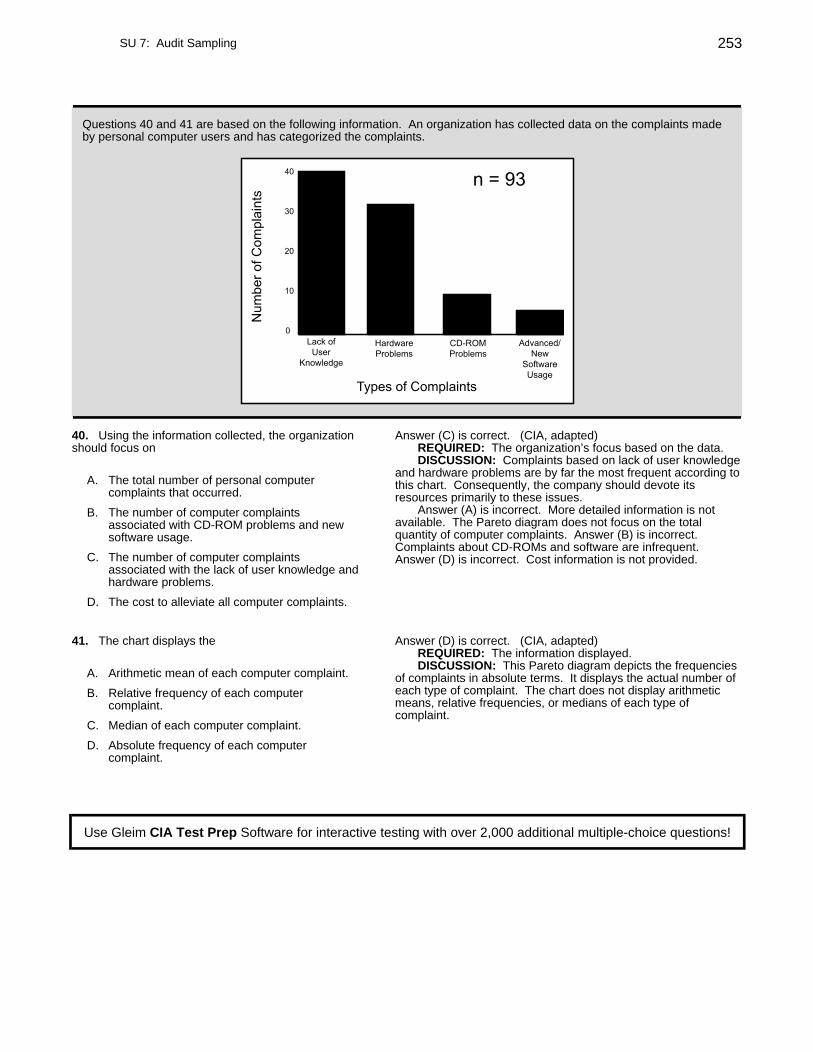
Questions 40 and 41 are based on the following information. An organization has collected data on the complaints madeby personal computer users and has categorized the complaints.
40. Using the information collected, the organizationshould focus on
A. The total number of personal computercomplaints that occurred.
B. The number of computer complaintsassociated with CD-ROM problems and newsoftware usage.
C. The number of computer complaintsassociated with the lack of user knowledge andhardware problems.
D. The cost to alleviate all computer complaints.
Answer (C) is correct. (CIA, adapted)REQUIRED: The organization’s focus based on the data.DISCUSSION: Complaints based on lack of user knowledge
and hardware problems are by far the most frequent according tothis chart. Consequently, the company should devote itsresources primarily to these issues.
Answer (A) is incorrect. More detailed information is notavailable. The Pareto diagram does not focus on the totalquantity of computer complaints. Answer (B) is incorrect.Complaints about CD-ROMs and software are infrequent.Answer (D) is incorrect. Cost information is not provided.
41. The chart displays the
A. Arithmetic mean of each computer complaint.
B. Relative frequency of each computercomplaint.
C. Median of each computer complaint.
D. Absolute frequency of each computercomplaint.
Answer (D) is correct. (CIA, adapted)REQUIRED: The information displayed.DISCUSSION: This Pareto diagram depicts the frequencies
of complaints in absolute terms. It displays the actual number ofeach type of complaint. The chart does not display arithmeticmeans, relative frequencies, or medians of each type ofcomplaint.
Use Gleim CIA Test Prep Software for interactive testing with over 2,000 additional multiple-choice questions!
SU 7: Audit Sampling 253

254 SU 7: Audit Sampling