Study Report on Creating Corporate Success in the N.E ...
215
Study Report on Creating Corporate Success in the N.E. (Oct 2001) All India Shippers Council, New Delhi CONTENTS TITLE Page No. I Creating Corporate Success in the North East 1-6 Introduction 1 Doing Business in the North East : Some Bottlenecks and Challenges 2 Strengths and Weaknesses, Opportunities and Threats 4 II Creating A Climate for Corporate Success 7-18 Land Policy 7 Investors need to be welcomed with open arms 11 Role of Financial Institutions 12 Labour Policy 12 Claiming Financial Incentives 13 Revamping Infrastructure - Key Thrust on Power 13 III Road Map for Applying Selective Thrust 19-46 - New Industrial Policy 19 - Agribusiness Opportunities Deserve Greater Focus 20 - Floricultural Products 22 - Ginger Cultivation 24 - Organically Grown Tea 27 - Tung Oil 27 - Cane and Bamboo Products 28 - Rubber and Rubber Products 28 - Assistance from APEDA 29 - Sericulture offers new Opportunities 30 - Inland Water Transport - Upcoming Opportunity 30 - Inland Container Depot 31 - Travel and Tourism have Potential 32 - Health Care 33 - Oil Sector 34 - Scope for Knowledge-Based Industries 34 - Venture Capital Financing 35 - Telecommunications 36 - Integrating with World Economy 36 - Border Trade - Requires Liberalisation 37 - Indo-Myanmar Trade 39 - Liberalisation of Bilateral Trade 42 - Review of Export First-Import Later Policy 42 - Strengthening of Infrastructural Facilities 42 - Establishment of Joint Ventures 43 - Promotion of Border Trade through Nagaland Routes 43 - Indo-Bangladesh Trade 43 IV Creating Corporate Success – Findings and Observations 47-54 Some Steps for Enhancing Corporate Success 52 Annexure -1: Some Examples of Corporate Success Annexure-2
Transcript of Study Report on Creating Corporate Success in the N.E ...
Study Report on Creating Corporate Success in the N.E. (Oct 2001) All India Shippers Council, New Delhi
CONTENTS
TITLE Page No. I Creating Corporate Success in the North East 1-6 Introduction 1 Doing Business in the North East : Some Bottlenecks and Challenges 2 Strengths and Weaknesses, Opportunities and Threats 4
II Creating A Climate for Corporate Success 7-18 Land Policy 7 Investors need to be welcomed with open arms 11 Role of Financial Institutions 12 Labour Policy 12 Claiming Financial Incentives 13 Revamping Infrastructure - Key Thrust on Power 13
III Road Map for Applying Selective Thrust 19-46 − New Industrial Policy 19 − Agribusiness Opportunities Deserve Greater Focus 20 − Floricultural Products 22 − Ginger Cultivation 24 − Organically Grown Tea 27 − Tung Oil 27 − Cane and Bamboo Products 28 − Rubber and Rubber Products 28 − Assistance from APEDA 29 − Sericulture offers new Opportunities 30 − Inland Water Transport - Upcoming Opportunity 30 − Inland Container Depot 31 − Travel and Tourism have Potential 32 − Health Care 33 − Oil Sector 34 − Scope for Knowledge-Based Industries 34 − Venture Capital Financing 35 − Telecommunications 36 − Integrating with World Economy 36 − Border Trade - Requires Liberalisation 37 − Indo-Myanmar Trade 39 − Liberalisation of Bilateral Trade 42 − Review of Export First-Import Later Policy 42 − Strengthening of Infrastructural Facilities 42 − Establishment of Joint Ventures 43 − Promotion of Border Trade through Nagaland Routes 43 − Indo-Bangladesh Trade 43
IV Creating Corporate Success – Findings and Observations 47-54 Some Steps for Enhancing Corporate Success 52 Annexure -1: Some Examples of Corporate Success
Annexure-2

1
I
Creating Corporate Success in the North East Introduction
In the era of globalisation that has overtaken the whole world today, countries as well as regimes and states within a country have little option but to compete for investment flows. And it is with a view to open up the market opportunities to private investment that an International Conference on “Business Opportunities in North East India - Guwahati Initiative” was organised on 22-23rd February 2001 by Federation of Indian Chambers of Commerce and Industry (FICCI) and the Federation of Industries and Commerce of North Eastern Region (FINER) with the support of Government of Assam..
In a liberalised policy environment, with only very few areas covered by licensing the role of the Government is indeed extremely limited in directing investment. Any investor either foreign or Indian now has the option to select from an array of competing opportunities and locations. The North Eastern Region is no exception.
Creating a competitive investment climate in the North East was one of the principal areas of concern of this conference. The crux of the conference proceedings highlights that apart from all other economic considerations, the ‘feel good factor’ about the current business environment and the level of confidence in the future of an economy play deciding roles in investor preferences. Simultaneously the steady emergence of successful entrepreneurs from the Region acts as a strong motivating factor for others to follow. This study annexes some direct examples of corporate success stories in the North East to demonstrate that despite various obstacles the flow of capital formation is on.
Nothing succeeds like success and nothing attracts investors more easily than success stories. Of course, the attraction that any investment destination offers consists of both tangible and intangible conditions. Greater attention is therefore required towards creating and formulating corporate success to help gravitate new investment flows. It would not be out of place to mention here that in a fairly open investment regime, sometimes investors tend to by-pass difficult options.

2
Doing Business in the North East : Some Bottlenecks and Challenges
Unlike in the case of other regions in the country, the North Eastern Region occupies 8.06% of India’s total land area with a population of around 35 million and shares only 2% of its boundary with the main land of the country while 98% is linked with India’s international border between Bangladesh, Myanmar, China and Bhutan. The entire region with its land locked geo-political and economic dimension coupled with a multi-tribal, multi-ethnic and multi-lingual socio-cultural populace becomes a real test of judgment for entrepreneurs and policy makers. The entire region has developed several in built resistance to economic advancement over the years.
The North East of India is usually packaged as one entity, which does not take into account the ground realities of difficulties of travel and free trade in the region.
Quite apart from the fact that there are many distinct ethnic groups inhabiting the various States in the region, who have their own language, culture and religion, there is an almost insurmountable barrier by way of hilly terrain, distances and time required to travel between the States in the North East.
It still takes almost two days to travel to Manipur from Guwahati and Tripura is best visited by air. Even to certain areas of Assam’s neighbouring States of Arunachal Pradesh and Nagaland, it takes one full days travel. The main reason for this is the poor condition of the National Highways and other roads in the region. For any meaningful increase in trade, not only within the region but also with our neighbouring countries, it is essential to first improve and expand the road network. There is also a pressing need to have a viable and efficient regional airline in place to connect at least the State capitals on a regular basis.
Doing business in the North-East has its own challenges. The region has enormous resources that have not been fully developed. After partition the region lost all the traditional routes to the main centres of trade and industry and despite fifty years of independence. The region is still to recover from the fatalities of distortion. During the old days, a boat with tea, timber, coal from Dibrugarh, which is about 400 km. away, would reach Calcutta in eight days of day-night navigation. Now the same boat doesn’t go from Dibrugarh, but from Guwahati, and takes a long time because there are no night navigation facilities, no river channeling, and a large number of customs points. Traveling from Guwahati to Tripura, going from Guwahati to Aizwal is almost a two-day affair, even if it’s a flying distance of only 35 minutes. Coming from outside the region means staying overnight in Calcutta.

3
In many ways the current state of economic and social environment in the North East presents a paradox for development planners. Recent research by some economic scholars* reveal a host of interesting contradictions :
1. Agriculture still predominates the entire sphere of economic activity while the industrial sector is a distant second. The tertiary or services sector comprising banking, insurance, financial service, travel, health, education etc is depressed and available figures are actually inflated. While agriculture receives primacy of importance, the degree of commercialisation is negligible, slash and burn (jhum) cultivation is widely prevalent in a majority of the hill areas, while single crop traditional agriculture dominates in the plains. The existing land tenure system of the region with its emphasis on local ownership adds to the prevalence of innumerable small sized farm holdings. Naturally this acts as a strong impediment to the spread of commercialisation in agriculture.
2. Efforts to industrialise the state have largely been state sponsored. Most cases of industrial success have emerged from the private sector. The North East was the first to receive public investment in Oil and Natural Gas and yet the rising cost of per unit operations have made much of these investments non-competitive today. Similarly state sponsored small scale industries are now very unviable. Reduction in tariff barriers coupled with a free flow of goods from across the border have all added to the plight of small scale entrepreneurs.
3. The region has mixed levels of infrastructure. There are pockets in the region (like Assam) which have a network of railways and highways that are quite comparable to many economically advanced regions in the country. However, despite the latent potential for hydro-power, barring Meghalaya, power is a great bottleneck. Telecommunication network requires to go beyond the capital cities to gain wider usage and mass appeal.
4. The region by and large has a long history of administrative experience. Therefore the existing government institutional infrastructure is fairly well equipped. There are also pockets where it is woefully lacking.
_____________ * Sachdeva (1998)
4
5. Contrary to popular belief the entire North east is a labour scarce region with the possible exception of the Brahmaputra valley and Tripura. Populist policies based on general levels of unemployment have made it difficult for industry to find skilled manpower locally and most entrepreneurs shy away from undertaking any major investments into industrial projects as these involve ‘importing’ skilled workforce from elsewhere.
6. Despite enormous Central Government support, the economic health of most State Governments continues to remain questionable. Low volumes of business activity imply the prevalence of a narrow taxable base and this means strained financial resources. Hence several State Governments in the region are handicapped to pursue their own economic agendas without proper central support.
7. One of the greatest assets of the region is a large educational infrastructure, both for lower as well as for higher education. The region has always had a tradition of higher learning. In today’s world of information technology and IT enabled services this has strong implications for future investment potential. However, in the absence of adequate employment opportunities the North East “exports” a sizable number of skilled manpower to other economically advanced states.
8. The western frontiers of the North East are connected to the eastern part of the Indian subcontinent by a narrow land corridor. Sometimes referred to as the Chicken’s Neck. The physical isolation is evident. However in an increasingly integrated world economy, there is a good possibility that the locational disadvantage of the North East could be converted into an advantage, by adopting corrective steps to liberalise the border trade with Myanmar and Bangladesh.
Strengths and Weaknesses, Opportunities and Threats
Located in one of the world’s richest bio-geographic zone, Assam and the other North-Eastern states are extremely rich in bio-diversity. Nature has blessed Assam with resources like oil and gas, coal, limestone, granite etc, which are very rich resources for investment. The ideal climatic conditions also allow for investment in plantations, medicinal plants and herbs, horticulture and food processing. The region offers immense potential for investments in the tourism sector and in the generation of hydro-electrical power. The largest state, Assam, has a population figure of 26.8 million with a population density of 286 per sq km indicates the

5
market size and the scope of investment in demand-based industries. In the context of globalisation, Assam and the North-Eastern states are strategically located because of their proximity to the East and South-East Asian countries.
The percentage of people living below the poverty line in rural areas is about 45.01% as against the all India figures of 37 percent. Rural unemployment, particularly among the educate youth of this region has contributed immensely to the state of unrest and discomfort. The nature of insurgency which prevails in the region has prompted some policy makers to describe the phenomenon as somewhat of “small-scale” industry run by a band of educated youth who, in the absence of viable job opportunities, have taken up the gun to derive authority and employment.
Assam is the biggest state in the North East region with 80 percent of its population of 2.68 crore (26.8 million). Its geographical area is second only to Arunanchal Pradesh. It has 24,000 villages 93 towns and a literacy rate of 80 per cent. The per capita income is around Rs 9,600 compared to an all India average of Rs 15,000. The Brahmaputra divides Assam into two parts, North Assam and South Assam. Efforts are underway to lay strong foundation for what is called Assam Inc., making it a destination for corporate houses to invest in the new Assam. The cutting edge or the competitive edge of Assam remains its natural resources. But there remains the prevailing disadvantage of locational bottlenecks. At the same time early birds can take maximum advantage of the cheap and qualified labour and the general package of incentives to kick-start a variety of mass based industries.
If one sees North East in a global context, or in a South Asian context, then we have the North-east in the centre of the area. The region is surrounded by China, Myanmar and all the South-east tigers i.e. Singapore, Hong Kong, Malaysia and Thailand; and we have Nepal, Bangladesh and Bhutan. At the same time, the region is also the gateway to South-East Asia. The aerial distance from Guwahati to Singapore, Malaysia or to Thailand is less than the distance to Mumbai or Chennai. Recently, Guwahati has been declared an international airport, and with the South-east pre-financial trade agreement becoming applicable and increased globalisation, one can visualise a lot of new opportunities for the North-east and East India.
While discussing natural resources, the first thing that comes to mind is the oil well reserves. Oil wells were introduced in the region way back in 1889 and there is the world’s second-oldest refinery and Asia’s first refinery at Digboi. There is plenty of scope for undertaking new exploration in the region as per the new exploration guidelines of the Government of India remitting all exploration by private parties and

6
foreign multinational companies, apart from Indian Oil and ONGC. There is a large reserve of natural gas and its careful exploitation can lead to growth of several ancillary industries. The Government of Assam has tied up with Reliance Industries Limited and it is expected that the construction of this gas-sector project will be started shortly from this year.
Apart from this, there are a number of petrochemical projects and power plants next to the natural gas reserves. There are a huge deposit of limestone (800 million tonnes), coal (320 million tonnes), as well as granite, mica, gypsum, glass, china clay etc for ceramic and pottery industries.
For investment in the North-east region, the Government of India has announced a unique package of incentives with excise and tax rebates for 10 years, capital investment subsidies, subsidies on working capital, food subsidies and also 100 per cent subsidies for insurance premium for industrial units. There are no locational restrictions if the industries are set up anywhere in Assam in case of 18 specified industries, which includes mineral-based industries, food processing industries, and tea-based industries. Certain industries such as mining, power and plantation can get automatic FDI approval.

7
II
Creating a climate for corporate success in the North East
To attract private investment and capital to the region, some basic changes are necessary. They are mainly in the areas of land policy, labour laws, infrastructure both hard and soft, general law and order situation in the states, attitudes of financial institutions, disbursement of incentives and so on.
Land Policy Apart from some industry in Assam, the region is primarily agricultural. So the initial impetus to economic activity must commence from agriculture. Some of our most industrialised States (like Maharashtra, Gujarat) have a strong agrarian base. The present agricultural techniques are archaic and relatively unproductive. For a start the agriculture of the region must be commercialised. There is a further scope for tea plantations, horticulture, rubber plantations, floriculture, sericulture. As it is the share of cash crops in the total agriculture production in the region is already quite substantial as indicated in the following Table.
Percentage Share of Cash Crops to Total Crops in North-East
(1994-95)
State % of Cash Crops to Total Crops
Arunachal Pradesh 46.3
Assam 45.0
Manipur 44.1
Meghalaya 54.5
Mizoram 34.6
Nagaland 54.3
Tripura 33.5
All India 42.8
Source : Parliamentary Questions. 25 February, 1996

8
With the exception of the Rubber Board, the government departments which promote such activities have more or less failed to be the rightful catalysts in all the States. These are all highly capital intensive and technical activities; and there really is no choice but to invite private capital into some of these areas. However, the present land tenure system in the region is very complex, and is a strong deterrent for outside investment. Apart from Assam, it is difficult to get land in other North-East States either on ownership or on lease. In order to attract private capital, there is an urgent need to look into current land policies.
Land Tenure System in the North-East
Arunachal Pradesh: Cultivation Pattern - 75% Shifting 25% settled Legal Position - No land Tenure System with legal backing Transfer of Land to Non Tribals and Outsiders - Prohibited by Customary Law Pattern of Ownership - Community, Clan and Private Assam : Plain Areas : Legal Position - Assam Land and Revenue Regulation 1886 Transfer of Land to Non Tribals and Outsiders - Possible except in designated 'Protected Areas' within the Tribal Belts and Blocks. Hill Districts : Karbi Anglong Legal Position - Only Executive Orders and Instruction
9
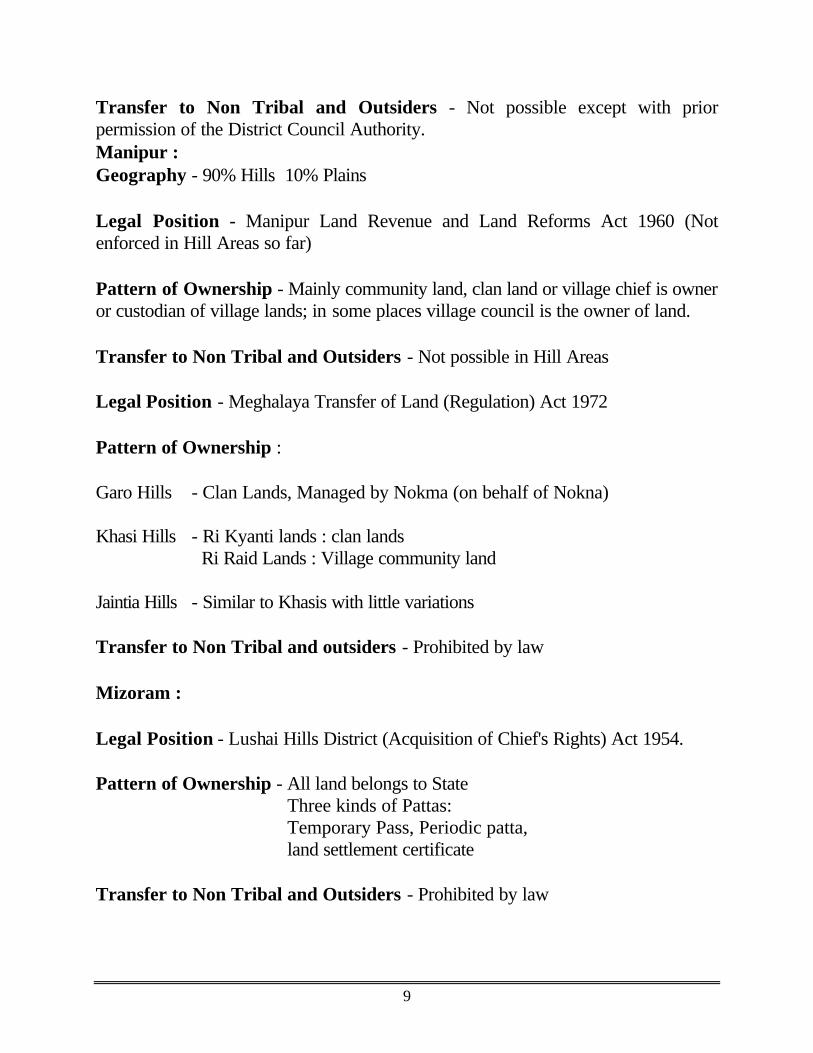
Transfer to Non Tribal and Outsiders - Not possible except with prior permission of the District Council Authority. Manipur : Geography - 90% Hills 10% Plains Legal Position - Manipur Land Revenue and Land Reforms Act 1960 (Not enforced in Hill Areas so far) Pattern of Ownership - Mainly community land, clan land or village chief is owner or custodian of village lands; in some places village council is the owner of land. Transfer to Non Tribal and Outsiders - Not possible in Hill Areas Legal Position - Meghalaya Transfer of Land (Regulation) Act 1972 Pattern of Ownership : Garo Hills - Clan Lands, Managed by Nokma (on behalf of Nokna) Khasi Hills - Ri Kyanti lands : clan lands Ri Raid Lands : Village community land Jaintia Hills - Similar to Khasis with little variations Transfer to Non Tribal and outsiders - Prohibited by law Mizoram : Legal Position - Lushai Hills District (Acquisition of Chief's Rights) Act 1954. Pattern of Ownership - All land belongs to State
Three kinds of Pattas: Temporary Pass, Periodic patta, land settlement certificate
Transfer to Non Tribal and Outsiders - Prohibited by law

10
Nagaland : Legal Position - Customary laws Pattern of Owernship - Common Village land, Clan land, Individual land, Morung land Transfer to Non Tribal and Outsiders - Not possible Tripura : Geography - Hills 60%, Plains 40% Legal Position - Tripura Land Revenue & Land Reforms Act 1960, Tripura Tribal Area Autonomous District Council Act 1979 Pattern of Ownership - Community Transfer to Non Tribal and Outsiders - Prohibited without the permission of Deputy Commissioner The above data indicates the complex nature of the land tenure system in the region. Any market based economy cannot grow in a place where there is no genuine market for the basic factor of production - land. There is a realisation now in the region that the land tenure system among the tribals is responsible for the slow growth in agriculture. It was also observed in Manipur that private lands are more developed compared to the community land; even hill lands under private ownership or management are prosperous [Refer FEEDS and IPA (1997)]. Amongst western economies the collapse of the economic system in the USSR is a strong example of low productivity in traditional collective enterprises can depress overall economic activity. Therefore, it is evident that major policy actions in the area of land policy have to be implemented by almost all the States. During the conference on Business Opportunities in the North East India, time and againentrepreneurs and industry representatives emphasised that land should be made available to investors for industrial or agricultural purposes in a transparent manner, either on lease or on ownership. This would be an important step to remove one of the greatest
11
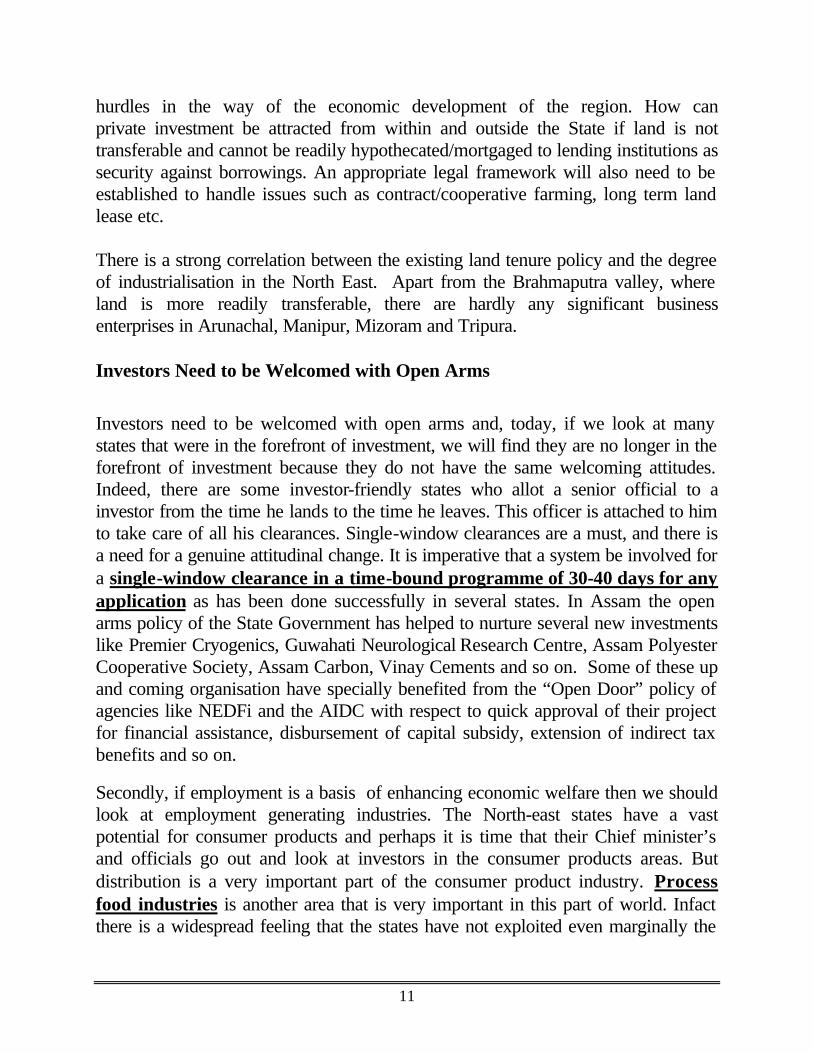
hurdles in the way of the economic development of the region. How can private investment be attracted from within and outside the State if land is not transferable and cannot be readily hypothecated/mortgaged to lending institutions as security against borrowings. An appropriate legal framework will also need to be established to handle issues such as contract/cooperative farming, long term land lease etc. There is a strong correlation between the existing land tenure policy and the degree of industrialisation in the North East. Apart from the Brahmaputra valley, where land is more readily transferable, there are hardly any significant business enterprises in Arunachal, Manipur, Mizoram and Tripura. Investors Need to be Welcomed with Open Arms
Investors need to be welcomed with open arms and, today, if we look at many states that were in the forefront of investment, we will find they are no longer in the forefront of investment because they do not have the same welcoming attitudes. Indeed, there are some investor-friendly states who allot a senior official to a investor from the time he lands to the time he leaves. This officer is attached to him to take care of all his clearances. Single-window clearances are a must, and there is a need for a genuine attitudinal change. It is imperative that a system be involved for a single-window clearance in a time-bound programme of 30-40 days for any application as has been done successfully in several states. In Assam the open arms policy of the State Government has helped to nurture several new investments like Premier Cryogenics, Guwahati Neurological Research Centre, Assam Polyester Cooperative Society, Assam Carbon, Vinay Cements and so on. Some of these up and coming organisation have specially benefited from the “Open Door” policy of agencies like NEDFi and the AIDC with respect to quick approval of their project for financial assistance, disbursement of capital subsidy, extension of indirect tax benefits and so on.
Secondly, if employment is a basis of enhancing economic welfare then we should look at employment generating industries. The North-east states have a vast potential for consumer products and perhaps it is time that their Chief minister’s and officials go out and look at investors in the consumer products areas. But distribution is a very important part of the consumer product industry. Process food industries is another area that is very important in this part of world. Infact there is a widespread feeling that the states have not exploited even marginally the
12
processed food industry in the North East. However, a successful beginning has been made with the launching of North East Pure Drinks Ltd which is a joint venture between a local entrepreneur and Pepsico Ltd. This project has been put into commercial operation within a very short time frame and is reportedly doing well.
Role of Financial Institutions
There is a strong feeling amongst businessmen and entrepreneurs that the financial institutions have still not understood the desires of the Governments in the North-eastern states. There is enormous delay in sanctions, there is a penal rate of interest, and the penal rate of interest is on the basis that the loan is not secured in this part of the country. There is a clear case for a lower interest rate in this part of the country to attract investors. Again, financial institutions should look at viable projects and clear them quickly. Inspite of having 200 per cent of primary securities in the form of land and buildings, these institutions ask for 100 per cent additional collateral securities. Another area is rate of interest. In spite of having a successful promoter’s track record, ongoing project, adequate security, the rate of interest charged by financial institutions is high. Although institutions like the NEDFi have helped to create a climate of initial investment, if we have to convert the tide into a flood then a more positive attitude amongst lending agencies needs to be adopted. Time and again the conference witnessed speakers who narrated some of their avoidable experiences with banks on account of disbursement of term loans, working capital facilities and application of penal interest charges. Infact, one of the participating companies (Assam Carbon) provided detailed account of how in the initial start-up period their projected requirement of working capital was curtailed by the dealing bank and unit almost went sick.
Labour Policy
Another important issue related to economic development in the region is labour. It has to be understood that the North-Eastern region is a labour scarce economy rather than a labour surplus economy. This is perhaps one of the main reasons for the failure of the various labour intensive government schemes in the areas of animal husbandry, fishery and Jawahar Rozgar Yojana, etc. Despite all the reference to 'outsider invasion', labour (both skilled and unskilled) is quite scarce in the region with the possible exception of the Brahmaputra valley and Tripura. Already outside labour (mainly from Bangladesh, Myanmar and other parts

13
of India) is a crucial factor in both agricultural as well as non-agricultural activities of the region. Discussions with local entrepreneurs reveal that with an increase in economic activities, the problems of labour shortage is expected to get aggravated. Unless the region is opened up for outside labour, economic development is going to suffer. Labour, ofcourse is a highly sensitive issue; and the respective State Governments need to incorporate a proactive labour policy. For the economic development of the region, it is imperative to evolve a tolerant labour policy. Already some States have started some measures to deal with the problem. They are considering a control mechanism to allay tribal apprehensions of influx of outsiders. The labour policy has to become more open if the North-East Region really desires to take advantage of new opportunities. Perhaps as a test case at least in the Special Economic Zones there should be adequate freedom given to industry to recruit people with desired skills from wherever. There is a growing apprehension amongst prospective entrepreneurs that there is an acute shortage of skill labour and this in turn makes sophisticated investments in engineering and processing industries even more difficult. However, there are instances when “enlightened” managements such as ONGC, Vinay Cements, Premier Cryogenics have helped to nurture their own pool of talent. This has helped to create a wider talent base. Claiming Financial Incentives The 100 percent excise duty refunds is one of the most welcome subsidies that make the North East a very attractive location. However, for full impact of the benefit, the locational instruction needs immediate removal and, also moderate credit needs to be allowed. Central and other subsidies help ensuring the bottomline. As for the insurance refund policy, not even the rules have been formed, and there is no one yet who has claimed the insurance refund. This is something that has to be looked into and rules are required to be formed as early as possible so the genuine entrepreneurs are not put to hardship. Similarly there is a huge back log in the disbursement of transport subsidy and at long last the entire process of claim settlement has been entrusted to NEDFi. To a large extent individual cases of hardship have been taken up by FINER with the concerned agencies and officials. Revamping infrastructure - key thrust on Power
14
Every study on the North-East has highlighted the problem of infrastructure in the region. The S P Shukla Commission which was set up mainly to look into infrastructural gaps in the region has reported that infrastructural requirements for the region are a staggering amount of Rs 93,619 crores, and it estimated that the requirements for the Ninth Plan period itself are at about Rs 18,000 crores. However, of the total estimates, more than Rs 60,000 crores are for the power sector alone. This is the crucial area which requires strong attention. The following tables show that despite having only about 100 KWH per capita consumption (against the national average of 319 KWH), all the States in the region except Meghalaya face a shortage of power. Yet the North-East Region has a huge reserve of hydro-electric potential averaging between 30,000 and 40,000 MW. Arunachal Pradesh alone is supposed to have the potential of about 30,000 MW, of which only 25 MW has been harnessed so far. If only a portion of the hydro electric potential is realised, the region can become attractive to investors. Obviously, this is one area where foreign direct investment can be readily attracted. Table 2 shows that more than 15 new power projects, including the private sector projects, are at different stages of implementation. Project reports of Lower Kopili and Tipaimukh projects are also ready. Twenty-seven other projects are under active consideration. All these projects would require about Rs 40,000 crore worth of investment.

15
Table - 1 Power Situation in the North East
Arunachal Assam Manipur Meghalaya Mizoram Nagaland Tripura Central
Sector NER
1 1 1 1 1 1 1 1 1 1 Hydro Power Potential at 60% Load Factor (mw)
26756
351
1176
1070
1455
1040
9
-
31857 Generating Capacity March 1996 (mw)
Hydral 24 2 3 187 3 3 16 255 492 Thermal 16 595 9 7 21 4 53 168 873 Total 40 59 12 194 24 7 53 356 1366 Situation in 1994-95 Require-ment
55
500
75
79
43
33
82
-
840 Avail-ability
36
345
59
79
31
26
45
-
620 Surplus(+)/ Deficit (-)
-19
-155
-16
0
-12
-7
-37
-220
1 1 1 1 1 1 1 1 1 1
Surplus(+)/ Deficit (-)
-34.5
-31
-21.3
0
-27.9
-21.2
-45.1
-
-26.2
Peak (mw) Projection for 1999-2000
86
1187
163
119
98
64
150
-
1867 Per Capita Consump-tion of Electricity 1994-95 (Kwh)
66
104
129
136
112
59
66
319 AI
102 Village Electrifica-tion (%) March 1996)
67
99
49
100
99
100
886 AI
-
- Comm. Loss of State Electricity Boards March 93 (Rs Crore)
1131
19

16
Table - 2
Power Plants Commissioned Between 1992-93 and 1995-96
Project Type Ownership State Capacity (Mw) Year of Commissioning
Lakwa Gt Unit 5.6 Gas State Govt. Assam 20x2 1993-94
Lakwa Gt Unit II 7 Gas State Govt. Assam 20 1994-95
Kathalguri GT 1,2,3 Gas Central Govt. Assam 33.5x3 1994-95
Kathalguri Gt 4.5 Thermal Central Govt. Assam 33.5x2 1995-96
Umiam Umtru Unit 1 Hydro State Govt. Meghalaya 30x2 1992-93
Rokhta Ph III Gt 3.4 Thermal Central Govt. Tripura 8x2 1995-96
Source : India's Energy Sector, CMIE, September 1996

17
Table 3
Status of Main New Power Projects in the NER
Project Raw Material
Cost Rs (Crore)
Capacity (MW)
Ownership Status
1 2 3 4 5 6
Ranganadi (Aru)
Hydral 774.00 405 Neepco* (Central Govt.) Under Implementation
Damwe (Aru) Hydral 1500.00 520 Neepco (Central Govt.) Proposed
Kharsang (Aru) Gas 232.00 48 Intercorp (Central Govt.) Under Implementation
Kemeng (Aru) Hydral 1300.00 600 Intercorp (Central Govt.) Under Implementation
Kathalguri (Ass)
Gas 1347.00 291 Neepco (Central Govt.) Under Implementation
Kopili (Ass) Hydral 111.00 100 Neepco (Central Govt.) Under Implementation
Adamtilla (Ass) Gas 52.50 9 DLF Power Co. (Pvt. Ind) Under Implementation
Bashkandi (Ass)
Gas 78.75 16 DLF Power Co. (Pvt. Ind) Under Implementation
Namrup (Ass) Coal 315.00 90 Assam Valley Power Under Implementation
Amguri (Ass) Gas 1400.00 348 NTPC# (Central Govt.) Announcement (Pvt. Indian)
Karbi Langpi (Ass)
Hydral 189.60 100 ASEB+Subhash Projects Announcement
Loktak (Man) Hydral 315.00 90 NHPC! (State Govt.) Under Implementation
Tuiviai (Mtz) Hydral 735.00 210 State Govt. Proposed
Dhaleshwari (Mtz)
Hydral 420.00 120 State Govt. Proposed
Tuirial (Mtz) Hydral 250.00 60 State Govt. Proposed
Doyang (Nag) Hydral 331.59 75 Neepco (Central Govt.) Under Implementation
Agartala (Tri) Gas 294.05 84 Neepco (State Govt.) Under Implementation
• North Eastern Electric Power Corpn. Ltd. ! National Hydro-electric Power Corpn. # National Thermal Power Corpn Ltd Source : India's Energy Sector, CMIE, September 1996 : NEEEPCO

18
If things go as planned, the power situation is likely to be eased. But for the next five to ten years, power will remain a major problem in the region which no investor can ignore. As against the backdrop of current scarcity of power the Sixteenth Electric Power Survey of India (September 2000) forecasts a drop in electricity demand for almost all the individual North Eastern States in its long term projections for the year 2016-17. This startling revelution is disconcerting because it has several repercussions on the pace of new investment into fresh power projects.
Table - 4 North Eastern Region
Summary of Categorywise Forecast (Public Utilities)
in Million kwh Categories 1993-94 1994-95 1995-96 1996-97 1997-98 1998-99
---------------------------------------Actual-------------------------------------------
Estimated
Domestic 764.42 755.15 962.89 1108.37 1204.07 1338.18 Commercial & Miscellaneous 271.86 302.15 334.49 333.04 349.88 368.19 Public Lighting 42.25 52.10 51.97 58.33 49.42 55.15 Public Water Works 97.00 115.87 119.37 124.10 135.90 152.08 Irrigation 70.37 75.53 71.85 89.69 88.87 117.17 Lift Irrigation 5.27 12.61 6.18 7.16 8.05 16.50 LT Industries 487.16 564.08 499.99 532.03 586.30 620.55 ET Industries less than IMW 136.66 128.52 144.15 203.08 191.40 206.37 ET Industries 1 MW & above 286.93 261.11 316.06 301.47 305.46 333.79 Non Industrial 287.06 313.69 299.04 419.33 406.24 426.83 Total Consumption - MkWh 2448.98 2580.81 2805.99 3176.60 3326.61 3634.81 T & D Losses (%) 26.04 26.54 28.01 25.17 26.04 25.76 T & D Lossess - MkWh 862.02 932.19 1092.01 1068.40 1171.39 1261.19 Energy Requirement - MkWh 3311.00 3513.00 3898.00 4245.00 4498.00 4896.00 Load Factor (%) 56.08 58.37 66.12 72.11 62.31 57.68 Peak Load (MW) 674.00 687.00 693.00 672.00 826.00 969.00
Categories 1999-0 2000-01 2001-02 2002-03 2003-4 2004-5
--------------------------------------- Estimated -----------------------------------------------------
Domestic 1476.62 1615.18 1768.40 1935.18 2116.49 2314.48 Commercial & Miscellaneous 387.48 407.41 428.42 450.65 474.49 498.88 Public Lighting 63.14 72.03 79.53 85.72 92.03 98.80 Public Water Works 165.66 180.37 195.22 210.54 243.98 251.68 Irrigation 126.08 136.66 147.64 159.01 17078 182.94 Lift Irrigation 24.18 26.96 36.96 44.16 53.57 59.23 LT Industries 677.89 727.82 769.42 812.08 856.14 911.70 ET Industries less than IMW 255.14 284.13 313.37 342.86 372.63 402.80 ET Industries 1 MW & above 365.14 416.97 470.14 540.78 607.43 690.71 Non Industrial 501.44 549.54 598.16 642.36 687.14 732.59 Total Consumption - MkWh 4040.77 4420.07 4807.26 5223.34 5665.28 6143.81 T & D Losses (%) 25.43 25.21 24.93 24.67 24.35 24.06

19
T & D Lossess - MkWh 1378.23 1489.93 1596.74 1710.66 1823.72 1946.19 Energy Requirement - MkWh 5419.00 5910.00 6404.00 6934.00 7489.00 8090.00 Load Factor (%) 57.33 57.37 57.47 57.53 57.57 57.68 Peak Load (MW) 1079.00 1176.00 1272.00 1376.00 1485.00 1601.00
20
III
Strategy for Applying Selective Thrust in the North-East New Industrial Policy The Government of India’s New Industrial Policy for the North-Eastern Region announced in late 1996 contains many concessions to stimulate development of industry in the region. Some of the salient features of the new industrial policy are as follows : The Central Government would provide a sum of Rs 15 crore to each State for the development of a growth centre. The transport subsidy scheme would be extended to North-Eastern States for a further period of 7 years, i.e. up to 31 March 2007, being coterminous with the Tenth Five-Year Plan. Fiscal incentives have been offered for converting the growth centres and IIDCs into a total tax free zone for the next 10 years. All industrial activity in this zone would be free from income-tax and excise for a period of 10 years from the commencement of production. Exemptions are envisaged in respect of sales tax and municipal tax from the State Governments. Industries located in the growth centres would also be given capital investment subsidy at the rate of 15 per cent of their investment in plant and machinery subject to a maximum ceiling of Rs. 30 lakh. An interest subsidy of 3 per cent of the working capital loans would be provided for a period of ten years after the commencement of production. Financial assistance is also provided to horticulture, piggery, poultry, fishing and small tea garden activities. The policy guidelines do provide a host of concessionary assistance and if properly availed could lead to substantive economic advancement in the entire region. But inspite of granting various concessions growth is still tardy. This is because macro level measures need to be carefully woven with micro level planning. In some instances there is a case for raising the upward ceiling of the capital subsidy bearing in mind that more and more medium to large industrial investments

21
may be forthcoming in future and a Rs. 30 lakh subsidy limit is too short of expectations. Agribusiness Opportunities Deserve Greater Focus In spite of low population density (122 persons per thousand against the national average of 291), the North East Region imports around two million tonnes of foodgrains per year. Fortunately, the area is endowed with a climate that is conducive to diverse agricultural activity. What is required is a strong emphasis for generating cultivable surplus for the market (something quite different from generating agricultural output to meet home consumption). Some of the essential pre-requisites for this policy emphasis are : ♦ Multicropping culture should cover the whole of agriculture in the Region.
For this purpose modern farming practices involving improved irrigation, power tillers, High Yielding Variety seeds, fertilizers, are a must and farmers must be encouraged to make fruitful investments in procuring them.
♦ Extension is the most important guide to promote multicropping culture.
Farmers have to be educated and also trained in modern farming. They must be fully equipped with the most advanced package of agriculture practices. This whole process of learning requires State level co-ordination supported by specialised agencies both in the public and private sectors. The role played by the leading private sector manufacturers of fertilisers in extending modern cultivation in different states of India has indeed been quite revolutionary. But for their support modern multicropping practices could not have developed in this country. The Governments of North Eastern states should emulate the examples of other states and engage specialised agencies with a proven track record to provide training to the farmers to switch over to multicropping.
♦ The Regional agricultural universities/institutes should play the role of a
catalyst in this transformation process. Apart from extension they are expected to provide R & D support to the farmers in the changing process. Development of new agricultural products and also processes for enriching the existing range of products is a critical area which requires the State level guidance and also resource support. Perhaps some of these institutions could

22
adopt regular exchange programmes for faculty/trainers from other establishments.
♦ A fairly extensive network for preservation of agricultural produce should be
developed throughout the State not only for wastage control but also to promote market delivery. The North-East needs more cold storages in its prime agricultural areas.
♦ Apart from food and the cash crops like jute and tea emphasis should be
given on the development of pisciculture, sericulture, horticulture, animal husbandry, poultry, piggery, goatery and similar other agro-related activities having immense potential for income and employment growth. The North-East is an exciting land of bio-diversities with varying flora and fauna. Very little research has been made in this regard for developing marketable products from these precious resources. It will be a good idea to deeply evaluate agribusiness opportunities independently.
♦ Market access is a great problem for agricultural products particularly the
horticultural items. It is suggested that the existing organisation NERAMAC may be allowed to concentrate exclusively on marketing including export marketing of agri-horticultural and floricultural products. The management of processing units and procurement operations may be delegated to state agricultural/horticultural departments. It is equally necessary to revamp NERAMAC to make it emerge as the pre-eminent marketing outfit in respect of agro-horticultural products for the North-Eastern Region as a whole. NERAMAC should enter into marketing tie-ups with national level organisations like TRIFED and NAFED. The structure, staffing, role and culture of the NERAMAC should be critically reviewed so that this and similar institutions are better able to fulfill their intended role.
♦ The various Commodity Boards must have a credible presence in the North-
East. Some do have an office in Guwahati and some small representation elsewhere. But this is wholly inadequate. Each of these Boards must set up a full-fledged regional office in the North-East and well-manned field offices spread over the region. The Silk Board should pay attention to the North-Eastern sericultural varieties and also open centres in this region. Likewise the Khadi and Village Industries Commission should be encouraged to open more offices to promote village level economic activity.

23
Floricultural Products Floriculture holds promise for several areas in the North East. Floricultural products include (i) Bulbs, tubers and tuberous roots, (ii) Live plants, (iii) Cut-flowers, and (iv) Cut-foliage. They also include dried flowers and foliage propagating materials (seeds, cuttings, bulbs, etc.), tissue cultured plants and starter and adult ornamental plants, including house plants. The climatic conditions in the North-Eastern Region especially in Arunachal Pradesh and Assam are very conducive for production of a variety of orchids. Orchids grown in this region are unique. Of the 1,100 species grown in the country, 150 species are of ornamental varieties. Arunachal Pradesh alone produces 525 species which are about 47.73 per cent of the total orchids grown in India. As many as 100 species are of ornamental variety especially belonging to Aerides, Anoecto, Chilus, Ascocentrum, Calanthe, Cymbidium, Coeogyne, Denodrobium, Esmeralda, paphiopedilum, Phaius, Renathera, Rhynchostylts, Spatho-Glottis and Vanda. Some of them are epiphytic and others are terrestrial requiring different techniques to grow. A number of exotic species and hybrids belonging to the genera Asocendas, Cattleya, Cymbidium, Dendrobium, Epidendrum, Paphiopedilum, Vanda, etc. have been introduced recently in the orchid centres in the State and are propagated through tissue culture. With increasing demand in overseas markets and also within the country particularly in Delhi, Calcutta, Chennai, Mumbai and Bangalore, prospects exist for growing orchids on large scale for commercial purposes in different climatic conditions in Arunachal Pradesh. Orchid centres located at Itanager, Tipi, Sessa, Jengging, Dirang and Roing under the State Forest Research Institute have good germ-plasma collection with about 400 species and hybrids and about one lakh plants under cultivation. Although different ornamental orchids can be grown in a particular climatic condition, growing cut-flower varieties of Cattleyas, Cymbidium, Paphiopedilums and Vandaceous hybrids have also been recommended in various agro-climatic conditions of Arunachal Pradesh. Cymbidiums and paphiopedilums are especially suitable for the hilly areas of the State Forest Research Institute with a production capacity of about 20,000 cut-flowers annually. Cybidium cut-flowers fetch better price ranging from Rs 30/- to Rs. 120/- per spike with 10-15 blooms in
24
Calcutta and Delhi, while Lady Slippers (paphs) fetch Rs 1/- to Rs 2/- for each flower. Investment for growing Cymbidium and Paphiopedilum orchids is much less when compared to the cost of cultivation of epiphytic orchids like cattleyas, Dendrobiums and Vandas. Cymbidiums and Phaiopedilums require only ground nursery beds with suitable compose. The sloppy terrain of the State hills and jhum agricultural fields can advantageously be used by making terraced beds. However, suitable nylon shade nets will have to be used to check excess sunlight and for production of quality flowers. Orchid cut-flower industry is cost intensive. However, with the infrastructure already created under the Orchidology Division of the State Forest Research Institute of the Department of Environment and Forests, quality seedlings through tissue culture would be available to meet the demand to a certain extent in the western part of Arunachal Pradesh. Creation of one more biotechnology lab in the eastern part of Arunachal Pradesh would facilitate supply of quality seedlings to the farmers in that area. The state has been engaged in tissue culture by employing modern technology. The communication system in the State has been gradually improving. With the introduction of Dornier air services both at Hapoli and Tezu and access to the North Lakhimpur and Tezpur airports in Assam, transportation of orchids and cut-flowers to the metropolitan cities in the country have largely improved. Although there is ample potential for the cultivation of orchids in the North East Region as a whole and there is attractive market both within the country and abroad, the enthusiasm to further invest in the cultivation of orchids is lacking. Organisations like National Horticulture Board (NHB) and Agricultural and Processed Food Products Export Development Authority (APEDA) have to take steps to popularise the cultivation of orchids in the North-Eastern Region. The State Governments in association with NHB and APEDA have to adopt urgent measures to strengthen the development of floriculture in the region in the following areas : a) Improving the inconsistent communication network b) Educating potential buyers about the NER’s supply potential of floricultural
products especially orchids c) Improving awareness amongst the local entrepreneurs regarding the potential of
the product

25
d) Introducing adequate transportation facilities such as cold-chain in handling perishable cargo
e) Introducing regular quality control mechanisms such as hardening centres, etc and
f) Providing for adequate packaging facilities to ensure the longitivity of the product
Ginger Cultivation Ginger is cultivated as a cash crop mostly in “Jhum” (shifting cultivation)field spread over the hills and tribal areas in the North Eastern Region. Meghalaya, Arunachal Pradesh, Mizoram, Tripura and Manipur are the important ginger growing states. Production of ginger in Assam is very limited, confined largely to Halting area of North Cachar Hill District. Production of ginger in the North-Eastern States almost accounts for 37 per cent of all-India output. Meghalaya ranks first in production of ginger in the North-Eastern Region and the State ranks second next only to Kerala in the country. Ginger produced in the North-Eastern Region is of local verity and it is fibrous. Processing units are absent in the region and, therefore, ginger is marketed in fresh form. Consumption in the producing States in the region is very low necessitating sales outside the States. The absence of dynamic marketing infrastructure combined with poor transport facilities depress the prices of ginger and the farmers are not much enthused to augment production. Remunerative prices play a key role in increasing ginger output. Ginger from Meghalaya is marketed across the border in Bangladesh.

26
Statewise Production of Ginger in North-Eastern Region (1991-92 to 1994-95
Areas (A) : ‘000Hectares Production (P) : ‘000 tonnes
Yield (Y) : Kg/hectare State 1991-92 1992-93 1993-94 1994-95 Meghalaya A 6.6 6.6 6.7 6.7 P 38.5 4.8 41.8 40.0 Y 5,845.0 6145.0 6273.0 5984.0 Arunachal Pradesh A 1.0 2.4 2.5 2.6 P 4.5 14.5 16.5 16.9 Y - 6029.0 6600.0 6528.0 Mizoram A 0.7 0.8 0.9 0.9 P 5.5 6.8 7.9 8.7 Y - - - - Tirpura A 1.0 1.0 1.0 1.0 P 1.8 1.9 1.9 1.9 Y 1800.0 1900.0 1900.0 1900.0 Manipur A 0.6 0.9 0.9 0.9 P 1.1 1.4 1.4 1.4 Y 1833 1556.0 1556.0 1556.0 Nagaland A 0.2 0.2 Neg Neg P 2.8 1.0 Neg Neg Y - - - - Total of six States A 10.2 11.9 12.0 12.1 P 54.2 66.4 69.5 68.9 Y 5314.0 5580.0 5792.0 5694.0 All India Total A 59.8 59.9 60.6 162.1 P 182.7 201.6 186.2 186.1 Y 3053.0 3368.0 3074.0 2996.0 Source : Directorate of Economics & Statistics, Department of Agriculture & Cooperation, Ministry of Agriculture, Area & Production of Principal Crops in India (1993-94 to 1994-95).

27
Ginger exports of Rs 11.88 crore from the region accounted for a share of 74.2 per cent in all-India exports in 1995-96. Meghalaya and Assam are the two State exporting ginger to Bangladesh through the border routes. Since Assam is not a producer of ginger of any reckoning, it is to be presumed that the quantities exported from the State are coming from outside the region. The agro-climatic conditions in the North-Eastern Region clearly favour cultivation of ginger on a much larger scale than what is currently being done at present. Meghalaya, Arunachal Pradesh, Mizoram, Tripura, Manipur and Nagaland have ample potential to augment production of ginger not only to improve the welfare of the farmers and tribal population but also to increase exports to the neighboring countries, particularly to Bangladesh through border routes. From the long-term point of view, the Spices Board has to take initiatives in collaboration with the concerned States Governments to introduce low-fibrous “Jamaican Variety” of ginger in the North-Eastern States. This variety will be useful in making value-added products such as dried ginger, ginger paste, etc. This step of bringing about varietal change in the production of ginger would provide opportunities for tapping export markets in the Middle-East countries as well. The State Governments in the North-Eastern Region have to encourage private enterprise to come forward to set up units for processing ginger by offering attractive incentives. The State Governments should also encourage private enterprise to set up warehouses for storage of ginger. Post-harvest management functions such as storage, transportation and marketing need to be given utmost importance to sustain farmers’ interests in production. Application of post-harvest technologies would help to arrest the decline in prices arising out of larger output at the farms at the time of harvest. NERAMAC should play a leading role initially in assisting the growers by purchasing ginger from cultivators through a support price mechanism for marketing both within the country and abroad. Farmers’ interests are protected by offering remunerative prices so as to ensure their continued interest in the cultivation of ginger. NERAMAC’s role as a dynamic and vibrant marketing organisation is essential to harness the production and export market potential of various agricultural, horticultural, floricultural and forest-based items in the Region.
28
Organically Grown Tea North-Eastern Region has ample potential to produce organically grown tea to supply to a number of developed country markets. Organically grown tea is gaining importance for the health conscious consumers in developed-country markets. Efforts are currently being made by some of the enterprising companies in the North-Eastern Region to produce organically grown teas. For instance the United Neelgiri Tea Estates Co. Ltd since 1994-95 has been procuring organically grown tea from its tea gardens in the Kora Kundha estates. The company is planning to export organically grown tea. Production of bio-tea is also undertaken in the sabroom area (Tripura) in the two tea gardens of a private enterprise with necessary financial support from ERAMIC, a German organisation. The North-Eastern Region particularly Assam and to some extent Tripura have the potential to develop organically grown tea. Keeping in view the rising demand for organically grown teas in global markets, the enterprising companies in the North-Eastern Region may adopt the practices required to develop organically grown tea. International Certification is required in approving the exports of such specialty teas. The Institute for Marketology, Switzerland, as Associate Member of the International Federation for Organic Agriculture Movements (IFOAM) gives a certificate for the organically grown tea which would include certification for the cultivation practices adopted by a tea estate. The IFOAM’S certification will be conforming to the EU regulations and is also accepted by Japan and USA. Tung Oil Tung oil is a pale yellow pungent and quick drying oil. It dries much faster than the linseed oil. On heating, tung oil polymerises to a hard gel. Tung oil is extensively used for the manufacture of paint enamels, lacquers, electrical insulting wires and also in the brake-linings in the automobile industry. In Mizoram, cultivation of tung oil under New Land Use Policy has been taken up since 1991. Many rural families have opted for tung cultivation in the State. Opportunities for the utilisation of tung oil within the North-Eastern Region are very limited, as the markets are mainly located in Delhi, Calcutta and Mumbai. In order to encourage there is a case where adequate marketing support from NERAMAC or any other national level marketing organisation is very necessary.

29
Cane and Bamboo Products North-Eastern Region produces large quantity of bamboo. Cane and bamboo products form an integral part of the life and culture of the people in the region. Each State in the Region has uniqueness which gets reflected in the articles produced from cane and bamboo. So far the State Governments are actively supporting the production and marketing of handicrafts by the people. In Assam, a joint venture project has come up for the manufacture of bamboo based value-added products such as chopsticks, skewers, tooth picks and bamboo tiles with 100 per cent buy-back arrangements. There is good demand for floor tiles made of bamboo in the western markets while chopsticks and skewers are in good demand in the Far East and South-East Asian markets. Small-scale producers of cane and bamboo products face a number of problems. Inadequate market information is a serious lacuna. There is also lack of commercialization and export orientation. There is need to inculcate the quality and product development aspects in artisans with a view to meeting the demand in overseas markets. Steps have to be taken to ensure uniformity and excellent finishing. At present there are largely indirect exports of cane and bamboo produced from the Region which are estimated at around Rs 3-4 crores. But innovative value addition can bring about greater revenues. Rubber and Rubber Products Rubber cultivation in the North-Eastern Region is of great significance. North-Eastern Region has an area of 36,080 hectares under rubber cultivation producing 2,067 tonnes. Tripura is the major producer of rubber accounting for over 80 per cent of production. The Rubber Board has planned to increase the rubber area of plantation in Tripura State to 35,000 hectares and production to 20,000 metric tonnes by the turn of the century. North-Eastern Region is ideally suited for producing rubber from the point of view of agro-climatic suitability and the availability of labour at reasonable wages. There are no exports of rubber and rubber products from the North-Easter Region. Mushroom Cultivation
All over the West there is a resurgence of vegetarian foods. For a variety of reasons mushrooms are considered to be one of the attractive foods in modern times.

30
Although mushrooms can be cultivated artificially, it is best to cultivate them in natural conditions. Japanese mushroom cultivators are conducting much of their business in Europe. Presently, not all kinds of mushroom are cultivated in India. The mushroom cultivation technology in Japan is very specialised and many Japanese enterprises are transporting this technology to other countries. They are working in China, South and North America, Europe and South-east Asia, but not yet India. There is case for the establishment in the region of a global mushroom research institute. An institute of this nature, will act as a catalyst to boost mushroom farming in the North East Region.
Assistance from APEDA
The North-east has varied agro-climatic conditions that range from temperate to tropical, coupled with abundant rainfall. APEDA, which stands for Agricultural Process Food Product Export Development Authority, has a mandate to promote agro exports from India and they are giving special attention to the North-east in lieu of the guidelines provided by the Government of India. Presently, APEDA is required to spend 10 per cent of the budget allocation on the North-east. To begin with, it set up a regional office in Guwahati in 1997 and coordinating offices in Manipur, Tripura, Nagaland subsequently.
APEDA has commissioned a study to access the export potentiality of horticulture and floriculture in the North-east region, to identify the products and infrastructure needs for export trade, the feasibility of setting up food processing units, and to estimate the investment required in the region. It has asked North-east Consultancy to carry out the study, and highlighted some of the problems like nomadic technology transfer resulting in low-quality, low-volume food yields, the high rate of infrastructure and transport facilities from the markets to the main centres, and growth of capital accumulation.
They have identified NERMAC, the Central Government cooperation operating in North-eastern India, as the nodal agency to procure the supply of packing materials. They have asked Central Food Technology Research Institute to conduct a study on the prevention of moisture loss during transportation of food. They also have plans to set up a floriculture plant in Guwahati. One of the major problems in this region is pre- and post-harvest mango and pineapple foods. In Tripura, APEDA is establishing a modern organic farm.

31
Sericulture offers new opportunities
Silk has been considered the queen of textiles and has been associated with high fashion. Surprisingly, this is one sector, where demand in India outstrips supply. India roughly produces 15,000 metric tons of silk, and a further 7,000 metric tons of silk is imported to meet the domestic demand. So, this sector offers tremendous possibilities. Even in the export segment, growth in the last three years has been more than 27 per cent, from Rs 500 crore in '98-'99 to Rs 1,500 crore last year, and likely to touch Rs 1,800 crore this year. Sericulture and silk are highly eco-friendly, and there is no wastage of any particular by-product. For those who look for social commitment, over 6 million people are employed in this sector and more than 60 per cent of them are women. It offers a high flexibility of investment opportunities. Yet, sericulture in North East is not as organised as in the South India, which is why it is still considered an untapped opportunity.
There are a lot of organisations to provide support, technologies that can be transferred, possibilities of high skilled labour training opportunities, and agencies to provide export market information, making the sector highly viable.
Another related area is equipment manufacturing. In places like Surat or Ahmedabad or Baroda, one finds a lot of textile machineries that are being manufactured there for the textile sector. The Central Silk Board has introduced a couple of machines in the North-east which have proved very popular with heavy demand. These machines are not very hi-tech, and may be developed by entrepreneurs in the North East immediately.
Inland Water Transport - Upcoming Opportunity Inland Water Transport (IWT) was an important and popular mode of transportation of passenger as well as cargo traffic in the North-Eastern Region prior to the partition of India. About 80 per cent of the traffic in tea and 90 per cent of the traffic in jute goods apart from large quantities of fuel oil were reportedly ferried by IWT, primarily between Calcutta and Assam. Prior to Independence, the rivers of the North-East and their tributaries also served as trade routes to neighboring Myanmar. After the Partition, the IWT system got disrupted. But now there is an increasing realisation that IWT can be viable. The IWT is the ideal mode of transportation in the North-Eastern States as it offers many advantages in terms of fuel efficiency, employment generation, and pollution

32
free environment. In addition, the IWT system is most economical for transporting general cargo to various destinations where such facilities are available. IWT is also considered very useful to transport Over Dimensional Cargo (ODC), especially required by industrial plants. An IIFT Study noted that the Union Government was considering to increase the freight subsidy for inland waterways transport to 22 paise per tonne. This step would help considerably to stimulate the interest of private investors. Recognising the need for developing inland waterways as an alternative and effective transportation of goods to and from the North-Eastern Region, IIFT Study places renewed emphasis on the plea for private sector participation in taking over waterways stretches or terminals or contract of handling equipment on BOT basis, which would have to be transferred back to the Government after 25 years. In order to attract private investments, it is also suggested that the private operators may be permitted to charge toll fee to recover their investments under the new policy. The union Government may consider extension of shipbuilding subsidy to inland waterways transport. In order to give a boost to the utilisation of inland waterways until they become very popular, various user Ministries such as Coal, Petroleum, Oil should give some preferential treatment to cargo movement by waterways. The Ministries should ensure that at least 5 per cent of the cargo is reserved on those routes where inland waterways are available. Inland Container Depot The barriers of distance and time have acted as an impediment to the free flow of trade, particularly with our neighbouring countries. The trade conducted at the Land Custom’s stations is mainly restricted for consumption within the area and does not form any meaningful quantity in the rest of the region. The active Land Custom’s stations of Dawki in Megalaya, Sutarkandi in Assam, Agartala and Shrimantipur in Tripura, trade with Bangladesh. Our window to Burma is restricted to Moreh in Manipur, while Bhutan is connected to Assam through Darranga. It is in this context that the Inland Container Depot (ICD) at Amingaon, Guwahati play a very vital role. It is the only ICD in the region and handles exports and

33
imports in ISO containers. This provides an opportunity for businesses in the region to export their cargo to distant countries of the world, which is not part of the North East’s immediate neighbourhood. Till such time as efficient and realistic container movement by river through Bangladesh can take place from the Northeastern States, the ICD at Guwahati can play an important role in fostering trade. The recent press announcements regarding the proposal to declare the entire North East as a “Free Trade Zone”, should enhance the importance of ICD Amingaon to the North East. The major commodity handled at the Amingaon ICD is tea and this is likely to remain so in the foreseeable future until such time as other exportable or importable commodities are available. Unlike Delhi and Bangalore where there is a two-way traffic of both import and export cargo, Amingaon is unique in the sense that there is only seasonal export cargo available in the form of tea. Recently there have been some imports by tea companies of multiwall paper sacks directly at ICD Amingaon. However, this major imbalance in positioning of empty containers for export, owing to a lack of import cargo, needs to be addressed urgently as it increases the cost of exports from the region. Travel and Tourism have Potential The entire North-Eastern Region has tremendous potential in the service sector as tourism can act as a catalytic agent in transforming the region into an economic power. North-Eastern Region has great potential for enhancement of travel and tourism, especially in the three distinct segments, namely (1) adventure sports, (2) pilgrimage, (3) eco-tourism. Adventure sports comprising mountaineering, hang-gliding, water sports can attract a lot of tourists particularly from overseas. Pilgrimage tourism has enormous potential to attract people from South-East Asia and amongst the age group of 50 years and above. The Twang monastery in Arunachal, the Kamakhya temple near Agartala are destinations where more facilities have to be created. The entire North-Eastern Region is ideally suited for eco-tourism. Simple facilities exist in most areas and there are some remarkable wildlife locations such as the Namdpha sanctuary in Arunachal Pradesh and Kaziranga National Park in Assam. What is required is a strong awareness programme coupled with dedicated private

34
investment. A case in point is Sikkim - in a matter of few years a carefully packaged state tourism policy has made this region a preferred destination of many Indian and overseas tourists. Indeed tourism is thriving in Sikkim, but elsewhere the business opportunities are yet to be exploited. In Sikkim bulk of the tourism activities are directly handled by private agencies and entrepreneurs. The State Government merely acts as a facilitator. Assam is the gateway to the North East. Its lush green forest are home to over 400 species of rare animals including the one-horned rhino; the hillsides are dotted with over 1000 Tea gardens; and finally there is the Brahmaputra - one of the four largest rivers of the world. Guwahati is connected with the most important cities of the country and as well as all the North Eastern State capitals. There is an immense potentiality for opening up the North East to tourism from South East Asia. The flying distance to Bangkok is just two hours and once Guwahati is converted into an international airport for all practical purposes the gates will be wide open for the entire South East Asia. Much of the North East and Assam in particular is dotted with rolling Tea Gardens, some of which have their own private air strips and golf course. Tourists from South East Asia could visit some of the tea gardens and experience a rare element of socio cultural life that offers unique instances of colonial luxury. Their visits can be made more interesting by undertaking select river cruises on the Brahmaputra. The NEDFi has recently shown a special interest by inviting proposal for investment in tea tourism and river tourism in the Brahmaputra region. In this region, tourism has been declared as an industry and special incentives such as capital subsidy, sales tax and income tax benefits are already in place. An exclusive tourism policy is under preparation. Health Care This an area where the present handicaps can be converted into investment opportunities. The subject of health care can be dealt with at various levels. Primary health care, which is of immense public concern, requires large investments and is best left to the State. However, the creation of composite medical centres adequately equipped to deal with various medical exigencies requires private participation. That this can be profitable and emotionally satisfying is amply demonstrated by some of the successful case studies as is demonstrated by the striking example of the growth of the Guwahati Neurological Research Centre Ltd
35
(GNRC). Infact health care ought to be given industry status and the private sector encouraged to establish satellite facilities all over the region. Oil Sector When talking of natural resources, the first item that comes to mind is the oil well reserves. Oil wells were introduced in Assam way back in 1889 and there is a lot of scope for taking up new exploration in this region as per the new exploration policy of the Government of India which allows all private domestic and international companies to enter this field, apart from Indian Oil and ONGC. The existing oil sector can be further stimulated to create new opportunities in Natural Gas resources located in the North East. Natural Gas once tapped can act as a catalyst for several chemical and engineering industries and carefully structured investments can lead to several forward linkages in medium to large industry. Scope for Knowledge-Based Industries A recent World Development Report highlights the importance of knowledge in the progress of a nation's economy. We are today in an era of knowledge-based competition and the progress of an economy will depend on how best we can encourage our intellectual capital. Elsewhere it has been observed in this report that one of the greatest assets of the region is a large educational infrastructure both for lower as well as for higher education. The region has one Indian Institute of Technology (IIT) and a number of other technical institutions. As such there is a critical mass of English speaking, technically qualified selective pool of youthful manpower which could be effectively harnessed to either promote or participate in knowledge-based industries like software development, Consultancy, pharmaceuticals, financial services, engineering services, biotechnology etc. KBCs are usually export intensive and have customers across the globe. They need a high degree of flexibility to effectively manage global operations. There is already an information technology revolution blowing through the entire country. So far this movement has made little impact on the economic welfare of the North-Eastern Region. Given the fact that a substantial number of technically qualified people from the North East regularly migrate to other parts of India and overseas for career opportunities in IT. It is high time that an unified effort is made by North Eastern States to incorporate a special task force to usher in greater IT oriented services in the region.

36
According to the 54th national sample survey, literacy in Assam has increased to almost 80 per cent in December 1999, against the all India average of 60 per cent. There is a good possibility of the knowledge industry gaining a special footing in the region, particularly Assam. An Information Technology park has already been established by the North Eastern Financial Corporation Ltd and a Software Technology Park has also been set up by STPI in Guwahati. Two medical transcription centres have already come up and a few call centres with overseas tie-ups are about to get established. A beginning for e-commerce is about to be made through the launch of internet connectivity. Venture Capital Financing The risk and asset profile of most KBCs pose a natural barrier to traditional financing options. KBCs rely heavily on knowledge workers and their asset base in much lower than conventional manufacturing concerns. Banks and financial institutions are quite averse to funding start-ups and small companies in knowledge-intensive industries. Moreover, floating equity issues are not feasible for start-ups due to the requirements of a three year track record and a threshold level of Rs 3 crores and Rs 10 crores for regional and national stock exchanges respectively. All this points to the criticality of venture capital financing for KBCs in the North East. A key factor for the success of Silicon Valley firms in the US has been the active collaboration among academia , venture capitalists and industry. There are three things that a venture capitalist brings to a start -up :
1. The accumulated knowledge and experience that could be used to give upcoming entrepreneurs an independent assessment of the worth of their ideas.
2. The collaborative benefits of being a part of a big network
3. The ability to bring in money quickly without excessive paperwork At present the availability of suitable VC funding for the North East is very limited. The existing venture agencies like NEDFi, AIIDC, SIDBI are more focused on financing the "brick-and-mortar" ventures and are not really equipped to fund KBCs. For this a dedicated VC agency like the ICICI backed TDICI of Bangalore is desirable. Telecommunications

37
It is a truism to say that telecommunications more than any other factor has lead to creation of a global village. Telecommunications enables instant communication across thousands of miles. Free flow of information, access to e-commerce, instant integration of people into world communities has lead to enormous economic benefits. A dependable telecom network is the backbone of every developed country. KBCs more than any other companies depend heavily on telecommunications for their work. Access to good telecommunications infrastructure is specially critical when companies have clients across the globe. Moreover, internationally competitive telecom infrastructure would enhance the Region's attractiveness as a base for a variety of IT enabled services seeking low-cost locations for their customer support units and back-office operations. A recent Mckinsey & Co research study advocates that IT - enabled services are expected to grow 15 times by year 2008, providing vast opportunities for Indian players. These opportunities are anticipated to be in the areas of :
– Call Centres – Medical Transcription – Back Office Operations, Revenue accounting and other ancillary
operations – Insurance claims processing – Legal databases – Content Development/Animation – Payroll management – Logistics Management
Integrating with World Economy Many elements are building a new global economy, among these is information technology. Modern advancement in IT, transportation and communications are taking us to a post-industrial age with profound implications for societies and economies. In this new era, brain matters more than brawn, how much you know matters more than how much you can lift, innovation matters more than mass production. These technological advancements have led to a new trend in the world. This is the beginning of the global economy that is worthy of the name, more in which goods, capital and information flow freely into the globe to where they will be most effective in spurring economic growth. The difficulties of doing this were

38
pointed up in a recent WTO meeting. But the events of the past three years have shown that there can be no alternatives of the benefits of global integration. Discussion of international integration used to be the preserve of industrial countries. With the balance and power now shifting with nearly all the growth in the world’s labour from developing countries, it will be especially important to make these nations a part of all discussions. This has been reflected in the financial sphere with the creation of the so-called G20 in which India has played such an important role. For the North East, integrating with the world economy through trade and innovative systems is likely to throw open a vast array of opportunities. Border Trade - Requires liberalisation Border trade has great significance for the people living in the North Eastern Region. Their importance is largely from the point of view of business opportunities. For those living in the border areas, movement to and fro to the neighboring areas for purchase and sale of essential commodities is very common. The economic development of the Region including employment and income generation and avenues for business and investment, is interlinked with market opportunities available in the neighbouring countries. Border trade, thus, assumes an important place in the life of the people of the North-Eastern States.
There are two important reasons why we need to look at the region across our international borders. First, the enormity of international borders – the total length of the international border in this region is 5,132 km which is 98 per cent of the total length of this region. The other is the significant change in the economic policy that has come up in recent years. Let us estimate the market potentialities first. RBI studies show the total amount of goods exported and imported in this region is around Rs 440 crore. Government of India have done a study of their own which shows the total exports and imports from this region to the neighbouring countries is only around Rs 170 crore. There are three specific types of goods which are exported and imported through this region. One is goods produced in this region and exported across the border, the second is goods produced in this region and exported from outside the region, and the third is goods produced in the rest of the country but passing through this region’s international borders. This third category is the most important at the moment. The significant thing to note is that there is no data estimation of formal and informal trade. Informal trade is likely to be much more than formal trade.

39
There is a regime of trade agreements with our neighbouring countries, signed with Bangladesh in 1972, with Myanmar in 1970, with China in 1984, besides free trade with Bhutan. The total imports in these four countries is around Rs 6,000 crore but we export goods worth only Rs. 170 crore. To correct this situation, the first thing that comes to mind is the land custom stations and notified border stations. The Shukla Commission has made mention of the Old Burma road which was in use during the second world war. The other route is the transition railway, which has been in the pipeline a for number of years. The third is the Brahmaputra river.
As far as the Old Burma road is concerned, the problem is not with Government of India. On the Myanmar side, for about a 300-km stretch there is practically no road. If we need linkages with China, we need to develop this road. There has to be some sort of co-ordination and some initiative needs to be taken by our trade partners across the border. As for the transition railway, this is an ambitious project and it is difficult to comment on the time frame it will take. What can be observed is that the North-east is a part of the map of the transition railway and as and when this materialises, we will pay for the ground in two parts in the North-east. The inland waterway of Brahmaputra river has two additional points of call which have been notified and which will be important for trade with India.
The Prime Minister announced a programme for the specific development of four border towns in the North-east which is difficult because, at the moment, 14 border towns are functional of which we have chosen only four. These are Nori in Manipur, Terakhandi in Assam, Dawki in Meghalaya, and Chankai in Mizoram. Financial problems specific to these projects are being drawn up and financial projects are being tied up in this regard. Of special mention are the possibilities of reviewing a trade route through Gangadevi in Mizoram and Chaurhka, again in Mizoram. Gangadevi is a border point on the international border of Mizoram with Bangladesh , and at the moment it is used to export a lot of ginger and forest produce. This project has been sanctioned. Efforts are on to start trade through Jakota which is on the international border of Mizoram with Myanmar. The other route which is being looked back is Caladine river in Mizoram, which passes through Mizoram and goes to Myanmar. RITES has already conducted a technical feasibility study of this particular route and Government is looking at the possibility of revival of this route, if there is inland water ways agreement with Myanmar for both Gangadevi on Bangladesh and Mizoram border the Caladine river route on the Mizoram-Myanmar border. Agreements with Myanmar and Bangladesh will be required and that is where, perhaps, the need of the ministries of surface transport and inland waterways authority comes in.

40
For industrial activity in the North-east region and for export and border trade activities, a specific fund has been created with a small corpus of Rs 5 crore. This fund has already been placed in position and state governments have been advised to prepare project proposals.
An important development last year is microwave linkages across the border. Representatives of trade and industry had been asking for telecommunication facilities, especially for the border towns. This has begun in the form of establishing a digital microwave linkage with Agartala and there is a point across the border called Dramanbaria in Bangladesh. It is expected that this experiment will be repeated in several border towns in the region.
Although North-Eastern States share the international border with Bangladesh, Myanmar, China and Bhutan, two countries, viz. Myanmar and Bangladesh are of great importance currently as they account for the major share of the border trade of the North-Eastern States. Government of India has entered into border trade agreement with Myanmar. The Agreement came into effect on 12 April 1995 when Indo-Myanmar border was officially declared open for trade at Moreh in Manipur. India has no formal agreement with Bangladesh on the opening up of border trade at present. But considerable trade is taking place through the border states of Meghalaya, Assam and Tripura and Bangladesh through authorised customs check posts and informally. Indo-Myanmar Trade Official trade data of Indo-Myanmar trade as reported by the DGCI &S, Calcutta, do not cover record of informal trade that takes place between India and Myanmar. India’s trade with Myanmar has been increasing over the years. India’s major items of exports include spices, drugs and pharmaceuticals, agro-chemicals, rubber manufactures, iron and steel bars and rods, primary and semi-finished iron & steel items and miscellaneous processed items. India’s major items from Myanmar include pulses, wood and wood products. India-Myanmar trade takes place largely on an informal basis through the border area through Moreh (Manipur) and Champhai (Mizoram). A study conducted by the IIFT in 1995, on “Promotion of Border Trade between India and Myanmar” estimated the value of informal trade through borders between the two countries at around Rs 2,000 crore per annum. A variety of high value items including precious and semi-precious stones and sophisticated electronic goods feature in such

41
informal trade. The commodity composition of the informal trade between the two countries is of the following order. Through the Moreh Border (Manipur) Items imported into NEI from Myanmar : Electronic goods, synthetic blankets, man-made fabrics, car batteries, emergency lamps, locks and padlocks, precious and semi-precious stones, walking shoes, soaps and toiletries, silk yarn and coves. Items exported from NEI to Myanmar : Automobile parts, drugs and pharmaceuticals, cycle parts, chemicals (bleaching powder, ammonium chloride) urea, cotton yarn and handloom lunges and stainless steel utensils. Through Champhai Border (Mizoram) From Myanmar to India, drugs and pharmaceuticals, synthetic fabrics, synthetic blankets, torches and batteries, electronic goods (TV sets, air-conditioners, VCRs) hardware items, high frequency radio sets, beverages, semi-precious and precious stones and metal scrap. From India to Myanmar, Nescafe (instant coffee), tea, Maltova, Horlicks, baby foods, wheat flour, medicines, bicycles, cotton yarn (in bales), cotton made ups, sanitary fittings, and stainless steel articles. Estimates indicate that Moreh border accounts for the bulk of the border trade, with a total trade estimated between Rs. 1,300 and 1,400 crore per annum. The main reason for this large business turnover is that Moreh and its counterpart Tamu in Myanmar are the only reasonably developed townships in the border area with requisite infrastructure like proper road linkages, distribution points, transportation systems, and banking facilities. The value of border trade through Champhai border in Mizoram is estimated at around Rs 500 crore while informal trade through Lungwa (Nagaland) border is estimated at around Rs 100 crore. The Current Border Trade Agreement in regard to exchange of commodities between the two sides, is envisaged to strengthen the economies of the North-Eastern States and lead to further avenues of mutual cooperation, including joint ventures and production cooperation arrangements.

42
Twenty-two commodities feature in the exchange of goods by residents living on either side of Indo-Myanmar border. These include the following :
1 Mustard and rapeseed 2 Pulses and beans 3 Fresh vegetables 4 Fruit 5 Garlic 6 Onion 7 Chillies 8 Spices (excl. Nutmeg, mace, cloves and cassia) 9 Bamboo 10 Minor forest products excl. Teak 11 Betelnuts and leaves 12 Food items for local consumption 13 Tobacco 14 Tomato 15 Reed Broom 16 Sesame Seed 17 Resin 18 Coriander Seeds 19 Soyabean 20 Roasted sunflower seeds 21 Katha 22 Ginger 23 Any other commodity/commodities as may be mutually agreed upon
between the two sides Enhancing Indo-Myanmar Border Trade Expanding the list of exchangeable goods is necessary to promote border trade. Following list of items may have to be added to promote further border trade : From Myanmar
43
Cardamom (small); poppy seed; paraffin wax; peanuts; coconut oil; groundnut seeds and oil; stationery and toilet soaps; blankets and dress material; bamboo based household goods; silk yarn and cocoons; imitation jewelry; nutmeg and cinnamon; plastic materials/granules; soyabean & nuggets; and animal hides and skins. From North East India Motor cycles, mopeds and motor parts; electrical goods; tyres and tubes; milk power and condensed milk; cosmetics; crockery; cycle and cycle parts; cement; washing power; cotton yarn; scraps and wastes of all items; and electrical goods. Libralisation of Bilatral Trade In order to promote bilateral trade between India and Myanmar, liberal policies are necessary. Relaxation is necessary in relation to norms regarding minimum raw material/labour content and value additions for imported items and duty-free entry of goods without quantitative restrictions. Review of Export First-Import Later Policy The policy of export first and import later is creating avoidable hardship to the Indian exporters, and the Government may have to review this policy and adopt lenient norms mainly to give a push to border trade. Strengthening of Infrastructural Facilities It is necessary to provide certain minimal infrastructural facilities including uninterrupted power supply, approach roads, proper sanitation, hospitals and schools and shopping centres in the selected centres. At the border check posts, suitable warehousing facilities, weigh bridges for cargo, efficient telephone and fax facilities need to be provided. In the case of Chemphai in Mizoram, it is necessary to ensure excellent road conditions in the Champhai-Rhi Sector. Establishment of Joint Ventures Joint ventures with buy-back deals in the border areas should open up new avenues for exchange of goods and services between the two countries. Joint venture projects which can be considered include oil seed processing, gem cutting and
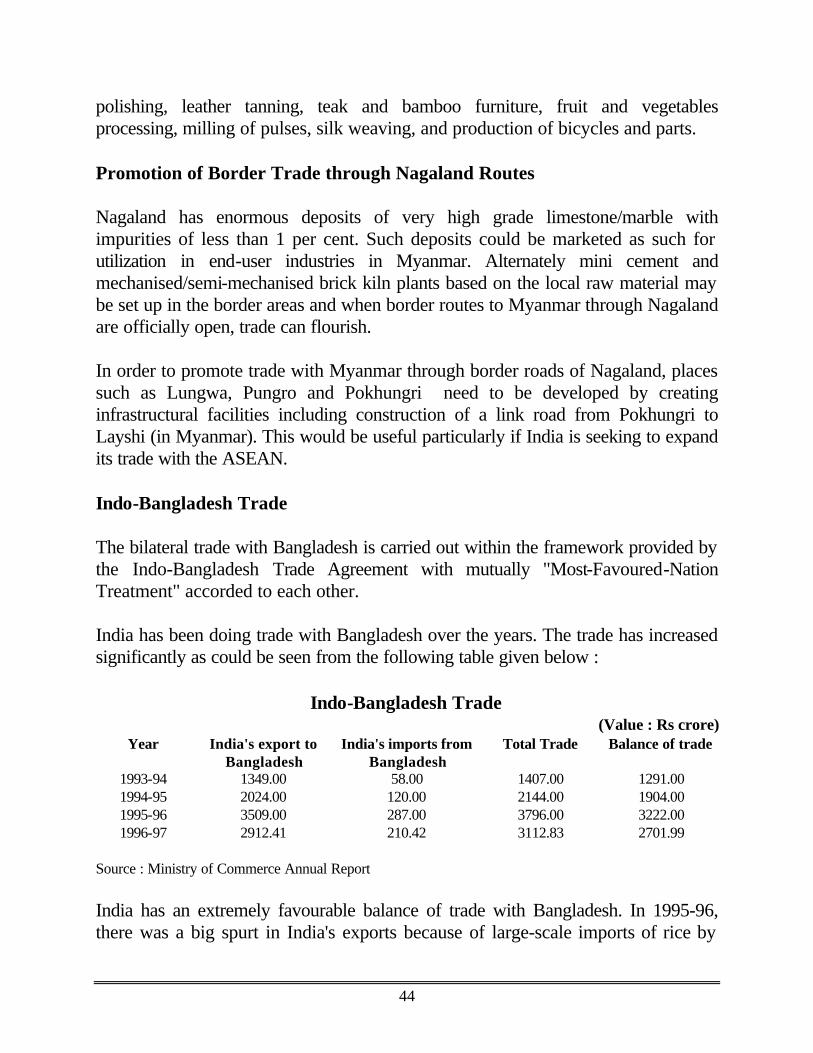
44
polishing, leather tanning, teak and bamboo furniture, fruit and vegetables processing, milling of pulses, silk weaving, and production of bicycles and parts. Promotion of Border Trade through Nagaland Routes Nagaland has enormous deposits of very high grade limestone/marble with impurities of less than 1 per cent. Such deposits could be marketed as such for utilization in end-user industries in Myanmar. Alternately mini cement and mechanised/semi-mechanised brick kiln plants based on the local raw material may be set up in the border areas and when border routes to Myanmar through Nagaland are officially open, trade can flourish. In order to promote trade with Myanmar through border roads of Nagaland, places such as Lungwa, Pungro and Pokhungri need to be developed by creating infrastructural facilities including construction of a link road from Pokhungri to Layshi (in Myanmar). This would be useful particularly if India is seeking to expand its trade with the ASEAN. Indo-Bangladesh Trade The bilateral trade with Bangladesh is carried out within the framework provided by the Indo-Bangladesh Trade Agreement with mutually "Most-Favoured-Nation Treatment" accorded to each other. India has been doing trade with Bangladesh over the years. The trade has increased significantly as could be seen from the following table given below :
Indo-Bangladesh Trade
(Value : Rs crore) Year India's export to
Bangladesh India's imports from
Bangladesh Total Trade Balance of trade
1993-94 1349.00 58.00 1407.00 1291.00 1994-95 2024.00 120.00 2144.00 1904.00 1995-96 3509.00 287.00 3796.00 3222.00 1996-97 2912.41 210.42 3112.83 2701.99
Source : Ministry of Commerce Annual Report India has an extremely favourable balance of trade with Bangladesh. In 1995-96, there was a big spurt in India's exports because of large-scale imports of rice by

45
Bangladesh due to crop failure. India's major items of exports to Bangladesh include textiles, machinery and instruments, transport equipment, rubber products, chemicals and pharmaceuticals and minerals and ores. Major items of import from Bangladesh include fertilisers, raw jute, and organic chemicals. India and Bangladesh have singed a Border Trade Agreement in 1972. But this Agreement remained in abeyance due to lack of interest from Bangladesh in its implementation or renewal. The border Trade Agreement as originally envisaged sought to regulate the border trade between the two countries essentially to meet the day-to-day requirements of the people living within 16 km belt of the border between West Bengal, Assam, Mizoram on the one side and Bangladesh on the other. There has been some debate on the utility of having formal border trade agreement with Bangladesh in view of the adoption of a free market economy by both the countries. Both the countries are moving towards the concept of South Asian Free Trade Arrangement (SAFTA). Presently few items are being imported by India through the Bangladesh borders, barring hilsa fish and occasionally jamdhani sarees. Currently some items are moving through the border to Bangladesh particularly from Meghalaya, Assam and Tripura. Following table shows the value of different commodities exported to Bangladesh from the border by the concerned States.
Statewise Exports Through North-Eastern Borders to Bangladesh
(Value : Rs. Lakh) Item Meghalaya Assam Tripura 1996-97 1995-96 1996-97 1995-96 1996-97 1995-96 Onion 6.98 3.09 42.08 6.07 -- -- Citrus fruit 1.94 4.23 20.52 18.57 -- -- Ginger 16.04 5.88 3.39 6.00 -- -- Rice -- 785.73 435.99 4728.85 1.82 6.48 Coal 6400.04 4794.57 418.72 2847.42 -- -- Limestone 583.57 392.18 -- -- -- -- Oranges 20.27 90.86 85.63 131.30 -- -- Grapes -- -- 1.95 3.92 0.75 0.63 Dry chilly -- -- 14.70 2.57 -- 8.67 Garlic -- 37.40 2.42 4.13 -- 0.09 Paper 0.32 4.53 0.38 -- -- 2.09 Stone Boulder 30.23 11037.23 29.31 -- -- -- Apples -- 1.71 0.36 1.27 1.99 0.18 Total (Statewise)
7059.39 18435.25 2390.25 200.61 18.15 4.56
Source : Office of the Commissioner of Customs, Shillong (Meghalaya)

46
Exports to Bangladesh particularly from Meghalaya and Assam constitute, on a cumulative basis, 99 per cent of the total exports through the customs check points in the border areas. Coal and limestone are the major items supplied through the border posts. Some quantity of fruit, vegetables and spices are also moving through the borders. Stone boulders are also sent through the border from Meghalaya. The principal customs check posts or authorised stations through which there is a smooth flow of border trade with Bangladesh are as follows :
State Authorised routes (Customs)
Meghalaya Dwaki, Bholaganj, Shella Bazar, Balat, Borsora, Mahendraganj, Dalu Assam Dhubri, Sutarkhandi, Gokalganj, Mankacher Tripura Akhaura, Srimanthapur, Rajna
Imports from Bangladesh through the authorised routes are reported to be practically nil, with very small quantities of hilsa fish, coming through the borders at Akhaura (Tripura) and Sutarkhandi (Assam) during the season (July-September). Some amounts of hilsa and items like jamdhani sarees also come through unofficial channels, although precise details are not available. Number of goods move through the border illegally (unauthorized trade : Indo-Bangladesh) from Bangladesh. Estimate of illegal trade is around Rs 600 crore. List of items exported from India through unprotected borders include :
a) Cycle and cycle parts, b) Automobile parts, c) Printed textiles, d) Medicines (Phencidil), e) Plastic goods, f) Chemicals, g) Salt, h) Sugar, i) Kerosene, j) Cereals and pulses, k) Wood and bamboo, l) Rubber and rubber products, m) Fruit and vegetable, etc

47
The narrow range of products in authorised trade closure of local markets (Haats) in the border areas, deficiencies in infrastructure are causing serious problems in promoting border trade. Removal of the problems cited earlier and strengthening of the infrastructure will increase the trade between the border states and Bangladesh. On the Indian border, cement plants could be set up based on the locally available limestone mainly for supplying to Bangladesh. There are also opportunities for setting up joint venture units for processing fruit and ginger and also to produce rubber goods, knitted and embroidered articles, cane and bamboo items, herbal cosmetics and toiletries and processing of minerals. From Bangladesh, India can import fish (fresh and dry), poultry products, betel levels/nuts, milk and milk products, vegetables, jute and meats, spices and handloom sarees (Jamdhani).

48
IV
Creating Corporate Success - Findings and Observations The economic resurgence sweeping through large parts of India seems to have little impact in the North East. Out of 8000 Public Limited Companies featuring in a database maintained by the CMIE less than 200 companies from the North East find inclusion in this valuable index. Even out of these 200 companies almost 80 percent of them are located in the Brahmaputra valley. Today, several businesses in the North East revolve around the production of tea, petroleum, food products, wood based products, sugar, cement, jute, paper, fertilisers and spinning only. Lack of skilled manpower, weak institutional finance, low domestic/regional demand, mixed levels of infrastructure, inferior agriculture practices, depressed law and order situation all seem to way heavily on creating a robust climate for investment. Only direct private investments in the region can help to create long term economic sustenance as is demonstrated by a few of the successful case studies which are annexed. Higher levels of private investment are essential to generate greater capital formation, improve productivity, upgrade technology and create an industrious work culture. Today the levels of low infrastructure, geo-political isolation, isolated markets can actually be converted to economic advantage. With the increasing privatisation of telecom, power, road building the yawning infrastructural gap actually presents distinct economic opportunities for large scale entry of private players in the region. The bulk of the capital that will be required to improve supply responses in the region will ultimately have to emerge from private rather than government sources, Hence there is a strong case for attracting private capital. Indeed the entire focus of creating corporate successes in the North East evolves around delegating a "most favoured" status to the private sector. Any talk of according greater status to the private sector throws up the standard question whether industry is actually keen to invest in the region. The answer is two fold : 1) Recent initiatives taken by the Bengal Chamber of Commerce and Industry
and FICCI go to prove that the private sector has a definite interest in the region. The establishment of a Guwahati chapter by BCCI, the organisation of a industry round-table by FICCI and other similar exercises all add up to substantiate this contention. What is now needed is a dedicated push to create a better climate for attracting private investment.

49
2) Despite the several existing economic hurdles the private sector has already made in roads into the North East. This background paper documents a list of instances of corporate success that merit attention and encouragement. If proper policies are persued more such examples are likely to emerge.
The primary focus of this study has been to identify the various corporate success stories in the North East (Annexure I). A related feature of this exercise is to explain key attributes, which have contributed to individual successes. The underlying idea being to take a closer look at these attributes and examine whether some of them can be more closely woven with the current economic policy initiatives. A final and more vital feature of this exercise is to analyse the current policy environment, identify apparent hurdles to attracting investment and suggesting a future road map. The biggest challenge for the North Eastern Region as a whole would be to develop a long term development strategy that inspires the confidence of investors both Indian and Foreign. One of the important factors that has established India as a key investment destination is the visible political consensus that has been brought about in the irreversibility of economic reforms. The governments and people of the North Eastern Region will also have to demonstrate their preference for faster development through private investment and make it known to the investor community through appropriate communication strategies. Some of the areas/issues that deserve special emphasis are the following : I. Economic resurgence will undoubtedly stimulate regional prosperity and
stability. For this to materialise only increased investments in the region will help. However all investors whether internal or external want strong reassurances about a common minimum economic agenda, a continuity in policy making and willingness by individual State Governments to accept the role of private enterprise in attracting new investment in the Region.
II. State - sponsored investment initiatives have yielded slow results. Because of
obvious problems of infrastructure, entrepreneurship, size of market, law and order etc. the small scale suffers from natural handicaps. As some of the annexed success stories demonstrate with the on set of economic liberalisation, economic lot size and returns to scale make significant differences to the desirable size of investment. Hence policy makers must maintain an open mind for large investments as and when they are proposed.

50
III. The New Industrial Policy for the North East, despite making bold concessions, has failed to stimulate economic growth to the desired levels. There is a need for a wider package. The closed door attitude to transfer of land and labour creates serious bottlenecks for rapid industrialisation. Most investors feel more insecure on this account rather than adverse law and order situation. Therefore a deliberate attempt to introduce 'feel good' factors need to be introduced. Creation of Special Economic Zones in specified regional centres will at least induce some special interest in the minds of investors.
IV. Despite having a reasonable infrastructure in some areas like the Brahmaputra Valley, focused efforts are urgently required in other areas to improve the hard infrastructure, particularly the power situation. Coupled with this, dedicated investments in telecommunication facilities are very desirable. A good telecom structure can lead to a tide of investments in several knowledge based industries like software services, call centres, transcription, data base management and so on.
V. The illustration of specific examples of corporate success revolves around
tea. light engineering, cement, synthetic textiles health care, containerisation and wood based industries. In most instances the size of investment is medium and the ownership is primarily local. Large scale private sector investment into infrastructure, heavy engineering and so on is still alluding the region, notwithstanding the proposed joint venture with Reliance Industries.
VI. Several distinct agribusiness opportunities can be tapped quite
comprehensively. The opportunities are in floriculture, medicinal herbs and plants, ginger cultivation, organically grown tea, tung oil, cane and bamboo products. The cultivation and export of commercial crops, particularly medicinal herbs offers great possibilities. The region has more than 400 herbs and large scale cooperative farming can yield desired results. However despite the underlying potential this study was unable to come across meaningful success stories.
VII. Entire North East has immense potential for tourism. However only Sikkim
seems to be exploiting its inherent advantages. All other States need to incorporate very proactive travel and tourism policies. To promote tourism on a wider scale air link with major destinations in the North East is necessary. Converting Guwahati into an international airport will enable tourists from Thailand, Malaysia, Singapore to visit the North-East in larger

51
numbers. Direct charter flights between Guwahati and Bangkok will help immensely. Simultaneously a full fledged marketing drive through exhibitions and road shows needs to be launched to improve the awareness of the region amongst potential travellers. A fruitful begining has been made by the Assam Government with the launch of an international road show to highlight the great potential of adventure and eco-tourism in the region.
VIII. Hydro power offers immense opportunities all over. Micro-hydel Projects
can yield considerable results. There is a need for large scale private initiative from outside the region in this sphere. Investments required are sizeably large and so far what has materialised is far too low. Power projects are capital intensive and require enormous public support. The State Governments need to display far greater vision before they can expect any genuine private sector involvement.
IX. Existing oil sector can be further stimulated to create a whole set of new
opportunities in natural gas. Infact natural gas once tapped can act as a catalyst for several chemical and engineering industries. In case the project by Reliance Industries gets established it will change the contours of industry in the region.
X. A new thrust on knowledge based industries through development of
telecommunications networks, creation of IT parks is already yielding positive results. The Brahmaputra valley has a high rate of literacy and selective encouragement to IT enabled services like call centres, medical transcriptions, data management centres is very desireable.
XI. Liberalising border trade is vital for the region. However, related
infrastructure facilities need to be rapidly developed. Much of this effort is dependent on our neighbouring countries. The suggestion of removing the 40 km limit on either side of the border is fraught with difficulties. This requires the setting up of several land customs check posts and also the simultaneous concurrence of countries like Bangaldesh and Myanmar.
XII. The prevalent labour policies need to be examined in their totality. Amidst
large scale unemployment the region suffers from an acute shortage of skilled labour. Infact several entrepreneurs find the difficulties of locating skilled labour to be a tremendous bottleneck.

52
XIII. A careful study of the current success stories demonstrates that innovative and realistic projects have succeeded and can succeed. Dynamism and professional management are key factors behind industrial success.
XIV. Most successful stories are hitherto local. So far the available data does not
highlight any success story of any new foreign investor. This means that more concrete steps need to be taken to induce participation of investors from outside the State. Some of the participants in the conference explained the need to create a “feel good” factor by the State Governments towards outside investment
XV. While some information is available about proposed Indian private sector
projects in the region it is too early to assess their impact. It will be all the more important for this region to convert these projects into resounding success stories, so as to demonstrate the immense investment potential in the Region. In some ways here is a proactive role for the local media to highlight and bring to the notice of all others the simple efficacies of making investments in the region.
XVI. The primacy of 'professionalism' and 'organisational effectiveness' as
overriding standards in separating the successful from the unsuccessful cannot be over emphasised in the context of meeting broader economic challenges. Competition, by its very nature distinguishes the weak from the strong. Those who have prospered in the North East despite the various deficiencies in the overall environment have been able to achieve these through building a professional environment around themselves. The message for policy makers is that special consideration must be given to entrepreneurs who are equipped with technical and professional skills rather than capital alone so that their knowledge and organisational skills can be effectively tapped. We need more agencies like NEDFi, AIIDC which can assist prospective entrepreneurs with venture capital.
XVII. Effective product/service marketing is both a cause and a result of success.
Out of the current list of successful ventures a large cross section have organisational links within and outside the region. Whether it is tea, jute, floriculture, power, transport or infrastructure the importance of a sustainable marketing network cannot be over emphasised. However, such networks require years of effort and dedicated investment. It is not always feasible for emerging entrepreneurs to devote time and investment to this area. May be

53
this is where policy makers can step in to formulate specific packages to give an impetus to the marketing thrust of individual businessmen from this region. A case in point is tourism. Despite the enormous potential of tourism in the North East there is hardly any business venture of critical size in this region. In contrast, states like Kerala, Rajasthan and Himachal Pradesh, which are similarly poised, are able to generate tremendous volumes of traffic because of the sustained awareness campaigns initiated by the respective State Governments.
XVIII.Direct interaction with some of the successful entrepreneurs reveals that
despite initial apprehensions a majority of them welcome the process of economic liberalisation initiated in the rest of the country. There is a strong feeling that while liberalisation has thrown open the gates to competition it has also inculcated the need to invest in technology, technological skills and cost competitiveness. A perceptible difference is visible in the attitude of entrepreneurs and managers in giving importance to consumer preferences, forward - looking planning, and devising unique firm specific strategies to improve upon market share. In fact if it were not for delicensing of the engineering industry a successful company like Premier Cryogenics Ltd would never have come into existence in the North East.
Some Steps for Enhancing Corporate Success :
∗ At the policy level there are some important lessons from this review. The state must largely play the role of a facilitator and confine itself towards provision of basic infrastructural services. Institutions like SIDBI, NEDFi, AIIDC must be encouraged to establish a wider network as these have so far been a breeding ground for professional entrepreneurs.
∗ One of the drawbacks of the state sponsored industrialisation is the absence
of external market linkages. No industrial venture can survive unless there is a conscious effort to establish a sound marketing network. The case of Assam Polyester with its sixty whole sale outlets and more than seventy company owned show rooms clearly substantiates the fact that in the North East apart from oil, tea and plywood other industries can also flourish if the enterprise is backed up by a dependable marketing network.

54
∗ In a region where new ventures take time to get implemented an entrepreneur must run from pillar to post in order to organise the funding arrangements. At least a few of the enlisted success stories would never have gone beyond the drawing board stage if it were not for the risk taking ability of AIIDC, NEDFi, SIDBI.
∗ There is a popular belief that a special credit policy (with concessional
interest rates and easy repayment packages) needs to be introduced if the pace of industrialisation has to be increased. The need of the times is for larger and quicker availability of credit rather concessionary credit. To hasten the pace of new investment project the entire business of project appraisal itself needs to be given a fresh look. May be a joint body of the existing project funding agencies should come together and delegate the business of appraisal to a reputed outside agency like the ICICI to examine all new proposals and finalise suitable recommendations from time to time.
∗ In a region where land acquisition has always been a delicate issue there
cannot be any balanced regional development unless land is made available for industrialisation. As in the case of the sample of success stories (Premier Cryogenics, Assam Polyester, MRB, CNRC, Buildworth etc) new industries can come up where land and labour are readily available. Hence the increasing concentration of industry in Assam. For the entire North East to replicate the experiences of the Brahmaputra valley the present land policy must be boldly reviewed. There is indeed a strong case for establishing "Special Economic Zones" in individual states where the state helps to create a "competitive climate" for investment. The case for establishing Special Economic Zones is best substantiated by the example of Pipavav Port Trust in Gujarat where a private entrepreneur has gone ahead to create a special economic zone on his own initiative for other private players to establish and flourish.
∗ Industrial investment is influenced by the prospects of profitability, long
term sustenance and, above all, a general "feel good" factor. Private capital is largely risk capital and investment decisions are influenced by an entrepreneur's belief that "money can be made", which is what the "feel good" factor is all about. It is important for State Governments to realise that one of the prerequisites for creating a climate for attracting big investors from outside the region is the acceptance and propagation of common

55
minimum economic agenda for all the seven states. Unless private enterprise is well assured of this the pace of economic resurgence will remain tardy.
∗ The State owned funding agencies are often not equipped with the expertise
or the coverage to support innovative business ventures. It will therefore be a good idea to engage independent project evaluation agencies for assisting the state level and regional funding agencies in making bolder investment decisions.

1
M R B Enterprises Annexure -1
1. Personal Particulars:
Name of Entrepreneur /Businessman: M. R. Baruva - Chairman cum Managing Partner/Director S P Baruva - Partner/Director cum Chief Executive Officer Contact Address: Bharali Complex, G. S. Road, Ulubari, Guwahati – 781 007, Assam Telephone/Fax: Tel: (91 361) 521438, 512270, 527967 Fax: (91 361) 511928 E-mail: [email protected] Website: www.mrbtea.com
2. General Background/Activities:
The MRB Group is the embodiment of four generations of experience in the Tea Industry of Assam. It has its lineage from Late Rai Bahadur Radhika Prasad Baruva, grandfather of the CMD M R Baruva, who is one of the pioneer’s of the Tea Industry. The activities of the group are mainly in the Tea Industry. The activities include Cultivation, Production, Packaging, Brokering and Exports.
3. Business/Company Activities:
2
The MRB Group comprises of six companies which include the following: Sonarie Tea Co. Pvt. Ltd. - This Company is the flagship of the Group, which owns Sonarie and Soonitpur Tea Estates with a production of over 1.5 million kgs p.a. of tea annually. It is recognized as a prime land mark in Tea circles. Indeed it holds the record for procuring the highest ever-price for teas sold at the Guwahati Tea Auction Center.
MRB & Associates - is a registered partnership firm and is primarily a manufacturing cum trading company, which looks after four Tea Estates and is engaged in the production of packet, branded teas. The production of this company is 3 million kgs p.a. The Tea Estates managed by the firm are:
1. Gorajan Tea Estate 2. Umabari Tea Factory (Lessee) 3. Thengalbarie Tea Factory (Lessee) 4. Dayamanti Tea Factory (Lessee) MRB Enterprises - is a 100 % export unit dealing in trading of tea with CIS, Europe & USA. It is one of the biggest export firms of this region.
Tea Brokers (Guwahati) Pvt. Ltd. - is a registered Broker and Auctioneer in Guwahati Tea Auction. This is one of the oldest brokering house in Guwahati and has a client list of over 100 Tea Estates from the North East Region. This company was acquired by the group as a going concern in 1996.
Transpower Private Limited - is a recent acquisition for the group. It undertakes turnkey projects in the power sector. Its area of specialty is power transmission. It also manufactures and supplies galvanised/ungalvanised transmission towers, Sub Station Structures,
3
Equipment Mounting Structures for both low and high Voltage, Watch Towers Signal Poles (tubular & lattice) and other similar fabricated Structures. The company has appointed a number of agents in India, Europe and CIS countries which enable it to reach out to the world market.
4. Manpower:
Unskilled & semi skilled - 921 Permanent workers Executives - 54
5. Financial Information:
Turnover - Rs. 30.5 million 6. Instances of special achievements:
M R Baruva – Chairman cum Managing Partner/Director was awarded the “Rajiv Gandhi International Award” in the years 1995 for his contribution to the Tea Industry and for corporate excellence.
S P Baruva CEO cum Partner/Director was specially selected to be a member of the expert group to study the implementation of HACCP (Hazard Analysis Critical Control Point) in the Tea Industry. He is also a Director of FINER (Federation of Industries of North East Region).
7. Future Business / Investment Plans:
The MRB group is negotiating to acquire more properties in the Tea Industry. It also has plans to expand its packet tea business. An ambitious program has been launched for the cultivation of organic tea. One of its constituent company Trans-power Private Limited is looking for tie-ups and collaborations in turnkey projects in the power sector. The company also has plans to enter the food-processing

4
sector with special emphasis on Pineapple. The group is also actively exploring the potentiality of Eco-tourism in the Northeast region.

5
Premier Cryogenics Ltd.
1. Personal Particulars of entrepreneur :
ABHIJIT BAROOAH C/o Premier Cryogenics Ltd. Maniram Dewan Road, Chandmari Guwahati 781 003, Assam Phone No.(361) 660190 to 93 Fax No.(361) 668102/661787 E-mail : [email protected]/[email protected]
2. General Background/History of Business : Mr. Barooah is a First-generation technocrat entrepreneur. He did B.Tech in Chemical Engineering from IIT, Delhi in 1983 and went on to complete a post graduate degree in Chemical Engineering from University of Rochester, USA in 1985. Immediately after that he promoted M/s. Assam Air Products (P) Ltd. to set up an Industrial Gases plant at Sivasagar in Assam. The Company went into production in 1988. Currently it markets the entire range of Industrial and Medical gases throughout the Northeastern region. Its clients includes all major industrial units and hospitals of the region. Current annual turnover of the Company is about Rs. 4 crore. 3. Business/Company Expension : In 1995 Mr Barooah further promoted M/s. Premier Cryogenics Ltd. to set up a plant at Guwahati to manufacture Liquid Nitrogen, Industrial & Medical Oxygen gas, Nitrogen gas and Compressed Air at an investment of Rs. 10 crore. Several major Financial Institutions like IDBI, IIBI, IFCI Venture, NEDFi and AIIDC have provided venture capital to the Company and are shareholders. The Company mainly caters to the requirement of the oil exploraton & refining and defence sectors of Eastern India. Current annual turnover of the Company is about Rs. 5 crore. It is a profit-making dividend-paying Company listed in the stock exchanges of Guwahati, Calcutta and Ahmedabad.

6
4. Manpower : The two Companies of the group directly employ 52 persons, apart from giving indirect employment to about 50 more. Some of the key employees are Mrs. Anamika Chowdhary, MBA (Wholetime Director), Sri Tridib Borah, B.E. (General Manager) and Sri Anjan Talukdar, ACS (Company Secretary). 5. Financial Information :
(Rs. in lakhs)
1997-98 1998-99 1999-2000
Total Income 235.83 329.58 432.84
Profit before interest & depreciation 129.87 155.23 204.32
Interest 94.87 97.08 74.85
Depreciation & misc. expenses write off 25.22 47.90 48.34
Provision for taxes - - -
Net Profit 13.39 13.87 84.75 1. Some instances of special achievements : i) Only commercial manufacturer in the Northeastern region of Liquid Nitogen,
which is a critical input in oil exploration. Made significant contribution to indigenous oil production by ensuring uninterrupted supply.
ii) The only Defence Ministry approved aviation and medical gas manufacturer
in Eastern India. iii) One of the first manufacturing Companies of the Northeastern region
to float a public issue successfully in 1996. iv) One of the first Companies of the region to receive venture funding. v) Received senior Chevening Gurukul Scholarship to attend 10 week
programme at the London School of Economics & Political Science on `Globalization and its impact on Indian leadership’ at the invitation of U.K. government.

7
vi) Attended a three week programme on “Entrepreneurship in the U.S.”
conducted by United States Service at the invitation of U.S. government. vii) Attended “Venture 2000” - a symposium on Asian Venture Capital Business
at Osaka, Japan at the invitation of Asian Productivity Organisation, Tokyo as a part of a 6 member Indian delegation.
1. Future Business/Investment Plans : i) Based on the core competency of operating sophisticated manufacturing &
distribution operations in the northeast to enter into strategic alliance for contract manufacturing.
ii) Marketing tie-up with world leaders for all types of speciality
gases/chemicals.

8
Guwahati Neurological Research Centre Ltd Name of Enterpreneur : Dr N C Borah, MBBS, MD, DCP, DM
Neurologist Contact Address : GNRC Limited Dispur Guwahati 781 006 (Assam)
Tel. 0361 227700 Fax.0361 227711 E-Mail : [email protected] General Background/ History of Business : Incorporated in 1985 the company commenced operations in 1987 Nature of Activity : The company established a super specialty hospital at Guwahati at an investment of Rs 1 crore for care of neurological patients which over a period of time has become one of the finest and also biggest privately managed neuroscience centre in the country. The centre is popularly known as 'Institute of Neurological Sciences. It is the first ISO-9002 hospital in North Eastern India. It is an unparalled hospital for all the seven NE States, CGHS, Railways, Defense and many other public and private sector undertakings located in the North East. It employs about 400 personnel including 50 doctors, 150 nurses and other paramedical and administrative staff. INS is also a three years DNB training centre in neurology recognised by National Board of Examinations, New Delhi under Ministry of Health and Family Welfare, Government of India. In 1997-98 the GNRC promoted another super specialty hospital for cardiac patients with state-of-the-art technology and equipment's at an investment of Rs 15 crores. This heart hospital is known as 'GNRC Heart Institute. It has 200 employees including 25 Doctrors,100 Nurses and other paramedical and administrative staff. GNRC Heart Institute perform OHS procedures like, cardiac Bypass, Valve replacement and other congenital heart diseases. It is also an ISO-9002 hospital from British Standard Institute. GNRC is also in the process of setting up a dedicated hospital for accident and Emergency Medical Services with state-of-the-art technology at a project cost of Rs 45 crores. This would be commercially operational from April, 2001.

9
Financial Position : GNRC with its domain knowledge and expertise in hospital management system is also in the process of venturing into information technology in the health care services and has opened a division known as 'GNRC Infotech'. GNRC is a public limited company with an equity capital of Rs 5.5 crores. IDBI, NEDFi, RCITC, AIDC etc. are having equity in the company. For last ten years the company has been making profit and paying dividend. It has paid 21% dividend during the year 1998-99 and 1999-2000. Turnover : 1998-1999 : Rs. 11.70 crores 1999-2000 : Rs. 16.32 crores Some Special Achievements : a) Amidst the hectic pace of growth and expansion GNRC has succeeded to foster a
very healthy working environment between management and the employees. b) GNRC is a living example of providing value for money in the healthcare industry. As
a result, while maintaining the larger social objective of providing highly valuable health care services in perspective, GNRC has retained the rare distinction of an uninterrupted track record of profitability.
Future Business / Investment Plan : a) This institution aims to expand health care facilities in Assam as a social movement b) GNRC expects to venture into ancillary health related economically viable projects to
generate new employment.
10
Assam Polyester Co-operative Society Ltd 1. Personal Particulars:
Sanjib Sabhapandit Director Assam Polyester Cooperative Society Ltd Chandmari Guwahati 781 003 Tel. 0361-652917 (Direct) 551770, 551970 Fax 0361-552372
2. General Background/History of Business:
Year of Establishment : 1988 - Yarn Spinning Unit 1991 - Fabric Unit The company announced operations 1988 with a yarn spinning unit. Later in 1991 a fabric unit was established. The principal promotors of the compay are : i) Mr Ashim Kumar Sarma, B E
Chairman-cum-Mg Director
ii) Mr Sanjit Sabhapandit, B E, M B A Director
iii) Mr Kalyan Bhagowati
Textile Technological Director 1. Business/Company Activities
The company's activities evolve around the manufacturing of a) Polyester Viscose blende yarn both grey & dyed
b) 100% polyester yarn-dye
c) 100% Acrylic yarn-dye
d) Polyester Viscose blended shirtings, suitings and ladies dress materials and
furnishing materials
11
e) Cotton sarees, bed sheets etc.
f) Readymades (indirectly)
The market for polyester materials is around Rs 500 crore in the North East India, and the company has market share of about 6%. The company has a modernised spinning, weaving, process printing & dyeing unit. Over a period the company has established a sound marketing network with about more than 60 wholesellers all over the country and about 70 authorised showrooms in the North East India.
4. Manpower:
Direct - about 1500 nos. 85% (approx) skilled. Indirect - about 1000 nos.
5. Financial Information:
Capital investment - Rs 24.00 crores Turnover (present) - Rs 25.00 crores Average of the last 2 years - Rs 20.00 crores
6. Some Instances of Special Achievements :
a) The investment in the Textile sector in the state between 1986 and 1992 was about Rs 480.00 crores. Six (6) Spinning Mills, 3 Process houses, one filament yarn unit, about 2000 powsr looms were installed. Out of all these APOL's unit is virtually the lone unit running along with a few other small units.
b) There was a myth that except Oil, Tea & Plywood, nothing could be produced
in the North East and marketed outside. APOL has broken this myth.
c) Although Assam has a very rich handloom textile heritage it did not have any mechanised textile expertise. APOL can now claim to have created a very substantial expertise in the field of Textiles in the State.
4. Future Expansion/Investment Plans :
Expansion of capacity by 25% in the same line is under implementation and product diversification is the main thrust area.
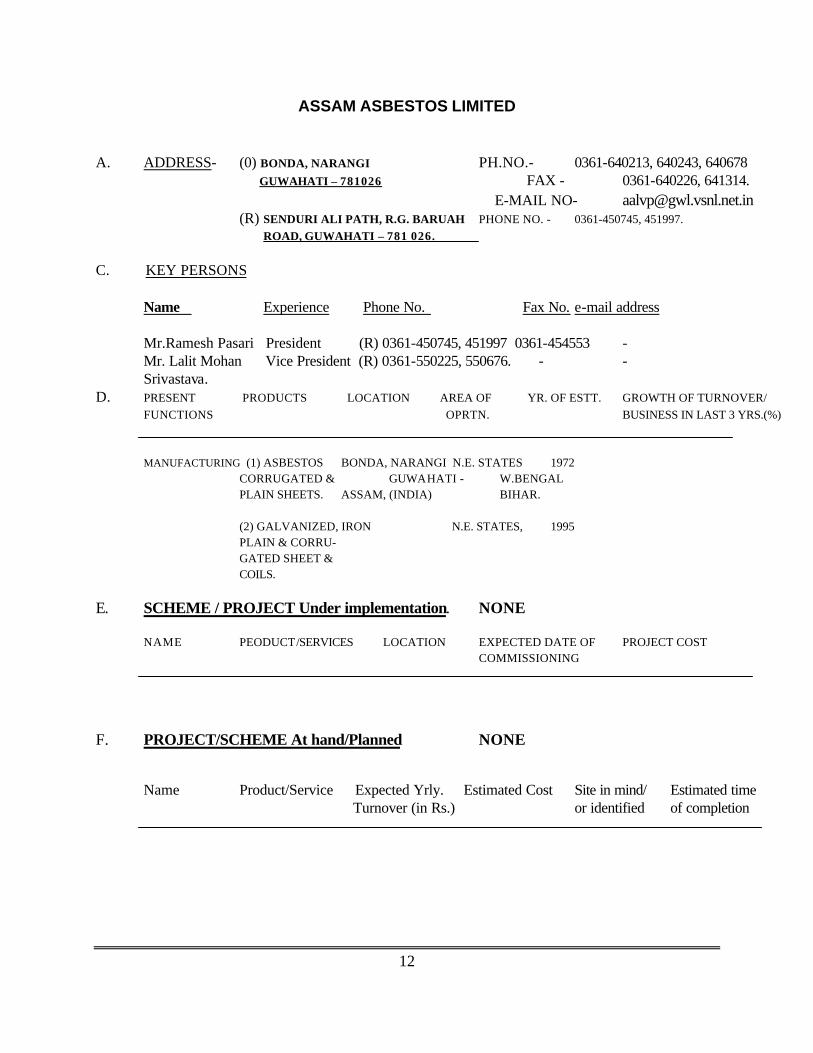
12
ASSAM ASBESTOS LIMITED
A. ADDRESS- (0) BONDA, NARANGI PH.NO.- 0361-640213, 640243, 640678
GUWAHATI – 781026 FAX - 0361-640226, 641314. E-MAIL NO- [email protected]
(R) SENDURI ALI PATH, R.G. BARUAH PHONE NO. - 0361-450745, 451997. ROAD, GUWAHATI – 781 026. C. KEY PERSONS
Name Experience Phone No. Fax No. e-mail address Mr.Ramesh Pasari President (R) 0361-450745, 451997 0361-454553 - Mr. Lalit Mohan Vice President (R) 0361-550225, 550676. - -
Srivastava. D. PRESENT PRODUCTS LOCATION AREA OF YR. OF ESTT. GROWTH OF TURNOVER/ FUNCTIONS OPRTN. BUSINESS IN LAST 3 YRS.(%) MANUFACTURING (1) ASBESTOS BONDA, NARANGI N.E. STATES 1972 CORRUGATED & GUWAHATI - W.BENGAL PLAIN SHEETS. ASSAM, (INDIA) BIHAR. (2) GALVANIZED, IRON N.E. STATES, 1995 PLAIN & CORRU- GATED SHEET & COILS.
E. SCHEME / PROJECT Under implementation. NONE NAME PEODUCT/SERVICES LOCATION EXPECTED DATE OF PROJECT COST
COMMISSIONING
F. PROJECT/SCHEME At hand/Planned NONE Name Product/Service Expected Yrly. Estimated Cost Site in mind/ Estimated time Turnover (in Rs.) or identified of completion

13
Buildworth Pvt Ltd
1. Personal Particulars Name of Entrepreneur/ Businessman : Mr Deepak Singh Contact Address : Buildworth Pvt Ltd G S Road, Dispur Guwahati 781 005 Telephone : 261411, 260352/3 Fax : 91-361-261411 E-Mail : [email protected]
2. General Background/History of Business Buildworth Pvt Ltd is a medium size engineering industry with headquarters at Guwahati, ASSAM (India) and office at Kolkata. The company is established in 1959.
3. Business & Company Activities : Buildworth has been in the field of mechanical, civil and heavy structural construction at site for over 40 years. Its range of products are Bath type Indirect Heaters, Oil & Gas Separators, Mist Extractors, Emulsion Treaters, LPG Bullets, Heat Exchangers, Pressure Vessels and other oil & gas process equipments. The company has tied up with Chesterton International Inc. Boston, USA for marketing of its its Advanced Reinforced Composite and other products in entire Eastern and North East India. Buildworth's main customers are Oil India Ltd, ONGC Ltd, Oil Refineries, Railways Defence and other industries in this region.
4. Manpower : Skilled : 93 Unskilled : 37
5. Financial Information
Overall Bank credit limit : Rs. 595 lacs Turnover for the last two years : 1998-99 - 1151.35 lacs 1999-2000 - 774.57 lacs
6. Name of the Company : Buildworth Pvt Ltd. (Private Limited)
7. Some instances of : Sheer hard work, coupled with

14
special achievements dedication and steadfastness of purpose
8. Future/Investment Plans : As required
A F T Industries Ltd.
Registered office Talap Appejay House, Dist. Tinsukia 15, Park Street, Assam Calcutta 700016 Incorporation year :1977 Ownership group : Apeejay Group Main activity : Tea Listed on Bombay Stock Exchange Calcutta Stock Exchange National Stock Exchange Assam Frontier Tea Company was incorporated in England as a subsidiary of Sime Darby Holdings Ltd. with Shaw Wallace as its Indian agent. It is carrying tea plantation in Assam since 1889. The company was formerly known as Assam Frontier Tea and is a subsidiary of Assam Frontier Tea Company Limited of UK. It was incorporated in India in June 1977, in order to acquire the Indian business of UK parent. In 1982, Sime Darby Holdings Ltd sold the company to Mr. Swraj Paul of the Apeejay group. Mr. Surrendra Paul became the chairman of the company who was killed by the ULFA in 1990, following which Mrs. Shireen Paul took over as the chairperson. As of 1999, promoters hold 44 per cent equity stake in the company while 29 per cent is held by public and 7 per cent by foreign parties. The company owns 8 estates, all situated in Assam and having their own processing facilities. In May 2000, the company made a foray into the web world by launching its B2C online tea boutique -- teastall.com in May 2000. The Apeejay Surrendra Tea group, comprising of AFT Industries, Empire plantations and Singlo India Tea company, plans to merge the three companies into one entity.

15
Plant Locations/Products Capacity/Units Production/Units
1. Budlapara (Darrang, ASS) Tea 0.00
'000 tonnes
1.07 '000 tonnes
2. Budlabeta (Dibrugarh, ASS) Tea 0.00
'000 tonnes 1.56
'000 tonnes 3. Hapjan (Dibrugarh, ASS) Tea 0.00
'000 tonnes 1.67
'000 tonnes 4. Hilika (Dibrugarh, ASS) Tea 0.00
'000 tonnes 1.29
'000 tonnes 5. Hokonguri (Dibrugarh, ASS) Tea 0.00
'000 tonnes 1.29
'000 tonnes 6. Kharjan (Dibrugarh, ASS) Tea 0.00
'000 tonnes 0.84
'000 tonnes 7. Khobong (Dibrugarh, ASS) Tea 0.00
'000 tonnes 1.72
'000 tonnes 8. Pengaree (Dibrugarh, ASS) Tea 0.00
'000 tonnes 1.13
'000 tonnes 9. Talup (Dibrugarh, ASS) Tea 16.20
'000 tonnes 1.46
'000 tonnes

16
Financial Performance
March 2000 12mths
Rs. Crores
Gross sales 95.93 Net sales 91.17 VOP 90.59 Other income 6.41 Cost of production 49.79 Selling cost 4.68 PBDIT (NNRT) 23.82 PBDT (NNRT) 23.28 PBT (NNRT) 21.26 PAT (NNRT) 14.06 Cash profit(NNRT) 16.08 Operating cash flow 38.80 Gross value added 68.50 Exports 1.99 Imports 2.94 Gross fixed assets (net of reval & WIP) 82.84 Current assets 58.42 Net worth 81.26 Equity capital 6.00 Long term borrowings 0.00 Capital employed 81.26 Current liabilities & provisions 33.43 Total assets / liabilities (net of reval & misc. exp. n.w.o)
114.69
Break-even sales (%) 60.59 Margin of safety (%) 39.41
Growth (%)
Gross sales -9.00 Net sales -11.09 Cost of production -8.50 GFA 14.71 Total assets 3.42

17
Margins (%) PBDIT (NNRT) / Sales 24.83 PBDT (NNRT) / Sales 24.27 PAT (NNRT) / Sales 14.66 PBDIT (NNRT) / Net sales 26.13 PBDT (NNRT) / Net sales 25.53 PAT (NNRT) / Net sales 15.42 Returns ratios (%) PAT / Net worth 18.01 PAT / Total assets 12.47 PBDIT / Total assets 21.12 PBDIT / Capital employed 30.52 Liquidity ratios Long term debt / equity (times) 0.00 Total debt / equity (times) 0.01 Current ratio (times) 1.75 Interest cover (times) 40.37 Gross working capital cycle (days) 231 Net working capital cycle (days) 116 Avg. days of debtors (days) 44 Avg. days of creditors (days) 115 VOP / Total assets 0.803 VOP / GFA (times) 1.168 Total R & D expenditure 0.00 R & D capital 0.00 R & D current 0.00

18
Bharat General & Textile Inds. Ltd.
Registered office
8th Floor, 9/1, R.N. Mukherjee Road Calcutta West Bengal.700001 Incorporation year :1944 Ownership group : Birla B.K. Group Main activity : Diversified Plant Locations/Products
Capacity/Units Production/Units
1. Chariduwar (Darrang, ASS) Cotton yarn 0.00
Spindles 0.00
Tonnes 2. Achalpur (Amravati, MAH) Oils 36.62
'000 tonnes 0.00
'000 tonnes 3. Malkapur (Kolhapur, MAH) Oil cakes 95.00
'000 tonnes 0.00
Oils 36.63
'000 tonnes 0.00
'000 tonnes Others 0.00 7520000.00
Kgs Solvent extracted oil 0.00
1.24
'000 tonnes Dhamangaon (Solapur, MAH) Oils 36.63
'000 tonnes 3.44
'000 tonnes Guntur (Guntur, AP) Oils 36.62
'000 tonnes 0.00
'000 tonnes Solvent extracted oil 0.00
1.24
'000 tonnes

19
Financial Performance
March 2000
12mths Rs. Crores
Gross sales 60.13 Net sales 59.54 VOP 58.78 Other income 4.51 Cost of production 54.06 Selling cost 3.33 PBDIT (NNRT) 4.06 PBDT (NNRT) 3.63 PBT (NNRT) 3.19 PAT (NNRT) 2.22 Cash profit(NNRT) 2.66 Operating cash flow 0.00 Gross value added 7.80 Exports 3.32 Imports 0.00 Gross fixed assets (net of reval & WIP) 9.31 Current assets 21.31 Net worth 34.59 Equity capital 5.76 Long term borrowings 2.01 Capital employed 36.60 Current liabilities & provisions 6.47 Total assets / liabilities (net of reval & misc. exp. n.w.o)
42.55
Break-even sales (%) 158.15 Margin of safety (%) 0.00 Growth (%) Gross sales -33.15 Net sales -33.09 Cost of production -36.68 GFA -38.47

20
Total assets -7.86
Margins (%) PBDIT (NNRT) / Sales 6.75 PBDT (NNRT) / Sales 6.04 PAT (NNRT) / Sales 3.69 PBDIT (NNRT) / Net sales 6.82 PBDT (NNRT) / Net sales 6.10 PAT (NNRT) / Net sales 3.73 Returns ratios (%) PAT / Net worth 6.78 PAT / Total assets 5.00 PBDIT / Total assets 9.15 PBDIT / Capital employed 11.68 Liquidity ratios Long term debt / equity (times) 0.06 Total debt / equity (times) 0.16 Current ratio (times) 3.29 Interest cover (times) 8.42 Gross working capital cycle (days) 82 Net working capital cycle (days) 49 Avg. days of debtors (days) 21 Avg. days of creditors (days) 34 VOP / Total assets 1.325 VOP / GFA (times) 4.810 Total R & D expenditure 0.00 R & D capital 0.00 R & D current 0.00

21
B & A Plantations & Inds. Ltd Registered Office : Rukmini Nagar G S Road, Guwahati Assam Pin - 781 006 Inforporation Year : 1915 Ownership Group : Private (Indian) Main Activity : Tea Listed on : Bombay Stock Exchange Calcutta Stock Exchange Guwahati Stock Exchange B & A Plantations & Industries Ltd. was originally incorporated on 1 June, 1915 as Barasali Tea Co., Ltd. with the object of taking over and running of Barasali Tea Estate in Assam from Group Tea Company Ltd. Barasali Tea Co Ltd. over the years acquired three other tea Estates before its name was changed to B & A Plantations and Industries Ltd on 4th March, 1986. BAPIL currently owns and operates five tea estates in Assam and is in the business of manufacture and state of tea. The company has two factories at Gatoonga and Salkathoni Tea Estates which process the leaf from all five tea gardens of the company. Plant Locations Production/Units
1. Barasali (Sibsagar, ASS)
Tea 1.14
‘000 tonnes 2. Gatoonga (Sibsagar, ASS)
Tea 0.66
‘000 tonnes 3. New Samaguri (Sibsagar, ASS)
Tea 0.12
‘000 tonnes 4. Samaguri (Sibsagar, ASS)
Tea 0.46
‘000 tonnes 5. Sangsua (Sibsagar, ASS)
Tea 0.73
‘000 tonnes

22
Financial Performance
Dec'99 12mths
Rs. Crores
Gross sales 26.99 Net sales 24.31 VOP 26.08 Other income 0.02 Cost of production 14.06 Selling cost 1.78 PBDIT (NNRT) 4.61 PBDT (NNRT) 1.53 PBT (NNRT) 0.84 PAT (NNRT) 0.68 Cash profit(NNRT) 1.40 Operating cash flow 4.69 Gross value added 16.32 Exports 3.40 Imports 0.34 Gross fixed assets (net of reval & WIP) 27.06 Current assets 18.64 Net worth 19.98 Equity capital 3.11 Long term borrowings 9.64 Capital employed 29.62 Current liabilities & provisions 15.15 Total assets / liabilities (net of reval & misc. exp. n.w.o)
42.64
Break-even sales (%) 84.45 Margin of safety (%) 15.55 Growth (%) Gross sales 11.02 Net sales 8.68

23
Cost of production 11.69 GFA 5.54 Total assets 5.94 Margins (%) PBDIT (NNRT) / Sales 17.08 PBDT (NNRT) / Sales 5.67 PAT (NNRT) / Sales 2.52 PBDIT (NNRT) / Net sales 17.97 PBDT (NNRT) / Net sales 5.96 PAT (NNRT) / Net sales 2.65 Returns ratios (%) PAT / Net worth 3.43 PAT / Total assets 1.64 PBDIT / Total assets 11.12 PBDIT / Capital employed 15.63 Liquidity ratios Long term debt / equity (times) 0.48 Total debt / equity (times) 0.88 Current ratio (times) 1.23 Interest cover (times) 1.27 Gross working capital cycle (days) 4.7 Net working capital cycle (days) 328 Avg. days of debtors (days) 18 Avg. days of creditors (days) 78 VOP / Total assets 0.629 VOP / GFA (times) 0.990 Total R & D expenditure 0.03 R & D capital 0.00 R & D current 0.03
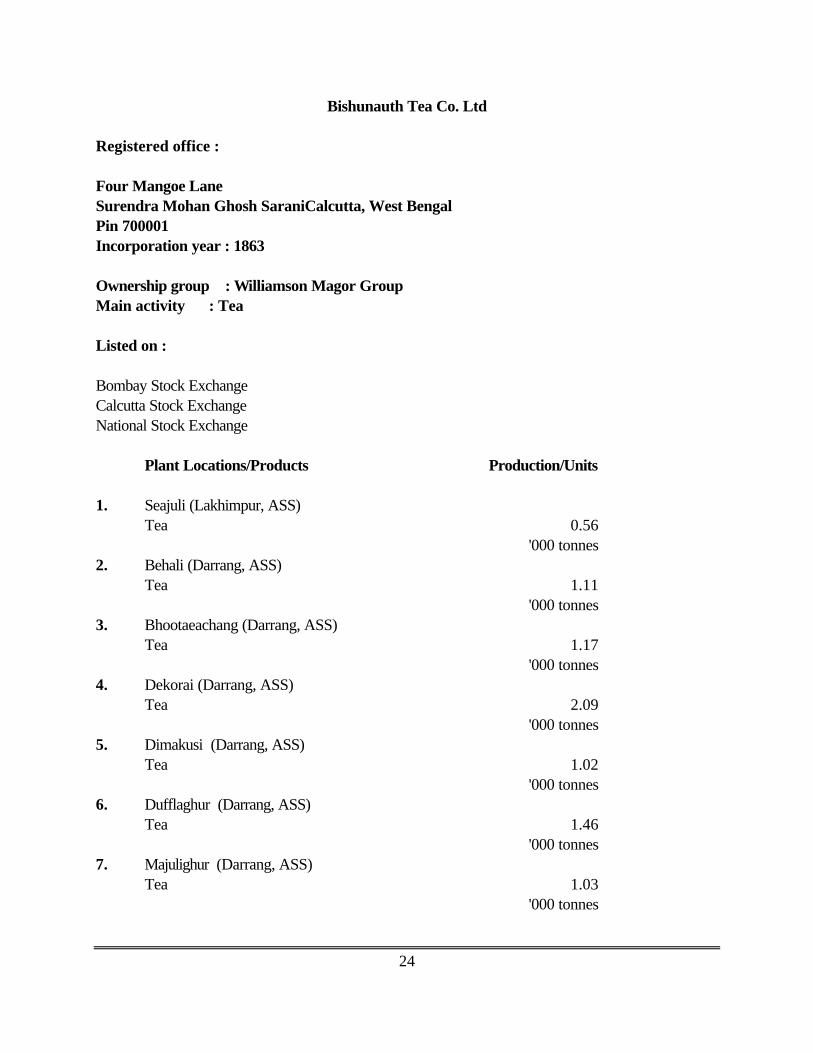
24
Bishunauth Tea Co. Ltd Registered office : Four Mangoe Lane Surendra Mohan Ghosh SaraniCalcutta, West Bengal Pin 700001 Incorporation year : 1863 Ownership group : Williamson Magor Group Main activity : Tea Listed on : Bombay Stock Exchange Calcutta Stock Exchange National Stock Exchange Plant Locations/Products Production/Units
1. Seajuli (Lakhimpur, ASS) Tea 0.56
'000 tonnes 2. Behali (Darrang, ASS) Tea 1.11
'000 tonnes 3. Bhootaeachang (Darrang, ASS) Tea 1.17
'000 tonnes 4. Dekorai (Darrang, ASS) Tea 2.09
'000 tonnes 5. Dimakusi (Darrang, ASS) Tea 1.02
'000 tonnes 6. Dufflaghur (Darrang, ASS) Tea 1.46
'000 tonnes 7. Majulighur (Darrang, ASS) Tea 1.03
'000 tonnes

25
Financial Performance
Dec'99 12mths
Rs. Crores
Gross sales 164.34 Net sales 157.91 VOP 158.70 Other income 13.32 Cost of production 78.67 Selling cost 14.97 PBDIT (NNRT) 50.87 PBDT (NNRT) 29.19 PBT (NNRT) 23.68 PAT (NNRT) 15.68 Cash profit(NNRT) 21.19 Operating cash flow 40.48 Gross value added 91.25 Exports 51.67 Imports 7.12 Gross fixed assets (net of reval & WIP) 208.34 Current assets 124.95 Net worth 187.15 Equity capital 14.69 Long term borrowings 55.29 Capital employed 242.44 Current liabilities & provisions 107.28 Total assets / liabilities (net of reval & misc. exp. n.w.o)
-65.21
Break-even sales (%) 41.46 Margin of safety (%) 58.54 Growth (%) Gross sales -7.65 Net sales -9.26 Cost of production 4.78 GFA 6.68 Total assets

26
Margins (%) PBDIT (NNRT) / Sales 30.95 PBDT (NNRT) / Sales 17.76 PAT (NNRT) / Sales 9.54 PBDIT (NNRT) / Net sales 32.21 PBDT (NNRT) / Net sales 18.49 PAT (NNRT) / Net sales 9.93 Returns ratios (%) PAT / Net worth 8.66 PAT / Total assets 12.72 PBDIT / Total assets 41.25 PBDIT / Capital employed 21.50 Liquidity ratios Long term debt / equity (times) 0.30 Total debt / equity (times) 0.73 Current ratio (times) 1.16 Interest cover (times) 2.09 Gross working capital cycle (days) 327 Net working capital cycle (days) 269 Avg. days of debtors (days) 17 Avg. days of creditors (days) 58 VOP / Total assets 1.287 VOP / GFA (times) 0.786 Total R & D expenditure 0.27 R & D capital 0.00 R & D current 0.27

27
Assam Co. Ltd Registered office : Head / Corporate office : Greenwood Tea Estate Assam Tea House, P O Dibrugarh Chowringhee Road Assam Calcutta West Bengal Pin 786 001 Pin 700 071 Incorporation year : 1977 Ownership group : Mehta Mahendra Group Main activity : Tea Listed on : Bombay Stock Exchange Calcutta Stock Exchange Guwahati Stock Exchange National Stock Exchange The company was incorporated as Assam Co. (India) Ltd. in March 1977 as a public limited company under the Companies Act, 1956 to takeover the Indian business of six sterling tea companies - Assam Co. Ltd., Assam Estates Ltd., Greenwood Tea Co. Ltd., Salonah Tea Co. Ltd., Thanai Tea Co. Ltd. and Upper Assam Tea Co. Ltd. - all of which were incorporated in England. The Sterline companies were wholly owned subsidiaries of Assam Investments Ltd., a company incorporated in England, in which Inchcape Co. Ltd. hold 37% of share capital. Assam Co. Ltd. was the first commercial tea company in the world, having been established in 1839 under a Royal Charter of the British Parliament. Consequent to the introduction of Foreign Exchange Regulations Act in the year 1973, Duncan Macneill Holdings Ltd. of U.K. (Formerly Assam Investment Ltd.), (part of the world renowned Inchcap Group), promoted Assam Co. (India) Ltd. by amalgamating the 6 sterling tea companies in December 1977. Assam Co. (India) Ltd. is a subsidiary of DMHL since inception. In 1979 foreign shareholding in the company was reduced to 74%. The name of the company was changed to Assam Co. Ltd. in 1989. The company owns 28 tea estates located at Doom Dooma, Moran, Panitola, Dibrugarh, Nowgong and Jorhat, and spread over 7400 hectares and 17 tea manufacturing factories.

28
Plant Locations/Products Production/Units
1. Dibrugarh (Borborooah) (Dibrugarh, ASS) Tea 0.00
'000 tonnes 2. Dibrugarh (Greenwood) (Dibrugarh, ASS) Tea 1.10
'000 tonnes 3. Dibrugarh (Hazelbank) (Dibrugarh, ASS) Tea 0.54
'000 tonnes 4. Dibrugarh (Maijan) (Dibrugarh, ASS) Tea 1.12
'000 tonnes 5. Dibrugarh (Nudwa) (Dibrugarh, ASS) Tea 0.47
'000 tonnes 6. Dibrugarh (Thanai) (Dibrugarh, ASS) Tea 0.99
'000 tonnes 7. Dikom (Dibrugarh, ASS) Tea 0.47
'000 tonnes 8. Doom Dooma (Digulturrung) (Dibrugarh, ASS) Tea 9. Panitola (Dinjan) (Dibrugarh, ASS) Tea 0.17
'000 tonnes 10. Panitola (Rungagora) (Dibrugarh, ASS) Tea 1.27
'000 tonnes 11. Jorhat (Kotalgoorie) (Jorhat, ASS Tea 0.73
'000 tonnes 12. Nowgong (Kondoli) (Nagaon, ASS) Tea 1.06
'000 tonnes 13. Nowgong (Salonah) (Nagaon, ASS) Tea 2.33
'000 tonnes 14. Moran (Doomur Dullung) (Sibsagar, ASS)

29
Tea 0.80 '000 tonnes
15. Moran (Hajura) (Sibsagar, ASS) Tea 0.15
'000 tonnes 16. Moran (Khoomtaie) (Sibsagar, ASS) Tea 1.42
'000 tonnes 17. Moran (Mohokutie) (Sibsagar, ASS) Tea 0.58
'000 tonnes
Financial Performance Dec'99
12mths Rs. Crores
Gross sales 148.36 Net sales 142.70 VOP 138.94 Other income 2.30 Cost of production 67.67 Selling cost 27.94 PBDIT (NNRT) 26.68 PBDT (NNRT) 12.11 PBT (NNRT) 7.98 PAT (NNRT) 7.19 Cash profit(NNRT) 11.32 Operating cash flow 30.59 Gross value added 59.34 Exports 35.88 Imports 6.32 Gross fixed assets (net of reval & WIP) 161.08 Current assets 78.80 Net worth 105.83 Equity capital 22.40 Long term borrowings 45.11 Capital employed 150.94 Current liabilities & provisions 31.16

30
Total assets / liabilities (net of reval & misc. exp. n.w.o)
182.10
Break-even sales (%) 76.50 Margin of safety (%) 23.50
Growth (%) Gross sales 4.13 Net sales 2.50 Cost of production 2.68 GFA 8.38 Total assets -2.34 Margins (%) PBDIT (NNRT) / Sales 17.98 PBDT (NNRT) / Sales 8.16 PAT (NNRT) / Sales 4.85 PBDIT (NNRT) / Net sales 18.70 PBDT (NNRT) / Net sales 8.49 PAT (NNRT) / Net sales 5.04 Returns ratios (%) PAT / Net worth 6.89 PAT / Total assets 3.90 PBDIT / Total assets 14.48 PBDIT / Capital employed 18.24 Liquidity ratios Long term debt / equity (times) 0.43 Total debt / equity (times) 0.60 Current ratio (times) 2.53 Interest cover (times) 1.55 Gross working capital cycle (days) Net working capital cycle (days) Avg. days of debtors (days) 46 Avg. days of creditors (days) 47 VOP / Total assets 0.754 VOP / GFA (times) 0.897 Total R & D expenditure 0.23

31
R & D capital 0.04 R & D current 0.19

32
Vinay Cements Ltd.
Registered office Jamunanagar, Umrangshu, North Cachar Hills Assam
Incorporation year : 1988 Ownership group : Private (Indian) Main activity : Cement Listed on : Bombay Stock Exchange Plant Location/Product
Capacity/ Production/ Units Units
1 Umrangshu (North Cachar Hills, ASS)
Ordinary portland cement 148.50 '000 tonnes
184.14nt '000 tonnes
Income & Expenditure: Vinay Cements Ltd.
Non-Annualised
Mar 1998 12mths Rs. Crore
Sales
46.26
Manufacturing 46.26 Trading 0.00 Fiscal benefits 0.00 Internal transfers 0.00 Others 0.00 Other income 0.11 Dividend received 0.00 Interest earned 0.00 Miscellaneous income 0.11 Change in stocks 2.12 Finished goods 1.77 Semi-finished goods 0.35 Non-recurring income 0.00

33
Gain on sale of assets 0.00 Gain on sales of investment 0.00 Provisions written back 0.00 Others 0.00 Expenditure Raw materials, stores, etc 19.19 Raw materials 13.08 Stores & spares 4.27 Packaging expenses 1.84 Purchase of finished goods 0.00 Wages & salaries 1.93 Energy (power & fuel) 5.76 Other manufacturing expenses 1.01 Indirect taxes 6.67 Excise duties 4.76 Repairs & maintenance 0.46 Plant & machinery 0.26 Other repairs 0.20 Selling & distribution expenses 4.96 Advertising 0.10 Marketing 2.23 Distribution 2.63 Provision for doubtful/bad debts 0.00 Amortisation 0.08 Miscellaneous expenses 2.04 Non-recurring expenses 0.10 Loss on sale of assets 0.01 Loss on sale of investment 0.00 Others 0.09 Less: Expenses capitalised 0.00 Interest capitalised 0.00 PBDIT Interest 4.41 On short term loans 0.15 On long term loans 4.26 Lease rent 0.11
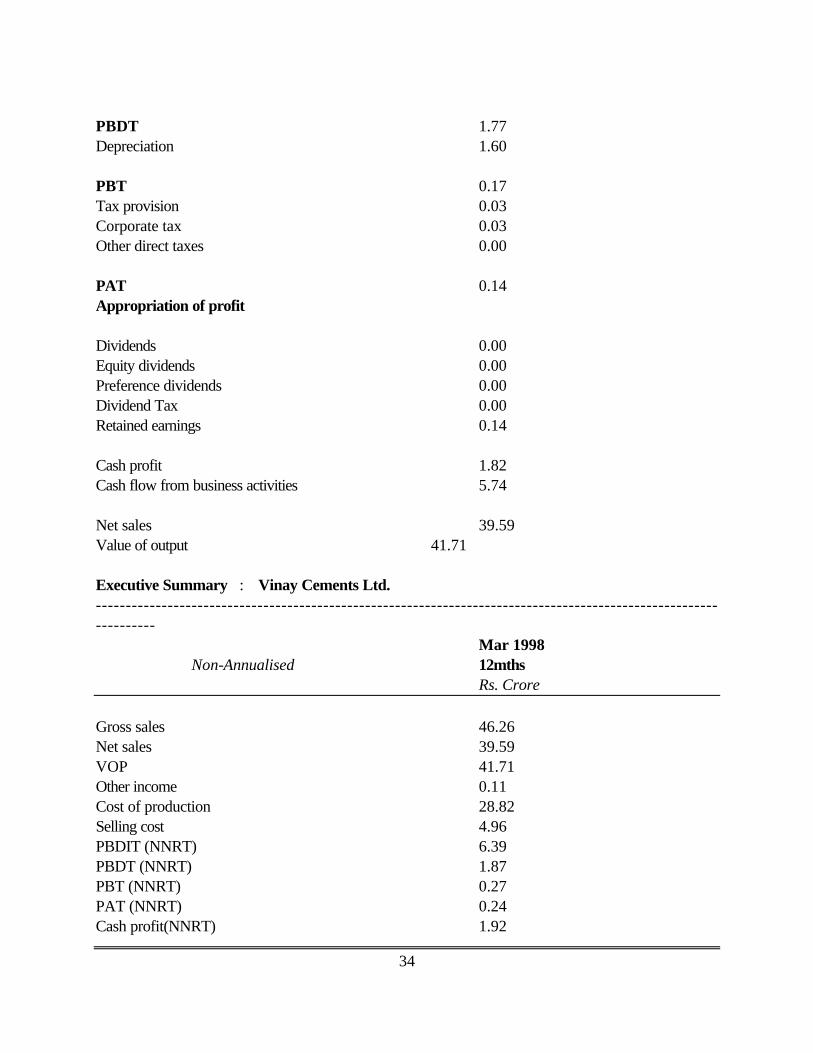
34
PBDT 1.77 Depreciation 1.60 PBT 0.17 Tax provision 0.03 Corporate tax 0.03 Other direct taxes 0.00 PAT 0.14 Appropriation of profit Dividends 0.00 Equity dividends 0.00 Preference dividends 0.00 Dividend Tax 0.00 Retained earnings 0.14 Cash profit 1.82 Cash flow from business activities 5.74 Net sales 39.59 Value of output 41.71 Executive Summary : Vinay Cements Ltd. ------------------------------------------------------------------------------------------------------------------
Mar 1998 Non-Annualised 12mths Rs. Crore Gross sales 46.26 Net sales 39.59 VOP 41.71 Other income 0.11 Cost of production 28.82 Selling cost 4.96 PBDIT (NNRT) 6.39 PBDT (NNRT) 1.87 PBT (NNRT) 0.27 PAT (NNRT) 0.24 Cash profit(NNRT) 1.92

35
Operating cash flow 5.74 Gross value added 9.29 Exports 0.36 Imports 0.04 Gross fixed assets (net of reval & W 30.66 Current assets 18.90 Net worth 10.85 Equity capital 7.50 Long term borrowings 20.99 Capital employed 31.84 Current liabilities & provisions 7.93 Total assets / liabilities (net of reval & misc. exp. n.w.o) 41.42 Break-even sales (%) 51.85 Margin of safety (%) 48.15 Growth (%) Gross sales 12.53 Net sales 13.67 Cost of production 21.37 GFA 4.78 Total assets 7.58 Margins (%) PBDIT (NNRT) / Sales 13.81 PBDT (NNRT) / Sales 4.04 PAT (NNRT) / Sales 0.52 PBDIT (NNRT) / Net sales 16.14 PBDT (NNRT) / Net sales 4.72 PAT (NNRT) / Net sales 0.61 Returns ratios (%) PAT / Net worth 2.23 PAT / Total assets 0.60 PBDIT / Total assets 15.99 PBDIT / Capital employed 20.12

36
Liquidity ratios Long term debt / equity (times) 1.93 Total debt / equity (times) 2.02 Current ratio (times) 2.38 Interest cover (times) 1.06 Gross working capital cycle (days) 141 Net working capital cycle (days) 98 Avg. days of debtors (days) 36 Avg. days of creditors (days) 43 VOP / Total assets 1.044 VOP / GFA (times) 1.392 Total R & D expenditure 0.00 R & D capital 0.00 R & D current 0.00

37
Hindustan Paper Corpn. Ltd. Registered office Head / Corporate office Vishal Bhawan Ruby Building 95, Nehru Place 75-C Park Street New Delhi Calcutta Pin 110019 Pin 700016 Incorporation year : 1970 Ownership group : Central Govt. - Commercial Enterprises Main activity : Paper BACKGROUND Hindustan Paper Corporation Limited was incorporated in 1970. The company was set up as a public sector undertaking, wholly owned by Government of India, to manufacture paper, paper boards, craft paper and news print and their distribution on equitable and rational basis in the country. Hindustan Paper was to act as a catalyst for ensuring adequate levels of investment in the paper industry and keep the prices stable in time of scarcity. The company has since then invested in three subsidiaries and set up two mills. Hindustan Paper Corporation took over a sick paper mill in Karnataka in 1974 and commenced commercial operations. The sick mill Mandya National Paper Mills was made a subsidiary of the company. The company entered into joint venture with Government of Nagaland to form Nagaland Pulp & Paper Company Limited. The joint venture subsidiary commenced commercial operation from November 1982. In 1983 Hindustan paper took over the business of The News Print Mill in Kerala and formed a subsidiary company Hindustan News Print Limited. The company started manufacturing paper and paper products from its own plant, Nagoan Paper Mill (Assam) in October 1985. its second manufacturing plant, Cacher Paper Mill in Assam commenced production in April 1988. ACTIVITY The company manufactures and distributes paper and paper products. The Company has its own paper mills manufacturing paper and paper products. Besides Hindustan Paper acts as a Holding company for three paper companies. OWNERSHIP

38
Hindustan Paper Corporation is a public sector undertaking by virtue of being its share owned by President of India. The company is wholly owned by Government of India. INFRASTRUCTURE Hindustan Paper has got five paper mills. Three of the mills are in the form of subsidiaries with independent board of directors. Two mills at Nagaoan and Cacher in Assam are in the forms of units directly under its control. Plant Location/Product Capacity/Units Production/Units 1 Cachar (Cachar, ASS) Writing & printing pap
100000.00 Tonnes
60009.00 Tonnes
2 Jagi (Morigaon, ASS) Writing & printing pap
100000.00 Tonnes
90174.00 Tonnes
Product/s Purchased/ Manufactured/ Traded
Capacity/ Units
Production Sales/ Units
Sales Quantity/ Units
Value Rs.Crore
Writing & Printing Paper 200000.00 138686.00 0.00 364.00 * Includes others a Included elsewhere Products Details Income & Expenditure :Hindustan Paper Corpn. Ltd.
Non-Annualised
Mar 2000 12mths
Rs.Crore Income Sale 449.17
Manufacturing 439.28 Trading 0.00 Fiscal benefits 0.00 Internal transfers 6.68 Others 3.21 Other income 23.65

39
Dividend received 0.41 Interest earned 22.49 Miscellaneous income 0.75 Change in stocks -2.28 Finished goods -2.56 Semi-finished goods 0.28 Non-recurring income 16.77 Gain on sale of assets 0.00 Gain on sales of investment 0.00 Provisions written back 1.61 Others 15.16 ExpenditureRaw materials, stores, etc. 143.87 Raw materials 80.59 Stores & spares 54.06 Packaging expenses 9.22 Purchase of finished goods 0.00 Wages & salaries 58.51 Energy (power & fuel) 67.77 Other manufacturing expenses 1.85 Indirect taxes 41.08 Excise duties 40.31 Repairs & maintenance 30.33 Plant & machinery 28.96 Other repairs 1.37 Selling & distribution expenses 65.45 Advertising 0.41 Marketing 21.47 Distribution 26.70 Provision for doubtful/bad debts 16.87 Amortisation 0.33 Miscellaneous expenses 14.66 Non-recurring expenses 10.28 Loss on sale of assets 0.00 Loss on sale of investment 0.00 Others 10.28

40
Less: Expenses capitalised 0.00 Interest capitalised 0.00 PBDIT 53.18 Interest 28.69 On short term loans 2.04 On long term loans 26.65 Lease rent 1.95 PBDT 22.54 Depreciation 11.93 PBT 10.61 Tax provision 0.01 Corporate tax 0.00 Other direct taxes 0.01 PAT 10.60 Appropriation of profitDividends 0.00 Equity dividends 0.00 Preference dividends 0.00 Dividend Tax 0.00 Retained earnings 10.60 Cash profit 22.86 Cash flow from business activities 0.00 Net sales 408.09 Value of output 405.81 Gross value added 110.22 Executive Summary : Hindustan Paper Corpn. Ltd.
Non-Annualised
Mar 2000 12mths
Rs.Crore Gross sales 449.17 Net sales 408.09 VOP 405.81 Other income 23.65 Cost of production 295.06 Selling cost 65.45 PBDIT (NNRT) 46.69 PBDT (NNRT) 16.05

41
PBT (NNRT) 4.12 PAT (NNRT) 4.11 Cash profit (NNRT) 16.37 Operating cash flow 0.00 Gross value added 110.22 Exports 26.90 Imports 2.84 Gross fixed assets (net of reval & W 688.70 Current assets 451.50 Net worth 102.28 Equity capital 554.73 Long term borrowings 208.07 Capital employed 310.35 Current liabilities & provisions 739.54 Total assets / liabilities (net of reval & misc. exp. n.w.o) 1049.89 Break-even sales (%) 90.36 Margin of safety (%) 9.64 Growth (%) Gross sales 5.11 Net sales 6.31 Cost of production 11.88 GFA 1.29 Total assets 3.04 Margins (%) PBDIT (NNRT) / Sales 10.39 PBDT (NNRT) / Sales 3.57 PAT (NNRT) / Sales 0.92 PBDIT (NNRT) / Net sales 11.44 PBDT (NNRT) / Net sales 3.93 PAT (NNRT) / Net sales 1.01 Returns ratios (%) PAT / Net worth 4.34 PAT / Total assests 0.40 PBDIT / Total assets 4.51 PBDIT / Capital employed 30.24
Liquidity ratios Long term debt / equity (times) 2.03

42
Total debt / equity (times) 2.03 Current ratio (times) 0.61 Interest cover (times) 1.13 Gross working capital cycle (days) 385 Net working capital cycle (days) 293 Avg. days of debtors (days) 100 Avg. days of creditors (days) 92 VOP / Total assets 0.392 VOP / GFA (times) 0.593 Total R & D expenditure 0.00 R & D capital 0.00 R & D current 0.00

43
Indian Oil Corpn. Ltd. Registered office Head / Corporate office Indian Oil Bhavan, Scope Complex, Core 2, G-9, Ali Yavar Jung Marg, 7, Institutional Area, Lodhi Road, Bandra (East), Mumbai, Maharashtra New Delhi Pin 400051 Pin 1-10003
Incorporation year : 1959
Ownership group : Central Govt. - Commercial Enterprises
Main activity : Refinery
Listed on : Bombay Stock Exchange National Stock Exchange Background Report Indian Oil Corporation is the largest company in the country ranked among the Fortune 500 companies in the world. It own the largest crude oil refining capacity of over 31 million tpa in the country. Its refineries are strategically spread across the country. IOC is also the market leader in the lube oil and lubricants segment, with over 32 per cent market share. IOC has the largest network of crude oil and product pipelines in India. The company makes lubricants and greases, wax/bitumen asphalt/lube oil drums and propylene recovery units. IOC is a public sector unit, with the government having an 81 per cent stake in its equity capital. Public sector oil company, ONGC has a 10 per cent stakeholding in IOC, while the rest is held by financial institutions, banks and the public. Indian Oil Corporation was incorporated in 1959 as Indian Oil Company. It was formed to organise the supply of petroleum products of the refineries of Indian Refineries Ltd at Guwahati, Assam and Barauni, Bihar. To ensure coordination between Indian Refineries Ltd and IOC, in 1964 the two were amalgamated to form a new company called Indian Oil Corporation Ltd. In 1964, the Barauni refinery was commissioned. In 1965--66, IOC started marketing LPG under the name `Indane' and in 1981, started producing LPG from Bombay High. As of March 1998, the company had 5026 consumer outlets, 6954 retail outlets and 3422 SKO/LDO (Light Diesel Oil) dealerships. IOC has 44 divisional offices, 33 Indane area offices, 185 terminals and depots and 50 LPG bottling plants and 2900 LPG distributors. Plant location /Product Capacity/Units Production/Units

44
1 Panipat (Panipat, HAR) Petroleum products [tonnes] 60.00 Lakh tonnes 0.00 Lakh tonnes 2 Mathura (Mathura, UP) Petroleum products [tonnes] 75.00 Lakh tonnes 0.00 Lakh tonnes 3 Berauni (Begusarai, BIH) Petroleum products [tonnes] 33.00 Lakh tonnes 0.00 Lakh tonnes 4 Haldia (Medinipur, WB) Petroleum products [tonnes] 37.50 Lakh tonnes 0.00 Lakh tonnes 5 Guwahati (Kamrup, ASS) Petroleum products [tonnes] 355.50 Lakh tonnes 303.79 Lakh tonnes 6 Digboi (Tinsukia, ASS) Petroleum products [tonnes] 6.50 Lakh tonnes 0.00 Lakh tonnes 7 Kayali (Vadodara, GUJ) Petroleum products [tonnes] 95.00 Lakh tonnes 0.00 Lakh tonnes 8 Chennai (Madras, TN) Lubricants & greases [tonnes] 206.00 '000 tonnes 121.00 '000 tonnes Executive Summary:Financial Performance Indian Oil Corpn. Ltd.
Non-Annualised
Mar 2000 12mths Rs.Crore
Gross sales 97275.48 Net sales 84420.07 VOP 88082.20 Other income 429.59 Cost of production 82961.32 Selling cost 328.63 PBDIT (NNRT) 5805.74 PBDT (NNRT) 4776.59 PBT (NNRT) 2790.10 PAT (NNRT) 2262.90

45
Cash profit(NNRT) 4249.39 Operating cash flow 135.33 Gross value added 7159.49 Exports 1303.31 Imports 40084.09 Gross fixed assets(net of reval & W) 23109.61 Current assets 25956.14 New worth 14064.75 Equity capital 778.67 Long term borrowings 5488.26 Capital employed 19553.01 Current liabilities & provisions 25029.28 Total assets / liabilities (net of reval & misc. exp. n.w.o) 42854.37 Break-even sales (%) 60.08 Margin of safety (%) 39.92 Growth (%) Gross sales 37.69 Net sales 34.69 Cost of production 55.23 GFA 34.14 Total assets 33.98 Margins (%) PBDIT (NNRT) / Sales 5.97 PBDT (NNRT) / Sales 4.91 PAT (NNRT) / Sales 2.33 PBDIT (NNRT) / Net sales 6.88 PBDT (NNRT) / Net sales 5.66 PAT (NNRT) / Net sales 2.68 Returns rations (%) PAT / Net worth 17.19 PAT / Total assets 6.05 PBDIT / Total assets 15.52 PBDIT / Capital employed 33.16 Liquidity ratios Long term debt / equity (times) 0.39 Total debt / equity (times) 1.05 Current ratio (times) 1.04

46
Interest cover (times) 3.71 Gross working capital cycle (days) 73 Net working capital cycle (days) 41 Avg. days of debtors (days) Avg. days of creditors (days) 32 VOP / Total assets 2.354 VOP / GFA (times) 4.367 Total R & D expenditure 77.40 R & D capital 39.40 R & D current 38.40 Income & Expenditure: IOC Mar 2000
12mths Rs.Crore
Income Sales 97275.48 Manufacturing 81873.38 Trading 12472.49 Fiscal benefits 1408.55 Internal transfers 1478.43 Others 42.63 Other income 429.59 Dividend received 92.16 Interest earned 181.15 Miscellaneous income 156.28 Change in stocks 3662.13 Finished goods 3392.48 Semi-finished goods 269.65 Non-recurring income 206.54 Gain on sale of assets 7.67 Gain on sales of investment 9.94 Provisions written back 6.47 Others 182.46 Expenditure Raw materials, stores, etc. 78343.80
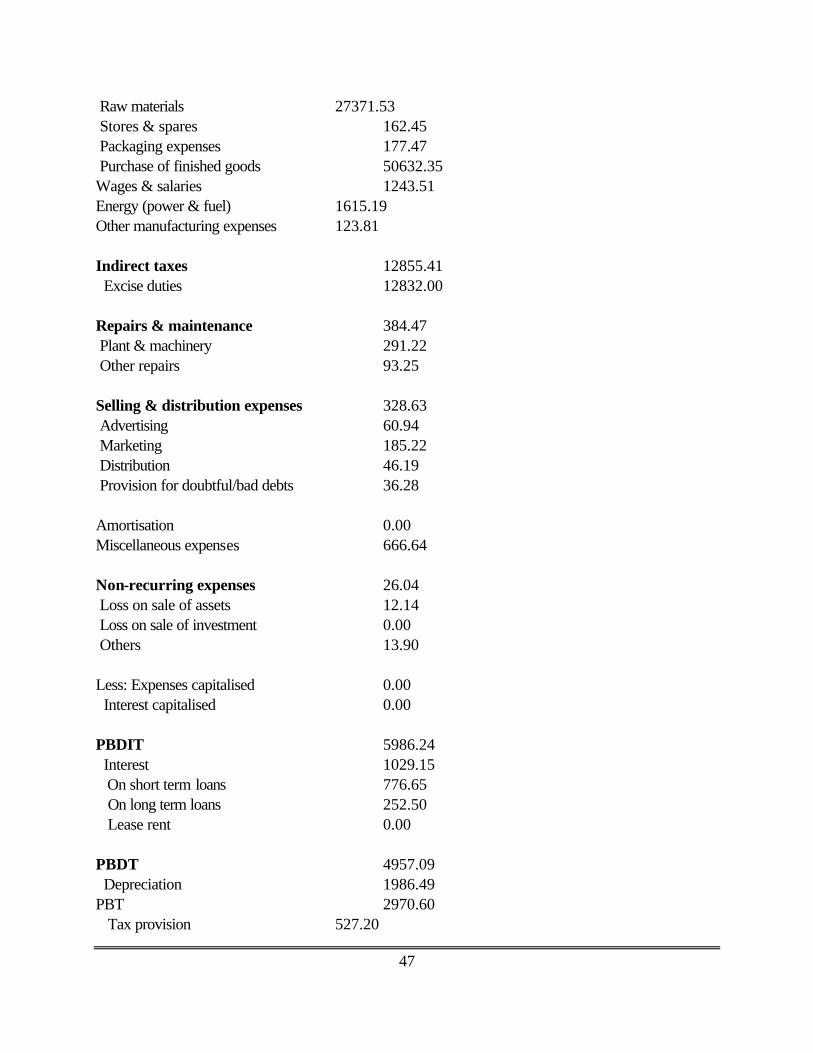
47
Raw materials 27371.53 Stores & spares 162.45 Packaging expenses 177.47 Purchase of finished goods 50632.35 Wages & salaries 1243.51 Energy (power & fuel) 1615.19 Other manufacturing expenses 123.81 Indirect taxes 12855.41 Excise duties 12832.00 Repairs & maintenance 384.47 Plant & machinery 291.22 Other repairs 93.25 Selling & distribution expenses 328.63 Advertising 60.94 Marketing 185.22 Distribution 46.19 Provision for doubtful/bad debts 36.28 Amortisation 0.00 Miscellaneous expenses 666.64 Non-recurring expenses 26.04 Loss on sale of assets 12.14 Loss on sale of investment 0.00 Others 13.90 Less: Expenses capitalised 0.00 Interest capitalised 0.00 PBDIT 5986.24 Interest 1029.15 On short term loans 776.65 On long term loans 252.50 Lease rent 0.00 PBDT 4957.09 Depreciation 1986.49 PBT 2970.60 Tax provision 527.20
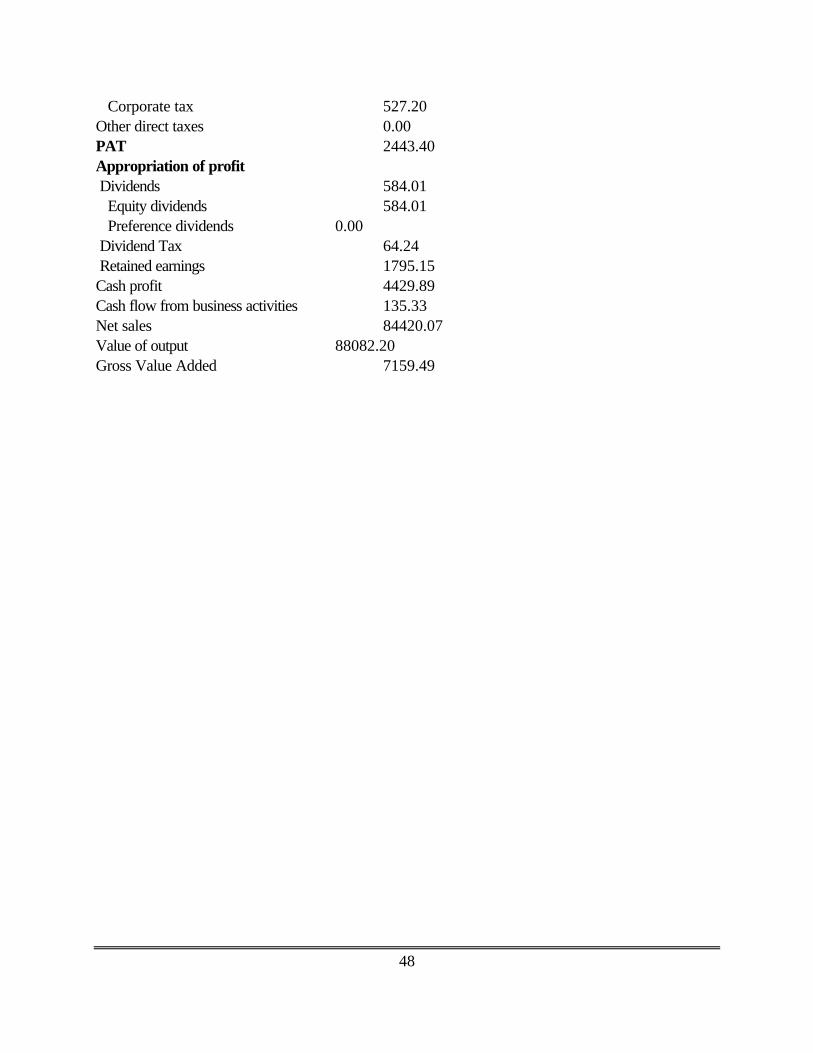
48
Corporate tax 527.20 Other direct taxes 0.00 PAT 2443.40 Appropriation of profit Dividends 584.01 Equity dividends 584.01 Preference dividends 0.00 Dividend Tax 64.24 Retained earnings 1795.15 Cash profit 4429.89 Cash flow from business activities 135.33 Net sales 84420.07 Value of output 88082.20 Gross Value Added 7159.49

49
India Carbon Ltd. Registered office Noonmati, Guwahati Assam. Pin 781020 Incorporation year : 1961 Ownership group : Himatsingka Group Main activity : Lubricants, etc. Plant Location/Product Capacity/Units Production/Units 1 Budge Budge (South 24 Parganas, WB) Calcined petroleum cok 60000.00 21296.00 Tonnes Tonnes 2 Noonmati (Kamrup, ASS) Electrode carbon paste 10000.00 789.00 Tonnes Tonnes Thermal carbon 3000.00 337.00 (tamping) paste Tonnes Tonnes Executive Summary: Financial Performance India Carbon Ltd. Mar 1998 12mths Non-Annualised Rs.Crore Gross sales 40.66 Net sales 35.26 VOP 35.33 Other income 0.49 Cost of production 29.84 Selling cost 1.82 PBDIT (NNRT) 2.26 PBDT (NNRT) 0.63 PBT (NNRT) 0.39 PAT (NNRT) 0.01 Cash profit(NNRT) 0.25 Operating cash flow -0.05

50
Gross value added 4.07 Exports 0.00 Imports 15.91 Gross fixed assets (net of reval & W 10.40 Current assets 13.72 Net worth 9.53 Equity capital 2.40 Long term borrowings 1.56 Capital employed 11.09 Current liabilities & provisions 8.45 Total assets / liabilities (net of reval & misc. exp. n.w.o) 19.19 Break-even sales (%) 102.26 Margin of safety (%) 0.00 Growth (%) Gross sales 5.91 Net sales 4.38 Cost of production 26.52 GFA 0.48 Total assets -18.76 Margins (%) PBDIT (NNRT) / Sales 5.56 PBDT (NNRT) / Sales 1.55 PAT (NNRT) / Sales 0.02 PBDIT (NNRT) / Net sales 6.41 PBDT (NNRT) / Net sales 1.79 PAT (NNRT) / Net sales 0.03 Returns ratios (%) PAT / Net worth 0.12 PAT / Total assets 0.05 PBDIT / Total assets 10.56 PBDIT / Capital employed 22.62 Liquidity ratios Long term debt / equity (times) 0.16 Total debt / equity (times) 0.66

51
Current ratio (times) 1.62 Interest cover (times) 1.24 Gross working capital cycle (days) 126 Net working capital cycle (days) 84 Avg. days of debtors (days) 42 Avg. days of creditors (days) 41 VOP / Total assets 1.651 VOP / GFA (times) 3.405 Total R & D expenditure 0.03 R & D capital 0.00 R & D current 0.03 Income & Expenditure: India Carbon Ltd. Mar 1998 12mths Non-Annualised Rs.Crore Income Sales 40.66 Manufacturing 40.37 Trading 0.00 Fiscal benefits 0.00 Internal transfers 0.00 Others 0.29 Other income 0.49 Dividend received 0.00 Interest earned 0.27 Miscellaneous income 0.22 Change in stocks 0.07 Finished goods 0.07 Semi-finished goods 0.00 Non-recurring income 3.12 Gain on sale of assets 0.02 Gain on sales of investment 0.00 Provisions written back Others 3.10 Expenditure Raw materials, stores, etc. 26.62 Raw materials 25.92

52
Stores & spares 0.70 Packaging expenses 0.00 Purchase of finished goods 0.00 Wages & salaries 1.73 Energy (power & fuel) 1.48 Other manufacturing expenses 0.15 Indirect taxes 5.40 Excise duties 5.35 Repairs & maintenance 0.33 Plant & machinery 0.14 Other repairs 0.19 Selling & distribution expenses 1.82 Advertising 0.02 Marketing 0.85 Distribution 0.88 Provision for doubtful/bad debts 0.07 Amortisation 0.00 Miscellaneous expenses 1.43 Non-recurring expenses 0.00 Loss on sale of assets 0.00 Loss on sale of investment 0.00 Others 0.00 Less:Expenses capitalised Interest capitalised 0.00 PBDIT 5.38 Interest 1.61 On short term loans 1.60 On long term loans 0.01 Lease rent 0.02 PBDT 3.75 Depreciation 0.24 PBT 3.51 Tax provision 0.38 Corporate taxOther direct taxes 0.00 PAT 3.13 Appropriation of profit Dividends 0.37

53
Equity dividends 0.36 Preference dividends 0.01 Dividend Tax 0.03 Retained earnings 2.73 Cash profit 3.37 Cash flow from business activities - 0.05 Net sales 35.26 Value of output 35.33 India Carbon Ltd. Mar 1997
Product/s Purchased/ Manufactured/ Traded
Capacity/ Units
Production Sales/ Units
Sales Quantity/ Units
Value Rs.Crore
Calcined petroleum coke 120000.00 Tonnes
33784.00 Tonnes
41393.00 Tonnes
37.41
Electrode carbon paste 10000.00 Tonnes
734.00 Tonnes
632.00 Tonnes
0.90
Calcined anthracite coal Tonnes
5000.00 0.00 0.00 0.00
Thermal carbon ping) paste
3000.00 Tonnes
40.00 Tonnes
0.00
0.00
Carbon/graphite cements & surface prim
1000.00 Tonnes
1.00 Tonnes
0.00 0.00
Others 0.00 0.00 0.00 0.09 Raw petroleum coke 0.00 0.00 401.00 0.22 * Includes others a Included elsewhere Products Details

54
Jay Shree Tea & Inds. Ltd. Registered office Industry House, 10, Camac Street, Calcutta, West Bengal Pin 700017 Incorporation year : 1945 Ownership group : Birla B.K. Group Main activity : Tea Listed on : Bombay Stock Exchange Calcutta Stock Exchange Delhi Stock Exchange National Stock Exchange Plant Locatin/Product Capacity/Units Production/Units 1 Putaudi (Gurgaon, HAR) Superphospate 50.04 25.77 '000 tonnes '000 tonnes Sulphuric acid 26.10 19.12
'000 tonnes '000 tonnes 2 Magarwara (Unnao, UP) Superphospate 54.59 28.12
'000 tonnes '000 tonnes Sulphuric acid 19.77 14.48
'000 tonnes '000 tonnes Sodium silico fluoride 0.00 0.00 Tonnes 3 Liza Hill (Darjiling, WB) Black tea 0.00 0.08
'000 tonnes '000 tonnes 4 Risheehat (Darjiling, WB)

55
Black tea 0.00 0.21 '000 tonnes '000 tonnes
5 Khardah (North 24 Parganas, WB) Superphospate 121.09 62.37
'000 tonnes '000 tonnes Granulated single supe 34.00 32.95
'000 tonnes '000 tonnes Sulphuric acid 49.83 36.33
'000 tonnes '000 tonnes 6 Burtoll (Cachar, ASS) Black tea 18.00 1.55
'000 tonnes '000 tonnes 7 Dewan (Cachar, ASS) Black tea 0.00 2.05
'000 tonnes '000 tonnes 8 Jallalpore (Cachar, ASS) Black tea 0.00 0.65
'000 tonnes '000 tonnes 9 Kalline (Cachar, ASS) Black tea 0.00 1.19
'000 tonnes '000 tonnes 10 Labac (Cachar, ASS) Black tea 0.00 1.37 '000 tonnes '000 tonnes 11 Tukvar (Cachar, ASS) Black tea 0.00 0.20
'000 tonnes '000 tonnes 12 Manani (Jorhat, ASS) Plywood, finished 4000.00 627.61
'000 sq.metres '000 sq.metres Semi-finished sawn tim 6000.00 565.00 Ber Cubic metres Cubic metres 13 Mangalam (Sibsagar, ASS) Black tea 0.00 0.89
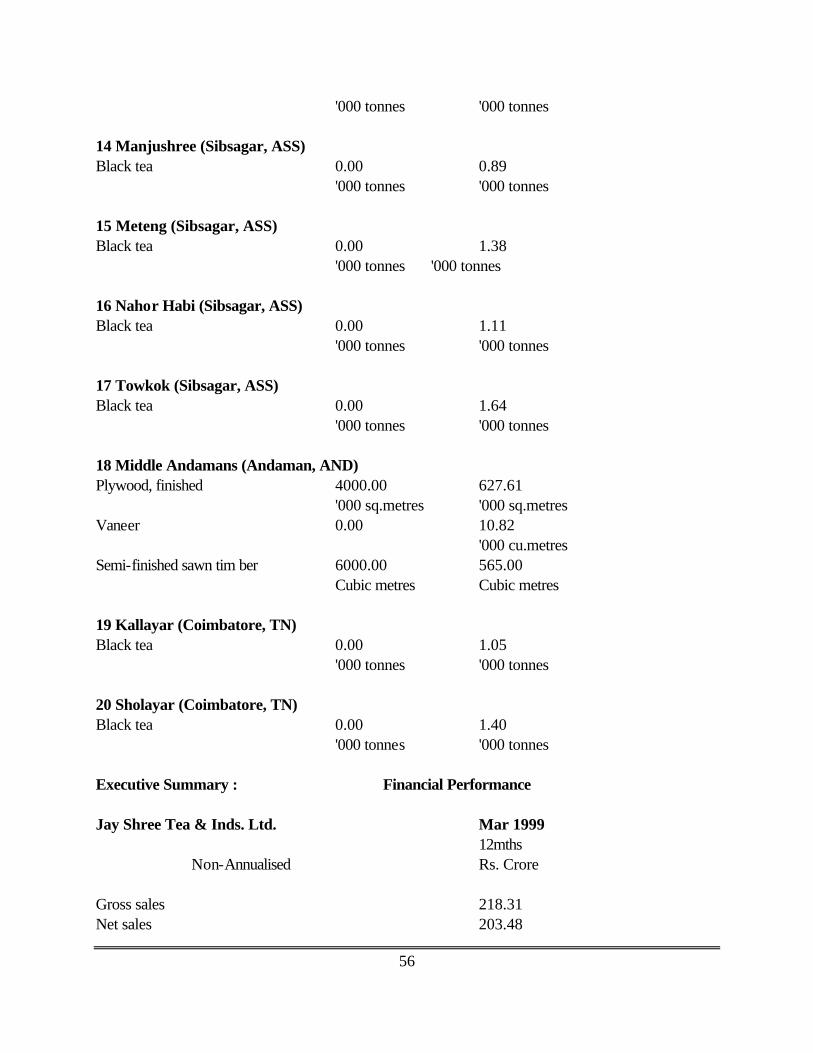
56
'000 tonnes '000 tonnes 14 Manjushree (Sibsagar, ASS) Black tea 0.00 0.89
'000 tonnes '000 tonnes 15 Meteng (Sibsagar, ASS) Black tea 0.00 1.38 '000 tonnes '000 tonnes 16 Nahor Habi (Sibsagar, ASS) Black tea 0.00 1.11
'000 tonnes '000 tonnes 17 Towkok (Sibsagar, ASS) Black tea 0.00 1.64
'000 tonnes '000 tonnes 18 Middle Andamans (Andaman, AND) Plywood, finished 4000.00 627.61
'000 sq.metres '000 sq.metres Vaneer 0.00 10.82
'000 cu.metres Semi-finished sawn tim ber 6000.00 565.00 Cubic metres Cubic metres 19 Kallayar (Coimbatore, TN) Black tea 0.00 1.05
'000 tonnes '000 tonnes 20 Sholayar (Coimbatore, TN) Black tea 0.00 1.40
'000 tonnes '000 tonnes
Executive Summary : Financial Performance Jay Shree Tea & Inds. Ltd. Mar 1999 12mths Non-Annualised Rs. Crore Gross sales 218.31 Net sales 203.48

57
VOP 208.14 Other income 10.27 Cost of production 124.08 Selling cost 15.13 PBDIT (NNRT) 50.67 PBDT (NNRT) 42.31 PBT (NNRT) 38.29 PAT (NNRT) 25.89 Cash profit (NNRT) 29.91 Operating cash flow 53.28 Gross value added 110.36 Exports 20.47 Imports 19.35 Gross fixed assets (net of reval & W 115.40 Current assets 120.94 Net worth 143.47 Equity capital 12.30 Long term borrowings 52.27 Capital employed 195.74 Current liabilities & provisions 36.64 Total assets / liabilities (net of reval & misc. exp. n.w.o) 231.34 Break-even sales (%) 53.53 Margin of safety (%) 46.47 Growth (%) Gross sales -3.30 Net sales -3.71 Cost of production 0.63 GFA 7.00 Total assets 14.98 Margins (%) PBDIT (NNRT) / Sales 23.21 PBDT (NNRT) / Sales 19.38 PAT (NNRT) / Sales 11.86 PBDIT (NNRT) / Net sales 24.90 PBDT (NNRT) / Net sales 20.79 PAT (NNRT) / Net sales 12.72 Returns ratios (%)

58
PAT / Net worth 19.56 PAT / Total assets 11.97 PBDIT / Total assets 23.43 PBDIT / Capital employed 28.23 Liquidity ratios Long term debt / equity (times) Total debt / equity (times) 0.39 Current ratio (times) 3.30 Interest cover (times) 5.58 Gross working capital cycle (days) 212 Net working capital cycle (days) 170 Avg. days of debtors (days) 66 Avg. days of creditors (days) 43 VOP / Total assets 0.962 VOP / GFA (times) 1.865 Total R & D expenditure 0.00 R & D capital 0.00 R & D current 0.00 Income & Expenditure : Jay Shree Tea & Inds. Ltd . Mar 1999 12mths Non-Annualised Rs. Crore Income Sales 218.31 Manufacturing 195.71 Trading 0.00 Fiscal benefits 14.51 Internal transfers 0.17 Others 7.92 Other income 10.27 Dividend received 0.45 Interest earned 7.66 Miscellaneous income 2.16 Change in stocks 4.66 Finished goods 3.84

59
Semi-finished goods 0.82 Non-recurring income 1.76 Gain on sale of assets 0.24 Gain on sales of investment 0.00 Provisions written back 0.00 Others 1.52 Expenditure Raw materials, stores, etc. 60.84 Raw materials 39.64 Stores & spares 8.74 Packaging expenses 5.38 Purchase of finished goods 7.08 Wages & salaries 59.30 Energy (power & fuel) 14.04 Other manufacturing expenses 2.10 Indirect taxes 14.83 Excise duties 0.00 Repairs & maintenance 7.60 Plant & machinery 2.39 Other repairs 5.21 Selling & distribution expenses 15.13 Advertising 0.00 Marketing 6.01 Distribution 8.32 Provision for doubtful/bad debts 0.80 Amortisation 0.00 Miscellaneous expenses 8.73 Non-recurring expenses 0.00 Loss on sale of assets 0.00 Loss on sale of investment 0.00 Others 0.00 Less: Expenses capitalised 0.00 Interest capitalised 0.00 PBDIT 52.43 Interest 8.36

60
On short term loans 2.49 On long term loans 5.87 Lease rent 0.00 PBDT 44.07 Depreciation 4.02 PBT 40.05 Tax provision 12.40 Corporate tax 12.40 Other direct taxes 0.00 PAT 27.65 Appropriation of profit Dividends 5.41 Equity dividends 4.92 Preference dividends 0.49 Dividend Tax 0.00 Retained earnings 22.24 Cash profit 31.67 Cash flow from business activities 53.28 Net sales 203.48 Value of output 208.14 Gross value added 110.36

61
Jorehaut Group Ltd. Registered office Head / Corporate office P.O. Cinnamara 26, Shakespeare Sarani Jorhat Calcutta Assam Pin 700017 Pin 785008 Incorporation year : 1975 Ownership group : Private (Indian) Main activity : Tea Plant Location/product Capacity/Units Production/Units
1 Jorehat (Jorhat, ASS) Tea 0.00 3.17
'000 tonnes
Executive Summary: Financial Performance
Mar 1999 12mths Non-Annualised Rs. Crore Gross sales 31.07 Net sales 30.52 VOP 31.61 Other income 0.01 Cost of production 18.50 Selling cost 3.46 PBDIT (NNRT) 2.58 PBDT (NNRT) 0.92 PBT (NNRT) 0.59 PAT (NNRT) 0.39 Cash profit (NNRT) 0.72 Operating cash flow 0.00 Gross value added 18.73 Exports 0.00 Imports 0.23 Gross fixed assets (net of reval & W 11.23 Current assets 9.83

62
Net worth 3.87 Equity capital 0.50 Long term borrowings 1.15 Capital employed 5.02 Current liabilities & provisions 12.31 Total assets / liabilities (net of reval & misc. exp. n.w.o) 17.33 Break-even sales (%) 94.19 Margin of safety (%) 5.81 Growth (%) Gross sales 16.80 Net sales 16.85 Cost of production 21.52 GFA 7.98 Total assets -7.77 Margins (%) PBDIT (NNRT) / Sales 8.30 PBDT (NNRT) / Sales 2.96 PAT (NNRT) / Sales 1.26 PBDIT (NNRT) / Net sales 8.45 PBDT (NNRT) / Net sales 3.01 PAT (NNRT) / Net sales 1.28 Returns ratios (%) PAT / Net worth 10.55 PAT / Total assets 2.16 PBDIT / Total assets 14.29 PBDIT / Capital employed 55.48 Liquidity ratios Long term debt / equity (times) 0.30 Total debt / equity (times) 1.75 Current ratio (times) 0.80 Interest cover (times) 1.36 Gross working capital cycle (days) 232 Net working capital cycle (days) 140 Avg. days of debtors (days) 2 Avg. days of creditors (days) 92 VOP / Total assets 1.750 VOP / GFA (times) 2.923 Total R & D expenditure 0.00 R & D capital 0.00 R & D current 0.00
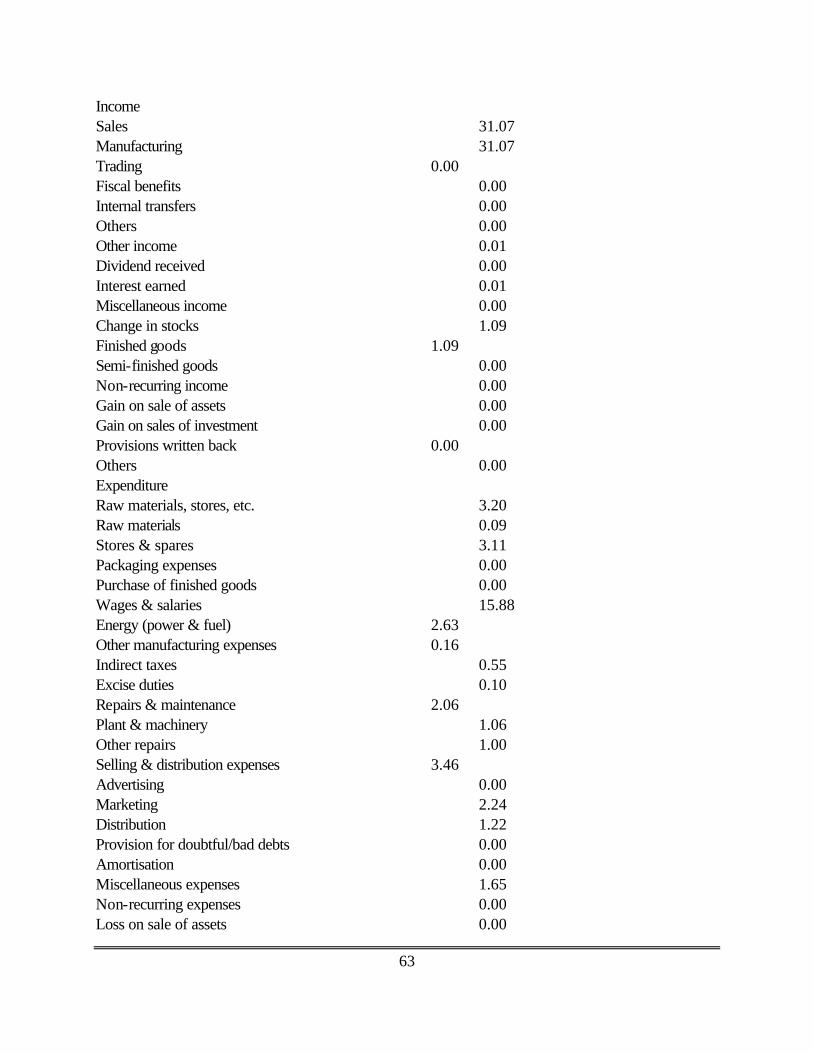
63
Income Sales 31.07 Manufacturing 31.07 Trading 0.00 Fiscal benefits 0.00 Internal transfers 0.00 Others 0.00 Other income 0.01 Dividend received 0.00 Interest earned 0.01 Miscellaneous income 0.00 Change in stocks 1.09 Finished goods 1.09 Semi-finished goods 0.00 Non-recurring income 0.00 Gain on sale of assets 0.00 Gain on sales of investment 0.00 Provisions written back 0.00 Others 0.00 Expenditure Raw materials, stores, etc. 3.20 Raw materials 0.09 Stores & spares 3.11 Packaging expenses 0.00 Purchase of finished goods 0.00 Wages & salaries 15.88 Energy (power & fuel) 2.63 Other manufacturing expenses 0.16 Indirect taxes 0.55 Excise duties 0.10 Repairs & maintenance 2.06 Plant & machinery 1.06 Other repairs 1.00 Selling & distribution expenses 3.46 Advertising 0.00 Marketing 2.24 Distribution 1.22 Provision for doubtful/bad debts 0.00 Amortisation 0.00 Miscellaneous expenses 1.65 Non-recurring expenses 0.00 Loss on sale of assets 0.00

64
Loss on sale of investment 0.00 Others 0.00 Less: Expenses capitalised 0.00 Interest capitalised 0.00 PBDIT 2.58 Interest 1.41 On short term loans 1.41 On long term loans 0.00 Lease rent 0.25 PBDT 0.92 Depreciation 0.33 PBT 0.59 Tax provision 0.20 Corporate tax 0.20 Other direct taxes 0.00 PAT 0.39 Appropriation of profit Dividends 0.04 Equity dividends 0.04 Preference dividends 0.00 Dividend Tax 0.00 Retained earnings 0.35 Cash profit 0.72 Cash flow from business activities 0.00 Net sales 30.52 Value of output 31.61 Gross value added 18.73

65
Kothari Plantations & Inds. Ltd. Registered office 8, India Excahange Place Calcutta Pin 700001 Incorporation year : 1897 Ownership group : Private (Indian) Main activity : Tea Plant Location/Product Capacity/Units Production/Units 1 D+llabcherra (Cachar, ASS) Tea 0.00 0.92 '000 tonnes '000tonnes 2 Arun (Darrang, ASS) Tea 0.00 0.51 '000 tonnes '000 tonnes 3 D+erai (Darrang, ASS) Tea 0.00 1.27 '000 tonnes '000 tonnes 4 Borkatonee (Sibsagar, ASS) Tea 4.50 0.41 '000 tonnes '000 tonnes 5 Dooria (Sibsagar, ASS) Tea 0.00 0.63 '000 tonnes '000 tonnes 6 Gorunga (Sibsagar, ASS) Tea 0.00 0.49 '000 tonnes '000 tonnes 7 Madurai (Madurai, TN) Formaldehyde 6000.00 3344.03 Tonnes Tonnes Brucine sulphate 0.00 9.43 Tonnes Tonnes Chloropropamide 0.00 60.14 Tonnes Tonnes Rice bran extraction 55.00 13.20 '000 tonnes '000 tonnes
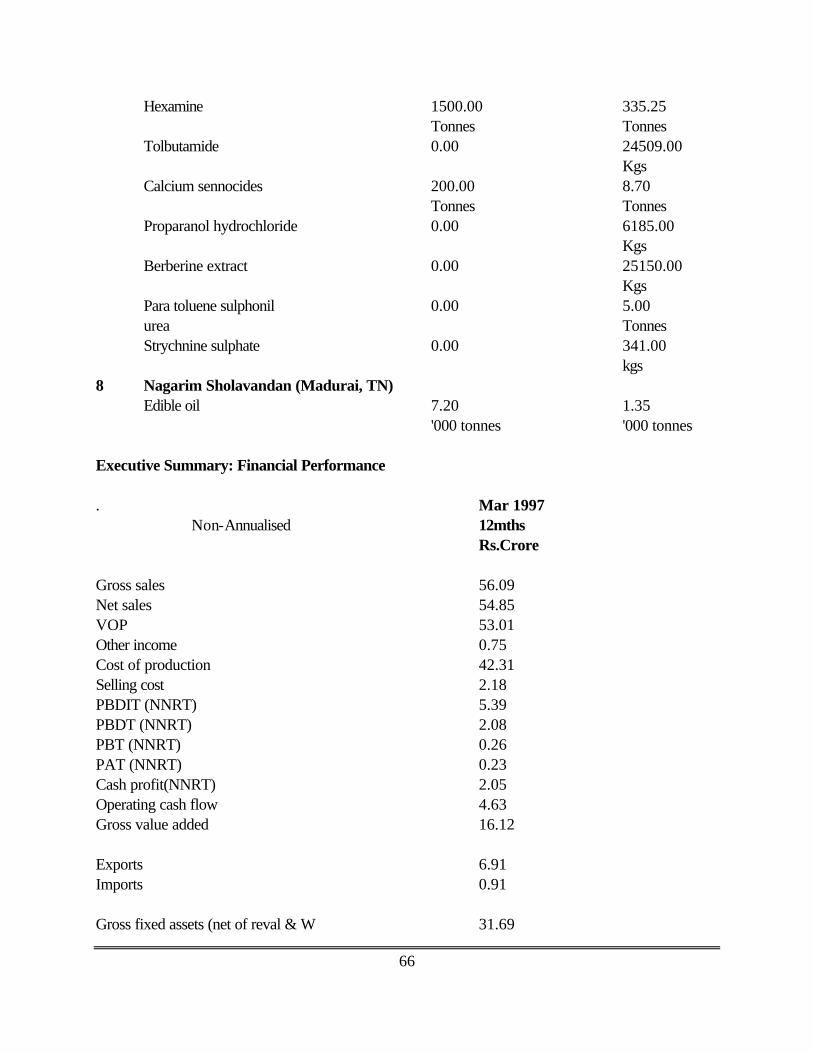
66
Hexamine 1500.00 335.25 Tonnes Tonnes Tolbutamide 0.00 24509.00 Kgs Calcium sennocides 200.00 8.70 Tonnes Tonnes Proparanol hydrochloride 0.00 6185.00 Kgs Berberine extract 0.00 25150.00 Kgs Para toluene sulphonil 0.00 5.00 urea Tonnes Strychnine sulphate 0.00 341.00 kgs 8 Nagarim Sholavandan (Madurai, TN) Edible oil 7.20 1.35 '000 tonnes '000 tonnes Executive Summary: Financial Performance . Mar 1997 Non-Annualised 12mths Rs.Crore Gross sales 56.09 Net sales 54.85 VOP 53.01 Other income 0.75 Cost of production 42.31 Selling cost 2.18 PBDIT (NNRT) 5.39 PBDT (NNRT) 2.08 PBT (NNRT) 0.26 PAT (NNRT) 0.23 Cash profit(NNRT) 2.05 Operating cash flow 4.63 Gross value added 16.12 Exports 6.91 Imports 0.91 Gross fixed assets (net of reval & W 31.69

67
Current assets 14.90 Net worth 10.75 Equity capital 3.84 Long term borrowings 8.82 Capital employed 19.57 Current liabilities & provisions 14.48 Total assets/liabilities (net of reval & misc. exp. n.w.o) 34.05 Break-even sales (%) 92.40 Margin of safety (%) 7.60 Growth (%) Gross sales -7.84 Net sales -7.28 Cost of production -17.50 GFA 8.05 Total assets -10.82 Margins (%)PBDIT (NNRT)/Sales 9.61 PBDT (NNRT)/Sales 3.71 PAT (NNRT)/Sales 0.41 PBDIT (NNRT)/Net sales 9.83 PBDT (NNRT)/Net sales 3.79 PAT (NNRT)/Net sales 0.42 Returns ratios (%) PAT/Net worth 2.14 PAT/Total assets 0.64 PBDIT/Total assets 14.92 PBDIT/Capital employed 28.09 Liquidity ratios Long term debt/equity (times) 0.82 Total debt/equity (times) 1.42 Current ratio (times) 1.03 Interest cover (times) 1.08 Gross working capital cycle (days) 175 Net working capital cycle (days) 123 Avg. days of debtors (days) 30 Avg. days of creditors (days) 52

68
VOP/Total assets 1.468 VOP/GFA (times) 1.737 Total R & D expenditure 0.00 R & D capital 0.00 R & D current 0.00 IncomeSales 56.09 Manufacturing 38.76 Trading 16.93 Fiscal benefits 0.26 Internal transfers 0.10 Others 0.04 Other income 0.75 Dividend received 0.01 Interest earned 0.52 Miscellaneous income 0.22 Change in stocks -1.84 Finished goods -2.05 Semi-finished goods 0.21 Non-recurring income 0.14 Gain on sale of assets 0.00 Gain on sales of investment 0.00 Provisions written back 0.00 Others 0.14 Expenditure Raw materials, stores, etc. 28.76 Raw materials 10.24 Stores & spares 2.83 Packaging expenses 0.00 Purchase of finished goods 15.69 Wages & salaries 10.68 Energy (power & fuel) 3.14 Other manufacturing expenses 0.44 Indirect taxes 1.24 Excise duties 1.16 Repairs & maintenance 1.29 Plant & machinery 0.88 Other repairs 0.41 Selling & distribution expenses 2.18 Advertising 0.00

69
Marketing 0.61 Distribution 1.57 Provision for doubtful/bad debts 0.00 Amortisation 0.00 Miscellaneous expenses 1.88 Non-recurring expenses 0.06 Loss on sale of assets 0.06 Loss on sale of investment 0.00 Others 0.00 Less: Expenses capitalised 0.00 Interest capitalised 0.00 PEDIT 5.47 Interest 3.31 On short term loans 2.05 On long term loans 1.26 Lease rent 0.00 PBDT 2.16 Depreciation 1.82 PBT 0.34 Tax provision 0.03 Corporate tax 0.03 Other direct taxes 0.00 PAT 0.31 Appropriation of profit Dividends 0.29 Equity dividends 0.29 Preference dividends 0.00 Dividend Tax 0.03 Retained earnings -0.01 Cash profit 2.13 Cash flow from business activities 4.63 Net sales 54.85 Value of output 53.01 Gross value added 16.12

70
Mcleod Russel (India) Ltd. [Erstwhile] Registered office Four Mangoe Lane, (7th Floor) Surendra Mohan Ghosh Sarani Calcutta Pin 700001 Incorporation year : 1976 Ownership group : Williamson Magor Group Main activity : Tea & Coffee Listed on : Bombay Stock Exchange Calcutta Stock Exchange Gauhati Stock Exchange National Stock Exchange Mcleod Russel (India) Ltd. was incorporated on 19 March, 1976 in the State of West Bengal as a public limited company. In pursuance of its objects the company became party to Seven Schemes of Arrangement for Amalgamation, whereby the assets, liabilities and undertakings in India of the Seven Sterling Companies (the names of which are set out below) had been merged with the company with effect from 1 January, 1977. Their assets in India as at the transfer date comprised inter-allia twelve tea estates of which area under cultivation was 6685.70 hectares. (1) The Bengal United Tea Co. Ltd. (2) The British Assam Tea Co. Ltd. (3) The Cachar & Doars Tea Co.Ltd. (4) The Gingia Tea Co.Ltd. (5) The Halem Tea Co. Ltd. (6) The Hunwal Tea Co. Ltd. and (7) The Imperial Tea Co. Ltd. The total valuation of the undertaking of the seven Sterling Companies has however been fixed by the Reserve Bank of India. It made a public issue in 1978. In 1980 it made its Bonus Issue. The company presently has 21 Tea gardens of which 13 are in Assam and 8 are in West Bengal. The company has a polypack brand Premium Gold' in the domestic retail market. The Subsidiaries are: (1) Faith Investments Ltd., (2) Union Carbide India Ltd., (3) Nepal Battery Co.Ltd. and (4) Natex Marketing Ltd. The company belongs to Williamson Magor Group of companies which is headed by Mr.B.M. Khaitan. Plant Location/Product Capacity/Units Production/Units 1 Glenburn (Darjiling, WB) Tea 0.00 0.14 ' 000 tonnes '000 tonnes 2 Lingia (Darjiling, WB)

71
Tea 0.00 0.07 '000 tonnes '000 tonnes 3 Nagri Farm (Darjiling, WB) Tea 0.00 0.23 '000 tonnes '000 tonnes 4 Soom (Darjiling, WB) Tea 0.00 0.14 '000 tonnes '000 tonnes 5 Central Dooars (Jalpaiguri, WB) Tea 0.00 1.35 '000 tonnes '000 tonnes 6 Chuapara (Jalpaiguri, WB) Tea 0.00 1.26 '000 tonnes '000 tonnes 7 Jaint (Jalpaiguri, WB) 0.00 0.82 Tea ‘ 000 tonnes '000 tonnes 8 Matelli (Jalpaiguri, WB) Tea 0.00 1.07 ‘000 tonnes '000 tonnes 9 Mathura (Jalpaiguri, WB) 0.00 0.91 Tea '000 tonnes '000 tonnes 10 Bhatpara (Koch Bihar, WB) 0.00 0.94 Tea '000 tonnes '000 tonnes 11 Bogapani (Dibrugarh, ASS) 0.00 1.83 Tea '000 tonnes '000 tonnes 12 Dehing (Dibrugarh, ASS) 0.00 1.03 Tea '000 tonnes '000 tonnes 13 Dirok (Dibrugarh, ASS) 0.00 1.34 Tea '000 tonnes '000 tonnes 14 Margherita (Dibrugarh, ASS) 0.00 1.08 Tea '000 tonnes '000 tonnes 15 Namdang (Dibrugarh, ASS) 0.00 1.41 Tea '000 tonnes '000 tonnes 16 Hunwal (Sibsagar, ASS) 0.00 1.33 Tea ‘000 tonnes '000 tonnes 17 Addabarie (Sonitpur, ASS) 28.99 1.51 Tea '000 tonnes '000 tonnes 18 Gingia (Sonitpur, ASS) 0.00 0.82 Tea '000 tonnes '000 tonnes 19 Halem (Sonitpur, ASS) 0.00 0.97 Tea '000 tonnes '000 tonnes 20 Monabarie (Sonitpur, ASS) 0.00 2.54

72
Tea '000 tonnes '000 tonnes 21 Nya Gogra (Sonitpur, ASS) 0.00 1.10 Tea '000 tonnes '000 tonnes 22 Taraulie (Sonitpur, ASS) 0.00 0.88 Tea '000 tonnes '000 tonnes 23 Tezpore & Gogra (Sonitpur, ASS) 0.00 0.93 Tea '000 tonnes '000 tonnes Executive Summary: Financial Performance Mar 1996 12mths Non-Annualised Rs.Crore Gross sales 145.74 Net sales 143.06 VOP 144.83 Other income 22.66 Cost of production 79.67 Selling cost 17.16 PBDIT (NNRT) 35.76 PBDT (NNRT) 8.55 PBT (NNRT) 3.80 PAT (NNRT) 3.80 Cash profit(NNRT) 12.31 Operating cash flow 18.23 Gross value added 100.42 Exports 39.55 Imports 5.43 Gross fixed assets (net of reval & W) 218.27 Current assets 153.89 Net worth 350.28 Equity capital 29.83 Long term borrowings 155.88 Capital employed 506.16 Current liabilities & provisions 119.85 Total assets/liabilities (net of reval & misc. exp. n.w.o) 623.17 Break-even sales (%) 131.87 Margin of safety (%) 0.00

73
Growth (%)Gross sales 6.62 Net sales 6.86 Cost of production 14.02 GFA 10.61 Total assets 6.02 Margins (%) PBDIT (NNRT)/Sales 24.54 PBDT (NNRT)/Sales 5.87 PAT (NNRT)/Sales 2.61 PBDIT (NNRT)/Net sales 25.00 PBDT (NNRT) / Net sales 5.98 PAT (NNRT) / Net sales 2.66 Returns ratios (%) PAT / Net worth 1.53 PAT / Total assets 0.63 PBDIT / Total assets 5.91 PBDIT / Capital employed 6.87 Liquidity ratios Long term debt / equity (times) 0.45 Total debt / equity (times) 0.65 Current ratio (times) 1.28 nterest cover (times) 1.14 Gross working capital cycle (days) 240 Net working capital cycle (days) 124 Avg. days of debtors (days) 19 Avg. days of creditors (days) 115 VOP / Total assets 0.239 VOP / GFA (times) 0.697 Total R & D expenditure 0.25 R & D capital 0.00 R & D current 0.25 Income & Expenditure: Russel (India) Ltd. Mar 1996 Non-Annualised 12mths

74
Rs.Crore Income Sales 145.74 Manufacturing 145.17 Trading 0.57 Fiscal benefits 0.00 Internal transfers 0.00 Others 0.00 Other income 22.66 Dividend received 6.80 Interest earned 15.09 Miscellaneous income 0.77 Change in stocks 1.77 Finished goods 1.77 Semi-finished goods 0.00 Non-recurring income 24.20 Gain on sale of assets 5.17 Gain on sales of investment 19.00 Provisions written back 0.03 Others 0.00 Expenditure Raw materials, stores, etc. 13.81 Raw materials 0.00 Stores & spares 13.45 Packaging expenses 0.00 Purchase of finished goods 0.36 Wages & salaries 60.73 Energy (power & fuel) 13.91 Other manufacturing expenses 1.61 Indirect taxes 2.68 Excise duties 0.36 Repairs & maintenance 10.41 Plant & machinery 3.08 Other repairs 7.33 Selling & distribution expenses 17.16 Advertising 0.00 Marketing 4.67

75
Distribution 12.49 Provision for doubtful/bad debts 0.00 Amortisation 3.76 Miscellaneous expenses 10.34 Non-recurring expenses 0.00 Loss on sale of assets 0.00 Loss on sale of investment 0.00 Others 0.00 Less: Expenses capitalised 0.00 Interest capitalised 0.00 PBDIT 59.96 Interest 23.60 On short term loans 21.55 On long term loans 2.05 Lease rent 3.61 PBDT 32.75 Depreciation 4.75 PBT 28.00 Tax provision 0.00 Corporate tax 0.00 Other direct taxes 0.00 PAT 28.00 Appropriation of profit Dividends 12.01 Equity dividends 12.01 reference dividends 0.00 Dividend Tax 0.00 Retained earnings 15.99 Cash profit 36.51 Cash flow from business activities 18.23 Net sales 143.06 Value of output 144.83 Gross value added 100.42

76
Kamrup Roofings Ltd.
Registered office Saraf Building Annexe, 2nd Floor, A. T. Road, Guwahati, Pin 781001 Assam Incorporation year : 1986 Ownership group : Private (Indian) Main activity : Finished steel Listed on : Executive Summary : Financial Performance Kamrup Roofings Ltd. Mar 1999 12mths Non-Annualised Rs. Crore Gross sales 21.48 Net sales 18.59 VOP 17.91 Other income 0.03 Cost of production 16.05 Selling cost 0.17 PBDIT (NNRT) 1.60 PBDT (NNRT) 0.39 PBT (NNRT) 0.21 PAT (NNRT) 0.21 Cash profit(NNRT) 0.39 Operating cash flow 0.00 Gross value added 2.14 Exports 0.00 Imports 0.00 Gross fixed assets (net of reval & W 3.63 Current assets 13.07 Net worth 0.61 Equity capital 3.00 Long term borrowings 3.95 Capital employed 4.56 Current liabilities & provisions 9.43

77
Total assets / liabilities (net of reval & misc. exp. n.w.o) 13.99 Break-even sales (%) 34.97 Margin of safety (%) 65.03 Growth (%) Gross sales 16.42 Net sales 15.47 Cost of production 14.27 GFA 0.28 Total assets 1.45 Margins (%) PBDIT (NNRT) / Sales 7.45 PBDT (NNRT) / Sales 1.82 PAT (NNRT) / Sales 0.98 PBDIT (NNRT) / Net sales 8.61 PBDT (NNRT) / Net sales 2.10 PAT (NNRT) / Net sales 1.13 Returns ratios (%) PAT / Net worth 41.58 PAT / Total assets 1.51 PBDIT / Total assets 11.52 PBDIT / Capital employed 36.91 Liquidity ratios Long term debt / equity (times) 6.48 Total debt / equity (times) 12.33 Current ratio (times) 1.39 Interest cover (times) 1.17 Gross working capital cycle (days) 175 Net working capital cycle (days) 80 Avg. days of debtors (days) 99 Avg. days of creditors (days) 96 VOP / Total assets 1.289 VOP / GFA (times) 4.941 Total R & D expenditure 0.00 R & D capital 0.00 R & D current 0.00

78
Income & Expenditure: Kamrup Roofings Ltd. Mar 1999 Non-Annualised 12mths Rs. Crore Income Sales 21.48 Manufacturing 21.44 Trading 0.00 Fiscal benefits 0.04 Internal transfers 0.00 Others - 0.00 Other income 0.03 Dividend received 0.00 Interest earned 0.00 Miscellaneous income 0.03 Change in stocks -0.68 Non-recurring income 0.00 Gain on sale of assets 0.00 Gain on sales of investment 0.00 Provisions written back 0.00 Others 0.00 Expenditure Raw materials, stores, etc. 15.11 Raw materials 14.80 Stores & spares 0.22 Packaging expenses 0.00 Purchase of finished goods 0.09 Wages & salaries 0.52 Energy (power & fuel) 0.25 Other manufacturing expenses 0.02 Indirect taxes 2.89 Excise duties 2.88 Repairs & maintenance 0.01 Plant & machinery 0.00 Other repairs 0.01 Selling & distribution expenses 0.17 Advertising 0.00 Marketing 0.09 Distribution 0.00
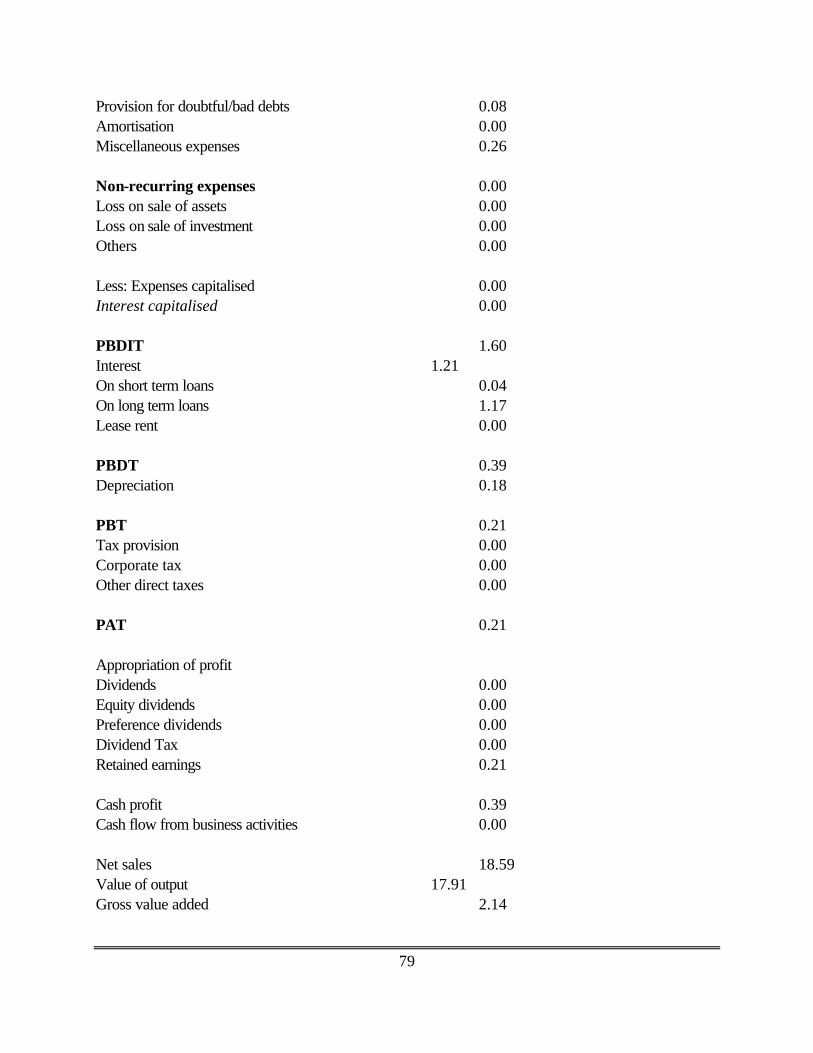
79
Provision for doubtful/bad debts 0.08 Amortisation 0.00 Miscellaneous expenses 0.26 Non-recurring expenses 0.00 Loss on sale of assets 0.00 Loss on sale of investment 0.00 Others 0.00 Less: Expenses capitalised 0.00 Interest capitalised 0.00 PBDIT 1.60 Interest 1.21 On short term loans 0.04 On long term loans 1.17 Lease rent 0.00 PBDT 0.39 Depreciation 0.18 PBT 0.21 Tax provision 0.00 Corporate tax 0.00 Other direct taxes 0.00 PAT 0.21 Appropriation of profit Dividends 0.00 Equity dividends 0.00 Preference dividends 0.00 Dividend Tax 0.00 Retained earnings 0.21 Cash profit 0.39 Cash flow from business activities 0.00 Net sales 18.59 Value of output 17.91 Gross value added 2.14

75
Annexure – 2 U F M Industriess Ltd.
Registered office Meherpur, Silchar, Assam. Pin 788015 Incorporation year : 1986 Ownership group : Private (Indian) Main activity : Bakery & milling products Listed on : Ahmedabad Stock Exchange Bombay Stock Exchange Calcutta Stock Exchange Gauhati Stock Exchange The company was incorporated in 1986, to takeover the flour mills known as Union Flour Mills. The company is engaged in the business of wheat processing. The company processes wheat to produce atta, maida, bran and suji, The Company sells its products under the brand name ``Harvest''. The company's mills are located at Silchar(Assam). In 1996, the company made its IPO to part finance its wheat processing project at Gauripur at Silchar (Assam). The project started its commercial production in March 1996.
Plant Location Production Silchar (Cachar, Ass) Maida 114.00 17.92
`000 tonnes `000 tonnes Atta 0.00 15.55
`000 tonnes Bran 0.00 7.95
`000 tonnes Suji 0.00 0.62
`000 tonnes Refraction 0.00 599.00
tonnes

76

77
Income & Expenditure: U F M Industries Ltd. Mar 1996 Mar 1997
12mths 12mths Rs.Crore
Income Sales 22.52 26.01 Manufacturing 22.38 25.89 Trading 0.00 0.00 Fiscal benefits 0.00 0.00 Internal transfers 0.00 0.00 Others 0.14 0.12 Other income 0.09 0.04 Dividend received 0.00 0.00 Interest earned 0.06 0.01 Miscellaneous income 0.03 0.03 Change in stocks 0.08 -0.05 Finished goods 0.08 -0.05 Semi-finished goods 0.00 0.00 Non-recurring income 0.00 0.00 Gain on sale of assets 0.00 0.00 Gain on sales of investment 0.00 0.00 Provisions written back 0.00 0.00 Others 0.00 0.00 Expenditure Raw metherials, stores, etc. 20.11 23.63 Raw materials 19.76 23.04 stores & spares 0.16 0.30 Packaging expenses 0.19 0.29 Purchase of finished goods 0.00 0.00 Wages & salaries 0.26 0.28 Energy (power & fuel) 0.85 0.75 Otehr manufacturing expenses 0.08 0.05 Indiredt taxes 0.00 0.00 Excise duties 0.00 0.00
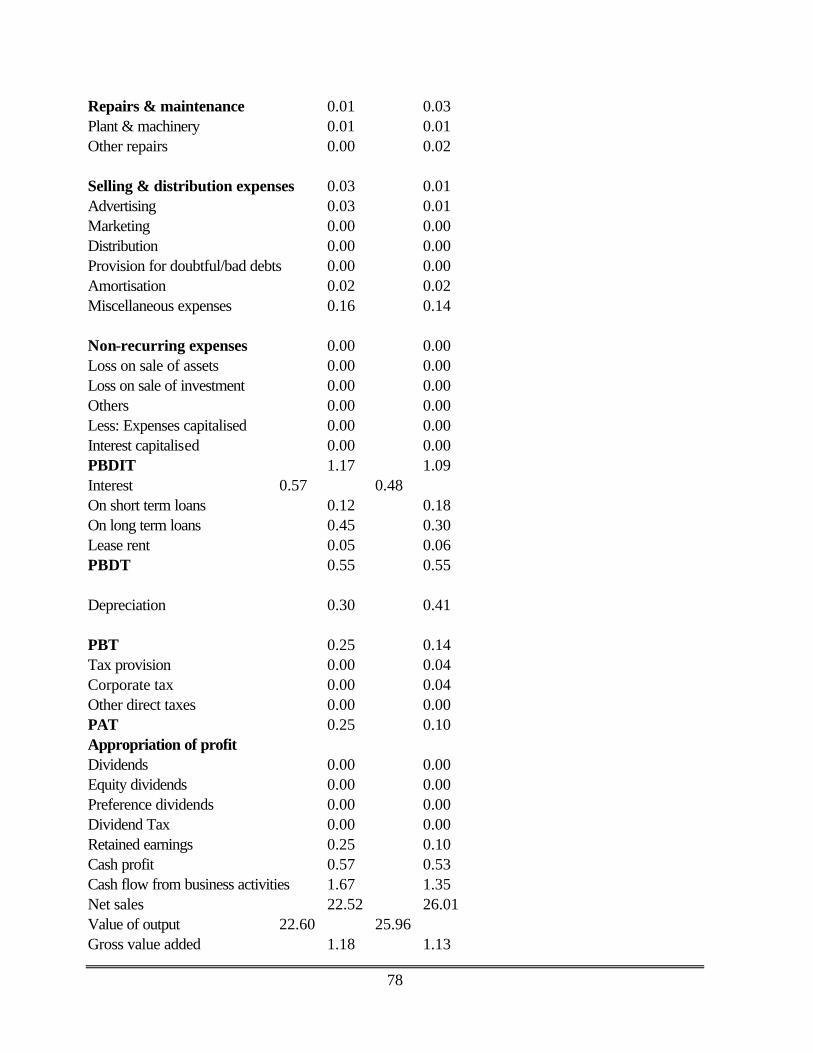
78
Repairs & maintenance 0.01 0.03 Plant & machinery 0.01 0.01 Other repairs 0.00 0.02 Selling & distribution expenses 0.03 0.01 Advertising 0.03 0.01 Marketing 0.00 0.00 Distribution 0.00 0.00 Provision for doubtful/bad debts 0.00 0.00 Amortisation 0.02 0.02 Miscellaneous expenses 0.16 0.14 Non-recurring expenses 0.00 0.00 Loss on sale of assets 0.00 0.00 Loss on sale of investment 0.00 0.00 Others 0.00 0.00 Less: Expenses capitalised 0.00 0.00 Interest capitalised 0.00 0.00 PBDIT 1.17 1.09 Interest 0.57 0.48 On short term loans 0.12 0.18 On long term loans 0.45 0.30 Lease rent 0.05 0.06 PBDT 0.55 0.55 Depreciation 0.30 0.41 PBT 0.25 0.14 Tax provision 0.00 0.04 Corporate tax 0.00 0.04 Other direct taxes 0.00 0.00 PAT 0.25 0.10 Appropriation of profit Dividends 0.00 0.00 Equity dividends 0.00 0.00 Preference dividends 0.00 0.00 Dividend Tax 0.00 0.00 Retained earnings 0.25 0.10 Cash profit 0.57 0.53 Cash flow from business activities 1.67 1.35 Net sales 22.52 26.01 Value of output 22.60 25.96 Gross value added 1.18 1.13

79
Gross sales 22.52 26.01 Net sales 22.52 26.01 VOP 22.60 25.96 Other income 0.09 0.04 Cost of production 21.53 25.05 Selling cost 0.03 0.01 PBDIT (NNRT) 1.77 1.09 PBDIT (NNRT) 0.55 0.55 PBT (NNRT) 0.25 01.4 PAT (NNRT) 0.25 0.10 Cash profit(NNRT) 0.57 0.53 Operating cash flow 1.67 1.35 Gross value added 1.48 1.43 Exports 0.00 0.00 Imports 0.00 0.28 Gross fixed assets (net of reval & W) 6.29 6.87 Current assets 6.40 5.02 Net worth 8.02 8.71 Equity caital 4.00 4.43 Long term borrowings 2.06 1.16 Capital employed 10.08 9.87 Current liabilities & provisions 0.84 0.22 Total assents / liabilities (net of reval & misc. exp. n. w. o) 10.91 10.03 Break-even sales (%) 54.41 69.56 Margin of safety (%) 45.59 30.44 Growth (%) Gross sales 16.62 15.50 Net sales 16.74 15.50 Cost of production 26.88 16.32 GFA 3.97 9.22 Total assets 13.53 -8.07 Margins (%) PBDIT (NNRT) / Sales 5.20 4.19 PBDT (NNRT) / Sales 2.44 2.11 PAT (NNRT) / Sales 1.11 0.38 PBDIT (NNRT) / Net sales 5.20 4.19 PBDT (NNRT) / Net sales 2.44 2.11 PAT (NNRT) / Net slaes 1.11 0.38 Returns ratios (%) PAT / Net worth 3.66 1.20
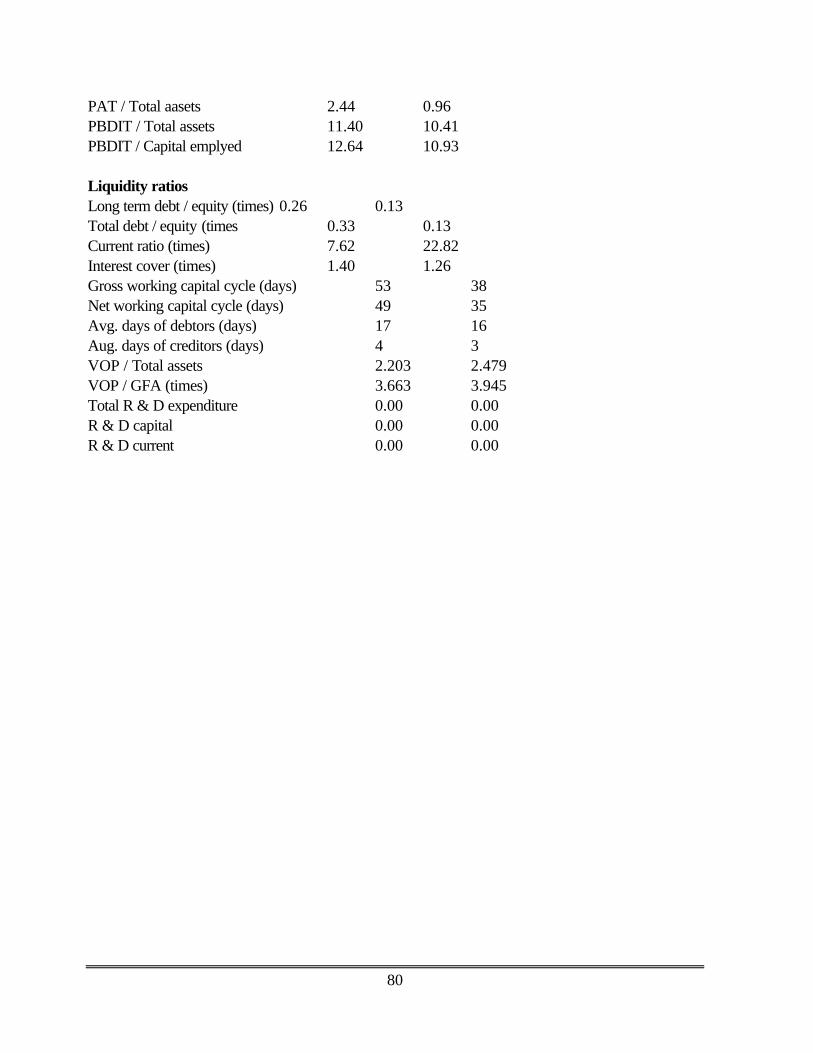
80
PAT / Total aasets 2.44 0.96 PBDIT / Total assets 11.40 10.41 PBDIT / Capital emplyed 12.64 10.93 Liquidity ratios Long term debt / equity (times) 0.26 0.13 Total debt / equity (times 0.33 0.13 Current ratio (times) 7.62 22.82 Interest cover (times) 1.40 1.26 Gross working capital cycle (days) 53 38 Net working capital cycle (days) 49 35 Avg. days of debtors (days) 17 16 Aug. days of creditors (days) 4 3 VOP / Total assets 2.203 2.479 VOP / GFA (times) 3.663 3.945 Total R & D expenditure 0.00 0.00 R & D capital 0.00 0.00 R & D current 0.00 0.00

81
Assam Carbon Products Ltd. Registered office Head / Corporate office Birkuchi, Everest House Guwahati, 46-C, Chowringhee Road Assam Calcutta, West Bengal Pin 781026 Pin 700071 Incorporation year : 1962 Ownership group : Private (Indian) Main activity : Lubricants, etc. Listed on : Plant Locations Location/Products Capacity/ Production/ Units Units 1 Birkuchi (Kamrup, ASS) Electrical carbon brus 2500.00 2420.19 hes '000 nos '000 nos EG & RB Carbon blocks 125.00 118.59 Tonnes Tonnes MG & SG Carbon blocks 125.50 92.77 Tonnes Tonnes 2 Patancheru (Medak, AP) Machined & special car 700.00 302.26 bon components '000 nos '000 nos Iso-Graphite components 36.00 35.25 '000 nos '000 nos Mechanical & sp. Carbon 90.00 23.66 block & blanks Tonnes Tonnes Product/s Capacity Production Sales Sales Manufactured/ Quanity /Units /Units /Units Rs.Crore Mar 1999 EG & RB Carbon blocks125.00 118.60 70.90 6.89 Tonnes Tonnes Tonnes MG & SG Carbon 125.50 92.78 77.28 2.98 blocks Tonnes Tonnes Tonnes Electrical carbon b 2500.00 2420.19 2404.24 14.30 Rushes '000 nos '000 nos '000 nos Machined & special 700.00 302.27 385.25 2.64 carbon components '000 nos '000 nos '000 nos
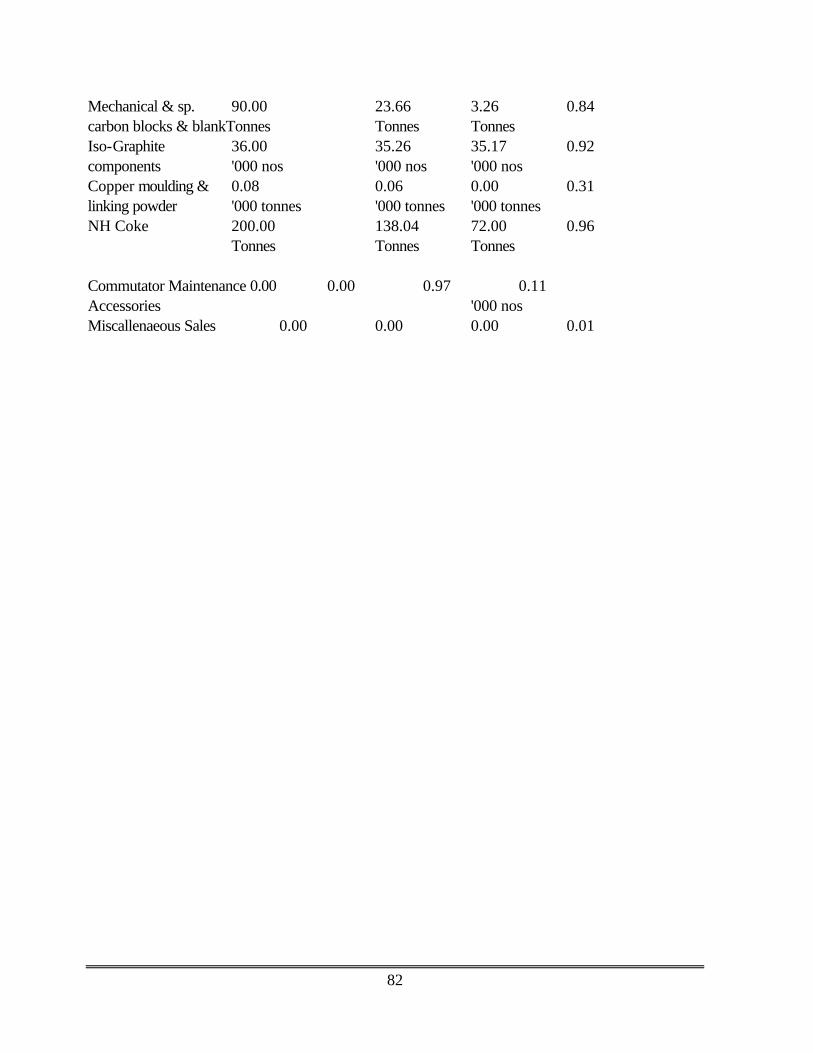
82
Mechanical & sp. 90.00 23.66 3.26 0.84 carbon blocks & blankTonnes Tonnes Tonnes Iso-Graphite 36.00 35.26 35.17 0.92 components '000 nos '000 nos '000 nos Copper moulding & 0.08 0.06 0.00 0.31 linking powder '000 tonnes '000 tonnes '000 tonnes NH Coke 200.00 138.04 72.00 0.96 Tonnes Tonnes Tonnes Commutator Maintenance 0.00 0.00 0.97 0.11 Accessories '000 nos Miscallenaeous Sales 0.00 0.00 0.00 0.01

83
Income & Expenditure Mar 1999 12mths Rs.Crore
IncomeSales 29.98 Manufacturing 28.76 Trading 1.19 Fiscal benefits 0.02 Internal transfers 0.00 Others 0.01 Other income 0.10 Dividend received 0.00 Interest earned 0.02 Miscellaneous income 0.08 Change in stocks 0.48 Finished goods 0.30 Semi-finished goods 0.18 Non-recurring income 0.01 Gain on sale of assets 0.00 Gain on sales of investment 0.00 Provisions written back 0.00 Others 0.01 Expenditure Raw materials, stores, etc. 7.31 Raw materials 5.60 Stores & spares 0.78 Packaging expenses 0.00 Purchase of finished goods 0.93 Wages & salaries 6.41 Energy (power & fuel) 1.44 Other manufacturing expenses 0.47 Indirect taxes 4.07 Excise duties 4.04 Repairs & maintenance 0.66 Plant & machinery 0.46 Other repairs 0.20 Selling & distribution expenses 1.14 Advertising 0.03 Marketing 0.66 Distribution 0.37 Provision for doubtful/bad debts 0.08

84
Amortisation 0.00 Miscellaneous expenses 3.65 Non-recurring expenses 0.01 Loss on sale of assets 0.01 Loss on sale of investment 0.00 Others 0.00 Less: Expenses capitalised 0.00 Interest capitalised 0.00 PBDIT 5.41 Interest 1.06 On short term loans 0.83 On long term loans 0.23 Lease rent 0.00 PBDT 4.35 Depreciation 0.53 PBT 3.82 Tax provision 1.30 Corporate tax 1.30 Other direct taxes 0.00 PAT 2.52 Appropriation of profit Dividends 1.27 Equity dividends 1.27 Preference dividends 0.00 Dividend Tax 0.14 Retained earnings 1.11 Cash profit 3.05 Cash flow from business activities 4.81 Net sales 25.91 Value of output 26.39 Cross value added 12.10

85
Executive Summary: Mar 1999 12mths Rs.Crore
Gross sales 29.98 Net sales 25.91 VOP 26.39 Other income 0.10 Cost of production 14.52 Selling cost 1.14 PBDIT (NNRT) 5.41 PBDT (NNRT) 4.35 PBT (NNRT) 3.82 PAT (NNRT) 2.52 Cash profit(NNRT) 3.05 Operating cash flow 4.81 Gross value added 12.10 Exports 1.11 Imports 2.44 Gross fixed assets (net of reval & W) 11.76 Current assets 20.06 Net worth 7.46 Equity capital 2.83 Long term borrowing 2.55 Capital employed 10.01 Current liabilities & provisions 15.74 Total assets / liabilities (net of reval & misc. exp. n.w.o) 23.11 Break-even sales (%) 64.62 Margin of safety (%) 35.38 Growth (%) Gross sales 20.98 Net sales 21.36 Cost of production 17.38 GFA 5.28 Total assets 14.12 Margins (%) PBDIT (NNRT) / Sales 18.05 PBDT (NNRT) / Sales 14.51 PAT (NNRT) / Sales 8.41 PBDIT (NNRT) / Net sales 20.88 PBDT (NNRT) / Net sales 16.79 PAT (NNRT) / Net sales 9.73

86
Returns ratios (%)PAT / Net worth 36.47 PAT / Total assets 11.62 PBDIT / Total assets 24.95 PBDIT / Capital employed 56.83 Liquidity ratios Long term debt / equity (times) 0.34 Total debt / equity (times) 0.84 Current ratio (times) 1.27 Interest cover (times) 4.60 Gross working capital cycle (days) 339 Net working capital cycle (days) 217 Avg. days of debtors (days) 113 Avg. days of creditors (days) 122 VOP / Total assets 1.217 VOP / GFA (times) 2.302 Total R & D expenditure 0.00 R & D capital 0.00 R & D current 0.00

87
Tata Tea Ltd. Registered office 1, Bishop Lefroy Road, Calcutta West Bengal Pin 700020 Incorporation year : 1962 Ownership group : Tata Tea Group Main activity : Tea Listed on : Bombay Stock Exchange Calcutta Stock Exchange London Stock Exchange National Stock Exchange Tata Tea was incorporated in 1962 as Tata-Finlay Private Ltd and became a public limited company in the following year. It was set up by the Tatas under a technical and financial collaboration agreement with James Finlay & Co Ltd, UK. This agreement expired in 1971. The packet tea plant was commissioned in 1964 and the instant tea plant commenced production in 1965. The Tatas had a 40 per cent stake in Tata Finaly Ltd. Subsequent to the expiry of the collaboration agreement, the overseas company sold off its entire stake to Tata Industries in 1982. After the sale of equity holdings, the name of the company was changed to Tata Tea during 1983. In 1976, Tata Tea expanded its business operations after it acquired the business of James Finlay & Co and its seven associate tea companies operating in India. During 1985, the company set up a tea factory at Chundavurrai tea estate in Kerala with a capacity to process 4.5 to 5 million kg of black tea per annum. In 1984, it floated an investment company as a 100 per cent owned subsidiary called Bambino Investment & Trading Co Pvt Ltd. In 1986, Tata Tea set up a 100 per cent subsidiary in the US, Tata Tea Inc, after acquiring the instant tea processing facilities of Tritea Inc, USA. During 1990-91, Consolidated Coffee Ltd, along with its two subsidiaries, became subsidiaries of Tata Tea. In 1993, it set up Tata Tetley Ltd, a joint venture company with the Lyons Tetley group of UK, in Cochin. In March 2000, Tata Tea acquired the world-wide tea business of UK based tea major Tetley Tea for a consideration of 270 million pounds (Rs 1,890 crore). In the same

88
month, Tata Tea had made its Global Depository Receipt issue for part- funding this acquisition. It had issued 75.98 lakh GDRs at $9.87 (Rs 430) per GDR. Tata Tea's acquisition of Tetley is expected to provide the company access to markets in North America, Europe and Australia. The company also set up a wholly-owned subsidiary, Tata Tea, Great Britain for the purpose of acquiring the UK firm. Plant Location Location/Products Capacity/Units Production/Units 1. Ghaziabad (Ghaziabad, UP Packet tea & instant 0.00 0.00 Tea '000 tonnes '000 tonnes 2 Dooars Region (West Bengal, WB) Tea 0.00 4.41 '000 tonnes 3 Jorhat & Golaghat (Assam, ASS) Tea 0.00 6.39 '000 tonnes 4 North Bank (Assam, ASS) Tea 0.00 5.48 '000 tonnes 5 Nowgong (Assam, ASS) Tea 0.00 4.11 '000 tonnes 6 Upper Assam (Assam, ASS) Tea 0.00 8.66 '000 tonnes 7 Bangalore (Bangalore, KAR) Packet tea & instant 5.35 24.54 Tea '000 tonnes '000 tonnes 8 Kerala (Kerala, KER) Tea 0.00 27.14 '000 tonnes 9 Munnar (Idukki, KER)

89
Pepper 0.00 1629.00 Tonnes Packet tea & instant 0.00 0.00 Tea '000 tonnes '000 tonnes 10 Tamil Nadu (Tamil Nadu, TN) Tea 0.00 4.90 '000 tonnes 11 Coimbatore (Coimbatore, TN) Packet tea & instant 0.00 0.00 Tea '000 tonnes '000 tonnes 12 Valparai (Coimbatore, TN) Coffee 0.00 0.54 '000 tonnes 13 Valparai, Pachaimallai, Pannimade (Coimbatore, TN) Cardamom 0.00 38.00 Tonnes

90
Income & Expenditure Mar 1999 Mar 2000 12mths 12mths
Rs. Crore Income Sales 876.02 913.39 Manufacturing 868.47 906.38 Trading 0.55 0.45 Fiscal benefits 1.79 0.93 Internal transfers 0.00 0.00 Others 5.21 5.63 Other income 38.53 61.07 Dividend received 16.47 38.36 Interest earned 14.72 14.91 Miscellaneous income 7.34 7.80 Change in stocks 31.70 -3.61 Finished goods 31.67 -3.62 Semi-finished goods 0.03 0.01 Non-recurring income 1.35 10.64 Gain on sale of assets 0.00 0.04 Gain on sales of investment 0.00 9.71 Provisions written back 1.35 0.89 Others 0.00 0.00 ExpenditureRaw materials, stores, etc. 232.18 271.33 Raw materials 140.14 202.83 Stores & spares 1.74 1.57 Packaging expenses 54.90 60.36 Purchase of finished goods 35.40 6.57 Wages & salaries 132.00 153.37 Energy (power & fuel) 30.72 33.61 Other manufacturing expenses 105.95 115.15 Indirect taxes 32.96 18.37 Excise duties 27.58 13.20 Repairs & maintenance 30.86 29.72 Plant & machinery 19.43 19.95 Other repairs 11.43 9.77 Selling & distribution expenses 102.16 100.94 Advertising 73.47 68.19 Marketing 8.55 8.80 Distribution 17.10 15.37

91
Provision for doubtful/bad debts 3.04 8.58 Amortisation 0.00 0.00 Miscellaneous expenses 45.47 42.76 Non-recurring expenses 0.08 0.00 Loss on sale of assets 0.08 0.00 Loss on sale of investment 0.00 0.00 Others 0.00 0.00 Less: Expenses capitalised 0.00 0.00 Interest capitalised 0.00 0.00 PBDIT 235.22 216.24 Interest 32.79 32.52 On short term loans 1.79 2.83 On long term loans 31.00 29.69 Lease rent 0.00 0.00 PBDT 202.43 183.72 Depreciation 17.67 18.65 PBT 184.76 165.07 Tax provision 56.00 40.50 Corporate tax 25.00 20.60 Other direct taxes 31.00 19.90 PAT 128.76 124.57 Appropriation of profit Dividends 53.49 49.57 Equity dividends 53.49 49.57 Preference dividends 0.00 0.00 Dividend Tax 5.89 5.45 Retained earnings 69.38 69.55 Cash profit 146.43 143.22 Cash flow from business activities 166.40 107.02 Net sales 843.06 895.02 Value of output 874.76 891.41 Gross value added 970.53 363.94

92
Executive Summary Mar 1999 Mar 2000
12mths 12mths Rs. Crore
Gross sales 876.02 913.39 Net sales 843.06 895.02 VOP 874.76 891.41 Other income 38.53 61.07 Cost of production 498.32 566.04 Selling cost 102.16 100.94 PBDIT (NNRT) 233.95 205.60 PBDT (NNRT) 201.16 173.08 PBT (NNRT) 183.49 154.43 PAT (NNRT) 127.49 113.93 Cash profit (NNRT) 145.16 132.58 Operating cash flow 166.40 107.02 Gross value added 370.53 363.94 Exports 143.99 98.05 Imports 14.49 6.03 Gross fixed assets (net of reval & W) 337.50 410.88 Current assets 377.07 425.15 Net worth 448.41 830.24 Equity capital 48.62 56.22 Long term borrowings 190.80 217.91 Capital employed 639.21 1048.15 Current liabilities & provisions 247.71 282.64 Total assets / liabilities (net of reval & misc. exp. n.w.o) 885.46 1328.29 Break-even sales (%) 40.34 51.10 Margin of safety (%) 59.66 48.90 Growth (%) Gross sales 0.50 4.27 Net sales -2.53 6.16 Cost of production -6.02 13.59 GFA 0.56 21.74 Total assets 6.45 50.01 Margins (%) PBDIT (NNRT) / Sales 26.71 22.51 PBDT (NNRT) / Sales 22.96 18.95
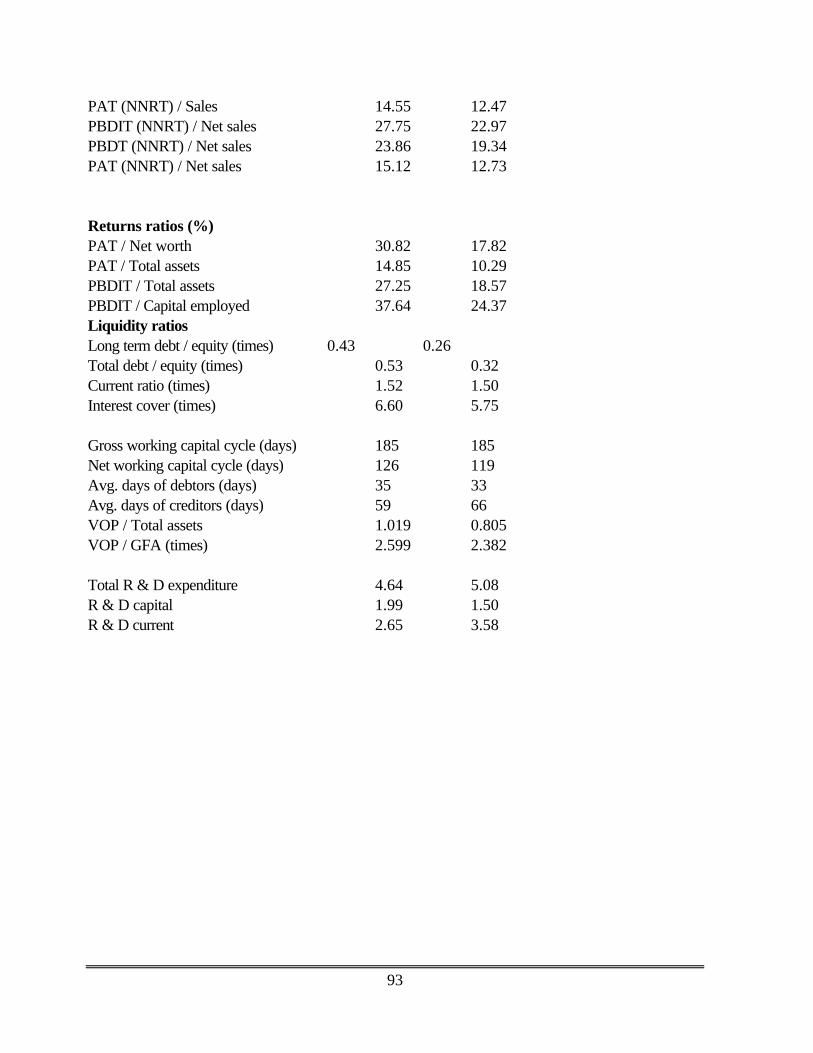
93
PAT (NNRT) / Sales 14.55 12.47 PBDIT (NNRT) / Net sales 27.75 22.97 PBDT (NNRT) / Net sales 23.86 19.34 PAT (NNRT) / Net sales 15.12 12.73 Returns ratios (%) PAT / Net worth 30.82 17.82 PAT / Total assets 14.85 10.29 PBDIT / Total assets 27.25 18.57 PBDIT / Capital employed 37.64 24.37 Liquidity ratios Long term debt / equity (times) 0.43 0.26 Total debt / equity (times) 0.53 0.32 Current ratio (times) 1.52 1.50 Interest cover (times) 6.60 5.75 Gross working capital cycle (days) 185 185 Net working capital cycle (days) 126 119 Avg. days of debtors (days) 35 33 Avg. days of creditors (days) 59 66 VOP / Total assets 1.019 0.805 VOP / GFA (times) 2.599 2.382 Total R & D expenditure 4.64 5.08 R & D capital 1.99 1.50 R & D current 2.65 3.58

94
Arunachal Plywood Inds. Ltd. Registered office Poddar Point 113, Park Street CalcuttaPin 700016 Incorporation year : 1918 Ownership group : Private (Indian) Main activity : Wood Plant Location Location/Products Capacity/ Production/ Units Units 1 Namsai, Nefa (Lohit, ARU) Plywood 10765.00 3071.65 '000 sq.metres '000 sq.metres Sawn timber 0.00 2804.00 Cubic metres U.F. solution 1200.00 916.26 Tonnes Tonnes Products Details Product/s Capacity Production Sales Sales Purchase Manufactured/ Quantity Value Traded /Units /Units /Units Rs. Crore Rs. Crore
Mar 1999 Plywood 10765.00 0.00 0.34 0.75 0 '000 sq.metres '000 sq.metres '000 cu.metres Sawn timber 0.00 0.00 33.29 0.03 0. Cubic metres Cubic metres Veneer 0.00 0.00 67.89 0.09 0. '000 cu.metres Logs 0.00 0.00 0.07 0.09 2. '000 cu.metres
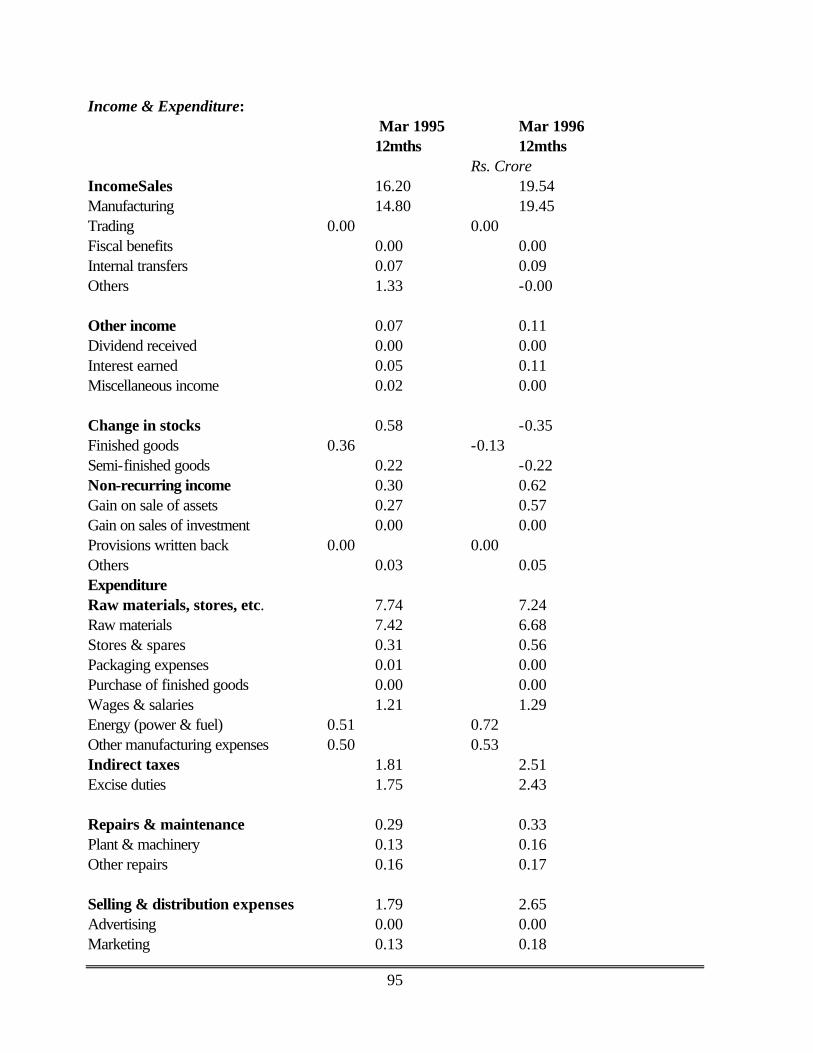
95
Income & Expenditure: Mar 1995 Mar 1996 12mths 12mths Rs. Crore
IncomeSales 16.20 19.54 Manufacturing 14.80 19.45 Trading 0.00 0.00 Fiscal benefits 0.00 0.00 Internal transfers 0.07 0.09 Others 1.33 -0.00 Other income 0.07 0.11 Dividend received 0.00 0.00 Interest earned 0.05 0.11 Miscellaneous income 0.02 0.00 Change in stocks 0.58 -0.35 Finished goods 0.36 -0.13 Semi-finished goods 0.22 -0.22 Non-recurring income 0.30 0.62 Gain on sale of assets 0.27 0.57 Gain on sales of investment 0.00 0.00 Provisions written back 0.00 0.00 Others 0.03 0.05 Expenditure Raw materials, stores, etc. 7.74 7.24 Raw materials 7.42 6.68 Stores & spares 0.31 0.56 Packaging expenses 0.01 0.00 Purchase of finished goods 0.00 0.00 Wages & salaries 1.21 1.29 Energy (power & fuel) 0.51 0.72 Other manufacturing expenses 0.50 0.53 Indirect taxes 1.81 2.51 Excise duties 1.75 2.43 Repairs & maintenance 0.29 0.33 Plant & machinery 0.13 0.16 Other repairs 0.16 0.17 Selling & distribution expenses 1.79 2.65 Advertising 0.00 0.00 Marketing 0.13 0.18

96
Distribution 1.66 2.47 Provision for doubtful/bad debts 0.00 0.00 Amortisation 0.00 0.00 Miscellaneous expenses 0.72 1.08 Non-recurring expenses 0.01 0.12 Loss on sale of assets 0.01 0.01 Loss on sale of investment 0.00 0.00 Others 0.00 0.11 Less: Expenses capitalised 0.00 0.00 Interest capitalised 0.00 0.00 PBDIT 2.57 3.45 Interest 0.78 1.36 On short term loans 0.41 0.72 On long term loans 0.37 0.64 Lease rent 0.07 0.34 PBDT 1.72 1.75 Depreciation 0.23 0.32 PBT 1.49 1.43 Tax provision 0.46 0.00 Corporate tax 0.46 0.00 Other direct taxes 0.00 0.00 PAT 1.03 1.43 Appropriation of profit Dividends 0.15 0.32 Equity dividends 0.14 0.31 Preference dividends 0.01 0.01 Dividend Tax 0.00 0.00 Retained earnings 0.88 1.11 Cash profit 1.26 1.75 Cash flow from business activities 0.82 0.73 Net sales 14.39 17.03 Value of output 14.97 16.68 Gross value added 3.57 4.00 Executive Summary: Gross sales 16.20 19.54 Net sales 14.39 17.03 VOP 14.97 16.68 Other income 0.07 0.11 Cost of production 9.74 10.09 Selling cost 1.79 2.65
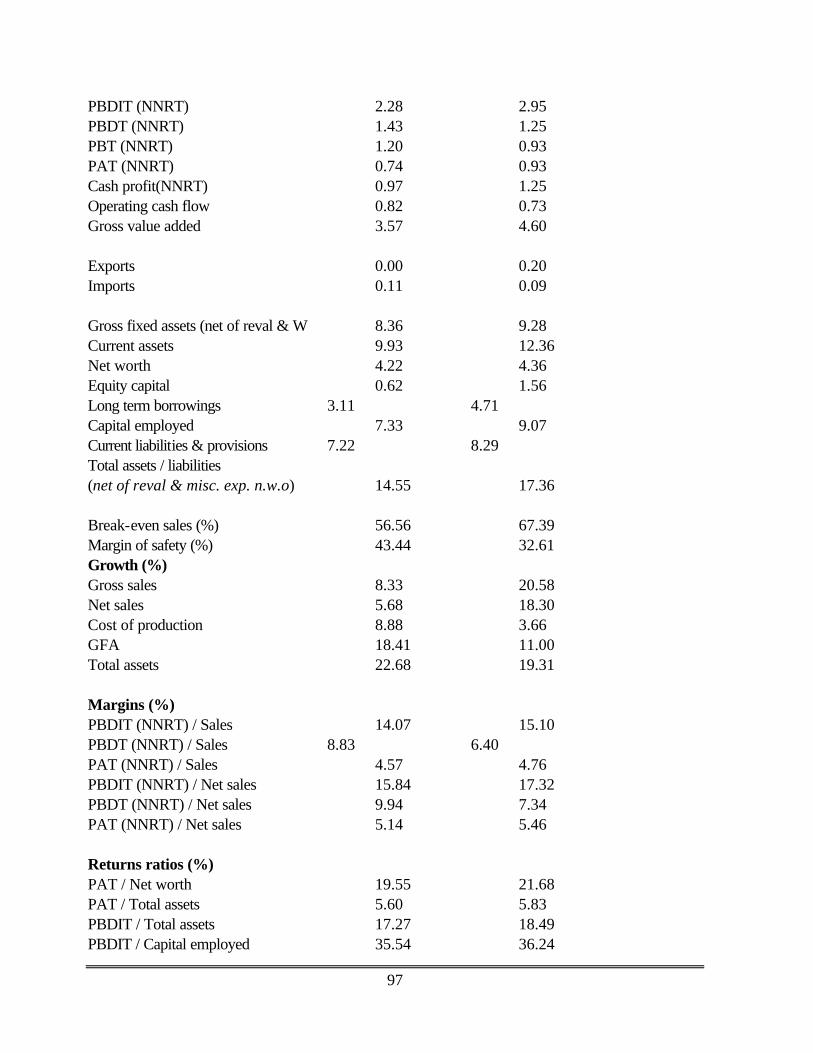
97
PBDIT (NNRT) 2.28 2.95 PBDT (NNRT) 1.43 1.25 PBT (NNRT) 1.20 0.93 PAT (NNRT) 0.74 0.93 Cash profit(NNRT) 0.97 1.25 Operating cash flow 0.82 0.73 Gross value added 3.57 4.60 Exports 0.00 0.20 Imports 0.11 0.09 Gross fixed assets (net of reval & W 8.36 9.28 Current assets 9.93 12.36 Net worth 4.22 4.36 Equity capital 0.62 1.56 Long term borrowings 3.11 4.71 Capital employed 7.33 9.07 Current liabilities & provisions 7.22 8.29 Total assets / liabilities (net of reval & misc. exp. n.w.o) 14.55 17.36 Break-even sales (%) 56.56 67.39 Margin of safety (%) 43.44 32.61 Growth (%) Gross sales 8.33 20.58 Net sales 5.68 18.30 Cost of production 8.88 3.66 GFA 18.41 11.00 Total assets 22.68 19.31 Margins (%) PBDIT (NNRT) / Sales 14.07 15.10 PBDT (NNRT) / Sales 8.83 6.40 PAT (NNRT) / Sales 4.57 4.76 PBDIT (NNRT) / Net sales 15.84 17.32 PBDT (NNRT) / Net sales 9.94 7.34 PAT (NNRT) / Net sales 5.14 5.46 Returns ratios (%) PAT / Net worth 19.55 21.68 PAT / Total assets 5.60 5.83 PBDIT / Total assets 17.27 18.49 PBDIT / Capital employed 35.54 36.24

98
Liquidity ratios Long term debt / equity (times) 0.74 1.08 Total debt / equity (times) 1.61 1.97 Current ratio (times) 1.38 1.49 Interest cover (times) 2.41 1.55 Gross working capital cycle (days) 313 306 Net working capital cycle (days) 251 239 Avg. days of debtors (days) 55 66 Avg. days of creditors (days) 62 67 VOP / Total assets 1.134 1.045 VOP / GFA (times) 1.942 1.891 Total R & D expenditure 0.00 0.00 R & D capital 0.00 0.00
R & D current 0.00 0.00

99
Eastern Mining & Allied Inds. Ltd.
Registered office Nongrim Hills, Shillong, Meghalaya Pin 793003 Incorporation year : 1985 Ownership group : Private (Indian) Main activity : Coal & lignite Listed on : Ahmedabad Stock Exchange Bombay Stock Exchange Delhi Stock Exchange Gauhati Stock Exchange Jaipur Stock Exchange National Stock Exchange 1 Meghalaya (Meghalaya, MEG) Coal 480000.00 272225.79 Tonnes Tonnes Product/s Capacity Production Sales Sales Purchase Manufactured/ Quantity Value Traded /Units /Units /Units Rs. Crore Rs. Crore Mar 1998 Coal 480000.00 272225.80 261605.62 22.45 0. Tonnes Tonnes Tonnes
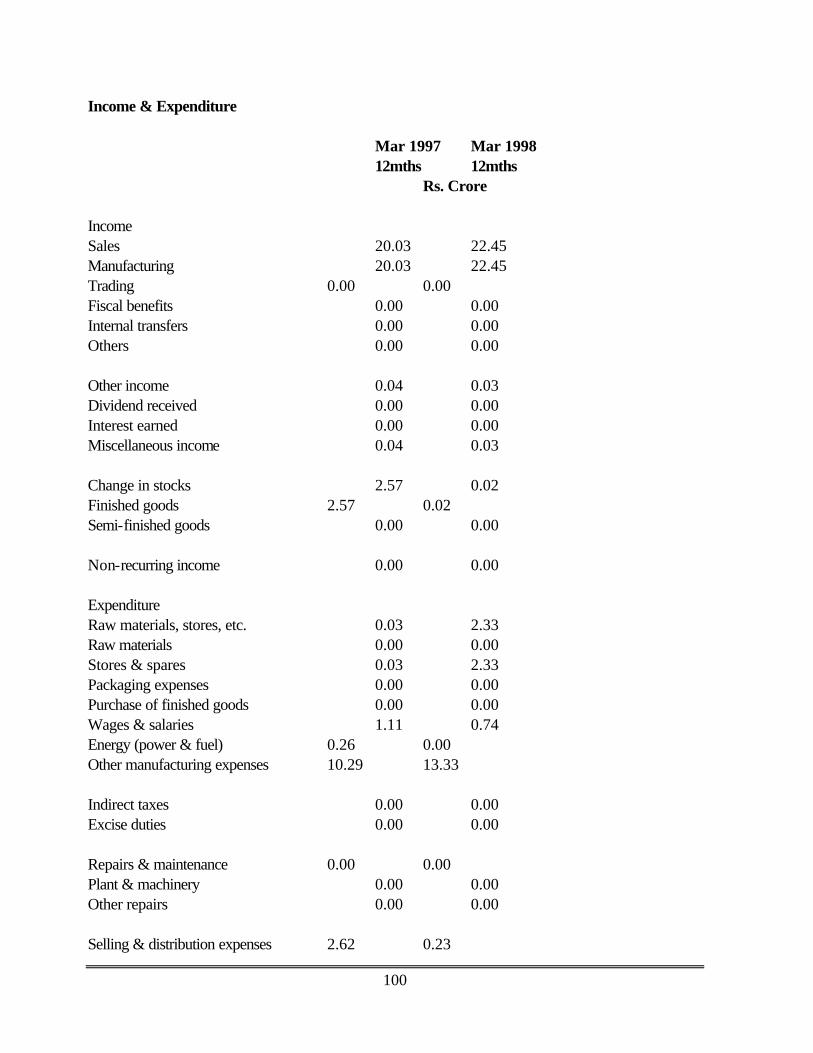
100
Income & Expenditure
Mar 1997 Mar 1998 12mths 12mths
Rs. Crore Income Sales 20.03 22.45 Manufacturing 20.03 22.45 Trading 0.00 0.00 Fiscal benefits 0.00 0.00 Internal transfers 0.00 0.00 Others 0.00 0.00 Other income 0.04 0.03 Dividend received 0.00 0.00 Interest earned 0.00 0.00 Miscellaneous income 0.04 0.03 Change in stocks 2.57 0.02 Finished goods 2.57 0.02 Semi-finished goods 0.00 0.00 Non-recurring income 0.00 0.00 Expenditure Raw materials, stores, etc. 0.03 2.33 Raw materials 0.00 0.00 Stores & spares 0.03 2.33 Packaging expenses 0.00 0.00 Purchase of finished goods 0.00 0.00 Wages & salaries 1.11 0.74 Energy (power & fuel) 0.26 0.00 Other manufacturing expenses 10.29 13.33 Indirect taxes 0.00 0.00 Excise duties 0.00 0.00 Repairs & maintenance 0.00 0.00 Plant & machinery 0.00 0.00 Other repairs 0.00 0.00 Selling & distribution expenses 2.62 0.23

101
Advertising 0.04 0.02 Marketing 0.00 0.20 Distribution 2.58 0.00 Provision for doubtful/bad debts 0.00 0.01 Amortisation 0.39 0.41 Miscellaneous expenses 1.41 0.91 Non-recurring expenses 0.00 0.50 Loss on sale of assets 0.00 0.01 Loss on sale of investment 0.00 0.00 Others 0.00 0.49 Less: Expenses capitalised 0.00 0.00 Interest capitalised 0.00 0.00 PBDIT 6.53 4.05 Interest 0.39 0.33 On short term loans 0.39 0.33 On long term loans 0.00 0.00 Lease rent 0.00 0.63 PBDT 6.14 3.09 Depreciation 1.19 0.96 PBT 4.95 2.13 Tax provision 0.00 0.00 Corporate tax 0.00 0.00 Other direct taxes 0.00 0.00 PAT 4.95 2.13 Appropriation of profit Dividends 0.00 0.00 Equity dividends 0.00 0.00 Preference dividends 0.00 0.00 Dividend Tax 0.00 0.00 Retained earnings 4.95 2.13 Cash profit 6.53 3.50 Cash flow from business activities 5.64 4.37 Net sales 20.03 22.45 Value of output 22.60 22.47 Gross value added 7.84 0.00 Executive Summary:

102
Gross sales 20.03 22.45 Net sales 20.03 22.45 VOP 22.60 22.47 Other income 0.04 0.03 Cost of production 12.55 17.14 Selling cost 2.62 0.23 PBDIT (NNRT) 6.53 4.55 PBDT (NNRT) 6.14 3.59 PBT (NNRT) 2.57 0.30 Imports 0.00 0.00 Gross fixed assets (net of reval & W) 35.74 51.49 Current assets 26.03 29.24 Net worth 81.91 83.45 Equity capital 24.45 24.45 Long term borrowings 0.06 1.33 Capital employed 81.97 84.78 Current liabilities & provisions 5.12 10.07 Total assets / liabilities (net of reval & misc. exp. n.w.o) 87.06 94.82 Break-even sales (%) 43.06 57.18 Margin of safety (%) 56.94 42.82 Growth (%) Gross sales 20.16 12.08 Net sales 21.03 12.08 Cost of production 43.84 36.59 GFA 2.52 44.07 Total assets 9.36 8.91 Margins (%) PBDIT (NNRT) / Sales 32.60 20.27 PBDT (NNRT) / Sales 30.65 15.99 PAT (NNRT) / Sales 24.71 11.71 PBDIT (NNRT) / Net sales 32.60 20.27 PBDT (NNRT) / Net sales 30.65 15.99 PAT (NNRT) / Net sales 24.71 11.71 Returns ratios (%) PAT / Net worth 6.24 3.18 PAT / Total assets 5.94 2.89 PBDIT / Total assets 7.84 5.00 PBDIT / Capital employed 8.23 5.46 Liquidity ratios

103
Long term debt / equity (times) 0.00 0.02 Total debt / equity (times) 0.01 0.03 Current ratio (times) 5.08 2.90 Interest cover (times) 13.69 3.74 Gross working capital cycle (days) 1243 178 Net working capital cycle (days) 1161 110 Avg. days of debtors (days) 74 75 Avg. days of creditors (days) 82 68 VOP / Total assets 0.271 0.247 VOP / GFA (times) 0.640 0.515 Total R & D expenditure 0.00 0.00 R & D capital 0.00 0.00 R & D current 0.00 0.00

104
Nagaland Pulp & Paper Co. Ltd. Registered office P.O. Papernagar Nagaland Pin 798623 Incorporation year : 1971 Ownership group : Central Govt.-Commercial Enterprises Main activity : Paper Nagaland Pulp & Paper Company limited is a subsidiary of HindustanPaper Corporation. 1 Tuli (Mokokchung, NAG) Writing & printing paper 33000.00 0.00 Tonnes Products Details Product/s Capacity Production Sales Sales Purchase Manufactured/ Quantity Value Traded /Units /Units /Units Rs. Crore Rs. Crore Mar 1995 Pulp 33000.00 0.00 0.00 0.00 0.
Tonnes Writing & printing 33000.00 0.00 6.00 0.01 0. paper Tonnes Tonnes

105
Income & Expenditure:
Mar 1999 Mar 2000 12mths 12mths
Rs. Crore Income Sales 0.00 0.00 Manufacturing 0.00 0.00 Trading 0.00 0.00 Fiscal benefits 0.00 0.00 Internal transfers 0.00 0.00 Others 0.00 0.00 Other income 0.10 0.00 Dividend received 0.00 0.00 Interest earned 0.00 0.00 Miscellaneous income 0.10 0.00 Change in stocks 0.00 0.00 Finished goods 0.00 0.00 Semi-finished goods 0.00 0.00 Non-recurring income 0.08 0.00 Gain on sale of assets 0.00 0.00 Gain on sales of investment 0.00 0.00 Provisions written back 0.00 0.00 Others 0.08 0.00 Expenditure Raw materials, stores, etc. 0.00 0.00 Raw materials 0.00 0.00 Stores & spares 0.00 0.00 Packaging expenses 0.00 0.00 Purchase of finished goods 0.00 0.00 Wages & salaries 6.00 5.83 Energy (power & fuel) 0.09 0.09 Other manufacturing expenses 0.26 0.24 Indirect taxes 0.00 0.00 Excise duties 0.00 0.00 Repairs & maintenance 0.01 0.01
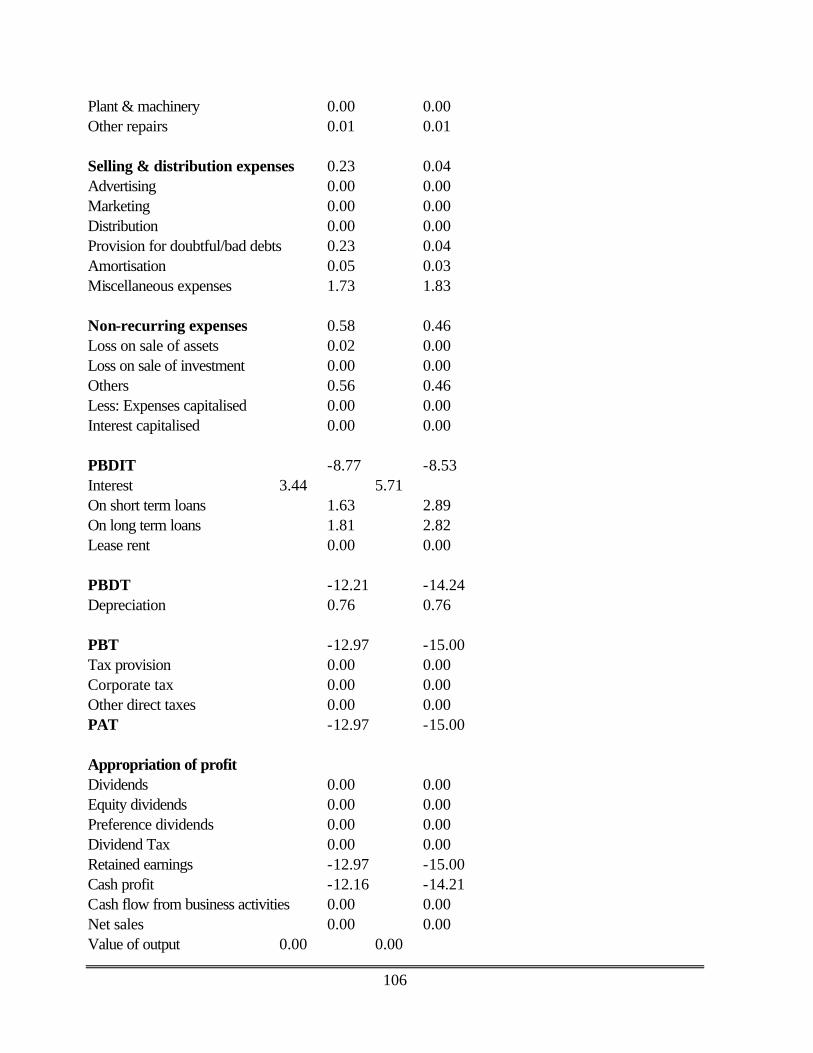
106
Plant & machinery 0.00 0.00 Other repairs 0.01 0.01 Selling & distribution expenses 0.23 0.04 Advertising 0.00 0.00 Marketing 0.00 0.00 Distribution 0.00 0.00 Provision for doubtful/bad debts 0.23 0.04 Amortisation 0.05 0.03 Miscellaneous expenses 1.73 1.83 Non-recurring expenses 0.58 0.46 Loss on sale of assets 0.02 0.00 Loss on sale of investment 0.00 0.00 Others 0.56 0.46 Less: Expenses capitalised 0.00 0.00 Interest capitalised 0.00 0.00 PBDIT -8.77 -8.53 Interest 3.44 5.71 On short term loans 1.63 2.89 On long term loans 1.81 2.82 Lease rent 0.00 0.00 PBDT -12.21 -14.24 Depreciation 0.76 0.76 PBT -12.97 -15.00 Tax provision 0.00 0.00 Corporate tax 0.00 0.00 Other direct taxes 0.00 0.00 PAT -12.97 -15.00 Appropriation of profit Dividends 0.00 0.00 Equity dividends 0.00 0.00 Preference dividends 0.00 0.00 Dividend Tax 0.00 0.00 Retained earnings -12.97 -15.00 Cash profit -12.16 -14.21 Cash flow from business activities 0.00 0.00 Net sales 0.00 0.00 Value of output 0.00 0.00

107
Gross value added 2.27 2.24 Executive Summary: Gross sales 0.00 0.00 Net sales 0.00 0.00 VOP 0.00 0.00 Other income 0.10 0.00 Cost of production 5.31 5.17 Selling cost 0.23 0.04 PBDIT (NNRT) -8.27 -8.07 PBDT (NNRT) -11.71 -13.78 PBT (NNRT) -12.47 -14.54 PAT (NNRT) -12.47 -14.54 Cash profit(NNRT) -11.66 -13.75 Operating cash flow 0.00 0.00 Gross value added -2.27 -2.24 Exports 0.00 0.00 Imports 0.00 0.00 Gross fixed assets (net of reval&W) 74.37 74.37 Current assets 2.61 2.33 Net worth -38.99 -53.99 Equity capital 120.20 120.20 Long term borrowings 8.80 13.07 Capital employed -30.19 -40.92 Current liabilities & provisions 44.22 53.74 Total assets / liabilities (net of reval & misc. exp. n.w.o) 14.03 12.82 Break-even sales (%) Margin of safety (%) Growth (%) Gross sales Net sales Cost of production 11.53 -2.62 GFA 0.00 0.00 Total assets -11.98 -8.62 Margins (%) PBDIT (NNRT) / Sales PBDT (NNRT) / Sales PAT (NNRT) / Sales PBDIT (NNRT) / Net sales PBDT (NNRT) / Net sales PAT (NNRT) / Net sales

108
Returns ratios (%) PAT / Net worth 38.98 31.28 PAT / Total assets -83.22 -108.31 PBDIT / Total assets -55.19 -60.11 PBDIT / Capital employed 32.96 22.70 Liquidity ratios Long term debt / equity (times) -0.23 -0.24 Total debt / equity (times) -0.23 -0.24 Current ratio (times) 0.06 0.04 Interest cover (times) -2.63 -1.55 Gross working capital cycle (days) Net working capital cycle (days) Avg. days of debtors (days) Avg. days of creditors (days) 137 320 VOP / Total assets 0.000 0.000 VOP / GFA (times) 0.000 0.000 Total R & D expenditure 0.00 0.00 R & D capital 0.00 0.00 R & D current 0.00 0.00

109
Assam Asbestos Ltd. Registered office Bonda, Narangi, Guwahati Pin 781026 Incorporation year : 1972 Ownership : Private (Indian) Main activity : Cement & asbestos products Listed on : Products Details Product/s Capacity/ Production/ Sales/ Sales Purcha Manufactured/ Quantity Value Traded Units Units Units Rs.Crore Rs.Cro
Mar 1999
Asbestos sheets 46000.00 24275.00 24504.00 18.31 0. Tonnes Tonnes Tonnes Galvanised sheets 20.00 3702.00 3.65 11.34 0. '000 tonnes '000 tonnes '000 tonnes Scrap 0.00 0.00 123.00 0.20 0. Tonnes PVC fittings 0.00 0.00 10386.00 0.03 0. Piece

110
North Eastern Electric Power Corpn. Ltd. Registered office ``Brookland Compound'' Lower New Colony Laitumkhrah, Shillong Pin 793003 Incorporation year : 1976 Ownership group : Central Govt.-Commercial Enterprises Main activity : Electricity generation Plant Locations Location/Products Capacity Production
/Units /Units Electricity 0.00 516.34
Mw Million units 1 Kopili (Darrang, ASS) Electricity 1503.00 995.17
Million units Million units 2 Kathalguri (Dibrugarh, ASS) Electricity 1123.00 743.39
Million units Million units 3 Agartala (West Tripura, TRI) Electricity 298.00 197.37
Million units Million units North Eastern Electric Power Mar 1999 Electricity 2924.00 1935.93 .
Million units Million units
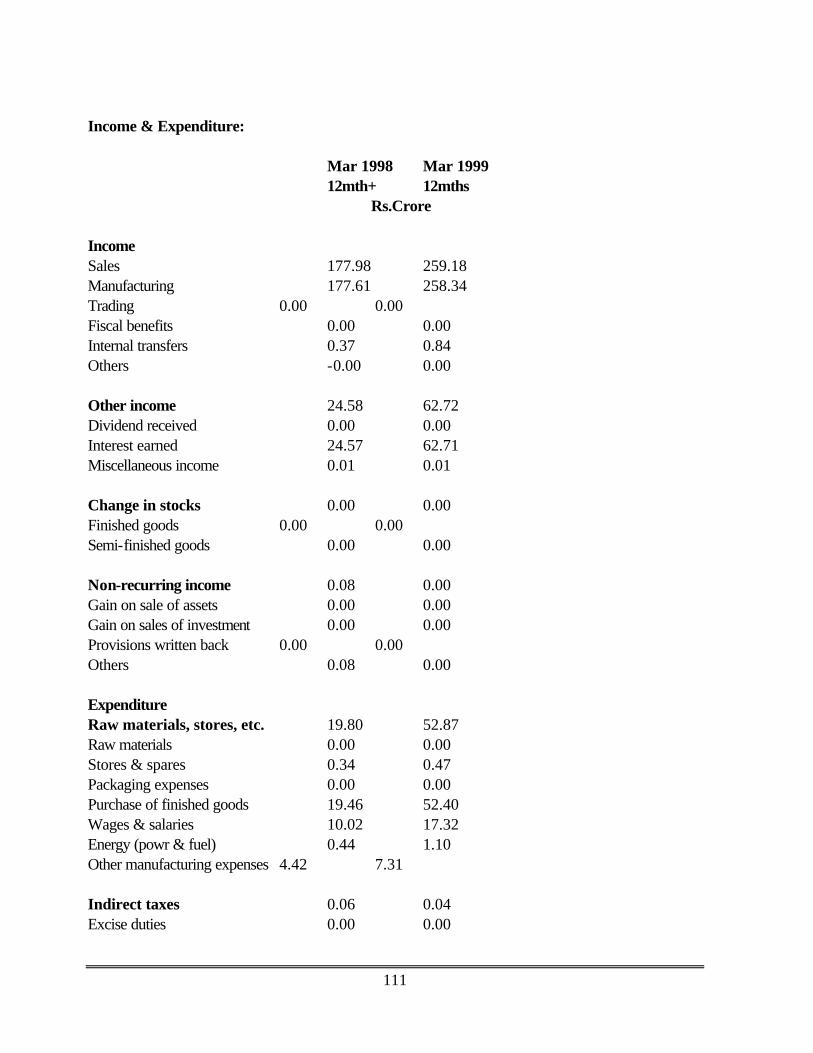
111
Income & Expenditure:
Mar 1998 Mar 1999 12mth+ 12mths Rs.Crore
Income Sales 177.98 259.18 Manufacturing 177.61 258.34 Trading 0.00 0.00 Fiscal benefits 0.00 0.00 Internal transfers 0.37 0.84 Others -0.00 0.00 Other income 24.58 62.72 Dividend received 0.00 0.00 Interest earned 24.57 62.71 Miscellaneous income 0.01 0.01 Change in stocks 0.00 0.00 Finished goods 0.00 0.00 Semi-finished goods 0.00 0.00 Non-recurring income 0.08 0.00 Gain on sale of assets 0.00 0.00 Gain on sales of investment 0.00 0.00 Provisions written back 0.00 0.00 Others 0.08 0.00 Expenditure Raw materials, stores, etc. 19.80 52.87 Raw materials 0.00 0.00 Stores & spares 0.34 0.47 Packaging expenses 0.00 0.00 Purchase of finished goods 19.46 52.40 Wages & salaries 10.02 17.32 Energy (powr & fuel) 0.44 1.10 Other manufacturing expenses 4.42 7.31 Indirect taxes 0.06 0.04 Excise duties 0.00 0.00

112
Repairs & maintenance 3.76 2.70 Plant & machinery 0.57 0.99 Other repairs 3.19 1.71 Selling & distribution expenses 0.93 8.29 Advertising 0.03 0.10 Marketing 0.90 8.19 Distribution 0.00 0.00 Provision for doubtful/bad debts 0.00 0.00 Amortisation 0.00 0.14 Miscellaneous expenses 9.11 16.83 Non-recurring expenses 0.44 3.78 Loss on sale of assets 0.00 0.00 Loss on sale of investment 0.00 0.000 Others 0.44 3.78 Less: Expenses capitalised 0.00 0.00 Interest capitalised 0.00 0.00 PBDIT 153.66 211.52 Interest 73.46 78.61 On short term loans 0.03 1.40 On long term loans 73.43 77.21 Lease rent 0.00 0.00 PBDT 80.20 132.91 Depreciation 54.30 74.69 PBT 25.90 58.22 Tax provision 0.00 0.00 Corporate tax 0.00 0.00 Other direct taxes 0.00 0.00 PAT 25.90 58.22 Appropriation of profit Dividends 2.00 4.00 Equity dividends 2.00 4.00 Preference dividends 0.00 0.00 Dividend Tax 0.20 0.40 Retained earnings 23.70 53.82 Cash profit 80.20 133.05 Cash flow from business activities 0.00 0.00
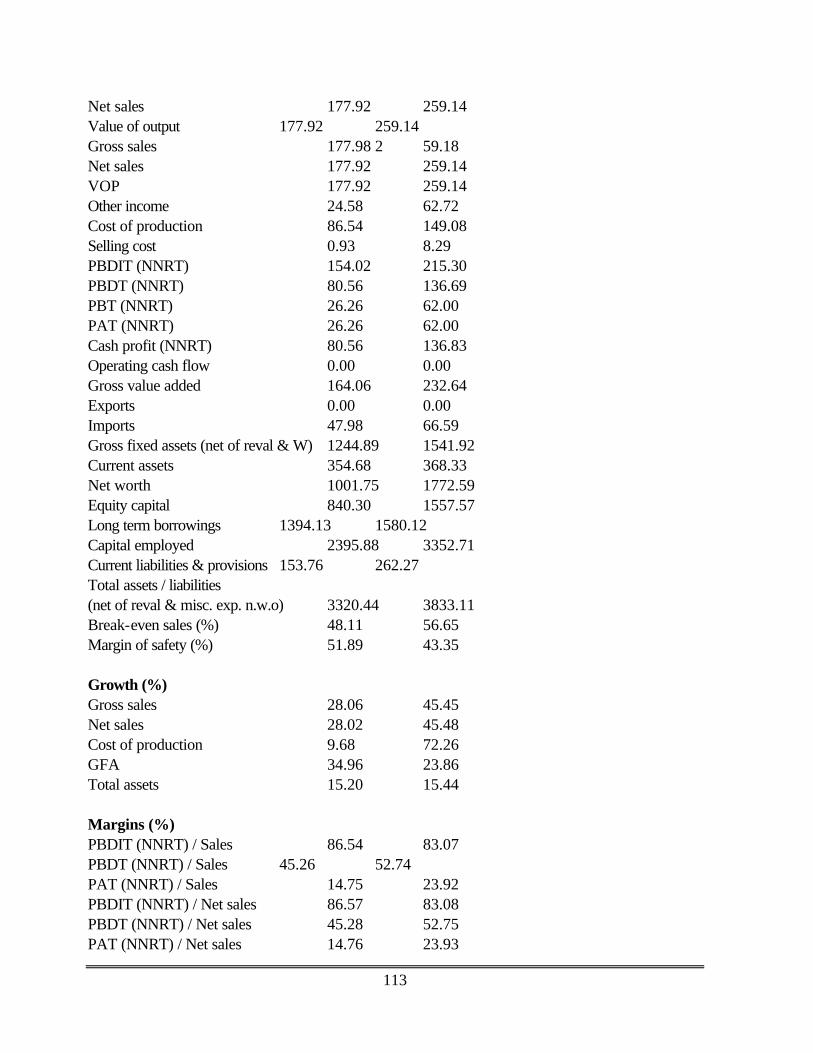
113
Net sales 177.92 259.14 Value of output 177.92 259.14 Gross sales 177.98 2 59.18 Net sales 177.92 259.14 VOP 177.92 259.14 Other income 24.58 62.72 Cost of production 86.54 149.08 Selling cost 0.93 8.29 PBDIT (NNRT) 154.02 215.30 PBDT (NNRT) 80.56 136.69 PBT (NNRT) 26.26 62.00 PAT (NNRT) 26.26 62.00 Cash profit (NNRT) 80.56 136.83 Operating cash flow 0.00 0.00 Gross value added 164.06 232.64 Exports 0.00 0.00 Imports 47.98 66.59 Gross fixed assets (net of reval & W) 1244.89 1541.92 Current assets 354.68 368.33 Net worth 1001.75 1772.59 Equity capital 840.30 1557.57 Long term borrowings 1394.13 1580.12 Capital employed 2395.88 3352.71 Current liabilities & provisions 153.76 262.27 Total assets / liabilities (net of reval & misc. exp. n.w.o) 3320.44 3833.11 Break-even sales (%) 48.11 56.65 Margin of safety (%) 51.89 43.35 Growth (%) Gross sales 28.06 45.45 Net sales 28.02 45.48 Cost of production 9.68 72.26 GFA 34.96 23.86 Total assets 15.20 15.44 Margins (%) PBDIT (NNRT) / Sales 86.54 83.07 PBDT (NNRT) / Sales 45.26 52.74 PAT (NNRT) / Sales 14.75 23.92 PBDIT (NNRT) / Net sales 86.57 83.08 PBDT (NNRT) / Net sales 45.28 52.75 PAT (NNRT) / Net sales 14.76 23.93

114
Returns ratios (%) PAT / Net worth 2.70 4.47 PAT / Total assets 0.85 1.73 PBDIT / Total assets 4.97 6.02 PBDIT / Capital employed 5.97 7.49 Liquidity ratios Long term debt / equity (times) 1.39 0.89 Total debt / equity (times) 1.39 0.89 Current ratio (times) -2.31 1.40 Interest cover (times) 1.36 1.79 Gross working capital cycle (days) 42582 41705 Net working capital cycle (days) 42535 41636 Avg. days of debtors (days) 424 479 Avg. days of creditors (days) 46 69 VOP / Total assets 0.057 0.072 VOP / GFA (times) 0.164 0.186 Total R & D expenditure 0.00 0.00 R & D capital 0.00 0.00 R & D current 0.00 0.00

115
Oil & Natural Gas Corpn. Ltd. Registered office Head/Corporate office Jeevan Bharti', Tower II, Tel Bhavan, 124, Indira Chowk Dehradun, New Delihi Uttar Pradesh Pin 110001 Pin 248003 Incorporation year : 1959 Ownership group : Central Govt.-Commercial Enterprises Main activity : Crude oil & natural gas Listed on : Bombay Stock Exchange National Stock Exchange BACKGROUND GIST: The Oil and Natural Gas Corporation LTD (ONGC) is engaged in the exploration and production of crude oil and the production of liquefied petroleum gas, naphtha and kerosene. Since the year 1989-90, the production of oil has been declining. The peak level of crude oil production in this year was 42.17 million MT. Since then, production has been declining and usually hovers in a range of 25 to 30 million MT. With the gradual opening up of the oil sector, companies such as ONGC will have to contend with dramatic changes in the competitive structure of the industry. As on 31st March 1998, the company had gross fixed assets of Rs 54183 core and a net worth of Rs 22323 crore. The Government holds a 96 per cent stake in the company. BACKGROUND DETAILS: HISTORY: The Oil and Natural Gas Corporation LTD (ONGC) was incorporated in 1959. It was formed under an Act of Parliament as a `Commission'. It turned into a `Corporation' governed by the Companies Act in June 1993. Its creation in 1956 was to reflect the philosophy of self-reliance contained in the Industrial Policy Resolution of that year. At that time, it was decided that core sectors such as oil and gas exploration would be reserved for the state-owned units. ONGC is engaged in the exploration and production of crude oil, production of liquefied natural gas, naphtha and kerosene. The first well was spudded at Jwalamukhi in April 1957. A significant on shore discovery of oil was made at Ankeleshwar in May 1960.This was followed by the discovery of oil at Kalol and Rudrasagar in Assam. In March 1970, the first off-shore well was spudded at Bhavanagar. Off-shore drilling commenced at Bombay High in 1973. IN March 1976, oil was found at the Bassein structure. In July 1978, the oil pipeline system from Bombay High to Trombay was commissioned. In 1984, ONGC's gas and pipeline division was converted into another company, Gas Authority of India LTD (GAIL). Until the late eighties, ONGC was focussed on crude oil production. The refining and marketing of petroleum products was reserved for the public sector company. Indian Oil Corporation. However, this would

116
change with the deregulation of the oil sector. With the gradual opening up of the oil sector, companies such as ONGC will have to contend with dramatic changes in the competitive structure of the industry. ACTIVITY: ONGC is into exploration and production of crude oil, production of liquefied petroleum gas, naphtha and kerosene. The company's sites are located at Gandak (Patna, Bihar), Upper Assam (Assam, Gauhati), Ankleshwar (Bharuch, G ujarat) Hazira (Surat, Gujarat) ad Uran (Raigarh, Maharashtra). Its offshore sites are at Cambay, Gandhar and at the Krishna-Godavari basin. Since the year 1989--90, the production of oil has been on a decline. The peak level of crude oil production was in this year at 42.17 million MT. Since then, production has been declining and usually hovers in a range of 25 to 30 million MT. ONGC has been trying to reduce its massive manpower. The size of the company's workforce dropped from 48300 personnel on 1st April 1992 to 42000 in 1998. As on 31st March 1998, the company had gross fixed assets of Rs 54183 crore and a net worth of Rs 22323 crore. SUBSIDIARIES: ONGC Videsh Ltd. (100%). Gandak (Patna, BIH) Liquefied natural gas 0.00 0.00
Million cu.metres 2 Guwahati (Kamrup, ASS) Crude 0.00 0.00
'000 tonnes Liquefied natural gas 0.00 0.00
Million cu.metres 3 Krishna-Godavari Offshore (Krishna Godavari Offshore, MS) Crude 0.00 0.00
'000 tonnes Liquefied natural gas 0.00 0.00
Million cu.metres 4 Ankleshwar (Bharuch, GUJ) Natural gas (gaseous) 2060000.00 400506.00
Tonnes Tonnes LPG 0.00 0.00
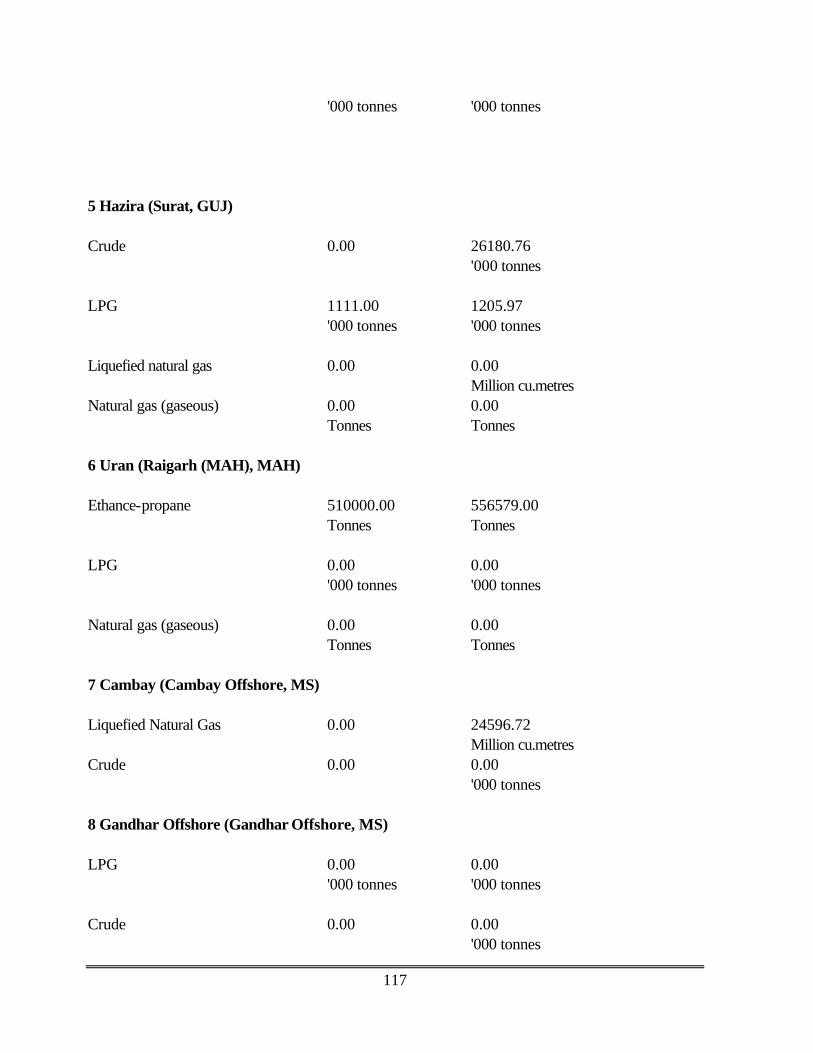
117
'000 tonnes '000 tonnes 5 Hazira (Surat, GUJ) Crude 0.00 26180.76
'000 tonnes LPG 1111.00 1205.97
'000 tonnes '000 tonnes Liquefied natural gas 0.00 0.00
Million cu.metres Natural gas (gaseous) 0.00 0.00
Tonnes Tonnes 6 Uran (Raigarh (MAH), MAH) Ethance-propane 510000.00 556579.00
Tonnes Tonnes LPG 0.00 0.00
'000 tonnes '000 tonnes Natural gas (gaseous) 0.00 0.00
Tonnes Tonnes 7 Cambay (Cambay Offshore, MS) Liquefied Natural Gas 0.00 24596.72
Million cu.metres Crude 0.00 0.00 '000 tonnes 8 Gandhar Offshore (Gandhar Offshore, MS) LPG 0.00 0.00
'000 tonnes '000 tonnes Crude 0.00 0.00
'000 tonnes

118
Natural gas (gaseous) 0.00 0.00 Tonnes Tonnes
Product/s Capacity Production Sales Sales Purchase Manufactured/ Quantity Value Traded /Units /Units /Units Rs. Crore Rs. Crore
Mar 2000 Crude 0.00 26180.76 23436.32 11561.38 0.
'000 tonnes '000 tonnes Liquefied natural 0.00 24596.73 20100.12 4714.71 0. gas Million cu.metres Million cu.metres LPG 1111.00 1205.97 1207.72 927.94 0.
'000 tonnes '000 tonnes '000 tonnes Natural gas (gaseous) 2040000.00 400506.00 544825.00 92.12 0 Tonnes Tonnes Tonnes Ethane-propane 510000.00 556579.00 556732.00 384.37 0
Tonnes Tonnes Tonnes Aromatic rich naptha 751715.00 1263401.00 1253784.00 1214.19 0 Tonnes Tonnes Tonnes Superior kerosene oil 285320.00 228263.00 228081.00 102.81 0. Tonnes Tonnes Tonnes Heavy cut 0.00 39238.00 40374.00 43.60 0
Tonnes Tonnes Others 0.00 0.00 0.00 1.50 0 Pipeline transportation 0.00 0.00 0.00 110.94 0. receipts Contractual short 0.00 0.00 0.00 11.23 0. lifted gas receipts Reimbursement received 0.00 0.00 0.00 3.20 0. from Govt. of lndia

119
Other contractual 0.00 0.00 0.00 119.49 0. receipts Share of profit on 0.00 0.00 0.00 1.40 0. investment in partn

120
Income & Expenditure:
Mar 1999 Mar 2000 12mths 12mths
Rs. Crore Income Sales 15107.82 20228.88 Manufacturing 14759.41 19982.62 Trading 0.00 0.00 Fiscal benefits 21.48 3.20 Internal transfers 0.00 0.00 Others 326.93 243.06 Other income 909.53 856.85 Dividend received 1.06 85.26 Interest earned 841.33 687.76 Miscellaneous income 67.14 83.83 Change in stocks 0.19 15.21 Finished goods 0.19 15.21 Semi-finished goods 0.00 0.00 Non-recurring income 51.75 156.23 Gain on sale of assets 0.00 0.00 Gain on sales of investment 7.27 0.97 Provisions written back 44.48 125.83 Others 0.00 29.43 Expenditure Raw materials, stores, etc. 202.47 200.69 Raw materials 0.00 0.00 Stores & spares 202.47 200.69 Packaging expenses 0.00 0.00 Purchase of finished goods 0.00 0.00 Wages & salaries 341.55 700.15 Energy (power & fuel) 115.01 119.19 Other manufacturing expenses 1252.76 3423.75 Indirect taxes 4667.64 3057.40 Excise duties 1925.46 2349.95 Repairs & maintenance 124.13 395.55 Plan & machinery 0.00 0.00

121
Other repairs 124.13 395.55 Selling & distribution expenses 580.11 820.31 Advertising 0.00 0.00 Marketing 0.00 0.00 Distribution 510.36 740.24 Provision for doubtful/bad debts 69.75 80.07 Amortisation 0.00 0.00 Miscellaneous expenses 1398.64 1714.19 Non-recurring expenses 7.28 195.26 Loss on sale of assets 1.01 1.03 Loss on sale of investment 0.00 0.00 Others 6.27 194.23 Less: Expenses capitalised 217.16 181.80 Interest capitalised 0.00 0.00 PBDIT 7596.86 10812.48 Interest 830.40 600.32 On short term loans 216.63 101.93 On long term loans 613.77 498.39 Lease rent 0.00 0.00 PBDT 6766.46 10212.16 Depreciation 3191.81 4252.29 PBT 3574.65 5959.87 Tax provision 820.15 2330.40 Corporate tax 819.10 2330.00 Other direct taxes 1.05 0.40 PAT 2754.50 3629.47 Appropriation of profit Dividends 784.26 926.85 Equity dividends 784.26 926.85 Preference dividends 0.00 0.00 Dividend Tax 86.27 141.17 Retained earnings 1883.97 2561.45 Cash profit 5946.31 7881.76 Cash flow from business activities 6926.01 8483.70 Net sales 10440.18 17171.48 Value of output 10440.37 17186.69 Gross sales 15107.82 20228.88

122
Net sales 10440.18 17171.48 VOP 10440.37 17186.69 Other income 909.53 856.85 Cost of production 5001.14 8486.03 Selling cost 580.11 820.31 PBDIT (NNRT) 7552.39 10851.51 PBDT (NNRT) 6721.99 10251.19 PBT (NNRT) 3530.18 5998.90 PAT (NNRT) 2710.03 3668.50 Cash profit(NNRT) 5901.84 7920.79 Operating cash flow 6926.01 8483.70 Gross value added 7893.94 11551.66 Exports 35.81 52.73 Imports 3353.44 3541.44 Gross fixed assets (net of reval & W 58315-.90 63115.69 Current assets 11462.93 17871.38 Net worth 24171.15 26736.83 Equity capital 1425.92 1425.92 Long term borrowings 7531.48 6850-.08 Capital employed 31702.63 33586.91 Current liabilities & provisions 8661.65 10426.16 Total assets/liabilities (net of reval & misc. exp. n.w.o.) 37118.91 38258.48 Break-even sales (%) 62.84 53.30 Margin of safety (%) 37.16 44.70 Growth (%) Gross sales -1.37 33.90 Net sales 0.73 64.47 Cost of production -10.35 69.68 GFA 7.63 8.23 Total assets 3.84 3.07 Margins (%) PBDIT (NNRT)/Sales 49.99 53.64 PBDT (NNRT)/Sales 44.49 50.68 PAT (NNRT)/Sales 17.94 18.13 PBDIT (NNRT)/Net sales 72.34 63.19 PBDT (NNRT)/Net sales 64.39 59.70 PAT (NNRT)/Net sales 25.96 21.36 Returns ratios (%) PAT/Net worth 11.66 14.41

123
PAT/Total assets 7.44 9.73 PBDIT/Total assets 20.73 28.79. PBDIT/Capital employed 23.86 33.24 Liquidity ratios Long term debt / equity (times) 0.31 0.26 Total debt/equity (times) 0.34 0.27 Current ratio (times) 1.32 1.71 Interest cover (times) 5.25 10.99 Gross working capital cycle (days) 3015 2737 Net working capital cycle (days) 2987 2722 Avg. days of debtors (days) 29 26 Avg. days of creditors (days) 28 15 VOP / Total assets 0.287 0.456 VOP / GFA (times) 0.186 0.283 Total R & D expenditure 57.75 71.04 R & D capital 8.98 5054 R & D current 48.77 65.50

124
George Williamson (Assam) Ltd. Registered office `WM HOUSE', Khandapara, Six Mile, G. S. Road, Guwahati, Assam Pin 781022 Incorporation year : 1977 Ownership group : Williamson Magor Group Main activity : Tea Listed on : Bombay Stock Exchange Calcutta Stock Exchange National Stock Exchange George Williamson (Assam) Ltd. Planting Locations production Capacity Production
/units /units 1 Attareekhat (Darrang, Ass) Tea 0.00 0.93
`000 tonnes 2 Bargany (Darrang, ASS) Tea 0.00 2.29
`000 tonnes 3 Borengajuli (Darrang, ASS) Tea 0.00 1.42
`000 tonnes 4 Boroi (Darrang, ASS) Tea 0.00 0.85
`000 tonnes 5 Corramore (Darrang, ASS) Tea 0.00 1.09
`000 tonnes 6 Paneery (Darrang, ASS) Tea 0.00 0.86
`000 tonnes 7 Rupajuli (Darrang, ASS)

125
Tea 0.00 0.88 `000 tonnes
8 Bordubi (Dibrugarh, Ass) Tea 0.00 2.09
`000 tonnes 9 Dirial(Dibrugarh, ASS) Tea 0.00 1.47
`000 tonnes 10 Itakhooli (Dibrugarh, ASS) Tea 0.00 0.88
`000 tonnes 11 Keyhung(Dibrugarh, ASS) Tea 0.00 1.66
`000 tonnes 12 Koomsong (Dibrugarh, ASS) Tea 0.00 1.69
000 tonnes 13 Phillobari (Dibrugarh, ASS) Tea 0.00 0.70
`000 tonnes 14 Behora (Sibsagar, ASS) Tea 0.00 1.85
`000 tonnes 15 Rajmai (Sibsagar, ASS) Tea 0.00 0.82
`000 tonnes Executive Summary Financial Perfromance Mar 2000
12mths Rs.Crore
Gross sales 191.73 Net sales 184.61 VOP 185.16 Other income 7.00 Cost of production 85.26 Selling cost 18.99 PBDIT (NNRT) 56.14 PBDT (NNRT) 48.24 PBD(NNRT) 41.38 PAT (NNRT) 28.98 Cash profit (NNRT) 35.84

126
Operating cash flow 42.78 Gross value added 119.24 Exports 75.63 Imports 24.11 Gross fixed assets (net of reval & W) 186.36 Current assets 233.70 Net worth 111.38 Equity capital 14.18 Long term borrowings 32.66 Capital employed 144.04 Current liabilities & provisions 193.82 Total assets / liabilities (net of reval & misc. exp. n. w. o) 215.53 Break-even sale (%) 57.17 Margin of safety (%) 42.83 Growth (%) Gross sales -1.44 Net sales -3.01 Cost of production 10.45 GFA 11.73 Total assets 8.77 Margins (%) PBDIT (NNRT) / Sales 29.28 PBDT (NNRT) / Sales 25.16 PAT (NNRT) / Sales 15.12 PADIT (NNRT) / Net sales 30.41 PBDT (NNRT) / Net sales 26.13 PAT (NNRT) / Net sales 15.70 Returns ratios (%) PAT / Net worth 27.65 PAT / Total assets 14.01 PBDIT / Total assets 27.14 PBDIT / Capital employed 39.21 Liquidity ratios Long term debt / equity (times) 0.29 Total debt / equity (times) 0.42 Current ratio (times) 1.21 Interest cover (times) 6.24

127
Gross working capital cycle (days) 208 Net working capital cycle (days) 158 Avg. days of debtors (days) 11 Avg. days of creditors (days) 50 VOP / Total assets 0.895 VOP / GFA (times) 1.049 Total R & D expenditure 0.00 R & D Capital 0.00 R & D current 0.00 Income Sales 191.73 Manufacturing 191.61 Trading 0.00 Fiscal benefits 0.12 Internal transfers 0.00 Others -0.00 Other income 7.00 Dividend recived 0.00 Interest earned 4.93 Miscellaneous income 2.07 Change in stocks 0.55 Finished goods 0.55 Semi-finished goods 0.00 Non-recurring income 0.43 Gain on sale of assets 0.09 Gain on sales of investment 0.00 Provisions written back 0.00 Others 0.34 Expenditure Raw meterials, stores, etc. 13.67 Raw meterials 0.00 Stores & spares 10.29 Packaging expenses 0.00 Purchase of finished goods 3.38 Wages & salaries 62.28 Energy (power & fuel) 14.79 Other manufacturing expenses 1.63
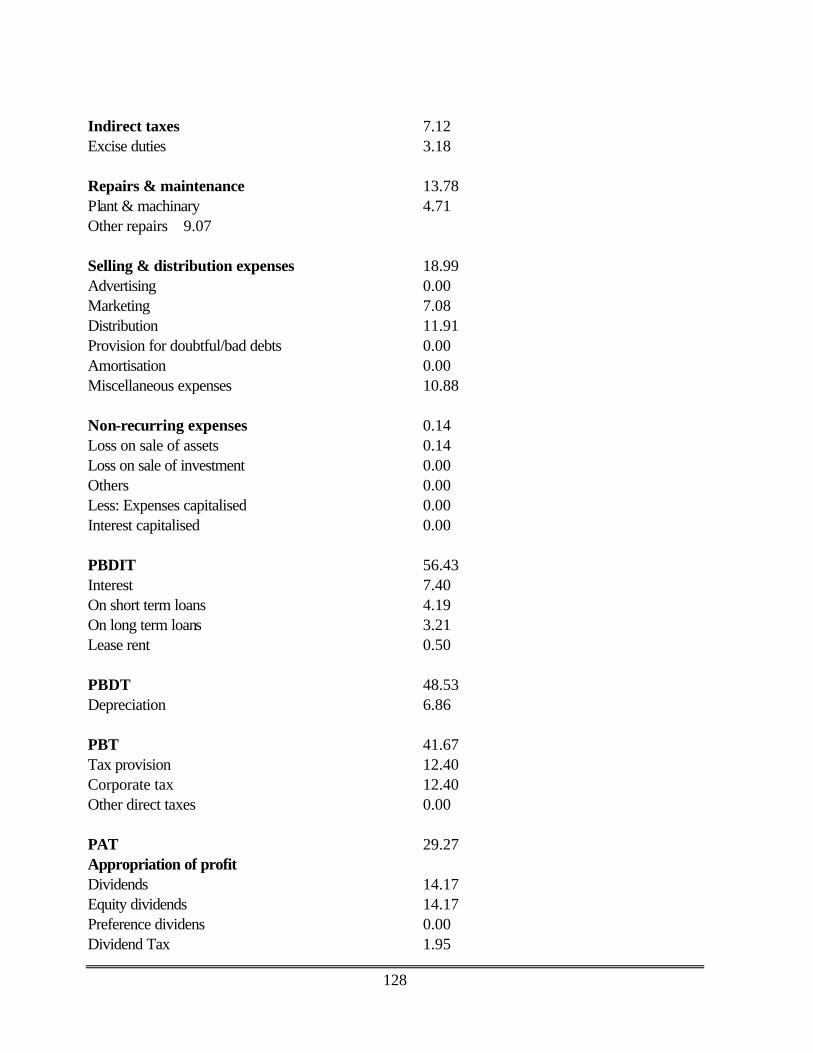
128
Indirect taxes 7.12 Excise duties 3.18 Repairs & maintenance 13.78 Plant & machinary 4.71 Other repairs 9.07 Selling & distribution expenses 18.99 Advertising 0.00 Marketing 7.08 Distribution 11.91 Provision for doubtful/bad debts 0.00 Amortisation 0.00 Miscellaneous expenses 10.88 Non-recurring expenses 0.14 Loss on sale of assets 0.14 Loss on sale of investment 0.00 Others 0.00 Less: Expenses capitalised 0.00 Interest capitalised 0.00 PBDIT 56.43 Interest 7.40 On short term loans 4.19 On long term loans 3.21 Lease rent 0.50 PBDT 48.53 Depreciation 6.86 PBT 41.67 Tax provision 12.40 Corporate tax 12.40 Other direct taxes 0.00 PAT 29.27 Appropriation of profit Dividends 14.17 Equity dividends 14.17 Preference dividens 0.00 Dividend Tax 1.95

129
Retained earnings 13.15 Cash profit 36.13 Cash flow from business activities 42.78 Net sales 184.61 Value of output 185.16 Gross value added 19.24

130
Gillanders Arbuthnot & Co. Ltd.
Registered office A-1, Gillander House Netaji Subhas Road Calcutta Pin 700001 Incorporation year : 1935 Ownership group : Private (Indian) Main activity : Diversified Listed on : Calcutta Stock Exchange Plant Locations 1. Taipoo (Darjiling, WB) Saleable tea 0.00 .51 '000 tonnes '000 tonnes 2. Gairkhata (Jalpaiguri, WB) Saleable tea 3.60 1.14 '000 tonnes '000 tonnes 3. Konnagar (Hugli, WB) 4. Behala (Calcutta, WB) Kalamazoo sheets 11982.00 177.82 '000 nos '000 nos Kalamazoo binders & 18000.00 4848.00 accessories Numbers Numbers 5. Betjan (Dibrugarh, ASS) Saleable tea 0.00 0.76 '000 tonnes '000 tonnes 6. Jatlibari (Dibrugarh, ASS) Saleable tea 0.00 0.69 '000 tonnes '000 tonnes 7. Tengpani (Dibrugarh, ASS) Saleable tea 0.00 0.51 '000 tonnes '000 tonnes 8. Maduranthagam (Chengalpattu MGR, TN)

131
Plastic containers 370.00 78.80 '000 nos '000 nos

132
Executive Summary: Financial Performance. Mar 1999 12mths
Rs. Crore
Gross sales 52.03 Net sales 51.34 VOP 51.34 Other income 5.54 Cost of production 37.14 Selling cost 2.22 PBDIT (NNRT) 11.99 PBDT (NNRT) 11.98 PBT (NNRT) 10.39 PAT (NNRT) 7.19 Cash profit(NNRT) 8.78 Operating cash flow 10.14 Gross value added 24.62 Exports 0.12 Imports 1.66 Gross fixed assets (net of reval & W 31.68 Current assets 23.95 Net worth 39.92 Equity capitalLong term borrowings 0.29 Capital employed 40.21 Current liabilities & provisions 13.83 Total assets / liabilitie (net of reval & misc. exp. n.w.o) 51.03 Break-even sales (%) 64.64 Margin of safety (%) 35.36 Growth (%) Gross sales 19.79 Net sales 20.65 Cost of production 27.23 GFA 4.87 Total assets 17.28 Margins (%) PBDIT (NNRT) / Sales 23.04 PBDT (NNRT) / Sales 23.03 PAT (NNRT) / Sales 13.82 PBDIT (NNRT) / Net sales 23.35

133
PBDT (NNRT) / Net sales 23.33 PAT (NNRT) / Net sales 14.00 Returns ratios (%) PAT / Net worth 19.75 PAT / Total assets 15.21 PBDIT / Total assets 25.36 PBDIT / Capital employed 32.71 Liquidity ratios Long term debt / equity (times) 0.01 Total debt / equity (times) 0.01 Current ratio (times) 1.73 Interest cover (times) 1040.00 Gross working capital cycle (days) 108 Net working capital cycle (days) 56 Avg. days of debtors (days) 36 Avg. days of creditors (days) 52 VOP / Total assets 1.086 VOP / GFA (times) 1.659 Total R & D expenditure 0.00 R & D capital 0.00 R & D current 0.00

134
Income & Expenditure Mar 1999 12mths Rs. Crore
IncomeSales 52.03 Manufacturing 32.60 Trading 17.67 Fiscal benefits 0.00 Internal transfers 0.04 Others 1.72 Other income 5.54 Dividend received 1.04 Interest earned 1.51 Miscellaneous income 2.99 Change in stocks 0.00 Finished goods 0.00 Semi-finished goods 0.00 Non-recurring income 1.43 Gain on sale of assets 0.02 Gain on sales of investment 0.11 Provisions written back 1.17 Others 0.13 Expenditure Raw materials, stores, etc. 23.32 Raw materials 8.14 Stores & spares 1.83 Packaging expenses 0.00 Purchase of finished goods 13.35 Wages & salaries 12.48 Energy (power & fuel) 2.50 Other manufacturing expenses 0.26 Indirect taxes 0.69 Excise duties 0.00 Repairs & maintenance 1.19 Plant & machinery 0.73 Other repairs 0.46 Selling & distribution expenses 2.22 Advertising 0.00 Marketing 0.81

135
Distribution 1.24 Provision for doubtful/bad debts 0.17 Amortisation 0.00 Miscellaneous expenses 2.92 Non-recurring expenses 0.00 Loss on sale of assets 0.00 Loss on sale of investment 0.00 Others 0.00 Less: Expenses capitalised 0.00 Interest capitalised 0.00 PBDIT 13.42 Interest 0.01 On short term loans 0.00 On long term loans 0.01 Lease rent 0.00 PBDT 13.41 Depreciation 1.59 PBT 11.82 Tax provision 3.20 Corporate tax 3.20 Other direct taxes 0.00 PAT 8.62 Appropriation of profit Dividends 1.43 Equity dividends 1.43 Preference dividends 0.00 Dividend Tax 0.16 Retained earnings 7.03 Cash profit 10.21 Cash flow from business activities 10.14 Net sales 51.34 Value of output 51.34 Gross value added 24.02

136
Oil India Ltd.
Registered office Corporate Office P.O. Duliajan, Allahabad Bank Bldg. Dibrugarh distt., 17, Parliament Street Assam New Delhi Pin 786602 Pin 110001 Incorporation year : 1959 Ownership group : Central Govt.-Commercial Enterprises Main activity : Crude oil & natural gas BACKGROUND GIST: Oil India Ltd (OIL) is a public sector undertaking involved in the exploration and production of hydrocarbons (crude oil and natural gas), extraction of liquefied petroleum gas and the transportation of hydrocarbons through its pipeline network. The operations of the company are largely concentrated in the North-East region of the country and account for about 7 per cent of the total area being explored in the 26 sedimentary basins in India. OIL holds mining leases covering an area of about 1990 square kms in Assam. It also holds petroleum exploration licenses governing an area of 552 square kms in Arunachal Pradesh. BACKGROUND DETAILS : HISTORY: Oil India Private Ltd was registered as a company in February 1959 as a joint venture between the Government of India and the Burmah Oil Company, UK. The government had a 33.33 per cent stake and the rest of the equity was held by the Burmah Oil Company. The company's name changed to Oil India Ltd (OIL) in 1961 and the equity stakes were realigned to 50:50. The objective of the company was to develop the oil fields discovered in Assam. During the mid-fifties, Assam Oil Company, a subsidiary of Burmah Oil Company, had discovered oil in Nahorkatiya and Moran. In 1981, the Government acquired the entire equity of the company. ACTIVITY: OIL is engaged in the exploration and production of hydrocarbons (crude oil and natural gas), extraction of liquefied petroleum gas and the transportation of hydrocarbons through its pipeline network. The operations of the company are largely concentrated in the North-East region of the country and account for about 7 per cent of the total area being explored in the 26 sedimentary basins in India. As of 31st March 1998, OIL had gross fixed assets of Rs 2632 crore and a net worth of Rs 2035 crore. INFRASTRUCTURE: OIL holds mining leases covering an area of about 1900 square kms in Assam. It also holds petroleum exploration licenses governing an area of 552 square kms in Arunachal Pradesh. It has constructed a pipeline to transport crude oil from the oil fields to the refineries at Gauhati, Barauni and Digboi.

137
Plant Locations : 1 Dulaijan (Dibrugarh, ASS) Crude oil 0.00 3073.63
'000 tonnes Natural gas 0.00 1541.09
Million cu.metres LPG 50.00 51.32
'000 tonnes '000 tonnes Product/s Capacity Production Sales Sales Purchase Manufactured/ Quantity Value Traded /Units /Units /Units Rs. Crore Rs. Crore Crude oil 0.00 3073.64 3062.07 1422.53 0. `000 tonnes `000 tonnes Natural gas 0.00 1541.10 1169.87 131.76 0. Million cu.metresMillion cu.metres LPG 50.00 51.33 51.61 38.18 0. `000 tonnes `000 tonnes `000 tonnes Electricity 41.50 101630.00 0.00 0.01 0.
Mw Kwh Gas condensate 0.00 24000.00 0.00 0.00 0. Tonnes Income from transpor- 0.00 0.00 0.00 42.63 0. tation & scrap Scrap 0.00 0.00 .00 0.34 0.
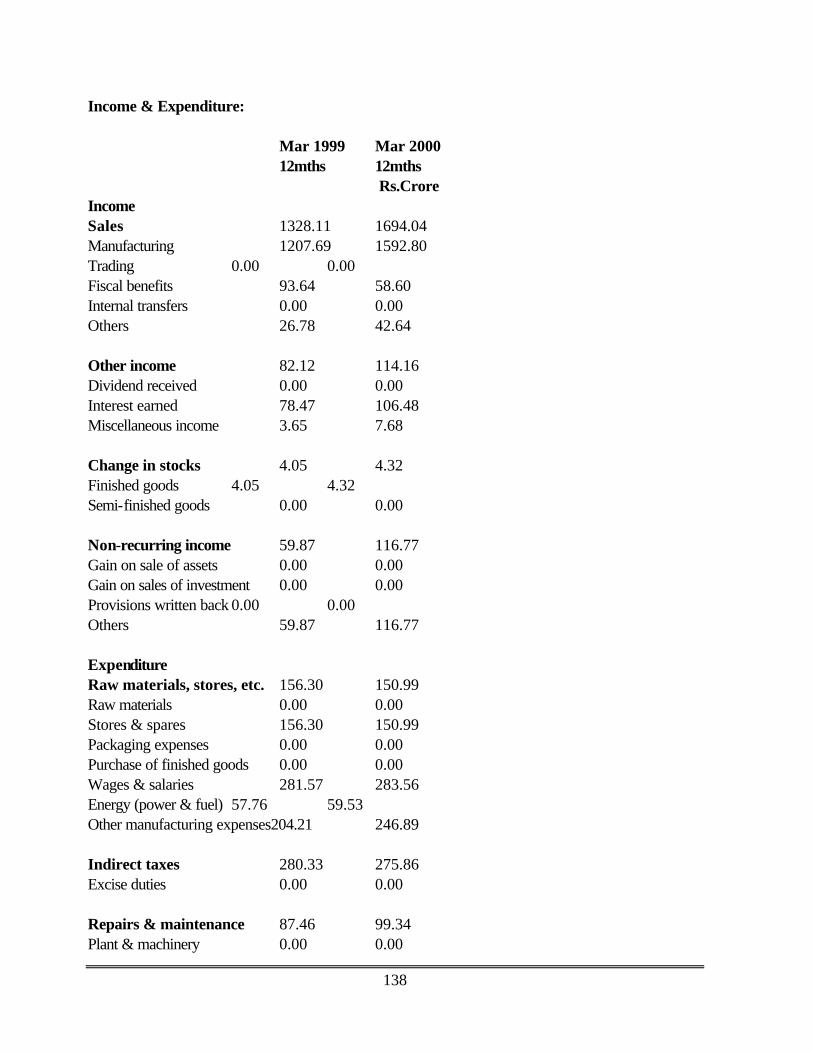
138
Income & Expenditure:
Mar 1999 Mar 2000 12mths 12mths
Rs.Crore Income Sales 1328.11 1694.04 Manufacturing 1207.69 1592.80 Trading 0.00 0.00 Fiscal benefits 93.64 58.60 Internal transfers 0.00 0.00 Others 26.78 42.64 Other income 82.12 114.16 Dividend received 0.00 0.00 Interest earned 78.47 106.48 Miscellaneous income 3.65 7.68 Change in stocks 4.05 4.32 Finished goods 4.05 4.32 Semi-finished goods 0.00 0.00 Non-recurring income 59.87 116.77 Gain on sale of assets 0.00 0.00 Gain on sales of investment 0.00 0.00 Provisions written back 0.00 0.00 Others 59.87 116.77 Expenditure Raw materials, stores, etc. 156.30 150.99 Raw materials 0.00 0.00 Stores & spares 156.30 150.99 Packaging expenses 0.00 0.00 Purchase of finished goods 0.00 0.00 Wages & salaries 281.57 283.56 Energy (power & fuel) 57.76 59.53 Other manufacturing expenses204.21 246.89 Indirect taxes 280.33 275.86 Excise duties 0.00 0.00 Repairs & maintenance 87.46 99.34 Plant & machinery 0.00 0.00

139
Other repairs 87.46 99.34 Selling & distribution expenses 1.82 7.83 Advertising 1.82 1.52 Marketing 0.00 0.00 Distribution 0.00 0.00 Provision for doubtful/bad debts 0.00 6.31 Amortisation 86.68 168.60 Miscellaneous expenses 41.28 50.29 Non-recurring expenses 4.60 76.77 Loss on sale of assets 0.56 1.32 Loss on sale of investment 0.00 0.00 Others 4.04 75.45 Less: Expenses capitalised 311.71 312.03 Interest capitalised 0.00 0.00 PBDIT 583.85 821.66 Interest 31.74 30.38 On short term loans 11.79 12.49 On long term loans 19.95 17.89 Lease rent 0.00 0.00 PBDT 552.11 791.28 Depreciation 138.78 160.46 PBT 413.33 630.82 Tax provision 121.73 221.03 Corporate tax 121.73 221.03 Other direct taxes 0.00 0.00 PAT 291.60 409.79 Appropriation of profit Dividends 78.47 107.00 Equity dividends 78.47 107.00 Preference dividends 0.00 0.00 Dividend Tax 8.63 17.26 Retained earnings 204.50 285.53 Cash profit 517.06 738.85 Cash flow from business activities 0.00 0.00 Net sales 1047.78 1418.18

140
Value of output 1051.83 1422.50
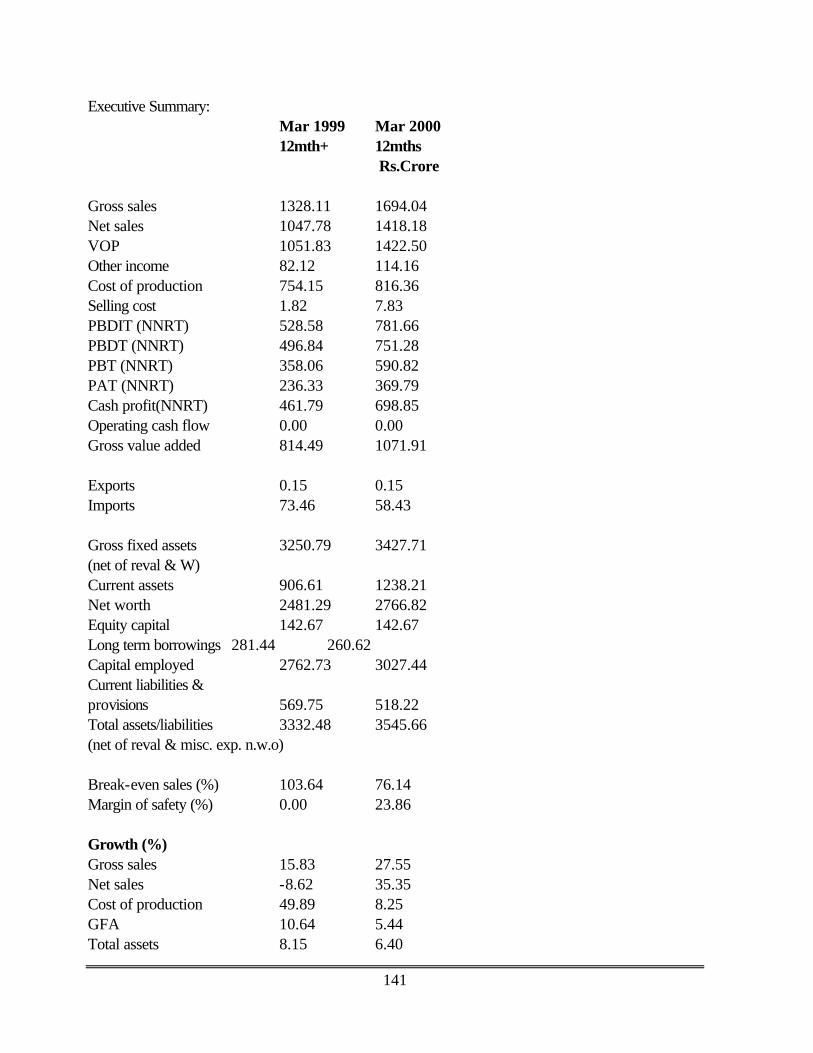
141
Executive Summary: Mar 1999 Mar 2000 12mth+ 12mths
Rs.Crore
Gross sales 1328.11 1694.04 Net sales 1047.78 1418.18 VOP 1051.83 1422.50 Other income 82.12 114.16 Cost of production 754.15 816.36 Selling cost 1.82 7.83 PBDIT (NNRT) 528.58 781.66 PBDT (NNRT) 496.84 751.28 PBT (NNRT) 358.06 590.82 PAT (NNRT) 236.33 369.79 Cash profit(NNRT) 461.79 698.85 Operating cash flow 0.00 0.00 Gross value added 814.49 1071.91 Exports 0.15 0.15 Imports 73.46 58.43 Gross fixed assets 3250.79 3427.71 (net of reval & W) Current assets 906.61 1238.21 Net worth 2481.29 2766.82 Equity capital 142.67 142.67 Long term borrowings 281.44 260.62 Capital employed 2762.73 3027.44 Current liabilities & provisions 569.75 518.22 Total assets/liabilities 3332.48 3545.66 (net of reval & misc. exp. n.w.o) Break-even sales (%) 103.64 76.14 Margin of safety (%) 0.00 23.86 Growth (%) Gross sales 15.83 27.55 Net sales -8.62 35.35 Cost of production 49.89 8.25 GFA 10.64 5.44 Total assets 8.15 6.40

142
Margins (%) PBDIT (NNRT)/Sales 39.80 46.14 PBDT (NNRT)/Sales 37.41 44.35 PAT (NNRT)/Sales 17.79 21.83 PBDIT (NNRT)/Net sales 50.45 55.12 PBDT (NNRT)/Net sales 47.42 52.97 PAT (NNRT)/Net sales 22.56 26.07 Returns ratios (%) PAT/Net worth 9.93 14.09 PAT/Total assets 7.37 10.75 PBDIT/Total assets 16.48 22.73 PBDIT/Capital employed 19.79 27.00 Liquidity ratios Long term debt/equity (times) 0.11 0.09 Total debt/equity (times) 0.12 0.10 Current ratio (times) 1.59 2.39 Interest cover (times) 12.28 20.45 Gross working capital cycle (days) 537 561 Net working capital cycle (days) 489 504 Avg. days of debtors (days) 71 62 Avg. days of creditors (days) 48 57 VOP/Total assets 0.328 0.414 VOP/GFA (times) 0.340 0.426 Total R & D expenditure 0.00 8.20 R & D capital 0.00 0.34 R & D current 0.00 7.86

143
Rossell Industries Ltd. Registered office ``Bally-High'', 1st Floor,1 Ballygunge Park Road Calcutta West Bengal Pin 700019 Incorporation year : 1975 Ownership group : Private (Foreign) Main activity : Tea Listed on : Bombay Stock Exchange Calcutta Stock Exchange National Stock Exchange Originally known as Jokai (Assam) Tea Company Ltd, Rossell Industries was established way back in 1872 when it was registered as a British company in London. In 1973, with the enaction of FERA, the holding pattern and name of the company changed to Jokai India Ltd. The management control then went into the hands of US-based NRI, Rajendra Sethia. But soon he became insolvent with huge liabilities pending with Punjab National Bank (PNB) which he couldn't pay. PNB then became the custodian and tried to manage the company with the help of professionals but with little success. In the early-nineties, the Y. K. Modia and H.L. Gupta purchased the entire equity of the company from PNB in partnership. The name of the company changed to Rossell Industries. Eventually, in 1995, Y.K.Modi parted with the H.L. Gupta. Y.K.Modi retained the Jokai brand and Rossell Industries with eight of the eleven tea gardens, while H.L.Gupta took the other three and set up Rossell Tea Ltd. In April 1999, the company sold off its largest tea estate-Koilamari to Mumbai-based M.K. Shah Exports Ltd, which is merchant-exporter of tea and owns Dorar region of West Bengal. In December 1999, it was reported that Unilever Plc, US, parent company of Hindustan Lever Ltd (HLL) has acquired 65 per cent stake in the company's equity. Unilever also intends to make an open offer to acquire the balance 35 per cent from the shareholders by making a public offer. Plant Locations 1 Koilamari (Lakhimpur, ASS) Tea 0.00 1.63 `000 tonnes

144
2 Bokel (Dibrugarh, ASS) Tea 0.00 1.49 `000 tonnes 3 Daisajan (Dibrugarh, ASS) Tea 0.00 1.17 `000 tonnes 4 Dikom (Dibrugarh, ASS) Tea 0.00 0.00 `000 tonnes 5 Hattialli (Dibrugarh, ASS) Tea 0.00 0.91 `000 tonnes 6 Muttuck (Dibrugarh, ASS) Tea 0.00 0.80 `000 tonnes 7 Nalani (Dibrugarh, ASS) Tea 0.00 1.43 `000 tonnes 8 Nokhroy (Dibrugarh, ASS) Tea 0.00 0.00 `000 tonnes 9 Panitola (Dibrugarh, ASS) Tea 0.00 1.59 `000 tonnes 10 Singlijan (Dibrugarh, ASS) Tea 0.00 0.56 `000 tonnes Income & Expenditure:
Dec 1997 Dec 1998 15mths 12mths Rs.Crore
Income Sales 89.46 75.40 Manufacturing 89.16 75.07 Trading 0.00 0.00 Fiscal benefits 0.00 0.03 Internal transfers 0.00 0.00 Others 0.30 0.30

145
Other income 2.59 2.26 Dividend received 0.01 0.01 Interest earned 1.94 1.29 Miscellaneous income 0.64 0.96 Change in stocks -6.99 5.65 Finished goods 6.99 5.65 Semi-finished goods -13.98 0.00 Non-recurring income 1.92 0.53 Gain on sale of assets 0.00 0.00 Gain on sales of investment 0.00 0.00 Provisions written back 0.00 0.00 Others 1.92 0.53 Expenditure Raw materials, stores, etc. 9.87 12.03 Raw materials -0.00 0.00 Stores & spares 6.86 6.43 Packaging expenses 0.00 0.00 Purchase of finished goods 3.01 5.60 Wages & salaries 26.24 26.49 Energy (power & fuel) 4.76 4.93 Other manufacturing expenses 0.88 0.73 Indirect taxes 1.67 1.72 Excise duties 1.57 1.54 Repairs & maintenance 3.43 4.16 Plant & machinery 1.25 2.02 Other repairs 2.18 2.14 Selling & distribution expenses 9.28 8.53 Advertising 0.08 0.04 Marketing 2.57 2.84 Distirbution 6.63 5.65 Provision for doubtful/bad debts 0.00 0.00 Amortisation 0.08 0.03 Miscellaneous expenses 9.49 8.97 Non-recurring expenses 0.71 0.62 Loss on sale of assets 0.04 0.40 Loss on sale of investment 0.00 0.11 Others 0.67 0.11 Less: Expenses capitalised 0.00 0.00

146
Interest capitalised 0.00 0.00 PBDIT 20.57 15.63 Interest 9.08 6.91 On short term loans 2.30 2.48 On long term loans 6.78 4.43 Lease rent 0.93 0.60 PBDT 10.56 8.12 Depreciation 2.32 1.91 PBT 8.24 6.21 Tax provision 0.00 0.51 Corporate tax 0.00 0.51 Other direct taxes 0.00 0.00 PAT 8.24 5.70 Appropriation of profit Dividends 1.52 1.52 Equity dividends 1.52 1.52 Preference dividends 0.00 0.00 Dividend Tax 0.15 0.15 Retained earnings 6.57 4.03 Cash profit 10.64 7.64 Cash flow from business activities 17.34 12.25 Net sales 87.79 73.68 Value of output 80.80 79.33 Gross value added 46.80 43.10

147
Executive Summary: Dec 1997 Dec 1998
15mths 12mths Rs.Crore
Gross sales 89.46 75.40 Net sales 87.79 73.68 VOP 80.80 79.33 Other income 2.59 2.26 Cost of production 51.43 40.16 Selling cost 9.28 8.53 PBDIT (NNRT) 19.36 15.72 PBDT (NNRT) 9.35 8.21 PBT (NNRT) 7.03 6.30 PAT (NNRT) 7.03 5.79 Cash profit(NNRT) 9.43 7.73 Operating cash flow 17.34 12.25 Gross value added 46.80 43.10 Exports 17.41 19.53 Imports 2.02 3.19 Gross fixed assets (net of reval & W) 58.97 60.43 Current assets 26.03 31.66 Net worth 53.47 57.53 Equity capital 10.12 10.12 Long term borrowings 33.49 24.73 Capital employed 86.96 82.26 Current liabilities & provisions 17.11 28.26 Total assets/liabilities (net of reval & misc. exp. n.w.o) 104.07 110.52 Break-even sales (%) 69.17 73.98 Margin of safety (%) 30.83 26.02 Growth (%)Gross sales 27.36 -15.72 Net sales 27.45 -16.07 Cost of production 3.73 -21.90 GFA 5.04 2.48 Total assets 7.23 6.20 Margins (%) PBDIT (NNRT)/Sales 21.64 20.85 PBDT (NNRT)/Sales 10.45 10.89 PAT (NNRT)/Sales 7.86 7.68

148
PBDIT (NNRT)/Net sales 22.05 21.34 PBDT (NNRT)/Net sales 10.65 11.14 PAT (NNRT)/Net sales 8.01 7.86 Returns ratios (%) PAT/Net worth 14.02 10.43 PAT/Total assets 6.99 5.40 PBDIT/Total assets 19.25 14.65 PBDIT/Capital employed 22.84 18.58 Liquidity ratios Long term debt/equity (times) 0.63 0.43 Total debt/equity (times) 0.73 0.65 Current ratio (times) 1.52 1.12 Interest cover (times) 1.70 1.84 Gross working capital cycle (days) 234 278 Net working capital cycle (days) 219 256 Avg. days of debtors (days) 25 37 Avg. days of creditors (days) 15 22 VOP/Total assets 0.804 0.739 VOP/GFA (times) 1.404 1.329 Total R & D expenditure 0.00 0.00 R & D capital 0.00 0.00 R & D current 0.00 0.00
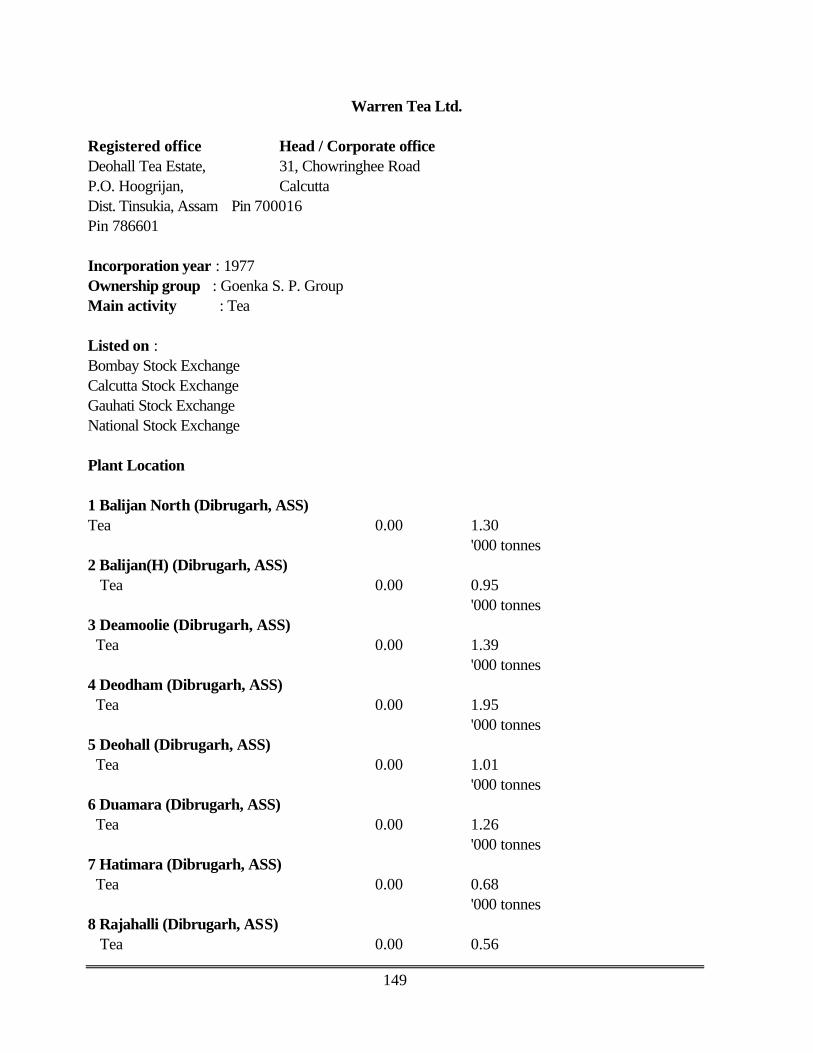
149
Warren Tea Ltd. Registered office Head / Corporate office Deohall Tea Estate, 31, Chowringhee Road P.O. Hoogrijan, Calcutta Dist. Tinsukia, Assam Pin 700016 Pin 786601 Incorporation year : 1977 Ownership group : Goenka S. P. Group Main activity : Tea Listed on : Bombay Stock Exchange Calcutta Stock Exchange Gauhati Stock Exchange National Stock Exchange Plant Location 1 Balijan North (Dibrugarh, ASS) Tea 0.00 1.30 '000 tonnes 2 Balijan(H) (Dibrugarh, ASS) Tea 0.00 0.95 '000 tonnes 3 Deamoolie (Dibrugarh, ASS) Tea 0.00 1.39 '000 tonnes 4 Deodham (Dibrugarh, ASS) Tea 0.00 1.95 '000 tonnes 5 Deohall (Dibrugarh, ASS) Tea 0.00 1.01 '000 tonnes 6 Duamara (Dibrugarh, ASS) Tea 0.00 1.26 '000 tonnes 7 Hatimara (Dibrugarh, ASS) Tea 0.00 0.68 '000 tonnes 8 Rajahalli (Dibrugarh, ASS) Tea 0.00 0.56

150
'000 tonnes 9 Rupai (Dibrugarh, ASS) Tea 0.00 1.46 '000 tonnes 10 Sealkotee (Dibrugarh, ASS) Tea 0.00 0.89 '000 tonnes 11 Tara (Dibrugarh, ASS) Tea 0.00 1.44 '000 tonnes 12 Zaloni (Dibrugarh, ASS) Tea 0.00 1.07 '000 tonnes 13 Thowra (Sibsagar, ASS) Tea 0.00 0.67 '000 tonnes

151
Income & Expenditure:
Mar 1999 Mar 2000 12mths 12mths
Rs. Crore IncomeSales 131.85 141.69 Manufacturing 131.36 134.87 Trading 0.00 0.00 Fiscal benefits 0.00 0.00 Internal transfers 0.00 0.00 Others 0.49 6.82 Other income 3.25 2.70 Dividend received 0.02 0.05 Interest earned 2.95 2.23 Miscellaneous income 0.28 0.42 Change in stocks -3.44 1.21 Finished goods -3.44 1.21 Semi-finished goods 0.00 0.00 Non-recurring income 0.24 0.41 Gain on sale of assets 0.00 0.01 Gain on sales of investment 0.00 0.00 Provisions written back 0.03 0.05 Others 0.21 0.35 ExpenditureRaw materials, stores, etc. 17.14 20.59 Raw materials 0.00 0.00 Stores & spares 17.14 20.59 Packaging expenses 0.00 0.00 Purchase of finished goods 0.00 0.00 Wages & salaries 46.48 49.37 Energy (power & fuel) 4.72 5.61 Other manufacturing expenses 0.87 7.61 Indirect taxes 0.48 3.03 Excise duties 0.48 3.03 Repairs & maintenance 8.01 2.38 Plant & machinery 0.95 1.16 Other repairs 7.06 1.22 Selling & distribution expenses 11.75 14.88

152
Advertising 0.00 0.00 Marketing 2.64 2.70 Distribution 9.11 10.72 Provision for doubtful/bad debts 0.00 1.46 Amortisation 0.00 0.00 Miscellaneous expenses 8.68 10.13 Non-recurring expenses 0.12 0.25 Loss on sale of assets 0.02 0.00 Loss on sale of investment 0.00 0.00 Others 0.10 0.25 Less: Expenses capatalised 0.00 0.00 Interest capitalised 0.00 0.00 PBDIT 33.65 32.16 Interest 2.42 2.69 On short term loans 2.06 2.69 On long term loans 0.36 0.00 Lease rent 0.00 0.00 PBDT 31.23 29.47 Depreciation 4.66 5.06 PBT 26.57 24.41 Tax provision 8.00 7.50 Corporate tax 8.00 7.50 Other direct taxes 0.00 0.00 PAT 18.57 16.91 Appropriation of profit Dividends 8.56 8.56 Equity dividends 8.56 8.56 Preference dividends 0.00 0.00 Dividend Tax 0.90 1.00 Retained earnings 9.11 7.35 Cash profit 23.23 21.97 Cash flow from business activities 32.40 19.45 Net sales 131.37 38.66 Value of output 127.93 139.87 Gross value added 82.36 84.09

153
Executive Summary Mar 1999 Mar 2000
12mths 12mths Rs. Crore
Gross sales 131.85 141.69 Net sales 131.37 138.66 VOP 127.93 139.87 Other income 3.25 2.70 Cost of production 60.88 74.59 Selling cost 11.75 14.88 PBDIT (NNRT) 33.53 32.00 PBDT (NNRT) 31.11 29.31 PBT (NNRT) 26.45 24.25 PAT (NNRT) 18.45 16.75 Cash profit (NNRT) 23.11 21.81 Operating cash flow 32.40 19.45 Gross value added 82.36 84.09 Exports 23.80 22.86 Imports 4.80 6.29 Gross fixed assets (net of reval & W) 96.75 107.46 Current assets 75.29 90.21 Net worth 87.69 95.04 Equity capital 10.70 10.70 Long term borrowings 6.00 12.46 Capital employed 93.69 107.50 Current liabilities & provisions 43.97 46.82 Total assets / liabilities (net of reval & misc. exp. n.w.o) 137.66 154.32 Break-even sales (%) 60.71 62.14 Margin of safety (%) 39.29 37.86 Growth (%) Gross sales 3.00 7.46 Net sales 2.62 5.55 Cost of production 0.63 22.53 GFA 7.23 11.07 Total assets 8.90 12.10 Margins (%)

154
PBDIT (NNRT) / Sales 25.43 22.58 PBDT (NNRT) / Sales 23.59 20.69 PAT (NNRT) / Sales 13.99 11.82 PBDIT (NNRT) / Net sales 25.52 23.08 PBDT (NNRT) / Net sales 23.68 21.14 PAT (NNRT) / Net sales 14.04 12.08 Returns ratios (%) PAT / Net worth 22.19 18.33 PAT / Total assets 13.97 11.47 PBDIT / Total assets 25.39 21.92 PBDIT / Capital employed 36.78 31.81 Liquidity ratios Long term debt / equity (times) 0.07 0.13 Total debt / equity (times) 0.07 0.13 Current ratio (times) 1.71 1.93 Interest cover (times) 11.93 10.01 Gross working capital cycle (days) 133 143 Net working capital cycle (days) 68 76 Avg. days of debtors (days) 24 32 Avg. days of creditors (days) 64 67 VOP / Total assets 0.969 0.958 VOP / GFA (times) 1.368 1.370 Total R & D expenditure 0.00 0.00 R & D capital 0.00 0.00 R & D current 0.00 0.00