STUDY REGARDING THE INFLUENCE OF SUBLIMINAL … · romanian journal of experimental applied...
19
ROMANIAN JOURNAL OF EXPERIMENTAL APPLIED PSYCHOLOGY VOL. 5, ISSUE 4 – www.rjeap.ro STUDY REGARDING THE INFLUENCE OF SUBLIMINAL MESSAGES ON PRODUCT CHOICE MIHAI ANIŢEI , MĂDĂLINA CURELEA b a,b University of Bucharest, Faculty of Psychology and Educational Sciences Abstract The present study proposed to show the fact that audio subliminal stimuli may influence the behavior of choosing certain food and beverage producs among students at Psychology. The subjects of this research study were 193 students, 129 female and 64 male, aged between 19 and 35 years old M=21.71; S.D.=2.70), students at the Faculty of Psychology and Educational Sciences, University of Bucharest. They have been divided into six different experimental groups. The utilized materiales included playing a melody which words were inserted on a auditive subliminal naming fruit, beverage and sandwich. The dependent variables were the following: the number of words the subkects hear during the melody, the hunger sensation induced and preference for a certain type of food (fruit, sweeets, sandwiches). The independent variables were: the intensity of words registered during the melody (high, low, very low). Also answer charts were utilized (both with images and text which represents the words registered during the melody) which the participants complete after listening to the stimuli-melody. The obtained results following hypothesis testing were partially confirmed (hypothesis 2 and partially, hypothesis 1). The study may be extended within populations different regarding age, qualifications and applied subliminal stimuli. Cuvinte cheie: stimuli subliminali, mâncare, sete, foame, alegerea consumatorului. Keywords: subliminal stimuli food, thirst, hurger, consumer choise.
Transcript of STUDY REGARDING THE INFLUENCE OF SUBLIMINAL … · romanian journal of experimental applied...

ROMANIAN JOURNAL OF
EXPERIMENTAL APPLIED PSYCHOLOGY
VOL. 5, ISSUE 4 – www.rjeap.ro
STUDY REGARDING THE INFLUENCE OF SUBLIMINAL
MESSAGES ON PRODUCT CHOICE
MIHAI ANIŢEI , MĂDĂLINA CURELEA b
a,bUniversity of Bucharest,
Faculty of Psychology and Educational Sciences
Abstract
The present study proposed to show the fact that audio subliminal stimuli may
influence the behavior of choosing certain food and beverage producs among
students at Psychology. The subjects of this research study were 193 students, 129
female and 64 male, aged between 19 and 35 years old M=21.71; S.D.=2.70),
students at the Faculty of Psychology and Educational Sciences, University of
Bucharest. They have been divided into six different experimental groups. The
utilized materiales included playing a melody which words were inserted on a
auditive subliminal naming fruit, beverage and sandwich. The dependent variables
were the following: the number of words the subkects hear during the melody, the
hunger sensation induced and preference for a certain type of food (fruit, sweeets,
sandwiches). The independent variables were: the intensity of words registered
during the melody (high, low, very low). Also answer charts were utilized (both
with images and text which represents the words registered during the melody)
which the participants complete after listening to the stimuli-melody. The obtained
results following hypothesis testing were partially confirmed (hypothesis 2 and
partially, hypothesis 1). The study may be extended within populations different
regarding age, qualifications and applied subliminal stimuli.
Cuvinte cheie: stimuli subliminali, mâncare, sete, foame, alegerea
consumatorului.
Keywords: subliminal stimuli food, thirst, hurger, consumer choise.

55
1. INTRODUCTION
Ducoffe (1996) apud Kim & Han (2014) consider that within the
advertisement domain the most important factors are the cognitive and affective
ones. The authors consider that the cognitive factors include the perception on
information and credibility in advertising as long as the content has an informative
purpose (Aaker, Norris, 1982 apud Kim, Han, 2014). MacKenzie & Lutz (1989)
apud Kim & Han (2014) emphasize the fact that the advertising credibility refers to
the general perception of the consumer regarding the veridicity of the advertising.
Schlinger (1979b) apud Hyun, Kim &Lee (2011) consider that stimulating in
advertising indicates that it is pleasent, enterteining in order to be followed and has
the role of influencing the consumer’s attitude. Eisend (2006) proposes a
metaanalyzis of advertising based on empirical data within professional literature
and shows that the study results confirm that persuasive messages in advertising
depend on the information quantity, the attribute’s quality, plasing negative
information, marketing volunteering, correlation between positive and negative
attributes. Manolea, Chraif, Sebastian & Ciolacu (2012) conducted an experiment
that highlights the influence of triangle subliminal geometrical forms in choosing
the most desired geometrical form.
Gorn, 1982 (apud Alperta, Alpert and Maltz, 2005) have emphasized that
background music utilized in commercials can be associated to the promoted
product, both consciously and unconsciously, influencing the consumer regard the
product choice by classical conditioning. In this regard authors show that by
classical conditioninng, the exposed product is correlated to positive emotions
transmitted by likeable music.
Lewis (1981) apud Hyun, Kim & Lee (2011) have shown that when
managers experiment pleasent feelings towards advertising, they have the tendency
of offering a larger quantity of positive information.
Doron and Parot (2007) define the subliminal stimuli as a type of stimuli
which is placed under the absolute treshold, or connected to the distance between

56
two stimuli, a difference which cannot reach the differential treshold. It also
describes an event situated beyond any treshold.” (Doron & Parot, 2007, p756).
Hawkins, 1970 (apud Chandrasekera, Vo, D’Souza, 2012) have demonstrated
that there is a possibility of inducing subliminal suggestions in short inspiration
moments using external stimuli, through subliminal suggestions, namely stimuli
under the mínimum of awarness level.
Dehaene et al. (1998) apud Bustin et al (2012) have shown that the
unconscious stimuli influence the semantic processing, emotional processing
(Morris, Öhman, & Dolan, 1998 apud Bustin et al, 2012), the product choice
(Verwijmeren, Karremans, Stroebe, & Wigboldus, 2011 apud Bustin et al, 2012 )
and action planification (Binsted, Brownell, Vorontsova, Heath, & Saucier, 2007
apud Bustin et al, 2012).
According to Verwijmeren, T., et al (2013), in adverrtising, subliminal stimuli
operates as an automatic process, which people are not aware of.
Karremans, Stroebe, & Claus (2006) apud Verwijmeren, T.,et al (2013) have
demonstrated that, in specific conditions, subliminal advertising may affect the
consumer’s behavior in choosing certain products.
Karremans et al (2006) apud (Verwijmeren, T.,et al, 2013) have shown that
subliminal action for the benefit of a certain soda company has increased the desire
of drinking it only among the subjects who were already thristy.
Strahan, Spencer, și Zanna (2002) apud Verwijmeren, T.,et al, 2013) have
demonsted there is a relevant ovjective of the subliminal message (such as thirst)
which affects the announcement’s persuasión of directing the objective (decreasing
the thirst), when there is a motivation of reaching the objective (when the thirst is
present, or instance).

57
2. OBJECTIVE AND HYPOTHESES
2.1. OBJECTIVE
The present study objective was to emphasize the influence of subliminal
audio messages on consumers. In other words the research was focused on
inducing the participants the feeling of hunger and preference for a certain type of
food on a consciously activated musical background. Such messages were
describing certain food types such as fruit, sweets, sandwiches, etc.
2.2. HYPOTHESES
Hypothesis 1: The more the recorded speech intensity during melody
increases, the more the participants will hear more recorded words during the song
during both tasks.
Hypothesis 2: The more the recorded speech intensity decreases during
the melody, the more the participants will be induced the feeling of hunger during
both tasks.
Hypothesis 3: The more the intensity of speech decreases during the
melody, the more the participants will have preferences for types of foods
described by words recorded within the melody (fruit, sweets, sandwich).
Hypothesis 4: There are statistically significant differences between the
subject’s responses in the first situation compared to the responses from the second
part of testing, thus, the number of participants from the second test phase who will
be induced the sensation of hunger and will present preferences for types of foods
presented during the melody, but also the number of words heard during the
melody will be higher compared to the participants of the first situation. The
diversity of perspectives on a creative group task influences the number of
categories for the ideas generated.

58
3. METHOD
3.1. PARTICIPANTS
The participants were 193 undergraduate students, 129 female participants
and 64 male participants, age between 19 and 35 years old (M=21.71; S.D.=2.70)
Faculty of Psychology and Educational Sciences, University of Bucharest. They
were split in 6 experimental groups according the experimental design.
3.2. INSTRUMENTS
The following instruments have been used:
A melody with Romanian lyrics;
The stimuli recorded between the melody lyrics, pronounced in Romanian
language: 6 words representing food (3 fruits: banana, orange and apple; 2 sweets:
croissant and chocolate and the word “sandwich”). The stimuli were listened using
a laptop and sound devices.
The response files were included in two categories: one with images and
the other with words representing the stimuli mixed with another fruits and sweets.
3.3. PROCEDURE
The participants were told they will listen to a melody which they will have to
pay attention to. They were asked both not to talk to each other and to closed
windows, the door and turn off the mobile phones in order to hear the melody as
well as possible.
Following the melody, they were told to complete a chart, being asked not to
talk to each other during the completion. Also, they were told, although it was
already written in the chart instructions, that their answers are confidential and
used strictly for academic purpose; also, their answers were anonymous. Both in
the final part of completing the chart and at the end of the testing, the participants
were thanked for their contribution and time dedicated for the present study.

59
3.4. EXPERIMENTAL DESIGN
The study included the following variables:
Dependent variables:
Number of words the subjects hear during the melody
Hunger sensation
Preference for a certain type of food (fruit, sweets, sandwiches)
Independent varibles:
Intensity of words recoded during the melody (loud, low and very low)
Situation 1
Situation 2
Reponses charts (both images and text representing words recorded during the
melody) the participants will complete after listening to the melody. (Chraif, 2013)
High, low and
very low intensity
audio stimuli
Correct word
recognition stimuli
Stimuli auditivi
la intensitatea mare,
mică și foarte mică
Correct visual
recognition stimuli

60
4. RESULTS
Data has been analyzed using SPSS 15.
Table 1 Descriptive statistics for the variables measured in the first experimental situation.
N Mean
Std.
Deviation
Std.
Error
95% Confidence
Interval for Mean
Minimum Maximum
Lower
Bound
Upper
Bound
Cuv_alese_prm_sit ,00 35 4,0857 1,59727 ,26999 3,5370 4,6344 ,00 6,00 1,00 33 3,3333 1,13652 ,19784 2,9303 3,7363 2,00 6,00
2,00 32 2,2813 1,39664 ,24689 1,7777 2,7848 ,00 5,00
Total 100 3,2600 1,56747 ,15675 2,9490 3,5710 ,00 6,00 Nevoie_prm_si ,00 35 ,7143 ,71007 ,12002 ,4704 ,9582 ,00 2,00
1,00 33 ,9091 ,84275 ,14670 ,6103 1,2079 ,00 2,00
2,00 32 ,9375 ,71561 ,12650 ,6795 1,1955 ,00 2,00 Total 100 ,8500 ,75712 ,07571 ,6998 1,0002 ,00 2,00
Pref_prm_sit
,00 35 1,1143 1,38843 ,23469 ,6373 1,5912 ,00 3,00
1,00 33 ,7576 1,22552 ,21334 ,3230 1,1921 ,00 3,00 2,00 32 1,0313 1,23090 ,21759 ,5875 1,4750 ,00 3,00
Total 100 ,9700 1,28279 ,12828 ,7155 1,2245 ,00 3,00
1. Table 1 presents the means, standard deviations, minimum and maximum
scores for each variable included in the first situation. We may notice that the mean
of the words selected after listening to a high intensity melody is higher (m=4,08,
ab.st=1.59) compared to the mean of words selected after the lower intensity
melody (m=3,33, ab.std=1,13) and compared to the mean of words selected after
the very low intensity melody (m=2,28, ab.std=1,39).
2. The mean score of the need experienced after listening to a high intensity
melody is lower (m=0,71, ab.std=0,71) compared to the need felt after listening to
the lower intensity melody (m=0,90, ab. Std=0,84) and the need experienced after
listening to the very low intensity melody (m=0,93, ab. Std=0,71).
3. The mean of the preferences shown after listening to a high intensity
melody (m=1,11, ab.std=1,38) compared to the mean of the preferences
experienced after listening to the lower intensity melody (m=0,75, ab.std=1,22) and
the mean of preferences shown after listening to the very low intensity melody
(m=1,03, ab.std=1,23).

61
In table 2 we may notice that the Skewness and Kurtosis values are placed
within the (-2, 2) range, resulting that the normality is not affected, thus, parametric
tests are viable.
Table 2 Skewness and Kurtosis values for the variables: words chosen in the first situation, needs in the first situation and preferences show in the first situation
Cuv_alese_prm_sit Nevoie_prm_sit Pref_prm_sit
N Valid 100 100 100
Missing 4 4 4
Skewness -,122 ,258 ,760
Std. Error of Skewness ,241 ,241 ,241
Kurtosis -,607 -1,205 -1,235
Std. Error of Kurtosis ,478 ,478 ,478
Table 3 shows results of the One-Way ANOVA for variables included in the
first situation. Thus, we notice that there is a statistically significant difference
between the number of words chosen after listening to the melody, the number of
words chosen being significantly lower when the intensity of the melody was
lower, as the model is statistically significant by F(2, 97) = 14.06, p<0.05. After
such results, the first research hypothesis according to which – the more the
intensity of recorded speech during the melody increases, the more the participants
will hear more words recorded during the melody during the both tasks, has been
confirmed.
Table 3 One-Way ANOVA in the first situation
Sum of Squares df Mean Square F Sig.
Cuv_alese_prm_sit Between Groups 54,695 2 27,348 14,069 ,000 Within Groups 188,545 97 1,944
Total 243,240 99
Nevoie_prm_sit Between Groups 1,005 2 ,502 ,874 ,420 Within Groups 55,745 97 ,575
Total 56,750 99
Pref_prm_sit Between Groups 2,338 2 1,169 ,706 ,496 Within Groups 160,572 97 1,655
Total 162,910 99
62
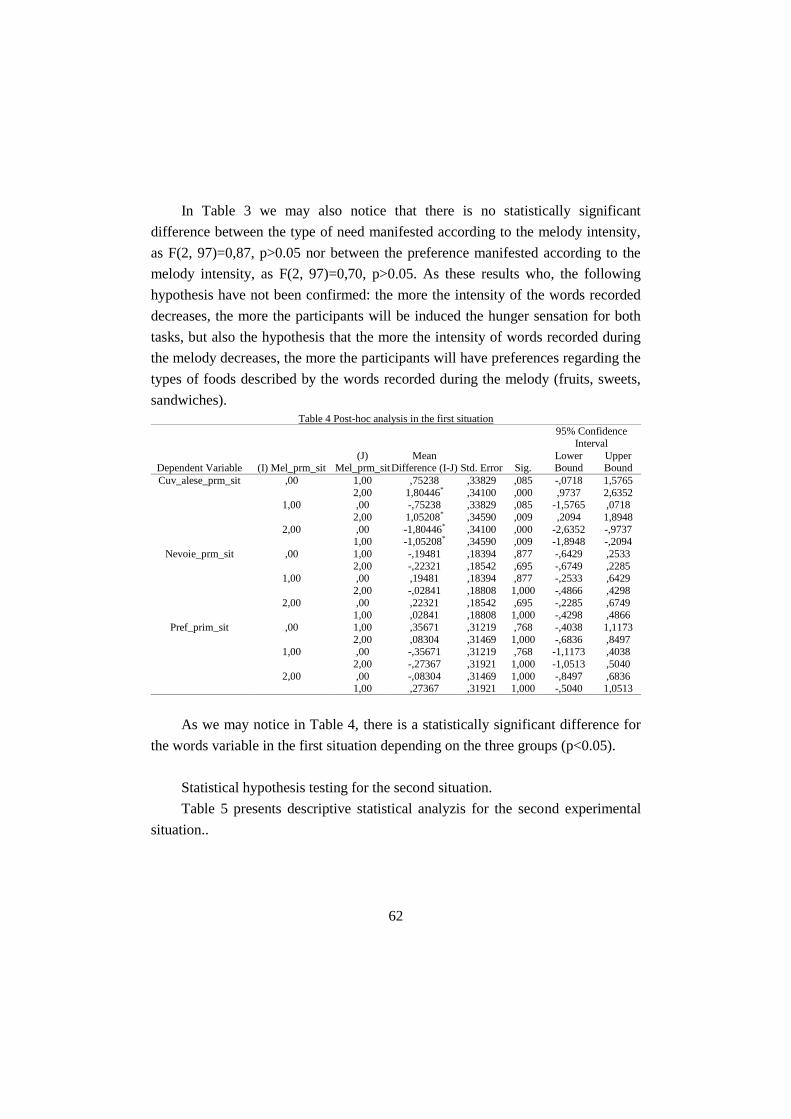
In Table 3 we may also notice that there is no statistically significant
difference between the type of need manifested according to the melody intensity,
as F(2, 97)=0,87, p>0.05 nor between the preference manifested according to the
melody intensity, as F(2, 97)=0,70, p>0.05. As these results who, the following
hypothesis have not been confirmed: the more the intensity of the words recorded
decreases, the more the participants will be induced the hunger sensation for both
tasks, but also the hypothesis that the more the intensity of words recorded during
the melody decreases, the more the participants will have preferences regarding the
types of foods described by the words recorded during the melody (fruits, sweets,
sandwiches).
Table 4 Post-hoc analysis in the first situation
Dependent Variable (I) Mel_prm_sit (J)
Mel_prm_sit Mean
Difference (I-J) Std. Error Sig.
95% Confidence
Interval
Lower Bound
Upper Bound
Cuv_alese_prm_sit ,00 1,00 ,75238 ,33829 ,085 -,0718 1,5765
2,00 1,80446* ,34100 ,000 ,9737 2,6352 1,00 ,00 -,75238 ,33829 ,085 -1,5765 ,0718
2,00 1,05208* ,34590 ,009 ,2094 1,8948
2,00 ,00 -1,80446* ,34100 ,000 -2,6352 -,9737 1,00 -1,05208* ,34590 ,009 -1,8948 -,2094
Nevoie_prm_sit ,00 1,00 -,19481 ,18394 ,877 -,6429 ,2533
2,00 -,22321 ,18542 ,695 -,6749 ,2285 1,00 ,00 ,19481 ,18394 ,877 -,2533 ,6429
2,00 -,02841 ,18808 1,000 -,4866 ,4298
2,00 ,00 ,22321 ,18542 ,695 -,2285 ,6749
1,00 ,02841 ,18808 1,000 -,4298 ,4866
Pref_prim_sit ,00 1,00 ,35671 ,31219 ,768 -,4038 1,1173
2,00 ,08304 ,31469 1,000 -,6836 ,8497 1,00 ,00 -,35671 ,31219 ,768 -1,1173 ,4038
2,00 -,27367 ,31921 1,000 -1,0513 ,5040
2,00 ,00 -,08304 ,31469 1,000 -,8497 ,6836 1,00 ,27367 ,31921 1,000 -,5040 1,0513
As we may notice in Table 4, there is a statistically significant difference for
the words variable in the first situation depending on the three groups (p<0.05).
Statistical hypothesis testing for the second situation.
Table 5 presents descriptive statistical analyzis for the second experimental
situation..
63
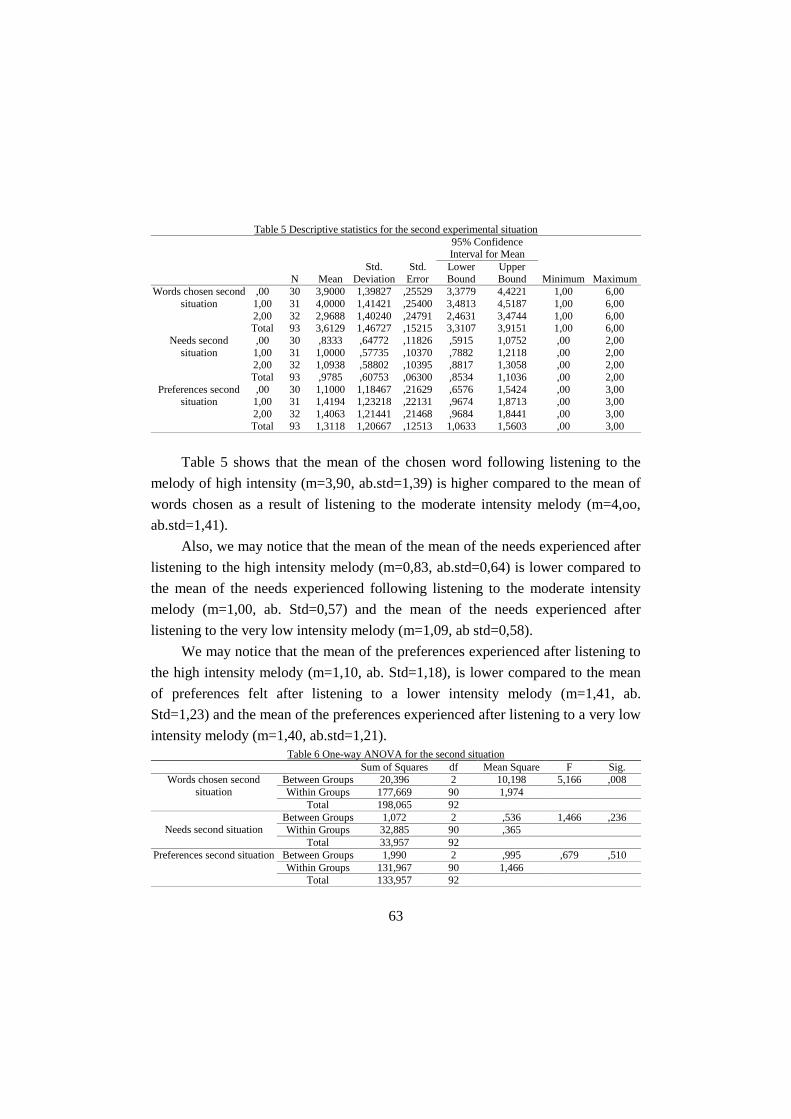
Table 5 Descriptive statistics for the second experimental situation
N Mean
Std.
Deviation
Std.
Error
95% Confidence Interval for Mean
Minimum Maximum
Lower
Bound
Upper
Bound
Words chosen second
situation
,00 30 3,9000 1,39827 ,25529 3,3779 4,4221 1,00 6,00
1,00 31 4,0000 1,41421 ,25400 3,4813 4,5187 1,00 6,00
2,00 32 2,9688 1,40240 ,24791 2,4631 3,4744 1,00 6,00 Total 93 3,6129 1,46727 ,15215 3,3107 3,9151 1,00 6,00
Needs second
situation
,00 30 ,8333 ,64772 ,11826 ,5915 1,0752 ,00 2,00
1,00 31 1,0000 ,57735 ,10370 ,7882 1,2118 ,00 2,00
2,00 32 1,0938 ,58802 ,10395 ,8817 1,3058 ,00 2,00
Total 93 ,9785 ,60753 ,06300 ,8534 1,1036 ,00 2,00
Preferences second situation
,00 30 1,1000 1,18467 ,21629 ,6576 1,5424 ,00 3,00 1,00 31 1,4194 1,23218 ,22131 ,9674 1,8713 ,00 3,00
2,00 32 1,4063 1,21441 ,21468 ,9684 1,8441 ,00 3,00
Total 93 1,3118 1,20667 ,12513 1,0633 1,5603 ,00 3,00
Table 5 shows that the mean of the chosen word following listening to the
melody of high intensity (m=3,90, ab.std=1,39) is higher compared to the mean of
words chosen as a result of listening to the moderate intensity melody (m=4,oo,
ab.std=1,41).
Also, we may notice that the mean of the mean of the needs experienced after
listening to the high intensity melody (m=0,83, ab.std=0,64) is lower compared to
the mean of the needs experienced following listening to the moderate intensity
melody (m=1,00, ab. Std=0,57) and the mean of the needs experienced after
listening to the very low intensity melody (m=1,09, ab std=0,58).
We may notice that the mean of the preferences experienced after listening to
the high intensity melody (m=1,10, ab. Std=1,18), is lower compared to the mean
of preferences felt after listening to a lower intensity melody (m=1,41, ab.
Std=1,23) and the mean of the preferences experienced after listening to a very low
intensity melody (m=1,40, ab.std=1,21).
Table 6 One-way ANOVA for the second situation
Sum of Squares df Mean Square F Sig.
Words chosen second
situation
Between Groups 20,396 2 10,198 5,166 ,008
Within Groups 177,669 90 1,974
Total 198,065 92
Needs second situation
Between Groups 1,072 2 ,536 1,466 ,236
Within Groups 32,885 90 ,365
Total 33,957 92
Preferences second situation Between Groups 1,990 2 ,995 ,679 ,510
Within Groups 131,967 90 1,466
Total 133,957 92

64
Table 6 presents the results of the One-Way ANOVA test for the variables
included in the second situation. Therefore, we notice there is a statistically
significant difference between the number of words chosen after listening to the
melody, the number of words chosen being significantly lower when the intensity
of the melody has been reduced, as the model is statistically significant by F(2, 90)
= 5.16, p<0.05. Thus, the first hypothesis of the research namely the more the
intensity of the words recorded during the melody increases, the more the
participants will hear more words recorded during the melody for both tasks has
been confirmed.
Also, we may notice there is no statistically significant difference between the
type of need manifested according to the melody intensity, with cu F(2,90)=1,46,
p>0.05, nor the preference manifested according to the melody intensity with
F(2,90)=0,67, p>0.05. Considering these results, the following hypothesis: the
more the intensity of the words recorded during the melody decreases, the more the
participants will be induced the feeling of hunger for both tasks and also the
hypothesis according to which the more the intensity of words recording during the
melody decreases, the more the participants will present preferences for types of
foods induced by words recorded during the melody (fruit, sweets, sandwich) have
not been confirmed.
In table 6 presents the Post-Hoc Bonferoni analysis for the second
experimental situation.
Table 6 Post-Hoc Bonferoni for the second situation
Dependent Variable (I)
Melody_img (J)
Melody_img
Mean
Difference (I-J) Std. Error Sig.
95% Confidence Interval
Lower Bound Upper Bound
Words chosen
second situation
,00 1,00 -,10000 ,35984 1,000 -,9778 ,7778
2,00 ,93125* ,35706 ,032 ,0602 1,8023
1,00 ,00 ,10000 ,35984 1,000 -,7778 ,9778
2,00 1,03125* ,35408 ,014 ,1675 1,8950
2,00 ,00 -,93125* ,35706 ,032 -1,8023 -,0602
1,00 -1,03125* ,35408 ,014 -1,8950 -,1675
Needs second situation
,00 1,00 -,16667 ,15481 ,854 -,5443 ,2110
2,00 -,26042 ,15362 ,280 -,6352 ,1143
1,00 ,00 ,16667 ,15481 ,854 -,2110 ,5443
2,00 -,09375 ,15233 1,000 -,4654 ,2779
2,00 ,00 ,26042 ,15362 ,280 -,1143 ,6352

65
1,00 ,09375 ,15233 1,000 -,2779 ,4654
Preferences second situation
,00 1,00 -,31935 ,31012 ,918 -1,0759 ,4372
2,00 -,30625 ,30773 ,967 -1,0570 ,4445
1,00 ,00 ,31935 ,31012 ,918 -,4372 1,0759
2,00 ,01310 ,30516 1,000 -,7313 ,7576
2,00 ,00 ,30625 ,30773 ,967 -,4445 1,0570
1,00 -,01310 ,30516 1,000 -,7576 ,7313
In order to test the last research hypothesis: There are statistically significant
differences between the subject’s responses in the first situation compared to the
responses from the second part of testing, thus, the number of participants from the
second test phase who will be induced the sensation of hunger and will present
preferences for types of foods presented during the melody, but also the number of
words heard during the melody will be higher compared to the participants of the
first situation the T-student for dependent samples was applied.
Table 7 Descriptive statistics for the variables in both experimental situations
Mean N Std. Deviation Std. Error Mean
Pair 1 Words chosen firs situation 3,2697 89 1,61502 ,17119
Words chosen second situation 3,6180 89 1,48864 ,15780
Pair 2 Needs first situation ,8876 89 ,76036 ,08060 Needs second situation ,9663 89 ,61143 ,06481
Pair 3 Preferences first situation 1,0000 89 1,29685 ,13747
Preferences second situation 1,3034 89 1,20985 ,12824
Table 7 presents the means and standard deviations for the variables included
in the two situations. We notice that the mean of the words chosen after completing
the questionnaire after the first situation, with words-stimuli (m=3,26, ab.std=1,61)
is much lower compared to the mean of words chosen after completing the
questionnaire in the second situation, namely involving images-stimuli (m=3,61,
ab.std=1,48).
We may also notice that the mean of the need experienced after completing
the questionnaire in the first situation is lower (m=0,88, ab.std=0,76) compared to
the need felt after completing the questionnaire in the second situation (m=0,96,
ab.std=0,61).
Also, we may notice that the mean of preferences manifested after completing
the questionnaire in the first situation is lower (m=1,00, ab.std=1,29) compared to

66
the preference manifested after completing the questionnaire for the second
situation (m=1,30, ab.std=1,20).
Table 8 T-student for pears test values and statistically significance for both experimental situation
Paired Differences
t df
Sig. (2-
tailed) Mean
Std.
Deviation
Std. Error
Mean
95% Confidence
Interval of the Difference
Lower Upper
Pair 1 Cuv_alese_prm_sit- Cuv_alese_sit_doua
-,34831 1,98346 ,21025 -,76614 ,06951 -1,657 88 ,101
Pair 2 Nevoie_prm_sit –
Nevoie_sit_doua
-,07865 ,96795 ,10260 -,28255 ,12525 -,767 88 ,445
Pair 3 Pref_prm_sit –
Pref_sit_doua
-,30337 1,72814 ,18318 -,66741 ,06067 -1,656 88 ,101
Table 8 presents the results of the t test for paired samples. Thus, we may
notice that there is no significant difference between the words chosen in the first
situation (words stimuli) and words chosen for the second situation (stimuli –
images) with p>0.005, nor between the type of need manifested for the first
situation and the second situation, with cu p>0.005 and nor between the
preferences manifested for the first situation and the second situation, with cu
p>0.005, therefore the following hypothesis: There are statistically significant
differences between the subject’s responses in the first situation compared to the
responses from the second part of testing, thus, the number of participants from the
second test phase who will be induced the sensation of hunger and will present
preferences for types of foods presented during the melody, but also the number of
words heard during the melody will be higher compared to the participants of the
first situation has not been confirmed.
67
REFERENCES
Chraif, M. (2013). Psihologie experimentală [Experimental psychology], Bucureşti: Ed
Universitară.
Bustin,B.M, Quoidbach,J., Hansenne,M., Capa,R.L., (2012), Personality modulation of
(un)conscious processing: Novelty Seeking and performance following supraliminal and
subliminal reward cues, Consciousness and Cognition 21 947–952
Chandrasekera,T., Vo, N., D’Souza, N.,(2012), The effect of subliminal suggestions
on Sudden Moments of Inspiration (SMI) in the design process, Department of
Architectural Studies, University of Missouri-Columbia, Columbia, MO 65211-7700, USA
Doron, R., Parot, F.,(2007), Dicționar de psihologie, Humanitas: București
Hyun,S.S., Kim, W., Lee,M.J., (2011), The impact of advertising on patrons’
emotional responses, perceived value, and behavioral intentions in the chain restaurant
industry: The moderating role of advertising-induced arousal, The International Journal of
Hospitality Management, 30 689–700
Kim, Y.J., Han, J., (2014), Why smartphone advertising attracts customers: A model of
Web advertising, flow, and personalization, Computers in Human Behavior 33, 256–269
Manolea, A., Chraif, M., Sebastian, V., Ciolacu, M.V. (2012).The subliminal influence
of the form's quantum effect on youngsters’ perception and choice of geometrical forms In
Editor (s) Anitei, M., Chraif, M. &Vasile, C., In the Proceedings of the International
Conference on Psychology and the Realities of the Contemporary World 2011, Procedia -
Social and Behavioral Sciences, Elsevier, 33, 791-795
Verwijmeren, T., Karremans, J.C., Bernritter ,S.F., Stroebe,W., Wigboldus,D.H-
J.,(2013) Warning: You are being primed! The effect of a warning on the impact of
subliminal ads, The Journal of Experimental Social Psychology 49, 1124–1129
REZUMAT
Studiul de faţă investighează influenţa stimulilor subliminali sub formă de
cuvinte aupra alegerii produselor dintr-o listă cu produse prezentate în imagini şi
o listă de produse prezentată în cuvinte. The participants were a number of 193
undergraduate students, 129 female participants and 64 male participants, age
between 19 and 35 years old (M=21.71; S.D.=2.70) Faculty of Psychology and
Educational Sciences, University of Bucharest. Materialele folosite sunt: audioclip
cu fundal musical şi cuvinte ce reprezintă produse de consum alimentar: fructe, şi
băuturi răcoritoare. Rezultatele au confirmat partial ipotezele cercetării. Această

68
cercetare se cere a fi extinsă pe un eşantion mai mare de subiecţi de diferite vârste,
populaţie din mediul rural şi urban dar şi modificarea stimulilor şi introducerea şi
a altor stimuli subliminali. De asemenea pentru a verifica ipoteza cu nevoile
bazale de foame şi sete trebuie să se introduce şi stimuli alimentary precum: carne,
ouă, peşte dar şi lichide de bază precum apa.
5. APPENDIX
Orange questionnaire/chart
For the first situation:
Data confidentiality: your responses will be only utilized for scientific
purpose. Each respondent will benefit from data confidentiality.
Gender:
Age:
You are asked to answer the following questions by choosing one of the
options:
- Select the answers which represent the words you have heared during the
melody:
- Cucumber
- Banana
- Orange
- Hot-dog
- Sandwich
- Apple
- Croissant
- Biscuits
- chocolate
In this moment you feel:
Hungry (need to eat)
Thirsty (need to drink)
Other needs:
No needs .

69
Answer the following question in the case that the answer for question 2
is not a). What would you like to eat?
Fruit
Cooked meal
Sandwich
Sweets
Other.......................
No preference
Answer the following question if the answer to question 2 is b). What
would you like to drink?
Plain water
Soda
Tea
Other (specify) ..........................
No preference
Thank you for your time!
For the second situation:
Data confidentiality: your responses will be only utilized for scientific
purpose. Each respondent will benefit from data confidentiality.
Gender:
Age:
You are asked to answer the following questions by choosing one of the
options:
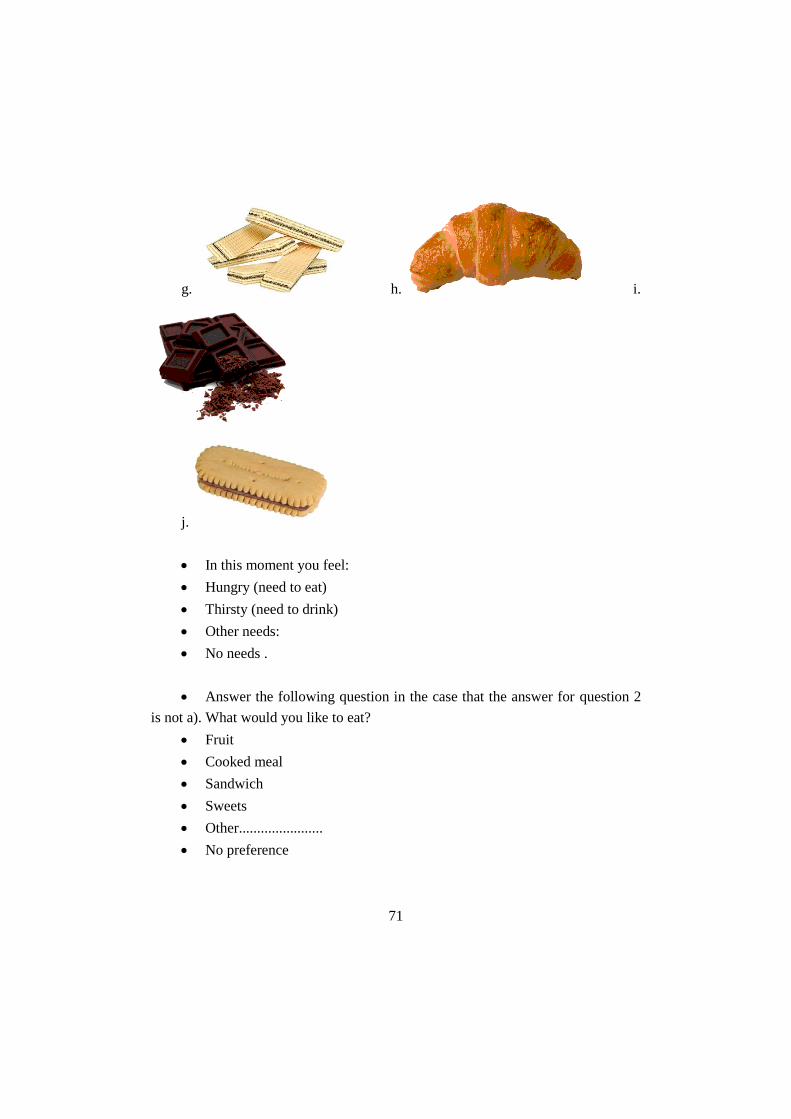
Check the answer options which represent the words you have heard
during the melody:

70
b. c.
d. e. f.
71
g. h. i.
j.
In this moment you feel:
Hungry (need to eat)
Thirsty (need to drink)
Other needs:
No needs .
Answer the following question in the case that the answer for question 2
is not a). What would you like to eat?
Fruit
Cooked meal
Sandwich
Sweets
Other.......................
No preference

72
Answer the following question if the answer to question 2 is b). What
would you like to drink?
Plain water
Soda
Tea
Other (specify) ..........................
No preference
Thank you for your time!