Study on Processing and Georeferencing of Historical … or automated. ... The authors used AgiSoft...
9
Abstract— Cropmarks offer a unique opportunity for visual discovery of buried historical (archaeological) features. These markings in landscape are mostly visible from proper perspective and overview. Aerial photographs are thus often used in finding them. Identification, characterization, and geographical localization of these objects currently require a high level of human interaction. The authors combine a specific knowledge from the fields of image processing, pattern recognition, and geographic information systems to design a robust procedure for semi-automated historical feature mapping. The main aim of this paper is to describe a technique for preprocessing high resolution aerial image data and to propose an intelligent system capable of recognition and classification of cropmarks. The cropmarks identified this way are consequently converted to polygons and mapped into a geographic information system (GIS). This research is an important step in automating the construction of archaeology- focused GIS, which support the protection of cultural heritage. Keywords— Historical feature detection, aerial image processing, cropmarks georeferencing. I. INTRODUCTION RCHAEOLOGICAL remote sensing (ARS) is currently one of the main pillars of modern nondestructive archaeology [1]. This discipline relies on two main sources of information – satellite images, and aerial photography. Both types of images can be acquired using a variety of devices, which can make certain feature of the land more pronounced, depending on the research subject and researchers’ choice. Several types of historical features can be observed using these devices, including such that are no longer visible even by the on-site observation. One of the most important techniques for the buried historical features detection relies on cropmarks in agricultural landscape. The paper was supported by the grant project of the Czech University of Live Sciences: Shape recognition in cropmarks, no. 20141051. This support is very gratefully acknowledged. Ondřej Gojda is with the Czech University of Life Sciences, Prague, Faculty of Economics and Management, Department of Information Engineering, Kamýcká 129, 165 21 Prague, CZECH REPUBLIC, e-mail: [email protected]. Petr Hanzlík is with the Czech University of Life Sciences, Prague, Faculty of Economics and Management, Department of Information Engineering, Kamýcká 129, 165 21 Prague, CZECH REPUBLIC, e-mail: [email protected]. Dana Klimešová is with the Czech University of Life Sciences, Prague, Faculty of Economics and Management, Department of Information Engineering, Kamýcká 129, 165 21 Prague, CZECH REPUBLIC, e-mail: [email protected]. Cropmarks have been used for remote sensing and detection of archaeological features in the United Kingdom since 1920s [2]. Discovering and documenting buried (under the arable layer) historical features using this natural phenomenon has thus a long tradition, in its parent country and Western Europe. After the fall of the Iron Curtain in 1989, it has been successfully implemented and developed in the post- soviet countries, too [3]. Mapping and georeferencing of buried features is very important for complex archaeological research. Interest- bearing historical deposits, the subject of later terrain archaeological research, can be pinpointed this way. It helps to confront the candidate features with existing domain knowledge, including historical maps and plans. This can enrich the knowledge about ancient settlement in the studied area [4]. Cropmarks make the shapes of buried man-made objects visible, which makes it possible to localize them in terrain. They can be observed mainly in barley (Hordeum vulgare), wheat (Triticum aestivum), winter rape (Brassica napus), and lucerne (Medicago sativa) [5]-[8]. There are two types of cropmarks – positive and negative – generally differentiable by their visual appearance. The positive cropmarks are characterized by a higher growth rate of plants contrary to their surroundings. The negative cropmarks work the other way around – plants above an ancient construction don’t reach the height of surrounding vegetation. Positive cropmarks represent around 98% of all the recorded cropmarks and negative ones only 2%. Both groups can also be characterized by slight difference in color of crops (lighter/darker) [1], [9], [10]. The positive cropmarks occur as a consequence of several factors. They take place above buried waste pits, graves, sunken dwellings and ditches. Thanks to the resulting soil with a higher concentration of nutritionally rich sediments, low mechanical resistance and high porosity, the plants above such places can produce deeper roots, which have a positive effect on water and nutrient supply [1]. The improved nourishment is in turn reflected by the height and color of such plants. The negative cropmarks work following the opposite premises. However, the resulting difference of crop length and color cannot be properly seen from the ground (eye) level. To document this phenomenon, it is necessary to see these features from a higher perspective, which can be provided by the aerial research. The actual distance (altitude) depends primarily on the size of observed Study on Processing and Georeferencing of Historical Features Ondrej Gojda, Petr Hanzlik, and Dana Klimesova A INTERNATIONAL JOURNAL OF MATHEMATICS AND COMPUTERS IN SIMULATION Volume 9, 2015 ISSN: 1998-0159 35
Transcript of Study on Processing and Georeferencing of Historical … or automated. ... The authors used AgiSoft...

Abstract— Cropmarks offer a unique opportunity for visual
discovery of buried historical (archaeological) features. These markings in landscape are mostly visible from proper perspective and overview. Aerial photographs are thus often used in finding them. Identification, characterization, and geographical localization of these objects currently require a high level of human interaction. The authors combine a specific knowledge from the fields of image processing, pattern recognition, and geographic information systems to design a robust procedure for semi-automated historical feature mapping. The main aim of this paper is to describe a technique for preprocessing high resolution aerial image data and to propose an intelligent system capable of recognition and classification of cropmarks. The cropmarks identified this way are consequently converted to polygons and mapped into a geographic information system (GIS). This research is an important step in automating the construction of archaeology-focused GIS, which support the protection of cultural heritage.
Keywords— Historical feature detection, aerial image processing, cropmarks georeferencing.
I. INTRODUCTION RCHAEOLOGICAL remote sensing (ARS) is currently one of the main pillars of modern nondestructive archaeology
[1]. This discipline relies on two main sources of information – satellite images, and aerial photography. Both types of images can be acquired using a variety of devices, which can make certain feature of the land more pronounced, depending on the research subject and researchers’ choice. Several types of historical features can be observed using these devices, including such that are no longer visible even by the on-site observation. One of the most important techniques for the buried historical features detection relies on cropmarks in agricultural landscape.
The paper was supported by the grant project of the Czech University of
Live Sciences: Shape recognition in cropmarks, no. 20141051. This support is very gratefully acknowledged.
Ondřej Gojda is with the Czech University of Life Sciences, Prague, Faculty of Economics and Management, Department of Information Engineering, Kamýcká 129, 165 21 Prague, CZECH REPUBLIC, e-mail: [email protected].
Petr Hanzlík is with the Czech University of Life Sciences, Prague, Faculty of Economics and Management, Department of Information Engineering, Kamýcká 129, 165 21 Prague, CZECH REPUBLIC, e-mail: [email protected].
Dana Klimešová is with the Czech University of Life Sciences, Prague, Faculty of Economics and Management, Department of Information Engineering, Kamýcká 129, 165 21 Prague, CZECH REPUBLIC, e-mail: [email protected].
Cropmarks have been used for remote sensing and detection of archaeological features in the United Kingdom since 1920s [2]. Discovering and documenting buried (under the arable layer) historical features using this natural phenomenon has thus a long tradition, in its parent country and Western Europe. After the fall of the Iron Curtain in 1989, it has been successfully implemented and developed in the post-soviet countries, too [3].
Mapping and georeferencing of buried features is very important for complex archaeological research. Interest-bearing historical deposits, the subject of later terrain archaeological research, can be pinpointed this way. It helps to confront the candidate features with existing domain knowledge, including historical maps and plans. This can enrich the knowledge about ancient settlement in the studied area [4].
Cropmarks make the shapes of buried man-made objects visible, which makes it possible to localize them in terrain. They can be observed mainly in barley (Hordeum vulgare), wheat (Triticum aestivum), winter rape (Brassica napus), and lucerne (Medicago sativa) [5]-[8]. There are two types of cropmarks – positive and negative – generally differentiable by their visual appearance. The positive cropmarks are characterized by a higher growth rate of plants contrary to their surroundings. The negative cropmarks work the other way around – plants above an ancient construction don’t reach the height of surrounding vegetation. Positive cropmarks represent around 98% of all the recorded cropmarks and negative ones only 2%. Both groups can also be characterized by slight difference in color of crops (lighter/darker) [1], [9], [10].
The positive cropmarks occur as a consequence of several factors. They take place above buried waste pits, graves, sunken dwellings and ditches. Thanks to the resulting soil with a higher concentration of nutritionally rich sediments, low mechanical resistance and high porosity, the plants above such places can produce deeper roots, which have a positive effect on water and nutrient supply [1].
The improved nourishment is in turn reflected by the height and color of such plants. The negative cropmarks work following the opposite premises. However, the resulting difference of crop length and color cannot be properly seen from the ground (eye) level. To document this phenomenon, it is necessary to see these features from a higher perspective, which can be provided by the aerial research. The actual distance (altitude) depends primarily on the size of observed
Study on Processing and Georeferencing of Historical Features
Ondrej Gojda, Petr Hanzlik, and Dana Klimesova
A
INTERNATIONAL JOURNAL OF MATHEMATICS AND COMPUTERS IN SIMULATION Volume 9, 2015
ISSN: 1998-0159 35

feature [11], [12]. The transformation of aerial images into objects listed and
mapped in a GIS currently requires an extensive work from a human expert; it is very time consuming [13]. This article pays special attention to the first phase of a complex process of georeferencing of buried archaeological features. This phase consists of preprocessing of input photographs to the appearance suitable for further automatic shape detection, and consequent vectorisation. The final results of this process are mapped buried features, including the precise shape extracted from visible cropmarks placed in the coordinate system. Authors present a universally applicable set of steps that segments an input image into the state where resulting buried features are clearly visible for automatic shape detection systems.
II. PROBLEM FORMULATION
A. Aerial Photographs A multitude of projects is currently underway in EU
(including the Czech Republic) that focus on mapping the vanished archaeological objects using sings in vegetation. In general, the processing of input image data and their entry into a GIS is performed manually. Nonorthogonal aerial photographs are primarily used within these projects for several reasons.
The first reason is the insufficient spatial resolution of satellite images for specific need of archaeological georeferencing. The second reason is the inconsistent time period when satellite images are taken, because cropmarks are evident during a specific part of year (season) only.
The most effective way to document cropmarks is taking pictures from a height of about 300m in the period from May to July (until harvest). These photos are therefore the only source of digital data in which are buried historical buildings clearly evident in their specific shape [4]. Aerial photographs are thus generally optimal for further processing needs, either manual or automated.
The complete procedure of mapping the historical features from aerial images to GIS consists of a series of interconnected step. We have identified these essential steps and formalized them in Figure 1.
In comparison with satellite image analysis, the analysis of aerial photographs assumes, the candidate historical feature has already been discovered and its location is manually photographed from an appropriate perspective.
The resulting images are transferred from a digital camera to a computer, the faulty photographs are removed, and individual image categorized by location. Certain level of manual interaction is therefore both required and acceptable, even in the consequent processing steps.
Various authors have already dealt with problems relevant for the proposed procedure, or solved analogous tasks. Lambers and Zingman describe the search of buried archaeological objects in satellite images, and propose a
procedure for detecting circle-shaped historical features based on template matching [14]. Even though the satellite image classification in demanding from the data manipulation and computing power point of view, it can be successfully solved by Computational Grids. Sheikh and Mukhopadhyay designed a robust, noise tolerant method for differentiating between man-made objects and natural-scenes in natural images [15]. Several image preprocessing techniques have been adapted for this study, including histogram-based contrast enhancement [16]-[19], spectral image clustering, and edge detection techniques. However, a comprehensive solution linking individual approaches and automating the entire process is still missing.
Fig. 1. Cropmark georeferencing procedure [Authors].
In order to design a solution usable in archaeological
practice, the precision of mapping is currently preferred over the computing overhead and performance. The interaction of the solution with human experts is also acceptable so far. In certain cases, it can dramatically reduce the processing time and improve the overall georeferencing precision.
B. Aerial Image Set The basic material used for this research was a set of oblique
high-definition aerial photos from the Institute of Archaeology of the Czech Academy of Sciences. The photographs were mainly acquired from Cessna 172 aircraft in 300-500m altitude. All the digital imagery was taken on various SLR cameras with minimum 12MP resolution during years 1992 and 2010. Photos with well-marked cropmarks were chosen for early research.
Although freely accessible satellite imagery (theoretically
INTERNATIONAL JOURNAL OF MATHEMATICS AND COMPUTERS IN SIMULATION Volume 9, 2015
ISSN: 1998-0159 36

perfect for detecting cropmarks in landside because of the vertical character of photographs acquired) can be a good source of data, it does not contain the required level of detail to ensure accurate mapping of historical features on.
C. Image Rectification Oblique aerial photographs would be fully sufficient for the
part of the georeferencing procedure associated with the shaped-based historical feature detection. However, in order to place vectorized buried features into a GIS, it is necessary to rectify the aerial images first [20], [21]. Authors therefore perform this operation before preprocessing the image any further. Unfortunately, rectification comes along with relatively high distance deviation of the final location from real coordinates. The level of distance deviation depends of several factors: quality and amount of source photographs, presence of additional solid objects (crossroads, buildings, electricity poles, etc.) around the observed feature contained in a base-map/satellite imagery, and importantly, preciseness and experience of the person who rectifies and places the image into the coordinate system, since this process is still traditionally manual.
The authors used AgiSoft Photoscan Professional to eliminate the problem described above. This software creates a fully textured and high-detailed 3D model of the observed area from a set of several (6-15) oblique 2D photographs. A high-resolution vertical image can be rendered easily from textured 3D model. AgiSoft Photoscan is able to process the GPS coordinates included in picture meta data and place the resulting model/image into the coordinate system, which is very useful for finalizing the described process of archaeological features mapping. To design a robust preprocessing algorithm, authors have further used both manually rectified imagery and AgiSoft Photoscan Proffesional outputs.
D. Image Preprocessing further automatic detection of buried historical features in
rectified aerial images, an appropriate preprocessing and segmentation algorithm is a must. There are several problems, which must be addressed. Even though the difference between the cropmark and the rest of the field is evident to the human eye, from the computer vision point of view, the actual transition is very smooth (see Fig. 2). Another problem is the presence of several unfavorable objects, which occur as a consequence of a specific natural phenomena (subsoil and bedrock structure, water resources, etc.) or the agricultural activities pursued
(plough furrows, field paths, country lanes, etc.). Following sections will discuss the proposed algorithm for making the cropmarks as pronounced and detached from the background as possible, whereas eliminating the noise, background, and as many unfavorable objects as possible.
We tend to think that similar objects should be those objects whose internal features are very similar to each other or those which co-occur often. These measures use different
ways to check each object’s internal feature values or co-occurrences of objects. Such similarity can be discovered from data sets of the attribute values or transactional dataset type.
Fig. 2. Cropmark feature transition [Authors].
In real world, a lot of objects which do not have similar internal feature structures and which do not co-occur together often exist, but their relationships with other objects are very similar and their behavior is similar [22]. Behavior-based similarity can help us find more surprising similar object pairs and this can provide us more interesting information to use for further analysis.
The reason for this is because, if two objects co-occur a lot, then they ought to share a lot of correlated associated objects. When two objects share a lot of correlated associated objects, they can share behavior-based similarity [23].
III. REGIONS AND SEGMENTS
A. Image Segmentation Traditional approaches to object identification use features
as the main source of information to evaluate similarity between objects. We can also use different types of relations between objects and also different types of objects on one
INTERNATIONAL JOURNAL OF MATHEMATICS AND COMPUTERS IN SIMULATION Volume 9, 2015
ISSN: 1998-0159 37

scene: pixels, segments, regions, scene objects and relation between them.
The term image segmentation refers to partitioning of an image into a set of regions that cover it. The goal is to find meaningful areas of the image, such as the crops, urban areas, and forests of satellite data (Fig. 3). In other type of analysis tasks, the regions might be sets of border pixels grouped into such structures like lines or circular segments in images of 2D or 3D objects. Moreover, regions may also be defined as groups of pixels having both a border and a shape. When the regions do not cover the whole image, we can still talk about segmentation.
In order to identify regions in an image, a wide range of questions bust be answered first, including:
• Segmented regions of images should be uniform and homogeneous with respect to some characteristic, such as intensity level, color, or texture. Region interiors should be simple, and without many small holes.
• Adjacent regions should have significantly different values with respect to the characteristic on which they are uniform.
• Boundaries of each segment should be smooth, not ragged (nor ramp), and should be spatially accurate.
However, this set of desired properties is difficult to achieve, because strictly uniform and homogeneous regions are typically full of small holes and have coarse boundaries. The problem also arises with adjacent regions, because they have large differences in values. It can cause regions to merge and boundaries to be lost.
In pattern recognition, clustering is a process of partitioning a set of pattern vectors into subsets called clusters. The general problem in clustering is to partition a set of vectors into groups having similar values. In image analysis, the vectors represent pixels or sometimes small neighborhoods around pixels. The components of these vectors can include:
• intensity values • RGB values and properties derived from them • statistical properties • texture features
Any feature that can be associated with a pixel can be used to group pixels.
B. Histogram-based Methods Iterative partition rearrangement schemes have to go
through the image data set many times. Because they require only one pass through the data, histogram methods probably involve the least computation time of the measurement space clustering techniques.
Histogram mode seeking is a measurement space clustering process in which it is assumed that homogeneous objects in the image manifest themselves as the clusters in measurement space, i.e. on the histogram. Image segmentation is accomplished by mapping the clusters back to the image
domain where the maximal connected components of the cluster labels constitute the image segments.
Fig. 3. Depicted profile and gradient (difference profiles) [Authors].
Segmentation has two objectives. The first is to decompose
the image into parts for further analysis. In simple case the environment might be well enough controlled so that the segmentation process extracts only the parts that need to be further analyzed. In complex cases, such as extracting archaeological features from aerial images, the segmentation problem can be very difficult and might require the application of internal feature structures, behavior mapping or context relations knowledge. The second objective of segmentation is to perform the change of representation. The pixels of the image must be organized into higher-level units that are either more meaningful or more efficient for further analysis, eventually both.
A critical issue is whether or not segmentation can be performed for many different domains using general bottom-up methods that do not use any special domain knowledge.
C. Conversion RGB – IHS based method In RGB model each color is presented by its primary
spectral components of red, green and blue, in IHS model, a color is defined by intensity, hue and saturation. Intensity I is decoupled from color information and measures energy in all wavelengths.
The IHS technique is one of the most commonly used fusion techniques for image sharpening. It has become a standard procedure in image analysis for color enhancement, feature enhancement, improvement of spatial resolution and the fusion of disparate data sets [24]. In the IHS space, spectral information is mostly reflected on the hue and the saturation.
Hue H describes a pure color and is associated with the dominant wavelength and saturation S refers to relative purity or the amount of white light mixed with hue.
RGB model can be represented by a cube and IHS color
INTERNATIONAL JOURNAL OF MATHEMATICS AND COMPUTERS IN SIMULATION Volume 9, 2015
ISSN: 1998-0159 38

model by a cone. In RGB space gray levels are located on diagonal of color cube joining black and white vertices, saturation is distance from this diagonal and hue is angle around this diagonal.
Fig. 4. Representation of IHS model [Authors].
The vertical axis represents intensity I which varies from
black to white and is not associated with any color. The components intensity I, hue H and saturation S can be obtained from the RGB model using following equations:
0>arctan
0arctan
3)(
2114.0587.0299.0
uuvh
uuvh
BGv
BGRuBGRI
=
<+=
−=
−−=++=
π
(1)
where h is transferred into the interval <0, 2π>. When it is negative, we add 2π. In case that u=0, for v≥0
h=0 otherewise h=π. As a result we calculate hue as:
hHπ2
255= (2)
and saturation as:
−−−
−−−
−−−
=I
IBI
BII
IGI
GII
IRI
RIS255
,,255
,,255
,max255 (3)
D. Contextual Interactions Context can be any information that is not directly produced
by the appearance of an object. It can be obtained from the nearby image data, image tags or annotations and the presence and location of other objects. We are dealing with context information from a global and local image level including interactions between pixels, regions, objects and object-scene interactions [25].
Fig. 5. Logical operation XOR between I and H components
with histogram slicing, see fig. 6 [Authors].
Fig. 6. Histogram window with different transfer functions [Authors].
We can also use different levels of relationships between
objects and their surroundings: interposition, support, probability, position and others and to take into consideration suitable context. In case of cooperation with different types of surroundings, three basic types of context can be differentiated: Semantic context (probability), spatial context (position), and scale context (size). Semantic context (probability) can be defined as a co-occurrence with other objects and in terms of
INTERNATIONAL JOURNAL OF MATHEMATICS AND COMPUTERS IN SIMULATION Volume 9, 2015
ISSN: 1998-0159 39
its occurrence in scenes. This information is commonly obtained from training data, or from an external knowledge base.
As seen from above we have at our disposal a lot of different measures of similarity which may be used in a specific context of the task. Highly sophisticated problems, for instance the scene recognition where the goal is to locate and identify instances of an object category within an image, use local interactions (pixel interactions, region and object interactions) and global interactions (object-scene interactions). Traditional approach is to use features as the main source of information: color, edge responses, texture and shape [26]. The problem of effectively integrating context information is a challenging task.
IV. PROBLEM SOLUTION The above described image set focusing on cropmarks of
various shapes and sizes was used as the main research material for further discussion. This original image set was consequently rectified and stored in/exported to JPEG format, using the RGB model (24 bits per pixel). As has already been mentioned before, in order to accomplish precise georeferencing, certain level of human interaction is acceptable. Hence, in the early research stages, the rectified image is manually focused on a visible outline of buried feature and cropped to include single feature and its near neighborhood only. This modification reduces the problems with detection of existing construction, and false detection in general. The performance of the procedure is dramatically improved this way, while researchers maintain a significant level of control in deciding which objects are worth mapping.
In order to prepare an image suitable for template matching algorithms, a binary representation of the source image must be calculated, using suitable image processing and segmentation techniques, which will be discussed in following sections.
A. Image Preprocessing and Segmentation The colors corresponding to cropmarks (from green,
through yellow to light orange) occur in the wavelength interval of approx. 510-600nm. This wavelength interval is covered by the intensity edge of red channel; light orange (around 600nm) lies at the start point of the intensity drop of red channel on one side, and green (around 510nm) lies at the end of the intensity drop on the other side. It means that pure green shades appear the darkest while yellow/orange shades the lightest in red channel [27]. Therefore, the grayscale intensity map of the red channel has been used for further processing.
In order to make cropmarks more profound in comparison with background, the contrast-limited adaptive histogram equalization (CLAHE) technique was utilized on the red channel for local contrast enhancement. This technique operates on small regions in the image and balances the distribution of grey scale used, and makes hidden features of the image more visible [17]. The full grey spectrum is used to express the image, using the discrete formula Eq. 4,
[ ] minminmax )(* gfPggg +−= (4)
where gmin is the minimum pixel value (0 in this case), gmax is
the maximum pixel value (255), and P(f) is the cumulative probability distribution.
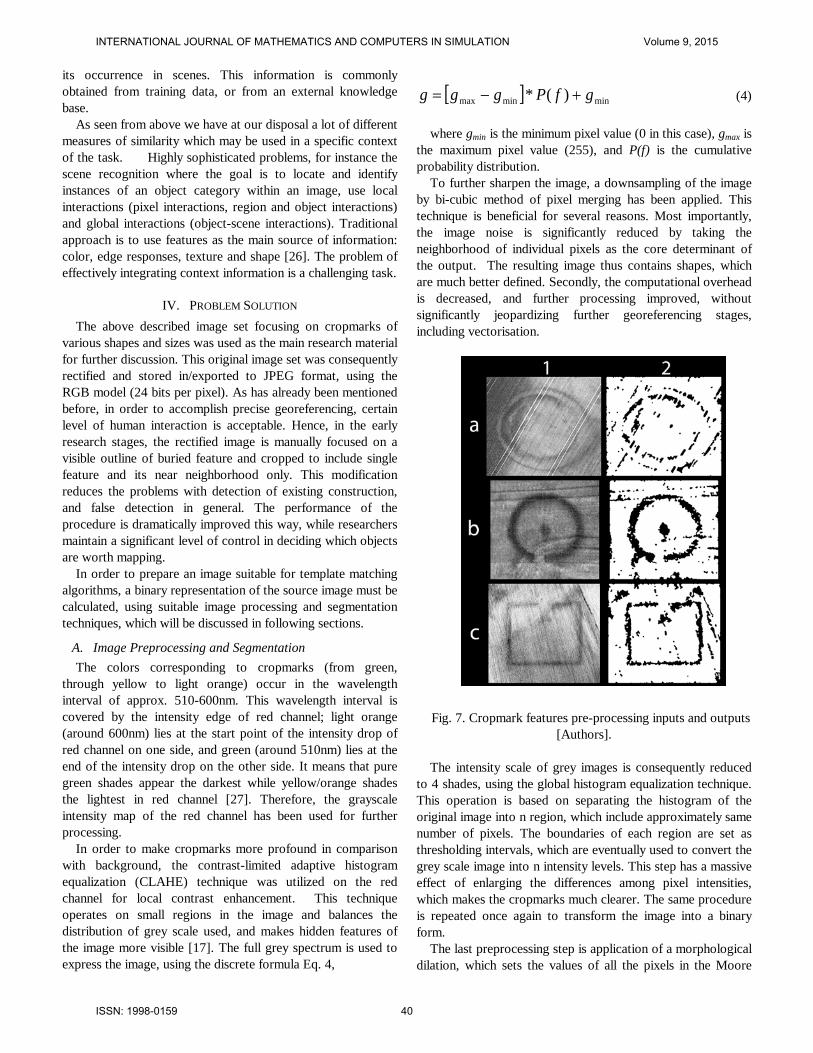
To further sharpen the image, a downsampling of the image by bi-cubic method of pixel merging has been applied. This technique is beneficial for several reasons. Most importantly, the image noise is significantly reduced by taking the neighborhood of individual pixels as the core determinant of the output. The resulting image thus contains shapes, which are much better defined. Secondly, the computational overhead is decreased, and further processing improved, without significantly jeopardizing further georeferencing stages, including vectorisation.
Fig. 7. Cropmark features pre-processing inputs and outputs [Authors].
The intensity scale of grey images is consequently reduced
to 4 shades, using the global histogram equalization technique. This operation is based on separating the histogram of the original image into n region, which include approximately same number of pixels. The boundaries of each region are set as thresholding intervals, which are eventually used to convert the grey scale image into n intensity levels. This step has a massive effect of enlarging the differences among pixel intensities, which makes the cropmarks much clearer. The same procedure is repeated once again to transform the image into a binary form.
The last preprocessing step is application of a morphological dilation, which sets the values of all the pixels in the Moore
INTERNATIONAL JOURNAL OF MATHEMATICS AND COMPUTERS IN SIMULATION Volume 9, 2015
ISSN: 1998-0159 40

neighborhood surrounding central pixel according to the dominant value. As a result, the neighboring regions are merged and form a uniform surface, which however keeps the general shape of features obvious and unchanged.
The Figure 7 shows the red channel of selected images (a, b and c) containing an outline of historical features as inputs (1) and the resulting outputs (2) of the described preprocessing procedure.
In further stages of the georeferencing procedure, a template matching algorithm will be applied on the preprocessed images. The use of such technique is feasible, because the variation in shapes of cropmarks is generally limited. Gojda and Hejcman present the typical shapes of buried archaeological features [1], which can describe most of the observed cases.
V. CONCLUSION This article discusses the aspects of georeferencing of buried
archaeological features into a GIS. The importance of aerial images in ARS is discussed and the various benefits and drawbacks of this technology described. Authors have formalized the procedure of transferring the cropmark into an object in the GIS. Special emphasis is paid to the preprocessing stage of this procedure. An algorithm consisting of well established techniques of image processing is proposed and tested on the set of images containing buried historical features of various shapes. The further stages of this research will focus on template matching, object vectorisation, and mapping of buried historical features into a coordinate system of GIS.
INTERNATIONAL JOURNAL OF MATHEMATICS AND COMPUTERS IN SIMULATION Volume 9, 2015
ISSN: 1998-0159 41

APPENDIX
Fig. A1. Crop-mark features selected pre-processing steps [Authors].
INTERNATIONAL JOURNAL OF MATHEMATICS AND COMPUTERS IN SIMULATION Volume 9, 2015
ISSN: 1998-0159 42

REFERENCES [1] Gojda, M., Hejcman, M., Cropmarks in main field crops enable the
identification of a wide spectrum of buried features on archaeological sites in Central Europe, Journal of Archaeological Science, No.39, 2012, pp. 1655-1664.
[2] Crawford, O.G.S., Air Survey and Archaeology, Ordnance Survey Professional Papers New Series, No.7, 1924.
[3] Hašek, V., Kovárník, J., Aerial and geophysical prospection in archaeological research of prehistoric circular ditches in Moravia, Archaeological Prospection, No.6, 1999, pp. 187-209.
[4] Gojda, M., Archeologie krajiny, Academia, 2000. [5] Evans, R., Jones, R.,J.,A., Crop marks and soils at two archaeological
sites in Britain, Journal of Archaeological Science, No.4, 1977, pp. 63-76.
[6] Gallo et al., Remote sensing techniques for constructing a vast Neolithic settlement in Southern Italy, Journal of Archaeological Science, No.36, 2009, pp. 43-50.
[7] Gojda, M., Features, sites and settlement areas in the view of air survey (Bohemia, 1992-2003), Burgeois, J., Meganck, M. (Eds.), Air Photography and Archaeology 2003, 2005, pp. 101-111.
[8] Hejcman, M., Smrž, Z., Cropmarks in stands of cereals, legumes and winter rape indicate sub-soil archaeological features in the agricultural landscape of Central Europe, Agriculture Ecosystems and Environment, No.138, 2010, pp. 348-354.
[9] Majer, A., Cropmarks from the vegetation colour process perspective, Archeologické Rozhledy, No.48, 1996, pp. 264-272.
[10] Hejcman, M., Ondráček, J., Smrž, Z., Ancient waste pits with wood ash irreversibly increase crop production in Central Europe, Plant and Soil, No.339, 2011, pp. 341-350.
[11] Doneus, M., Precision mapping and interpretation of oblique aerial photographs, Archaeological Prospection, No.8, 2001, pp. 13-27.
[12] Hanson, W.S., Oltean, I.A., The identification of Roman buildings from the air: recent discoveries in Western Transylvania, Archaeological Prospection, No.10, 2003, pp. 101-117.
[13] Klimešová D., Konopásek J., Image processing in cooperation with GIS, Int. Journal of Mathematical Models and Methods in Applied Sciences,7(4), 2013, pp. 388 – 395.
[14] Lambers, K., Zingman, I., Towards Detection of Archaeological Objects in High-Resolution Remotely Sensed Images: The Silvretta Case Study, Proceedings of the 40th Conference in Computer Applications and Quantitative Methods in Archaeology, 2012, pp. 26-30.
[15] Sheikh, A., A., Mukhopadhyay, S., Noise Tolerant Classification of Aerial Images into Manmade Structures and Natural-Scene Images based on Statistical Dispersion Measures, Proceeding of India Conference (INDICON), 2012, pp. 653-658.
[16] Pizer, S., M., Amburn, E., P., Austin, J., D., Adaptive Histogram Equalization and Its Variations, Computer Vision, Graphics, and Image Processing, No.39, 1987, pp. 355-368.
[17] Zuiderveld, K., Graphics Gems IV: Contrast Limited Adaptive Histogram Equalization, Academic Press, 1994.
[18] Gonzales, R., C., Woods, R., E., Eddins, S., L., Digital Image Processing Using MATLAB, Gatesmark Publishing, 2009.
[19] van den Boomgard, R., van Balen, R., Methods for Fast Morphological Image Transforms Using Bitmapped Images, Computer Vision, Graphics, and Image Processing: Graphical Models and Image Processing, Vol.3, No.54, 1992, pp. 254-258.
[20] Gojda, M., Nedestruktivní archeologie: Letecká archeologie a dálkový průzkum, Academia, 2004.
[21] Musson, Ch., Palmer, R., Campana, S., Flights Into the Past, Aerial Archaeology Research Group, 2013.
[22] Yang, F., Mao. K. Z., Robust Feature Selection for Microarray Data Based on Multicriterion Fusion. IEEE Transactions on Computational Biology and Bioinformatics, vol. 8, no. 4, pp. 1080-1092, 2011.
[23] Klimešová D., Ocelíková E., Spatial-temporal modeling and visualisation, NOUN International Journal of Mathematical Models and Methods in Applied Sciences, 2012, 6 (1) , pp. 149-156.
[24] Gillespie, Alan R., et al. 1986. Color Enhancement of Highly Correlated Images. I. Decorrelation and HSI Contrast Stretches. Remote Sensing of Environment, Vol. 29: 209-235.
[25] Klimešová D., Ocelíková E., GIS and image processing, International NOUN Journal of Mathematical Models and Methods in Applied Sciences, 2011, 5 (5), pp. 915-922.
[26] Borza, S., Simion, C,. Bandrea, I., GIS application with geospatial database for improving the waste management in Sibiu surrounding area, NOUN International Journal of Energy and Environment, Issue 5, Volume 5, 2011, pp. 653-660.
[27] Halounová, L., Pavelka, K., Dálkový průzkum země, ČVUT v Praze, 2005.
INTERNATIONAL JOURNAL OF MATHEMATICS AND COMPUTERS IN SIMULATION Volume 9, 2015
ISSN: 1998-0159 43