Nonlinear behaviour of built-up cold-formed steel section battened columns
STUDY ON MAXIMUM STRENGTH OF COLD-FORMED
STEEL COLUMNS
By C. C. Weng1 and C. P. Lin2
ABSTRACT: Based on the approximate Jezek's method of beam-column theory, a computerized analysis was performed to determine the maximum strength of cold-formed steel columns. In this study, the effect of residual stress and initial imperfection on the column strength were taken directly into account in the analysis. In addition, the influence of residual stress on the local buckling strength of the cold-formed sections also was accounted for by using a new concept, called second reduction. The predicted column strengths were compared with the results of 104 column tests by previous researchers. From the results of the analysis, this study obtained a new column-strength curve for predicting the maximum strength of cold-formed steel columns. The predicted values showed good agreement with the test results.
INTRODUCTION
Concerning the design of cold-formed steel columns, it is known that the column formulas for flexural buckling strength used in the American Iron and Steel Institute (AISI) specification (Specification 1986) are based on the Column Research Council's column curve. The CRC column curve was established based on tangent-modulus theory, which was originally developed for the design of hot-rolled steel columns. Recently, experimental results obtained by Dat (1980) and Weng and Pekoz (1990a) showed that for some types of cold-formed steel columns, the AISI column formulas may lean toward the unconservative side. Due to differences in the manufacturing process, the cold-forming and hot-rolling processes affect the residual stress and the variation of steel column material properties differently. Thus, it is thought that the direct use of the CRC column curve for the design of cold-formed steel columns may not be appropriate.
The objective of this study is to investigate the effect of residual stress and initial imperfection (crookedness) on the maximum strength of cold-formed steel columns. The approximate Jezek's method of beam-column theory was used for the development of a new column curve. The analytical features of this study include the following.
1. The effects of residual stress and initial imperfection on the maximum column strength were taken directly into account in the computerized analysis.
2. The influence of the variation of the yield stress at the corner regions of a cold-formed steel section also was included in the analysis.
3. The predicted maximum column strengths were compared with the results of tests on 104 cold-formed steel columns performed by previous researchers, which included 59 locally stable and 45 locally unstable columns.
'Assoc. Prof, of Civ. Engrg., Nat. Chiao Tung Univ., Hsinchu, Taiwan, Republic of China.
2Grad. Res. Asst. of Civ. Engrg., Nat. Chiao Tung Univ., Hsinchu, Taiwan, Republic of China.
Note. Discussion open until June 1, 1992. To extend the closing date one month, a written request must be filed with the ASCE Manager of Journals. The manuscript for this paper was submitted for review and possible publication on August 23, 1990. This paper is part of the Journal of Structural Engineering, Vol. 118, No. 1, January, 1992. ©ASCE, ISSN0733-0445/92/0001-0128/$1.00 + $.15 per page. Paper No. 340. 340.
128
J. Struct. Eng. 1992.118:128-146.
Dow
nloa
ded
from
asc
elib
rary
.org
by
Nat
iona
l Chi
ao T
ung
Uni
vers
ity o
n 05
/01/
14. C
opyr
ight
ASC
E. F
or p
erso
nal u
se o
nly;
all
righ
ts r
eser
ved.
4. The effect of residual stress on the local buckling strength of cold-formed steel columns was accounted for by using a new concept, called second reduction (Weng 1991).
RESIDUAL STRESSES AND SECOND REDUCTION
Residual Stresses In Cold-Formed Steel Sections For cold-formed steel members, Weng and Pekoz (1990b) presented a
detailed description of the residual stresses measured from a series of cold-formed channel sections. The experimental results of their work are used in this investigation. The following is a brief summary of the results of the residual stress measurement obtained by Weng and Pekoz (1990b).
1. The magnitude of the residual stress at the corner region was found to be greater than that at the flat portion of the section. In most cases, the magnitudes of the residual stresses at the corner region and the flat portion were found to be approximately equal to 70%Fy and 30%Fy, respectively.
2. Tensile residual stresses were found on the outside surface of the channel section, and compression residual stresses were found on the inside surface. At the same location, the magnitudes of the residual stresses on the outside and inside surfaces were very close.
3. At the flat portion, the distribution of the residual stress along its width was found to be nearly uniform.
According to the experimental findings, Weng and Pekoz (1990b) indicated that it seems reasonable to assume the residual stresses are linearly distributed through the thickness direction of the component plate elements of the cold-formed section.
Concept of Second Reduction Based on an intensive experimental investigation, Weng (1991) proposed
the second-reduction concept to incorporate the effect of residual stress on the local buckling strength of cold-formed sections. This effect may cause a further reduction on the strength of cold-formed steel columns. This concept is introduced briefly in the following paragraphs.
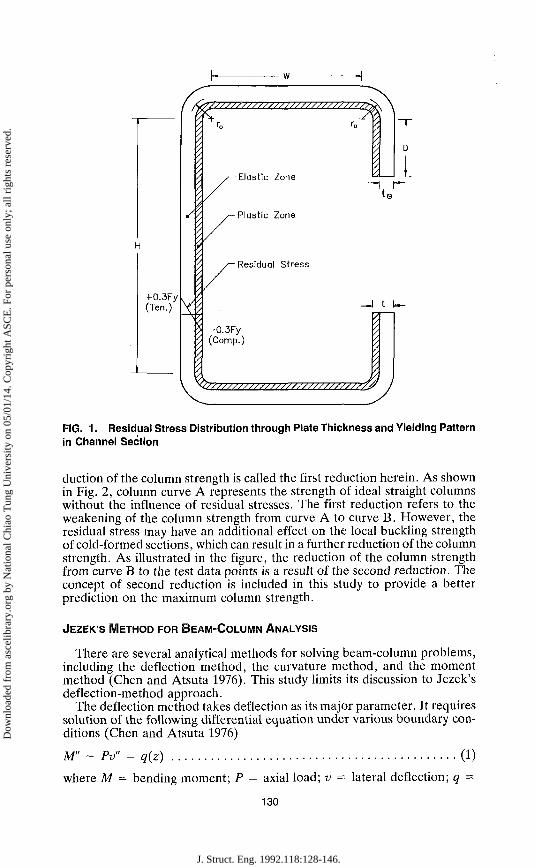
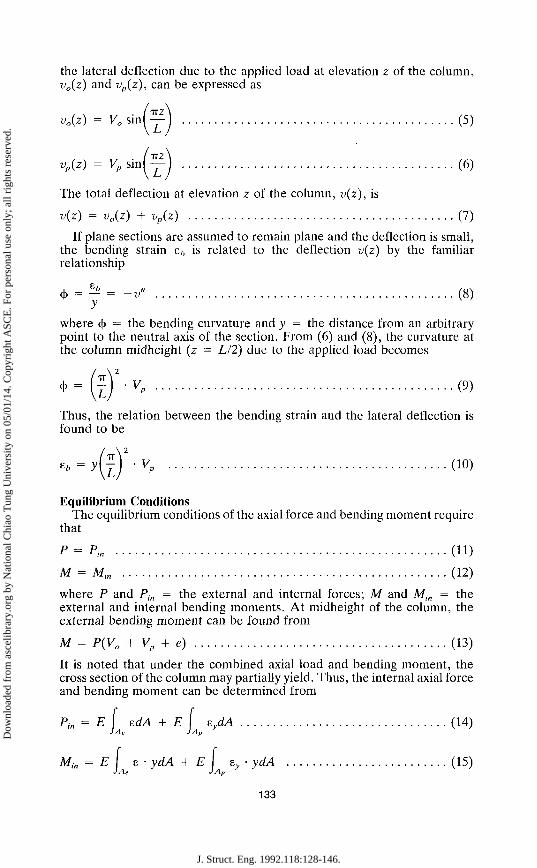
From the residual stress distribution pattern mentioned previously, the yielding propagation in an axially loaded cold-formed steel column is described in Fig. 1. As shown in the figure, when the sum of the applied stress and compressive residual stress reaches the yield stress of the material, the channel section starts to yield from the inside surface (where compressive residual stress exists). The yielded zone propagates as the load increases. The figure reveals that the elastic portion of the plate decreases from the original thickness, t, to an elastic thickness, te. Consequently, it is possible that a plate element that was originally fully effective may become partially effective if the width-thickness ratio of the element increases from bit to a larger value of blte. This phenomenon indicates that the presence of residual stress may result in local buckling of a cold-formed section that was originally fully effective.
From this information, it is noted that the residual stress may affect not only the overall buckling strength, but the local buckling strength of a cold-formed steel column. The influence of residual stress on the overall buckling strength has been taken into account in the AISI column formula {Specification 1986) through the use of the tangent-modulus approach. This re-
129
J. Struct. Eng. 1992.118:128-146.
Dow
nloa
ded
from
asc
elib
rary
.org
by
Nat
iona
l Chi
ao T
ung
Uni
vers
ity o
n 05
/01/
14. C
opyr
ight
ASC
E. F
or p
erso
nal u
se o
nly;
all
righ
ts r
eser
ved.
w
Elastic Zone
Plastic Zone
Residual Stress
-0.3Fy (Comp.)
'J//////////////////////S77PK
FIG. 1. Residual Stress Distribution through Plate Thickness and Yielding Pattern in Channel Section
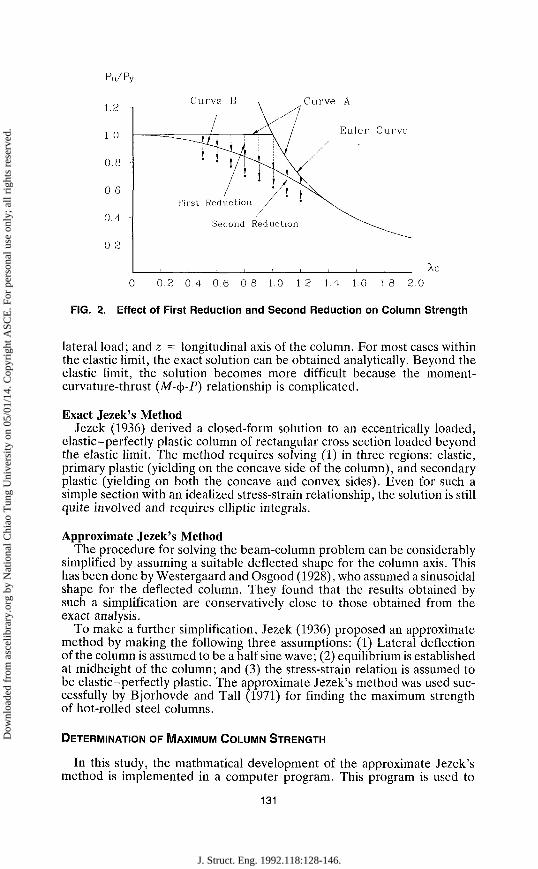
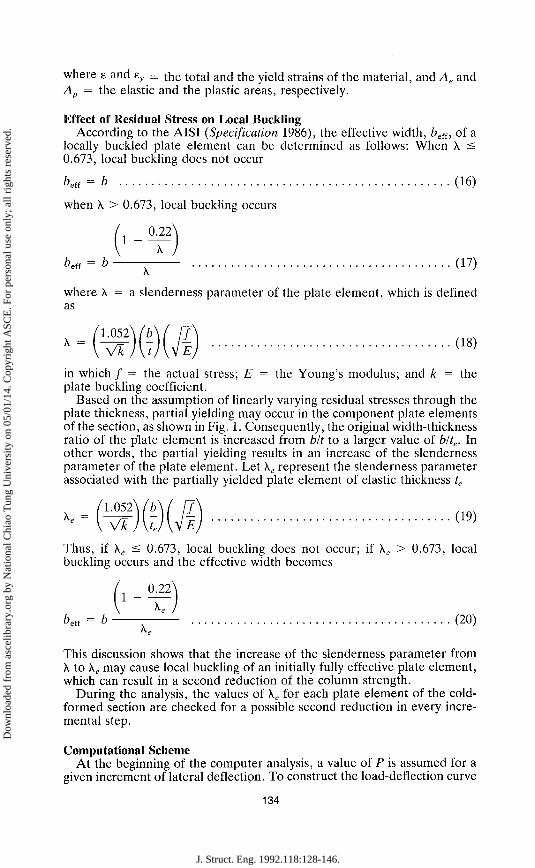
duction of the column strength is called the first reduction herein. As shown in Fig. 2, column curve A represents the strength of ideal straight columns without the influence of residual stresses. The first reduction refers to the weakening of the column strength from curve A to curve B. However, the residual stress may have an additional effect on the local buckling strength of cold-formed sections, which can result in a further reduction of the column strength. As illustrated in the figure, the reduction of the column strength from curve B to the test data points is a result of the second reduction. The concept of second reduction is included in this study to provide a better prediction on the maximum column strength.
JEZEK'S METHOD FOR BEAM-COLUMN ANALYSIS
There are several analytical methods for solving beam-column problems, including the deflection method, the curvature method, and the moment method (Chen and Atsuta 1976). This study limits its discussion to Jezek's deflection-method approach.
The deflection method takes deflection as its major parameter. It requires solution of the following differential equation under various boundary conditions (Chen and Atsuta 1976)
M" - Pv" = q(z) (1)
where M = bending moment; P = axial load; v = lateral deflection; q =
130
J. Struct. Eng. 1992.118:128-146.
Dow
nloa
ded
from
asc
elib
rary
.org
by
Nat
iona
l Chi
ao T
ung
Uni
vers
ity o
n 05
/01/
14. C
opyr
ight
ASC
E. F
or p
erso
nal u
se o
nly;
all
righ
ts r
eser
ved.
Curve B . Curve A
I JS\ / Euler Curve
/ H/r First Reduction /
Second Reduction
Xc 0 0.2 0.4 0.6 0.8 1.0 1.2 1.4 1.6 1 8 2.0
FIG. 2. Effect of First Reduction and Second Reduction on Column Strength
lateral load; and z = longitudinal axis of the column. For most cases within the elastic limit, the exact solution can be obtained analytically. Beyond the elastic limit, the solution becomes more difficult because the moment-curvature-thrust (M-$-P) relationship is complicated.
Exact Jezek's Method Jezek (1936) derived a closed-form solution to an eccentrically loaded,
elastic-perfectly plastic column of rectangular cross section loaded beyond the elastic limit. The method requires solving (1) in three regions: elastic, primary plastic (yielding on the concave side of the column), and secondary plastic (yielding on both the concave and convex sides). Even for such a simple section with an idealized stress-strain relationship, the solution is still quite involved and requires elliptic integrals.
Approximate Jezek's Method The procedure for solving the beam-column problem can be considerably
simplified by assuming a suitable deflected shape for the column axis. This has been done by Westergaard and Osgood (1928), who assumed a sinusoidal shape for the deflected column. They found that the results obtained by such a simplification are conservatively close to those obtained from the exact analysis.
To make a further simplification, Jezek (1936) proposed an approximate method by making the following three assumptions: (1) Lateral deflection of the column is assumed to be a half sine wave; (2) equilibrium is established at midheight of the column; and (3) the stress-strain relation is assumed to be elastic-perfectly plastic. The approximate Jezek's method was used successfully by Bjorhovde and Tall (1971) for finding the maximum strength of hot-rolled steel columns.
DETERMINATION OF MAXIMUM COLUMN STRENGTH
In this study, the mathmatical development of the approximate Jezek's method is implemented in a computer program. This program is used to
1.2 -i
1.0 -
0.8 •
0.6 -
0.4 -
0 2 -
131
J. Struct. Eng. 1992.118:128-146.
Dow
nloa
ded
from
asc
elib
rary
.org
by
Nat
iona
l Chi
ao T
ung
Uni
vers
ity o
n 05
/01/
14. C
opyr
ight
ASC
E. F
or p
erso
nal u
se o
nly;
all
righ
ts r
eser
ved.
construct a load-deflection (P — v) curve for each axially loaded column. The maximum load P in the P — v curve is the maximum strength of the column. Program data include: length of the column, cross-sectional and material properties, initial imperfection, and residual stresses.
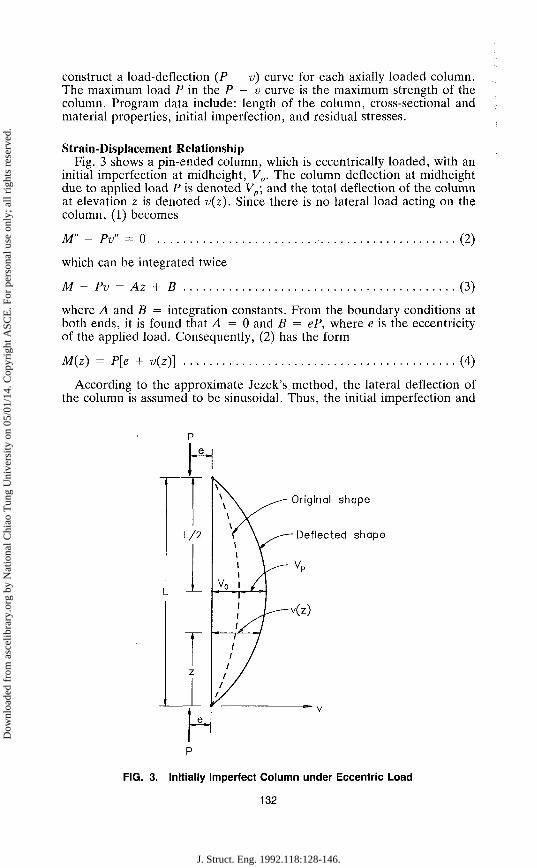
Strain-Displacement Relationship Fig. 3 shows a pin-ended column, which is eccentrically loaded, with an
initial imperfection at midheight, V0. The column deflection at midheight due to applied load P is denoted V ; and the total deflection of the column at elevation z is denoted v(z). column, (1) becomes
M" - Pv" = 0
which can be integrated twice
M - Pv = Az + B
Since there is no lateral load acting on the
(2)
(3)
where A and B = integration constants. From the boundary conditions at both ends, it is found that A = 0 and B = eP, where e is the eccentricity of the applied load. Consequently, (2) has the form
M{z) = P[e + v(z)] (4)
According to the approximate Jezek's method, the lateral deflection of the column is assumed to be sinusoidal. Thus, the initial imperfection and
Original shape
Deflected shape
FIG. 3. Initially Imperfect Column under Eccentric Load
132
J. Struct. Eng. 1992.118:128-146.
Dow
nloa
ded
from
asc
elib
rary
.org
by
Nat
iona
l Chi
ao T
ung
Uni
vers
ity o
n 05
/01/
14. C
opyr
ight
ASC
E. F
or p
erso
nal u
se o
nly;
all
righ
ts r
eser
ved.
the lateral deflection due to the applied load at elevation z of the column, va(z) and vp(z), can be expressed as
v0(z) = V0 sinlj^j (5)
vp(z) = Vp s i n ( ^ (6)
The total deflection at elevation z of the column, v(z), is
v{z) = v0(z) + Vp{z) (7)
If plane sections are assumed to remain plane and the deflection is small, the bending strain eb is related to the deflection v(z) by the familiar relationship
* = y = -v" (8)
where 4> = the bending curvature and y = the distance from an arbitrary point to the neutral axis of the section. From (6) and (8), the curvature at the column midheight (z = LI2) due to the applied load becomes
^ ( z ) 2 ' ^ <9> Thus, the relation between the bending strain and the lateral deflection is found to be
86 = y{lf ' V" (10)
Equilibrium Conditions The equilibrium conditions of the axial force and bending moment require
that
P = Pin (11)
M = Min (12)
where P and Pin = the external and internal forces; M and Min = the external and internal bending moments. At midheight of the column, the external bending moment can be found from
M = P(V0 + Vp + e) (13)
It is noted that under the combined axial load and bending moment, the cross section of the column may partially yield. Thus, the internal axial force and bending moment can be determined from
Pin = E\ sdA + E JAe JAp
zydA (14)
Min = E I e • ydA + E\ ey • ydA (15) JAe JAP
133
J. Struct. Eng. 1992.118:128-146.
Dow
nloa
ded
from
asc
elib
rary
.org
by
Nat
iona
l Chi
ao T
ung
Uni
vers
ity o
n 05
/01/
14. C
opyr
ight
ASC
E. F
or p
erso
nal u
se o
nly;
all
righ
ts r
eser
ved.
where e and ey — the total and the yield strains of the material, and Ae and Ap = the elastic and the plastic areas, respectively.
Effect of Residual Stress on Local Buckling According to the AISI {Specification 1986), the effective width, bef{, of a
locally buckled plate element can be determined as follows: When X. < 0.673, local buckling does not occur
freff = b (16)
when A. > 0.673, local buckling occurs
0 ^
•'ell
1 X
X (17)
where X = a slenderness parameter of the plate element, which is defined as
(18)
in which / = the actual stress; E = the Young's modulus; and k = the plate buckling coefficient.
Based on the assumption of linearly varying residual stresses through the plate thickness, partial yielding may occur in the component plate elements of the section, as shown in Fig. 1. Consequently, the original width-thickness ratio of the plate element is increased from bit to a larger value of blte. In other words, the partial yielding results in an increase of the slenderness parameter of the plate element. Let \e represent the slenderness parameter associated with the partially yielded plate element of elastic thickness te
(19)
Thus, if \e < 0.673, local buckling does not occur; if Xc > 0.673, local buckling occurs and the effective width becomes
_ P_^? K
&cff = b (20)
This discussion shows that the increase of the slenderness parameter from X to Xe may cause local buckling of an initially fully effective plate element, which can result in a second reduction of the column strength.
During the analysis, the values of Xc for each plate element of the cold-formed section are checked for a possible second reduction in every incremental step.
Computational Scheme At the beginning of the computer analysis, a value of P is assumed for a
given increment of lateral deflection. To construct the load-deflection curve
134
J. Struct. Eng. 1992.118:128-146.
Dow
nloa
ded
from
asc
elib
rary
.org
by
Nat
iona
l Chi
ao T
ung
Uni
vers
ity o
n 05
/01/
14. C
opyr
ight
ASC
E. F
or p
erso
nal u
se o
nly;
all
righ
ts r
eser
ved.

for each column, the first value of P = 0.1Py was assumed, where Py is the yield load of the column. The external bending moment M can be determined from (13); and the associated bending strain can be calculated by using (10). Also, the axial strain caused by the external load P is found from
6* = (^) ( 2 1 )
The total strain can be obtained by summing up the bending strain, axial strain, and residual strain. Then, the elastic and plastic parts of the section are determined, and (14) and (15) are used to calculate the internal force and moment.
If the equilibrium conditions are satisfied, i.e., P = Pin and M = Min, then a point on the column P-v curve has been obtained. However, if Pin \ P, the axial strain ea is changed and Pin and M,„ are recomputed. The convergence tolerances used in the iterative evaluation of equilibrium are \P - P,„\ < 0.001 kips and \M - M,-„\ < 0.001 kip-ft. After equilibrium is satisfied, the lateral deflection is incremented and a new iteration started. This procedure continues until the maximum load P is reached.
DATA INPUT FOR ANALYSIS
Column Test Data In this study, data from 104 column tests were used. For locally stable
columns, this study adopted 33 sets of data from Weng and Pekoz (1990a) and 26 sets from Dat (1980), as given in Tables 1 and 2, respectively. For locally unstable columns, this study used 12 sets of data from Mulligan (1983) and seven sets from Loughlan and Rhodes (1980), as given in Table 3. This study also used 26 sets of data from Loughlan and Rhodes (1980) for eccentrically loaded columns, as given in Table 4. The columns were all pin-ended, with a lipped-channel cross section, bent about the weak axis. All columns were controlled by flexural buckling.
Residual Stresses The results of the residual stresses obtained by Weng and Pekoz (1990b)
were used in this study. The magnitudes of the surface residual stresses at the flat portion and corner region,/^and frc, were equal to 0.3Fy and 0.7Fy, respectively. Also, the residual stresses were assumed to be linearly distributed through the plate thickness with compressive residual stress on the inside surface and tensile residual stress on the outside surface of the channel section.
Initial Imperfection Because of the lack of actual measured data of initial imperfections of
cold-formed steel columns, two different values of the initial imperfection at midheight of the column were assumed and used in the analysis, i.e., V0 = L/1,500 and V0 = L/1,000, where L is the length of the pin-ended column.
Variation of Yield Stress at Corner Regions The test results obtained by Karren (1967) and Dat (1980) showed that
the yield stress at the corners, fyc, of a cold-formed section is greater than that at the flat portions. In this study, a value of fyc = lAFy was used for
135
J. Struct. Eng. 1992.118:128-146.
Dow
nloa
ded
from
asc
elib
rary
.org
by
Nat
iona
l Chi
ao T
ung
Uni
vers
ity o
n 05
/01/
14. C
opyr
ight
ASC
E. F
or p
erso
nal u
se o
nly;
all
righ
ts r
eser
ved.
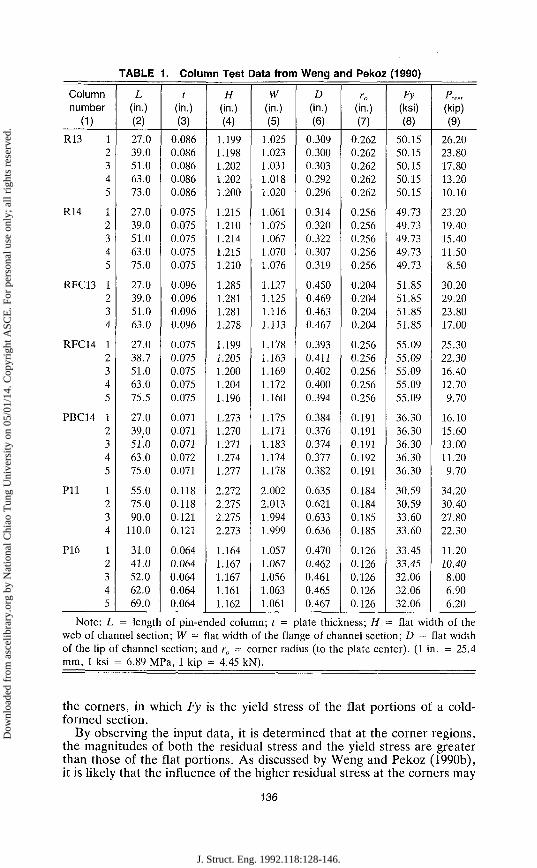
TABLE 1. Column Test Data from Weng and Pekoz (1990)
Column number
(D R13
R14
RFC13
RFC14
PBC14
P l l
P16
1 2 3 4 5
1 2 3 4 5
1 2 3 4
1 2 3 4 5
1 2 3 4 5
1 2 3 4
1 2 3 4 5
L (in.) (2)
27.0 39.0 51.0 63.0 73.0
27.0 39.0 51.0 63.0 75.0
27.0 39.0 51.0 63.0
27.0 38.7 51.0 63.0 75.5
27.0 39.0 5l'.0 63.0 75.0
55.0 75.0 90.0
110.0
31.0 41.0 52.0 62.0 69.0
( (in.) (3)
0.086 0.086 0.086 0.086 0.086
0.075 0.075 0.075 0.075 0.075
0.096 0.096 0.096 0.096
0.075 0.075 0.075 0.075 0.075
0.071 0.071 0.071 0.072 0.071
0.118 0.118 0.121 0.121
0.064 0.064 0.064 0.064 0.064
H (in.) (4)
1.199 1.198 1.202 1.202 1.200
1.215 1.210 1.214 1.215 1.210
1.285 1.281 1.281 1.278
1.199 1.205 1.200 1.204 1.196
1.273 1.270 1.271 1.274 1.277
2.272 2.275 2.275 2.273
1.164 1.167 1.167 1.161 1.162
W (in.) (5)
1.025 1.023 1.031 1.018 1.020
1.061 1.075 1.067 1.070 1.076
1.127 1.125 1.116 1.113
1.178 1.163 1.169 1.172 1.160
1.175 1.171 1.183 1.174 1.178
2.002 2.013 1.994 1.999
1.057 1.067 1.056 1.063 1.061
D (in.) (6)
0.309 0.300 0.303 0.292 0.296
0.314 0.320 0.322 0.307 0.319
0.450 0.469 0.463 0.467
0.393 0.411 0.402 0.400 0.394
0.384 0.376 0.374 0.377 0.382
0.635 0.621 0.633 0.636
0.470 0.462 0.461 0.465 0.467
ra
(in.) (7)
0.262 0.262 0.262 0.262 0.262
0.256 0.256 0.256 0.256 0.256
0.204 0.204 0.204 0.204
0.256 0.256 0.256 0.256 0.256
0.191 0.191 0.191 0.192 0.191
0.184 0.184 0.185 0.185
0.126 0.126 0.126 0.126 0.126
Fy (ksi) (8)
50.15 50.15 50.15 50.15 50.15
49.73 49.73 49.73 49.73 49.73
51.85 51.85 51.85 51.85
55.09 55.09 55.09 55.09 55.09
36.30 36.30 36.30 36.30 36.30
30.59 30.59 33.60 33.60
33.45 33.45 32.06 32.06 32.06
p 1 test (kip)
0) 26.20 23.80 17.80 13.20 10.10
23.20 19.40 15.40 11.50 8.50
30.20 29.20 23.80 17.00
25.30 22.30 16.40 12.70 9.70
16.10 15.60 13.00 11.20 9.70
34.20 30.40 27.80 22.30
11.20 10.40 8.00 6.90 6.20
Note: L = length of pin-ended column; ; = plate thickness; H = flat width of the web of channel section; W = flat width of the flange of channel section; D = flat width of the lip of channel section; and ra = corner radius (to the plate center). (1 in. = 25.4 mm, 1 ksi = 6.89 MPa, 1 kip = 4.45 kN).
the corners, in which Fy is the yield stress of the flat portions of a cold-formed section.
By observing the input data, it is determined that at the corner regions, the magnitudes of both the residual stress and the yield stress are greater than those of the flat portions. As discussed by Weng and Pekoz (1990b), it is likely that the influence of the higher residual stress at the corners may
136
J. Struct. Eng. 1992.118:128-146.
Dow
nloa
ded
from
asc
elib
rary
.org
by
Nat
iona
l Chi
ao T
ung
Uni
vers
ity o
n 05
/01/
14. C
opyr
ight
ASC
E. F
or p
erso
nal u
se o
nly;
all
righ
ts r
eser
ved.

TABLE 2. Column Test Data from Dat (1980)
Column number
(1)
RFC13
PBC13
RFC14
PBC14
1 2 3 4 5 6 7 8
1 2 3 4 5
1 2 3 4 5 6 7
1 2 3 4 5 6
L (in.)
(2)
87.0 75.0 69.0 63.0 57.0 51.0 45.0 39.0
100.0 82.0 63.0 51.0 39.0
84.9 80.5 80.5 51.0 51.0 39.0 27.0
89.0 78.0 69.0 57.0 39.0 27.0
t (in.) (3)
0.090 0.090 0.090 0.090 0.090 0.090 0.090 0.090
0.090 0.090 0.090 0.090 0.090
0.073 0.073 0.073 0.073 0.073 0.073 0.073
0.073 0.073 0.073 0.073 0.073 0.073
H (in.)
(4)
1.25 1.25 1.25 1.25 1.25 1.25 1.25 1.25
1.25 1.25 1.25 1.25 1.25
1.25 1.25 1.25 1.25 1.25 1.25 1.25
1.25 1.25 1.25 1.25 1.25 1.25
W (in.)
(5)
1.20 1.20 1.20 1.20 1.20 1.20 1.20 1.20
1.20 1.20 1.20 1.20 1.20
1.20 1.20 1.20 1.20 1.20 1.20 1.20
1.20 1.20 1.20 1.20 1.20 1.20
D (in.)
(6)
0.50 0.50 0.50 0.50 0.50 0.50 0.50 0.50
0.50 0.50 0.50 0.50 0.50
0.50 0.50 0.50 0.50 0.50 0.50 0.50
0.50 0.50 0.50 0.50 0.50 0.50
r0
(in.)
(7)
0.20 0.20 0.20 0.20 0.20 0.20 0.20 0.20
0.20 0.20 0.20 0.20 0.20
0.20 0.20 0.20 0.20 0.20 0.20 0.20
0.20 0.20 0.20 0.20 0.20 0.20
Fy (ksi) (8)
44.27 44.27 44.27 44.27 44.27 44.27 44.27 44.27
44.26 44.26 44.26 44.26 44.26
47.91 47.91 47.91 47.91 47.91 47.91 47.91
44.75 44.75 44.75 44.75 44.75 44.75
p 1 test (kip)
(9)
9.03 12.20 13.35 16.00 20.00 23.00 20.50 29.50
7.70 9.95
15.85 21.60 26.40
9.05 8.80 8.00
15.50 16.00 18.00 19.50
8.20 10.50 11.20 13.95 19.30 20.20
Note: 1 in. = 25.4 mm, 1 ksi = 6.89 MPa, 1 kip = 4.45 kN.
be negated by the increase of the yield stress. Besides, the area of the corner regions usually consist of only a minor percentage of the total area of a cold-formed section. Thus, for simplicity, it seems reasonable to neglect both the increases of the residual stress and the yield stress at the corners. Based on this observation, a set of simplified input data with values of fyc = l.OFy and/ rc = 0.3Fy for the yield stress and residual stress of the corner regions also were used in the analysis. The results obtained by using the simplified input data are then compared with those obtained without using such a simplification.
RESULTS AND COMMENTS
Table 5 shows a comparison between the average predicted maximum column strengths and the test results of 104 cold-formed steel columns. The results shown in the table include two different cases: Case 1 was obtained without using the simplified input data for the corner regions; and case 2 was obtained by using such a simplification.
137
J. Struct. Eng. 1992.118:128-146.
Dow
nloa
ded
from
asc
elib
rary
.org
by
Nat
iona
l Chi
ao T
ung
Uni
vers
ity o
n 05
/01/
14. C
opyr
ight
ASC
E. F
or p
erso
nal u
se o
nly;
all
righ
ts r
eser
ved.
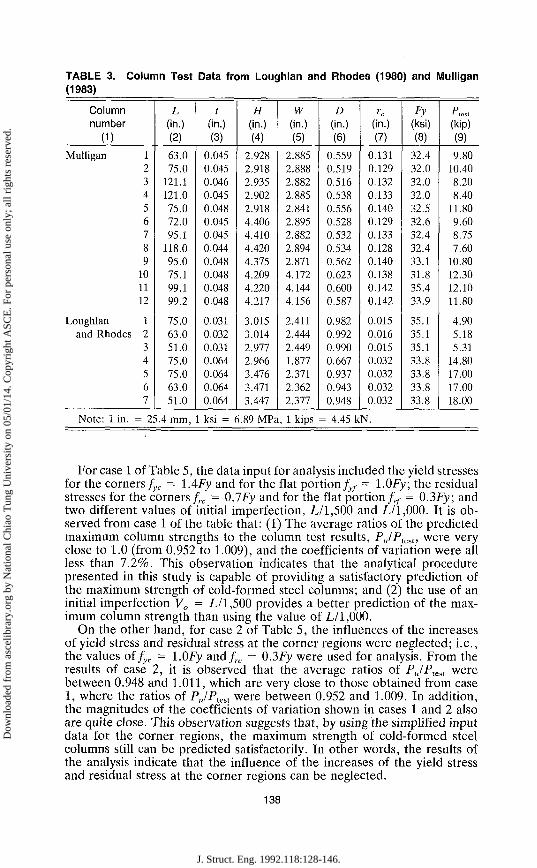
TABLE 3. Column Test Data from Loughlan and Rhodes (1980) and Mulligan (1983)
Column number
(1)
Mulligan 1 2 3 4 5 6 7 8 9
10 11 12
Loughlan 1 and Rhodes 2
3 4 5 6 7
L (in.) (2)
63.0 75.0
121.1 121.0 75.0 72.0 95.1
118.0 95.0 75.1 99.1 99.2
75.0 63.0 51.0 75.0 75.0 63.0 51.0
t (in.) (3)
0.045 0.045 0.046 0.045 0.048 0.045 0.045 0.044 0.048 0.048 0.048 0.048
0.031 0.032 0.031 0.064 0.064 0.064 0.064
H (in.) (4)
2.928 2.918 2.935 2.902 2.918 4.406 4.410 4.420 4.375 4.209 4.220 4.217
3.015 3.014 2.977 2.966 3.476 3.471 3.447
W (in.) (5)
2.885 2.888 2.882 2.885 2.841 2.895 2.882 2.894 2.871 4.172 4.144 4.156
2.411 2.444 2.449 1.877 2.371 2.362 2.377
D (in.) (6)
0.559 0.519 0.516 0.538 0.556 0.528 0.532 0.534 0.562 0.623 0.600 0.587
0.982 0.992 0.990 0.667 0.937 0.943 0.948
r„ (in.) (7)
0.131 0.129 0.132 0.133 0.140 0.129 0.133 0.128 0.140 0.138 0.142 0.142
0.015 0.016 0.015 0.032 0.032 0.032 0.032
Fy (ksi) (8)
32.4 32.0 32.0 32.0 32.5 32.6 32.4 32.4 33.1 31.8 35.4 33.9
35.1 35.1 35.1 33.8 33.8 33.8 33.8
p 1 test
(kip)
0) 9.80
10.40 8.20 8.40
11.80 9.60 8.75 7.60
10.80 12.30 12.10 11.80
4.90 5.18 5.31
14.80 17.00 17.00 18.00
Note: 1 in. = 25.4 mm, 1 ksi = 6.89 MPa, 1 kips = 4.45 kN.
For case 1 of Table 5, the data input for analysis included the yield stresses for the corners fyc = lAFy and for the flat portion fyf = 1.0Fy; the residual stresses for the corners/„. = 0.7Fy and for the flat portion/^ = 0.3Fy; and two different values of initial imperfection, L/1,500 and L/1,000. It is observed from case 1 of the table that: (1) The average ratios of the predicted maximum column strengths to the column test results, PJPtest, were very close to 1.0 (from 0.952 to 1.009), and the coefficients of variation were all less than 7.2%. This observation indicates that the analytical procedure presented in this study is capable of providing a satisfactory prediction of the maximum strength of cold-formed steel columns; and (2) the use of an initial imperfection V0 = L/1,500 provides a better prediction of the maximum column strength than using the value of L/1,000.
On the other hand, for case 2 of Table 5, the influences of the increases of yield stress and residual stress at the corner regions were neglected; i.e., the values of fyc = l.OFy and/, r = 0.3Fy were used for analysis. From the results of case 2, it is observed that the average ratios of PJPKst were between 0.948 and 1.011, which are very close to those obtained from case 1, where the ratios of PJPtest were between 0.952 and 1.009. In addition, the magnitudes of the coefficients of variation shown in cases 1 and 2 also are quite close. This observation suggests that, by using the simplified input data for the corner regions, the maximum strength of cold-formed steel columns still can be predicted satisfactorily. In other words, the results of the analysis indicate that the influence of the increases of the yield stress and residual stress at the corner regions can be neglected.
138
J. Struct. Eng. 1992.118:128-146.
Dow
nloa
ded
from
asc
elib
rary
.org
by
Nat
iona
l Chi
ao T
ung
Uni
vers
ity o
n 05
/01/
14. C
opyr
ight
ASC
E. F
or p
erso
nal u
se o
nly;
all
righ
ts r
eser
ved.

TABLE 4. Eccentrially Loaded Column Test Data from Loughlan and Rhodes (1980)
Column number
(D L 1 L 2 L 3 L 4 L 5 L 6 L 7 L 8 L 9 L 10 L 11 L 12 L 13 L 14 L 15 L 16 L 17 L 18 L 1 9 L 2 0 L 2 1 L 2 2 L23 L24 L 2 5 L 2 6
L (in.)
(2)
75.0 51.0 75.0 63.0 51.0 75.0 63.0 51.0 75.0 63.0 51.0 75.0 63.0 51.0 75.0 63.0 51.0 75.0 63.0 51.0 75.0 63.0 51.0 75.0 63.0 51.0
t (in.)
(3)
0.032 0.031 0.031 0.032 0.031 0.031 0.031 0.031 0.031 0.031 0.032 0.032 0.032 0.032 0.031 0.031 0.032 0.031 0.031 0.031 0.065 0.066 0.065 0.064 0.065 0.065
A (in.)
(4)
1.983 1.975 2.007 1.991 1.985 2.501 2.472 2.474 2.500 2.492 2.479 2.974 2.980 2.971 3.489 3.472 3.481 3.494 3.495 3.459 2.964 2.960 2.947 3.473 3.466 3.434
B (in.)
(5)
1.959 1.957 2.440 2.440 2.449 1.961 1.956 1.960 2.438 2.450 2.445 1.966 1.960 1.955 1.945 1.956 1.956 2.447 2.449 2.450 2.365 2.362 2.369 1.876 1.879 1.868
C (in.)
(6)
0.726 0.741 0.985 0.984 0.997 0.719 0.726 0.737 0.984 0.988 0.991 0.730 0.758 0.733 0.726 0.729 0.755 0.976 0.980 1.001 0.934 0.941 0.945 0.676 0.674 0.679
I'o
(in.) (7)
0.016 0.015 0.015 0.016 0.015 0.015 0.015 0.015 0.015 0.015 0.016 0.016 0.016 0.016 0.015 0.015 0.016 0.015 0.015 0.015 0.032 0.033 0.032 0.032 0.032 0.032
Fy (ksi) (8)
35.1 35.1 35.1 35.1 35.1 35.1 35.1 35.1 35.1 35.1 35.1 35.1 35.1 35.1 35.1 35.1 35.1 35.1 35.1 35.1 33.8 33.8 33.8 33.8 33.8 33.8
p 1 test (kip)
(9)
3.12 3.60 3.52 3.78 4.10 3.80 3.97 4.31 4.34 4.57 4.65 3.35 3.53 3.85 3.13 3.39 3.67 3.86 4.42 4.14
16.00 16.00 16.00 11.00 12.00 13.00
e (in.) (10)
-0 .29 -0 .29 -0 .40 -0 .40 -0 .41 -0 .07 -0 .07 -0 .07 -0 .18 -0 .19 -0 .19 -0 .18 -0 .18 -0 .18 -0 .22 -0 .22 -0 .22 -0 .16 -0 .16 -0 .16 -0 .08 -0 .08 -0 .08 -0 .11 -0 .11 -0 .11
Note: e = eccentricity of the axial load; (1 in. = 25.4 mm, 1 ksi = 6.89 MPa, 1 kip = 4.45 kN).
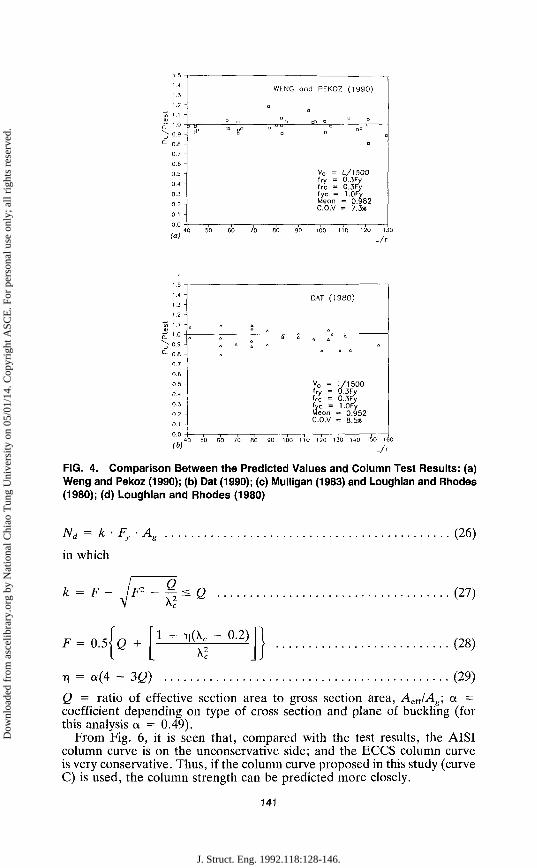
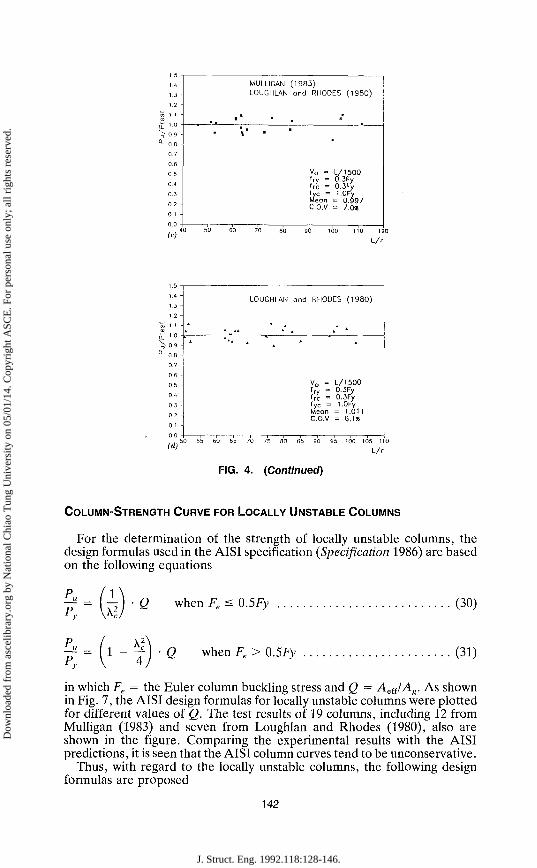
Figs. A{a)-{d) show the ratios of the predicted individual maximum column strength to the column test results obtained by Weng and Pekoz (1990a), Dat (1980), Mulligan (1983), and Loughlan and Rhodes (1980), using the simplified corner data.
COLUMN-STRENGTH CURVE FOR LOCALLY STABLE COLUMNS
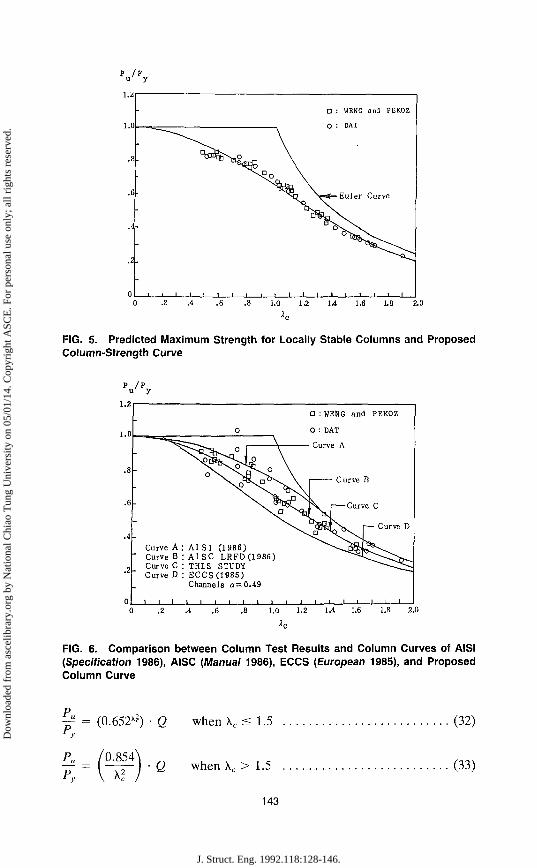
As shown in Fig. 5, the predicted maximum strengths for the locally stable columns tested by Weng and Pekoz (1990a) and Dat (1980) were plotted in terms of a dimensionless column slenderness parameter Xc, where \c = (1/TT) • (\/Fy/E) • (L/r). Based on these predicted values, a column-strength curve was constructed by using a least-squares regression technique. The equations found for the new column curve are
^ = 0.652x? when kc s 1.5 (22)
139
J. Struct. Eng. 1992.118:128-146.
Dow
nloa
ded
from
asc
elib
rary
.org
by
Nat
iona
l Chi
ao T
ung
Uni
vers
ity o
n 05
/01/
14. C
opyr
ight
ASC
E. F
or p
erso
nal u
se o
nly;
all
righ
ts r
eser
ved.
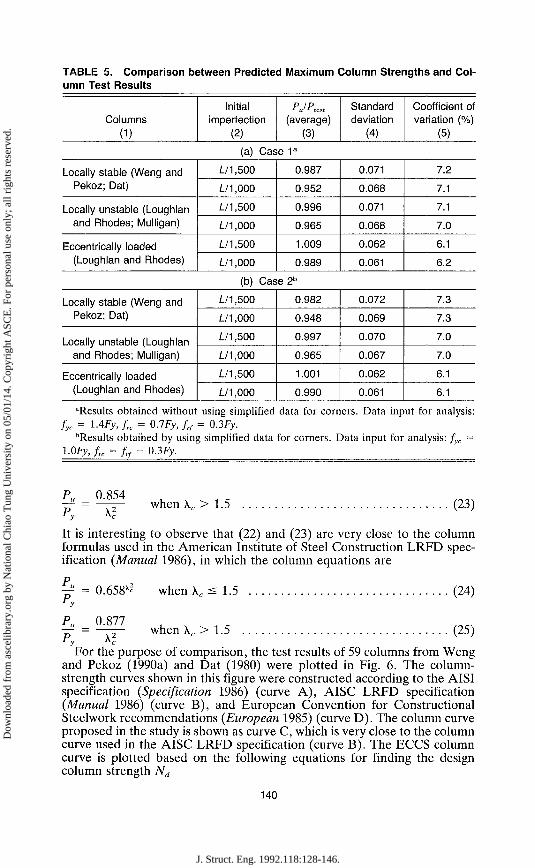
TABLE 5. Comparison between Predicted Maximum Column Strengths and Column Test Results
Columns (1)
Locally stable (Weng and Pekoz; Dat)
Locally unstable (Loughlan and Rhodes; Mulligan)
Eccentrically loaded (Loughlan and Rhodes)
Locally stable (Weng and Pekoz; Dat)
Locally unstable (Loughlan and Rhodes; Mulligan)
Eccentrically loaded (Loughlan and Rhodes)
Initial imperfection
(2)
P IP 1 it11 test
(average) (3)
(a) Case 1a
Z./1,500
L/1,000
L/1,500
L/1,000
L/1,500
L/1,000
0.987
0.952
0.996
0.965
1.009
0.989
(b) Case2b
L/1,500
L/1,000
L/1,500
L/1,000
L/1,500
L/1,000
0.982
0.948
0.997
0.965
1.001
0.990
Standard deviation
(4)
0.071
0.068
0.071
0.068
0.062
0.061
0.072
0.069
0.070
0.067
0.062
0.061
Coefficient of variation (%)
(5)
7.2
7.1
7.1
7.0
6.1
6.2
7.3
7.3
7.0
7.0
6.1
6.1
"Results obtained without fyc = lAFy, /„ = O.IFy, fr/ -
bResults obtained by using l.OFy, /„ = frf = 0.3Fy.
using simplified data for corners. Data input for analysis: = 0.3Fy. simplified data for corners. Data input for analysis: f c =
P„ 0.854 — = 2 when \c > 1.5 (23) "y K It is interesting to observe that (22) and (23) are very close to the column formulas used in the American Institute of Steel Construction LRFD specification (Manual 1986), in which the column equations are
y = 0.658x* when \c < 1.5 (24) "y
P 0 877 £ = ^ when \c > 1.5 (25)
For the purpose of comparison, the test results of 59 columns from Weng and Pekoz (1990a) and Dat (1980) were plotted in Fig. 6. The column-strength curves shown in this figure were constructed according to the AISI specification (Specification 1986) (curve A), AISC LRFD specification (Manual 1986) (curve B), and European Convention for Constructional Steelwork recommendations (European 1985) (curve D). The column curve proposed in the study is shown as curve C, which is very close to the column curve used in the AISC LRFD specification (curve B). The ECCS column curve is plotted based on the following equations for finding the design column strength Nd
140
J. Struct. Eng. 1992.118:128-146.
Dow
nloa
ded
from
asc
elib
rary
.org
by
Nat
iona
l Chi
ao T
ung
Uni
vers
ity o
n 05
/01/
14. C
opyr
ight
ASC
E. F
or p
erso
nal u
se o
nly;
all
righ
ts r
eser
ved.
-
-. Ff
-
q j s°
WENG
o
° " o
and PEKOZ ( 1 9 9 0 )
B D c
• °
V0 = L / 1 5 0 0 (ry = O.JFy frc = 0.3FV fyc = I.OFy Mean = 0.982 C.O.V = 7.3x
(a) L / r
(b)
DAT (1980)
V0 = L /1500 fry = O.JFy frc = 0.3Fy fyc = I.OFy Mean = 0.952 C.O.V = 8 .5*
80 90 100 110 120 130 140 150 160
L/r
FIG. 4. Comparison Between the Predicted Values and Column Test Results: (a) Weng and Pekoz (1990); (b) Dat (1990); (c) Mulligan (1983) and Loughlan and Rhodes (1980); (d) Loughlan and Rhodes (1980)
Nd = k-
in which
Fy-Ag (26)
F2__Q Q (27)
F = 0.5 Q + 1 + T1(\C - 0.2)
•n = o(4 - 3 0
(28)
(29)
Q = ratio of effective section area to gross section area, Ae{!/Ag; a = coefficient depending on type of cross section and plane of buckling (for this analysis a = 0.49).
From Fig. 6, it is seen that, compared with the test results, the AISI column curve is on the unconservative side; and the ECCS column curve is very conservative. Thus, if the column curve proposed in this study (curve C) is used, the column strength can be predicted more closely.
141
J. Struct. Eng. 1992.118:128-146.
Dow
nloa
ded
from
asc
elib
rary
.org
by
Nat
iona
l Chi
ao T
ung
Uni
vers
ity o
n 05
/01/
14. C
opyr
ight
ASC
E. F
or p
erso
nal u
se o
nly;
all
righ
ts r
eser
ved.
MULLIGAN LOUGHLAN
• •
l " •
( 1 9 8 3 ) ; and RHODES ( 1 9 8 0 )
V0 " L / 1 5 0 0 'ry = 0.3Fy ' re = 0.3Fy fyc = l-OFy Mean = 0.997 C.O.V = 7.0s
(<••) L / r
<d)
-
-; _ *
-
50 55
4 iA * A
60 65
LOUGHLAN and
*
70
*
*
75
/ ^ *
80 85
RHODES ( 1 9 8 0 )
»
V „ = L /1500 fry = 0.3Fy f r c = 0.3R-fyc = l.OFy Mean = 1.01 1 C.O.V = 6 . 1 *
90 95 100 105 1
L / r
FIG. 4. (ConMnued)
COLUMN-STRENGTH CURVE FOR LOCALLY UNSTABLE COLUMNS
For the determination of the strength of locally unstable columns, the design formulas used in the AISI specification (Specification 1986) are based on the following equations
• Q when Fe < 0.5Fy (30)
S - M Q when Fe > 0.5Fy (31)
in which Fe = the Euler column buckling stress and Q = As{f/Ag. As shown in Fig. 7, the AISI design formulas for locally unstable columns were plotted for different values of Q. The test results of 19 columns, including 12 from Mulligan (1983) and seven from Loughlan and Rhodes (1980), also are shown in the figure. Comparing the experimental results with the AISI predictions, it is seen that the AISI column curves tend to be unconservative.
Thus, with regard to the locally unstable columns, the following design formulas are proposed
142
J. Struct. Eng. 1992.118:128-146.
Dow
nloa
ded
from
asc
elib
rary
.org
by
Nat
iona
l Chi
ao T
ung
Uni
vers
ity o
n 05
/01/
14. C
opyr
ight
ASC
E. F
or p
erso
nal u
se o
nly;
all
righ
ts r
eser
ved.
P It u y
1.0
. 2 .
_i I ' i i
O : WENG and PEKOZ
O : DAT
i iu jer Curve
- j I 1 I I I I l_ 1.0 12 IA 1.6 1.8 2.0
in
FIG. 5. Predicted Maximum Strength for Locally Stable Columns and Proposed Column-Strength Curve
P / F u y
1.2
1.0
D : WENG and PEKOZ
O : DAT
Curve A
Curve A : A I S I ( 1 9 8 6 ) Curve B : A I S C L R F D C 1 9 8 6 ) Curve C : T H I S STUDY Curve D : E C C S ( 1 9 8 5 )
Channels a = 0 . 4 9
' ' ' I ' ' ' ' 1 I L-1.0 1.2 1.4 1.6 1.8 2.0
Ac
FIG. 6. Comparison between Column Test Results and Column Curves of AISI {Specification 1986), AISC {Manual 1986), ECCS {European 1985), and Proposed Column Curve
f = (0.652*) • Q •* v
when kc < 1.5 (32)
0.854 Q when Xc > 1.5 (33)
143
J. Struct. Eng. 1992.118:128-146.
Dow
nloa
ded
from
asc
elib
rary
.org
by
Nat
iona
l Chi
ao T
ung
Uni
vers
ity o
n 05
/01/
14. C
opyr
ight
ASC
E. F
or p
erso
nal u
se o
nly;
all
righ
ts r
eser
ved.

p /p
A : Q = 0 .4 t o 0 . 5 a : Q » 0 . 5 t o 0 .6 O : Q = 0 . 6 t o 0 . 7 A i Q m 0 . 7 t o 0 .8
FIG. 7. Comparison between Test Results of Locally Unstable Columns and the AISI {Specification 1986) Column-Strength Curve
p / p u' y
A : Q = 0 .4 t o 0 . 5 O : Q = 0 . 5 t o 0 .6 O : Q = 0 .6 t o 0 .7 A : Q = 0 .7 t o 0 .8
FIG. 8. Comparison between Test Results of Locally Unstable Columns and Proposed Column-Strength Curve
Figure 8 shows the column curves constructed from the preceding formulas. The column test results from Mulligan (1983) and Loughlan and Rhodes (1980) also are shown in Fig. 8. It is seen that the formulas recommended in this study for predicting the maximum strength of locally unstable columns showed good agreement with the experimental results.
144
J. Struct. Eng. 1992.118:128-146.
Dow
nloa
ded
from
asc
elib
rary
.org
by
Nat
iona
l Chi
ao T
ung
Uni
vers
ity o
n 05
/01/
14. C
opyr
ight
ASC
E. F
or p
erso
nal u
se o
nly;
all
righ
ts r
eser
ved.

SUMMARY AND CONCLUSIONS
1. Based on beam-column theory, a computerized maximum strength analysis for cold-formed steel columns was performed. The predicted values showed good agreement with the results of tests of 104 columns performed by previous researchers.
2. The influences of initial imperfection, residual stress, local buckling due to residual stress, and variation of yield stress at corners on the strength of cold-formed steel columns were taken directly into account in the analyses.
3. The results of the analyses showed that the influence of the variation of residual stress and yield stress at the corner regions can be neglected; i.e., the surface residual stress and the yield stress at the corners can be taken as l.OFy and Q.3Fy, respectively.
4. A new column-strength curve was obtained from the results of the analyses. Meanwhile, two sets of column formulas were presented for predicting the maximum strength of locally stable and locally unstable cold-formed steel columns.
5. The proposed column curve showed good agreement with the column test results and found to be very close to the column curve used in the AISC LRFD specification (Manual 1986).
APPENDIX I. REFERENCES
Manual of steel construction, load and resistance factor design. (1986). First Ed., American Institute of Steel Construction, Chicago, 111.
Specification for the design of cold-formed steel structural members. (1986). American Iron and Steel Institute, Washington, D.C.
Bjorhovde, R., and Tall, L. (1971). "Maximum column strength and the multiple column curve concept." Fritz. Engrg. Lab. Report No. 337.29, Lehigh University, Bethlehem, Pa., Oct.
Chen, W. F., and Atsuta, T. (1976). "Theory of beam-columns." Vol. 1, McGraw-Hill, New York, N.Y.
Dat, D. T. (1980). "The strength of cold-formed steel columns." Report No. 80-4, Dept. of Struct. Engrg., Cornell University, Ithaca, N.Y.
"European recommendations for the design of light gauge steel members." (1985). ECCS-TWG 711, European Convention for Constructional Steelwork, Brussels, Belgium.
Jezek, K. (1936). "Die Tragfahigkeit Axial Gedruckter und auf Biegung Bean-spruchter Stahlstabe," Der Stahlbau, Vol. 9, 12 (in German).
Karren, K. W. (1967). "Corner properties of cold-formed steel shapes." /. Struct. Div., ASCE, 92(1), 401-432.
Loughlan, J., and Rhodes, J. (1980). "The interactive buckling of lipped channel columns under concentric or eccentric loading." Proc. of the Int. Conf. on Thin-Walled Structures, Held at University of Strathclyde, Glasgow.
Mulligan, G. P. (1983). "The influence of local buckling on the structural behavior of symmetric cold-formed steel columns. "Report No. 83-1, Dept. of Struct. Engrg., Cornell University, Ithaca, N.Y.
Weng,C. C. (1991). "Effect of residual stress on cold-formed steel column strength." J. Struct. Engrg., ASCE, 117(6), 1622-1640.
Weng, C. C , and Pekoz, T. B. (1990a). "Compression tests of cold-formed steel columns." J. Struct. Engrg., ASCE, 116(5), 1230-1264.
Weng, C. C , and Pekoz, T. B. (1990b). "Residual stresses in cold-formed steel members."/. Struct. Engrg., ASCE, 116(6), 1611-1626.
Westergaard, H. M., and Osgood, W. R. (1928). "Strength of steel columns." Trans. ASME, 49, 50, 65.
145
J. Struct. Eng. 1992.118:128-146.
Dow
nloa
ded
from
asc
elib
rary
.org
by
Nat
iona
l Chi
ao T
ung
Uni
vers
ity o
n 05
/01/
14. C
opyr
ight
ASC
E. F
or p
erso
nal u
se o
nly;
all
righ
ts r
eser
ved.

APPENDIX II. NOTATION
The following symbols are used in this paper:
A e = elastic area; Ae{{ = effective section area;
A g = gross section area; A p = plastic area;
b = flat width of plate element; be(f = effective width;
D = flat width of lip of channel section; E = Young's modulus; Fe = Euler column buckling stress; Fy = yield stress of flat portion; fyc = yield stress of corner region; frc = surface residual stress of corner region; f\f = surface residual stress of flat portion; H = flat width of web of channel section; k = plate elastic buckling coefficient; L = column length;
M = external bending moment ; Min = internal bending moment ; Nd = design column strength used in ECCS column formula;
P = external axial force; Pin = internal axial force; Pu = predicted maximum column strength;
P,es t = maximum column strength obtained from test; Py = column yield load; U = Aeff/Ag',
q = lateral load; r = radius of gyration;
r0 = corner radiusof channel section; t = plate thickness;
te = elastic plate thickness; V0 = initial deflection at midheight of column; Vp = lateral deflection at midheight of column due to applied axial load;
v = lateral deflection of column (general); W = flat width of flange of channel section; z = longitudinal axis of column; E = total strain;
Ea = axial strain; eb = bending strain; \ = plate slenderness parameter;
\c = column slenderness parameter; \e = plate slenderness parameter with elastic thickness te; 4) = bending curvature.
146
J. Struct. Eng. 1992.118:128-146.
Dow
nloa
ded
from
asc
elib
rary
.org
by
Nat
iona
l Chi
ao T
ung
Uni
vers
ity o
n 05
/01/
14. C
opyr
ight
ASC
E. F
or p
erso
nal u
se o
nly;
all
righ
ts r
eser
ved.