Study on Karai Mini-Hydro Power Project in the Province of ...
280
Study on Economic Partnership Projects in Developing Countries in FY2014 Study on Karai Mini-Hydro Power Project in the Province of Sumatera Utara, the Republic of Indonesia Final Report February 2015 Prepared for: Ministry of Economy, Trade and Industry Ernst & Young Shin Nihon LLC Japan External Trade Organization Prepared by: Chodai Co., Ltd. IDI infrastructures Inc. Kiso-jiban Consultants Co.,Ltd.
Transcript of Study on Karai Mini-Hydro Power Project in the Province of ...
Study on Economic Partnership Projects
in Developing Countries in FY2014
Study on Karai Mini-Hydro Power Project in the Province of
Sumatera Utara, the Republic of Indonesia
Final Report
February 2015
Prepared for:
Ministry of Economy, Trade and Industry
Ernst & Young Shin Nihon LLC
Japan External Trade Organization
Prepared by:
Chodai Co., Ltd.
IDI infrastructures Inc.
Kiso-jiban Consultants Co.,Ltd.


Preface
This report represents the collated results of the “FY 2014 Infrastructure System Export Promotion Study
Project ((Study on Formation of Yen Loans and Private-Sector Infrastructure Projects)),” which was awarded by
the Ministry of Economy, Trade and Industry to CHODAI CO., LTD., IDI infrastructures Inc. and Kiso-jiban
Consultants Co., Ltd..
The study that was conducted, “Study on Karai Mini-Hydro Power Project in the Province of Sumatera Utara,
the Republic of Indonesia” was an investigation into the placement of flow-through style small hydro-power
stations on the Karai River in the Province of Sumatera Utara, the Republic of Indonesia, in order to consider the
feasibility of spending of JPY 1.47 billion on the construction of power stations and associated facilities with the
goal of helping to resolve the inherent serious power shortage in the Province of Sumatera Utara.
This report is intended to aid in the realization of the above project, as well as providing reference material for
those participants based in Japan.
February 2015
Chodai Co., Ltd.
IDI infrastructures Inc.
Kiso-jiban Consultants Co.,Ltd.

Geographical Location of the Project Sites
Source: Created by the Survey Commission
The Republic of Indonesia, North Sumatra Province
Simalungun Regency
Plan 1, Plan 2 Site Map

List of Abbreviations
Abbreviation Official Name / Term
AMDAL ANALISIS MENGENAI DAMPAK
LINGKUNGAN
B/C Benefit / Cost
BHE Bumi Hidro Engineering Constuction
BIE Bumi Investco Energi
BKPM Badan Koordinasi Penanaman Modal
BPS Badan Pusat Statistik
CIF Cost, Insurance and Freight, named port of
distination
EIA Environmental Impact Assessment
EIRR Economic Internal Rate of Return
EPC Engineering, Procurement and Construction
F/S Feasibility Study
FIRR Financial Internal Rate of Return
FIT Feed-in Tariff
FOB Free on Board
FS Feasibility Study
GDP Gross Domestic Product
GFS Government Finance Statistics
HIDA The Overseas Human Resources and Industry
Development Association
IDI-I IDI infrastructures Inc.
IDR Indonesian Rupiah
IMF International Monetary Fund
IPP Independent Power Producer
IPPKH Izin Penjam Pakan Kawasan Hutan
IRR Internal Rate of Return
IUPTL IJIN USAHA PENUNJANG TENAGA LISTRIK
JBIC Japan Bank for International Cooperation
JETRO Japan External Trade Organization
JICA Japan International Cooperation Agency
KLH Kementrian Lingkungan Hidup
MEMR The Ministry of Energy and Mineral Resources
MIGA Multilateral Investment Guarantee Agency
MP3EI Master Plan for Acceleration and Expansion of
Indonesian Economic Development
Abbreviation Official Name / Term
NEDO New Energy and Industrial Technology
Development Organization
NPV Net Present Value
O&M Operation & Maintenance
ODA Official Development Assistance
PKS Palm Kernel Shells
PLN Perusahaan Listrik Negara
PPA Power Purchase Agreement
RUPTL Rencana Usaha Penyediaan Tenaga Listrik
SCF Standard Conversion Factor
SMADA Stormwater Management and Design Aid
SMI Sarana Multi Infrastruktur
SPC Special Purpose Company
UKL/UPL Upaya Pengelolaan Lingkungan dan Upaya
Pemantauan Lingkungan
USD United States Dollar

Contents
Preface
Geographical Location of the Project Sites
List of Abbreviations
Contents
Executive Summary
(1)Project Background & Necessity ............................................................................................................... 1
(2)Basic Policy for Deciding Project Details ................................................................................................. 3
(3)Project Overview ....................................................................................................................................... 5
(4)Project Schedule ...................................................................................................................................... 11
(5)Project Feasibility .................................................................................................................................... 11
(6)Technological Advantages of Japanese Firms ......................................................................................... 13
(7)Maps of Project Target Location .............................................................................................................. 14
Chapter 1 Overview of Host Country and Sector
(1)Economic and Financial Situation of Host Country ...............................................................................1-1
1)Economic Overview ...............................................................................................................................1-1
2)Trade ...............................................................................................................................................1-2
3)Investment from Overseas ......................................................................................................................1-2
4)Industrial Composition ...........................................................................................................................1-3
5)Fiscal Balance .........................................................................................................................................1-3
6)Population ...............................................................................................................................................1-4
(2)Outline of Project’s Target Sector ...........................................................................................................1-6
1)Electrical Power Situation in Indonesia ..................................................................................................1-6
2)Energy Demand in the Sumatra Islands ..................................................................................................1-7
(3)State of Target Regions ......................................................................................................................... 1-10
1)Geography and Climate ........................................................................................................................ 1-10
2)Land Usage ........................................................................................................................................... 1-11
3)Population ............................................................................................................................................. 1-12
4)Simalungun Power Demand ................................................................................................................. 1-12
5)Industry 1-13
6)Resources .............................................................................................................................................. 1-14
Chapter 2 Study Methodology
(1)Details of Study ......................................................................................................................................2-1
1)Existing Studies on this Project ..............................................................................................................2-1
2)Investigation Points ................................................................................................................................2-4
..............................................................................................................................................

(2)Study Methodology and System .............................................................................................................2-6
(3)Investigation Schedule ............................................................................................................................2-8
Chapter 3 Justification, Objectives and Technical Feasibility of the Project
(1)Project Background and Necessity .........................................................................................................3-1
1)Project Scope ..........................................................................................................................................3-1
2)Supply and Demand for Project’s Core Products and Services ..............................................................3-3
3)Current Situation Analysis, Future Predictions (Including Demand Predictions), and Potential
Problems if Project is not Executed ........................................................................................................3-3
4)Results and Effects if Project is Executed ..............................................................................................3-4
5)Comparison of Proposed Project with Other Options (Alternative Energy Study).................................3-5
(2)Increased Rate of Energy Consumption and Rationalization ............................................................... 3-10
(3)Studies Necessary to Finalize Project Contents .................................................................................... 3-11
1)Predicted Demand ................................................................................................................................. 3-11
2)Problem points and analysis required to finalize project contents ........................................................ 3-12
3)Examination of Technical Methods ...................................................................................................... 3-66
(4)Project Plan Summary .......................................................................................................................... 3-72
1)Basic Policy for Deciding Project Details ............................................................................................ 3-72
2)Design Summary and Specifications of Applicable Equipment ........................................................... 3-72
3)Contents of Proposed Projects (Site and Scale of Project Budget, etc.) ............................................... 3-96
4)Solutions for Issues Regarding Proposed Techniques and System Use ................................................ 3-99
Chapter 4 Evaluation of the Environment and Social Impacts
(1)Analysis of the Current State of the Environment and Society ..............................................................4-1
1)Current Environment and Society Data Analysis ...................................................................................4-1
2)Future Predictions (If Project is not Carried Out) ................................................................................. 4-13
(2)Environmental Improvements Achieved through this Project .............................................................. 4-14
1)Setting a Baseline ................................................................................................................................. 4-14
2)Calculating these Results ...................................................................................................................... 4-16
(3)Environmental and Social Improvements Achieved through the Implementation of this of this Project
of this of this ................................................................................................................................................ 4-18
1)Screening of Economic and Social Topics Referred to in the JICA and JBIC
Guidelines ..................................................................................................................................... 4-18
2)Other Options and Comparisons for Less Environmental and Social Impact .................................... 4-21
(4)Overview of the Laws and Regulations Regarding Environmental and Social Issues in Indonesia ..... 4-22
1)Outline of laws and regulations regarding environmental and social issues related to this project ...... 4-22
2)Contents of the EIA (Environmental Impact Assessment) Required for Implementation
of of the Project ........................................................................................................................................ 4-25
3)Measures required to Satisfy Related Rules and Regulations ............................................................... 4-26
(5)Necessary Actions from Indonesia (Implementing Agencies and Other Organizations) to
Fulfill Fulfill this Project this Project ............................................................................................................. 4-27
Chapter 5 Financial and Economic Evaluation
(1)Estimated Project Cost ............................................................................................................................5-1
(2)Results Summary of Preliminary Financial/Economic Analyses ...........................................................5-1
1)Fundraising .............................................................................................................................................5-1
2)Detailed Statement ..................................................................................................................................5-2
3)Project Plan .............................................................................................................................................5-4
4)Summary of Financial Analysis Results .................................................................................................5-7
5)Summary of Economic Assessment Results ...........................................................................................5-8
Chapter 6 Planned Project Schedule
Chapter 7 Implementing Organization
Chapter 8 Technical Advantages Japanese Company
(1) Expected Form of Participation of Japanese Firms (Financing, Parts/Equipment Provision,
Facility Facility Management, etc.) ..................................................................................................................8-1
(2) Advantages of Japanese Firms for this Project (Technological, Economical) ......................................8-2
(3) Necessary Policies to Facilitate Successful Bid for Japanese Firms.....................................................8-3
Chapter 9 Project Financing Prospects
(1) Funding Sources and Financing Plan ....................................................................................................9-1
1) Confirming the Amount of Debt Contributable by Senior Lenders ......................................................9-1
2) Feasibility of Assembling Mezzanine Lenders .....................................................................................9-1
(2) Feasibility of Funding ...........................................................................................................................9-3
1) Feasibility of Financing from Local Indonesian Banks ........................................................................9-3
2) Feasibility of Funding from Mezzanine Lenders ..................................................................................9-4
(3) Cash Flow Analysis ..............................................................................................................................9-5
1) Sensitivity Analysis for Changes in Construction Costs .......................................................................9-5
2) Sensitivity Analysis for Changes in Interest .........................................................................................9-5
3) Sensitivity Analysis of the FIT Price ....................................................................................................9-6
4) Sensitivity Analysis of Power Generation Capacity .............................................................................9-6
Chapter 10 Plan of Action and Issues to Consider Moving Forward to Implementation
(1) Status of Work Moving Forward to Implementation of the Project .................................................... 10-1
1) Acquisition and Renewal of Necessary Permits and Licenses............................................................ 10-1
2) Detailed Engineering/Technical Considerations ................................................................................. 10-2
3) Financing Necessary Funds for Construction ..................................................................................... 10-2
4) History of Formation of the Project and Future Intentions ................................................................. 10-4

(2) Status of Work with Affiliated Government and Implementing Agencies Moving
Forward Forward to Implementation of the Project ....................................................................................... 10-6
(3) Indonesia Legal and Financial Restrictions ........................................................................................ 10-7
(4) Necessity for Additional Detailed Analyses ....................................................................................... 10-8
1) River Flow Study ................................................................................................................................ 10-8
2) Topographical Survey ......................................................................................................................... 10-8
3) Geological Survey .............................................................................................................................. 10-8
4) Basic Execution Plan Draft ................................................................................................................. 10-9
5) Environmental and Social Considerations .......................................................................................... 10-9
6) Operation Scheme, Funding Method .................................................................................................. 10-9
i
Figure Contents
Fig.1 Electricity Demand Forecast in North Sumatra Province ...................................................................1
Fig.2 Amended FIT Price .............................................................................................................................2
Fig.3 Conceptual Figure of Candidate Project Layout .................................................................................5
Fig.4 Concept Figure of Study Cases of Plan2 .............................................................................................6
Fig.5 Layout Drawing of Selected Project ...................................................................................................7
Fig.1-1-1 Indonesia Population Pyramid (2014) ............................................................................................ 1-4
Fig.1-2-1 Change in energy capacity by type ................................................................................................. 1-6
Fig.1-2-2 North Sumatra Islands Power Demand Assessment ....................................................................... 1-9
Fig.1-3-1 Investigation Target Region Map (Outline) .................................................................................. 1-10
Fig.1-3-2 Map of Precipitation in Sumatra................................................................................................... 1-11
Fig.1-3-3 Map of Sei Mangkei Special Economic Zone (Outline) .............................................................. 1-13
Fig.2-2-1 Study System .................................................................................................................................. 2-7
Fig.3-1-1 Project Location ............................................................................................................................. 3-1
Fig.3-1-2 Project Plan 1 Summary ................................................................................................................. 3-2
Fig.3-1-3 Project Plan 2 Summary ................................................................................................................. 3-2
Fig.3-1-4 Average Amount of Insolation in Indonesia ................................................................................... 3-6
Fig.3-1-5 Indonesia’s Geothermal Potential ................................................................................................... 3-8
Fig.3-3-1 Project Area Topographical Map .................................................................................................. 3-13
Fig.3-3-2 Geological Map around the Site ................................................................................................... 3-15
Fig.3-3-3 Site Reconnaissance Records and Locations of Photographs ....................................................... 3-19
Fig.3-3-4 Karai12 Lower Stream 1 Schematic Profile ................................................................................. 3-21
Fig.3-3-5 Karai12 Lower Stream 2 Schematic Profile ............................................................................... 3-21
Fig.3-3-6 Rainfall and Air Temperature in Medan ....................................................................................... 3-39
Fig.3-3-7 Map of Rainfall Observation Locations Near Project Site ........................................................... 3-40
Fig.3-3-8 Location of Pulau Tagor River Flow Observation Site................................................................. 3-41
Fig.3-3-9 Karai12 Site Flow Capacity.......................................................................................................... 3-43
Fig.3-3-10 Karai12 Design Flood ................................................................................................................ 3-44
Fig.3-3-11 Karai7 Flow Duration Curve ...................................................................................................... 3-46
Fig.3-3-12 Karai13 Flow duration Curve ..................................................................................................... 3-46
Fig.3-3-13 Karai7 Design Flood Hydrogragh ............................................................................................ 3-48
Fig.3-3-14 Karai13 Design Flood Hydrogragh ............................................................................................ 3-48
Fig.3-3-15 Transmission Network in Sumatra Island ................................................................................... 3-61
Fig.3-3-16 Electrical System Diagram in North Sumatra ............................................................................ 3-62
Fig.3-3-17 General Map of Intake Equipment Renovation .......................................................................... 3-69

ii
Fig.3-3-18 Example of Sand Trap Remodeling Method .............................................................................. 3-69
Fig.3-3-19 Suggested Intake Remodeling for Karai7 Power Plant .............................................................. 3-71
Fig.3-4-1 Topographical Map of Candidate Site Area for Karai12 Project .................................................. 3-75
Fig.3-4-2 Cross-Section Diagram of the Pulung River ................................................................................ 3-76
Fig.3-4-3 Discharge-Construction Unit Cost Curve .................................................................................. 3-77
Fig.3-4-4 General Ground Plan of Karai12 Mini-hydro power Power Plant ............................................... 3-79
Fig.3-4-5 Map of Karai River Diversion Locations ..................................................................................... 3-82
Fig.3-4-6 River Diversion Plan 1 (Sigambur River) Catchment Area .......................................................... 3-83
Fig.3-4-7 Flow Duration Curve of the Sigambur River ............................................................................... 3-84
Fig.3-4-8 River Diversion Plan 2 (Pulung River) Catchment Area .............................................................. 3-84
Fig.3-4-9 Flow Duration Curve of the Karai River ...................................................................................... 3-85
Fig.3-4-10 Karai13 Power Plant Load Duration Curve ................................................................................ 3-87
Fig.3-4-11 Karai7 Power Plant Load Duration Curve .................................................................................. 3-87
Fig.3-4-12 Plan 2 Case 1 (Output Increase via River Diversion) Karai13 General Layout ......................... 3-89
Fig.3-4-13 Plan 2 Case 1 (Output Increase via River Diversion) Karai7 General Layout ........................... 3-90
Fig.3-4-14 Plan 2 Case 2 (Plant Augmentation via River Diversion)
Karai13 General Layout .................................................................................................................................. 3-91
Fig.3-4-15 Plan 2 Case 2 (Plant Augmentation via River Diversion)
Karai7 General Layout .................................................................................................................................... 3-92
Fig.3-4-16 Map of Karai12 Electrical System (New Facility Proposal) ...................................................... 3-93
Fig.3-4-17 Map of Karai7 & 13 Electrical Systems (Augmentation Proposal) ............................................ 3-94
Fig.3-4-18 Map of Planned Location for Karai12 ........................................................................................ 3-97
Fig.3-4-19 Overview of Karai Region Power Transmission and
Power Distribution System ............................................................................................................................ 3-102
Fig.4-1-1 State of Land Use ........................................................................................................................... 4-4
Fig.4-1-2 State of Forest Reserves ................................................................................................................. 4-5
Fig.4-1-3 State of Conservation Areas ........................................................................................................... 4-6
Fig.4-1-4 Dolok Tinggi Raja Nature Conservation Area (Hot spring Location) ......................................... 4-7
Fig.4-1-5 Dolok Tinggi Raja Nature Conservation Area (Hot spring Location) Map .................................. 4-8
Fig.4-1-6 Buntu Siantar and Dolok Marawa Villages Map .......................................................................... 4-13
Fig.4-4-1 Indonesia Ministry of Environment (KLH) Organizational Map
(As of October, 2012) ...................................................................................................................................... 4-22
Fig.6-1 Project Implementation Schedule ...................................................................................................... 6-1
Fig.6-2 Construction Schedule for Karai 12 Mini-Hydro Power Plant .......................................................... 6-1
Fig.9-1-1 Mezzanine Finance (Image) ........................................................................................................... 9-2

i
Table Contents
Table1 Evaluation of Study Plans .......................................................................................................................6
Table2 Selected Project Outline .........................................................................................................................8
Table3 Selected Project Costs ............................................................................................................................9
Table4 Financial and Economic Analysis Results ............................................................................................10
Table5 Project Enactment Schedule ................................................................................................................. 11
Table6 Technical Advantageous of Japanese Enterprises .................................................................................13
Table1-1-1 Basic Economic Indicators .......................................................................................................... 1-1
Table1-1-2 Trade Balance (unit: million dollars) ........................................................................................... 1-2
Table1-1-3 Foreign Direct Investment (Execution Based) ............................................................................. 1-3
Table1-1-4 GDP by Sector ............................................................................................................................. 1-3
Table1-1-5 Fiscal Balance .............................................................................................................................. 1-4
Table1-2-1 Fast Track Program ...................................................................................................................... 1-7
Table1-2-2 Renewable Energy Development Potential .................................................................................. 1-7
Table1-2-3 Electrification rates in the islands of Sumatra (2012) .................................................................. 1-8
Table1-3-1 Land Usage Situation ................................................................................................................. 1-11
Table1-3-2 Simalungun Population by Area ................................................................................................ 1-12
Table1-3-3 Simalungun Poverty Rate .......................................................................................................... 1-12
Table1-3-4 Agricultural Produce Yield of Simalungun ................................................................................ 1-13
Table2-1-1 Summary of Existing Study Reports of Karai12 Project ............................................................. 2-1
Table2-1-2 Summary of Existing Study Reports of Karai7 Project ............................................................... 2-2
Table2-1-3 Summary of Existing Study Reports of Karai13 Project ............................................................. 2-3
Table2-1-4 Summary of Existing Study Reports of River Diversion Plan ..................................................... 2-4
Table2-3-1 Investigation Schedule ................................................................................................................. 2-8
Table2-3-2 First Site Survey Results Outline (Site Inspection) ......................................................... 2-9
Table2-3-3 First Site Survey Results Outline (Visits to Related Agencies) ................................................. 2-10
Table2-3-4 Second Site Survey Results Outline ........................................................................................... 2-11
Table2-3-5 Third Site Survey Results Outline ............................................................................................. 2-12
Table2-3-6 Forth Site Survey Results Outline .............................................................................................. 2-12
Table3-1-1 Peak Electricity Demand Forecast in North Sumatra Province ................................... 3-4
Table3-1-2 Current Project and Solar Power Comparison ............................................................................. 3-7
Table3-1-3 Solar Power (2,000kW) Project Estimated Cost Conditions........................................................ 3-7
Table3-1-4 Average Yearly Wind Speed in Medan ........................................................................................ 3-7
Table3-1-5 Geothermal Potential of Each Island ........................................................................................... 3-8
ii
Table3-1-6 Current Project and Geothermal Power Comparison ................................................................... 3-9
Table3-2-1 Renewable Energy Resources and Amount Introduced to Market (2011) ................................. 3-10
Table3-3-1 North Sumatra Electrical Demand Survey ................................................................................. 3-11
Table3-3-2 North Sumatra Equipment Capacity .......................................................................................... 3-11
Table3-3-3 North Sumatra Electrical Grid Data ........................................................................................... 3-12
Table3-3-4 Site Reconnaissance Schedule ................................................................................................. 3-18
Table3-3-5 Summary of Site Reconnaissance Results ................................................................................. 3-33
Table3-3-6 Average Monthly Rainfall at Observation Locations Near Project Site..................................... 3-40
Table3-3-7 Pulau Tagor Observed River Flow ............................................................................................. 3-42
Table3-3-8 Comparison of Karai7 and Karai13 Flow Conditions ................................................................ 3-47
Table3-3-9 North Sumatra’s Electrical Demand and Supply Capability ...................................................... 3-60
Table3-3-10 Electrical Supply and Demand of the Karai Area .................................................................... 3-64
Table3-3-11 Karai13 Monthly Sales Volume and Utilization Rate (Oct. 2014 Survey Data) ...................... 3-65
Table3-4-1 Existing Survey Report on the Karai12 Plan ............................................................................. 3-74
Table3-4-2 Results of Optimum Scale Determination ................................................................................. 3-77
Table3-4-3 Elements of the Karai12 Power Plant Plan ................................................................................ 3-78
Table3-4-4 Elements of Existing Karai13 and Karai7 Power Plants ............................................................ 3-81
Table3-4-5 Summary of Karai River Diversion Plan ................................................................................... 3-82
Table3-4-6 Case Examinations of Existing Power Plant Output Increases via River Diversion .................. 3-86
Table3-4-7 Plan 2 (River Diversion Proposal) Elements of Existing Power Plant Output Increase ............ 3-88
Table3-4-8 Overview of Salient Points for Each Plan Under Consideration ............................................... 3-95
Table3-4-9 Other Construction Costs for Each Plan .................................................................................... 3-95
Table3-4-10 Evaluation of Each Case Under Consideration ........................................................................ 3-96
Table3-4-11 Karai12 Power Plant Outline ................................................................................................... 3-98
Table3-4-12 Future Geological Investigation Items ................................................................................... 3-100
Table4-2-1 Calculation Conditions............................................................................................................... 4-14
Table4-2-2 Emissions Based on CO2/Crude Oil Conversions ..................................................................... 4-16
Table4-2-3 CO2 Reduced Emissions ............................................................................................................ 4-17
Table4-3-1 Investigation Results Based on Environmental Checklists ........................................................ 4-19
Table4-4-1 Laws and Regulations Regarding Environmental Issues (Basic Laws) ..................................... 4-23
Table4-4-2 Laws and Regulations Regarding Environmental Issues (Air Pollution) ................................... 4-24
Table4-4-3 Laws and Regulations Regarding Environmental Issues (Water Pollution) .............................. 4-24
Table4-4-4 Laws and Regulations Regarding Environmental Issues (Noise, Vibration, Smells) ................ 4-25
Table5-1-1 Case-by-case Project Cost Breakdown ........................................................................................ 5-1
Table5-2-1 Detailed Statement of the Confirmed Business Plan ................................................................... 5-3
Table5-3-1 Plan 1 Project Plan ....................................................................................................................... 5-5
Table5-3-2 Plan 2 Case 1 Project Plan ........................................................................................................... 5-6
Table5-3-3 Plan 2 Case 2 Project Plan ........................................................................................................... 5-7

iii
Table5-4-1 Financial Analysis Results ........................................................................................................... 5-7
Table5-5-1 SCF Calculation ........................................................................................................................... 5-8
Table5-5-2 Economic Cost Calculation .......................................................................................................... 5-9
Table5-5-3 Cash Flow for Economic Analysis (Plan 1) ............................................................................... 5-10
Table5-5-4 Cash Flow for Economic Analysis (Plan 2 Case 1) ................................................................... 5-10
Table5-5-5 Cash Flow for Economic Analysis (Plan 2 Case 2) ................................................................... 5-11
Table7-1 Implementation capability of host country’s organizations ............................................................. 7-2
Table9-2-1 Financing Conditions for Local Financial Institutions (Projected) .............................................. 9-3
Table9-3-1 FIRR Sensitivity Analysis of Construction Cost Changes ........................................................... 9-5
Table9-3-2 FIRR Sensitivity Analysis of Interest Changes ............................................................................ 9-6
Table9-3-3 FIRR Sensitivity Analysis of FIT Price Changes ......................................................................... 9-6
Table9-3-4 FIRR Sensitivity Analysis of Power Generation Capacity Changes ............................................ 9-7
Table10-1-1 Karai12 Permit/License Acquisition (Survey Commission Confirmation Status) ................... 10-1
Table10-1-2 Projected Risks ........................................................................................................................ 10-3
i
Picture Contents
Photo 3-3-1 Welded tuff with Development of Joints (Cracks) Occurring along River ............................... 3-16
Photo3-3-2 Columnar Joints of Welded tuff (View from Top) ..................................................................... 3-16
Photo3-3-3 Gully Erosions on Shirasu Slope Shirasu Covered Ravine ....................................................... 3-17
Photo3-3-4 Secondary deposited Shirasu along River ................................................................................. 3-17
Photo3-3-5 Karai 12 Lower Stream 1 Photographed from Upper to Lower Stream ................................. 3-22
Photo3-3-6 Karai 12 Lower Stream 1 Photographed from Lower to Upper Stream ................................. 3-22
Photo3-3-7 Karai 12 Lower Stream 1 Photographed from Upper to Lower Stream ................................. 3-22
Photo3-3-8 Karai 12 Lower Stream 2 Taken from Lower to Upper Stream (Low Gradient Parts) ......... 3-23
Photo3-3-9 Karai 12 Lower Stream 2 Secondary deposited Shirasu on River Bed ..................................... 3-23
Photo3-3-10 Karai 12 Lower Stream 2 Secondary deposited Shirasu (Close-up Photo) ............................. 3-23
Photo3-3-11 Karai 7 Intake Weir under construction Welded tuff occurs at Excavation ............................. 3-25
Photo3-3-12 Karai 7 Cut Slope at Right Bank of Sand Trap Facility ........................................................ 3-25
Photo3-3-13 Karai 7 Open Headrace from Sand Trap to Surge Tank .......................................................... 3-25
Photo3-3-14 Karai 7 Cut Slope around Power House .................................................................................. 3-26
Photo3-3-15 Karai 13 Intake Weir................................................................................................................ 3-27
Photo3-3-16 Karai 13 Cut Slope near Intake Weir ....................................................................................... 3-27
Photo3-3-17 Karai 13 CL Class Rock at River Bed of Intake Weir ............................................................. 3-28
Photo3-3-18 Karai 13 Headrace with Cover ................................................................................................ 3-28
Photo3-3-19 Karai 13 Penstock Blue Sheets are deteriorated ...................................................................... 3-28
Photo3-3-20 Karai 13 Discharged Water from Power House (Water is very muddy) .................................. 3-29
Photo3-3-21 River Conditions at Planned Location of No1 River diversion ............................................... 3-29
Photo3-3-22 Outcrops at Lower Stream of Planned No1 River diversion ................................................... 3-30
Photo3-3-23 Upper Stream River Conditions of No2 River diversion ......................................................... 3-30
Photo3-3-24 Outcrops at Upper Stream of Planned No2 River diversion .................................................... 3-31
Photo3-3-25 Outcrops at Upper Stream of Planned No2 River diversion Welded tuff (D Class Rock) ...... 3-31
Photo3-3-26 Sand Scour Gate Installed on Right Bank of Intake Weir
(Taken Downstream from Intake Weir) ........................................................................................................... 3-51
Photo3-3-27 Condition of the Intake Weir on the Upstream Side ................................................................ 3-51
Photo3-3-28 Dike on Right Bank Not Constructed ...................................................................................... 3-52
Photo 3-3-29 Dike on Right Bank Not Constructed ..................................................................................... 3-52
Photo3-3-30 Sand Trap Drainage Valve Pit .................................................................................................. 3-53
Photo3-3-31 Sand Trap Excavation .............................................................................................................. 3-53
Photo3-3-32 Headrace Channel Site ............................................................................................................ 3-54
Photo3-3-33 Headrace Swamp Crossing ...................................................................................................... 3-54
Photo3-3-34 Status of the “Masonry Concrete ............................................................................................. 3-55
Photo3-3-35 Head Pond Rebuilt Using Steel ............................................................................................... 3-55
Photo3-3-36 Penstock .................................................................................................................................. 3-56

ii
Photo3-3-37 Intake Equipment .................................................................................................................... 3-56
Photo3-3-38 Headrace .................................................................................................................................. 3-57
Photo3-3-39 Head Pond Under Construction ............................................................................................... 3-57
Photo3-3-40 Penstock .................................................................................................................................. 3-58
Photo3-3-41 Pulung River Intake Site .......................................................................................................... 3-59
Photo3-3-42 Shirasu Particles (Left: Magnified Photo, Right: Electron Microscope Photo)....................... 3-66
Photo3-3-43 Temporary Drainage Channel for Construction of Intake Weir ............................................... 3-70
Photo4-1-1 Dolok Tinggi Raja Nature Conservation Area ........................................................................... 4-8
Photo4-1-2 Buntu Siantar ............................................................................................................................. 4-9
Photo4-1-3 Local Resident Hearing ............................................................................................................... 4-9
Photo4-1-4 Investigation of Community ........................................................................................................ 4-9
Photo4-1-5 State of Private Water System ..................................................................................................... 4-9
Photo4-1-6 Water Tank ................................................................................................................................... 4-9
Photo4-1-7 Buntu Siantar Villagers ............................................................................................................ 4-10
Photo4-1-8 Plantation (Palm Oil) ................................................................................................................. 4-10
Photo4-1-9 Electricity System ...................................................................................................................... 4-11
Photo4-1-10 Buntu Siantar Village Road ................................................................................................... 4-11
Photo4-1-11 Church ..................................................................................................................................... 4-11
Photo4-1-12 Going to School ....................................................................................................................... 4-11
Photo4-1-13 Dolok Marawa Entrance ........................................................................................................ 4-11
Photo4-1-14 Plantation (Palm Oil) ............................................................................................................... 4-11
Photo4-1-15 Electricity System .................................................................................................................... 4-12
Photo4-1-16 Water System ........................................................................................................................... 4-12
Photo4-1-17 Dolok Marawa road ............................................................................................................... 4-12
Photo4-1-18 Fork to Buntu Siantar ............................................................................................................ 4-12
Photo4-1-19 Church ..................................................................................................................................... 4-12
Photo4-1-20 Going to School ....................................................................................................................... 4-12
Photo4-1-21 Elementary School .................................................................................................................. 4-12

1
Executive Summary
(1) Project Background & Necessity
The population of Indonesia is estimated to exceed 247 million people, and the average age is 28.9 years
old, with those under 30 making up half of the population; a large business market. There is a continuing
trend of steady population increase, and in the ten years from 2010-2020 there is a projected growth of 30
million people. The population is estimated to increase to 300 million people by 2050. Indonesia’s
economy has also seen what was a 3.6% economic growth rate in 2001 increase to over 5.5% and into 6%
after 2005. The growth rate is estimated to fall from 5.8% in 2013 to 5.5% in 2014, but as domestic
demand drives economic growth, the rate is projected to continue to hold steady.
Along with Indonesia’s economic growth, the country-wide demand for power is estimated to increase
from 26,246MW in 2010 to 59,863MW by 2019, with that growth of 33,617MW rivaling the total power
demand in 2011. In order to keep up with the 3,000MW/year growth in demand, it is anticipated that there
will be a need to increase the output of power output facilities by 5,500MW/yr. To stay abreast of this
vigorous demand, coal, geothermal, gas, and hydro power methods are all being anticipated, with the
renewable energies of gas and hydropower expected to triple.
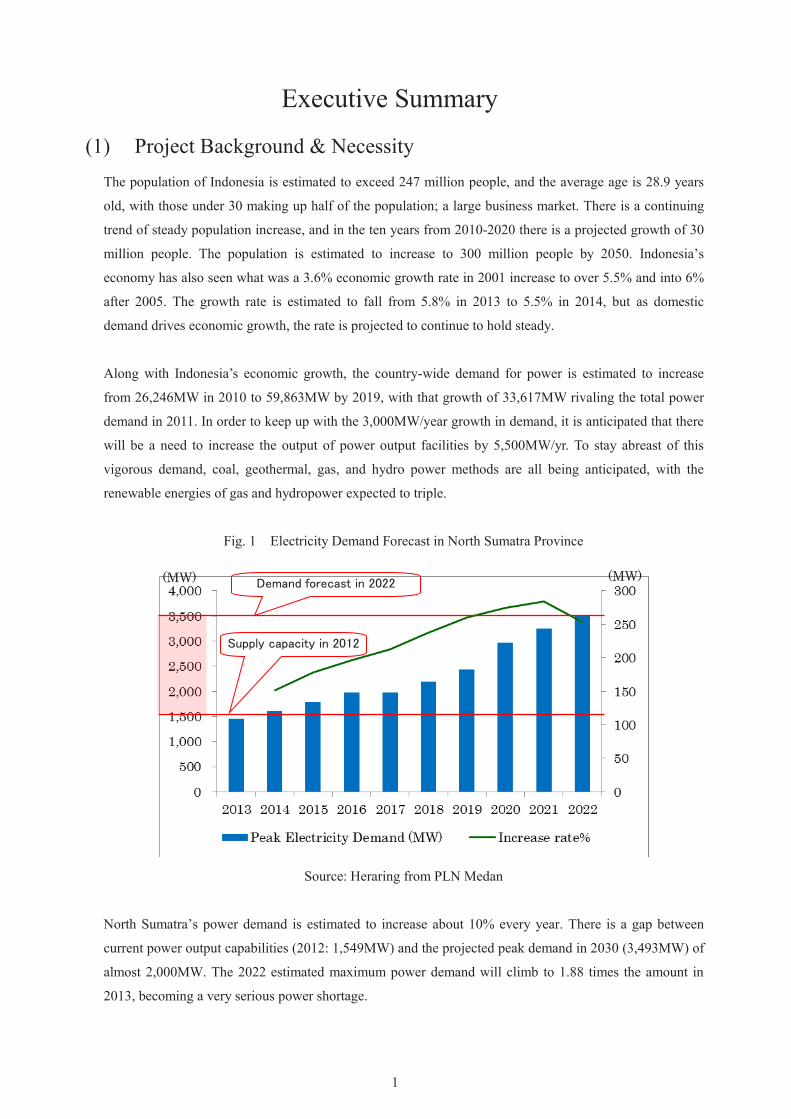
Fig. 1 Electricity Demand Forecast in North Sumatra Province
Source: Heraring from PLN Medan
North Sumatra’s power demand is estimated to increase about 10% every year. There is a gap between
current power output capabilities (2012: 1,549MW) and the projected peak demand in 2030 (3,493MW) of
almost 2,000MW. The 2022 estimated maximum power demand will climb to 1.88 times the amount in
2013, becoming a very serious power shortage.
(MW) Demand forecast in 2022
Supply capacity in 2012
(MW)
2
As desire for coal, geothermal, gas, and hydropower to cover the energy demand increases, if this project
or some other energy projects are not implemented, it is clear that the existing present electricity shortage
will be continued. The prolonged shortage of power in North Sumatra has reached 200MW, and is even
being taken up as a national issue. Because of instability in the power supply, it is difficult for other
Japanese firms to advance into the area; there is truly a great need for more power there.
At first the Indonesian government planned to enact the “Fast Track Program,” which involved only the
establishment of new coal-fired power plants. However, in recent years, with the increase of environmental
awareness, as well as large delays in development and construction have caused them to reconsider their
coal-centered stance. The new second Fast-Track Program (FTP-2) has been established, which considers
the aggressive use of not just PLN, but also Independent Power Producers (IPP) as well. This second
Fast-Track Program incorporates renewable energies such as mini-hydro power, and aims to quadruple the
current power generation capacity to 18,100MW by 2030. The same program, while beginning the
development of 1,204MW of hydroelectric power generation, has introduced the FIT system, a long term
fixed-price contract for selling power to PLN, to which mini-hydro power projects are also subject.
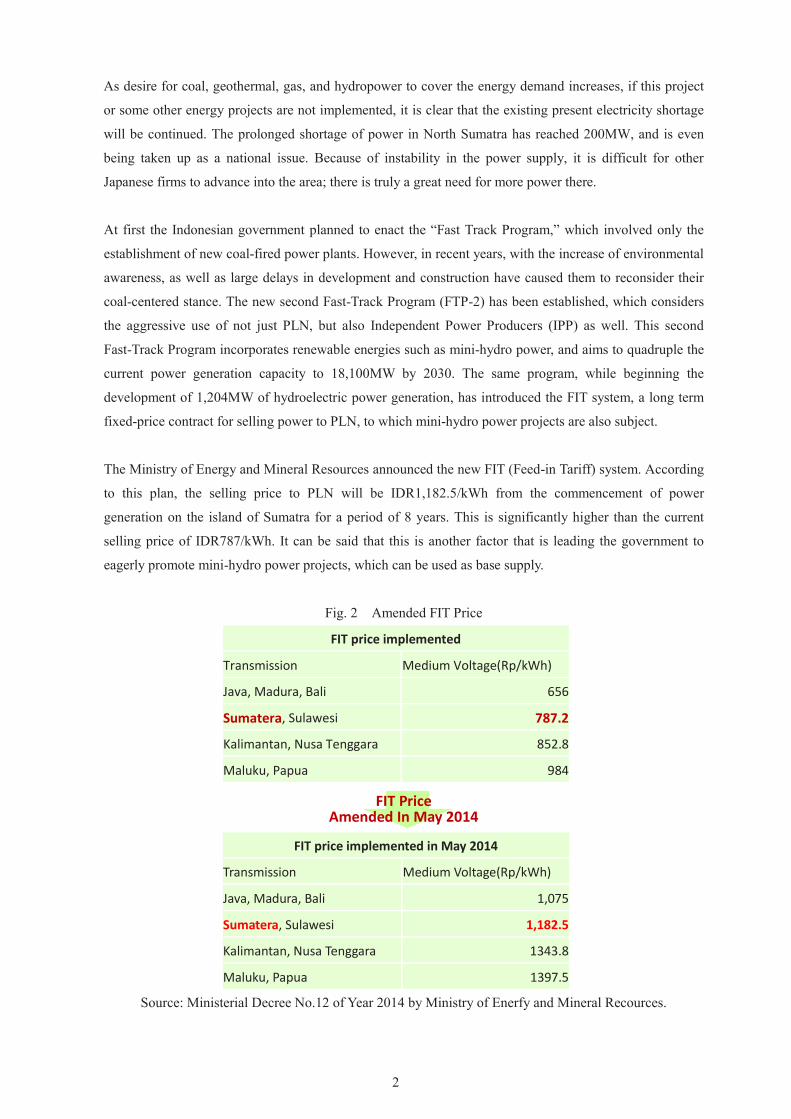
The Ministry of Energy and Mineral Resources announced the new FIT (Feed-in Tariff) system. According
to this plan, the selling price to PLN will be IDR1,182.5/kWh from the commencement of power
generation on the island of Sumatra for a period of 8 years. This is significantly higher than the current
selling price of IDR787/kWh. It can be said that this is another factor that is leading the government to
eagerly promote mini-hydro power projects, which can be used as base supply.
Fig. 2 Amended FIT Price
FIT price implemented
Transmission Medium Voltage(Rp/kWh) Java, Madura, Bali 656 Sumatera, Sulawesi 787.2 Kalimantan, Nusa Tenggara 852.8 Maluku, Papua 984
FIT price implemented in May 2014
Transmission Medium Voltage(Rp/kWh)
Java, Madura, Bali 1,075
Sumatera, Sulawesi 1,182.5
Kalimantan, Nusa Tenggara 1343.8
Maluku, Papua 1397.5
Source: Ministerial Decree No.12 of Year 2014 by Ministry of Enerfy and Mineral Recources.
FIT Price Amended In May 2014
3
As far as sources of energy to reduce current and future power sources, hydroelectric, geothermal, solar,
wind, and tidal energy sources are being considered. However, geothermal is risky, and solar and the others
don’t provide steady and reliable energy generation, so are not suited to primary power generation. The
area in question is mountainous with significant rainfall; the environmental conditions make it an ideal
location for mini-hydro power projects. Also, considering demand and potential to aid economic growth,
this project is well suited for the task.
This background leads us to the present, where the servicing of several mini-hydro power development
plans are being pursued. Among these, plans for new facilities as well plans to increase the output of
current facilities or those under construction are also underway in other areas nearby. Paying close
attention to these other projects, comparing and investigating them to create the most appropriate feasible
plan is the best course of action. Additionally, Japan has a history of over 100 years in the hydro power
industry, and Japanese corporations possess a high level of technological skill in the field, enabling this
project to fully capitalize on these advantages.
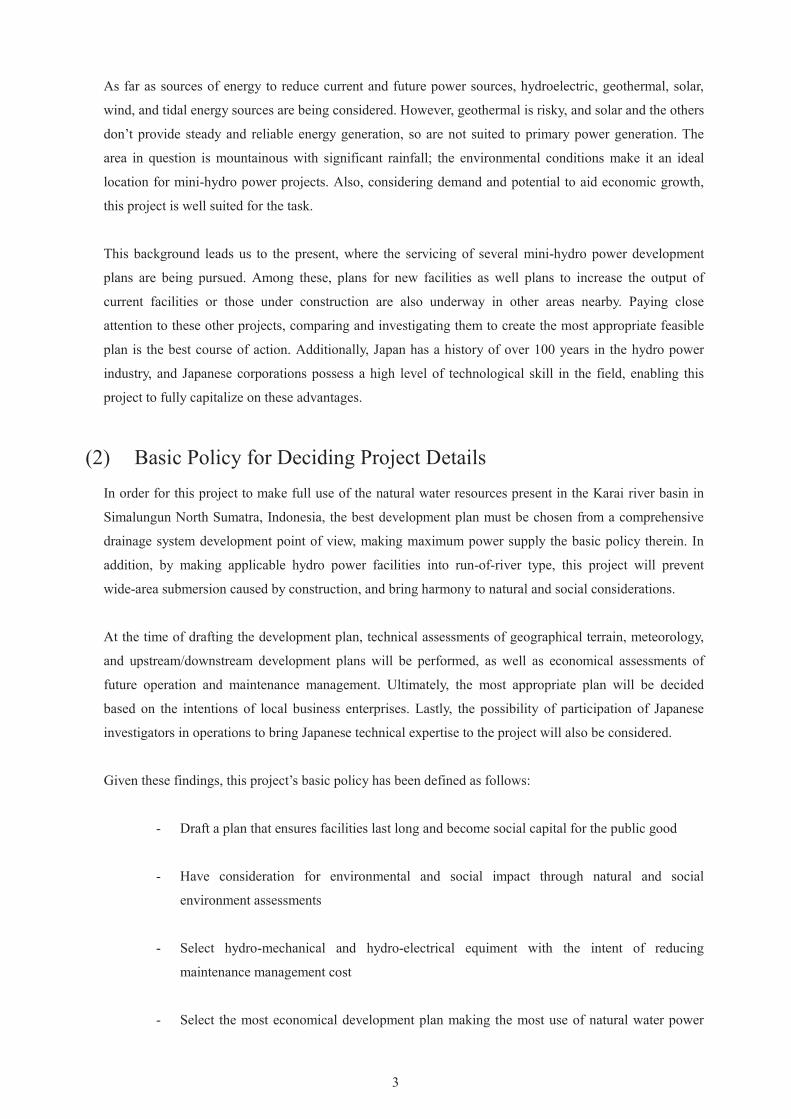
(2) Basic Policy for Deciding Project Details
In order for this project to make full use of the natural water resources present in the Karai river basin in
Simalungun North Sumatra, Indonesia, the best development plan must be chosen from a comprehensive
drainage system development point of view, making maximum power supply the basic policy therein. In
addition, by making applicable hydro power facilities into run-of-river type, this project will prevent
wide-area submersion caused by construction, and bring harmony to natural and social considerations.
At the time of drafting the development plan, technical assessments of geographical terrain, meteorology,
and upstream/downstream development plans will be performed, as well as economical assessments of
future operation and maintenance management. Ultimately, the most appropriate plan will be decided
based on the intentions of local business enterprises. Lastly, the possibility of participation of Japanese
investigators in operations to bring Japanese technical expertise to the project will also be considered.
Given these findings, this project’s basic policy has been defined as follows:
- Draft a plan that ensures facilities last long and become social capital for the public good
- Have consideration for environmental and social impact through natural and social
environment assessments
- Select hydro-mechanical and hydro-electrical equiment with the intent of reducing
maintenance management cost
- Select the most economical development plan making the most use of natural water power
4
resources that have drainage systems
This study has conducted an assessment and analysis of the necessary items to implement this project.
i. Contrast and examine establishment of new power generation facilities as well as
augmentation of existing facilities
ii. Select power generation facilities for project implementation
iii. Consider mini-hydro power project policy, effectiveness, and profitability
iv. Verify the feasibility of the project
Additionally, bear in mind the following when considering “i”.
a. Hydraulic studies will be enacted to calculate FIRR and EIRR to ensure power generation
capacity, the key to this project.
b. To ensure stable continued operation of facilities, ground strength, as well as river water flow
will be assessed. Counter measures for natural disasters such as floods and earthquakes will be
considered.
c. Consider environmental and social impact on the local area and residents who live along the
river.
d. Create a plan for the construction of the power production facilities and assess the economic
and business value of the project based upon financial analysis.
e. In order to perform a comparative analysis of the effectiveness of the power generation, make a
thorough study of the site conditions (head/flow).

5
(3) Project Overview
1) Proposal outline and total project costs
This study reviewed the existing plans for Karai 12 mini-hydro power development at the Pulung River
in the Karai River drainage system, and compared alternative plans to divert the upper-stream portion of
the Pulung River to the adjacent Sigambur and Karai Rivers, strengthening the output of the Karai 13
power generation facility as well as the Karai 7 facility still under construction.
Fig. 3 Conceptual Figure of Candidate Project Layout
Source: Created by Study Team

6
Fig. 4 Concept Figure of Study Cases of Plan2
The existing power plants have will have their power uprating in one of the 2 ways listed below:
Case 1: Only increase what can be output during the dry season, without changing the maximum output of the existing plants.It needs river diversion facility and renovation work of existing plants only for this case.
Case 2: Allow the extra river flow to increase the maximum output of existing plants.It needs river diversion facility, additional power plant, as well as renovation work of existing plant for this case.
Increased generating energy
Same max. output
Percent of time that indicated discharge was equaled or exceeded
Dis
ch
arg
e (
m
3 /s)
Increased max. output
Increased generating energy
Percent of time that indicated discharge was equaled or exceededD
isch
arg
e (
m
3 /s)
Source: Created by Study Team
The results of the study show that the development of the Karai 12 mini-hydro power is feasible from
technical, environmental, and economical standpoints. For these reasons, this study has elected to
recommend the Karai 12 mini-hydro power for this project.
Table 1 Evaluation of Study Plans
Case Under Consideration Plan 1Plan 2
Case 1 Case 2
Technical Concerns
○ △ △
A new construction plan that can
be tailored to the technical
requirements from the ground
up.
Existing structural problems will
be reconstructed, however use
of existing equipment means
unease over construction quality
remains.
Same as Left
Socio-Environmental Concerns ○ ○ ○
[Environment] Manufacturing forest or
plantation region; located
outside nature reserves.Same as Left Same as Left
[Social Impact] Will not displace residents. Will
also not draw water from a
recession area. Social impact
will be limited.
Same as Left Same as Left
Economics
○ △ △
Lowest Unit Cost of
Construction
Highest Unit Cost of
Construction
Second Lowest Unit Cost of
Construction
Overall Evaluation
○ △ △
Selected as Development PlanOverall Evaluation: Inferior to
Plan 1
Overall Evaluation: Inferior to
Plan 1
Source: Created by Study Team

7
Fug. 5 Layout Drawing of Selected Project
Source: Created by Study Team
8
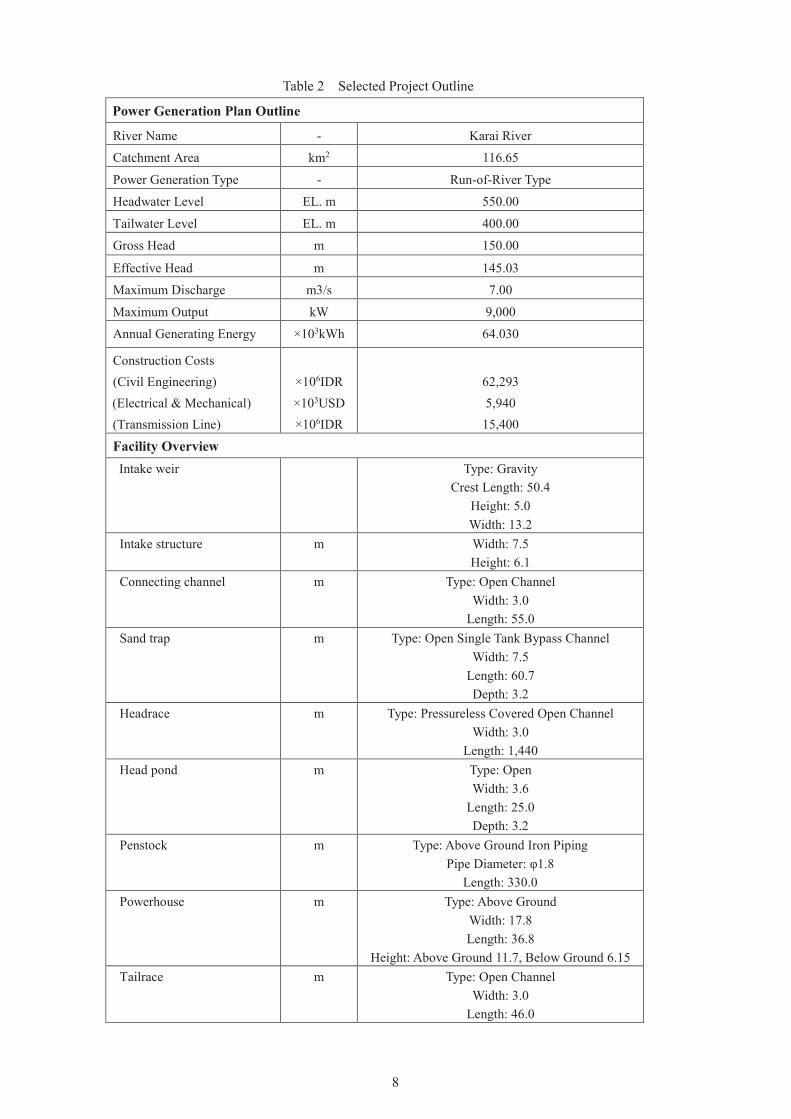
Table 2 Selected Project Outline
Power Generation Plan Outline
River Name - Karai River
Catchment Area km2 116.65
Power Generation Type - Run-of-River Type
Headwater Level EL. m 550.00
Tailwater Level EL. m 400.00
Gross Head m 150.00
Effective Head m 145.03
Maximum Discharge m3/s 7.00
Maximum Output kW 9,000
Annual Generating Energy ×103kWh 64.030
Construction Costs
(Civil Engineering)
(Electrical & Mechanical)
(Transmission Line)
×106IDR
×103USD
×106IDR
62,293
5,940
15,400
Facility Overview
Intake weir Type: Gravity
Crest Length: 50.4
Height: 5.0
Width: 13.2
Intake structure m Width: 7.5
Height: 6.1
Connecting channel m Type: Open Channel
Width: 3.0
Length: 55.0
Sand trap m Type: Open Single Tank Bypass Channel
Width: 7.5
Length: 60.7
Depth: 3.2
Headrace m Type: Pressureless Covered Open Channel
Width: 3.0
Length: 1,440
Head pond m Type: Open
Width: 3.6
Length: 25.0
Depth: 3.2
Penstock m Type: Above Ground Iron Piping
Pipe Diameter: φ1.8
Length: 330.0
Powerhouse m Type: Above Ground
Width: 17.8
Length: 36.8
Height: Above Ground 11.7, Below Ground 6.15
Tailrace m Type: Open Channel
Width: 3.0
Length: 46.0

9
Table 3 Selected Project Costs
Construction Expense (Civil
Engineering, Building) ×106IDR 77,693
Construction Expense (Generator) ×103USD 5,940
Construction Expense* ×106JPY 1,562.85
Construction Expense per kWh JPY/kWh 24.4
*: Converted using November 30, 2014 exchange rate (US$1=¥119.23、IDR1=¥0.0110)
Source: Created by Study Team
2) Preliminary finances & overview of economic analysis results
Plan 1 is a new proposal, while Plan 2 renovates or expands upon existing equipment to increase
operating ratios. Regarding the financial analysis of Plan 2, although this plan is a renovation or
expansion, it consists of extant machines, and has thus the preexisting assets and debts have been
included in the analysis of the project’s overall benefits.
The FIRR for all plans exceed Indonesia’s long-term interest rates, the NPV is positive, and the B/C>1;
it can be said that there is investment verification, however the FIRR of Plan 1 is quite high, thus
making Plan 1 the more efficient investment.
As for the economic assessment, the EIRR was calculated in order to evaluate the economic results of
the project from the perspective of the efficiency of resource allocation in regards to the national
economy. Because mini-hydro power generation can substitute for ordinary diesel power generation in
Indonesia, either plan would greatly exceed the general social discount rate of 12%, and it can be
concluded that the plans have a great value to the national economy. Just as in the financial analysis, the
EIRR of Plan 1 was greater, and the most efficient investment of the two.

10
Table 4 Financial and Economic Analysis Results
Plan 1 Plan 2
Case 1 Case 2
Total Investment millions
IDR
186,615 579,301 727,765
FIRR % 28.9% 17.6% 21.0%
NPV millions
IDR
232,964 371,093 563,640
B/C - 1.5 1.1 1.1
EIRR % 71% 48% 56%
Source: Created by the Study Team
3) Evaluation of environmental and social considerations
In regards to the impact that executing this project will have on the environment, we examined both the
natural and social environment of the target region, in addition to reviewing the environmental
protection laws in Indonesia.
The target location for this project is in a mountainous region, and the forest classification and land is
being used as perpetual forest production, dry farming, and plantations, but there are many plants and
animals living in the not-yet-utilized mountain and valley areas as habitats. Though there is no
information regarding important or endangered species, there have been reports from the Indonesian
government of protected Malayan Sun Bears in the area.
However, this project is not a large-scale power plant, and it plans to use the run-of-the-river water
intake method, making it an environmentally friendly form of power generation. In addition, the river is
not used by nearby indigenous peoples in their daily lives (Local Resident Hearing results), so it is likely
that the execution of this project will not have a large environmental or cultural impact.
Additionally, while this project is not subject to the environmental impact assessment (AMDAL),
operations and activities that are to be excluded from AMDAL requirements must create an
environmental management and monitoring program (UKL-UPL). A suitable investigation, estimation
and evaluation of the potential environmental and social impact to the area surrounding the target region
will need to be performed, looking for ways to avoid and/or reduce such impact as much as possible.

11
(4) Project Schedule
The schedule leading up to the realization of the project is currently set as follows:
Table 5 Project Enactment Schedule
Item Year 1 Year 2 Year 3 Year 4 Year 5
3 6 9 12 3 6 9 12 3 6 9 12 3 6 9 12 3 6
1. Business rights
application/approval
2. Environmental
application/approval
3. FS investigation
4. Detailed planning
and provisions
5. Construction/trial run
Source: Created by Study Team
(5) Project Feasibility
1) Feasibility according to technical, financial and economic analyses
This study determined the business feasibility of the establishment of a new facility (Karai 12) as
compared to the improvement of two other facilities (Karai 13, Karai 7) through the application of
technical, financial, and economical analyses. The results of these analyses indicated that the Karai 12 plan
is preferable. As laid out in Chapter 3, in order to proceed with the Karai 12 plan, enactment detailed
technical plans and facility designs is necessary. However, at present the project is not outfitted with
enough of these various documents and materials. Therefore, in order to continue advancing this project, it
will be necessary to pursue various detailed investigations. Also, this report has used substitute information
from business contacts and generalized data from related reports for the various prerequisites that are not
yet solidified in the financial and economic analyses. During detailed financing negotiations with various
financial institutions, it will become necessary to provide definitive project costs and provide a detailed
basis for such, as well as reliable contributions from business partners.
2) History of Formation of the Project and Future Intentions
IDI, a former industrial bank now working in the operation of funds and advisory business in
the environmental and renewable energy fields, approached us in December 2012 concerning
participation in mini-hydro power in Indonesia. As a result, we joined with Bumi Investco
Energi (BIE, headquarters: Jakarta), a company that invests in renewable energy, and Bumi
Hydro Engineering and Construction (BHE, headquarters: Jakarta), the construction
company that BIE established specifically for mini-hydro power projects, in concluding a
three party basic contract in October 2013 for the purposes of implementing all forms of
consulting, and including investment in the project.

12
In regard to the Karai 13 malfunction that occurred after the creation of this survey report, it
is the intent of the owner, BIE, to cover the damages using insurance. If Karai 12 will be
newly established, future funds will be focused into the construction of Karai 12, and in
regard to Karai 13 that suffered the damage, the intent is to continue to generate power
under O&M of the current facilities with the support of our company.
In regard to the new establishment of Karai 12, and taking funds into account, we intend to
make internal adjustments that will allow work to begin as quickly as possible, as well as
continuing discussions with those involved in the project to proactively contribute to new
development proposals in the future. Furthermore, we are also intending to make use of the
Ministry of Economy, Trade and Industry’s Joint Crediting Mechanism (JCM) in order to help
those involved in the project begin work on implementing a FS and commercialization
proposal.
13
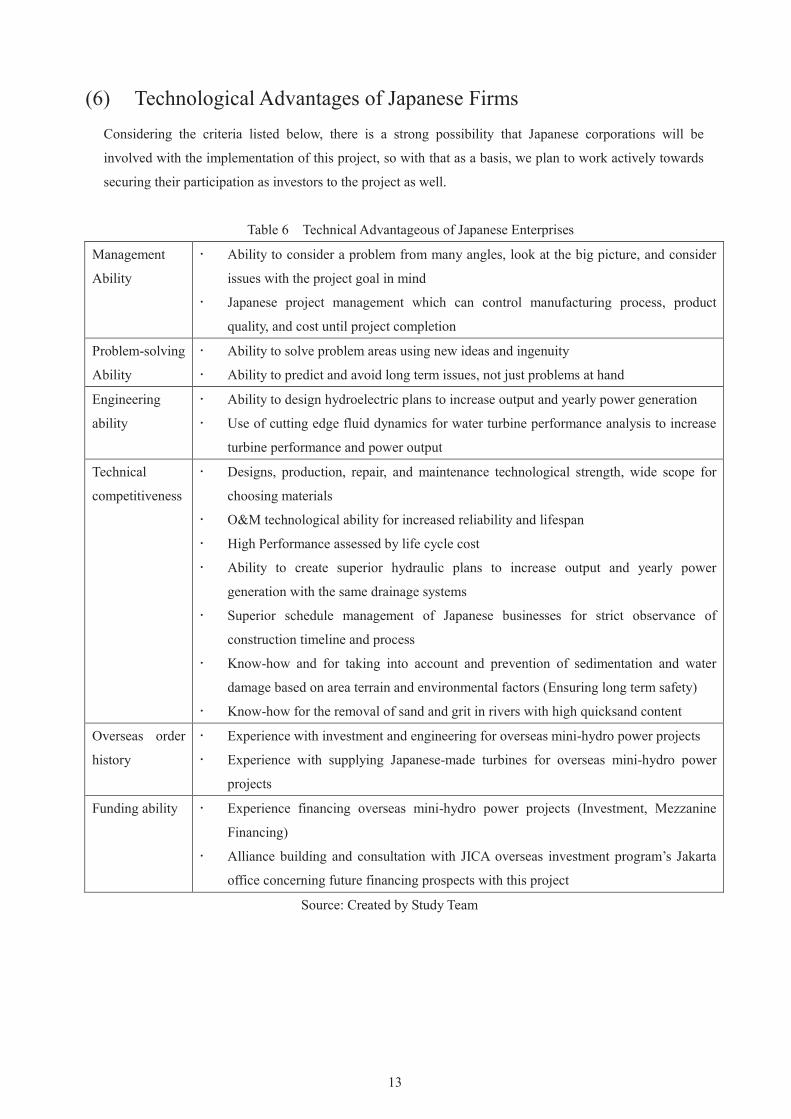
(6) Technological Advantages of Japanese Firms
Considering the criteria listed below, there is a strong possibility that Japanese corporations will be
involved with the implementation of this project, so with that as a basis, we plan to work actively towards
securing their participation as investors to the project as well.
Table 6 Technical Advantageous of Japanese Enterprises
Management
Ability
Ability to consider a problem from many angles, look at the big picture, and consider
issues with the project goal in mind
Japanese project management which can control manufacturing process, product
quality, and cost until project completion
Problem-solving
Ability
Ability to solve problem areas using new ideas and ingenuity
Ability to predict and avoid long term issues, not just problems at hand
Engineering
ability
Ability to design hydroelectric plans to increase output and yearly power generation
Use of cutting edge fluid dynamics for water turbine performance analysis to increase
turbine performance and power output
Technical
competitiveness
Designs, production, repair, and maintenance technological strength, wide scope for
choosing materials
O&M technological ability for increased reliability and lifespan
High Performance assessed by life cycle cost
Ability to create superior hydraulic plans to increase output and yearly power
generation with the same drainage systems
Superior schedule management of Japanese businesses for strict observance of
construction timeline and process
Know-how and for taking into account and prevention of sedimentation and water
damage based on area terrain and environmental factors (Ensuring long term safety)
Know-how for the removal of sand and grit in rivers with high quicksand content
Overseas order
history
Experience with investment and engineering for overseas mini-hydro power projects
Experience with supplying Japanese-made turbines for overseas mini-hydro power
projects
Funding ability Experience financing overseas mini-hydro power projects (Investment, Mezzanine
Financing)
Alliance building and consultation with JICA overseas investment program’s Jakarta
office concerning future financing prospects with this project
Source: Created by Study Team

14
(7) Maps of Project Target Location
Source: Created by the Study Team

Chapter 1 Overview of Host Country and Sector


1-1
(1) Economic and Financial Situation of Host Country
1) Economic Overview
After the Asian financial crisis in July of 1997, Indonesia agreed to the IMF, and carried out a reform of the
banking and business sectors. With the stabilization of the political, social, and financial situation, as well
as an increase in consumer spending, the 2001 economic growth rate of 3.6% increased to over 5.5% and
even into 6% after 2005. Though it was affected somewhat by the 2009 world financial and economic
crisis, it still maintained a relatively high rate of 4.6%, and 2011 and 2012 saw healthy growth rates of
6.5% and 6.3% respectively. In addition, in 2010, the Gross Domestic Product (hereafter referred to as
GDP) per capita broke 3000 dollars.
Though consumer spending stays strong, the 2013 Indonesian economy has seen a slowing in investment,
and the real GDP growth rate has dropped below 6% for the first time in four years. The initial growth rate
of 6.0% in 2014 was adjusted downwards to 5.5% in May, but domestic demand is projected to hold up
economic growth, and the growth rate will be maintained (Table 1-1-1).
Table 1-1-1 Basic Economic Indicators
Units 2009 2010 2011 2012 2013
Total GDP Million
dollars
538,613 709,342 845,573 877,801 870,275
GDP Growth Rate % 4.629 6.224 6.486 6.264 5.781
GDP Per Capita dollars 2,298.82 2,984.93 3,508.16 3,590.66 3,509.82
Inflation Rate % 5.047 5.14 5.344 3.981 6.413
Unemployment Rate
(Urban) % 7.87 7.14 6.56 6.14 6.25
Exchange Rate
(Period end、
Rupiah/Dollar)
3,184.69 3,406.04 3,606.57 3,698.24 3,802.49
Balance of External Debt Million
dollars
172,871 202,413 225,375 252,364 264,060
% of GDP Applied to
External Debt %
32.10 28.54 26.65 28.75 30.34
Source: IMF World Economic Outlook Database October 2014
Balance of External Debt provided by the Central Bank of Indonesia
On October 20th, 2014, Joko Widodo (hereafter referred to as Joko) assumed office as the 7th president,
establishing a new political administration. The administrations main economic policies revolve around
reduction of fuel subsidies, increasing infrastructure, administrative reform, elimination of corruption,
simplifying the investment process, continued export control of mineral resources, increasing regulation of
foreign investment in natural resources and finance, and the increasing of minimum wage. By decreasing
1-2
the large burden of fuel subsidies, the government will be able to redirect those funds to necessary social
welfare expenditures, such as infrastructure, education, and health care. Additionally, the resulting
increased cost of fuel will result in decreased oil consumption and imports, help reduce the current account
deficit, and help stabilize the economy
Additionally, the Indonesian government is working towards strengthening the response to issues such as
delays in policy enactment, and operating environment for businesses, as well as showing an aggressive
stance towards simplifying and shortening investment procedures (Especially the Energy and Mineral
Minister Sudirman’s declaration regarding the simplification of approval for energy investment), and
infrastructure development of roads, rail, and ports.
2) Trade
Indonesia’s amount of trade increased up to 380,000,000,000 dollars in 2011, where it has since stabilized.
The amount of exports had been greater than imports until 2011, but in 2012 an excess of imports caused
the trade balance to enter a deficit (Table 1-1-2). Indonesia’s major exports (2012) are comprised of 34%
natural resources, including oil and gas (19.5%), mineral fuels (13.9%), and animal and plant oil (11.2%).
On the other hand, major imports include oil and gas (22.2%), general machinery/equipment (14.8%), and
machines and electrical parts (9.9%). Oil and gas are both the primary import and export. In 2013, the
main partner countries by export were Japan (14.8%), China (12.4%), and Singapore (9.1%), and imports
were mainly from China (16.0%), Singapore (13.7%), and Japan (10.3%), but there has recently been
striking growth in China, so current numbers may differ.
Table 1-1-2 Trade Balance (unit: million dollars)
2009 2010 2011 2012 2013
Total Exports 116,510 157,779 203,617 190,032 182,552
Total Imports 96,829 135,663 177,299 191,691 186,629
Trade Balance 30,932 30,627 34,783 ▲8,619 ▲5,834
Foreign
Currency
Reserve 63,563 92,908 106,539 108,837 96,364
Source: Central Bank of Indonesia (Trade Balance)
3) Investment from Overseas
According to the Indonesia Investment Coordinating Board (BKPM), in 2013 the inward direct investment
(execution based) saw a 16.5% increase from the previous year to 28.6175 billion USD, and continued the
previous year’s trend of breaking record highs. Going by industry, mining was the greatest at 16.8%
overall, followed by transportation, metals, machines, electrical machinery, chemistry and medical supplies,
electric/gas/water, foodstuffs, and agriculture (Table 1-1-3). By country, Japan’s 4.7129 billion USD just
outpace Singapore’s 4.6708 billion USD, taking the lead position.
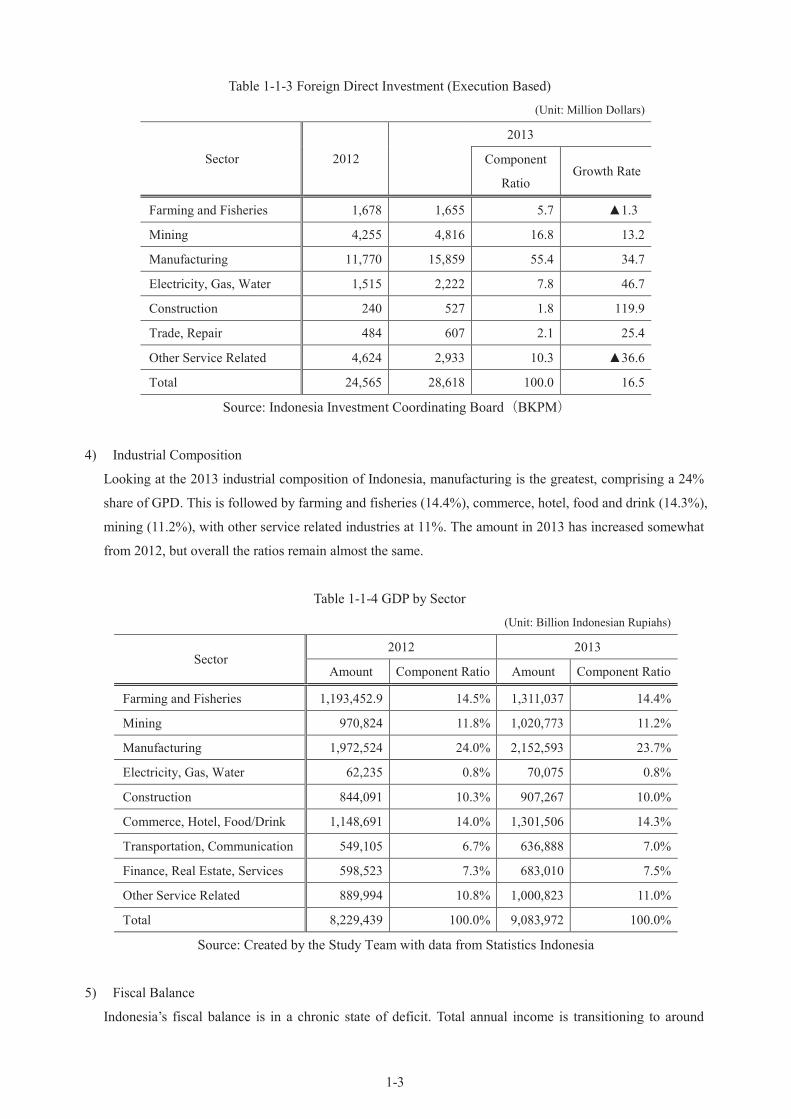
1-3
Table 1-1-3 Foreign Direct Investment (Execution Based)
(Unit: Million Dollars)
Sector 2012
2013
Component
Ratio Growth Rate
Farming and Fisheries 1,678 1,655 5.7 ▲1.3
Mining 4,255 4,816 16.8 13.2
Manufacturing 11,770 15,859 55.4 34.7
Electricity, Gas, Water 1,515 2,222 7.8 46.7
Construction 240 527 1.8 119.9
Trade, Repair 484 607 2.1 25.4
Other Service Related 4,624 2,933 10.3 ▲36.6
Total 24,565 28,618 100.0 16.5
Source: Indonesia Investment Coordinating Board(BKPM)
4) Industrial Composition
Looking at the 2013 industrial composition of Indonesia, manufacturing is the greatest, comprising a 24%
share of GPD. This is followed by farming and fisheries (14.4%), commerce, hotel, food and drink (14.3%),
mining (11.2%), with other service related industries at 11%. The amount in 2013 has increased somewhat
from 2012, but overall the ratios remain almost the same.
Table 1-1-4 GDP by Sector
(Unit: Billion Indonesian Rupiahs)
Sector 2012 2013
Amount Component Ratio Amount Component Ratio
Farming and Fisheries 1,193,452.9 14.5% 1,311,037 14.4%
Mining 970,824 11.8% 1,020,773 11.2%
Manufacturing 1,972,524 24.0% 2,152,593 23.7%
Electricity, Gas, Water 62,235 0.8% 70,075 0.8%
Construction 844,091 10.3% 907,267 10.0%
Commerce, Hotel, Food/Drink 1,148,691 14.0% 1,301,506 14.3%
Transportation, Communication 549,105 6.7% 636,888 7.0%
Finance, Real Estate, Services 598,523 7.3% 683,010 7.5%
Other Service Related 889,994 10.8% 1,000,823 11.0%
Total 8,229,439 100.0% 9,083,972 100.0%
Source: Created by the Study Team with data from Statistics Indonesia
5) Fiscal Balance
Indonesia’s fiscal balance is in a chronic state of deficit. Total annual income is transitioning to around

1-4
16% of GDP, while total annual expenditures are around 18%. A deficit like this one of 1-2% is beginning
to approach the upper limit (3.0%) proscribed by national law (Table 1-1-5).
Table 1-1-5 Fiscal Balance
(Unit: Billion Indonesian Rupiahs)
2009 2010 2011 2012 2013
Annual Income 1,211,000 1,338,000 1,502,000 1,635,000 Annual Income
GDP% 16.3 16.2 15.9 16.3 GDP%
Annual Expenditures 1,295,000 1,491,000 1,726,000 1,877,000 Annual Expenditures
GDP%) 17.4 18.1 18.3 18.7 GDP%
Fiscal Balance ▲84,000 ▲153,000 ▲224,000 ▲242,000 Fiscal Balance
GDP% ▲1.1 ▲1.9 ▲2.4 ▲2.4 GDP%
Source: Indonesia Ministry of Finance, End of August, 2014
6) Population
Indonesia’s population is approximately two times that of Japan’s, at over 247,000,000 people. After China,
India, and the United States of America, it is the world’s fourth largest country. The average age is 28.9
years old, with those under 30 making up half of the population; a large business market. The main ethnic
group is Malay (A classification of about 300 ethnicities, including Javanese and Sundanese). About 60%
of the total population of Indonesia lives on Java, which only makes up 7% of the total land area. There is
a continuing trend of steady population increase, and in the ten years from 2010-2020 there is a projected
growth of 30,000,000 people. The population is estimated to increase to 300,000,000 people by 2050. It is
one of the countries with the highest long-term market potential in all of East Asia (Fig. 1-1-1).
Fig. 1-1-1 Indonesia Population Pyramid (2014)
Source: Central Intelligence Agency
Population
(million)
Population
(million)
Age

1-5
Approximately half of this population (50.7% in 2011) is found in urban areas. Indonesia’s middle and
wealthy class are projected to double to 141,000,000 people by 2020, and the number of cities with
500,000 or more middle or wealthy class residents is also expected to double to 541.
According to the Asian Development Bank’s “Asian Development Outlook 2013,” in the three years
leading up to 2012, 8,600,000 people were able to escape from poverty due to the continued high growth
rate of over 6%. However, 29,000,000 people still fall below the poverty line, and 30,000,000 people live
very close to it. 60% of employed persons fall within the informal sector (work with no official
employment contract or insurance), and are resigned to a low income. There has been a trend in recent
years of an increasing income divide, and the Gini coefficient, a metric for measuring income gap, has
risen from 0.35 in 2008 to 0.41 in 2011.
1 Boston Consulting Group, Household Expenditures Database (2012), Indonesia Central Bureau of Statistics (BPS)
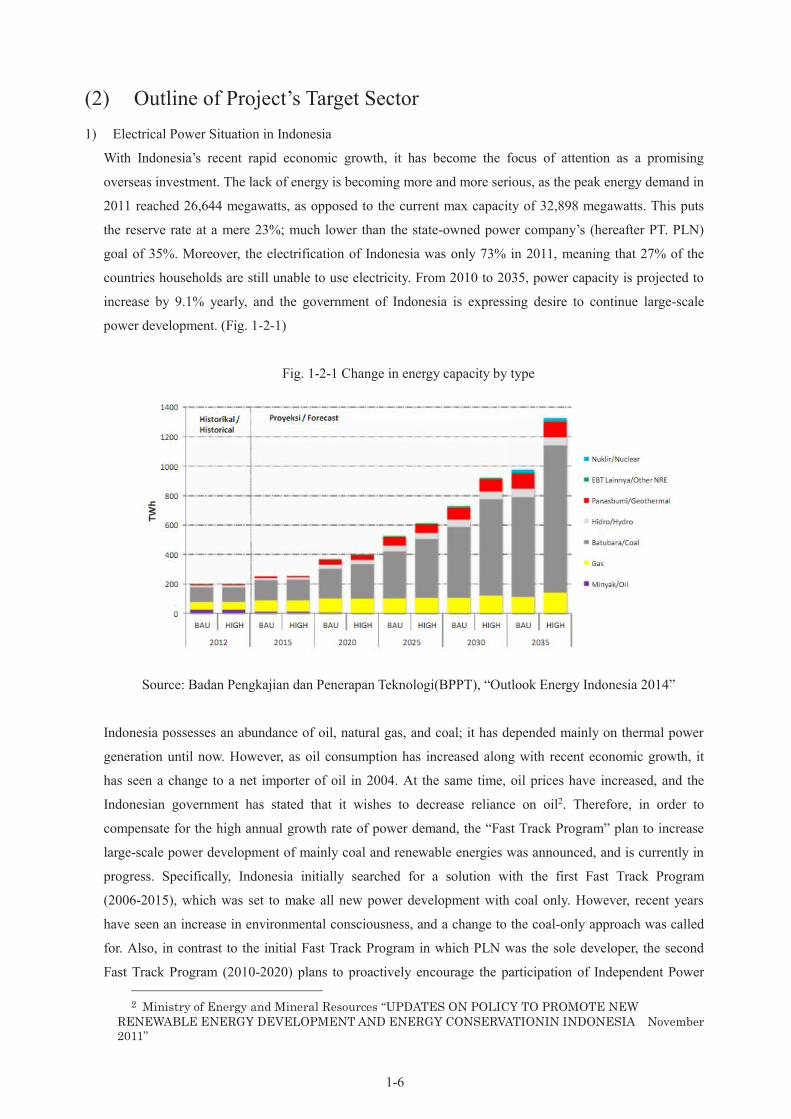
1-6
(2) Outline of Project’s Target Sector
1) Electrical Power Situation in Indonesia
With Indonesia’s recent rapid economic growth, it has become the focus of attention as a promising
overseas investment. The lack of energy is becoming more and more serious, as the peak energy demand in
2011 reached 26,644 megawatts, as opposed to the current max capacity of 32,898 megawatts. This puts
the reserve rate at a mere 23%; much lower than the state-owned power company’s (hereafter PT. PLN)
goal of 35%. Moreover, the electrification of Indonesia was only 73% in 2011, meaning that 27% of the
countries households are still unable to use electricity. From 2010 to 2035, power capacity is projected to
increase by 9.1% yearly, and the government of Indonesia is expressing desire to continue large-scale
power development. (Fig. 1-2-1)
Fig. 1-2-1 Change in energy capacity by type
Source: Badan Pengkajian dan Penerapan Teknologi(BPPT), “Outlook Energy Indonesia 2014”
Indonesia possesses an abundance of oil, natural gas, and coal; it has depended mainly on thermal power
generation until now. However, as oil consumption has increased along with recent economic growth, it
has seen a change to a net importer of oil in 2004. At the same time, oil prices have increased, and the
Indonesian government has stated that it wishes to decrease reliance on oil2. Therefore, in order to
compensate for the high annual growth rate of power demand, the “Fast Track Program” plan to increase
large-scale power development of mainly coal and renewable energies was announced, and is currently in
progress. Specifically, Indonesia initially searched for a solution with the first Fast Track Program
(2006-2015), which was set to make all new power development with coal only. However, recent years
have seen an increase in environmental consciousness, and a change to the coal-only approach was called
for. Also, in contrast to the initial Fast Track Program in which PLN was the sole developer, the second
Fast Track Program (2010-2020) plans to proactively encourage the participation of Independent Power
2 Ministry of Energy and Mineral Resources “UPDATES ON POLICY TO PROMOTE NEW
RENEWABLE ENERGY DEVELOPMENT AND ENERGY CONSERVATIONIN INDONESIA November
2011”
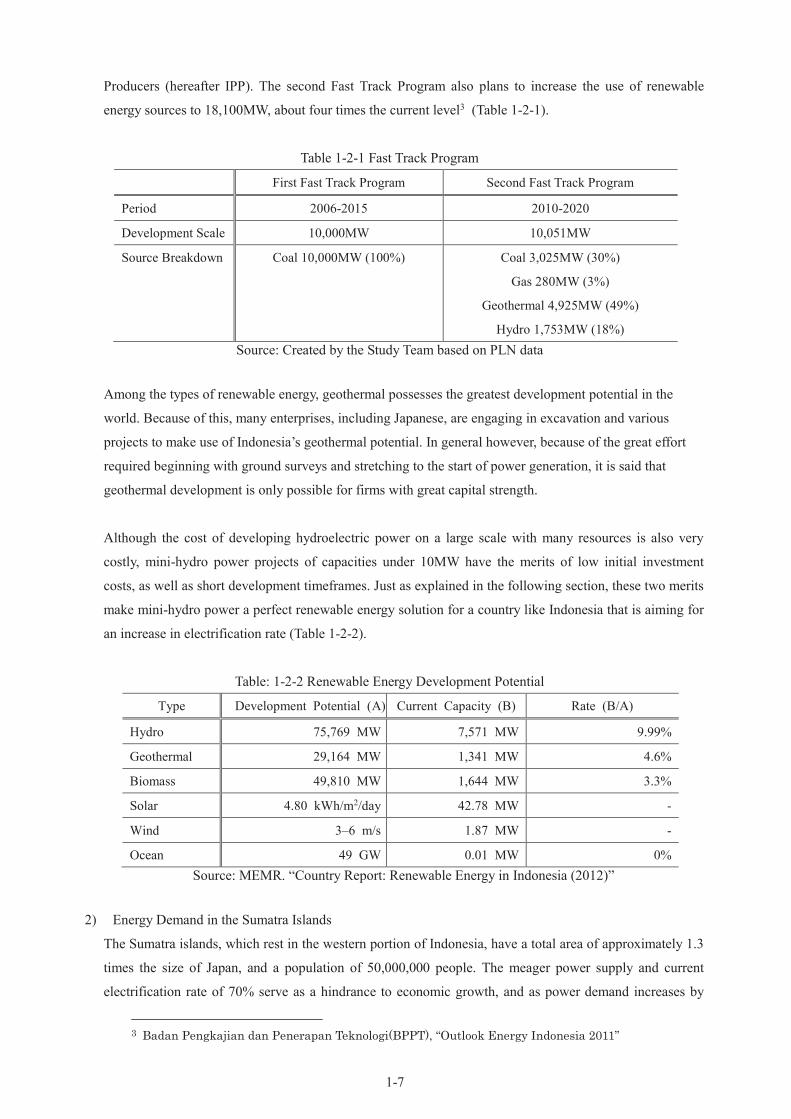
1-7
Producers (hereafter IPP). The second Fast Track Program also plans to increase the use of renewable
energy sources to 18,100MW, about four times the current level3 (Table 1-2-1).
Table 1-2-1 Fast Track Program
First Fast Track Program Second Fast Track Program
Period 2006-2015 2010-2020
Development Scale 10,000MW 10,051MW
Source Breakdown Coal 10,000MW (100%) Coal 3,025MW (30%)
Gas 280MW (3%)
Geothermal 4,925MW (49%)
Hydro 1,753MW (18%)
Source: Created by the Study Team based on PLN data
Among the types of renewable energy, geothermal possesses the greatest development potential in the
world. Because of this, many enterprises, including Japanese, are engaging in excavation and various
projects to make use of Indonesia’s geothermal potential. In general however, because of the great effort
required beginning with ground surveys and stretching to the start of power generation, it is said that
geothermal development is only possible for firms with great capital strength.
Although the cost of developing hydroelectric power on a large scale with many resources is also very
costly, mini-hydro power projects of capacities under 10MW have the merits of low initial investment
costs, as well as short development timeframes. Just as explained in the following section, these two merits
make mini-hydro power a perfect renewable energy solution for a country like Indonesia that is aiming for
an increase in electrification rate (Table 1-2-2).
Table: 1-2-2 Renewable Energy Development Potential
Type Development Potential (A) Current Capacity (B) Rate (B/A)
Hydro 75,769 MW 7,571 MW 9.99%
Geothermal 29,164 MW 1,341 MW 4.6%
Biomass 49,810 MW 1,644 MW 3.3%
Solar 4.80 kWh/m2/day 42.78 MW -
Wind 3–6 m/s 1.87 MW -
Ocean 49 GW 0.01 MW 0%
Source: MEMR. “Country Report: Renewable Energy in Indonesia (2012)”
2) Energy Demand in the Sumatra Islands
The Sumatra islands, which rest in the western portion of Indonesia, have a total area of approximately 1.3
times the size of Japan, and a population of 50,000,000 people. The meager power supply and current
electrification rate of 70% serve as a hindrance to economic growth, and as power demand increases by
3 Badan Pengkajian dan Penerapan Teknologi(BPPT), “Outlook Energy Indonesia 2011”

1-8
10.5% each year, the power system is falling into a situation where even normal usage exceeds capacity
(Maximum demand of 4,662MW, PLN maximum supply capacity of 4,777MW). Reliably power supply is
becoming an urgent issue in the area.
At the time of 2012, the electrification rate of the Sumatra islands was approximately 71.7%, a
comparatively higher rate than other areas, with the exceptions of Java and Bali (Table 1-2-3). The
Sumatra power system is already somewhat developed, with a 150kV power line to join the northern and
southern areas linked on August 14th, 20074. Additionally, PLN is advancing a plan to outfit 275kV and
500kV lines as well. With this comparatively advanced power line network as evidence, it is obvious that
the islands of Sumatra are showing concrete steps to improve the electrification of the region. North
Sumatra, the target location of this project, has a comparatively high electrification rate of 84.6%, but the
prolonged shortage of power in North Sumatra has reached 200MW, and is even being taken up as a
national issue. Because of instability in the power supply, it is difficult for other Japanese firms to advance
into the area; there is truly a great need for more power there.
Table: 1-2-3 Electrification rates in the islands of Sumatra (2012)
Province Name Population
(Thousands)
Residences
(Thousands)
Electrification (%)
Aceh 4,693.9 1,105.1 88.55
North Sumatra 13,215.4 3,112.5 84.61
West Sumatra 4,957.7 1,182.5 72.98
South Sumatra 7,701.5 1,870.2 63.09
Bengkulu 1,766.8 445.5 71.02
Riau Islands 811.5 192.1 72.13
Lampung 7,767.3 1,985.0 65.29
Bangka-Belitung
Islands 1,298.2 324.6 73.94
Riau 5,929.2 1,394.7 56.52
Jambi 3,242.8 800.4 58.05
Total 51,384.3 12,412.6 71.69
Source: “PLN Statistics 2012” March, 2013
According to PLN’s “2012-2021 Energy Development Plan,” the Sumatra islands are projected to see an
average economic growth rate of 7.1% and an average annual energy demand growth rate of 8.2%
spanning the years of 2012 to 2021, reaching an energy demand of 65.4TWh in 2021. With the above
economic growth rate as evidence for projected growth in energy demand, this plan has set the target
electrification rate in 2021 at 97.6%. Additionally, the power system for the Sumatra islands is planned to
have a 59% reserve power supply at that time, primarily covering the gap with new fossil fuel-based power
4 Ministry of Energy and Mineral Resources “Minister’s Order Regarding the National Electricity
General Plan 2008-2027” November 13, 2008

1-9
sources. In particular, development is planned to center around coal as a power source, but the proposal
also includes plans to increase hydro power 1.6GW by 2021, for a total of 2.6GW, making up 15.7% of
overall power generation (Fig. 1-2-2).
This power is being distributed by a 150KV2 line that stretches from Sumatra’s north-westernmost Aceh to
its south-easternmost Kalimantan. One part of this line is designed at 275KV, and is currently being used at
150KV.
Fig. 1-2-2 North Sumatra Islands Power Demand Assessment
Source: Created by the Study Team based on the data from the local cooperation company
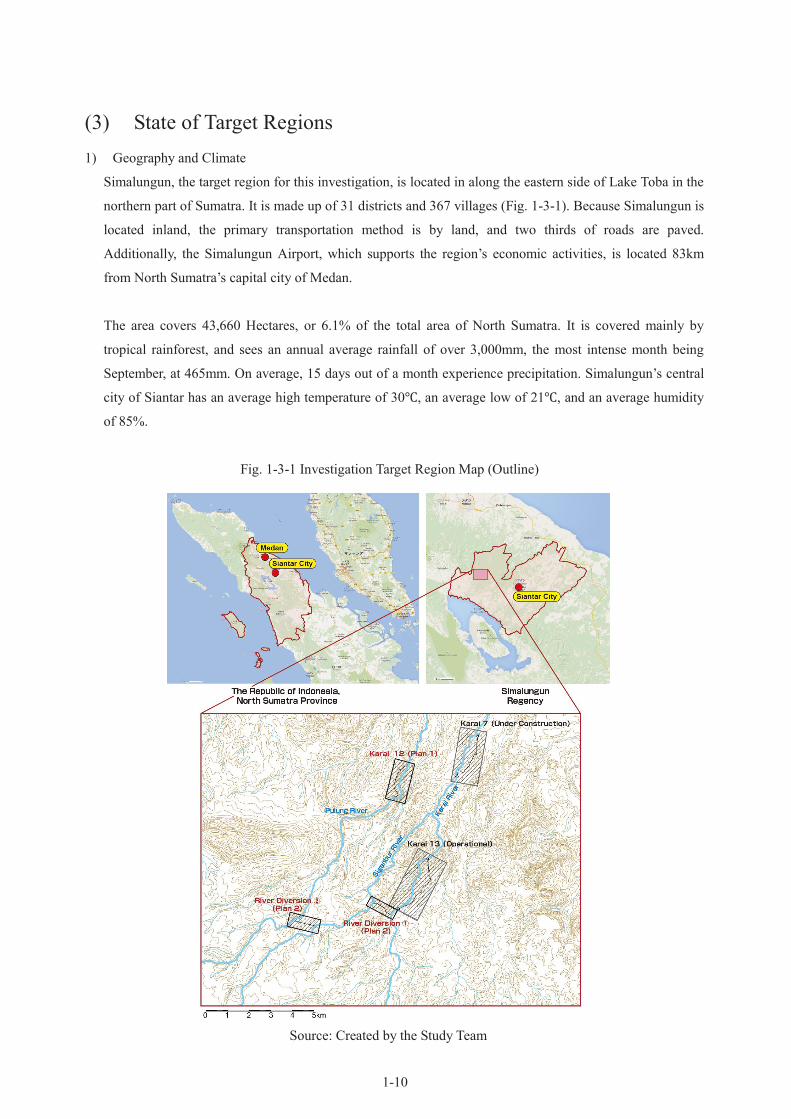
1-10
(3) State of Target Regions
1) Geography and Climate
Simalungun, the target region for this investigation, is located in along the eastern side of Lake Toba in the
northern part of Sumatra. It is made up of 31 districts and 367 villages (Fig. 1-3-1). Because Simalungun is
located inland, the primary transportation method is by land, and two thirds of roads are paved.
Additionally, the Simalungun Airport, which supports the region’s economic activities, is located 83km
from North Sumatra’s capital city of Medan.
The area covers 43,660 Hectares, or 6.1% of the total area of North Sumatra. It is covered mainly by
tropical rainforest, and sees an annual average rainfall of over 3,000mm, the most intense month being
September, at 465mm. On average, 15 days out of a month experience precipitation. Simalungun’s central
city of Siantar has an average high temperature of 30℃, an average low of 21℃, and an average humidity
of 85%.
Fig. 1-3-1 Investigation Target Region Map (Outline)
Source: Created by the Study Team

1-11
Fig. 1-3-2 Map of Precipitation in Sumatra
Source: Badan Meteorologi, Klimatologi dan Geofisika
2) Land Usage
Simalungun possesses 438,660 hectares of land, one third of which is forested, with 22.4% for
afforestation, and 6.3% being forest reserve. As for the other areas, 18.3% is used for agriculture, and
14.5% for plantations, the main produce of which is corn, palm oil, and rubber.
Table 1-3-1 Land Usage Situation
Land Usage Usage Area(ha) Usage
Rate% Target District/Primary Agricultural Produce
Afforestation 98,200 22.39% Kingdom Kahean, Silou Kahean, Raya, Panei,
Panombeian Panei, Dolok Panribuan, and so on
Afforestation
Restriction 10,842 2.47% Bosar Maligas, Hutabayu King,Hatonduhan
Forest Reserve 27,668 6.31%
Bund Silimahuta, silimakuta, Dolok Silou, Parba,
Dolk Pardamean, Haranggaol Horizon, Purba, Silaou
Khaeda
Conservation 2,031 0.46% Purba, Silaou Kahean, Dolok Silou
Agriculture 80,220 18.29% Cassava, Corn, Beans, Sweet Potatoes
Plantation 63,671 14.51%
Palm Oil, Rubber, Cocoa, Coffee, Coconuts, Areca
Palm, Cinnamon, Clove, Hazelnuts, Pepper, Palm
Sugar, Vanilla
Source: Simalungun Central Bureau of Statistics (2012)
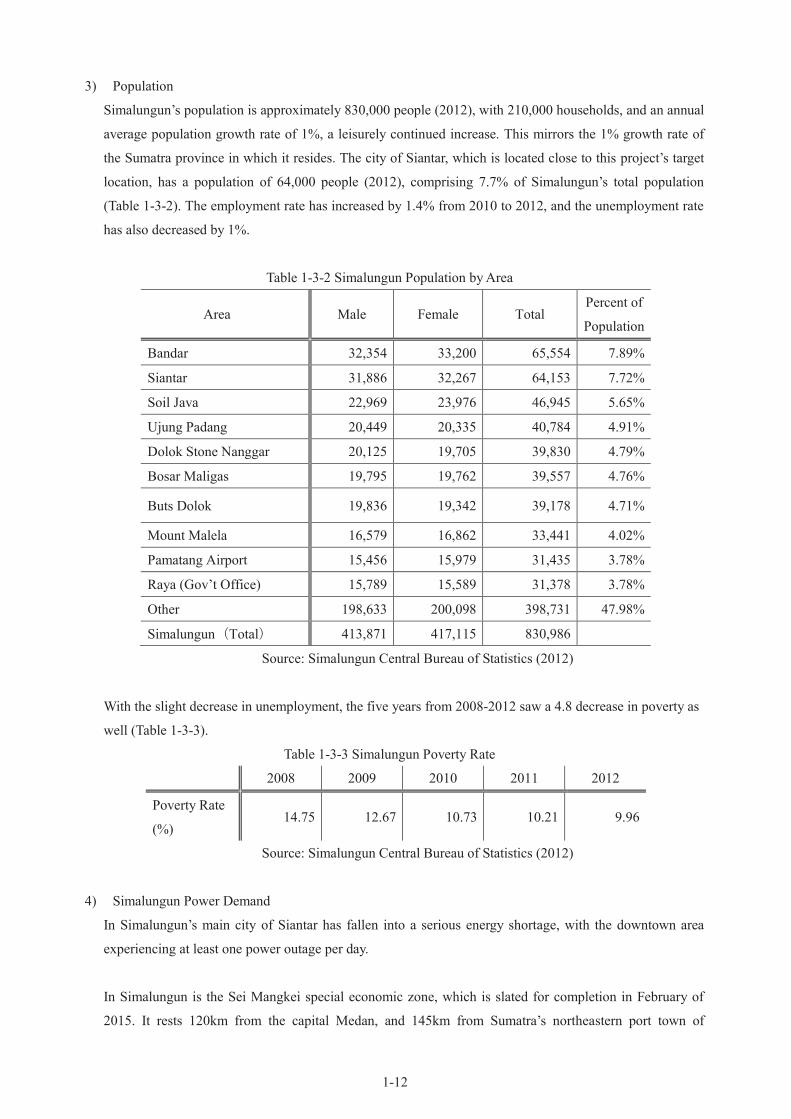
1-12
3) Population
Simalungun’s population is approximately 830,000 people (2012), with 210,000 households, and an annual
average population growth rate of 1%, a leisurely continued increase. This mirrors the 1% growth rate of
the Sumatra province in which it resides. The city of Siantar, which is located close to this project’s target
location, has a population of 64,000 people (2012), comprising 7.7% of Simalungun’s total population
(Table 1-3-2). The employment rate has increased by 1.4% from 2010 to 2012, and the unemployment rate
has also decreased by 1%.
Table 1-3-2 Simalungun Population by Area
Area Male Female Total Percent of
Population
Bandar 32,354 33,200 65,554 7.89%
Siantar 31,886 32,267 64,153 7.72%
Soil Java 22,969 23,976 46,945 5.65%
Ujung Padang 20,449 20,335 40,784 4.91%
Dolok Stone Nanggar 20,125 19,705 39,830 4.79%
Bosar Maligas 19,795 19,762 39,557 4.76%
Buts Dolok 19,836 19,342 39,178 4.71%
Mount Malela 16,579 16,862 33,441 4.02%
Pamatang Airport 15,456 15,979 31,435 3.78%
Raya (Gov’t Office) 15,789 15,589 31,378 3.78%
Other 198,633 200,098 398,731 47.98%
Simalungun(Total) 413,871 417,115 830,986
Source: Simalungun Central Bureau of Statistics (2012)
With the slight decrease in unemployment, the five years from 2008-2012 saw a 4.8 decrease in poverty as
well (Table 1-3-3).
Table 1-3-3 Simalungun Poverty Rate
2008 2009 2010 2011 2012
Poverty Rate
(%) 14.75 12.67 10.73 10.21 9.96
Source: Simalungun Central Bureau of Statistics (2012)
4) Simalungun Power Demand
In Simalungun’s main city of Siantar has fallen into a serious energy shortage, with the downtown area
experiencing at least one power outage per day.
In Simalungun is the Sei Mangkei special economic zone, which is slated for completion in February of
2015. It rests 120km from the capital Medan, and 145km from Sumatra’s northeastern port town of
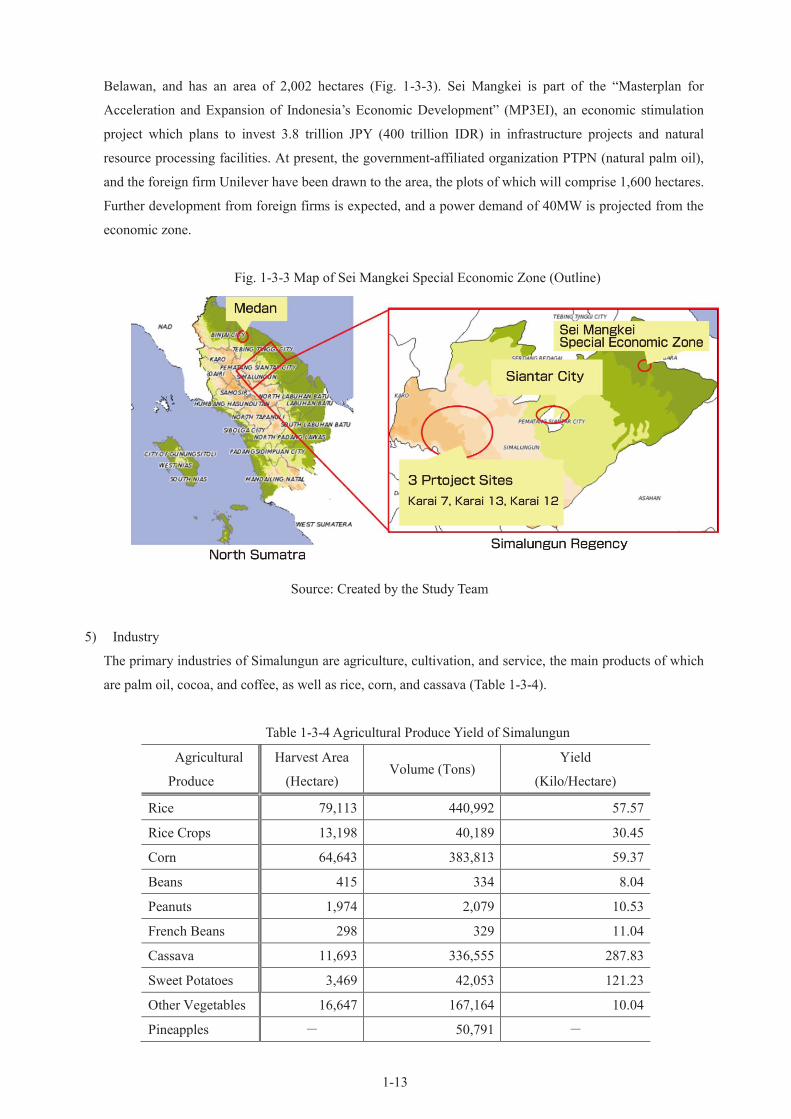
1-13
Belawan, and has an area of 2,002 hectares (Fig. 1-3-3). Sei Mangkei is part of the “Masterplan for
Acceleration and Expansion of Indonesia’s Economic Development” (MP3EI), an economic stimulation
project which plans to invest 3.8 trillion JPY (400 trillion IDR) in infrastructure projects and natural
resource processing facilities. At present, the government-affiliated organization PTPN (natural palm oil),
and the foreign firm Unilever have been drawn to the area, the plots of which will comprise 1,600 hectares.
Further development from foreign firms is expected, and a power demand of 40MW is projected from the
economic zone.
Fig. 1-3-3 Map of Sei Mangkei Special Economic Zone (Outline)
Source: Created by the Study Team
5) Industry
The primary industries of Simalungun are agriculture, cultivation, and service, the main products of which
are palm oil, cocoa, and coffee, as well as rice, corn, and cassava (Table 1-3-4).
Table 1-3-4 Agricultural Produce Yield of Simalungun
Agricultural
Produce
Harvest Area
(Hectare) Volume (Tons)
Yield
(Kilo/Hectare)
Rice 79,113 440,992 57.57
Rice Crops 13,198 40,189 30.45
Corn 64,643 383,813 59.37
Beans 415 334 8.04
Peanuts 1,974 2,079 10.53
French Beans 298 329 11.04
Cassava 11,693 336,555 287.83
Sweet Potatoes 3,469 42,053 121.23
Other Vegetables 16,647 167,164 10.04
Pineapples - 50,791 -

1-14
Bananas - 48,697 -
Oranges - 15,698 -
Other Fruits - 19,480 -
Source: Simalungun Central Bureau of Statistics (2012)
6) Resources
Most of the forest resources are planted forests. In terms of minerals, oil production is vigorous.

Chapter 2 Study Methodology

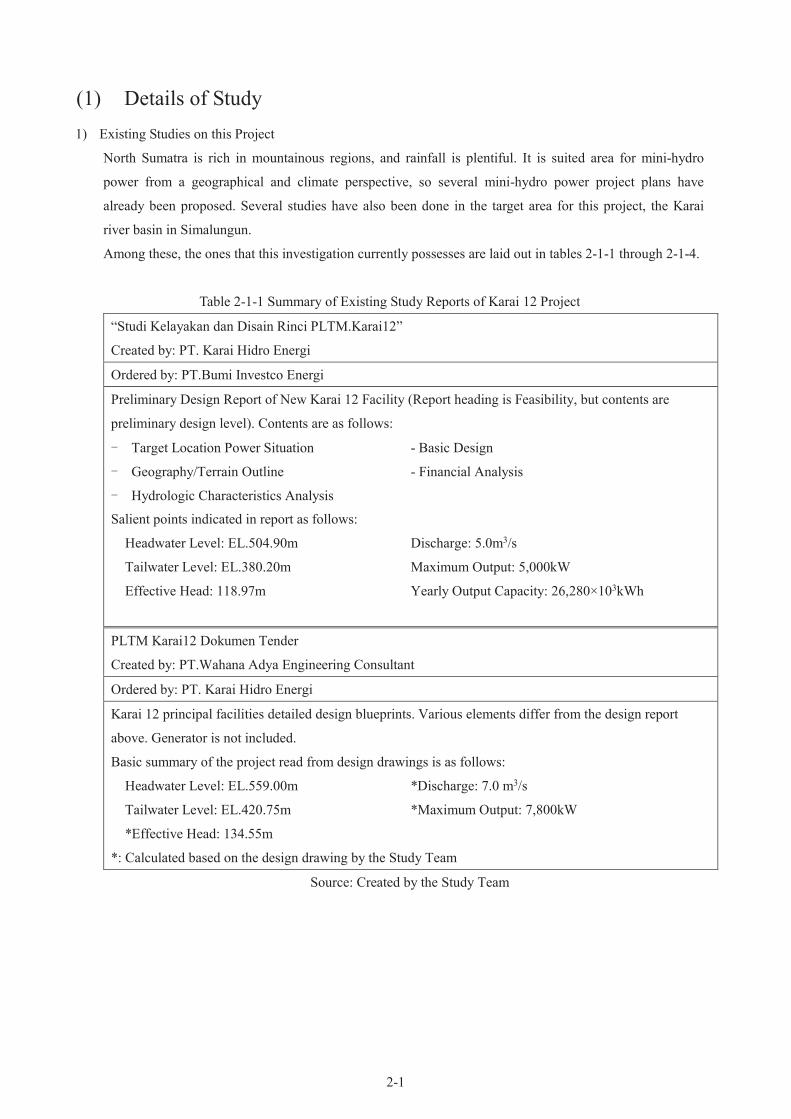
2-1
(1) Details of Study
1) Existing Studies on this Project
North Sumatra is rich in mountainous regions, and rainfall is plentiful. It is suited area for mini-hydro
power from a geographical and climate perspective, so several mini-hydro power project plans have
already been proposed. Several studies have also been done in the target area for this project, the Karai
river basin in Simalungun.
Among these, the ones that this investigation currently possesses are laid out in tables 2-1-1 through 2-1-4.
Table 2-1-1 Summary of Existing Study Reports of Karai 12 Project
“Studi Kelayakan dan Disain Rinci PLTM.Karai12”
Created by: PT. Karai Hidro Energi
Ordered by: PT.Bumi Investco Energi
Preliminary Design Report of New Karai 12 Facility (Report heading is Feasibility, but contents are
preliminary design level). Contents are as follows:
- Target Location Power Situation - Basic Design
- Geography/Terrain Outline - Financial Analysis
- Hydrologic Characteristics Analysis
Salient points indicated in report as follows:
Headwater Level: EL.504.90m Discharge: 5.0m3/s
Tailwater Level: EL.380.20m Maximum Output: 5,000kW
Effective Head: 118.97m Yearly Output Capacity: 26,280×103kWh
PLTM Karai12 Dokumen Tender
Created by: PT.Wahana Adya Engineering Consultant
Ordered by: PT. Karai Hidro Energi
Karai 12 principal facilities detailed design blueprints. Various elements differ from the design report
above. Generator is not included.
Basic summary of the project read from design drawings is as follows:
Headwater Level: EL.559.00m *Discharge: 7.0 m3/s
Tailwater Level: EL.420.75m *Maximum Output: 7,800kW
*Effective Head: 134.55m
*: Calculated based on the design drawing by the Study Team
Source: Created by the Study Team
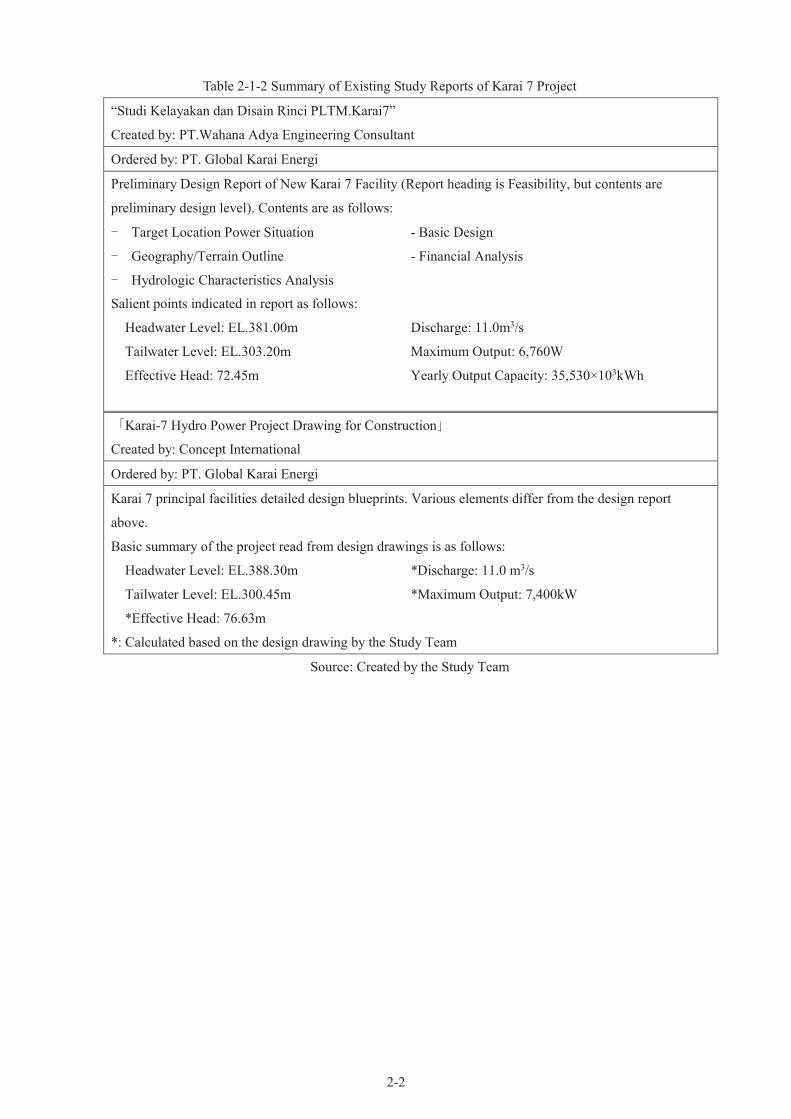
2-2
Table 2-1-2 Summary of Existing Study Reports of Karai 7 Project
“Studi Kelayakan dan Disain Rinci PLTM.Karai7”
Created by: PT.Wahana Adya Engineering Consultant
Ordered by: PT. Global Karai Energi
Preliminary Design Report of New Karai 7 Facility (Report heading is Feasibility, but contents are
preliminary design level). Contents are as follows:
- Target Location Power Situation - Basic Design
- Geography/Terrain Outline - Financial Analysis
- Hydrologic Characteristics Analysis
Salient points indicated in report as follows:
Headwater Level: EL.381.00m Discharge: 11.0m3/s
Tailwater Level: EL.303.20m Maximum Output: 6,760W
Effective Head: 72.45m Yearly Output Capacity: 35,530×103kWh
「Karai-7 Hydro Power Project Drawing for Construction」
Created by: Concept International
Ordered by: PT. Global Karai Energi
Karai 7 principal facilities detailed design blueprints. Various elements differ from the design report
above.
Basic summary of the project read from design drawings is as follows:
Headwater Level: EL.388.30m *Discharge: 11.0 m3/s
Tailwater Level: EL.300.45m *Maximum Output: 7,400kW
*Effective Head: 76.63m
*: Calculated based on the design drawing by the Study Team
Source: Created by the Study Team

2-3
Table 2-1-3 Summary of Existing Study Reports of Karai 13 Project
“Studi Kelayakan dan Disain Rinci PLTM.Karai13”
Created by: PT.Wahana Adya Engineering Consultant
Ordered by: PT. Global Hidro Energi
Preliminary Design Report of New Karai 13 Facility (Report heading is Feasibility, but contents are
preliminary design level). Contents are as follows:
- Target Location Power Situation - Basic Design
- Geography/Terrain Outline - Financial Analysis
- Hydrologic Characteristics Analysis
Salient points indicated in report as follows:
Headwater Level: EL.700.00m Discharge: 6.5m3/s
Tailwater Level: EL.546.50m Maximum Output: 7,620W
Effective Head: 150.70m Yearly Output Capacity: 40,000×103kWh
“Karai-13 Hydro Power Project Drawing for Construction”
Created by: PT.Bumi Hidro Engineering Construction
Ordered by: PT. Global Hidro Energi
Karai 13 principal facilities detailed design blueprints. Various elements differ from the design report
above.
Basic summary of the project read from design drawings is as follows:
Headwater Level: EL.707.80m *Discharge: 6.3 m3/s
Tailwater Level: EL.541.01m *Maximum Output: 8,600kW
*Effective Head: 155.52
*: Calculated based on the design drawing by the Study Team
Source: Created by the Study Team
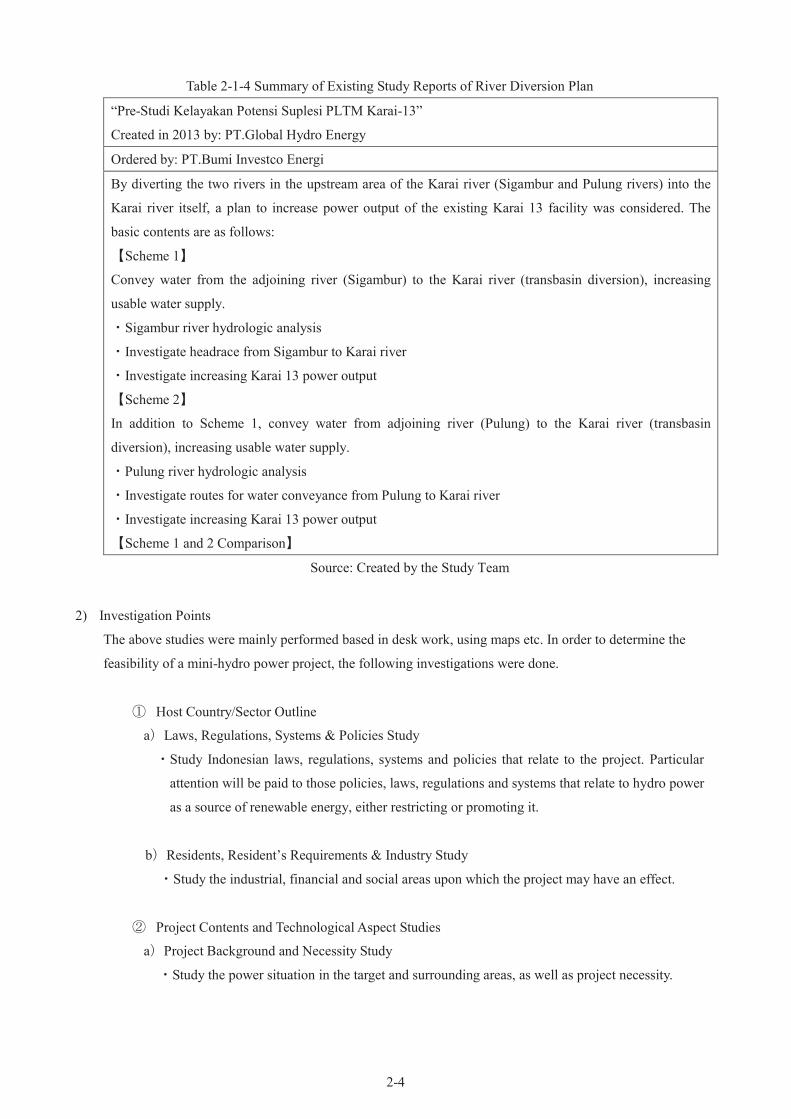
2-4
Table 2-1-4 Summary of Existing Study Reports of River Diversion Plan
“Pre-Studi Kelayakan Potensi Suplesi PLTM Karai-13”
Created in 2013 by: PT.Global Hydro Energy
Ordered by: PT.Bumi Investco Energi
By diverting the two rivers in the upstream area of the Karai river (Sigambur and Pulung rivers) into the
Karai river itself, a plan to increase power output of the existing Karai 13 facility was considered. The
basic contents are as follows:
【Scheme 1】
Convey water from the adjoining river (Sigambur) to the Karai river (transbasin diversion), increasing
usable water supply.
・Sigambur river hydrologic analysis
・Investigate headrace from Sigambur to Karai river
・Investigate increasing Karai 13 power output
【Scheme 2】
In addition to Scheme 1, convey water from adjoining river (Pulung) to the Karai river (transbasin
diversion), increasing usable water supply.
・Pulung river hydrologic analysis
・Investigate routes for water conveyance from Pulung to Karai river
・Investigate increasing Karai 13 power output
【Scheme 1 and 2 Comparison】
Source: Created by the Study Team
2) Investigation Points
The above studies were mainly performed based in desk work, using maps etc. In order to determine the
feasibility of a mini-hydro power project, the following investigations were done.
① Host Country/Sector Outline
a)Laws, Regulations, Systems & Policies Study
・Study Indonesian laws, regulations, systems and policies that relate to the project. Particular
attention will be paid to those policies, laws, regulations and systems that relate to hydro power
as a source of renewable energy, either restricting or promoting it.
b)Residents, Resident’s Requirements & Industry Study
・Study the industrial, financial and social areas upon which the project may have an effect.
② Project Contents and Technological Aspect Studies
a)Project Background and Necessity Study
・Study the power situation in the target and surrounding areas, as well as project necessity.
2-5
b)Terrain and Geological Study
・Collect geological and ground condition data as well as on-site survey. Taking into account
ground conditions, investigate placement of project facilities.
c)Hydrological/Climate Study
・Collect hydrological and climate data and conduct a hydrological analysis of the rivers.
d)Power Generation Study
・Settle on a general plan for the new Karai 12 construction project.
・Investigate intake/conveyance of water from Pulung and Sigambur rivers and settle on a general
plan for the project to strengthen the power output of Karai 13 and Karai 7 facilities.
・Conduct a comparative analysis of the Karai 12 new construction plan as opposed to the Karai
13 and Karai 7 strengthen power output plan.
e)Power Facilities Planning Study
・Conduct a general civil engineering study.
・Generator general study and conduct a study concerning the participation of Japanese firms.
・Conduct a study and general analysis of existing systems.
・Conduct a construction planning study.
・Settle on a plan for general maintenance management.
f)Alternative Energy Study
・Study natural energies that have the potential to be a substitute for hydro power, such as wind,
solar and geothermal energy.
The results of these studies will be complied based on the “Report Generation Criteria.”

2-6
(2) Study Methodology and System
The portion of this project conducted in Japan followed the pattern of materials gathering and organizing,
calculation and computation, analysis, and report creation. In Indonesia, an on-site survey as well as visitation of
related agencies will be conducted.
When conducting the study, the following points were especially kept in mind.
・ Hydraulic studies will be enacted to calculate FIRR and EIRR to ensure power generation capacity, the
key to this project.
・ To ensure stable continued operation of facilities, ground strength, as well as river water flow will be
assessed. Counter measures for natural disasters such as floods and earthquakes will be considered.
・ Consider environmental and social impact on the local area and residents who live along the river.
・ Create a plan for the construction of the power production facilities and assess the economic and
business value of the project based upon financial analysis.
・ In order to perform a comparative analysis of the effectiveness of the power generation, make a thorough
investigation of the site conditions (head/flow).
The Study’s system is laid out in Fig. 2-2-1. It is made up of three companies, CHODAI, IDI infrastructures Inc.,
and KISO-JIBAN CONSULTANTS CO., LTD.

2-7
Fig. 2‐2‐1 Study System
Source: Created by the Study Team
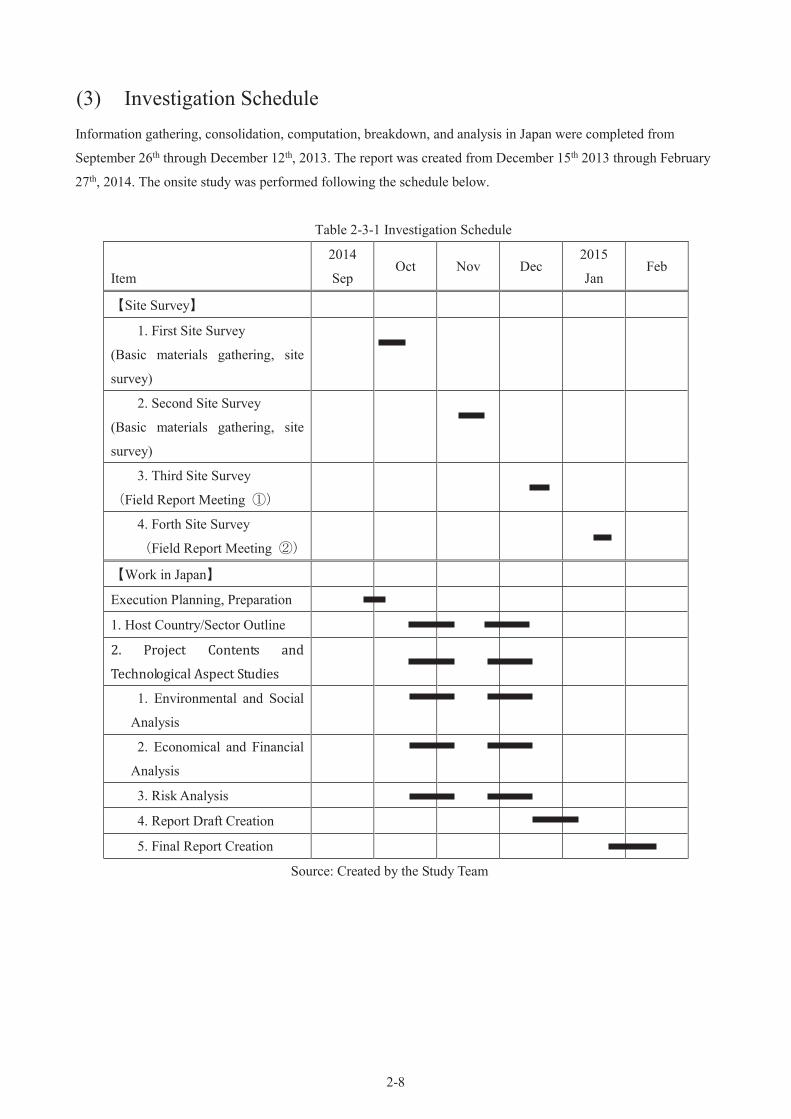
2-8
(3) Investigation Schedule
Information gathering, consolidation, computation, breakdown, and analysis in Japan were completed from
September 26th through December 12th, 2013. The report was created from December 15th 2013 through February
27th, 2014. The onsite study was performed following the schedule below.
Table 2-3-1 Investigation Schedule
Item
2014
Sep Oct Nov Dec
2015
Jan Feb
【Site Survey】
1. First Site Survey
(Basic materials gathering, site
survey)
2. Second Site Survey
(Basic materials gathering, site
survey)
3. Third Site Survey
(Field Report Meeting ①)
4. Forth Site Survey
(Field Report Meeting ②)
【Work in Japan】
Execution Planning, Preparation
1. Host Country/Sector Outline
2. Project Contents and
Technological Aspect Studies
1. Environmental and Social
Analysis
2. Economical and Financial
Analysis
3. Risk Analysis
4. Report Draft Creation
5. Final Report Creation
Source: Created by the Study Team
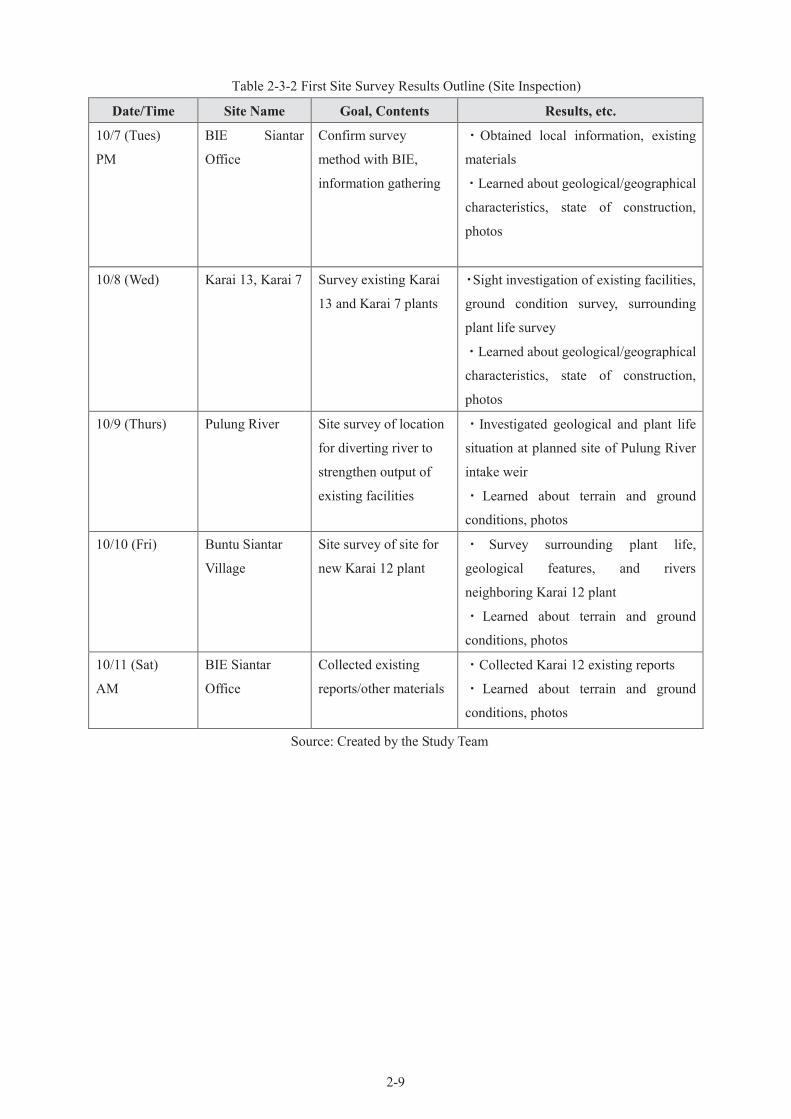
2-9
Table 2-3-2 First Site Survey Results Outline (Site Inspection)
Date/Time Site Name Goal, Contents Results, etc.
10/7 (Tues)
PM
BIE Siantar
Office
Confirm survey
method with BIE,
information gathering
・Obtained local information, existing
materials
・Learned about geological/geographical
characteristics, state of construction,
photos
10/8 (Wed)
Karai 13, Karai 7 Survey existing Karai
13 and Karai 7 plants
・Sight investigation of existing facilities,
ground condition survey, surrounding
plant life survey
・Learned about geological/geographical
characteristics, state of construction,
photos
10/9 (Thurs)
Pulung River Site survey of location
for diverting river to
strengthen output of
existing facilities
・Investigated geological and plant life
situation at planned site of Pulung River
intake weir
・ Learned about terrain and ground
conditions, photos
10/10 (Fri)
Buntu Siantar
Village
Site survey of site for
new Karai 12 plant
・ Survey surrounding plant life,
geological features, and rivers
neighboring Karai 12 plant
・ Learned about terrain and ground
conditions, photos
10/11 (Sat)
AM
BIE Siantar
Office
Collected existing
reports/other materials
・Collected Karai 12 existing reports
・ Learned about terrain and ground
conditions, photos
Source: Created by the Study Team
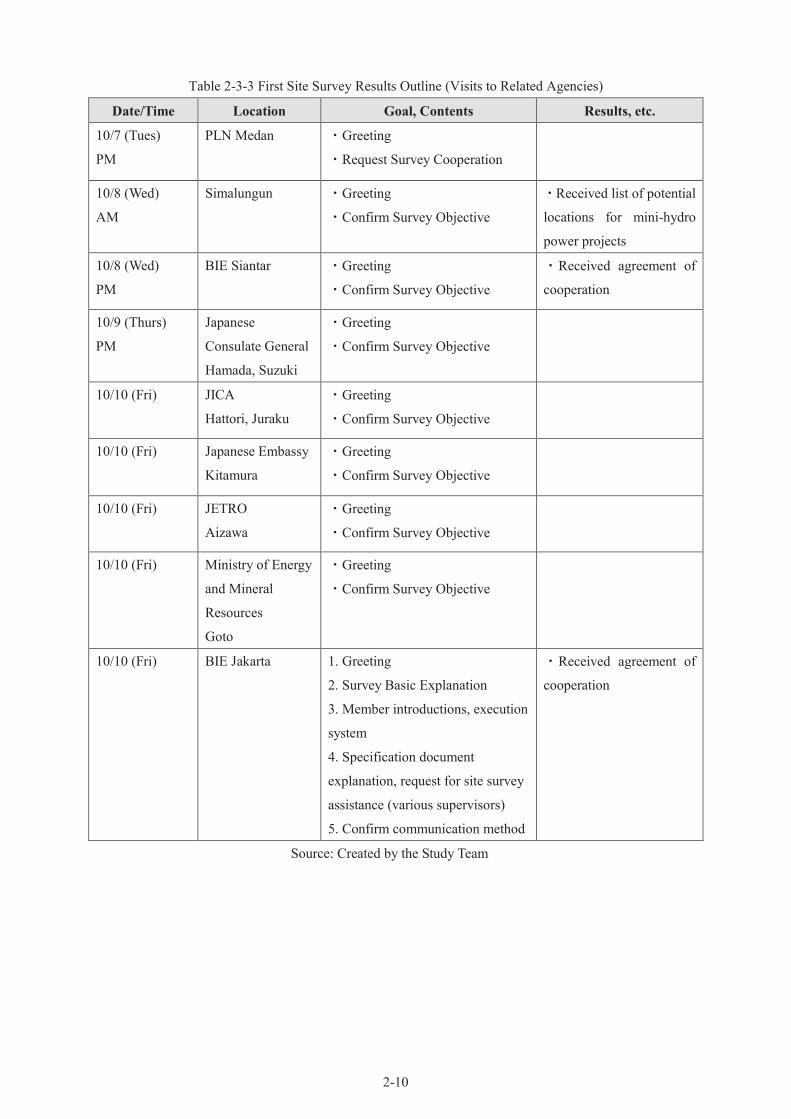
2-10
Table 2-3-3 First Site Survey Results Outline (Visits to Related Agencies)
Date/Time Location Goal, Contents Results, etc.
10/7 (Tues)
PM
PLN Medan
・Greeting
・Request Survey Cooperation
10/8 (Wed)
AM
Simalungun ・Greeting
・Confirm Survey Objective
・Received list of potential
locations for mini-hydro
power projects
10/8 (Wed)
PM
BIE Siantar ・Greeting
・Confirm Survey Objective
・Received agreement of
cooperation
10/9 (Thurs)
PM
Japanese
Consulate General
Hamada, Suzuki
・Greeting
・Confirm Survey Objective
10/10 (Fri)
JICA
Hattori, Juraku
・Greeting
・Confirm Survey Objective
10/10 (Fri) Japanese Embassy
Kitamura
・Greeting
・Confirm Survey Objective
10/10 (Fri) JETRO
Aizawa
・Greeting
・Confirm Survey Objective
10/10 (Fri) Ministry of Energy
and Mineral
Resources
Goto
・Greeting
・Confirm Survey Objective
10/10 (Fri) BIE Jakarta 1. Greeting
2. Survey Basic Explanation
3. Member introductions, execution
system
4. Specification document
explanation, request for site survey
assistance (various supervisors)
5. Confirm communication method
・Received agreement of
cooperation
Source: Created by the Study Team

2-11
Table 2-3-4 Second Site Survey Results Outline
Date/Time Location Goal, Contents Results, etc.
11/10 (Mon) Wiratman ・Confirm material
collection procedure
・Confirm materials in
possession
・Confirm Survey
Schedule
11/11 (Tues) In-transit all day
11/12 (Wed) Simalungun
National Ministry for
Spatial Planning
Ministry of Water
Resources
Ministry of the
Environment
Central Bureau of
Statistics
・Collect materials on
environment/society
・Obtained documents on the area,
population, main industries, climate,
etc. of the Silou Kahean area of
Simalungun
11/13 (Thurs) Neighboring
Communities (Bunta
Siantar、Dolok Marawa)
Nature Conservation
(Dolok Tinggi Raja)
・Local Resident
Hearing
・Confirm local
community state of
affairs
・Confirm state of
infrastructure
・Understood Pulung river usage
situation
・Understood state of private water
supply, servicing time period, cost,
usage system, etc.
・Understood nature conservation
location, situation
・Photos of state in communities
・ Village’s middle-period
development plan
11/14 (Fri) Simalungun
National Ministry for
Spatial Planning
Ministry of the
Environment
North Sumatra
Ministry of Water
Resources
・Collect materials on
environment/society
・Land use plan figures
・Forest division figures
・Existing reports
Source: Created by the Study Team
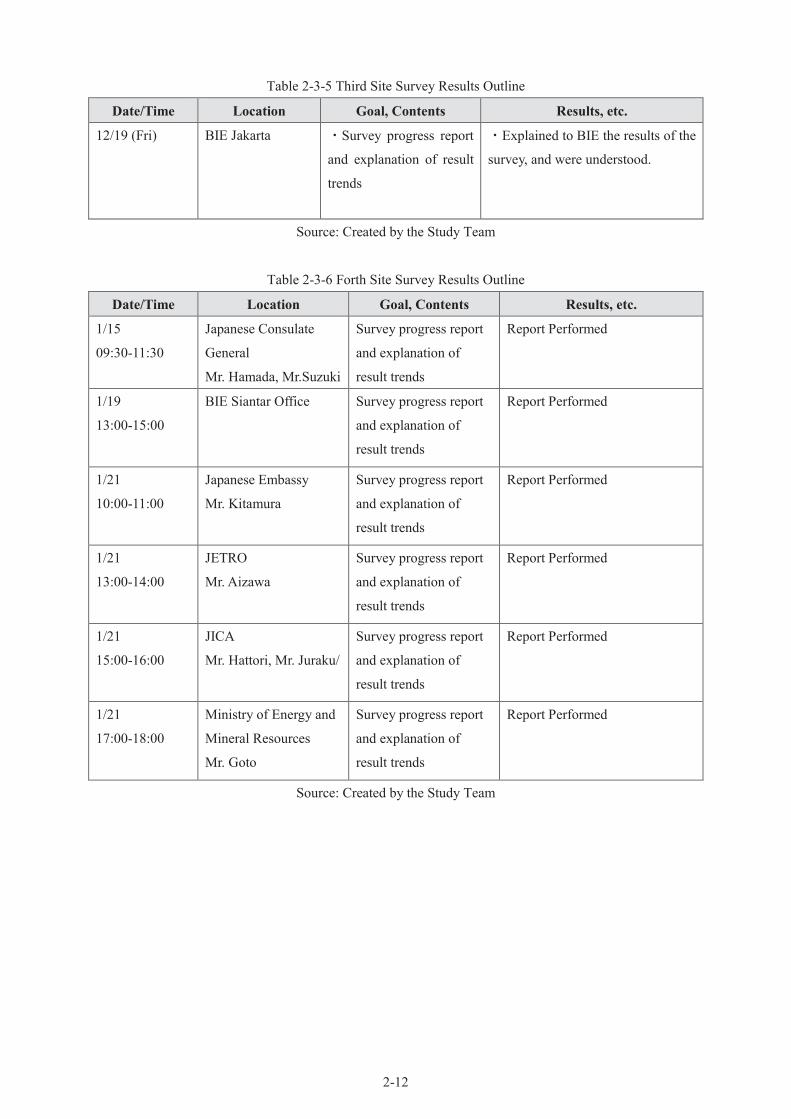
2-12
Table 2-3-5 Third Site Survey Results Outline
Date/Time Location Goal, Contents Results, etc.
12/19 (Fri) BIE Jakarta ・Survey progress report
and explanation of result
trends
・Explained to BIE the results of the
survey, and were understood.
Source: Created by the Study Team
Table 2-3-6 Forth Site Survey Results Outline
Date/Time Location Goal, Contents Results, etc.
1/15
09:30-11:30
Japanese Consulate
General
Mr. Hamada, Mr.Suzuki
Survey progress report
and explanation of
result trends
Report Performed
1/19
13:00-15:00
BIE Siantar Office Survey progress report
and explanation of
result trends
Report Performed
1/21
10:00-11:00
Japanese Embassy
Mr. Kitamura
Survey progress report
and explanation of
result trends
Report Performed
1/21
13:00-14:00
JETRO
Mr. Aizawa
Survey progress report
and explanation of
result trends
Report Performed
1/21
15:00-16:00
JICA
Mr. Hattori, Mr. Juraku/
Survey progress report
and explanation of
result trends
Report Performed
1/21
17:00-18:00
Ministry of Energy and
Mineral Resources
Mr. Goto
Survey progress report
and explanation of
result trends
Report Performed
Source: Created by the Study Team

Chapter 3 Justification, Objectives and Technical
Feasibility of the Project


3-1
(1) Project Background and Necessity
1) Project Scope
This study reviewed the existing plans for Karai 12 mini-hydro power development at the Pulung River in
Simalungun, North Sumatra, and compared alternative plans to divert the upper-stream portion of the Pulung
River to the adjacent Sigambur and Karai Rivers, strengthening the output of the Karai 13 power generation
facility as well as the Karai 7 facility still under construction. The location of the project is shown in Figure
3-1-1.
As figures 3-1-2 and 3-1-3 show, the plan for Karai 12 situates it downstream from the diverted rivers,
meaning that both solutions cannot coexist. As such, this survey will evaluate the techniques necessary, the
environmental impact, and the economics of each plan and determine which plan is most feasible for this
project.
In this report, the plans under consideration shall be classified as Project Plan 1 and Project Plan 2, as below.
- Project Plan 1: Development of new Karai 12 power plant.
- Project Plan 2: Power uprating of Karai 7 as well as Karai 13 via river diversion.
Fig. 3-1-1 Project Location
Sumatra Island
Medan
North Sumatra Province
Source: Created by the Study Team

3-2
Fig. 3-1-2 Project Plan 1 Summary
Source: Created by the Study Team
Fig. 3-1-3 Project Plan 2 Summary
Source: Created by the Study Team
Karai13 Powerplant
(Existing)
Karai7 Powerplant (Existing)
Puling River
Sigambur River
Karai River
Plan 1 Construction of new
Karai 12 Powerplant
Karai12 Powerplant (New construction)
Ⓖ
Plan 2
Power uprating of existing
Karai13 and Karai7 Powerplant
Pulung River Sigambur River
Karai13 Powerplant (Power uprating)
Karai7 Powerplant (Power uprating)
Pulung River Waterway
Sigambur River Waterway
Ⓖ
Ⓖ
Karai River
Ⓖ
Ⓖ

3-3
2) Supply and Demand for Project’s Core Products and Services
The power generated by this project will be sold primarily to PLN. At first the Indonesian government
planned to enact the “Fast Track Program,” which involved only the establishment of new coal-fired power
plants. However, in recent years, with the increase of environmental awareness, as well as large delays in
development and construction have caused them to reconsider their coal-centered stance. The new, second
Fast-Track Program (FTP-2) has been established, which considers the aggressive use of not just PLN, but
also Independent Power Producers (IPP) as well. This second Fast-Track Program incorporates renewable
energies such as mini-hydro power, and aims to quadruple the current power generation capacity to
18,100MW by 2030. The same program, while beginning the development of 1,204MW of hydroelectric
power generation, has introduced the FIT system, a long term fixed-price contract for selling power to PLN,
to which mini-hydro power projects are also subject.
The Ministry of Energy and Mineral Resources announced the new FIT (Feed-in Tariff) system for
mini-hydro power projects in May 2014. According to this plan, the selling price to PLN will be
IDR1,182.5/kWh from the commencement of power generation on the island of Sumatra for a period of 8
years, with the price dropping to IDR750/kWh from year 9 onward. The initial selling price is significantly
higher than the current selling price of IDR787/kWh. It can be said that this is another factor driving the
government to eagerly promote mini-hydro power, which can be used as a base supply.
The 2,002ha special economic area of Sei Mangkei, scheduled to be completed in February 2015, lies in
Simalungun, the target of this survey. Currently, Indonesia’s state-run business PTPN (palm oil) as well as
foreign capital group Unilever have been attracted to the area, but more foreign capital groups are expected
to be drawn to the area, creating demand for an estimated 40MW.
3) Current Situation Analysis, Future Predictions (Including Demand Predictions), and Potential Problems if
Project is not Executed
a) Current Situation Analysis
Indonesia’s population is estimated at over 247 million people, or roughly double that of Japan. It is the
fourth largest population, behind only China, India, and the United States, with an average of 28.9; those
under 30 make up half of the population—a large business market. There is a continuing trend of steady
population increase, and in the ten years from 2010-2020 there is a projected growth of 30 million people.
The population is estimated to increase to 300 million people by 2050.
Furthermore, the economic growth rate of 3.6% in 2001 has ballooned to 5.5~6% in the years since
2005, and even after the effects of the financial and economic crisis of 2009, retains a comparatively
high 4.6% growth rate. In 2011 it was 6.5%; in 2012 it was 6.3% with bullish market growth. 2013 saw
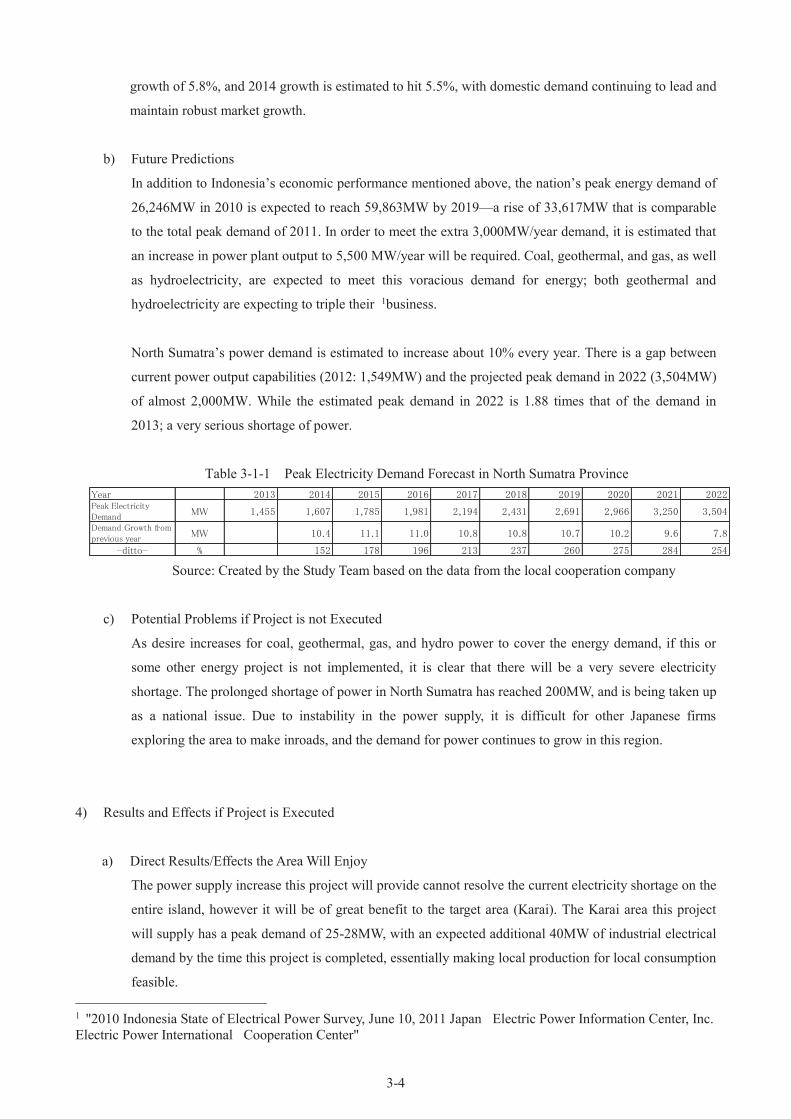
3-4
growth of 5.8%, and 2014 growth is estimated to hit 5.5%, with domestic demand continuing to lead and
maintain robust market growth.
b) Future Predictions
In addition to Indonesia’s economic performance mentioned above, the nation’s peak energy demand of
26,246MW in 2010 is expected to reach 59,863MW by 2019—a rise of 33,617MW that is comparable
to the total peak demand of 2011. In order to meet the extra 3,000MW/year demand, it is estimated that
an increase in power plant output to 5,500 MW/year will be required. Coal, geothermal, and gas, as well
as hydroelectricity, are expected to meet this voracious demand for energy; both geothermal and
hydroelectricity are expecting to triple their 1business.
North Sumatra’s power demand is estimated to increase about 10% every year. There is a gap between
current power output capabilities (2012: 1,549MW) and the projected peak demand in 2022 (3,504MW)
of almost 2,000MW. While the estimated peak demand in 2022 is 1.88 times that of the demand in
2013; a very serious shortage of power.
Table 3-1-1 Peak Electricity Demand Forecast in North Sumatra Province
Year 2013 2014 2015 2016 2017 2018 2019 2020 2021 2022Peak ElectricityDemand
MW 1,455 1,607 1,785 1,981 2,194 2,431 2,691 2,966 3,250 3,504
Demand Growth fromprevious year
MW 10.4 11.1 11.0 10.8 10.8 10.7 10.2 9.6 7.8
-ditto- % 152 178 196 213 237 260 275 284 254
Source: Created by the Study Team based on the data from the local cooperation company
c) Potential Problems if Project is not Executed
As desire increases for coal, geothermal, gas, and hydro power to cover the energy demand, if this or
some other energy project is not implemented, it is clear that there will be a very severe electricity
shortage. The prolonged shortage of power in North Sumatra has reached 200MW, and is being taken up
as a national issue. Due to instability in the power supply, it is difficult for other Japanese firms
exploring the area to make inroads, and the demand for power continues to grow in this region.
4) Results and Effects if Project is Executed
a) Direct Results/Effects the Area Will Enjoy
The power supply increase this project will provide cannot resolve the current electricity shortage on the
entire island, however it will be of great benefit to the target area (Karai). The Karai area this project
will supply has a peak demand of 25-28MW, with an expected additional 40MW of industrial electrical
demand by the time this project is completed, essentially making local production for local consumption
feasible.
1 "2010 Indonesia State of Electrical Power Survey, June 10, 2011 Japan Electric Power Information Center, Inc.
Electric Power International Cooperation Center"

3-5
In an area with such stringent supply and demand issues, the construction and management of power
equipment is one of the most important issues, and a project that builds the foundation for any and all
economic activity. Creating a reliable supply of electricity helps attract foreign businesses, and
construction and O&M involved in this project will not only create jobs, but contribute to the area’s
economic development.
b) Environmental Improvements
Contribution to the fight against Climate Change: As a green renewable energy source,
hydroelectricity’s generation process emits no CO2, making it an effective countermeasure against
climate change and other global problems.
Hydroelectricity is infinitely renewable and entirely domestically produced. It contributes to energy risk
management by guaranteeing the nation a minimum supply in emergency situations. It is also one part
of a comprehensive, long-term energy policy that can promote the introduction and development of
fossil-fuel alternatives.
c) Benefits for Japanese Companies
North Sumatra is blessed with woodland resources, and the palm oil, natural gum, coffee, and other
products at the center of the plantation business are also the focus of exports as well. At the heart of the
manufacturing industry lie cooking oils, feed, and several gum products, all of which make this area
vital to the progress of Japanese businesses.
With the stable supply of power this project plans to provide, the North Sumatra region can contribute to
the advancement of Japanese businesses in a big way. The achievements and successful operation of
Asahan Aluminum are a prime example of this.
5) Comparison of Proposed Project with Other Options (Alternative Energy Study)
In North Sumatra we have investigated the feasibility of solar, wind, and geothermal as alternative energies,
and weighed the benefits of each against those of this project. The result was that either of the plans
presented here would be more beneficial compared to another source of alternative energy.
The results of each energy comparison are listed below.
a) Solar Power
According to ETC Energy, North Sumatra receives approximately 4.5-5.0 kWh/m2 worth of sunlight per
day (Figure 3-1-4).

3-6
Fig. 3-1-4 Average Amount of Insolation in Indonesia
Source: ETC Energy
Since the output of solar cells (kW) is calculated by multiplying together the conversion efficiency of
the cells, the area of the cells (m2), and the amount of sunlight on a typical day (kW/ m2), if we set the
conversion efficiency arbitrarily at 10% the amount Q of electricity generated in a day is
Q(kWh/m2)=0.1×1×5.0≒0.5(kWh/m2)
The estimated yearly output increase for Plan 1 of this project is 66,030×103kWh/y, while that of Plan 2
Case 1 is 13,033×103kWh/y and Case 2 is 50,374×103kWh/y. The Case 1 of Plan 2 of this project means
increasing generating annual energy without additional power plant construction, thus this case does not
include comparative study with solar power.
By comparison, if the same amount were to be generated using solar power, you would need an area of
350,000 m2 for Plan 1, and 276,000 m2 for Case 2 (Table 3-1-2). As Sumatra is quite vast, finding a site
would not be a problem. However, solar power requires about 1.21 billion JPY worth of construction for
every 2,000 kW (Table 3-1-3); the construction cost of each plan’s output increase as generated by solar
power is shown in Table 3-1-2.
As the result of the cost comparative study, the cost of solar panels for Case 2 of Plan 2 far exceeds the
construction cost of mini hydro power project even the cost of this case is lower than another case,
whereas the construction cost for solar power jumps up to roughly 3.4 billion JPY from the cost for
small hydro power of 2.2 billion JPY.
According to the above, each plan in this project is more beneficial than solar power.

3-7
Table 3-1-2 Current Project and Solar Power Comparison
Study Plan Plan 1 Plan 2
Study Case Case 2
Output Increased kW 9,000 5,700
Generating Energy Increased peryear ×103kWh/y 64,030 50,374
Generating Energy Increased perday
kWh/day 175,000 138,000
Construction Cost JPY 1,562,849,200 2,238,495,100
Necessary Area for Solar Panel m2 350,000 276,000
Construction Cost of Solar Power JPY 5,445,000,000 3,448,500,000*Output increased in Case 1 is created from
the generating energy increased.
Source: Created by the Study Team
Table 3-1-3 Solar Power (2,000kW) Project Estimated Cost Conditions
Projected Items Projected Costs Base Calculations
Init
ial
Inves
tmen
ts Equipment (Solar Panels) 780,000,000 JPY 390×103JPY/kW×2,000kW
Equipment (Other) 280,000,000 JPY 140×103JPY /kW×2,000kW
Facility Construction 154,000,000 JPY 77×103JPY /kW×2,000kW
Total 1,210,000,000
(1.21 billion JPY) ―
Source: Created by the Study Team based on data from the Ministry of the Environment
b) Wind Power
Medan, located in the northern part of Sumatra, has an average wind speed of 2.5 m/s (Table 3-1-4). As
wind power generally requires average wind speeds of more than 6 m/s, this area cannot achieve wind
speeds great enough for the generation of electricity, and is therefore not suitable for wind power.
Table 3-1-4 Average Yearly Wind Speed in Medan
Anuual Jan Feb Mar Apr May Jun Jul Aug Sep Oct Nov Dec
km/h 9 8 12 9 9 9 9 9 9 9 9 8 8m/s 2.5 2.2 3.3 2.5 2.5 2.5 2.5 2.5 2.5 2.5 2.5 2.2 2.2
Source: Created by the Study Team based on data from Weatherbase
c) Geothermal Power
Indonesia boasts the second largest geothermal resources in the world, with the potential to generate
roughly 27,790MW~28,500MW (Figure 3-1-5). Sumatra itself boasts geothermal resources of roughly
12,778 MW (Table 3-1-5), so there is plenty of geothermal potential in the region.

3-8
Fig. 3-1-5 Indonesia’s Geothermal Potential
Source: “Geothermal Roadmap” (2011, IEA)
Table 3-1-5 Geothermal Potential of Each Island
Speculative Hydrothetical Possible Probable Rroven
1 Sumatera 90 3,089 2,427 6,867 15 380 12,778
2 Java 71 1,710 1,826 3,708 658 1,815 9,717
3Bali-Nusa
Tenggara28 360 417 1,013 0 15 1,805
4 Kalimantan 12 145 0 0 0 0 145
5 Sulawesi 65 1,323 119 1,374 150 78 3,044
6 Maluku 30 545 97 429 0 0 1,071
7 Papua 3 75 0 0 0 0 75
Total 299 7,247 4,886 13,391 823 2,288 28,635
TotalNo IslandNumber of
Location
Potential Energy (Mwe)
Resources Reserve
Source: Created by the Study team based on MEMR data (2012)
According to the NEDO 2nd Edition Renewable Energy Technology White Paper (2014), geothermal
power construction costs for flash-steam plants are generally 2,000~4,000 USD/kW. The construction
cost of each plan’s output increase as generated by geothermal power is shown in Table 3-1-6 below.

3-9
Table 3-1-6 Current Project and Geothermal Power Comparison
Study Plan Plan 1 Plan 2
Study Case Case 2
Output Inceased kW 9,000 5,700
Construction Cost JPY 1,562,849,200 2,238,495,100
Construction Cost of GeothermalPower (Upper Limit)
USD 36,000,000 22,800,000
Construction Cost of GeothermalPower (Lower Limit)
USD 18,000,000 11,400,000
Construction Cost of GeothermalPower (Upper Limit)
JPY 4,248,000,000 2,690,400,000
Construction Cost of GeothermalPower (Lower Limit)
JPY 2,124,000,000 1,345,200,000
*Output increased in Case 1 is created from
the generating energy increased.
Source: Created by the Study Team
These costs exceed the construction costs of Plan 1, but are equal to or lower than the cost of Plan 2
Case 2, and overall lower than Plan 2 Case 1.
However, the lead time on the development of geothermal power is typically 10 years or more, and
requires large sums of money for the drilling of several bore holes during the exploratory phase. This is
creating a lot of discussion about the big risks of geothermal power. As a result, all plans included in the
current project provide more benefits than geothermal power.

3-10
(2) Increased Rate of Energy Consumption and Rationalization
We believe it is possible to promote smarter, faster energy use in Indonesia through the increased use of renewable
energy and the decreased use of fossil fuels.
Indonesia is a major power in energy exports and is more than 100% self-sufficient, with its abundance of oil, coal,
natural gas and other fossil fuels. However, oil production (both crude and refined) is declining, and
transportation-related consumption of petroleum products is up; as of 2004 oil imports exceeded oil exports
(Daiwa Institute’s Daiwa Institute of Research Survey, Summer 2011 Vol. 3).
Indonesia is blessed with renewable energy sources; with 75,670MW of hydroelectric and 27,510MW of
geothermal power. Combined, they can supply about 5 times the entire country’s peak demand, however their
introduction into the market has been slow: just 4,200MW of hydroelectric and 1,050MW of geothermal are being
ineffectively used (Table 3-2-1).
By developing and expanding the use of abundant hydroelectric and geothermal renewable energy we can reduce
the amount of fossil fuels brought into the market, saving it for transportation or manufacturing petroleum
products, which is tied to reducing oil imports, thus easing the nation’s burden. Further, through the continual use
of hydroelectric and geothermal energy, we can reduce the amount of fossil fuels—which we worry will run
dry—on the market, ensuring that fossil fuels can be used effectively around the world in the future.
We believe the development and expansion of renewable energy described above is directly linked to increased, as
well as rationalized, energy consumption.
Considering increased and rationalized consumption from a local perspective, mini-hydro power is a perfect fit,
since it is locally produced and consumed. Converting local kinetic energy into electricity and distributing it over
existing networks for consumption is makes technical and economic sense, and this project fulfills that vision.
Table 3-2-1 Renewable Energy Resources and Amount Introduced to Market (2011)
Resources (MW) Introduced to Market(MW)
Hydroelectric 75,000 6,848
Geothermal 28,635 1,341
Mini-hydro
power 500 86.1
Biomass 49,810 445
Solar 4.80 (kW/m2/day) 12.1
Wind 9,290 1.1
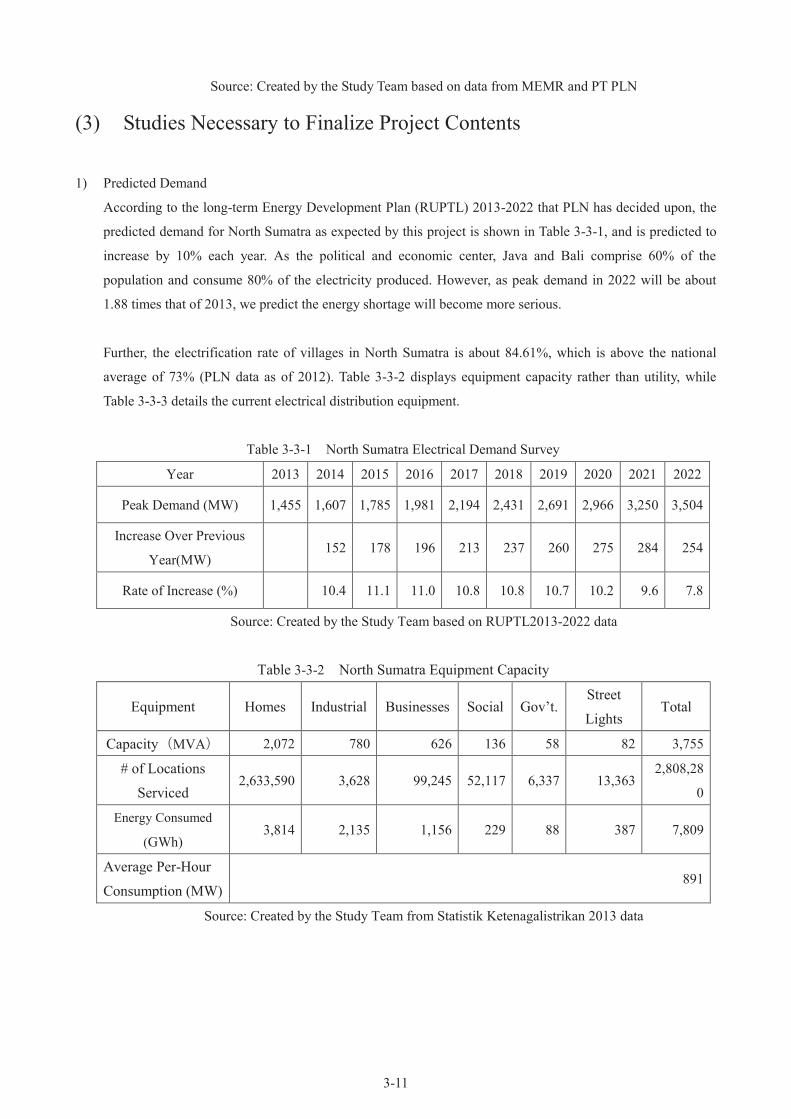
3-11
Source: Created by the Study Team based on data from MEMR and PT PLN
(3) Studies Necessary to Finalize Project Contents
1) Predicted Demand
According to the long-term Energy Development Plan (RUPTL) 2013-2022 that PLN has decided upon, the
predicted demand for North Sumatra as expected by this project is shown in Table 3-3-1, and is predicted to
increase by 10% each year. As the political and economic center, Java and Bali comprise 60% of the
population and consume 80% of the electricity produced. However, as peak demand in 2022 will be about
1.88 times that of 2013, we predict the energy shortage will become more serious.
Further, the electrification rate of villages in North Sumatra is about 84.61%, which is above the national
average of 73% (PLN data as of 2012). Table 3-3-2 displays equipment capacity rather than utility, while
Table 3-3-3 details the current electrical distribution equipment.
Table 3-3-1 North Sumatra Electrical Demand Survey
Year 2013 2014 2015 2016 2017 2018 2019 2020 2021 2022
Peak Demand (MW) 1,455 1,607 1,785 1,981 2,194 2,431 2,691 2,966 3,250 3,504
Increase Over Previous
Year(MW) 152 178 196 213 237 260 275 284 254
Rate of Increase (%) 10.4 11.1 11.0 10.8 10.8 10.7 10.2 9.6 7.8
Source: Created by the Study Team based on RUPTL2013-2022 data
Table 3-3-2 North Sumatra Equipment Capacity
Equipment Homes Industrial Businesses Social Gov’t. Street
Lights Total
Capacity(MVA) 2,072 780 626 136 58 82 3,755
# of Locations
Serviced 2,633,590 3,628 99,245 52,117 6,337 13,363
2,808,28
0
Energy Consumed
(GWh) 3,814 2,135 1,156 229 88 387 7,809
Average Per-Hour
Consumption (MW) 891
Source: Created by the Study Team from Statistik Ketenagalistrikan 2013 data
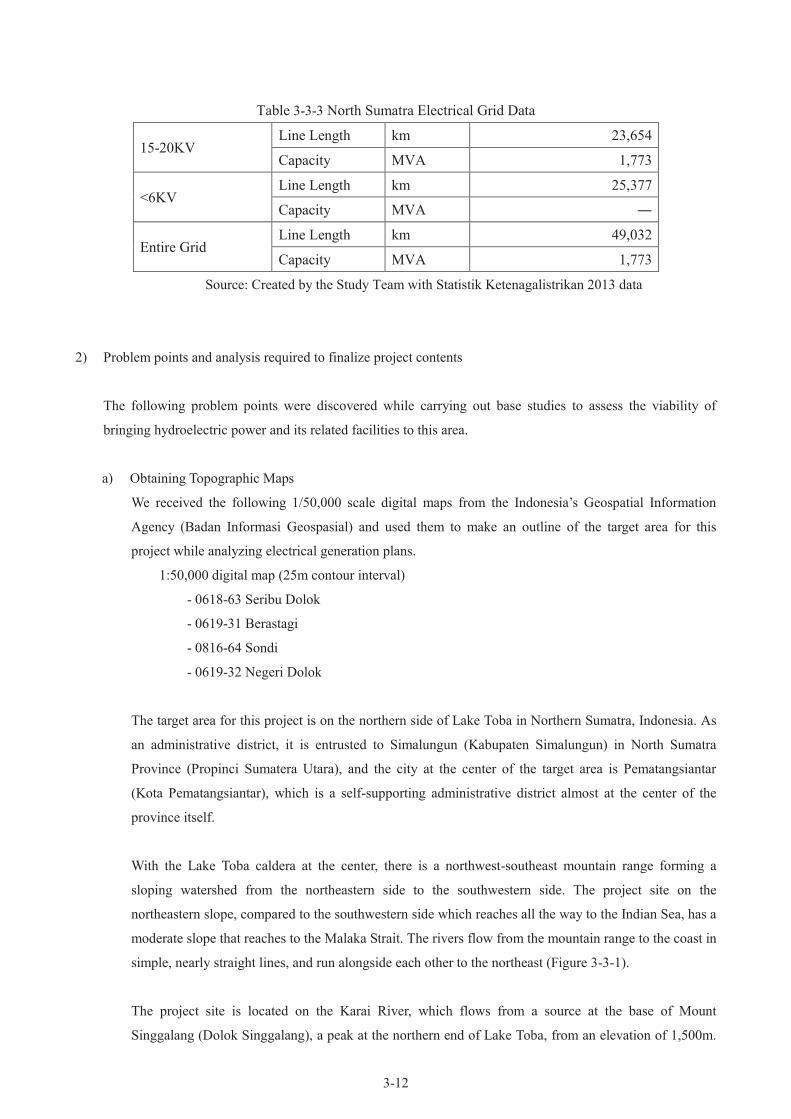
3-12
Table 3-3-3 North Sumatra Electrical Grid Data
15-20KV Line Length km 23,654
Capacity MVA 1,773
<6KV Line Length km 25,377
Capacity MVA ―
Entire Grid Line Length km 49,032
Capacity MVA 1,773
Source: Created by the Study Team with Statistik Ketenagalistrikan 2013 data
2) Problem points and analysis required to finalize project contents
The following problem points were discovered while carrying out base studies to assess the viability of
bringing hydroelectric power and its related facilities to this area.
a) Obtaining Topographic Maps
We received the following 1/50,000 scale digital maps from the Indonesia’s Geospatial Information
Agency (Badan Informasi Geospasial) and used them to make an outline of the target area for this
project while analyzing electrical generation plans.
1:50,000 digital map (25m contour interval)
- 0618-63 Seribu Dolok
- 0619-31 Berastagi
- 0816-64 Sondi
- 0619-32 Negeri Dolok
The target area for this project is on the northern side of Lake Toba in Northern Sumatra, Indonesia. As
an administrative district, it is entrusted to Simalungun (Kabupaten Simalungun) in North Sumatra
Province (Propinci Sumatera Utara), and the city at the center of the target area is Pematangsiantar
(Kota Pematangsiantar), which is a self-supporting administrative district almost at the center of the
province itself.
With the Lake Toba caldera at the center, there is a northwest-southeast mountain range forming a
sloping watershed from the northeastern side to the southwestern side. The project site on the
northeastern slope, compared to the southwestern side which reaches all the way to the Indian Sea, has a
moderate slope that reaches to the Malaka Strait. The rivers flow from the mountain range to the coast in
simple, nearly straight lines, and run alongside each other to the northeast (Figure 3-3-1).
The project site is located on the Karai River, which flows from a source at the base of Mount
Singgalang (Dolok Singgalang), a peak at the northern end of Lake Toba, from an elevation of 1,500m.

3-13
It gathers several tributaries as it flows downstream about 25km to the northeast, where it reaches the
project site. Roughly 15km beyond that, there is a steep average river grade of 1/30 and below; further
downstream there is a gentle, 1/500~1/1,000 grade and above as it reaches the Malaka Strait. The entire
river is approximately 100km long.
Fig. 3-3-1 Project Area Topographical Map
Source: 1:250,000 scale topographic map published by Badan Informasi Geospasial
b) Geological Survey
b-1) Summary of Topography and Geology
The project site is located along Karai River about 60km south of Medan North Sumatra. Shirasu2
plateaus, which are formed due to geological characteristics of this area, occur at the site. There are
steep slopes along the rivers due to deepening erosion. These rivers erode the plateaus resembling a
dendrite and flow generally from south-west to north-east by merging each other.
Figure 3-3-2 Geological Map around the Site shows geological map of the site area referring from the
Geology of the Medan. As shown in the geological map, Shirasu formed in Quaternary period
Pleistocene epoch covers widely the site. The base geology of the site is volcanic rocks3 (andesite,
2 The tuff at the site is called “Shirasu” in this report because it is very similar to Shirasu which is volcanic eruption
projects from Aira Caldera and is distributed widely south Kyushu Japan. 3 The rocks which is made as magna is spewed out on ground surface, rapidly cooled and harden; lava.
3-14
dacite, rhyolite, etc.) and pyroclastic rocks4 (tuff, tuff breccia, etc.) formed in Neogene period
Pliocene epoch. The geology of the area is summarized as follows:
[Geological Classification]
Geological Division for this site reconnaissance is done referring to the existing geological map
shown in Figure 3-2-2 Geological Map around the Site.
■ TUFA TOBA (Qvt)
TUFA TOBA consists of the eruption products (dacitic tuff) from world largest Toba Caldera, and is
dominant in this area. Shirasu is mainly nonwelded pyroclastic flow deposits (partially fall deposits).
Secondary Shirasu Deposit, which is made by erosion and transportation of originally deposited
Shirasu, is composed of fine to medium tuffaceous sand.
■ SATUAN TAKUR-TAKUR (QTvk)
SATUAN TAKUR-TAKUR consists of andesitic to dacitic pyroclastic rocks which is Neogene
Pliocene eruption products of the volcano located west of the site. SATUAN TAKUR-TAKUR is
thickly covered by Shirasu and only observed at the bottom of the some riverbeds.
At the site, andesitic to dacitic Welded tuff with various welding degrees occur along riverbeds and
the bottom of the excavation of the construction sites. Generally weakly welded parts are classified
into D Class Rock and strongly welded parts are classified into CL to CM Class Rock.
■ SATUAN SIMBOLON (QTvs)
SATUAN SIMBOLON consists of mainly andesitic lava with partially pyroclastic rocks both of
which are eruption products of the volcano at east of the site. As similar to SATUAN
TAKUR-TAKUR, SATUAN SIMBOLON is thickly covered by Shirasu and cannot be confirmed
on the ground surface. Within the study area, rhyolite lava is observed partially near Karai 7.
However, distribution of SATUAN SIMBOLON lava is very limited as a part of SATUAN
TAKUR-TAKUR pyroclastic rocks. Furthermore the characteristics of those two types of rocks do
not show large differences. Thus, those rocks are classified into SATUAN TAKUR-TAKUR in this
report.
4 Volcanoclastic materials which includes tuff, pumice, tuff with volcanic bombs, lava that includes surrounding
sediments eroded by lava flow.
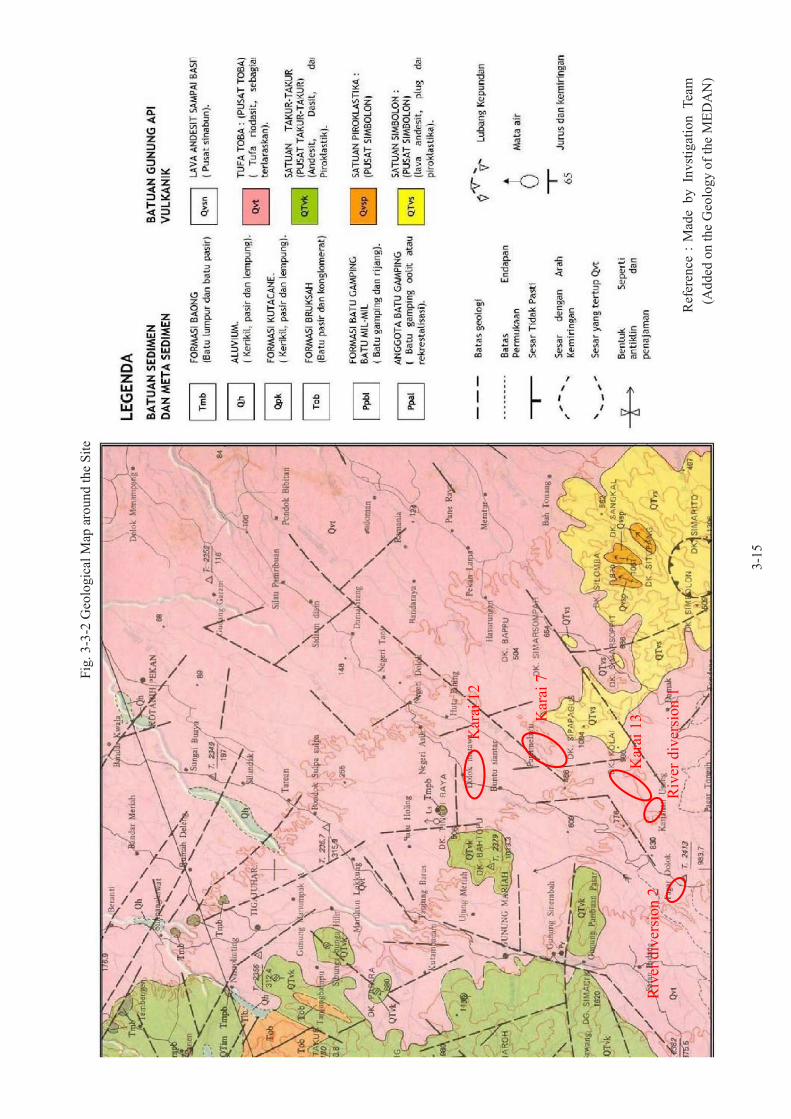
3-1
5
Fig
. 3-3
-2 G
eolo
gic
al M
ap a
round t
he
Sit
e
Ref
eren
ce:
Mad
e b
y
Invst
igat
ion
T
eam
(A
dded
on t
he
Geo
log
y o
f th
e M
ED
AN
)
Kar
ai 1
2
Kar
ai 1
3
Riv
er d
iver
sion
1
Riv
er d
iver
sion
2
Kar
ai 7
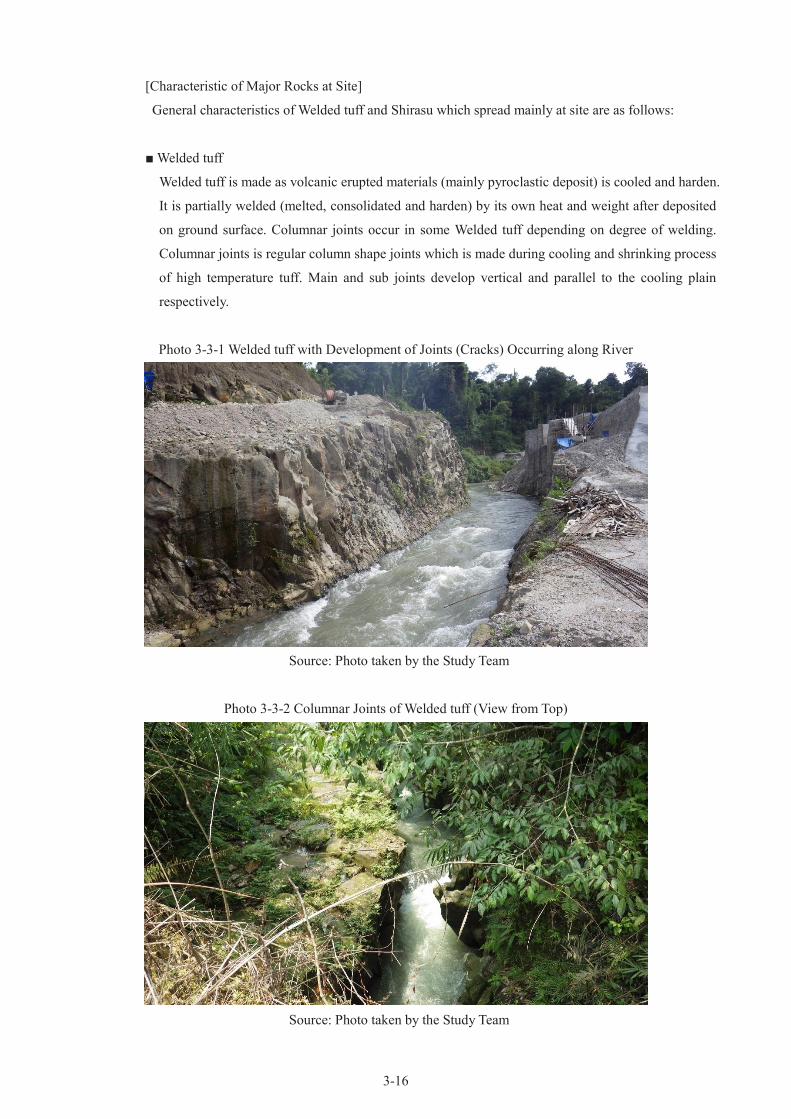
3-16
[Characteristic of Major Rocks at Site]
General characteristics of Welded tuff and Shirasu which spread mainly at site are as follows:
■ Welded tuff
Welded tuff is made as volcanic erupted materials (mainly pyroclastic deposit) is cooled and harden.
It is partially welded (melted, consolidated and harden) by its own heat and weight after deposited
on ground surface. Columnar joints occur in some Welded tuff depending on degree of welding.
Columnar joints is regular column shape joints which is made during cooling and shrinking process
of high temperature tuff. Main and sub joints develop vertical and parallel to the cooling plain
respectively.
Photo 3-3-1 Welded tuff with Development of Joints (Cracks) Occurring along River
Source: Photo taken by the Study Team
Photo 3-3-2 Columnar Joints of Welded tuff (View from Top)
Source: Photo taken by the Study Team
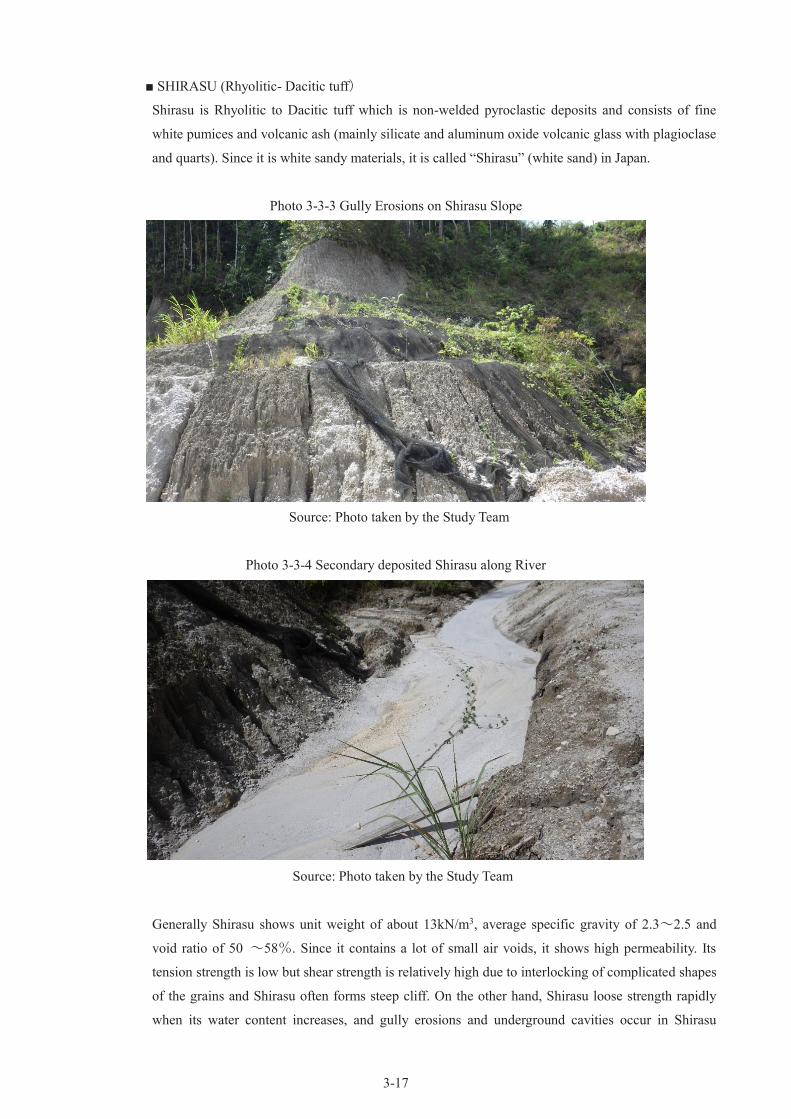
3-17
■ SHIRASU (Rhyolitic- Dacitic tuff)
Shirasu is Rhyolitic to Dacitic tuff which is non-welded pyroclastic deposits and consists of fine
white pumices and volcanic ash (mainly silicate and aluminum oxide volcanic glass with plagioclase
and quarts). Since it is white sandy materials, it is called “Shirasu” (white sand) in Japan.
Photo 3-3-3 Gully Erosions on Shirasu Slope
Source: Photo taken by the Study Team
Photo 3-3-4 Secondary deposited Shirasu along River
Source: Photo taken by the Study Team
Generally Shirasu shows unit weight of about 13kN/m3, average specific gravity of 2.3~2.5 and
void ratio of 50 ~58%. Since it contains a lot of small air voids, it shows high permeability. Its
tension strength is low but shear strength is relatively high due to interlocking of complicated shapes
of the grains and Shirasu often forms steep cliff. On the other hand, Shirasu loose strength rapidly
when its water content increases, and gully erosions and underground cavities occur in Shirasu

3-18
ground. Furthermore, Secondary Shirasu, which is formed as deposits of eroded Shirasu, is
composed of low strength fine sand.
Due to those characteristics mentioned above, flat plateaus with bluffs due to river erosion are often
formed in Shirasu area. Since Shirasu contains glass and quarts, it is used as abrasive.
b-2) Site Reconnaissance
[Reconnaissance Method]
Site Reconnaissance is carried out around Plan 1 (Karai 12) and Plan 2 (Karai 7, Karai 13, River
diversion 1, River diversion 2) by using topographic map of PETA RUPABUMI INDONESIA
1:50,000 as shown in Figure 3-3-3 Site Reconnaissance Records and Locations of Photographs in
order to understand general geological characteristics of the site.
During geological inspections of the outcrops, geology (lithology); strength; discontinuities such as
cracks and joints; fault; alteration zone and seepage are carried out. For natural slopes, unstable
slopes including landslide, failure topography, and steep slopes; surface deposits; geology
(lithology); geological structures and seepages are inspected. The records includes photographs and
sketches.
Site Reconnaissance route is recoded using Handy GPS (parallel 20 channels, sensitivity: less than
159dBm (accuracy of ±10m in ideal conditions).
[Site Reconnaissance Schedule]
Table 3-3-4 shows Site Reconnaissance Schedule.
Table 3-3-4 Site Reconnaissance Schedule
2014
8-Oct 9-Oct 10-Oct
Karai 7
Karai 12
Karai 13
River diversion 1
River diversion 2
Source: Created by the Study Team
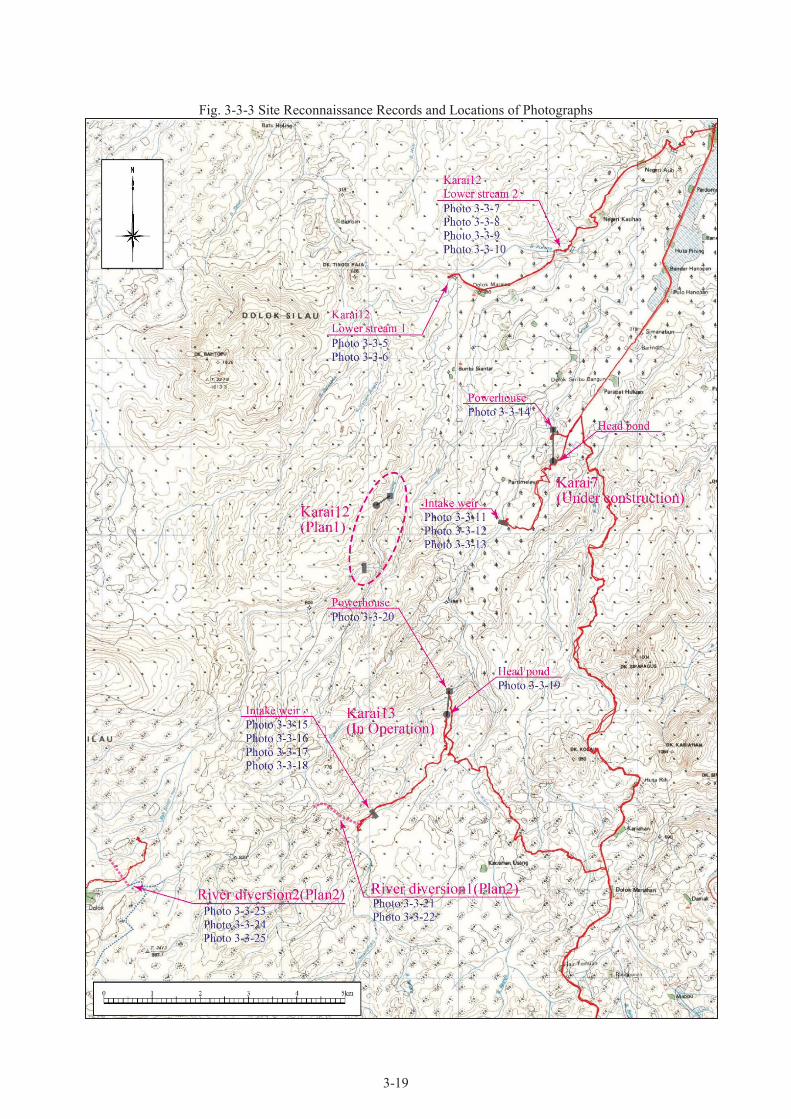
3-19
Fig. 3-3-3 Site Reconnaissance Records and Locations of Photographs

3-20
Source: Created by the Study Team based on PETA RUPABUMI INDONESIA S=1/50,000
[Site Reconnaissance Results]
Results of Site Reconnaissance are summarized as follows;
■ Karai 12
Karai 12 is planned as a new Mini-hydro power plant at lower reach of Pulung River (Plan 1). We
investigate upper and lower streams of the planned site along the road. Schematic profiles of each
location are shown in Figure 3-3-4 Lower Stream 1 Schematic Profile and Figure 3-3-5 Karai 12
Lower Stream 2 Schematic Profile (Topography is surveyed by laser range finder and water depth is
based on information from local people).
・Lower Steam 1
Lower Stream 1 is eroded severely by the river and forms V-shape valley (width of 2 to 5m and
depth of about 9m). Small eroded terrace plains, which develop at geological boundaries, occur as
shown in Photo 3-3-5 and Photo 3-3-6.
The geology at this location consists of thick Shirasu(Qvt)at upper part and Welded tuff (QTvk)
at lower part. Shirasu is classified as D Class Rock mainly composed of white fine pumice and tuff.
Shirasu at this location is solidified and it is difficult to stick the hammer tip into it. Welded tuff is
well welded CL to CM Class Rock with cracks which occur along columnar joints. Theses cracks
occur horizontally and vertically and majority of cracks are closed. Some parts of river walls are
protected by retaining walls, which are considered to be countermeasures for small failures of
Shirasu slopes.
・Lower Stream 2
Lower stream 2, of which elevation is about 50m lower than that of upper stream, forms V-shape
valley continuing from upper stream with gentler gradient (Photo 3-3-7 and Photo 3-3-8). The
geology at this location consists of thick Shirasu(Qvt)at upper part and Welded tuff (QTvk)at
lower part. Shirasu is classified as D Class Rock mainly composed of white fine pumice and tuff
and can be relatively easily broken by the hammer blow. Welded tuff in the lower stream shows
lower welding degree comparing to that of upper stream and is mainly classified into CL Class
Rock. Horizontally and vertically cracks occur in Welded tuff, however they develop less than
those in the upper stream and are mostly closed. Secondary deposited fine to medium Shirasu sand
occur in gentler gradient river bed (Photo 3-3-9 and Photo 3-3-10).

3-21
Figure 3-3-4 Karai 12 Lower Stream 1 Schematic Profile
Source: Created by the Study Team
Figure 3-3-5 Karai 12 Lower Stream 2 Schematic Profile
Source: Created by the Study Team
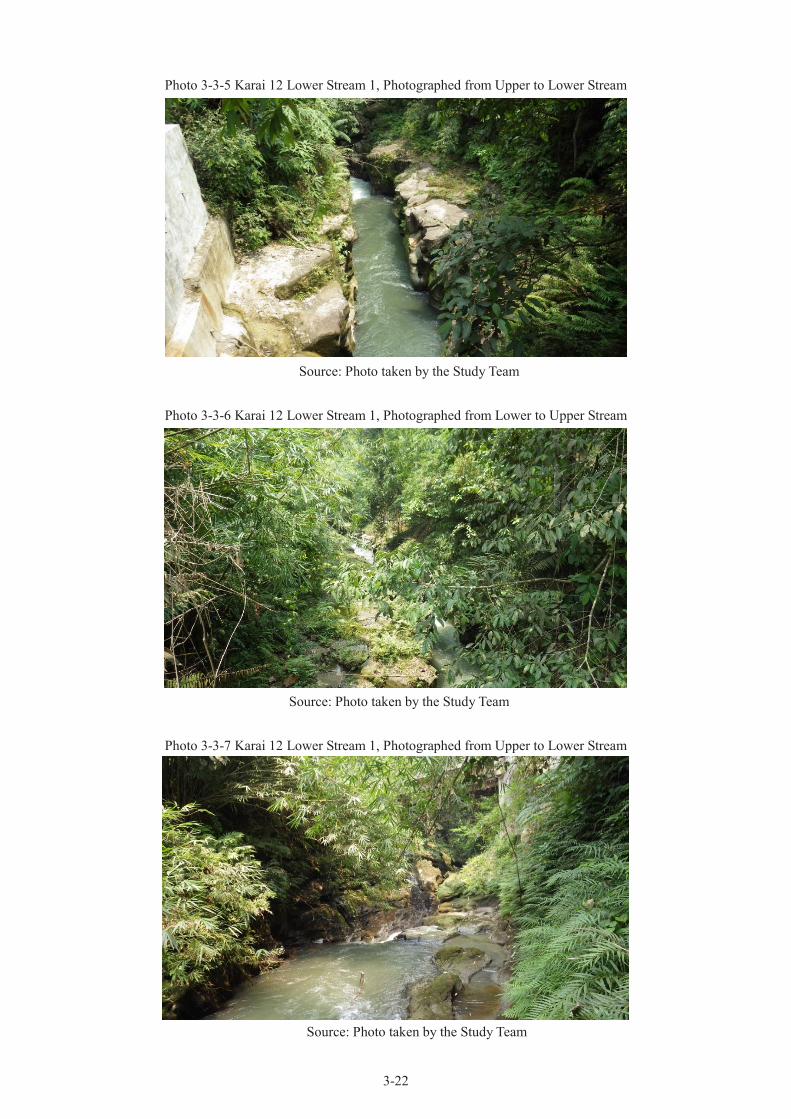
3-22
Photo 3-3-5 Karai 12 Lower Stream 1, Photographed from Upper to Lower Stream
Source: Photo taken by the Study Team
Photo 3-3-6 Karai 12 Lower Stream 1, Photographed from Lower to Upper Stream
Source: Photo taken by the Study Team
Photo 3-3-7 Karai 12 Lower Stream 1, Photographed from Upper to Lower Stream
Source: Photo taken by the Study Team

3-23
Photo 3-3-8 Karai 12 Lower Stream 2, Taken from Lower to Upper Stream (Low Gradient Parts)
Source: Photo taken by the Study Team
Photo 3-3-9 Karai 12 Lower Stream 2 Secondary deposited Shirasu on River Bed
Source: Photo taken by the Study Team
Photo 3-3-10 Karai 12 Lower Stream 2 Secondary deposited Shirasu (Close-up Photo)
Source: Photo taken by the Study Team

3-24
■ Karai 7
Karai 7 is a mini-hydro power plant under construction located along Karai River. Geological and
construction conditions from the intake weir at upper stream to the power house at lower stream are
summarized as follows:
・Intake Weir, Sand trap, Headrace (Photo 3-3-11, Photo 3-3-12, Photo 3-3-13)
The geology at this location consists of thick Shirasu(Qvt)at surface underlain by Welded tuff
(QTvk). Shirasu is classified as D Class Rock composed of brown fine pumice and tuff and can be
easily broken by the hammer blow. Welded tuff is well welded CL to CM Class Rock with cracks due
to columnar joints. These cracks occur horizontally and vertically and are mostly closed.
Volcanic products around Karai 7 consist varying between andesitic and ryolitic, and lava also occurs.
A part of those are considered to be volcanic products (QTvs) originated from east of this location.
Cracky rhyolite lava occurs at the lower parts of slopes at the right bank of the sand trap and
weathering along the joints (onion structure weathering) are developed.
CL to CM Class Rocks occur at the excavation base of dam and sand trap. On the other hand
Shirasu occurs at a wide range of the slopes along open headrace at lower stream of sand trap.
・Headtank, Penstock
Headtank is constructed with stone masonry covered by concrete without reinforcement. The
slopes around the structures are protected by shotcrete and rock bolts, and major defects are not
observed. However, slope failures are observed along the headrace from water storage facility to
power house and the pipe line is damaged by the debris.
・Powerhouse (Photo 3-3-14)
Large excavation (cut slope height of about 20m) is carried out at Power House. Shirasu(Qvt)
occur at the upper part of the cut slope and Welded tuff (QTvk)underlies at lower part of the cut
slope. Welded tuff is mainly composed of non-welded rhyolitic to andesitic pyroclastic deposit and
is classified into D Class Rock. Columnar joints are less developed, however many gully erosions
due to rain and small slope failures occur on the slopes.
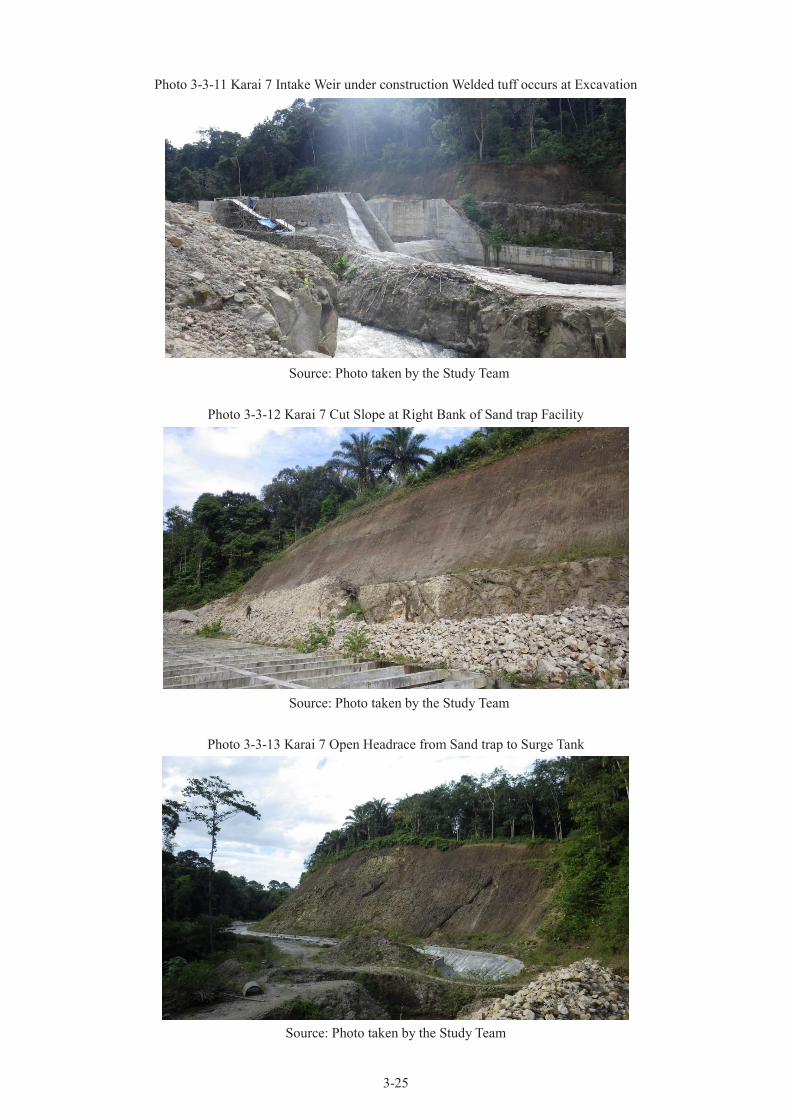
3-25
Photo 3-3-11 Karai 7 Intake Weir under construction Welded tuff occurs at Excavation
Source: Photo taken by the Study Team
Photo 3-3-12 Karai 7 Cut Slope at Right Bank of Sand trap Facility
Source: Photo taken by the Study Team
Photo 3-3-13 Karai 7 Open Headrace from Sand trap to Surge Tank
Source: Photo taken by the Study Team
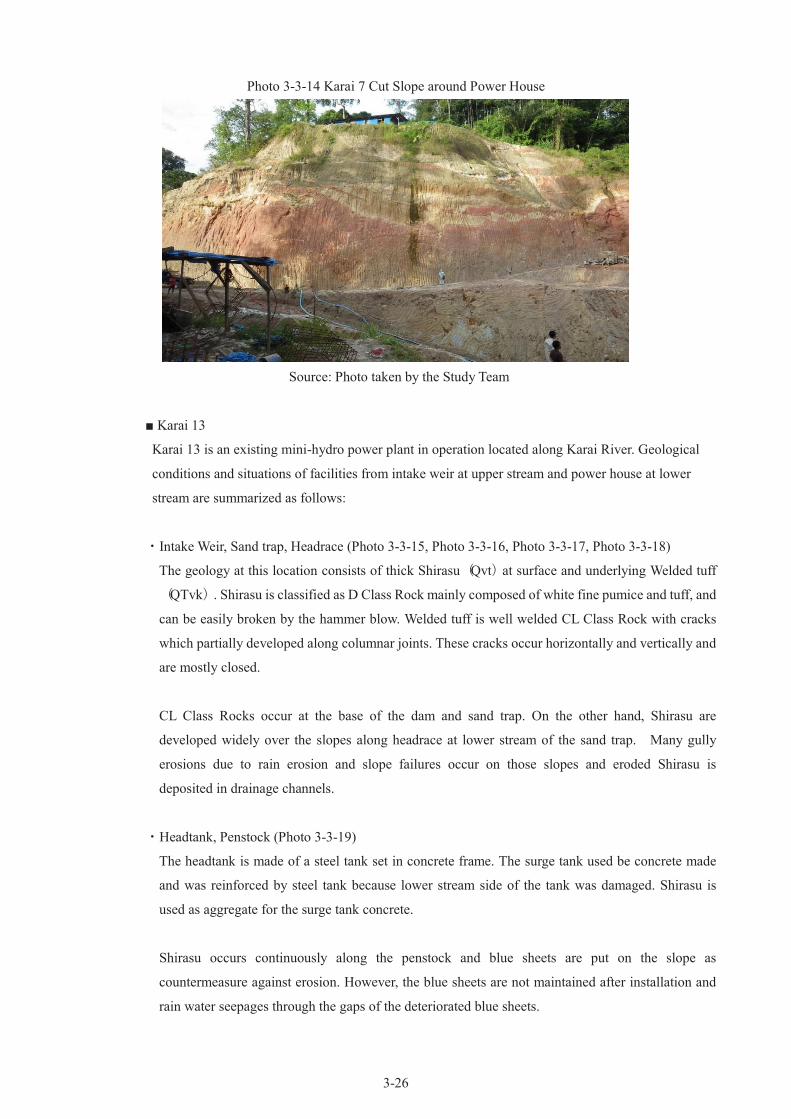
3-26
Photo 3-3-14 Karai 7 Cut Slope around Power House
Source: Photo taken by the Study Team
■ Karai 13
Karai 13 is an existing mini-hydro power plant in operation located along Karai River. Geological
conditions and situations of facilities from intake weir at upper stream and power house at lower
stream are summarized as follows:
・Intake Weir, Sand trap, Headrace (Photo 3-3-15, Photo 3-3-16, Photo 3-3-17, Photo 3-3-18)
The geology at this location consists of thick Shirasu(Qvt)at surface and underlying Welded tuff
(QTvk). Shirasu is classified as D Class Rock mainly composed of white fine pumice and tuff, and
can be easily broken by the hammer blow. Welded tuff is well welded CL Class Rock with cracks
which partially developed along columnar joints. These cracks occur horizontally and vertically and
are mostly closed.
CL Class Rocks occur at the base of the dam and sand trap. On the other hand, Shirasu are
developed widely over the slopes along headrace at lower stream of the sand trap. Many gully
erosions due to rain erosion and slope failures occur on those slopes and eroded Shirasu is
deposited in drainage channels.
・Headtank, Penstock (Photo 3-3-19)
The headtank is made of a steel tank set in concrete frame. The surge tank used be concrete made
and was reinforced by steel tank because lower stream side of the tank was damaged. Shirasu is
used as aggregate for the surge tank concrete.
Shirasu occurs continuously along the penstock and blue sheets are put on the slope as
countermeasure against erosion. However, the blue sheets are not maintained after installation and
rain water seepages through the gaps of the deteriorated blue sheets.

3-27
・Power House (Photo 3-3-20)
Power house is being constructed at flat land along Karai River. Discharged water from the power
house is very muddy, which is probably due to fine grains originated from Shirasu in conveyed
water.
Photo 3-3-15 Karai 13 Intake Weir
Source: Photo taken by the Study Team
Photo 3-3-16 Karai 13 Cut Slope near Intake Weir
Source: Photo taken by the Study Team

3-28
Photo 3-3-17 Karai 13 CL Class Rock at River Bed of Intake Weir
Source: Photo taken by the Study Team
Photo 3-3-18 Karai 13 Headrace with Cover
Source: Photo taken by the Study Team
Photo 3-3-19 Karai 13 Penstock Blue Sheets are deteriorated
Source: Photo taken by the Study Team
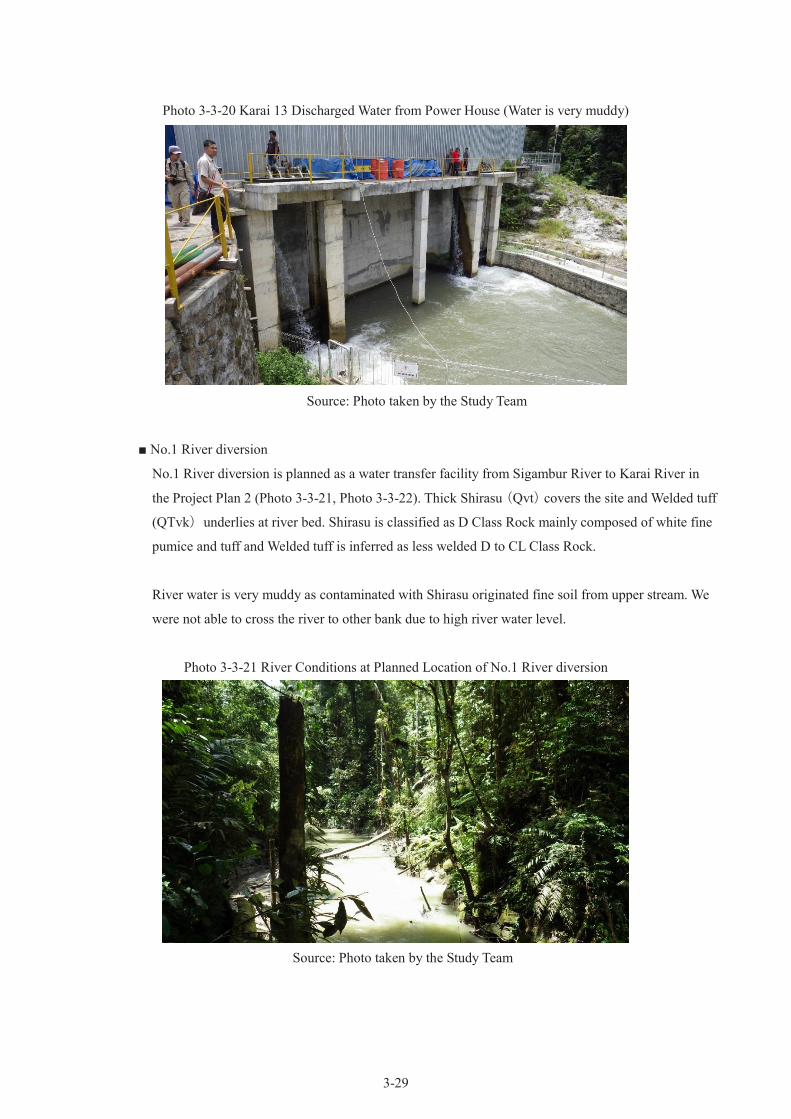
3-29
Photo 3-3-20 Karai 13 Discharged Water from Power House (Water is very muddy)
Source: Photo taken by the Study Team
■ No.1 River diversion
No.1 River diversion is planned as a water transfer facility from Sigambur River to Karai River in
the Project Plan 2 (Photo 3-3-21, Photo 3-3-22). Thick Shirasu(Qvt)covers the site and Welded tuff
(QTvk)underlies at river bed. Shirasu is classified as D Class Rock mainly composed of white fine
pumice and tuff and Welded tuff is inferred as less welded D to CL Class Rock.
River water is very muddy as contaminated with Shirasu originated fine soil from upper stream. We
were not able to cross the river to other bank due to high river water level.
Photo 3-3-21 River Conditions at Planned Location of No.1 River diversion
Source: Photo taken by the Study Team
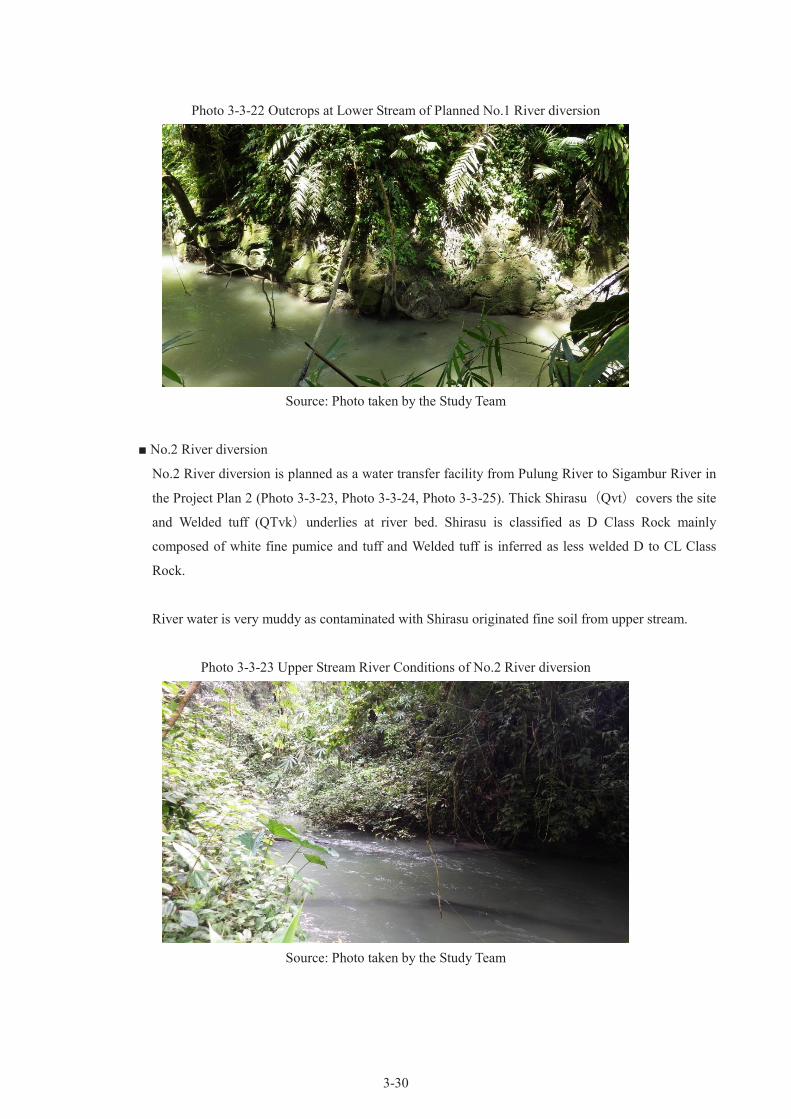
3-30
Photo 3-3-22 Outcrops at Lower Stream of Planned No.1 River diversion
Source: Photo taken by the Study Team
■ No.2 River diversion
No.2 River diversion is planned as a water transfer facility from Pulung River to Sigambur River in
the Project Plan 2 (Photo 3-3-23, Photo 3-3-24, Photo 3-3-25). Thick Shirasu(Qvt)covers the site
and Welded tuff (QTvk)underlies at river bed. Shirasu is classified as D Class Rock mainly
composed of white fine pumice and tuff and Welded tuff is inferred as less welded D to CL Class
Rock.
River water is very muddy as contaminated with Shirasu originated fine soil from upper stream.
Photo 3-3-23 Upper Stream River Conditions of No.2 River diversion
Source: Photo taken by the Study Team
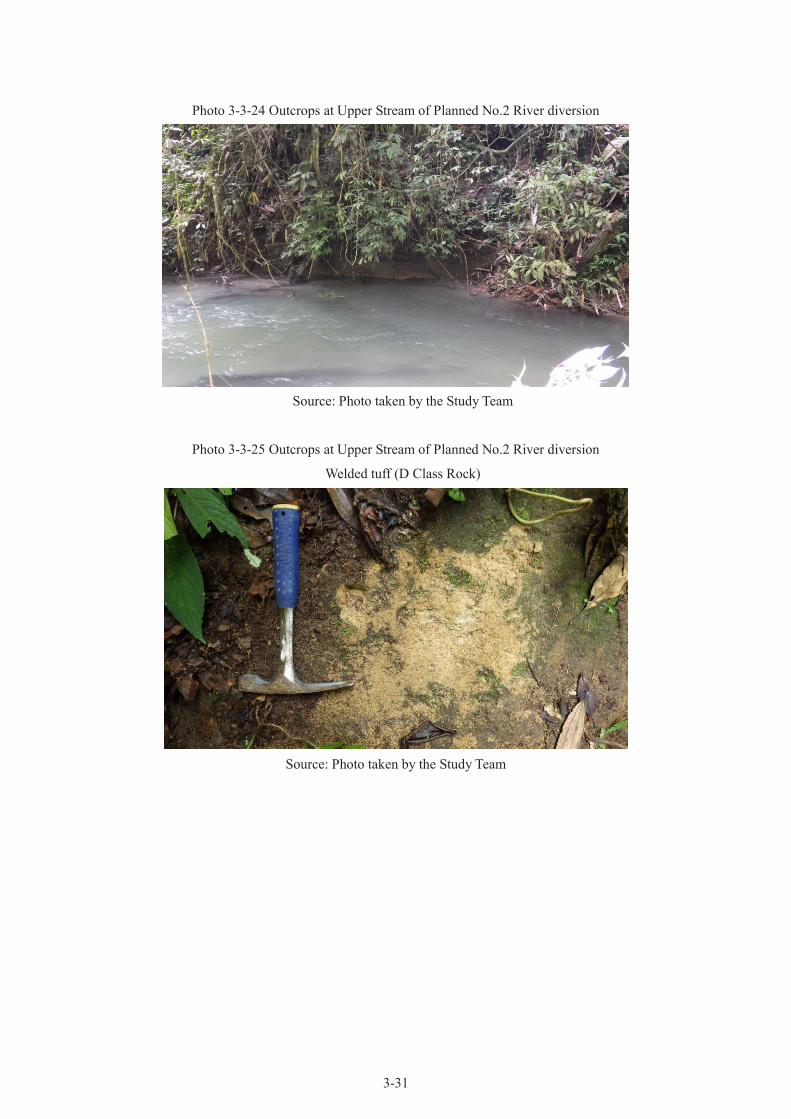
3-31
Photo 3-3-24 Outcrops at Upper Stream of Planned No.2 River diversion
Source: Photo taken by the Study Team
Photo 3-3-25 Outcrops at Upper Stream of Planned No.2 River diversion
Welded tuff (D Class Rock)
Source: Photo taken by the Study Team

3-32
b-3) Comments
[Comments on Design and Construction]
Shirasu and Welded tuff distributed at the site have the following characteristics which often become
problems in design and construction:
① Shirasu is vulnerable to weathering and erosion and the shear strength of secondary deposited
Shirasu is very low.
② Vertical and Horizontal joints (potential cracks) are tend to develop in Welded tuff. These joints
may be potential cause of water leakage at the planned intake weir location.
③ River water is clouded with fine materials (volcanic glasses, pumices and others) originated from
Shirasu. Those fine materials are not settled easily and transferred long distance to lower stream.
Comments on design and construction for Plan 1 and Plan 2 are summarized in the following
sections and Table 3-3-5 shows Summary of Site Reconnaissance Results.

3-33
Tab
le 3
-3-5
Sum
mar
y o
f S
ite
Rec
onnai
ssan
ce R
esu
lts
Pla
n/S
ite
Pla
n 1
P
lan
2
Kar
i 1
2
Pla
n
Kar
ai 7
U
nd
er C
on
stru
ctio
n
Kar
ai 1
3
In O
per
atio
n
Riv
er d
iver
sio
n p
lan
1 &
2
P
lan
Sit
e C
on
dit
ion
s
To
po
gra
ph
y/
Geo
log
y
A
t u
pp
er s
trea
m t
he
river
wid
th i
s n
arro
w (
2
to 5
m)
and
CL
Cla
ss R
ock
is
dis
trib
ute
d.
Lo
wer
str
eam
is
flat
an
d r
iver
wid
th i
s w
ider
(5
to 1
0m
) at
so
me
po
rtio
ns
(lev
el d
iffe
ren
ce
of
up
per
and
lo
wer
str
eam
is
abo
ut
50
m)
S
hir
asu
co
ver
s th
e su
rfac
e. W
eld
ed t
uff
at
river
bed
is
wel
l w
eld
ed a
nd j
oin
ts (
crac
ks)
ar
e d
evel
op
ed.
S
hir
asu
co
ver
s th
e su
rfac
e. C
L t
o
D C
lass
Wel
ded
tu
ff a
s b
ase
rock
o
ccu
rs a
t ri
ver
bed
.
S
hir
asu
occ
urs
on
th
e cu
t sl
op
es
alo
ng h
ead
race
W
eld
ed t
uff
is
wea
kly
wel
ded
and
jo
ints
(cr
acks)
are
les
s d
evel
op
ed.
S
hir
asu
co
ver
s th
e su
rfac
e. C
L t
o
D C
lass
Wel
ded
tu
ff a
s b
ase
rock
o
ccu
rs a
t ri
ver
bed
.
S
hir
asu
occ
urs
on
th
e cu
t sl
op
es
alo
ng h
ead
race
an
d P
enst
ock
. W
eld
ed t
uff
is
wel
l w
eld
ed a
nd
jo
ints
(cr
acks)
are
dev
elo
ped
.
S
hir
asu
co
ver
s th
e su
rfac
e. C
L t
o D
Cla
ss
Wel
ded
tu
ff o
ccu
rs a
t lo
wer
par
ts.
S
hir
asu
is
vuln
erab
le t
o e
rosi
on a
nd
d
enud
atio
n.
J
oin
ts (
crac
ks)
are
dev
elo
ped
at
the
stro
ngly
w
eld
ed p
arts
of
Wel
ded
tu
ff
Riv
er W
ater
R
iver
wat
er i
s co
nst
antl
y c
lou
ded
wit
h f
ine
mat
eria
ls (
vo
lcan
ic g
lass
es a
nd
qu
arts
).
Co
nst
ruct
ion
-
C
L C
lass
or
bet
ter
Wel
ded
tu
ff
occ
urs
at
the
bas
e o
f in
take
wei
r.
C
on
cret
e w
ith
Sh
iras
u a
ggre
gat
e is
u
sed
. N
o c
oun
term
easu
re i
s d
on
e on
S
hir
asu
slo
pes
alo
ng o
pen
h
ead
race
an
d m
any g
ull
y e
rosi
on
s o
ccu
r.
S
urg
e T
ank i
s co
nst
ruct
ed w
ith
st
on
e m
aso
nry
co
ver
ed b
y
con
cret
e.
S
lop
e fa
ilu
res
dam
age
Pen
sto
ck.
C
L C
lass
or
bet
ter
Wel
ded
tu
ff
occ
urs
at
the
bas
e o
f in
take
wei
r.
C
on
cret
e w
ith
Sh
iras
u a
ggre
gat
e is
use
d.
S
urg
e T
ank h
as r
epai
r re
cord
s (c
on
cret
e is
dam
aged
).
B
lue
shee
ts a
lon
g P
enst
ock
are
m
uch
det
erio
rate
d.
-
Ass
essm
ent/
co
nsi
der
atio
ns
To
po
gra
ph
y/
Geo
log
y
T
his
sit
e is
co
nsi
der
ed t
o b
e su
itab
le f
or
min
i-h
yd
ro p
ow
er p
lan
t.
C
ou
nte
rmea
sure
s ag
ain
st w
eath
erin
g,
ero
sion
, fa
ilu
res
on
Shir
asu
slo
pes
are
req
uir
ed.
C
ou
nte
rmea
sure
s is
req
uir
ed a
gai
nst
slo
pe
fail
ure
s o
f la
rge
slo
pes
. J
oin
ts (
crac
ks)
are
dev
elo
ped
bu
t m
ost
of
them
are
clo
sed
.
P
reli
min
ary t
o d
etai
led
so
il i
nves
tigat
ion
in
clud
ing s
ite
reco
nn
aiss
ance
, bo
rin
g,
in-s
itu
an
d l
abo
rato
ry t
ests
are
req
uir
ed f
or
faci
lity
la
yo
ut
pla
nn
ing.
C
ou
nte
rmea
sure
s ag
ain
st
wea
ther
ing,
ero
sio
n,
fail
ure
s o
n
Sh
iras
u s
lop
es a
re r
equir
ed.
C
ou
nte
rmea
sure
s is
req
uir
ed
agai
nst
slo
pe
fail
ure
s o
f la
rge
slo
pes
C
ou
nte
rmea
sure
s ag
ain
st
wea
ther
ing,
ero
sio
n,
fail
ure
s o
n
Sh
iras
u s
lop
es a
re r
equir
ed.
C
ou
nte
rmea
sure
s is
req
uir
ed
agai
nst
slo
pe
fail
ure
s o
f la
rge
slo
pes
C
ou
nte
rmea
sure
s ag
ain
st w
eath
erin
g,
ero
sio
n, fa
ilu
res
on
Sh
iras
u s
lop
es a
re
req
uir
ed.
C
ou
nte
rmea
sure
s is
req
uir
ed a
gai
nst
slo
pe
fail
ure
s o
f la
rge
slo
pes
P
reli
min
ary t
o d
etai
led
so
il i
nves
tigat
ion
in
clud
ing s
ite
reco
nn
aiss
ance
, bo
rin
g,
in-s
itu
an
d l
abo
rato
ry t
ests
are
req
uir
ed f
or
faci
lity
la
yo
ut
pla
nn
ing.
Riv
er W
ater
P
ipel
ine
or
slo
pe
pro
tect
ion
are
req
uir
ed t
o p
reven
t co
nta
min
atio
n o
f S
hir
asu
fro
m c
ut
slo
pes
alo
ng h
ead
race
. S
tudie
s fo
r m
eth
od
s to
rem
ove
fin
e gra
ins
such
as
san
d t
rap
des
ign
, se
dim
enta
tio
n
agen
ts,
and
pu
rifi
cati
on
sh
eets
are
req
uir
ed.
-

3-34
Co
nst
ruct
ion
Q
ual
ity c
on
tro
l m
anu
al s
uch
as
“Des
ign
an
d
Co
nst
ruct
ion M
anu
al f
or
Con
cret
e w
ith
S
hir
asu
Aggre
gat
e (D
raft
)” b
y K
ago
shim
a C
on
stru
ctio
n T
ech
nic
al C
ente
r, 2
00
6
(Jap
anes
e),
is r
equ
ired
.
B
ed r
ock
is
suit
able
fo
r fo
un
dat
ion
b
ase
of
stru
ctu
res.
T
her
e ar
e co
nce
rns
abo
ut
con
cret
e q
ual
ity.
T
her
e ar
e co
nce
rns
abo
ut
surg
e ta
nk s
tru
ctu
re.
S
tudie
s o
n P
enst
ock
co
ndu
it r
epai
r is
req
uir
ed.
B
ed r
ock
is
suit
able
fo
r fo
un
dat
ion
bas
e o
f st
ruct
ure
s.
T
her
e ar
e co
nce
rns
abo
ut
con
cret
e q
ual
ity.
M
ain
ten
ance
of
slop
es a
lon
g
Pen
sto
ck c
ond
uit
is
requ
ired
.
R
ock
s p
lan
ned
to
be
exca
vat
ed a
re m
ain
ly s
oft
ro
ck a
nd
exca
vat
ion
sh
all
be
rela
tivel
y e
asy.
C
ou
nte
rmea
sure
s fo
r sl
op
e p
rote
ctio
n a
nd s
oil
co
nta
min
atio
n a
re r
equ
ired
if
op
en h
ead
race
is
pla
nn
ed.
C
ou
nte
rmea
sure
s ag
ain
st s
lop
e ar
e re
qu
ired
fo
r p
ipel
ine
cond
uit
. M
ain
ten
ance
is
nec
essa
ry
du
rin
g o
per
atio
n
Sourc
e: C
reat
ed b
y t
he
Stu
dy T
eam
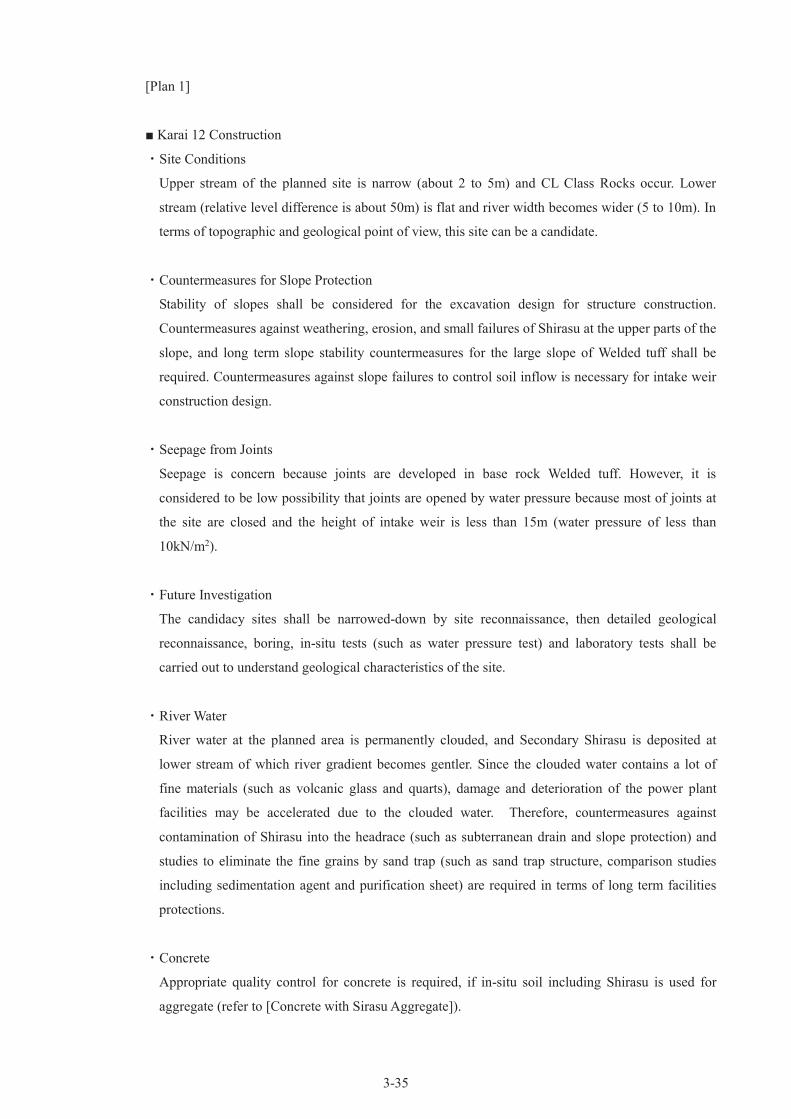
3-35
[Plan 1]
■ Karai 12 Construction
・Site Conditions
Upper stream of the planned site is narrow (about 2 to 5m) and CL Class Rocks occur. Lower
stream (relative level difference is about 50m) is flat and river width becomes wider (5 to 10m). In
terms of topographic and geological point of view, this site can be a candidate.
・Countermeasures for Slope Protection
Stability of slopes shall be considered for the excavation design for structure construction.
Countermeasures against weathering, erosion, and small failures of Shirasu at the upper parts of the
slope, and long term slope stability countermeasures for the large slope of Welded tuff shall be
required. Countermeasures against slope failures to control soil inflow is necessary for intake weir
construction design.
・Seepage from Joints
Seepage is concern because joints are developed in base rock Welded tuff. However, it is
considered to be low possibility that joints are opened by water pressure because most of joints at
the site are closed and the height of intake weir is less than 15m (water pressure of less than
10kN/m2).
・Future Investigation
The candidacy sites shall be narrowed-down by site reconnaissance, then detailed geological
reconnaissance, boring, in-situ tests (such as water pressure test) and laboratory tests shall be
carried out to understand geological characteristics of the site.
・River Water
River water at the planned area is permanently clouded, and Secondary Shirasu is deposited at
lower stream of which river gradient becomes gentler. Since the clouded water contains a lot of
fine materials (such as volcanic glass and quarts), damage and deterioration of the power plant
facilities may be accelerated due to the clouded water. Therefore, countermeasures against
contamination of Shirasu into the headrace (such as subterranean drain and slope protection) and
studies to eliminate the fine grains by sand trap (such as sand trap structure, comparison studies
including sedimentation agent and purification sheet) are required in terms of long term facilities
protections.
・Concrete
Appropriate quality control for concrete is required, if in-situ soil including Shirasu is used for
aggregate (refer to [Concrete with Sirasu Aggregate]).

3-36
[Plan 2]
■ Karai 7 Suppletion
・Slope Protection
No slope protection is done for most of the existing cut slopes. Slope protections against
weathering and erosion are required in terms of long term stability of slopes because the slopes
composed of Shirasu and Welded tuff are easily destabilized.
・River Water
River water at the planned area is permanently clouded. Since the clouded water contains a lot of
fine materials (such as volcanic glass and quarts), damage and deterioration of the power plant
facilities may be accelerated due to the clouded water. Therefore, countermeasures against
contamination of Shirasu into the headrace (such as subterranean drain and slope protection) and
studies to eliminate the fine grains by sand trap (such as sand trap structure, comparison studies
including sedimentation agent and purification sheet) are required in terms of long term facilities
protections.
・Base Rock
The intake weir is founded on stable CL Class or better Welded tuff. Since excavation for the
foundation was carried out about 4 to 5m further into the stable rocks, excavation volume and dam
height were increased and it was not economical. Rock inspection by the geological engineer shall
be required for the safe and economical foundation excavation.
・Concrete
Soil generated at the site, Shirasu, is used as aggregates of the concrete for the structures. There are
concerns about local concrete strength as damages of existing structures are observed.
・Head Pond Structure
Head pond being constructed is made of stone masonry covered by unreinforced concrete, and
there is concern about long term structural stability. Analysis considering planned water level and
detailed structures are considered to be required.
・Restoration of Penstock
Penstock is severely damaged by failed soil from Shirasu slopes. Countermeasures for slopes are
required before soil removal for restoration. In addition to cutting slope with stable gradient,
spraying slope frame or rock bolts shall be considered based on the slope stability analysis in order
to prevent instability due to future erosion and weathering.
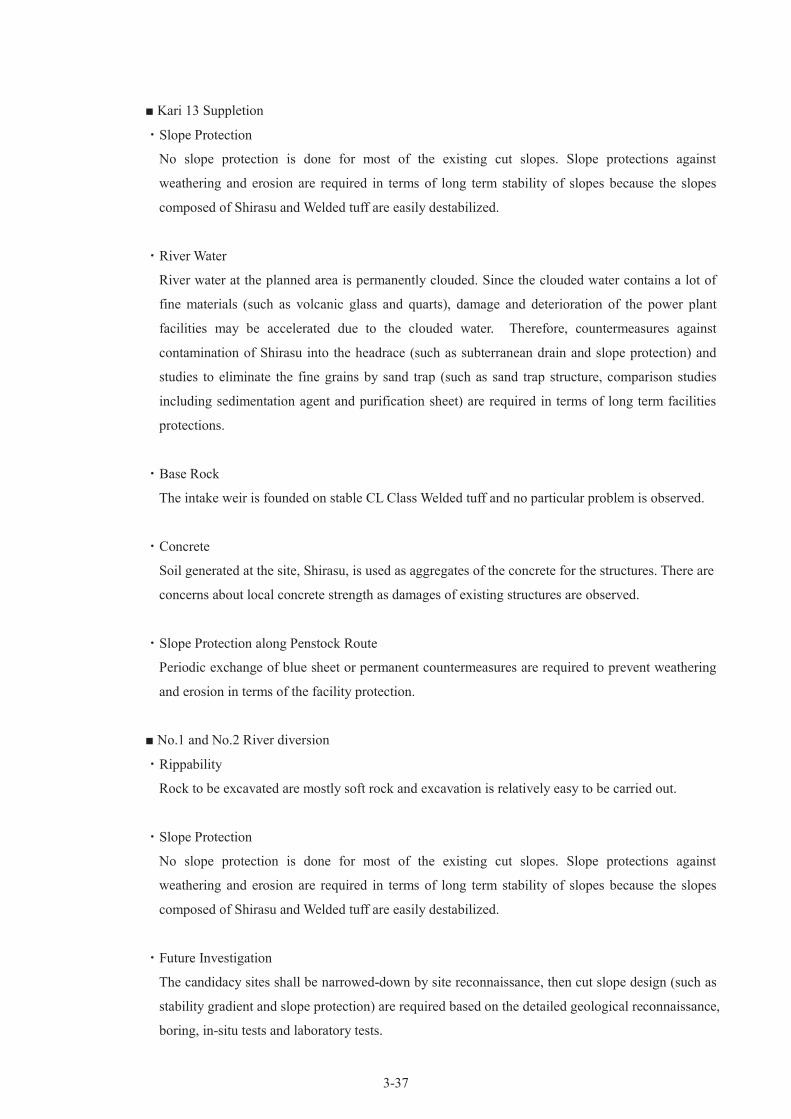
3-37
■ Kari 13 Suppletion
・Slope Protection
No slope protection is done for most of the existing cut slopes. Slope protections against
weathering and erosion are required in terms of long term stability of slopes because the slopes
composed of Shirasu and Welded tuff are easily destabilized.
・River Water
River water at the planned area is permanently clouded. Since the clouded water contains a lot of
fine materials (such as volcanic glass and quarts), damage and deterioration of the power plant
facilities may be accelerated due to the clouded water. Therefore, countermeasures against
contamination of Shirasu into the headrace (such as subterranean drain and slope protection) and
studies to eliminate the fine grains by sand trap (such as sand trap structure, comparison studies
including sedimentation agent and purification sheet) are required in terms of long term facilities
protections.
・Base Rock
The intake weir is founded on stable CL Class Welded tuff and no particular problem is observed.
・Concrete
Soil generated at the site, Shirasu, is used as aggregates of the concrete for the structures. There are
concerns about local concrete strength as damages of existing structures are observed.
・Slope Protection along Penstock Route
Periodic exchange of blue sheet or permanent countermeasures are required to prevent weathering
and erosion in terms of the facility protection.
■ No.1 and No.2 River diversion
・Rippability
Rock to be excavated are mostly soft rock and excavation is relatively easy to be carried out.
・Slope Protection
No slope protection is done for most of the existing cut slopes. Slope protections against
weathering and erosion are required in terms of long term stability of slopes because the slopes
composed of Shirasu and Welded tuff are easily destabilized.
・Future Investigation
The candidacy sites shall be narrowed-down by site reconnaissance, then cut slope design (such as
stability gradient and slope protection) are required based on the detailed geological reconnaissance,
boring, in-situ tests and laboratory tests.

3-38
・Headrace Design and Countermeasures
Countermeasure against slope failure and soil contamination for open headrace, and
countermeasures against slope failure for pipeline are required in Plan 2. Periodic maintenances of
slopes and channel are required during operation.
[Concrete with Shirasu Aggregate]
Shirasu is generally not suitable for concrete aggregate as it is porous, light, water-absorbable, and
its grains are fine and uneven. However, application of Shirasu for concrete aggregate is studied in
Kagoshima, Japan where Shirasu are vastly developed. It is reported that concrete with Shirasu
aggregate shows enough strength with appropriate quality control (for example, eliminating pumices
(separation of grains less than 5mm), using high performance AE water reducing agent, installment
of storage facility with roof as Shirasu has high water holding property).
Shirasu is already used as aggregate at the site, however appropriate quality control is not carried out,
and concrete strength may not be enough. Thus, if Shirasu is used for aggregate, quality control
referring Shirasu concrete in Kagoshima is required.
It is considered to be required to sample Shirasu at the site for laboratory tests to study applicability
for Shirasu concrete next fiscal year (test method shall be followed to Concrete Design Manual
using Shirasu as Fine Aggregate (Draft)). Laboratory test items and standard are shown as followed:
① Sampling
Standard-1: Sampling Method of Shirasu for Fine Aggregate.
② Grain Size Analysis
JIS A 1103 Method of test for amount of material passing test sieve 75 µm in aggregates
Standard-2: Sieve Analysis of Shirasu Fine Aggregate.
③ Density and Water Absorption Measurement
Standard-3: Test Methods for Density and Water Absorption Measurement of Shirasu for Fine
Aggregate.
④ Unit Weight and solid content in aggregates
JIS A 1104: Methods of test for bulk density of aggregates and solid content in aggregates.
⑤ Mixture Appropriateness Test (Strength Test)
JIS A 1108: Method of test for compressive strength of concrete.
JIS A 1113: Method of test for splitting tensile strength of concrete.
JIS A 1106: Method of test for flexural strength of concrete etc.
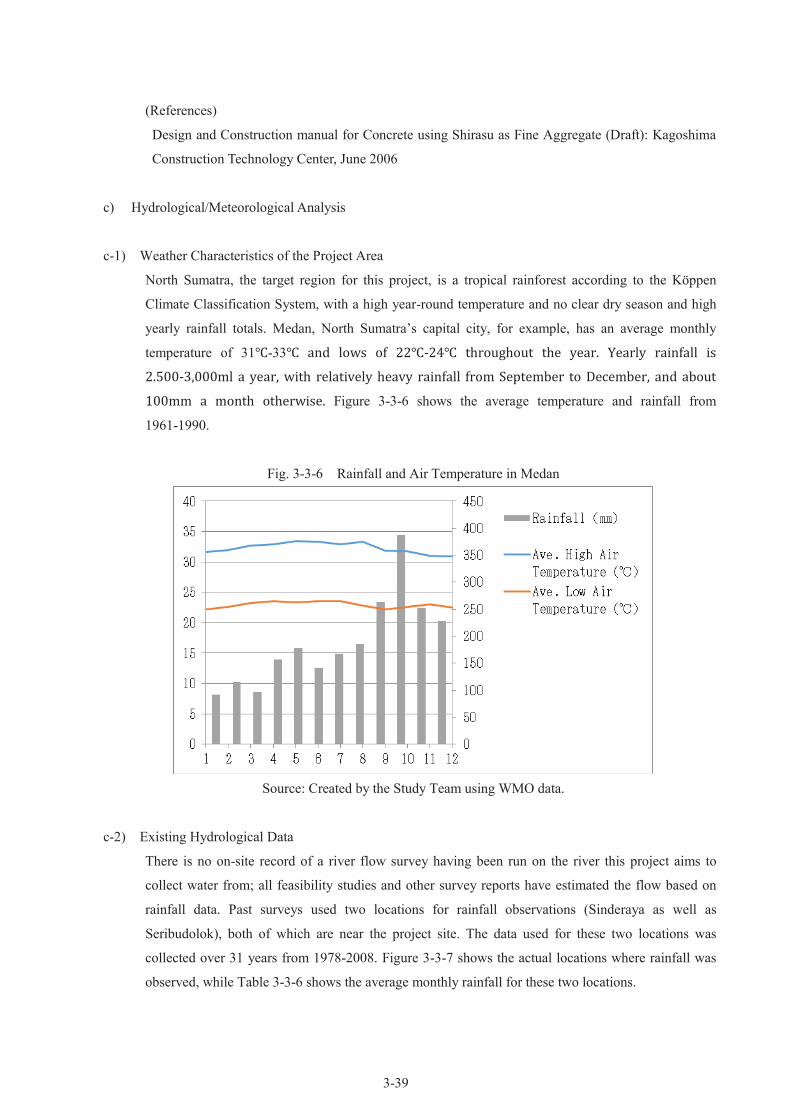
3-39
(References)
Design and Construction manual for Concrete using Shirasu as Fine Aggregate (Draft): Kagoshima
Construction Technology Center, June 2006
c) Hydrological/Meteorological Analysis
c-1) Weather Characteristics of the Project Area
North Sumatra, the target region for this project, is a tropical rainforest according to the Köppen
Climate Classification System, with a high year-round temperature and no clear dry season and high
yearly rainfall totals. Medan, North Sumatra’s capital city, for example, has an average monthly
temperature of 31℃-33℃ and lows of 22℃-24℃ throughout the year. Yearly rainfall is
2.500-3,000ml a year, with relatively heavy rainfall from September to December, and about
100mm a month otherwise. Figure 3-3-6 shows the average temperature and rainfall from
1961-1990.
Fig. 3-3-6 Rainfall and Air Temperature in Medan
Source: Created by the Study Team using WMO data.
c-2) Existing Hydrological Data
There is no on-site record of a river flow survey having been run on the river this project aims to
collect water from; all feasibility studies and other survey reports have estimated the flow based on
rainfall data. Past surveys used two locations for rainfall observations (Sinderaya as well as
Seribudolok), both of which are near the project site. The data used for these two locations was
collected over 31 years from 1978-2008. Figure 3-3-7 shows the actual locations where rainfall was
observed, while Table 3-3-6 shows the average monthly rainfall for these two locations.

3-40
Fig. 3-3-7 Map of Rainfall Observation Locations Near Project Site
Source: Feasibility Study and Detail Design of Karai07 Micro Hydro Power Plant,
Hydrology Report
Table 3-3-6 Average Monthly Rainfall at Observation Locations Near Project Site
Source: Feasibility Study and Detail Design of Karai07 Micro Hydro Power Plant, Hydrology Report
In addition to the rainfall data used in past surveys, this survey obtained existing river flow data on
the Karai River drainage system. The flow data was observed at Pulau Tagor (catchment area of
1,012.5 km2), approximately 45km downstream from the project site. The study team received 41
years’ worth of data, from 1972-2012. Figure 3-3-8 shows the location of Pulau Tagor, where the
flow was observed, while Table 3-3-7 shows the flow data.
Month Jan Feb Marc Apr May Jun Jul Augt Sept Oct Nov Des Average
Rainfall
(mm) 197.9 199.5 228.2 230.9 207.6 134.4 185.0 202.3 339.9 338.3 289.6 236.1 232.5
Lake Toba
Sideraya rainfall station
Seribudolok rainfall
station
Karai12 Catchment Area
Karai 7 Catchment Area
Karai 13 Catchment Area
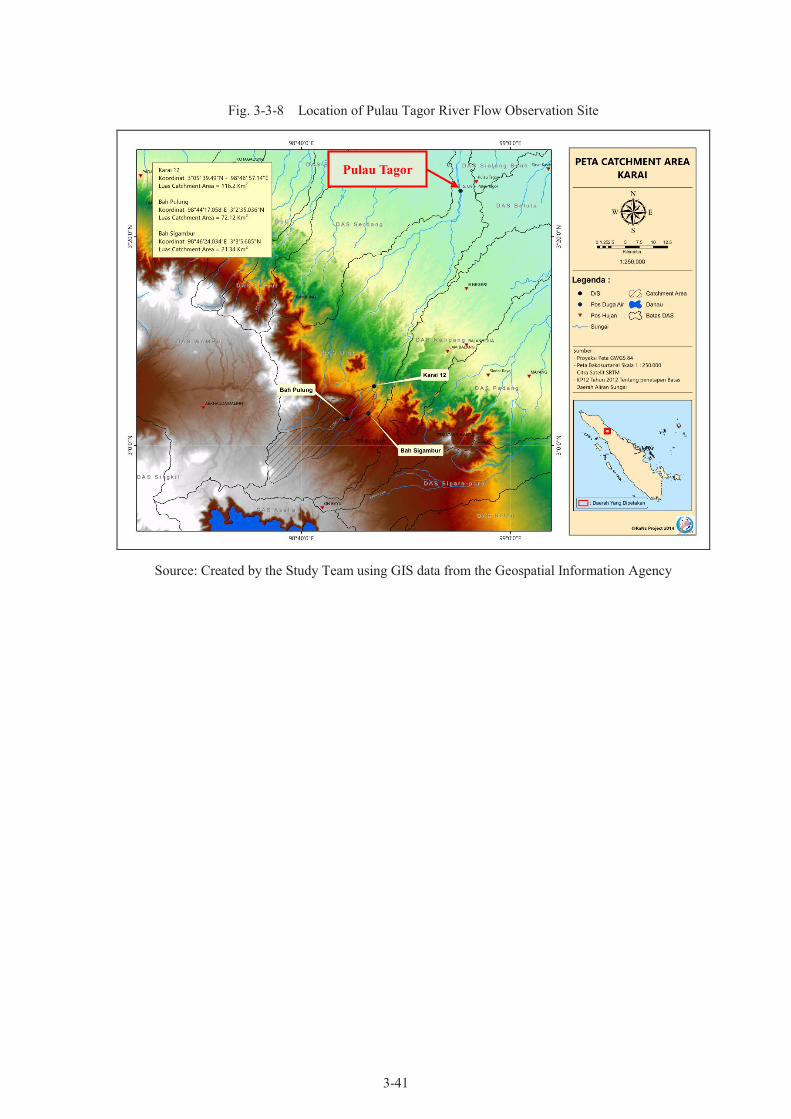
3-41
Fig. 3-3-8 Location of Pulau Tagor River Flow Observation Site
Source: Created by the Study Team using GIS data from the Geospatial Information Agency
Pulau Tagor

3-42
Table 3-3-7 Pulau Tagor Observed River Flow
Tahun Jan Feb Mar Apr May Jun Jul Aug Sep Oct Nov Dec Total
1972 53.42 52.17 48.65 56.93 56.84 50.48 37.41 33.30 43.67 53.91 64.89 62.26 613.92
1973 58.88 41.45 51.46 58.22 52.96 56.36 48.41 47.31 51.51 60.48 58.69 88.52 674.25
1974 55.83 60.16 47.82 48.16 48.54 45.11 45.96 46.56 66.13 61.03 63.02 49.10 637.43
1975 45.22 46.43 - 47.14 40.33 36.34 - - - - 54.83 55.30 325.58
1976 44.43 55.42 44.09 47.06 43.20 43.72 41.30 45.31 45.50 48.02 74.62 76.02 608.69
1977 60.85 59.58 44.68 43.45 44.00 43.65 36.63 38.31 40.89 64.59 68.95 56.91 602.48
1978 55.95 51.72 54.80 55.36 54.57 48.50 39.68 36.40 37.22 41.27 54.47 47.57 577.52
1979 39.02 40.49 36.04 40.41 35.59 38.40 40.14 36.35 56.48 48.11 73.04 51.17 535.23
1980 41.84 42.62 47.56 41.89 46.08 40.13 37.34 49.52 50.79 54.26 - 55.93 507.97
1981 34.36 - 51.37 52.28 71.21 45.51 31.18 29.68 41.08 53.34 55.29 50.89 516.19
1982 34.36 39.65 42.06 55.83 62.54 45.88 32.73 33.46 35.56 47.09 - - 429.15
1983 - - - - - - 36.18 35.64 42.27 55.48 49.30 55.76 274.64
1984 68.61 64.24 62.94 55.52 64.54 50.03 49.53 - 44.44 45.43 - 49.79 555.07
1985 - 61.51 58.47 57.46 58.10 41.78 43.28 43.27 58.15 65.61 68.25 71.45 627.34
1986 52.63 49.64 50.93 52.86 52.43 50.95 41.00 38.37 42.70 49.45 48.52 50.14 579.62
1987 49.48 41.51 49.83 50.05 58.87 48.99 - - - - - - 298.73
1988 53.02 42.22 51.93 53.19 51.69 40.36 36.25 31.08 63.09 61.80 68.42 72.65 625.70
1989 69.11 54.74 67.72 69.35 67.41 52.10 48.16 40.49 59.57 83.60 86.09 94.78 793.11
1990 67.52 52.05 50.50 51.84 - - 51.47 37.66 40.44 74.05 81.60 78.45 585.58
1991 56.53 56.69 62.75 58.38 66.41 59.29 46.01 47.97 61.98 91.19 91.64 90.22 789.05
1992 64.53 50.92 52.53 58.72 59.54 52.59 37.78 31.99 33.94 31.34 32.09 30.55 536.51
1993 31.13 36.24 37.84 50.66 62.99 47.79 48.47 41.01 53.24 69.57 78.24 57.65 614.82
1994 53.95 61.73 55.52 56.09 54.20 48.40 39.31 45.08 49.44 49.97 68.60 5.54 587.83
1995 46.89 42.48 43.23 45.69 46.19 43.16 36.94 49.95 43.60 49.17 51.33 41.97 540.59
1996 40.12 56.67 42.19 48.67 43.66 41.90 38.47 41.23 41.53 43.81 38.92 48.31 525.49
1997 39.97 38.30 40.56 39.66 33.76 31.46 31.85 28.35 30.66 38.39 60.61 42.62 456.19
1998 43.08 39.23 38.49 37.32 35.92 37.54 - - - - - - 231.58
2000 44.54 39.74 59.01 40.04 37.95 39.41 36.45 38.00 57.78 42.22 44.63 43.04 522.79
2001 42.70 35.72 30.21 34.66 29.63 27.73 26.13 26.03 32.65 32.88 44.41 44.23 406.97
2002 40.25 38.97 37.88 38.72 35.20 - - - - - - - 191.03
2005 45.38 30.94 32.87 34.94 32.80 28.59 29.29 29.12 26.91 31.40 36.23 - 358.47
2007 75.21 64.56 64.80 72.32 70.57 70.92 62.63 61.66 75.10 72.93 72.83 - 763.52
2008 119.60 104.74 155.98 124.83 99.81 105.54 108.96 104.07 132.09 149.60 90.51 - 1,295.71
2009 53.10 28.58 38.36 37.03 31.44 22.64 20.79 21.55 26.57 33.61 47.25 37.55 398.45
2010 63.53 37.19 47.90 46.69 40.32 30.56 28.47 29.51 34.76 42.83 59.11 47.01 507.88
2011 43.85 39.97 42.12 41.44 31.46 28.29 23.26 33.01 25.39 50.76 359.53
2012 103.57 131.18 324.88 122.88 86.74 98.26 54.14 107.27 95.28 111.02 165.23 240.98 1,641.44
S.Ular - Pulao Tagor (Luas DAS 1012.5 km2)
Source: Badan Meteorologi, Klimatologi dan Geofisika
c-3) River Flow at Karai 12 Intake Location (use for Project Plan 1)
[River Flow Condition]
We have made a model for the river flow at the construction site for Karai 12 (Catchment area of
116.64km2) based on the river flow and observed rainfall data approximately 45km downstream in
Pulau Tagor (Catchment area of 1,012.5km2). Using the flow data from Pulau Tagor as a base and
comparing it with the Karai 12 site, we found that even though the Pulau Tagor basin is 8.7 times as
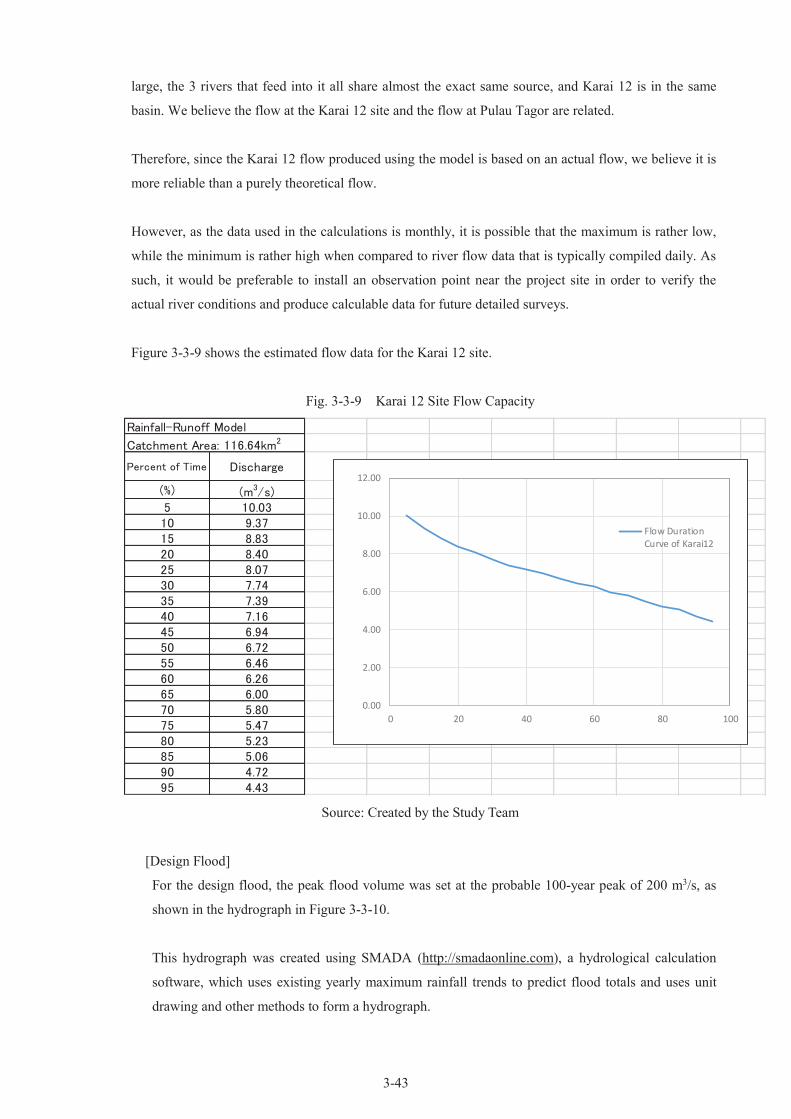
3-43
large, the 3 rivers that feed into it all share almost the exact same source, and Karai 12 is in the same
basin. We believe the flow at the Karai 12 site and the flow at Pulau Tagor are related.
Therefore, since the Karai 12 flow produced using the model is based on an actual flow, we believe it is
more reliable than a purely theoretical flow.
However, as the data used in the calculations is monthly, it is possible that the maximum is rather low,
while the minimum is rather high when compared to river flow data that is typically compiled daily. As
such, it would be preferable to install an observation point near the project site in order to verify the
actual river conditions and produce calculable data for future detailed surveys.
Figure 3-3-9 shows the estimated flow data for the Karai 12 site.
Fig. 3-3-9 Karai 12 Site Flow Capacity
Rainfall-Runoff Model
Catchment Area: 116.64km2
Percent of Time Discharge
(%) (m3/s)5 10.0310 9.3715 8.8320 8.4025 8.0730 7.7435 7.3940 7.1645 6.9450 6.7255 6.4660 6.2665 6.0070 5.8075 5.4780 5.2385 5.0690 4.7295 4.43
0.00
2.00
4.00
6.00
8.00
10.00
12.00
0 20 40 60 80 100
Flow DurationCurve of Karai12
Source: Created by the Study Team
[Design Flood]
For the design flood, the peak flood volume was set at the probable 100-year peak of 200 m3/s, as
shown in the hydrograph in Figure 3-3-10.
This hydrograph was created using SMADA (http://smadaonline.com), a hydrological calculation
software, which uses existing yearly maximum rainfall trends to predict flood totals and uses unit
drawing and other methods to form a hydrograph.

3-44
Fig. 3-3-10 Karai 12 Design Flood
0
50
100
150
200
250
0 10 20 30 40 50 60
De
bit
Ba
nji
r (m
3/s
)
Waktu (jam)
Flood Hydrograph Karai River at Weir(A = 116.64 Km2 )
Q 2th
Q 5th
Q 10th
Q 25th
Q 50th
Q 100th
Q 200th
#REF!
Source: Created by the Study Team
c-4) River Flow at Karai 7 and Karai 13 Intake Location (use for Project Plan2)
Hydrologic analyses for the existing Karai 7 and Karai 13 power plants appear in previous reports,
and so the current plans were created based on that data. As a result, the expansion plans for these
power plants uses the results of previous hydrological analyses. The hydrological analysis techniques
used in previous surveys have been verified as valid.
[River Flow Conditions]
The flow conditions at the Karai 7 and Karai 13 locations were created based on an F.J. Mock model
of the river’s flow. The general idea of an F.J. Mock model is that rainfall creates an influx that is
added to the river’s flow, and it also includes general ideas of underground and stored water as well,
so it is in the same system of flow models as the Tank Model.
■ Data used in the flow model
The rainfall and meteorological data used in the flow model is exactly as follows.
- Sinderaya Rainfall Data (1978-2008)
- Seribudolok Rainfall Data (1978-2008)
- Marihat Meteorological Data (2003-2007)
As rainfall data is an incredibly important parameter for creating flow models, the Thiessen method
(a method where bisectors are drawn across the straight lines connecting two locations of measured
Flo
od
Disch
arge (m
3/s)
0 10 20 30 40 50 60
Time (hr)

3-45
rainfall totals, then those bisectors are used to create polygons that divide the area into sectors
around each location) was used to calculate rainfall data for the basin based on rainfall totals
observed nearby. In other words, the observed rainfall value is the amount of rainfall at one location
(the site rainfall), and in order to know the rainfall in the basin (the area rainfall), we must find the
geometrical area these arbitrary rainfall observation points control. Once we find those areas, we
recalculate the rainfall totals and use that data.
Further, meteorological data was taken from a nearby observation post in Marihat, which will be
sufficient assuming that all the necessary parameters for the creation of a F.J. Mock flow model are
present.
■ Comparison and Evaluation of Flow Condition Graph Created From Flow Model Data
The flow condition graph for Karai 7 made using the above methods is shown in Figure 3-3-11,
while that of Karai 13 is shown in Figure 3-3-12. When the flow condition graphs are compared, we
can see that the Karai 13 basin is 145.254km2, and the Karai 7 basin is 248.306km2, making for a
differential of 0.585. The comparisons of both locations at 25%, 50%, 75%, and 90% of river flow
are shown in Table 3-3-8. Based on these results, we can say that the river flow data from Karai 7
and Karai 13 differs only in the amount of river flow, as seen in the basin comparison; flow
conditions are essentially the same.
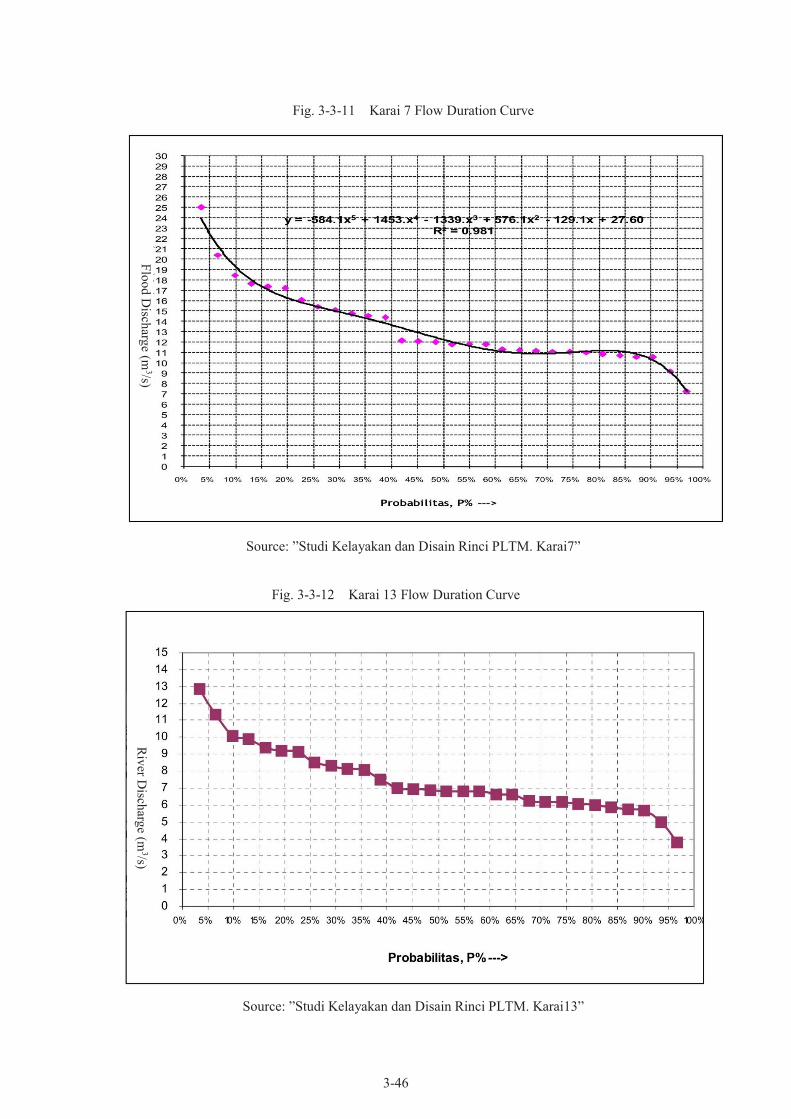
3-46
Fig. 3-3-11 Karai 7 Flow Duration Curve
Source: ”Studi Kelayakan dan Disain Rinci PLTM. Karai7”
Fig. 3-3-12 Karai 13 Flow Duration Curve
Source: ”Studi Kelayakan dan Disain Rinci PLTM. Karai13”
Flo
od
Disch
arge (m
3/s) R
iver D
ischarg
e (m3/s)
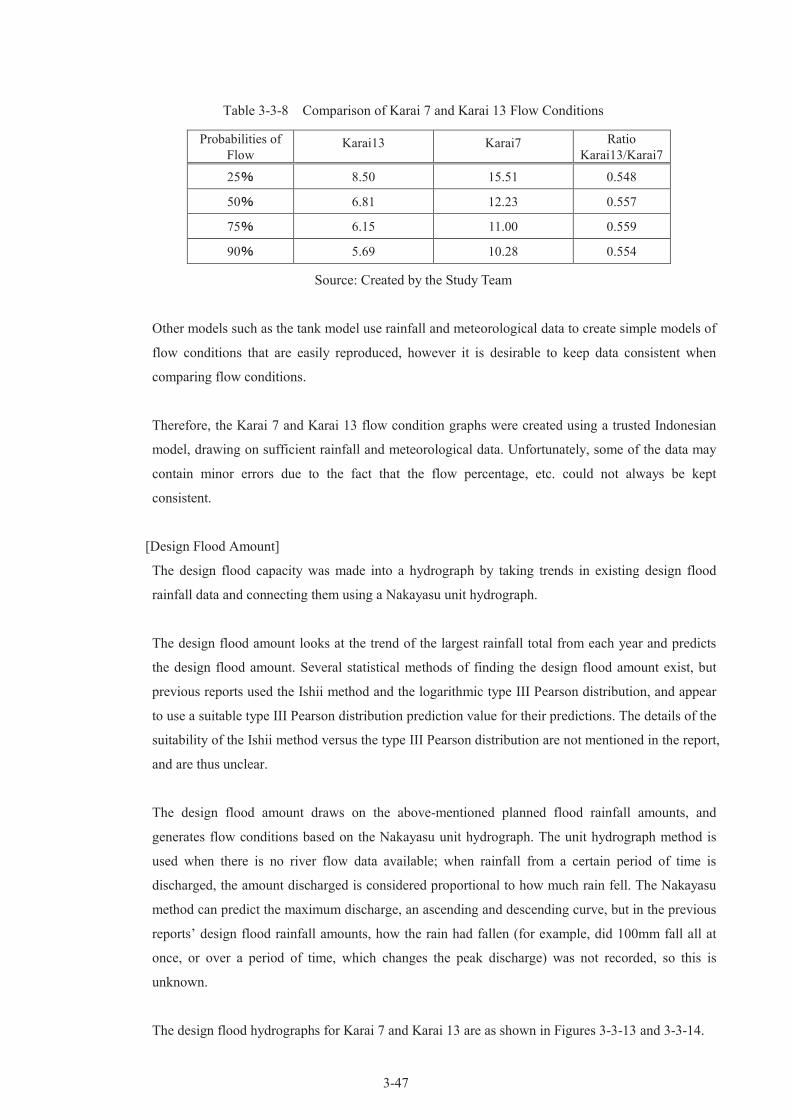
3-47
Table 3-3-8 Comparison of Karai 7 and Karai 13 Flow Conditions
Source: Created by the Study Team
Other models such as the tank model use rainfall and meteorological data to create simple models of
flow conditions that are easily reproduced, however it is desirable to keep data consistent when
comparing flow conditions.
Therefore, the Karai 7 and Karai 13 flow condition graphs were created using a trusted Indonesian
model, drawing on sufficient rainfall and meteorological data. Unfortunately, some of the data may
contain minor errors due to the fact that the flow percentage, etc. could not always be kept
consistent.
[Design Flood Amount]
The design flood capacity was made into a hydrograph by taking trends in existing design flood
rainfall data and connecting them using a Nakayasu unit hydrograph.
The design flood amount looks at the trend of the largest rainfall total from each year and predicts
the design flood amount. Several statistical methods of finding the design flood amount exist, but
previous reports used the Ishii method and the logarithmic type III Pearson distribution, and appear
to use a suitable type III Pearson distribution prediction value for their predictions. The details of the
suitability of the Ishii method versus the type III Pearson distribution are not mentioned in the report,
and are thus unclear.
The design flood amount draws on the above-mentioned planned flood rainfall amounts, and
generates flow conditions based on the Nakayasu unit hydrograph. The unit hydrograph method is
used when there is no river flow data available; when rainfall from a certain period of time is
discharged, the amount discharged is considered proportional to how much rain fell. The Nakayasu
method can predict the maximum discharge, an ascending and descending curve, but in the previous
reports’ design flood rainfall amounts, how the rain had fallen (for example, did 100mm fall all at
once, or over a period of time, which changes the peak discharge) was not recorded, so this is
unknown.
The design flood hydrographs for Karai 7 and Karai 13 are as shown in Figures 3-3-13 and 3-3-14.
Probabilities of
Flow Karai13 Karai7 Ratio
Karai13/Karai7
25% 8.50 15.51 0.548
50% 6.81 12.23 0.557
75% 6.15 11.00 0.559
90% 5.69 10.28 0.554
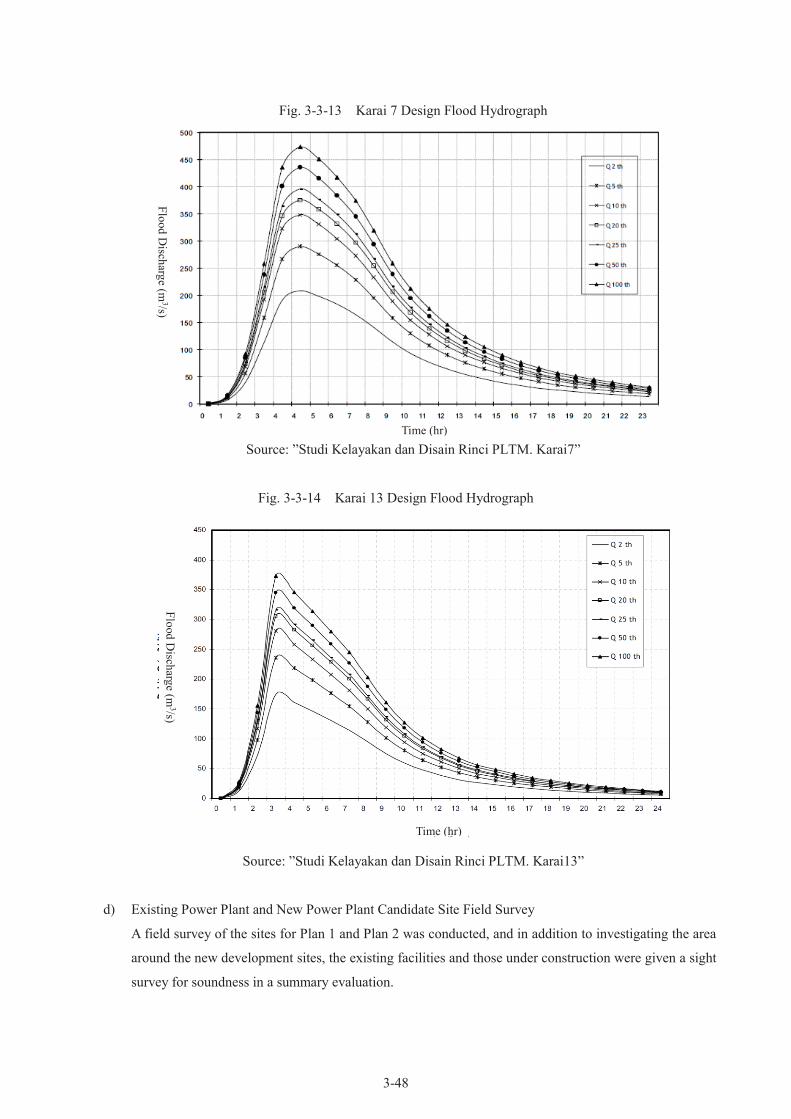
3-48
Fig. 3-3-13 Karai 7 Design Flood Hydrograph
Source: ”Studi Kelayakan dan Disain Rinci PLTM. Karai7”
Fig. 3-3-14 Karai 13 Design Flood Hydrograph
Source: ”Studi Kelayakan dan Disain Rinci PLTM. Karai13”
d) Existing Power Plant and New Power Plant Candidate Site Field Survey
A field survey of the sites for Plan 1 and Plan 2 was conducted, and in addition to investigating the area
around the new development sites, the existing facilities and those under construction were given a sight
survey for soundness in a summary evaluation.
Flo
od
Disch
arge (m
3/s) F
lood
Disch
arge (m
3/s)
Time (hr)
Time (hr)

3-49
d-1) Project Site of Karai 12 (Project Plan 1)
The planned site for Karai 12 is right along the Pulung River, and about 5km south (upstream) of the
closest village, Desa Butusiantar, is the planned intake area. The village is on the right bank of the
Pulung, and is accessible by car via an unpaved road, however the road becomes incredibly rough;
passenger vehicles and large trucks cannot pass without difficulty.
The generator will be installed at EL.550m (intake site)-EL.400m (power plant site), in an area where
the river runs down a steep slope with an average 1/11 grade. Up- and downstream of this area, the
grade is a comparatively gentle 1/30-1/50.
[Intake Weir Site]
As described in the detailed geological survey in item b), the sites for Plan 1 and Plan 2 are
generally covered in volcanic product from Lake Toba. The surface of Karai 12 is shirasu, with
welded tuff underneath. About 5m-15m from the riverbed lies CL-grade bedrock, and the grade of
both river banks approaches vertical in places, with some areas of the river being as narrow as 2m
(Photo 3-3-5). From EL.550m upward, the river gradually widens and the incline of the river banks
lessens, making EL.550m ideal for placement of the intake weir.
[Headrace Passage Location]
The headrace passage is planned to let water pass through an open channel at near EL.550m. The
contour line of the right river bank at EL.550m has a relatively gentle slope, while about 800m
downstream from the intake site on the left bank the drop becomes quite steep. It is possible to
establish a channel in either location, however installing the channel on the right bank tends to
increase the amount of excavation necessary.
[Head Pond and Penstock Location]
From a stability and post-construction maintenance perspective, it would be ideal for the head pond
and penstock to be located on a ridge. Around 1,500m downstream from the intake site, both river
banks form ridges, and the foothills extend down to roughly river level, making it possible to
establish the head pond and penstock on either side.
[Power Plant Site]
Downstream from EL.400m, the slopes on both banks of the river become relatively gentle, and
either bank is a suitable location for the power plant. It is necessary for the primary power
generation equipment to be placed at a sufficient height away from rising waters should the river
flood. According to the height of the draft tube given in the water wheel design and the position of
the drainage, the power plant will have to be elevated above the design flood level.
If the power plant is established on the steep banks along the narrow section of river on this site,
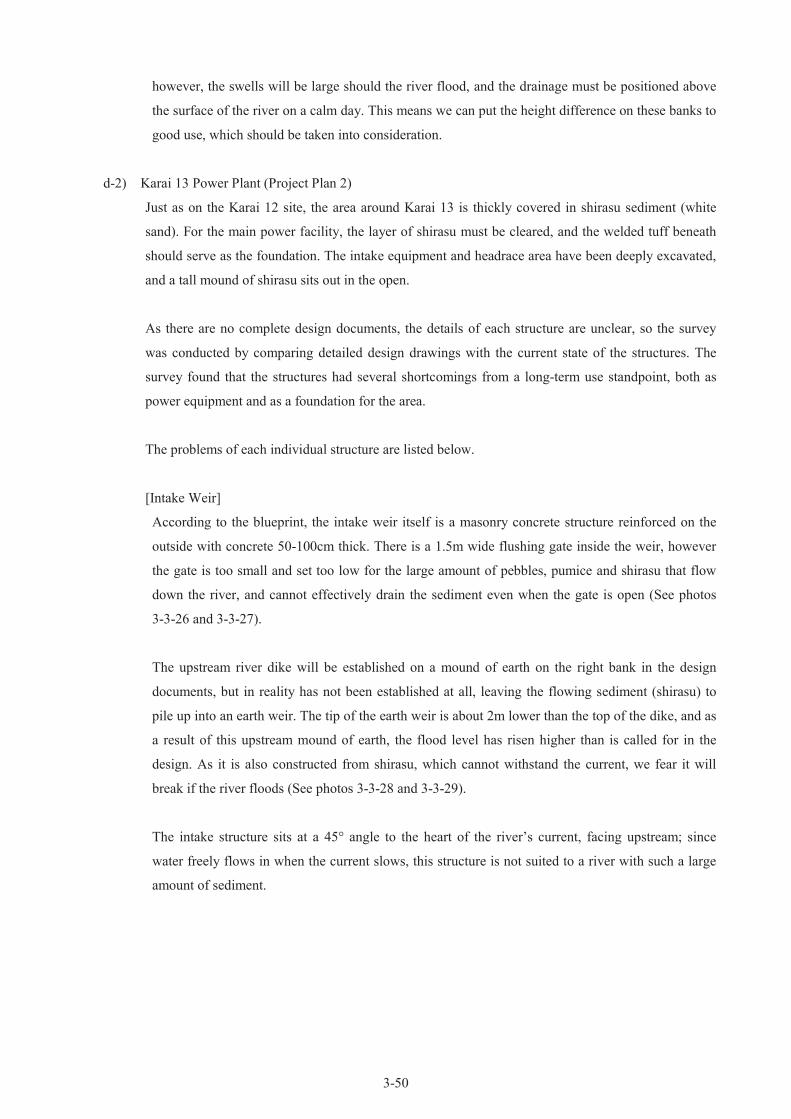
3-50
however, the swells will be large should the river flood, and the drainage must be positioned above
the surface of the river on a calm day. This means we can put the height difference on these banks to
good use, which should be taken into consideration.
d-2) Karai 13 Power Plant (Project Plan 2)
Just as on the Karai 12 site, the area around Karai 13 is thickly covered in shirasu sediment (white
sand). For the main power facility, the layer of shirasu must be cleared, and the welded tuff beneath
should serve as the foundation. The intake equipment and headrace area have been deeply excavated,
and a tall mound of shirasu sits out in the open.
As there are no complete design documents, the details of each structure are unclear, so the survey
was conducted by comparing detailed design drawings with the current state of the structures. The
survey found that the structures had several shortcomings from a long-term use standpoint, both as
power equipment and as a foundation for the area.
The problems of each individual structure are listed below.
[Intake Weir]
According to the blueprint, the intake weir itself is a masonry concrete structure reinforced on the
outside with concrete 50-100cm thick. There is a 1.5m wide flushing gate inside the weir, however
the gate is too small and set too low for the large amount of pebbles, pumice and shirasu that flow
down the river, and cannot effectively drain the sediment even when the gate is open (See photos
3-3-26 and 3-3-27).
The upstream river dike will be established on a mound of earth on the right bank in the design
documents, but in reality has not been established at all, leaving the flowing sediment (shirasu) to
pile up into an earth weir. The tip of the earth weir is about 2m lower than the top of the dike, and as
a result of this upstream mound of earth, the flood level has risen higher than is called for in the
design. As it is also constructed from shirasu, which cannot withstand the current, we fear it will
break if the river floods (See photos 3-3-28 and 3-3-29).
The intake structure sits at a 45° angle to the heart of the river’s current, facing upstream; since
water freely flows in when the current slows, this structure is not suited to a river with such a large
amount of sediment.
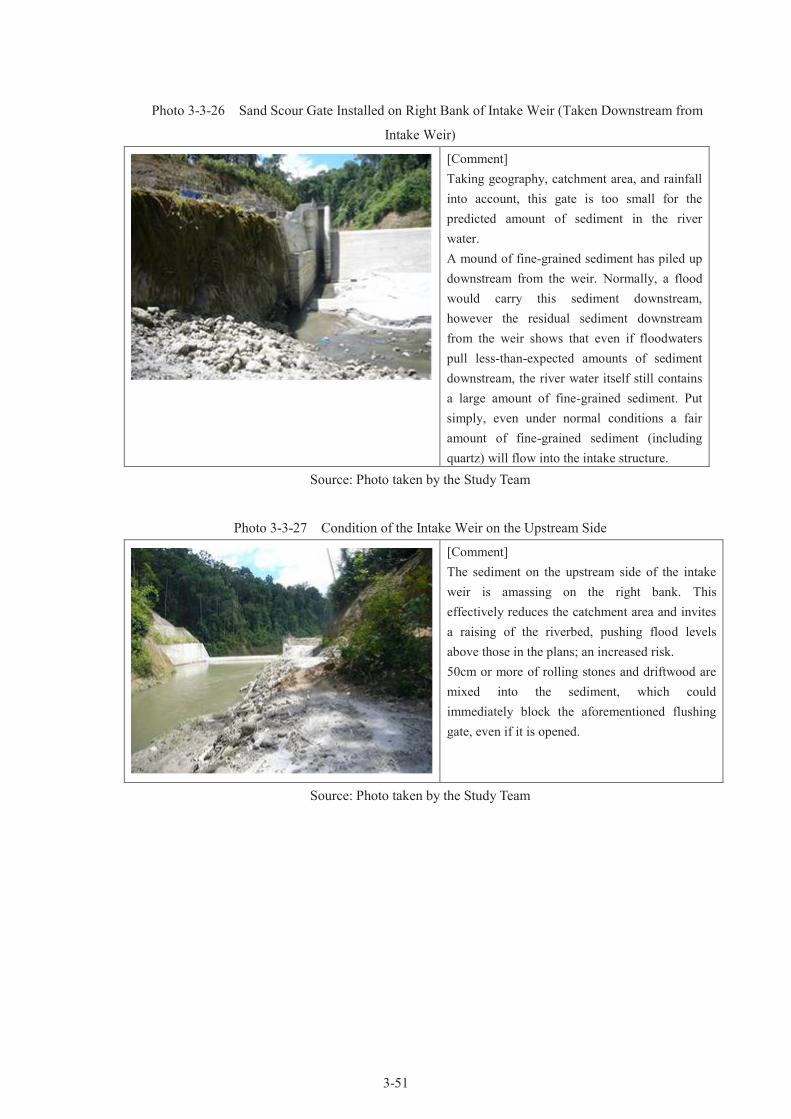
3-51
Photo 3-3-26 Sand Scour Gate Installed on Right Bank of Intake Weir (Taken Downstream from
Intake Weir)
[Comment]
Taking geography, catchment area, and rainfall
into account, this gate is too small for the
predicted amount of sediment in the river
water.
A mound of fine-grained sediment has piled up
downstream from the weir. Normally, a flood
would carry this sediment downstream,
however the residual sediment downstream
from the weir shows that even if floodwaters
pull less-than-expected amounts of sediment
downstream, the river water itself still contains
a large amount of fine-grained sediment. Put
simply, even under normal conditions a fair
amount of fine-grained sediment (including
quartz) will flow into the intake structure.
Source: Photo taken by the Study Team
Photo 3-3-27 Condition of the Intake Weir on the Upstream Side
[Comment]
The sediment on the upstream side of the intake
weir is amassing on the right bank. This
effectively reduces the catchment area and invites
a raising of the riverbed, pushing flood levels
above those in the plans; an increased risk.
50cm or more of rolling stones and driftwood are
mixed into the sediment, which could
immediately block the aforementioned flushing
gate, even if it is opened.
Source: Photo taken by the Study Team

3-52
Photo 3-3-28 Dike on Right Bank Not Constructed
[Comment]
The dike on the right bank has not been
constructed, and shirasu is collecting. Even now,
the top of the earth weir is at the same level, or
perhaps slightly lower, than the flood level, and it
is highly possible that it will break or be washed
away.
Should it break, the chances are great that large
amounts of sediment will enter the sand trap and
headrace, and dirty water could conceivably flow
along the headrace as well.
Source: Photo taken by the Study Team
Photo 3-3-29 Dike on Right Bank Not Constructed
[Comment]
There are clearly visible tracks in the earth weir
from rainfall, meaning the weir could loosen
even if exposed to small amounts of water.
Source: Photo taken by the Study Team
[Sand Trap]
The sand trap was constructed almost exactly to spec, however there are only 2 drainage pipes of
300mm installed, which will be weak drainage for a power plant that is expected to see a large
amount of sediment. Further, drainage is operated via a manual valve, and the control pit for said
valve may become submerged during rainfall, making the valve impossible to open during an
emergency (Photo 3-3-30).
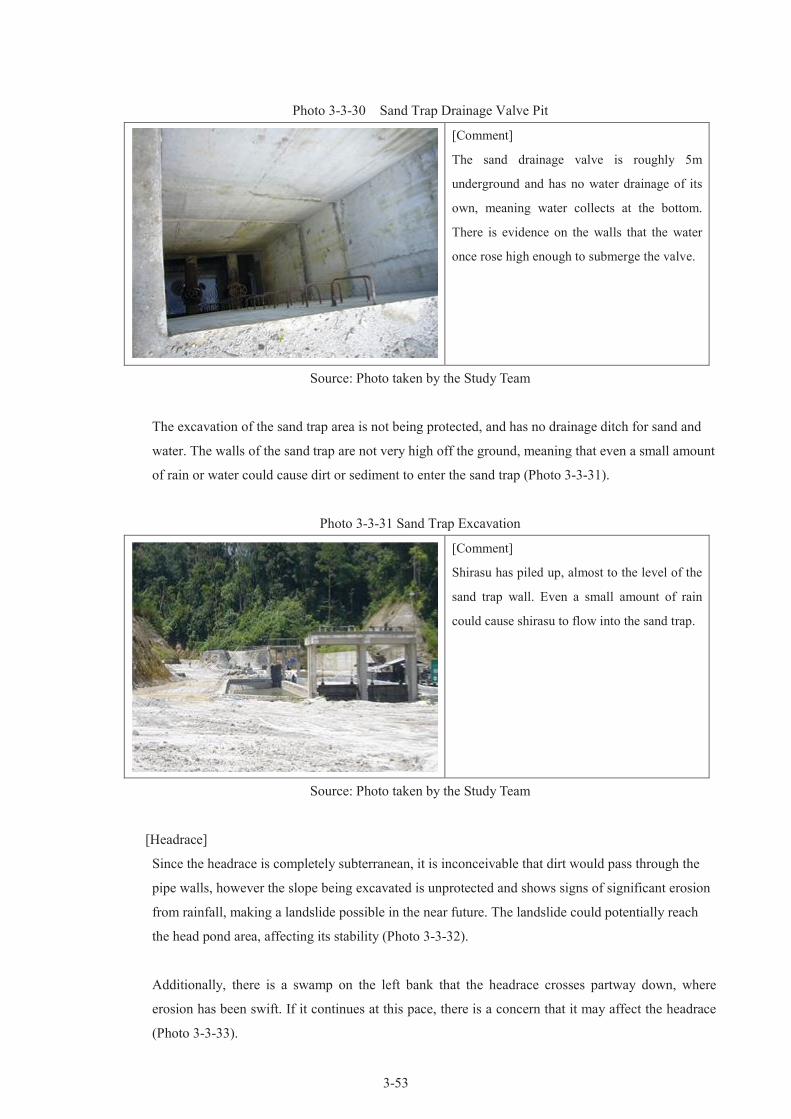
3-53
Photo 3-3-30 Sand Trap Drainage Valve Pit
[Comment]
The sand drainage valve is roughly 5m
underground and has no water drainage of its
own, meaning water collects at the bottom.
There is evidence on the walls that the water
once rose high enough to submerge the valve.
Source: Photo taken by the Study Team
The excavation of the sand trap area is not being protected, and has no drainage ditch for sand and
water. The walls of the sand trap are not very high off the ground, meaning that even a small amount
of rain or water could cause dirt or sediment to enter the sand trap (Photo 3-3-31).
Photo 3-3-31 Sand Trap Excavation
[Comment]
Shirasu has piled up, almost to the level of the
sand trap wall. Even a small amount of rain
could cause shirasu to flow into the sand trap.
Source: Photo taken by the Study Team
[Headrace]
Since the headrace is completely subterranean, it is inconceivable that dirt would pass through the
pipe walls, however the slope being excavated is unprotected and shows signs of significant erosion
from rainfall, making a landslide possible in the near future. The landslide could potentially reach
the head pond area, affecting its stability (Photo 3-3-32).
Additionally, there is a swamp on the left bank that the headrace crosses partway down, where
erosion has been swift. If it continues at this pace, there is a concern that it may affect the headrace
(Photo 3-3-33).
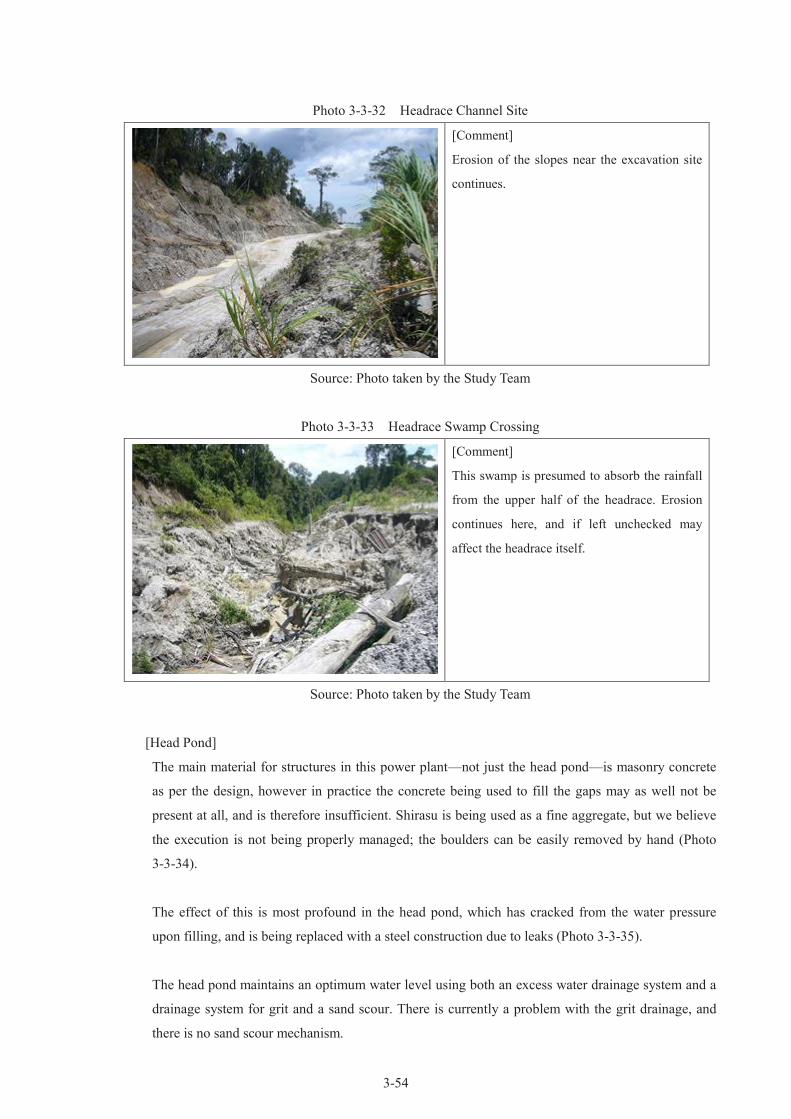
3-54
Photo 3-3-32 Headrace Channel Site
[Comment]
Erosion of the slopes near the excavation site
continues.
Source: Photo taken by the Study Team
Photo 3-3-33 Headrace Swamp Crossing
[Comment]
This swamp is presumed to absorb the rainfall
from the upper half of the headrace. Erosion
continues here, and if left unchecked may
affect the headrace itself.
Source: Photo taken by the Study Team
[Head Pond]
The main material for structures in this power plant—not just the head pond—is masonry concrete
as per the design, however in practice the concrete being used to fill the gaps may as well not be
present at all, and is therefore insufficient. Shirasu is being used as a fine aggregate, but we believe
the execution is not being properly managed; the boulders can be easily removed by hand (Photo
3-3-34).
The effect of this is most profound in the head pond, which has cracked from the water pressure
upon filling, and is being replaced with a steel construction due to leaks (Photo 3-3-35).
The head pond maintains an optimum water level using both an excess water drainage system and a
drainage system for grit and a sand scour. There is currently a problem with the grit drainage, and
there is no sand scour mechanism.
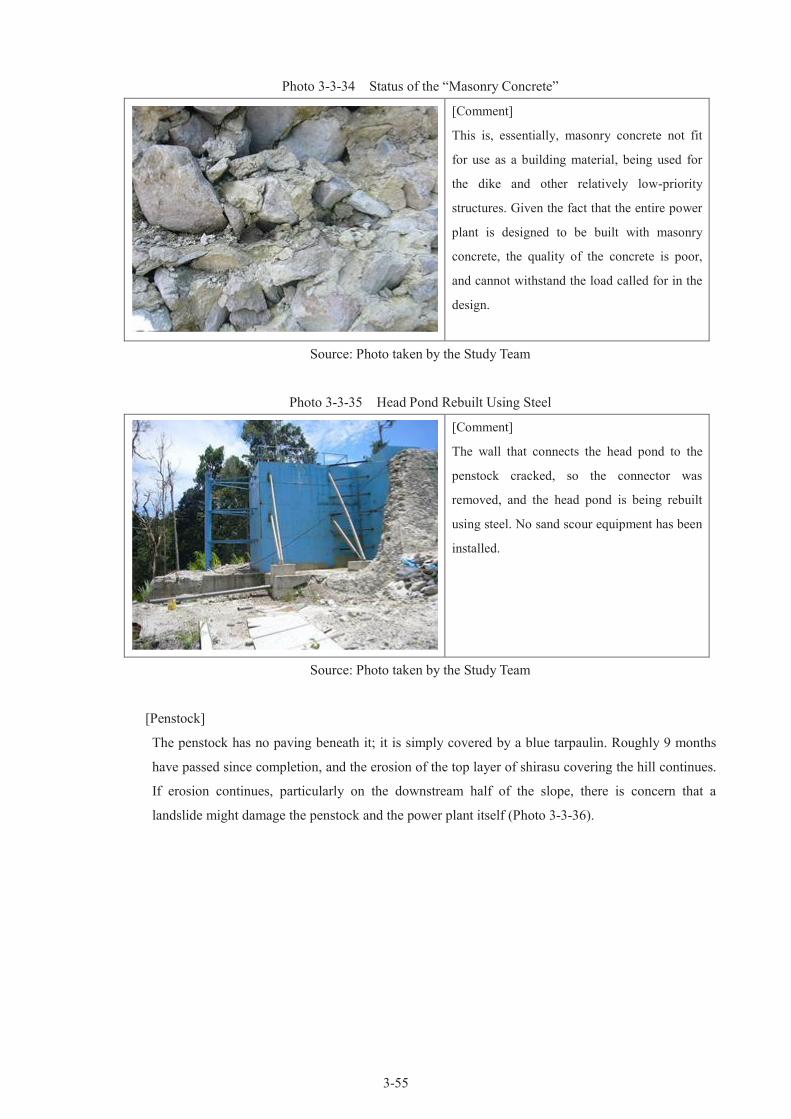
3-55
Photo 3-3-34 Status of the “Masonry Concrete”
[Comment]
This is, essentially, masonry concrete not fit
for use as a building material, being used for
the dike and other relatively low-priority
structures. Given the fact that the entire power
plant is designed to be built with masonry
concrete, the quality of the concrete is poor,
and cannot withstand the load called for in the
design.
Source: Photo taken by the Study Team
Photo 3-3-35 Head Pond Rebuilt Using Steel
[Comment]
The wall that connects the head pond to the
penstock cracked, so the connector was
removed, and the head pond is being rebuilt
using steel. No sand scour equipment has been
installed.
Source: Photo taken by the Study Team
[Penstock]
The penstock has no paving beneath it; it is simply covered by a blue tarpaulin. Roughly 9 months
have passed since completion, and the erosion of the top layer of shirasu covering the hill continues.
If erosion continues, particularly on the downstream half of the slope, there is concern that a
landslide might damage the penstock and the power plant itself (Photo 3-3-36).

3-56
Photo 3-3-36 Penstock
[Penstock]
The penstock has not been paved.
The effects of a landslide on the penstock and
power plant are a concern.
Source: Photo taken by the Study Team
d-3) Karai 7 Power Plant (Project Plan 2)
Karai 7 is under construction, however the basic structure is the same as Karai 13, meaning that the
deficiencies indicated on Karai 13 may show up on Karai 7 in the future. The problems inherent to
Karai 7 are listed structure-by-structure below.
[Intake Equipment]
The intake structure of Karai 13 is the same, however the distance between the weir and the intake
structure is long. As a result, even if the sand scour gate functions perfectly, the front section of the
intake structure will be difficult to clear of sand and sediment. Also, the terrace still exists, which is
at the same height as the cover on the front of the intake structure. This means the pile of dirt and
sediment on the terrace will mix with the water in the intake (See photo 3-3-37).
Photo 3-3-37 Intake Equipment
[Comment]
The distance between the sand scour gate and
the intake structure is too large.
The dirt and sediment on the terrace will get
into the intake structure.
Source: Photo taken by the Study Team

3-57
[Headrace]
Part of the headrace is uncovered and the nearby excavated hill has not been treated. Any eroded dirt
or sediment will enter the headrace (Photo 3-3-38).
Photo 3-3-38 Headrace
[Comment]
The excavated hill near the uncovered section
of headrace has not been treated, and erosion
has already begun. As this could become a
large landslide concern in the future, shotcrete
or other reinforcing material must be installed
soon.
Source: Photo taken by the Study Team
[Head Pond]
The basic structure and materials are the same as for Karai 13; there are concerns regarding their
strength (Photo 3-3-39).
Photo 3-3-39 Head Pond Under Construction
[Comment]
Just as with the Karai 13 head pond, masonry
concrete is being used for the construction,
however there are visible gaps between the
boulders that have not been appropriately filled
with mortar. The strength of the structure is in
question.
Source: Photo taken by the Study Team
[Penstock and Spillway]
The penstock is built atop marshlands (it is typically built on a ridge), in an area where rainfall
collects. Upon completion, a landslide sheared the pipe off at a weld and shifted it. The spillway lies
side-by-side with the penstock, but is uncovered; the blockage created by the landslide could cause it
to overflow (Photo 3-3-40).
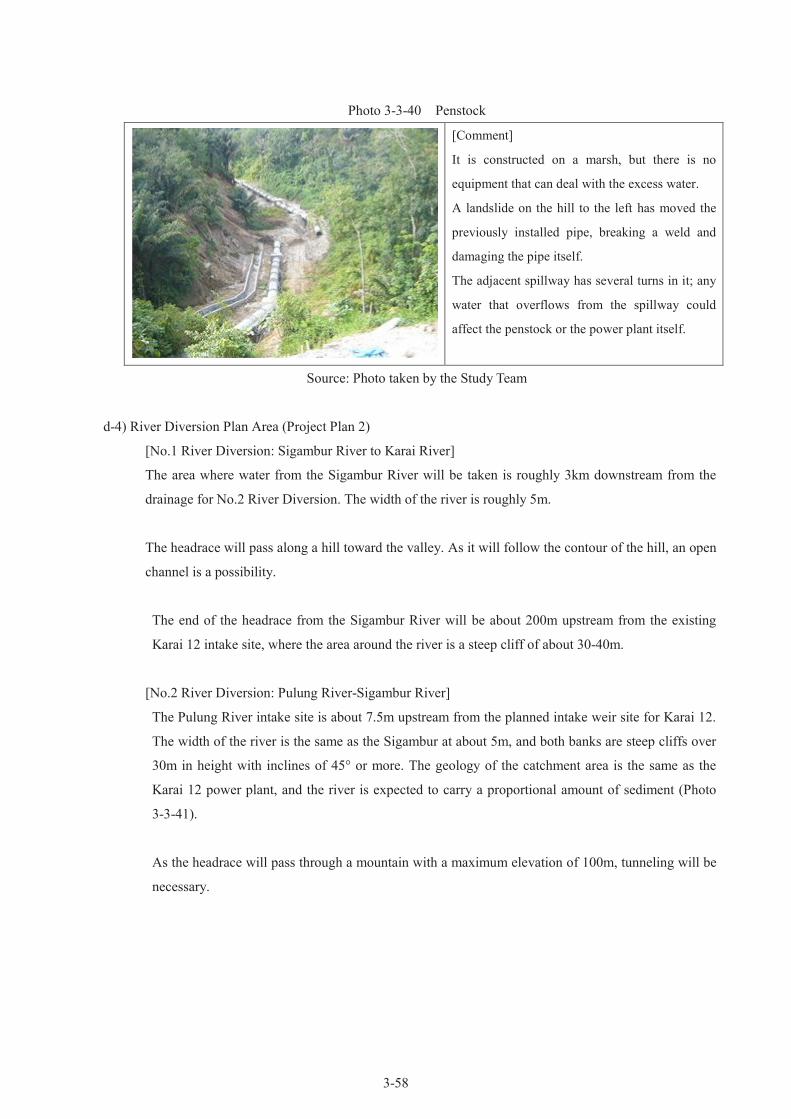
3-58
Photo 3-3-40 Penstock
[Comment]
It is constructed on a marsh, but there is no
equipment that can deal with the excess water.
A landslide on the hill to the left has moved the
previously installed pipe, breaking a weld and
damaging the pipe itself.
The adjacent spillway has several turns in it; any
water that overflows from the spillway could
affect the penstock or the power plant itself.
Source: Photo taken by the Study Team
d-4) River Diversion Plan Area (Project Plan 2)
[No.1 River Diversion: Sigambur River to Karai River]
The area where water from the Sigambur River will be taken is roughly 3km downstream from the
drainage for No.2 River Diversion. The width of the river is roughly 5m.
The headrace will pass along a hill toward the valley. As it will follow the contour of the hill, an open
channel is a possibility.
The end of the headrace from the Sigambur River will be about 200m upstream from the existing
Karai 12 intake site, where the area around the river is a steep cliff of about 30-40m.
[No.2 River Diversion: Pulung River-Sigambur River]
The Pulung River intake site is about 7.5m upstream from the planned intake weir site for Karai 12.
The width of the river is the same as the Sigambur at about 5m, and both banks are steep cliffs over
30m in height with inclines of 45° or more. The geology of the catchment area is the same as the
Karai 12 power plant, and the river is expected to carry a proportional amount of sediment (Photo
3-3-41).
As the headrace will pass through a mountain with a maximum elevation of 100m, tunneling will be
necessary.

3-59
Photo 3-3-41 Pulung River Intake Site
Source: Photo taken by the Study Team
e) Electrical Supply and Demand/Electrical System Survey
e-1) North Sumatra Electrical Supply and Demand, and Electrical System
According to the results of a survey conducted by the Medan office of PLN, the base electrical
consumption of the North Sumatra region is 1,000 MW, with a maximum of 1,300MW. Although this
is less than the estimates drawn out in 2012’s RUPTL 2013-2022 created by PLN (the Maximum
Demand in Table 3-3-9), the demand outstrips the supply by 200MW. The chronic shortage of energy
continues.
Looking at the items planned to increase the energy supply in order to reduce the energy deficiency,
the main source of energy in 2022 will be coal and gas, with hydro power and geothermal after that.
As for the mini-hydro power this project is concerned with, the current amount being generated is
10MW (as of 2013), with plans to increase that to 134MW by 2016. Plan 1 of this project adds a new
9.0MW facility, while Plan 2 adds an anticipated 5.7MW expansion, making the contributions of this
project, should it be enacted, quite large.
The North Sumatra power lines are a 240mmx2 conductor circuit rated for a voltage of 150KV, and
encircle Lake Toba. The electric supply forms three tightly-formed loops, with Lake Toba at the
center. Mini-hydro power is typically distributed via a 20KV electrical supply. Figure 3-3-9 is a map
of North Sumatra’s electrical supply system. Figure 3-3-10 is a diagram of the electrical system itself.
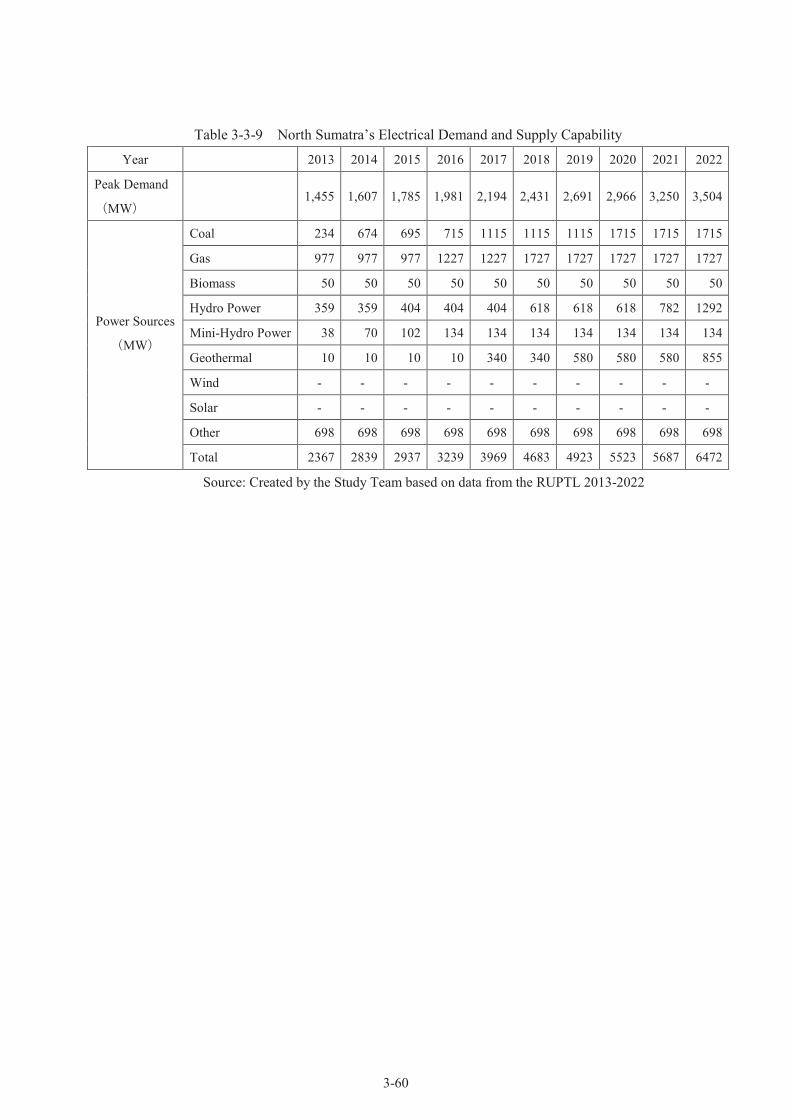
3-60
Table 3-3-9 North Sumatra’s Electrical Demand and Supply Capability
Year 2013 2014 2015 2016 2017 2018 2019 2020 2021 2022
Peak Demand
(MW) 1,455 1,607 1,785 1,981 2,194 2,431 2,691 2,966 3,250 3,504
Power Sources
(MW)
Coal 234 674 695 715 1115 1115 1115 1715 1715 1715
Gas 977 977 977 1227 1227 1727 1727 1727 1727 1727
Biomass 50 50 50 50 50 50 50 50 50 50
Hydro Power 359 359 404 404 404 618 618 618 782 1292
Mini-Hydro Power 38 70 102 134 134 134 134 134 134 134
Geothermal 10 10 10 10 340 340 580 580 580 855
Wind - - - - - - - - - -
Solar - - - - - - - - - -
Other 698 698 698 698 698 698 698 698 698 698
Total 2367 2839 2937 3239 3969 4683 4923 5523 5687 6472
Source: Created by the Study Team based on data from the RUPTL 2013-2022
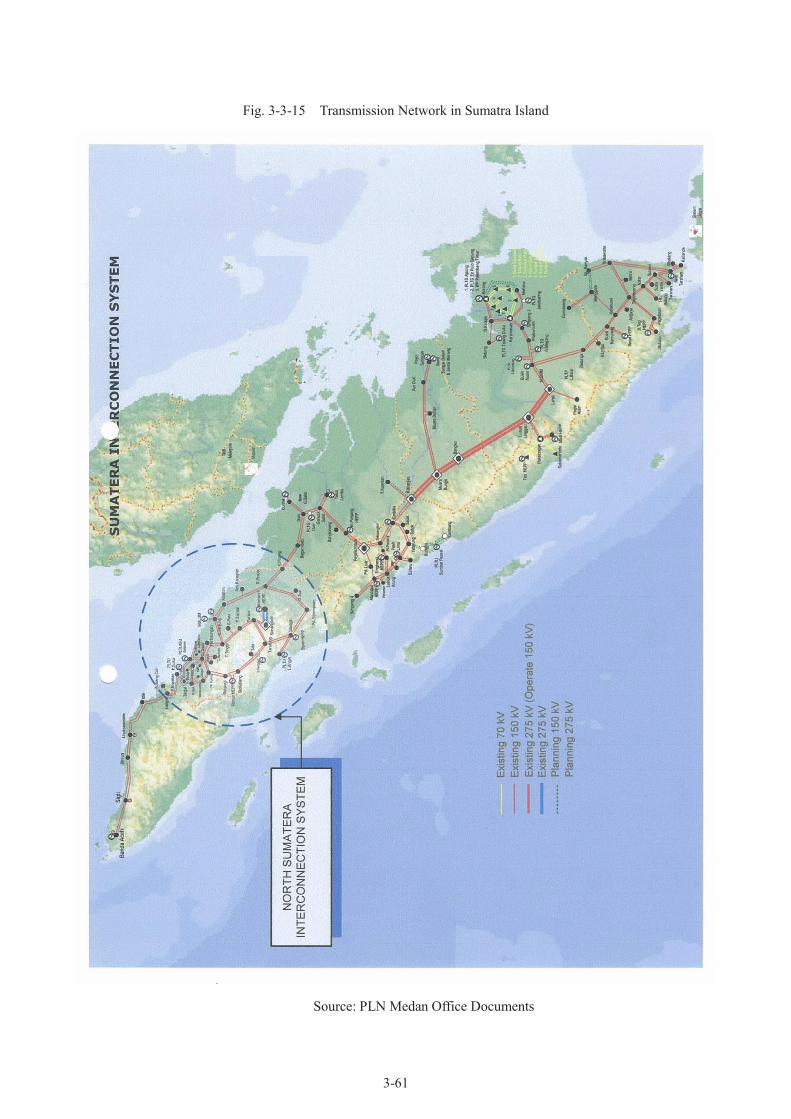
3-61
Fig. 3-3-15 Transmission Network in Sumatra Island
Source: PLN Medan Office Documents
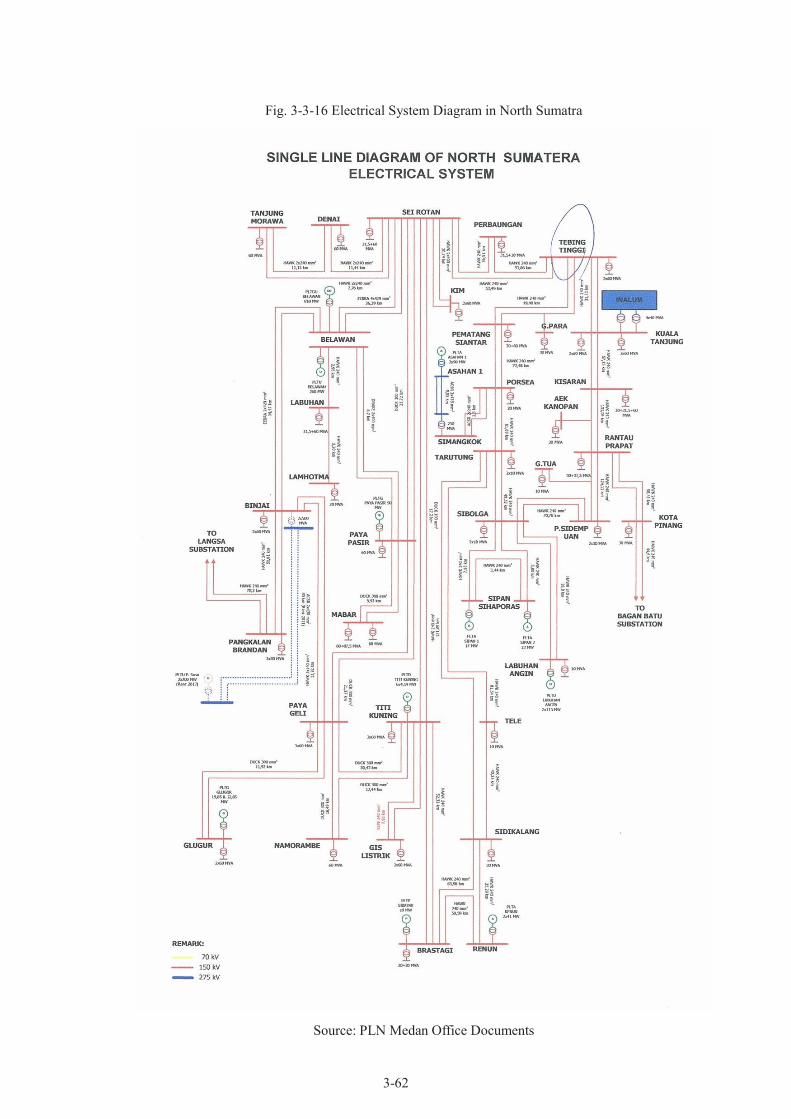
3-62
Fig. 3-3-16 Electrical System Diagram in North Sumatra
Source: PLN Medan Office Documents

3-63
e-2) Electrical Demand in the Karai Region
The demand for electricity in the Karai region this project plans to supply is shown in Table 3-3-10;
the current peak demand is 25-28MW. According to a survey conducted by the PLN office in Medan,
in the North Sumatra region where a chronic electricity shortage persists, the low demand of the
Karai region means that the supply currently outstrips demand. According to a survey conducted by
Chodai’s resident long-term dispatch engineers, Karai 13’s output is being restricted. This fact was
confirmed by the survey conducted by the PLN office in Medan.
The power distribution lines are not structured to allow power to flow freely through them like a
power line. The power lines and power distribution lines serve different purposes: where the power
lines are designed to let power flow without restriction to the transformers they connect to, power
distribution lines are designed to distribute electricity to areas where it is needed. Therefore, even if
there is a gap between the amount of electricity produced and the amount consumed in a given area,
there are still limits to how much can be sent, based on the size of the conductor and the amount
needed. These limitations occur even in the Karai region, impeding the flow of electricity. This is not
a problem unique to the area; even in Japan with the introduction of solar power, the same situation
arises. Restrictions and limits are being placed on the amount of power that can be received.
In order to resolve the cause of these restrictions, the power distribution system will have to be
re-evaluated and the main power lines upgraded, however PLN has no intention of doing so.
Within Table 3-3-10, which shows the demand for the Karai region, the applications to purchase
40MW worth of industrial power is listed as potential demand, but due to the high level of uncertainty
regarding this figure, it has not been included in the calculations. Therefore, factoring in Karai 7,
which is due to begin operating next year, as well as the output increase of roughly 6-9MW, we
estimate that the supply will overcome demand.
Due to the reasons listed above, the plan to augment existing equipment or install new equipment
requires a plan to upgrade the current 20KV electrical system distribution lines currently being used
to receive mini-hydro power to a superior 150KV system. Compared to the current system,
connecting to stable 150KV lines would prevent power plants from tripping due to events such as
lightning strikes and ground faults, and make a large contribution to the stability of the power supply.
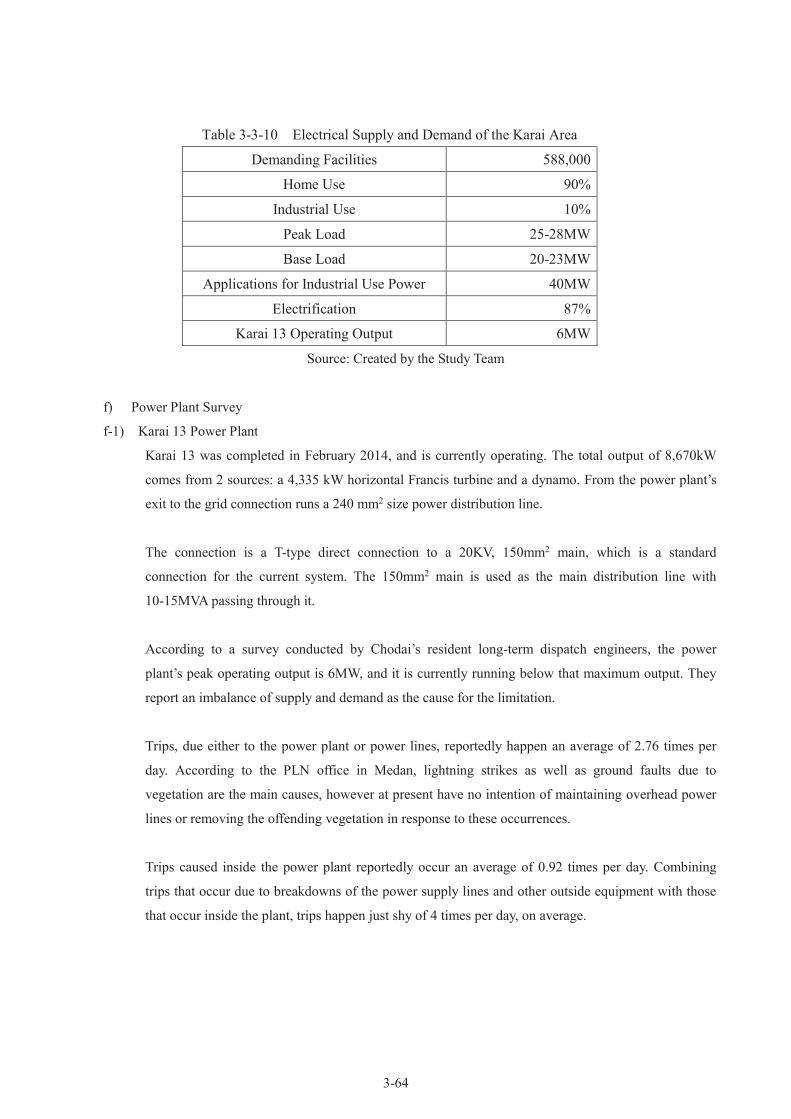
3-64
Table 3-3-10 Electrical Supply and Demand of the Karai Area
Demanding Facilities 588,000
Home Use 90%
Industrial Use 10%
Peak Load 25-28MW
Base Load 20-23MW
Applications for Industrial Use Power 40MW
Electrification 87%
Karai 13 Operating Output 6MW
Source: Created by the Study Team
f) Power Plant Survey
f-1) Karai 13 Power Plant
Karai 13 was completed in February 2014, and is currently operating. The total output of 8,670kW
comes from 2 sources: a 4,335 kW horizontal Francis turbine and a dynamo. From the power plant’s
exit to the grid connection runs a 240 mm2 size power distribution line.
The connection is a T-type direct connection to a 20KV, 150mm2 main, which is a standard
connection for the current system. The 150mm2 main is used as the main distribution line with
10-15MVA passing through it.
According to a survey conducted by Chodai’s resident long-term dispatch engineers, the power
plant’s peak operating output is 6MW, and it is currently running below that maximum output. They
report an imbalance of supply and demand as the cause for the limitation.
Trips, due either to the power plant or power lines, reportedly happen an average of 2.76 times per
day. According to the PLN office in Medan, lightning strikes as well as ground faults due to
vegetation are the main causes, however at present have no intention of maintaining overhead power
lines or removing the offending vegetation in response to these occurrences.
Trips caused inside the power plant reportedly occur an average of 0.92 times per day. Combining
trips that occur due to breakdowns of the power supply lines and other outside equipment with those
that occur inside the plant, trips happen just shy of 4 times per day, on average.

3-65
Table 3-3-11 Karai 13 Monthly Sales Volume and Utilization Rate (Oct. 2014 Survey Data)
Meter Value Amount
Sold
Utilization
Rate
Outages (Internal
Incidents)
Outages (External
Incidents)
Month kwh-meter kwh % Occurrences Occurrences
3 1796.8 2019.4 33.9
4 3816.2 2902.1 50.4
5 6718.3 3532.7 59.4
6 10251.0 3181.5 55.2
7 13432.5 4170.3 70.1 41 85
8 17602.8 4415.7 74.2 28 93
9 22018.5 4397.8 76.4 16 76
Total Number of Trips 85 254
Source: Created by the Study team, Drawing from Operation Records
f-2) Karai 7 Power Plant
Karai 7 is under construction, and scheduled to begin operating in April 2015. The total output for the
plant is 7,400 KW, from 2 sources: a 3,700KW horizontal Francis turbine and a dynamo.
This power plant connects to the main via a 150mm2 size power distribution line. The supply to the
main is guaranteed through this line, however the demand of the Karai region is low, so output
restrictions on the existing power plants will be applied to Karai 7 once it is completed and begins
generating power.
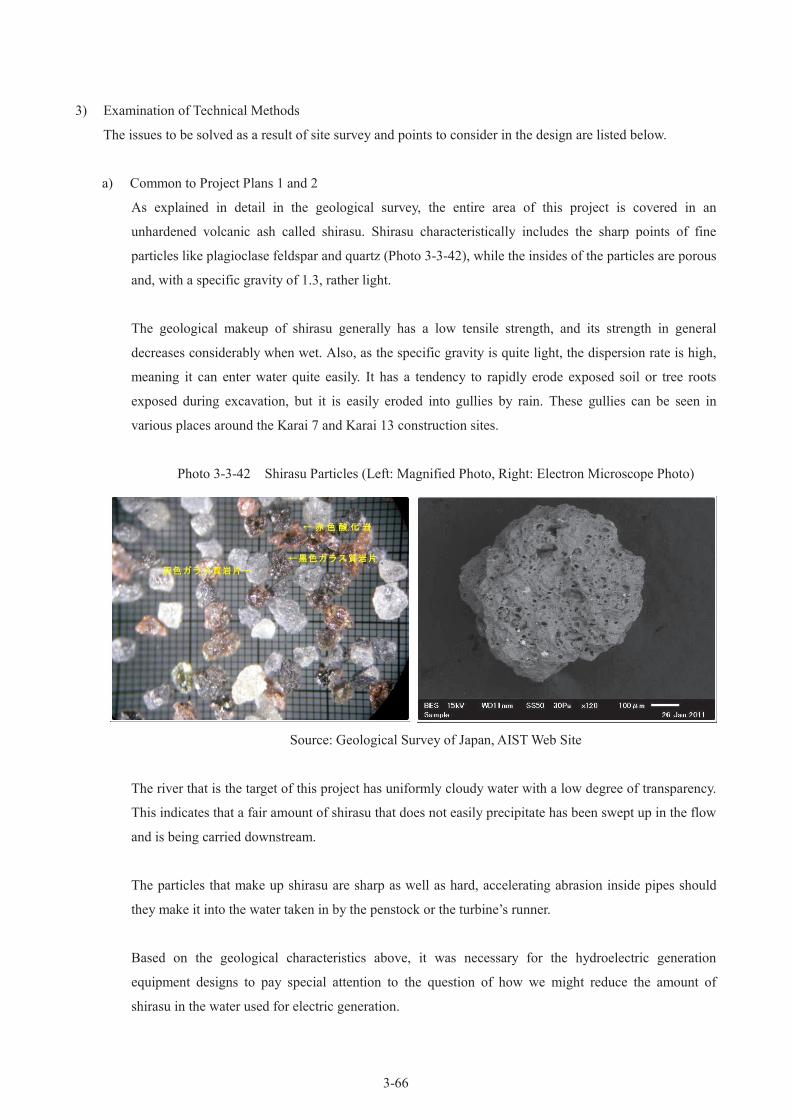
3-66
3) Examination of Technical Methods
The issues to be solved as a result of site survey and points to consider in the design are listed below.
a) Common to Project Plans 1 and 2
As explained in detail in the geological survey, the entire area of this project is covered in an
unhardened volcanic ash called shirasu. Shirasu characteristically includes the sharp points of fine
particles like plagioclase feldspar and quartz (Photo 3-3-42), while the insides of the particles are porous
and, with a specific gravity of 1.3, rather light.
The geological makeup of shirasu generally has a low tensile strength, and its strength in general
decreases considerably when wet. Also, as the specific gravity is quite light, the dispersion rate is high,
meaning it can enter water quite easily. It has a tendency to rapidly erode exposed soil or tree roots
exposed during excavation, but it is easily eroded into gullies by rain. These gullies can be seen in
various places around the Karai 7 and Karai 13 construction sites.
Photo 3-3-42 Shirasu Particles (Left: Magnified Photo, Right: Electron Microscope Photo)
Source: Geological Survey of Japan, AIST Web Site
The river that is the target of this project has uniformly cloudy water with a low degree of transparency.
This indicates that a fair amount of shirasu that does not easily precipitate has been swept up in the flow
and is being carried downstream.
The particles that make up shirasu are sharp as well as hard, accelerating abrasion inside pipes should
they make it into the water taken in by the penstock or the turbine’s runner.
Based on the geological characteristics above, it was necessary for the hydroelectric generation
equipment designs to pay special attention to the question of how we might reduce the amount of
shirasu in the water used for electric generation.
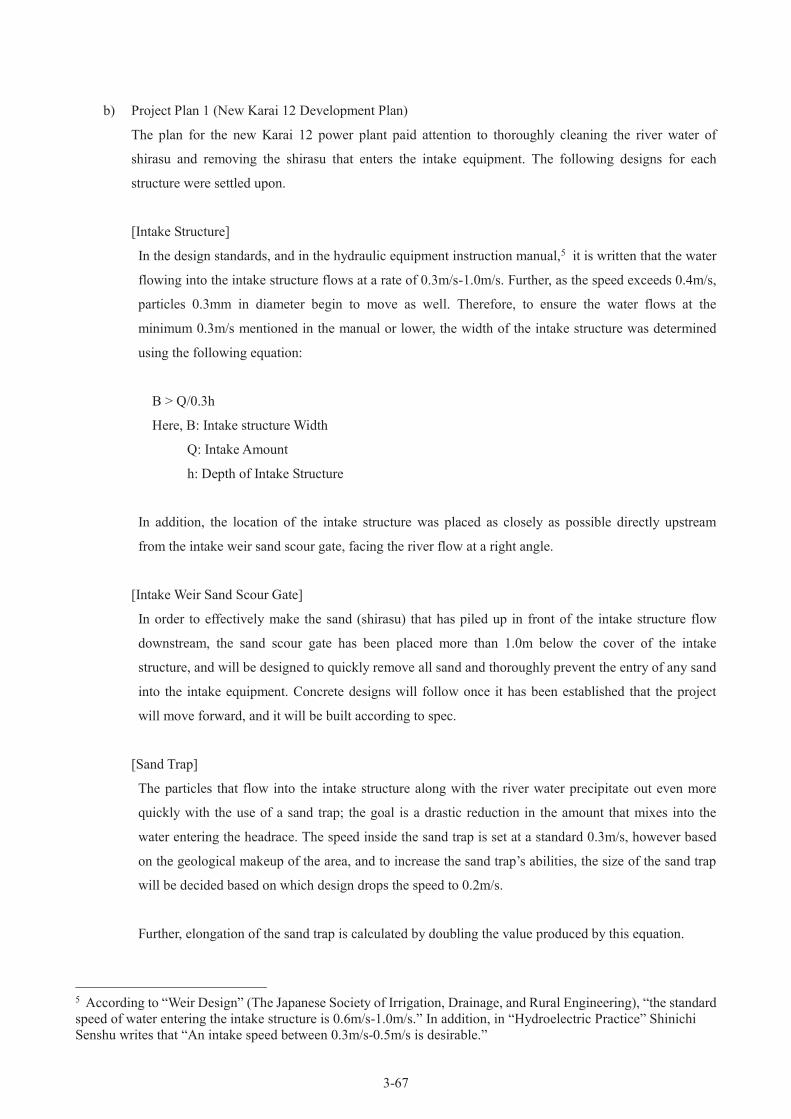
3-67
b) Project Plan 1 (New Karai 12 Development Plan)
The plan for the new Karai 12 power plant paid attention to thoroughly cleaning the river water of
shirasu and removing the shirasu that enters the intake equipment. The following designs for each
structure were settled upon.
[Intake Structure]
In the design standards, and in the hydraulic equipment instruction manual,5 it is written that the water
flowing into the intake structure flows at a rate of 0.3m/s-1.0m/s. Further, as the speed exceeds 0.4m/s,
particles 0.3mm in diameter begin to move as well. Therefore, to ensure the water flows at the
minimum 0.3m/s mentioned in the manual or lower, the width of the intake structure was determined
using the following equation:
B > Q/0.3h
Here, B: Intake structure Width
Q: Intake Amount
h: Depth of Intake Structure
In addition, the location of the intake structure was placed as closely as possible directly upstream
from the intake weir sand scour gate, facing the river flow at a right angle.
[Intake Weir Sand Scour Gate]
In order to effectively make the sand (shirasu) that has piled up in front of the intake structure flow
downstream, the sand scour gate has been placed more than 1.0m below the cover of the intake
structure, and will be designed to quickly remove all sand and thoroughly prevent the entry of any sand
into the intake equipment. Concrete designs will follow once it has been established that the project
will move forward, and it will be built according to spec.
[Sand Trap]
The particles that flow into the intake structure along with the river water precipitate out even more
quickly with the use of a sand trap; the goal is a drastic reduction in the amount that mixes into the
water entering the headrace. The speed inside the sand trap is set at a standard 0.3m/s, however based
on the geological makeup of the area, and to increase the sand trap’s abilities, the size of the sand trap
will be decided based on which design drops the speed to 0.2m/s.
Further, elongation of the sand trap is calculated by doubling the value produced by this equation.
5 According to “Weir Design” (The Japanese Society of Irrigation, Drainage, and Rural Engineering), “the standard
speed of water entering the intake structure is 0.6m/s-1.0m/s.” In addition, in “Hydroelectric Practice” Shinichi
Senshu writes that “An intake speed between 0.3m/s-0.5m/s is desirable.”

3-68
L > h/vg×u
Here, L: Maximum Length of Sand Trap(m)
h: Depth of Water in Sand Trap(m)
u: Average Speed Inside Sand Trap(m/s)
vg: Speed of Precipitating 0.3mm Sand Particle, 0.04m/s
In order to completely remove any sand, a sand scour gate is typically used in Japan, to great effect.
Since it is assumed there will be a need for regular sand removal once the plant is operational, a bypass
will be installed, running from the front of the sand trap gate to the headrace, so that sand removal can
take place without interrupting operation of the plant itself.
[Headrace]
In order to reduce construction costs, the headrace is usually an open channel installed along the local
geography. The hill being excavated is typically reinforced as soon as excavation finishes, however to
prevent eroded dirt and sand from entering the headrace, the entire headrace will be sealed with
concrete.
[Head Pond]
The head pond, established as the connecting point for the headrace and penstock, regulates changes to
the power plant’s load, in addition to precipitating the last of the sand and dirt from the water to
prevent damage to the pipes and turbines.
As sand removal is particularly important to this project, a sand trap and sand scouring equipment will
be installed.
c) Project Plan 2 (Existing Power Plant Suppletion with River Diversion Plan)
As the results of the site survey have shown, the existing Karai 13 facility and the Karai 7 facility under
construction are to be used safely in the long term with an increased generation capacity and output, the
existing equipment urgently needs restructuring.
Therefore, the repairs necessary to keep both existing facilities running as pieces of infrastructure for the
area have been added to the river diversion proposal of Plan 2. As in Plan 1, the main objective of
repairs to current equipment will be to strengthen the following functions:
- Construct facilities such that absolutely no sediment enters the intake structure.
- Construct facilities such that any sediment that does enter can quickly be removed.
c-1) Existing Karai 13 Power Plant
[Intake Structure]
The sand scour gate currently installed in the intake weir cannot adequately fulfill its duty, and the

3-69
intake structure location and orientation are incorrect. As a result, the current structure will be
exchanged for a new sand scour gate, intake structure and intake channel as per Figure 3-3-11.
Fig. 3-3-17 General Map of Intake Equipment Renovation
Source: Created by the Study Team based on “Karai 13 Hydro Power Project Drawing for
Construction”
[Sand Trap]
The sand trap is the most important structure of this power plant, and a complete restructuring will
be necessary. In this case, a multi-trap system like the one in Figure 3-3-12 would be effective.
Fig. 3-3-18 Example of Sand Trap Remodeling Method
Source: Civil Engineering Handbook
[Head Pond]
The existing steel head pond has a number of support beams installed, which throw off the flow of
Sand Flushing Gate
Headrace
Submerged
Weir Gate
Gate
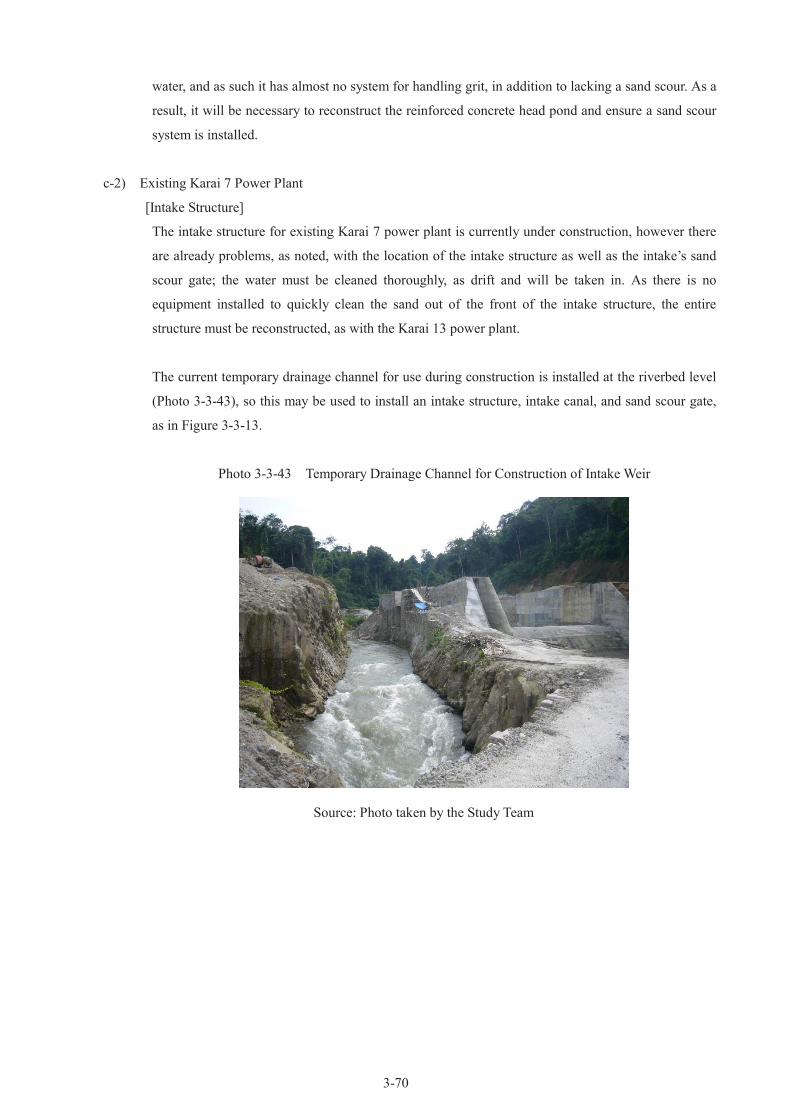
3-70
water, and as such it has almost no system for handling grit, in addition to lacking a sand scour. As a
result, it will be necessary to reconstruct the reinforced concrete head pond and ensure a sand scour
system is installed.
c-2) Existing Karai 7 Power Plant
[Intake Structure]
The intake structure for existing Karai 7 power plant is currently under construction, however there
are already problems, as noted, with the location of the intake structure as well as the intake’s sand
scour gate; the water must be cleaned thoroughly, as drift and will be taken in. As there is no
equipment installed to quickly clean the sand out of the front of the intake structure, the entire
structure must be reconstructed, as with the Karai 13 power plant.
The current temporary drainage channel for use during construction is installed at the riverbed level
(Photo 3-3-43), so this may be used to install an intake structure, intake canal, and sand scour gate,
as in Figure 3-3-13.
Photo 3-3-43 Temporary Drainage Channel for Construction of Intake Weir
Source: Photo taken by the Study Team
3-71
Fig. 3-3-19 Suggested Intake Remodeling for Karai 7 Power Plant
Source: Created by the Study Team based on “Karai-7 Hydro Power Project Drawing for Construction”
[Sand Trap]
Since it is sufficiently large, it appears that a gate capable of draining sand can be installed at the end
of the sand trap, just as in Karai 13.

3-72
(4) Project Plan Summary
1) Basic Policy for Deciding Project Details
In order for this project to make full use of the natural water resources present in the Karai river basin in
Simalungun, North Sumatra, Indonesia, the best development plan must be chosen from a comprehensive
drainage system development point of view, making maximum power supply the basic policy therein. In
addition, by making applicable hydro power facilities into run-of-river type, this project will prevent
wide-area submersion caused by construction, and bring harmony to natural and social considerations.
At the time of drafting the development plan, technical assessments of geographical terrain, meteorology, and
upstream/downstream development plans will be performed, as well as economical assessments of future
operation and maintenance management. Ultimately, the most appropriate plan will be decided based on the
intentions of local business enterprises. Lastly, the possibility of participation of Japanese investigators in
operations to bring Japanese technical expertise to the project will also be considered.
Given these findings, this project’s basic policy has been defined as follows:
- Draft a plan that ensures facilities last long and become social capital for the public good
- Have consideration for environmental and social impact through natural and social environment
assessments
- Select hydro-mechanical and hydro-electrical equipment with the intent of reducing maintenance
management cost
- Select the most economical development plan making the most use of natural water power resources
that have drainage systems
2) Design Summary and Specifications of Applicable Equipment
a) Study of Generation Plan
This survey, in addition to reviewing the plans for the new Karai 12 power plant, compared an
alternative plan to divert rivers with the aim of maximizing the use of existing facilities along the same
river system, thereby increasing the output of the currently operational Karai 13 and the Karai 7 facility
under construction. The most suitable development plan will be chosen. An examination of each plan
follows.
3-73
a-1) Project Plan 1: Construction of New Karai 12 Power Plant
① Review of Existing Reports
Regarding the plan for the new Karai 12 power plant, according to information from the main
developer of this project, BIE, several surveys have been conducted in the past, and each produced a
different development plan. No staff members know the details of these existing surveys, and only
parts of the reports and diagrams have been saved, so we could not gain a systematic understanding of
the existing surveys. In response to this, the documents received were organized into an existing
survey plan, and its validity and chances of being appropriated into this survey were assessed. Two
types of documents from which we could glean the previous plans were received and their contents
closely examined; there were uncertainties about using either one to form a plan. It was determined
that there is enough room near each candidate site for an equipment layout that would produce more
efficient head. Therefore, this survey will use a 1/50,000 scale topographic map as a base for
reconsidering the equipment layout, and creating a new plan.
Table 3-4-1 shows the contents and evaluation of the documents obtained.
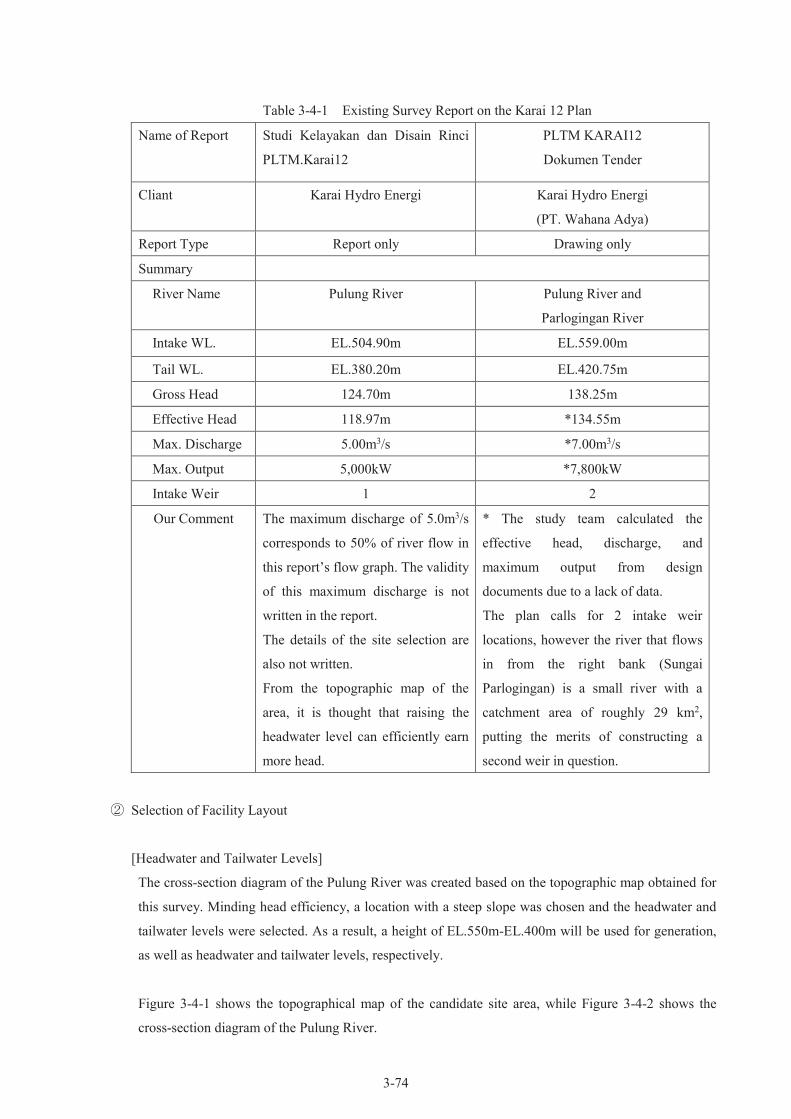
3-74
Table 3-4-1 Existing Survey Report on the Karai 12 Plan
Name of Report Studi Kelayakan dan Disain Rinci
PLTM.Karai12
PLTM KARAI12
Dokumen Tender
Cliant Karai Hydro Energi Karai Hydro Energi
(PT. Wahana Adya)
Report Type Report only Drawing only
Summary
River Name Pulung River Pulung River and
Parlogingan River
Intake WL. EL.504.90m EL.559.00m
Tail WL. EL.380.20m EL.420.75m
Gross Head 124.70m 138.25m
Effective Head 118.97m *134.55m
Max. Discharge 5.00m3/s *7.00m3/s
Max. Output 5,000kW *7,800kW
Intake Weir 1 2
Our Comment The maximum discharge of 5.0m3/s
corresponds to 50% of river flow in
this report’s flow graph. The validity
of this maximum discharge is not
written in the report.
The details of the site selection are
also not written.
From the topographic map of the
area, it is thought that raising the
headwater level can efficiently earn
more head.
* The study team calculated the
effective head, discharge, and
maximum output from design
documents due to a lack of data.
The plan calls for 2 intake weir
locations, however the river that flows
in from the right bank (Sungai
Parlogingan) is a small river with a
catchment area of roughly 29 km2,
putting the merits of constructing a
second weir in question.
② Selection of Facility Layout
[Headwater and Tailwater Levels]
The cross-section diagram of the Pulung River was created based on the topographic map obtained for
this survey. Minding head efficiency, a location with a steep slope was chosen and the headwater and
tailwater levels were selected. As a result, a height of EL.550m-EL.400m will be used for generation,
as well as headwater and tailwater levels, respectively.
Figure 3-4-1 shows the topographical map of the candidate site area, while Figure 3-4-2 shows the
cross-section diagram of the Pulung River.

3-75
Fig. 3-4-1 Topographical Map of Candidate Site Area for Karai 12 Project
Source: Created by the Study Team Based on a 1:50,000 Indonesian Topographic Map

3-76
Fig. 3-4-2 Cross-Section Diagram of the Pulung River
Source: Created by the Study Team
[Headrace Territory]
The area the headrace will pass through has a relatively gentle slope; once the open channel is
established, it has been determined that the amount of earthwork will be minimal, thus the left bank
has been chosen.
[Head Pond and Penstock]
The head pond will be positioned on a flat section of ridge on the left bank around EL. 550m. The
penstock will be placed along the ridge of a northeast-facing hill, more toward the river from the head
pond. The pipe will be about 350m in length.
③ Determination of Maximum Discharge
Based on the Pulung River intake site flow graph organized by the study team, the three cases had
maximum discharge estimates of 6.0m3/s, 7.0m3/s, and 8.0m3/s; these estimates were used to calculate
construction cost and electrical output, and the maximum discharge with the lowest cost of energy
production was chosen. The estimated construction costs dealt with here were chosen for the absolute
highest maximum discharge for the sake of comparison, and do not reflect actual construction costs.
For convenience, we have followed the “Standard for the Estimation of Construction Costs to
Determine the Survey Scope for the Optimization of Undeveloped Land” from the New Energy
Foundation’s “Small- and Medium-Scale Hydroelectric Generation Handbook” when making these
calculations. When calculating the electrical production, calculations were performed with the river
flow following deduction of a 0.5m3/s maintenance flow corresponding to a 100km2 catchment area,
since discharge from the river’s flow back into the environment is required.
Since the case with a maximum discharge of 7.0m3/s is the cheapest, this value was used for the
Intake WL.
Tail WL.
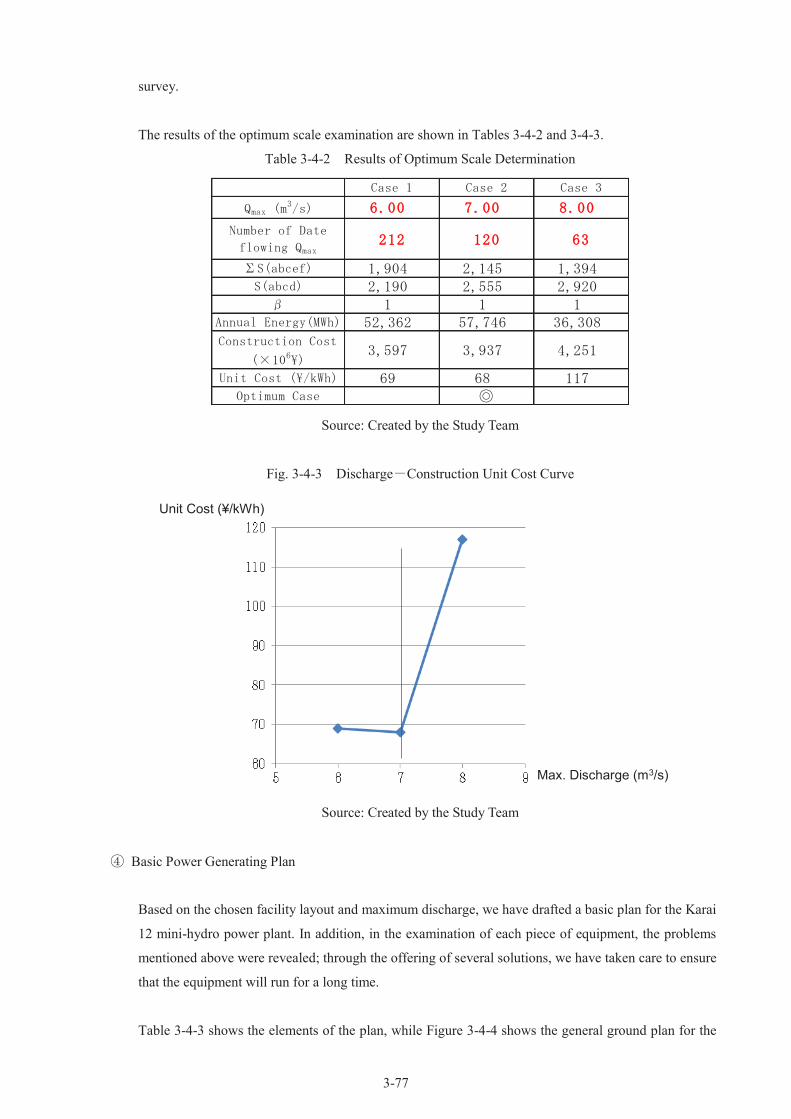
3-77
survey.
The results of the optimum scale examination are shown in Tables 3-4-2 and 3-4-3.
Table 3-4-2 Results of Optimum Scale Determination
69 68 117◎
Unit Cost (\/kWh)
Optimum Case
52,362 57,746 36,308
3,597 3,937 4,251
Annual Energy(MWh)
Construction Cost
(×106\)
2,190 2,555 2,9201 1 1
S(abcd)
β
212 120 63
1,904 2,145 1,394
Number of Date
flowing Qmax
ΣS(abcef)
Case 1 Case 2 Case 3
6.00 7.00 8.00Qmax (m3/s)
Source: Created by the Study Team
Fig. 3-4-3 Discharge-Construction Unit Cost Curve
Source: Created by the Study Team
④ Basic Power Generating Plan
Based on the chosen facility layout and maximum discharge, we have drafted a basic plan for the Karai
12 mini-hydro power plant. In addition, in the examination of each piece of equipment, the problems
mentioned above were revealed; through the offering of several solutions, we have taken care to ensure
that the equipment will run for a long time.
Table 3-4-3 shows the elements of the plan, while Figure 3-4-4 shows the general ground plan for the
Unit Cost (¥/kWh)
Max. Discharge (m3/s)

3-78
Karai 12 mini-hydro power plant.
Regarding the Annual Energy Production calculations: as discharge from the river’s flow back into the
environment is required, calculations were performed with the river flow following deduction of a
0.5m3/s maintenance flow corresponding to a 100km2 catchment area. In addition, a reduction in
generator efficiency when the discharge is reduced was taken into consideration.
Table 3-4-3 Elements of the Karai 12 Power Plant Plan
River Name Pulung River
Intake WL. EL. m 550.00
Tail WL. EL. m 400.00
Intake Weir no 1
Catchment Area km2 116.65
Type of Headrace Covered Open Channel
Length of Headrace m 1,440
Length of Penstock m 330.0
Gross Head m 150.00
Effective Head m 145.03
Max. Discharge m3/s 7.00
Max. Output kW 9,000
Annual Generating
Energy
×103kWh 64,030
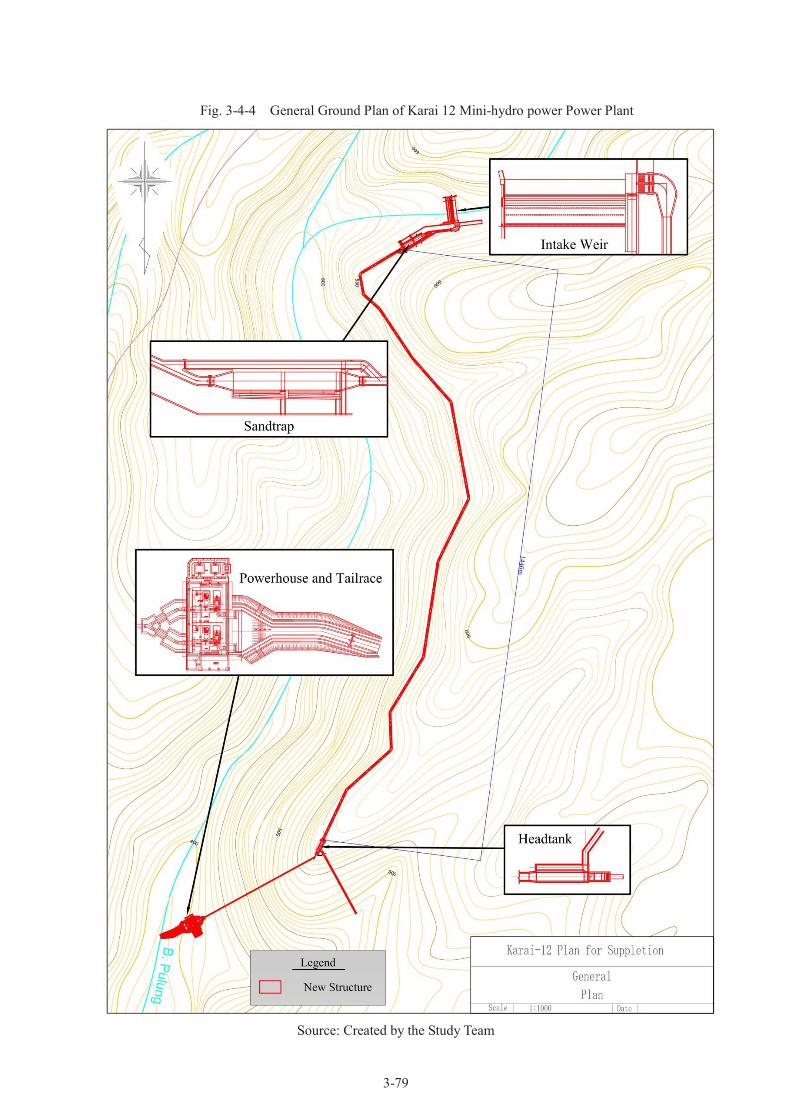
3-79
Fig. 3-4-4 General Ground Plan of Karai 12 Mini-hydro power Power Plant
Source: Created by the Study Team
3-80
a-2) Project Plan 2: Power Uprating Plan of Existing Power Plant with River Diversion
① Review of Existing Study Reports
[Karai 13 Power Plant]
The Karai 13 power plant was completed in February 2014 and is generating electricity. However,
there are no completed design documents, so the effective head and other basic generation data has not
been organized yet.
As a result, the base situation and elements used to create the output increase for existing equipment
are: the maximum discharge and generator efficiency taken off the generator’s nameplate; and the loss
calculations run based on the detailed design blueprints; these were organized by the study team.
Further, since the river flow observation post at the site of the power plant has not been established, the
study team has calculated the electrical output based on the flow graph from the planning phase.
[Karai 7 Power Plant]
The Karai 7 power plant is currently under construction, however the study team has obtained detailed
design documents. Just as with Karai 13, various data have not been organized, so the study team has,
based on the planned maximum discharge, run a loss calculation based on the blueprints, and organized
the data of the existing equipment to form a base.
Data on the Karai 13 and Karai 7 power plants are shown in Table 3-4-4.

3-81
Table 3-4-4 Elements of Existing Karai 13 and Karai 7 Power Plants
Power Plant Karai 13 Karai 7
River Name Karai River Karai River
Intake WL. EL.m 707.80 388.30
Tail WL. EL.m 541.01 300.45
Intake Weir no 1 1
Catchment Area km2 145.25 248.31
Type of Headrace Covered Open Channel Open Channel and
Covered Open Channel
Length of Headrace m 3,312.20 2,306.70
Length of Penstock m 445.12 684.84
Gross Head m 166.79 87.85
Effective Head m 155.52 76.63
Max. Discharge m3/s 6.30 11.00
Max. Output kW 8,670 7,460
Annual Generating
Energy ×103kWh 67,807 58,084
Source: Created by the Study Team from “Studi Kelayakan dan Disain Rinci PLTM, Karai 7” and
“Studi Kelayakan dan Disain Rinci PLTM, Karai 13”
[River Diversion Plans]
Regarding river diversion plans, with the commitment of BIE, Indonesian consultants are creating the
basic designs. The basic designs have 2 locations for channel plans, called River Diversion Plan 1 and
River Diversion Plan 2. The summary of these plans is shown in Fig. 3-4-5 and Table 3-4-5.

3-82
Fig. 3-4-5 Map of Karai River Diversion Locations
Table 3-4-5 Summary of Karai River Diversion Plan
Diversion Plan River Diversion 1 River Diversion 2
Name of Intake River Sigambur River Pulung River
Name of Discharge River Karai River Sigambur River
Catchment Area km2 22.22 67.74
Max. Discharge m3/s 0.79 2.42
% of Probable Flow % 70 70
Type of Headrace Open Channel Open Channel+Tunnel
Length of Headrace m 1,310 1,180
Source: Created by the Study Team Based on Data from “Pre-Feasibility Study SUPLESI PLTM
KARAI-13”
In River Diversion Plan 1, the headrace from the Sigambur River will be located approximately 200m
upstream from the existing Karai 13 intake site. The headrace will pass through a valley, and is planned
to be an open channel 1,310m long.
However, the catchment area of the Sigambur is small, and since we do not anticipate a large intake
(See Figures 3-4-6 and 3-4-7), roughly 3km upstream from the intake for River Diversion Plan 1 is
where the planned diversion from the Karai River in River Diversion Plan 2 will begin. The catchment
area of the intake location for River Diversion Plan 2 is larger than that of River Diversion Plan 1 (See
Figures 3-4-8 and 3-4-9), so we anticipate a larger intake. However, roughly 5km downstream from the
River Diversion 1
River Diversion 2
プルン川
カライ川 シガンブール川
Source: “Pre-Feasibility Study SUPLESI PLTM KARAI-13,” Annotated by the Study Team

3-83
planned intake site for the Pulung River is the planned site for the Karai 12 Power Plant, therefore both
plans cannot coexist.
In the results of the field survey, it was determined that there were no technical problems with the
existing channel plans, so they may be used in Plan 2 of this survey.
Fig. 3-4-6 River Diversion Plan 1 (Sigambur River) Catchment Area
Source: ”Pre-feasibility Study Suplesi PLTM Karai-13”
CA. of
Sigambur River
River Diversion
Plan 1 Intake of Karai13
Pulung River
CA of
Karai River

3-84
Fig. 3-4-7 Flow Duration Curve of the Sigambur River
Source: Created by the Study Team Based on Data from “Pre-feasibility Study Suplesi PLTM Karai 13”
Fig. 3-4-8 River Diversion Plan 2 (Pulung River) Catchment Area
Source: “Pre-feasibility Study Suplesi PLTM Karai 13”
River Diversion
Plan 2 Sigambur River
CA. of Pulung River
Intake Weir of
Karai13
CA. of
Karai River

3-85
Fig. 3-4-9 Flow Duration Curve of the Karai River
Source: Created by the Study Team Based on Data from “Pre-feasibility Study Suplesi PLTM Karai 13”
② Study Plan Organization for Power Uprating Plan of Existing Power Plant
Two adjacent rivers (the Sigambur and the Pulung) will be diverted into the Karai River, and in the
event of increased flow in the Karai River, the existing power plants on that river will have their
outputs increased in one of the 2 ways listed below:
- Study Case 1: Only increase what can be output during the dry season, without changing the
maximum output of the existing plant.
- Study Case 2: Allow the extra river flow to increase the maximum output of existing plant.
The contents of the 2 cases above are collected in Table 3-4-6. If the outputs are allowed to increase, as
in case 2, the construction of new powerhouses beside the existing powerhouses in each plant will be
required. Further, in each case, as revealed by the results of the survey, the replacement of the intake
structure, sand trap, and head pond will be planned as a solution to the problems noted with each. The
headrace, as determined in the examination of Case 2, will be able to handle even the increased
maximum flow comfortably, and is thus fit for use as-is in either case.

3-86
Table 3-4-6 Case Examinations of Existing Power Plant Output Increases via River Diversion
Case Case 1 Case 2
Output Increase
Method
Only increase what can be output
during the dry season, without
changing maximum output of the
existing plant.
Allow extra river flow to increase
maximum output of existing plant.
Maximum Discharge No change.
Use existing equipment.
Increase by diverted amount
(3.21m3/s)
Effect Increase in kWh only kW and kWh increase
Construction Scope Existing Equipment Renovation
・Intake Structure
・Intake Weir Sand Scour Gate
・Intake canal
・Sand Trap
・Head Pond (One section)
Existing Equipment Renovation
(Same as Case 1)
Installation of New Equipment
・ New Penstock (Divert from
existing penstock)
・New Powerhouse
・New Tailrace
・New 150kV Power Lines
Source: Created by the Study Team
③ Basic Power Generating Plan
Based on the existing flow surveys and results of hydrological analyses carried out in previous reports
on the existing plants on the Pulung and Sigambur Rivers, the following has been determined
regarding the river diversion that forms the basis of the plan to augment existing facilities:
1. The existing Karai 13 equipment utilization rate shall be calculated from the Karai River flow
diagram (Fig. 3-4-10, blue line).
2. A Load Duration Curve will be created by adding the diverted Sigambur and Pulung River
amounts to the Karai River flow diagram (Fig. 3-4-10, red line), and for Case 1 (increase of
existing power plant output only), a diverted flow was chosen so that the utilization rate would
reach the maximum value.
If 70% of the flow of the duration curves for the Sigambur and Pulung Rivers are diverted to the Karai
River, the utilization rates of plant equipment reach 99.7% and 98.4%, respectively, fulfilling the
conditions above. To achieve this, 70% of the flow in River Diversion Plans 1 and 2, a total of
3.21m3/s, was set as the ordinary intake. Figures 3-4-10 and 3-4-11 show the current condition of the
existing power plants, and the flow conditions following diversion of the rivers.
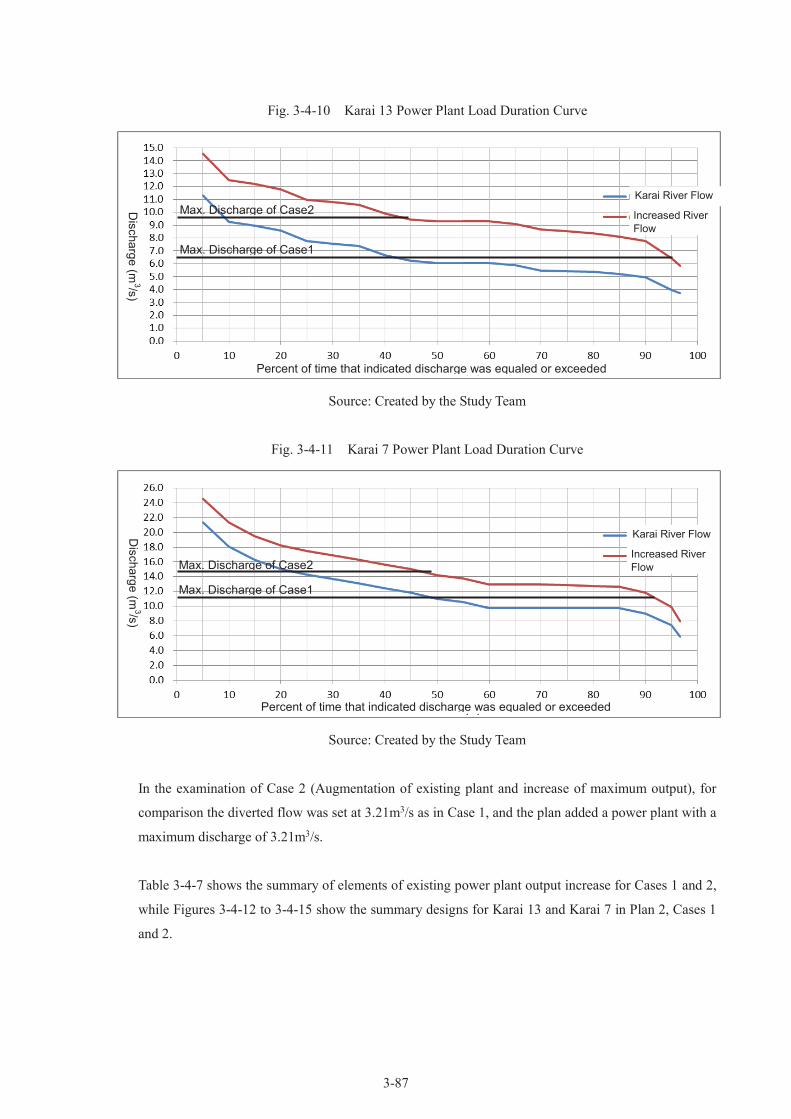
3-87
Fig. 3-4-10 Karai 13 Power Plant Load Duration Curve
Source: Created by the Study Team
Fig. 3-4-11 Karai 7 Power Plant Load Duration Curve
Source: Created by the Study Team
In the examination of Case 2 (Augmentation of existing plant and increase of maximum output), for
comparison the diverted flow was set at 3.21m3/s as in Case 1, and the plan added a power plant with a
maximum discharge of 3.21m3/s.
Table 3-4-7 shows the summary of elements of existing power plant output increase for Cases 1 and 2,
while Figures 3-4-12 to 3-4-15 show the summary designs for Karai 13 and Karai 7 in Plan 2, Cases 1
and 2.
Karai River Flow
Increased River
Flow
Max. Discharge of Case2
Max. Discharge of Case1
Max. Discharge of Case2
Max. Discharge of Case1
Karai River Flow
Increased River
Flow
Percent of time that indicated discharge was equaled or exceeded
Percent of time that indicated discharge was equaled or exceeded
Dis
cha
rge
(m3/s
) D
ischa
rge
(m3/s
)
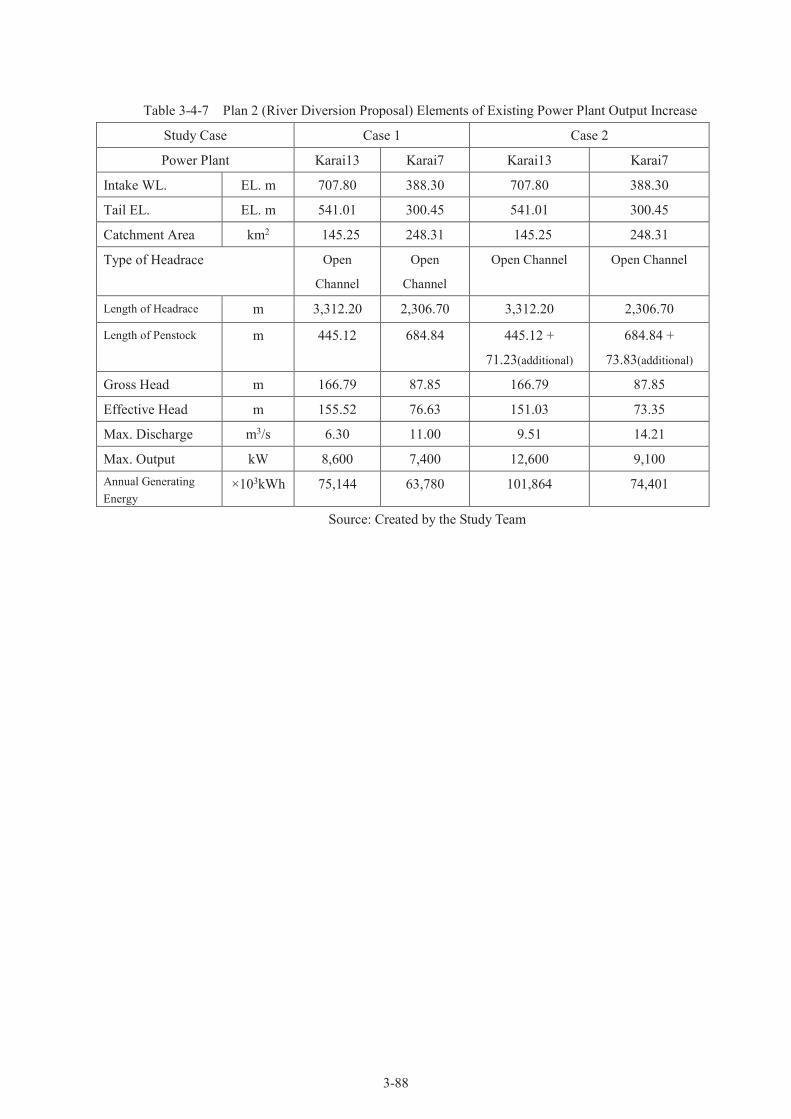
3-88
Table 3-4-7 Plan 2 (River Diversion Proposal) Elements of Existing Power Plant Output Increase
Study Case Case 1 Case 2
Power Plant Karai13 Karai7 Karai13 Karai7
Intake WL. EL. m 707.80 388.30 707.80 388.30
Tail EL. EL. m 541.01 300.45 541.01 300.45
Catchment Area km2 145.25 248.31 145.25 248.31
Type of Headrace Open
Channel
Open
Channel
Open Channel Open Channel
Length of Headrace m 3,312.20 2,306.70 3,312.20 2,306.70
Length of Penstock m 445.12 684.84 445.12 +
71.23(additional)
684.84 +
73.83(additional)
Gross Head m 166.79 87.85 166.79 87.85
Effective Head m 155.52 76.63 151.03 73.35
Max. Discharge m3/s 6.30 11.00 9.51 14.21
Max. Output kW 8,600 7,400 12,600 9,100
Annual Generating
Energy ×103kWh 75,144 63,780 101,864 74,401
Source: Created by the Study Team
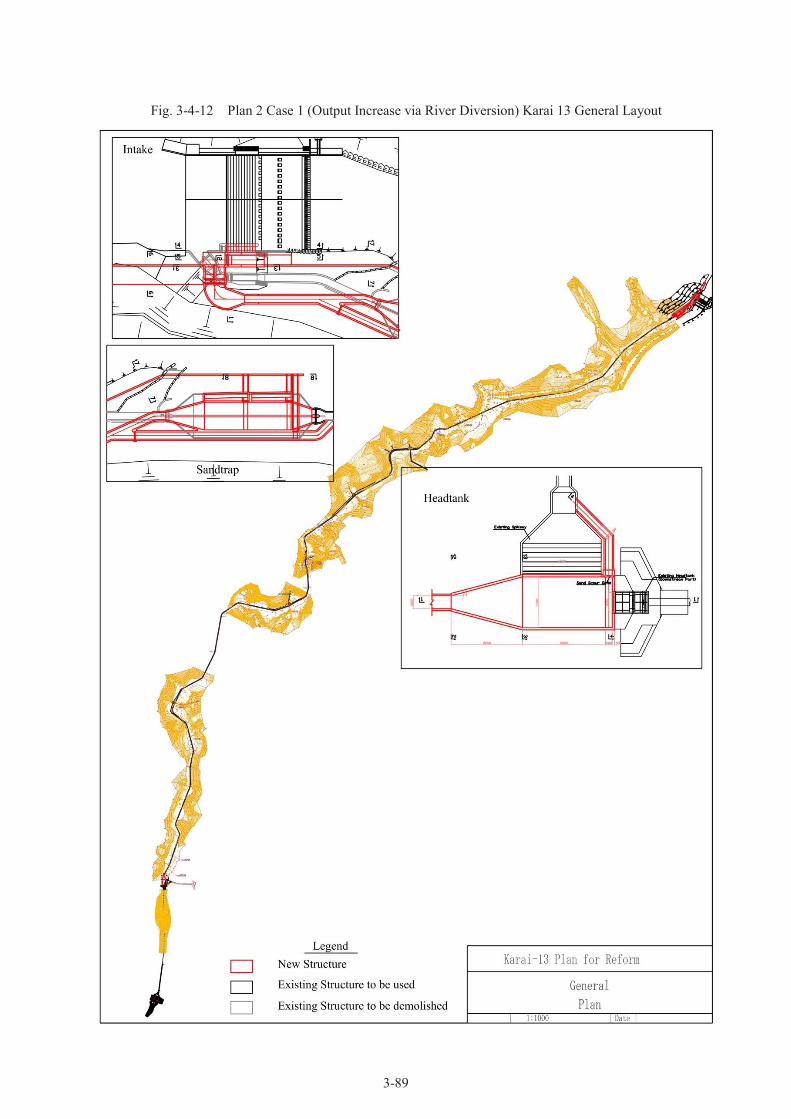
3-89
Fig. 3-4-12 Plan 2 Case 1 (Output Increase via River Diversion) Karai 13 General Layout
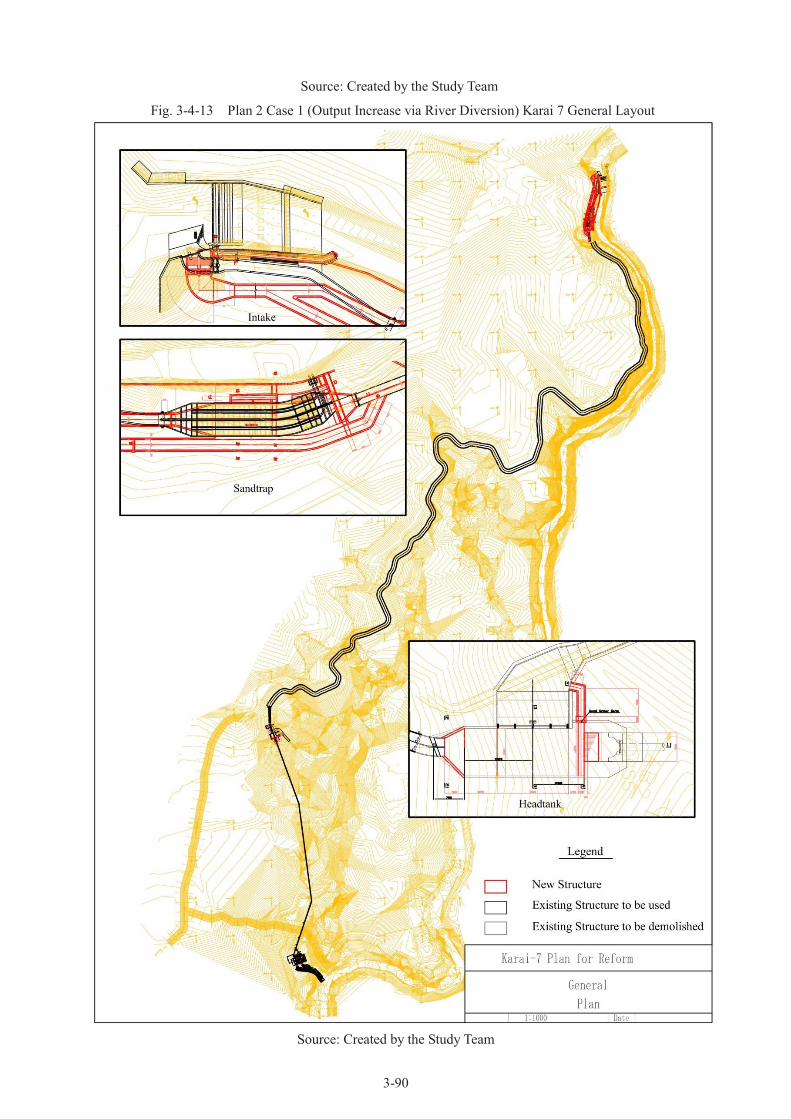
3-90
Source: Created by the Study Team
Fig. 3-4-13 Plan 2 Case 1 (Output Increase via River Diversion) Karai 7 General Layout
Source: Created by the Study Team

3-91
Fig. 3-4-14 Plan 2 Case 2 (Plant Augmentation via River Diversion) Karai 13 General Layout
Source: Created by the Study Team

3-92
Fig. 3-4-15 Plan 2 Case 2 (Plant Augmentation via River Diversion) Karai 7 General Layout
Source: Created by the Study Team

3-93
b) Examination of Planned Generation Equipment
b-1) Project Plan 1: Karai 12 Power Plant
The new facility proposed in Plan 1 will generate an output of 9.0MW. However we cannot
recommend the plan to connect it to the same 20KV distribution line as Karai 13, as this will result in a
large amount of supply line-related trips and issues due to lack of demand, as noted above. Thankfully,
there are plans to construct the nearby Negeri Dolok 150KV transformer; upgrading from a 20KV
distribution line to a 150 KV line, we can plan to reduce the aforementioned number of trips and relax
output limits, and expect an increase in the utilization rate of each plant.
Fig. 3-4-16 Map of Karai 12 Electrical System (New Facility Proposal)
Source: Created by the Study Team
b-2) Project Plan 2: River Diversion Plan, Existing Karai 13 and Karai 7 Facilities
Karai 13 and Karai 7 will receive output increases of 4,000kW and 1,700kW, respectively. These
outputs will be achieved through the installation of 1 new dynamo in each plant. It has been
determined that the installation of new equipment alongside the existing equipment will result in a
greater increase in output than the simple renovation of existing equipment alone.
Therefore, through the expansion of existing equipment, we will achieve output increases of 4.0MW
and 1.7MW, a Power Factor of 0.8, Short-Circuit Ratios of 1.0, and a transformer capacity fit for the
amount of power being generated.
The secondary voltage will be 20KV, in order to connect to the existing distribution lines.
As a result, the total outputs will be 12.6MW for Karai 13, and 9.1MW for Karai 7. The currently
installed distribution wiring has the capacity to carry the power from the power plant to the mains.
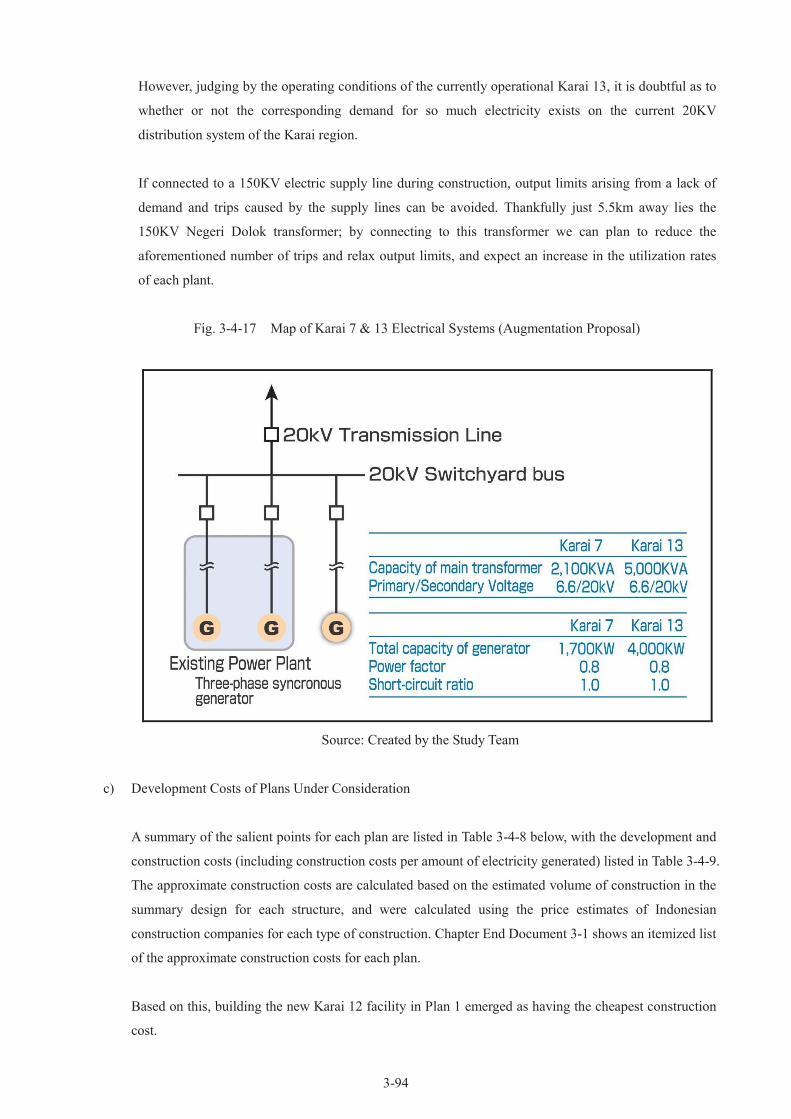
3-94
However, judging by the operating conditions of the currently operational Karai 13, it is doubtful as to
whether or not the corresponding demand for so much electricity exists on the current 20KV
distribution system of the Karai region.
If connected to a 150KV electric supply line during construction, output limits arising from a lack of
demand and trips caused by the supply lines can be avoided. Thankfully just 5.5km away lies the
150KV Negeri Dolok transformer; by connecting to this transformer we can plan to reduce the
aforementioned number of trips and relax output limits, and expect an increase in the utilization rates
of each plant.
Fig. 3-4-17 Map of Karai 7 & 13 Electrical Systems (Augmentation Proposal)
Source: Created by the Study Team
c) Development Costs of Plans Under Consideration
A summary of the salient points for each plan are listed in Table 3-4-8 below, with the development and
construction costs (including construction costs per amount of electricity generated) listed in Table 3-4-9.
The approximate construction costs are calculated based on the estimated volume of construction in the
summary design for each structure, and were calculated using the price estimates of Indonesian
construction companies for each type of construction. Chapter End Document 3-1 shows an itemized list
of the approximate construction costs for each plan.
Based on this, building the new Karai 12 facility in Plan 1 emerged as having the cheapest construction
cost.
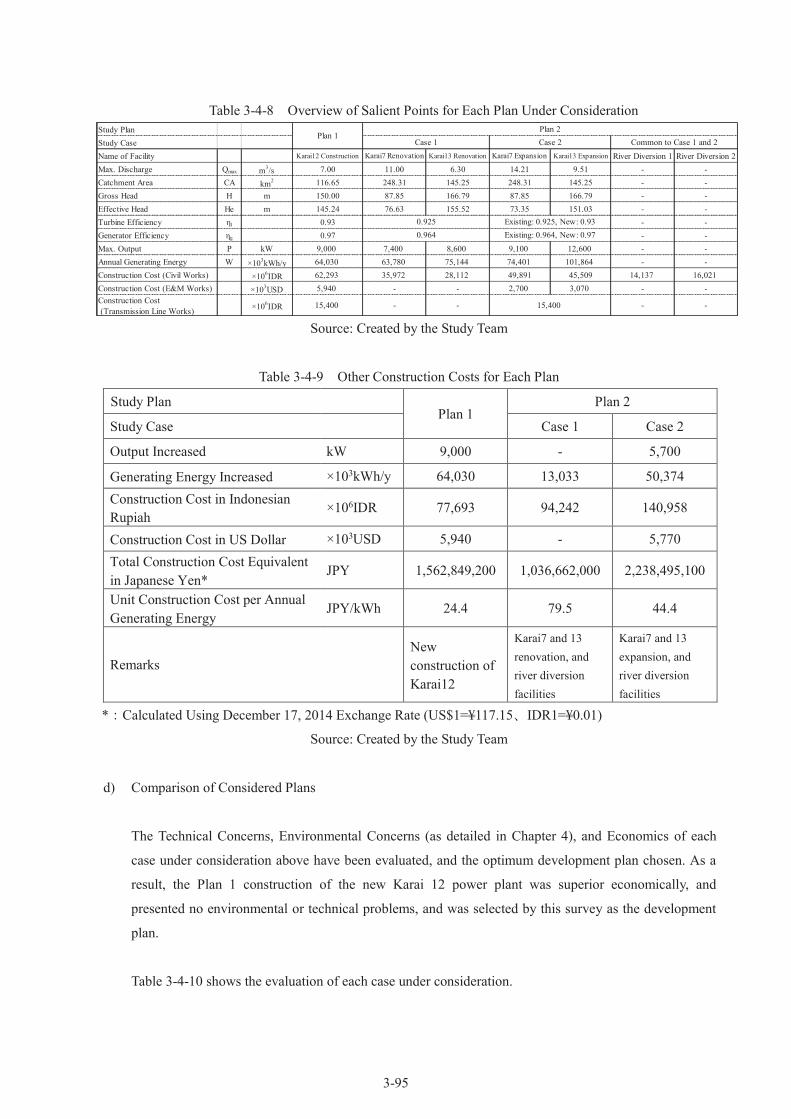
3-95
Table 3-4-8 Overview of Salient Points for Each Plan Under Consideration
Study Plan
Study Case
Name of Facility Karai12 Construction Karai7 Renovation Karai13 Renovation Karai7 Expansion Karai13 Expansion River Diversion 1 River Diversion 2
Max. Discharge Qmax m3/s 7.00 11.00 6.30 14.21 9.51 - -
Catchment Area CA km2 116.65 248.31 145.25 248.31 145.25 - -
Gross Head H m 150.00 87.85 166.79 87.85 166.79 - -
Effective Head He m 145.24 76.63 155.52 73.35 151.03 - -
Turbine Efficiency ηt 0.93 - -
Generator Efficiency ηg 0.97 - -
Max. Output P kW 9,000 7,400 8,600 9,100 12,600 - -
Annual Generating Energy W ×103kWh/y 64,030 63,780 75,144 74,401 101,864 - -
Construction Cost (Civil Works) ×106IDR 62,293 35,972 28,112 49,891 45,509 14,137 16,021
Construction Cost (E&M Works) ×103USD 5,940 - - 2,700 3,070 - -
Construction Cost
(Transmission Line Works)×10
6IDR 15,400 - - - -
0.925 Existing: 0.925, New: 0.93
Plan 1
0.964 Existing: 0.964, New: 0.97
15,400
Plan 2
Case 1 Case 2 Common to Case 1 and 2
Source: Created by the Study Team
Table 3-4-9 Other Construction Costs for Each Plan
Study Plan Plan 1
Plan 2
Study Case
Case 1 Case 2
Output Increased kW 9,000 - 5,700
Generating Energy Increased ×103kWh/y 64,030 13,033 50,374
Construction Cost in Indonesian
Rupiah ×106IDR 77,693 94,242 140,958
Construction Cost in US Dollar ×103USD 5,940 - 5,770
Total Construction Cost Equivalent
in Japanese Yen* JPY 1,562,849,200 1,036,662,000 2,238,495,100
Unit Construction Cost per Annual
Generating Energy JPY/kWh 24.4 79.5 44.4
Remarks
New
construction of
Karai12
Karai7 and 13
renovation, and
river diversion
facilities
Karai7 and 13
expansion, and
river diversion
facilities
*:Calculated Using December 17, 2014 Exchange Rate (US$1=¥117.15、IDR1=¥0.01)
Source: Created by the Study Team
d) Comparison of Considered Plans
The Technical Concerns, Environmental Concerns (as detailed in Chapter 4), and Economics of each
case under consideration above have been evaluated, and the optimum development plan chosen. As a
result, the Plan 1 construction of the new Karai 12 power plant was superior economically, and
presented no environmental or technical problems, and was selected by this survey as the development
plan.
Table 3-4-10 shows the evaluation of each case under consideration.

3-96
Table 3-4-10 Evaluation of Each Case Under Consideration
Case Under
Consideration Plan 1
Plan 2
Case 1 Case 2
Technical Concerns ○ △ △
A new construction plan
that can be tailored to
installation requirements
from the ground up.
Existing structural
problems will be
reconstructed, however
use of existing equipment
means unease over
construction quality
remains.
Same as Left
Environmental
Concerns
(Detailed in Chapter
4)
○ ○ ○
[Environment]
Manufacturing forest or
plantation region;
located outside nature
reserves.
[Social Impact]
Will not displace
residents. Will also not
draw water from a
recession area. Social
impact will be limited.
Same as Left
Same as Left
Economics ○ △ △
Lowest Unit Cost of
Construction
Highest Unit Cost of
Construction
Second Lowest
Unit Cost of
Construction
Overall Evaluation ○ △ △
Selected as
Development Plan
Overall Evaluation:
Inferior to Plan 1
Overall
Evaluation:
Inferior to Plan 1
○: Optimal, △: Development is Possible, but Inferior to Other Proposals
Source: Created by the Study Team
3) Contents of Proposed Projects (Site and Scale of Project Budget, etc.)
The summary design of Plan 1 (New Karai 12 Facility), which was selected as the optimum proposal, is
shown below. Chapter End Document 3-2 shows basic design drawings of Karai 12 Mini-Hydro Power
Project, and Chapter End Document 3-3 shows calculation result for Karai 12 head loss.

3-97
Fig. 3-4-18 General Layout of Karai 12 Mini-Hydro Power Plant
Source: Created by the Study Team
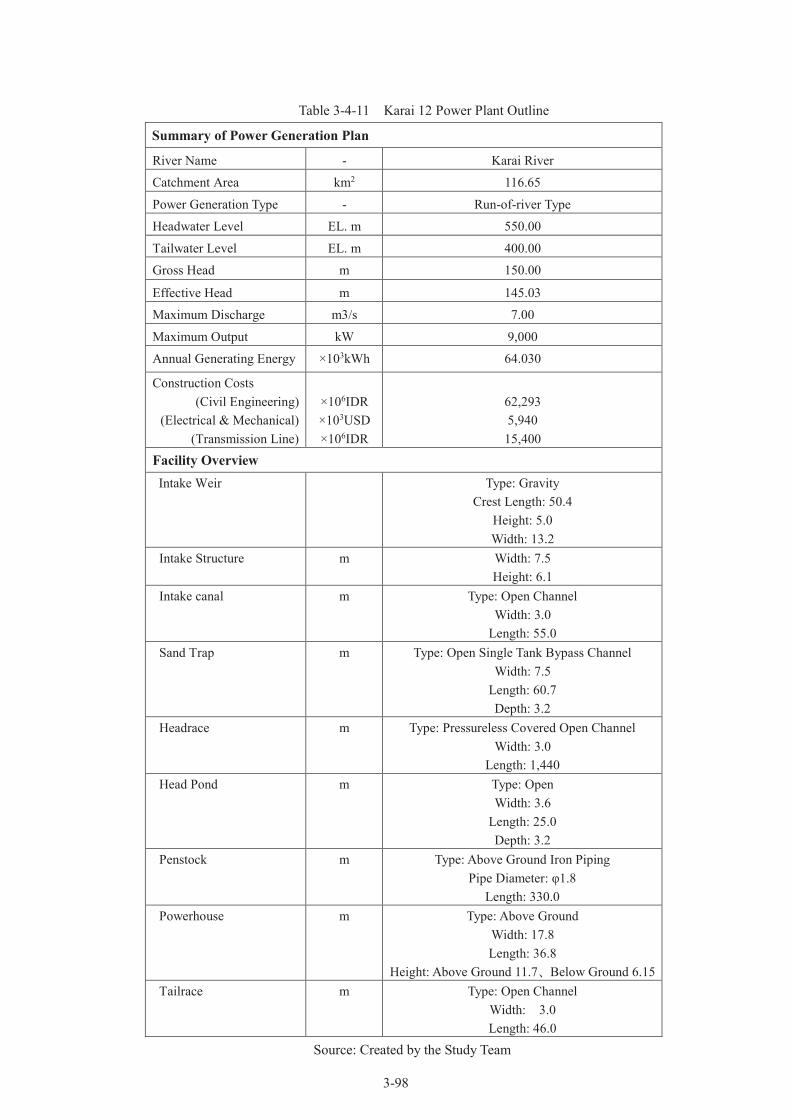
3-98
Table 3-4-11 Karai 12 Power Plant Outline
Summary of Power Generation Plan
River Name - Karai River
Catchment Area km2 116.65
Power Generation Type - Run-of-river Type
Headwater Level EL. m 550.00
Tailwater Level EL. m 400.00
Gross Head m 150.00
Effective Head m 145.03
Maximum Discharge m3/s 7.00
Maximum Output kW 9,000
Annual Generating Energy ×103kWh 64.030
Construction Costs
(Civil Engineering)
(Electrical & Mechanical)
(Transmission Line)
×106IDR
×103USD
×106IDR
62,293
5,940
15,400
Facility Overview
Intake Weir Type: Gravity
Crest Length: 50.4
Height: 5.0
Width: 13.2
Intake Structure m Width: 7.5
Height: 6.1
Intake canal m Type: Open Channel
Width: 3.0
Length: 55.0
Sand Trap m Type: Open Single Tank Bypass Channel
Width: 7.5
Length: 60.7
Depth: 3.2
Headrace m Type: Pressureless Covered Open Channel
Width: 3.0
Length: 1,440
Head Pond m Type: Open
Width: 3.6
Length: 25.0
Depth: 3.2
Penstock m Type: Above Ground Iron Piping
Pipe Diameter: φ1.8
Length: 330.0
Powerhouse m Type: Above Ground
Width: 17.8
Length: 36.8
Height: Above Ground 11.7、Below Ground 6.15
Tailrace m Type: Open Channel
Width: 3.0
Length: 46.0
Source: Created by the Study Team
3-99
4) Solutions for Issues Regarding Proposed Techniques and System Use
The projects proposed in this survey were examined for superiority by putting the currently available data to
use and carrying out basic designs at the basic study level. Regarding the implementation of the projects
proposed in this survey, the creation of more detailed plans and equipment designs must be carried out,
however the appropriate documents and data have not yet been collected. As a result, upon advancing
according to current plans, more detailed surveys need to be conducted.
The next round of surveys to be conducted and their contents are listed below.
a) River Flow Survey
As there is no documentation of the river flow for the project area, theoretical flows will be created
using local observed rainfall data. As these data are essential for generation plans as well as equipment
design, a rainfall observation outpost (gauging station) will be installed near the planned site of the
Karai 12 intake weir during the initial stage of the next round of surveys, observations will be recorded,
and a minimum of 1 years’ worth of river flow data will be collected.
The details of each survey are as follows:
- Installment of Gauging Station
- Measurement of River Cross-Section
- Measurement of Rainfall (Once a Month)
- Measurement of Water Level (Once a Day)
- Creation of H-Q Curve
b) Topographical Survey
The final layout of each piece of generation equipment must be scrutinized; a 1m, contour line-level
topographic map must be made, from the intake weir site to the power plant site. A detailed 1/200
topographic measurement of the area around each structure will also be conducted. Further, along with
measurements of a cross-section of the river, the width of the river will be measured in 50m intervals for
drainage and flood calculation purposes.
The details of each survey are as follows:
- Establishment of Reference Measurements (3 Locations)
- Topographical Survey (Total Ground Plan: Scale 1/1,000, Detailed Structural Blueprints: Scale
1/200)
- Measurement of River Cross-Section

3-100
- Measurement of River Width (50m pitch)
c) Geological Survey
Table 3-4-12 shows future geological investigation items assuming for Plan 1. Geological
investigation shall be carried out for each stage of preliminary to detail studies.
Table 3-4-12 Future Geological Investigation Items
Item Description
Preliminary/Detailed
Reconnaissance
Preliminary to detailed geological reconnaissance is required to understand
topographical and geological characteristics of the planned sites and
considerations for design and construction. Preliminary reconnaissance of wide
area of the planned site shall be carried out first. After narrowing down the
project site, topographic survey of the site and then the detailed reconnaissance
shall be carried out.
Topographic Survey
Accuracy of site reconnaissance depends on topographic map accuracy to be
used. Plan survey, cross-sectional survey and longitudinal profile leveling shall
be carried out for detail study for structures.
Boring Investigation
Boring investigation shall be carried out at each planned structure location
decided from site reconnaissance and preliminary design to understand the
geological conditions.
Good quality coring is necessary to evaluate ground conditions accurately.
Termination of boring should be generally 3 to 5m below the base foundation
rock, however it shall be studied depending on planned structures and site
conditions.
In-Situ Test
Lugeon tests shall be carried out in boreholes. The purpose of Lugeon test is to
understand the hydrological characteristics of ground and groundwater, and
evaluate seepage at intake weir. Other in-situ tests and sounding shall be studied
depending on planned structures and site conditions.
Laboratory Test
In order to investigate applicability of Shirasu concrete, sampling of Shirasu at
the site, laboratory tests of grain size, density, coefficient of water absorption,
specific gravity, solid content, and confirmation of concrete characteristics by
trial mix shall be carried out.
Source: Created by the Study Team
d) Increasing the Operating Ratio of Turbine Generators
According to a survey conducted by Chodai’s resident long-term dispatch engineers, the operating
maximum of Karai 13 is 6MW—a limit reportedly imposed due to the imbalance between supply and

3-101
demand. This indicates that there is no corresponding demand for the electricity being supplied by the
current distribution system; this also indicates that even a plan to expand the power plants cannot
guarantee that the equipment will reach the planned utilization rates.
Further, as previously stated, the distribution system is the cause of an average of 3 trips per day; adding
in the internal incidents that cause trips that number reaches just under 4 trips per day.
The root causes of these trips are lightning strikes and ground faults. We see no signs of a
solution—such as installing aerial power lines or removing the offending vegetation causing ground
faults—forthcoming from inside PLN.
These trips run the risk of shortening the life of the turbines, and we fear the turbines will not last as
long as planned should this situation continue. In addition, the primary cause of these trips has the
potential to cause other incidents; trips caused by the supply lines will become a major problem at some
stage.
Further, geological problems with the water in the plant caused buildup-related outages, so utilization
rates were not necessary close to their target at first. However thanks to the efforts of the existing Karai
13 facility owner, utilization rates have passed 70%.
Despite this effort, the time consumed by buildup-related outages on top of supply line related-trips, the
primary cause of outages, means that the current measures being taken do not amount to a fundamental
solution.
It will be necessary to conduct hydraulic tests, make alterations that address the cause of these trips to
the equipment and protected electric relay, change the connection to the distribution lines, etc. in order
to resolve these issues.
We would like a more detailed study of these incidents.
e) Condition of Power Lines and Connection to Power Supply Lines
As stated above, the ability to demand or consume electricity from the increased output of Karai 7 and
Karai 13, or the new Karai 12 facility, does not exist within the current 20kV supply lines.
Therefore it is necessary to connect to a superior 150kV system if this project is to be implemented.
If additional facilities are renovated or the new Karai 12 facility is built, a superior 150kV system will
be necessary to achieve smooth transfer of the power generated from an area with 2 or 3 power plants
the 5.5km distance to the 150kV Negeri Dolok transformer.

3-102
According to the Wiratman survey, the cost of building one 150kV circuit is 2.8 billion IDR, making the
total cost 15.4 billion IDR.
The conductor is a 240mm2 ACSR, with a supply capacity of 30-50MVA that is more than capable of
handling the 28.5MVA generated by the plants.
Moreover, the output would be relatively small relative to the capacity, and this would create an
economical, one-circuit system.
Fig. 3-4-19 Overview of Karai Region Power Transmission and Power Distribution System
Sou
rce: Created by the Study Team
f) Summary Examination of Construction Plan
In order to maintain long-lasting power facilities that can be used long-term as social capital for the
good of the public, construction management will ideally be conducted according to the following
policies, with the goal of guaranteeing the quality, process, and safety of construction.
- Construction methods and process will be conducted with consideration for the area’s
hydrological, meteorological, geographical and geological conditions, etc.; the location of the
power plant will be chosen with consideration for the river’s characteristics and other
environmental conditions.
- A general construction plan that does not contain the need for special equipment or techniques
outside the realm of possibility shall be created.
- In addition to setting an appropriate standard for construction methods and management, we will

3-103
enact an on-site supervision and management plan to fulfill that standard.
- To prevent pollution of the downstream area, we will select an area near the project site with
minimal impact on the environment and society for gravel pits, quarries, borrow pits, muck
disposal, and waste treatment facilities, in addition to preventing the maximum release of polluted
water and collected sediment during periods of high water.
Based on the above, the following points will be included in the detailed construction plan, to be drafted
during the detailed investigation phase.
- Examination of Supply Methods (Consent/Refusal of Japanese Equipment Introduction)
- Examination of Construction Schedule
- Examination of Construction Management System
- Proposal of Necessary Safety Measures
g) Outline of Maintenance and Management Plan
As mentioned above, based on the currently operating Karai 13’s many power distribution-related trips,
a plan to reduce the number of trips is needed.
Further, the sediment in the river that is a result of the area’s geological makeup is causing buildup in
the powerhouse and channel, as well as wear on the generator, reducing the electrical utilization rates. It
would be preferable to resolve these issues.

3-104
Chapter End Document 3-1 Table of Approximate Construction Cost Items for Each Case
[Plan 1 (Construction cost of new Karai 12 Mini-Hydro Power Plant)]
No. Work Item Price (*103 IDR)
1. Preparatory Works 985,000
1-1 Mobilization and Demobilization 500,000
1-2 Clearing & Grabbing 60,000
1-3 Community Management 70,000
1-4 Temporary Worker's Residence 100,000
1-5 Survey Work 80,000
1-6 Setting-out Control Point 50,000
1-7 Temporary Electrical Facilities 125,000
2. Weir and Intake 13,322,498
2-1 River Diversion 346,827
2-2 Intake Weir
a) Earth Work 211,905
b) Masonry Work 1,583,694
c) Concrete Work 1,554,843
d) Reinforcement Works 2,879,283
e) Form Works 242,139
f) Plastering Works 51,267
g) Miscellaneous Works 127,073
2-3 Intake Structure and Channel
a) Earth Work 281,806
b) Concrete Work 1,102,793
c) Reinforcement Works 1,905,172
d) Form Works 457,976
2-4 Gate 2,577,720
3. Sand Trap 8,486,694
a) Earth Work 828,700
b) Concrete Work 1,633,281
c) Reinforcement Works 4,232,457
d) Form Works 288,556
g) Gate 1,503,700
4. Headrace 12,843,209
a) Earth Work 4,154,450
b) Masonry Work 4,534,687
c) Concrete Work 802,734
d) Reinforcement Works 2,080,191
e) Form Works 611,293
f) Plastering Works 659,854
5. Headtank 3,555,281
a) Earth Work 122,981
b) Masonry Work 302,148
c) Concrete Work 516,822
d) Reinforcement Works 1,785,713
e) Form Works 154,722
f) Plastering Works 61,003
g) Trashrack Screen 611,892

3-105
No. Work Item Price (*103 IDR)
6. Penstock 8,449,937
a) Penstock Pipe 6,506,789
b) Anchor Block 272,145
c) Miscellaneous Works 1,671,003
7. Powerhouse 14,650,371
a) Earth Work 1,498,346
b) Masonry Work 735,309
c) Sand Filling Works 13,604
d) Concrete Works 1,373,909
e) Reinforcement Works 4,747,100
f) Form Works 307,124
g) Plastering Works 22,977
h) Powerhouse Superstructure 1,952,002
i) Overhead Traveling Crane 4,000,000
Total Cost 62,292,990

3-106
[Plan 2 common to Cases 1 and 2 (Construction cost of river diversion facility)]
River diversion 1: (Sigambur River to Karai River)
No. Work Item Price (*103 IDR)
1. Preparatory Works 2,435,114
1-1 Mobilization and Demobilization 200,000
1-2 Clearing & Grabbing 80,000
1-3 Community Management 35,000
1-4 Temporary Worker's Residence 50,000
1-5 Survey Work 30,000
1-6 Setting-out Control Point 35,000
1-7 Temporary Electrical Facilities 50,000
1-8 Land Acquisition 1,365,000
1-9 Disposal Area 590,114
2. Diversion Weir 3,045,624
2-1 River Diversion 835,947
2-2 Intake Weir
a) Earth Work 837,851
b) Masonry Work 249,836
c) Concrete Work 1,480
d) Reinforcement Works 2,672
e) Form Works 1,428
f) Plastering Works 12,457
g) Miscellaneous Works 70,099
2-3 Intake Structure
a) Earth Work 379,199
b) Masonry Work 98,770
c) Concrete Work 2,537
d) Reinforcement Works 4,580
e) Form Works 1,504
f) Plastering Works 4,752
g) Miscellaneous Works 51,214
2-4 Gate 491,298
3. Waterway 8,655,835
a) Earth Work 5,902,964
b) Masonry Work 2,752,871
Total Cost 14,136,573

3-107
River diversion 2: (Pulung River to Sigambur River)
No. Work Item Price (*103 IDR)
1. Preparatory Works 2,306,334
1-1 Mobilization and Demobilization 200,000
1-2 Clearing & Grabbing 80,000
1-3 Community Management 35,000
1-4 Temporary Worker's Residence 50,000
1-5 Survey Work 30,000
1-6 Setting-out Control Point 35,000
1-7 Temporary Electrical Facilities 50,000
1-8 Land Acquisition 1,680,000
1-9 Disposal Area 146,334
2. Diversion Weir 2,898,662
2-1 River Diversion 792,710
2-2 Intake Weir
a) Earth Work 812,017
b) Masonry Work 234,833
c) Concrete Work 1,480
d) Reinforcement Works 2,672
e) Form Works 1,428
f) Plastering Works 12,457
g) Miscellaneous Works 69,903
2-3 Intake Structure
a) Earth Work 316,623
b) Masonry Work 98,770
c) Concrete Work 2,537
d) Reinforcement Works 4,580
e) Form Works 1,504
f) Plastering Works 4,636
g) Miscellaneous Works 51,214
2-4 Gate 491,298
3. Waterway 10,816,135
a) Earth Work 858,359
b) Masonry Work 1,387,046
c) Concrete Work 2,769,396
d) Tunnel 5,801,334
Total Cost 16,021,131

3-108
[Plan 2, Cases 1 (Renovation cost of existing power plant)]
Renovation cost of existing Karai 13 Mini-Hydro Power Plant
No. Work Item Price (*103 IDR)
1. Preparatory Works 310,000
1-1 Mobilization and Demobilization 100,000
1-2 Clearing & Grabbing 40,000
1-3 Community Management 35,000
1-4 Temporary Worker's Residence 50,000
1-5 Survey Work 20,000
1-6 Setting-out Control Point 15,000
1-7 Temporary Electrical Facirities 50,000
2. Weir and Intake 14,436,558
2-1 River Diversion 271,289
2-2 Intake Weir
a) Earth Work 154,388
b) Masonry Work 4,298,990
c) Concrete Work 1,106,211
d) Reinforcement Works 2,021,234
e) Form Works 201,525
f) Plastering Works 26,160
g) Miscellaneous Works 46,476
2-3 Intake Structure and Channel
a) Earth Work 190,993
b) Concrete Work 1,164,945
c) Reinforcement Works 2,012,546
d) Form Works 339,614
2-4 Gate 2,602,187
3. Sand Trap 7,745,540
a) Concrete Demolition 65,585
b) Earth Work 95,497
c) Concrete Work 1,709,704
d) Reinforcement Works 4,430,498
e) Form Works 252,970
f) Miscellaneous Works 8,786
g) Gate 1,182,500
4. Headtank 5,619,676
a) Steel Demolition 377,505
b) Earth Work 47,748
c) Concrete Work 1,314,260
d) Reinforcement Works 3,405,749
e) Form Works 252,970
f) Miscellaneous Works 8,786
g) Trashrack Screen 212,658
Total Cost 28,111,774
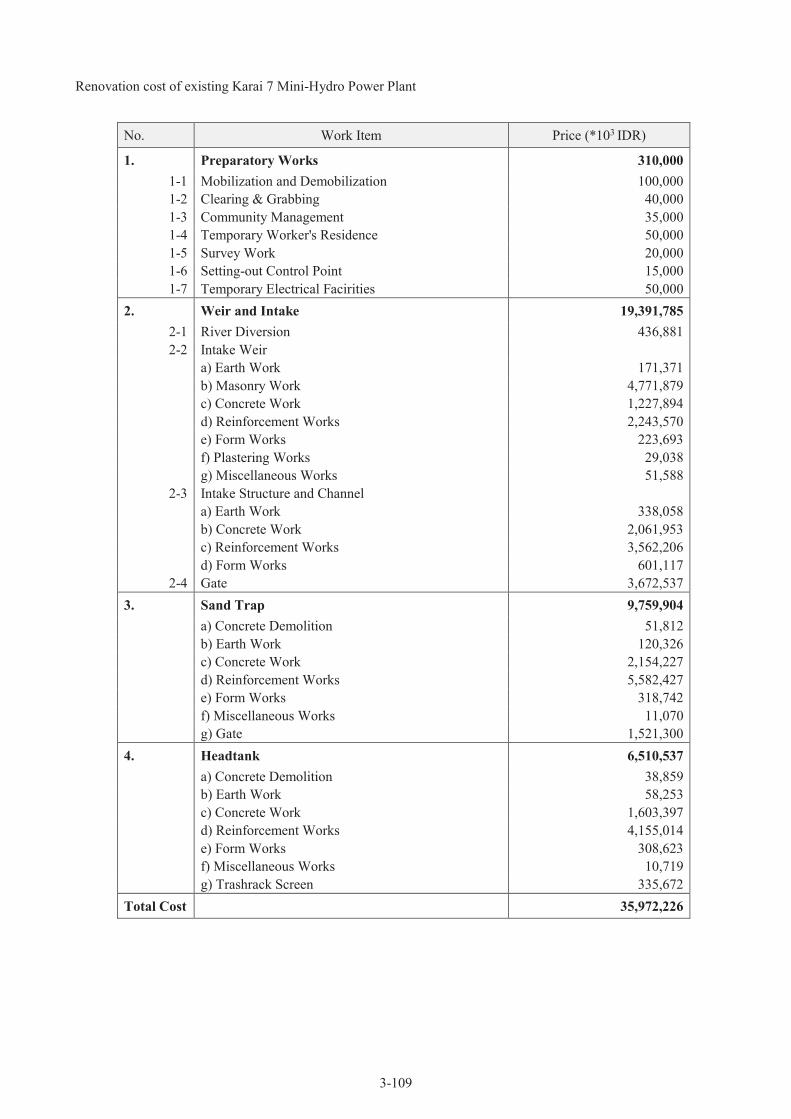
3-109
Renovation cost of existing Karai 7 Mini-Hydro Power Plant
No. Work Item Price (*103 IDR)
1. Preparatory Works 310,000
1-1 Mobilization and Demobilization 100,000
1-2 Clearing & Grabbing 40,000
1-3 Community Management 35,000
1-4 Temporary Worker's Residence 50,000
1-5 Survey Work 20,000
1-6 Setting-out Control Point 15,000
1-7 Temporary Electrical Facirities 50,000
2. Weir and Intake 19,391,785
2-1 River Diversion 436,881
2-2 Intake Weir
a) Earth Work 171,371
b) Masonry Work 4,771,879
c) Concrete Work 1,227,894
d) Reinforcement Works 2,243,570
e) Form Works 223,693
f) Plastering Works 29,038
g) Miscellaneous Works 51,588
2-3 Intake Structure and Channel
a) Earth Work 338,058
b) Concrete Work 2,061,953
c) Reinforcement Works 3,562,206
d) Form Works 601,117
2-4 Gate 3,672,537
3. Sand Trap 9,759,904
a) Concrete Demolition 51,812
b) Earth Work 120,326
c) Concrete Work 2,154,227
d) Reinforcement Works 5,582,427
e) Form Works 318,742
f) Miscellaneous Works 11,070
g) Gate 1,521,300
4. Headtank 6,510,537
a) Concrete Demolition 38,859
b) Earth Work 58,253
c) Concrete Work 1,603,397
d) Reinforcement Works 4,155,014
e) Form Works 308,623
f) Miscellaneous Works 10,719
g) Trashrack Screen 335,672
Total Cost 35,972,226
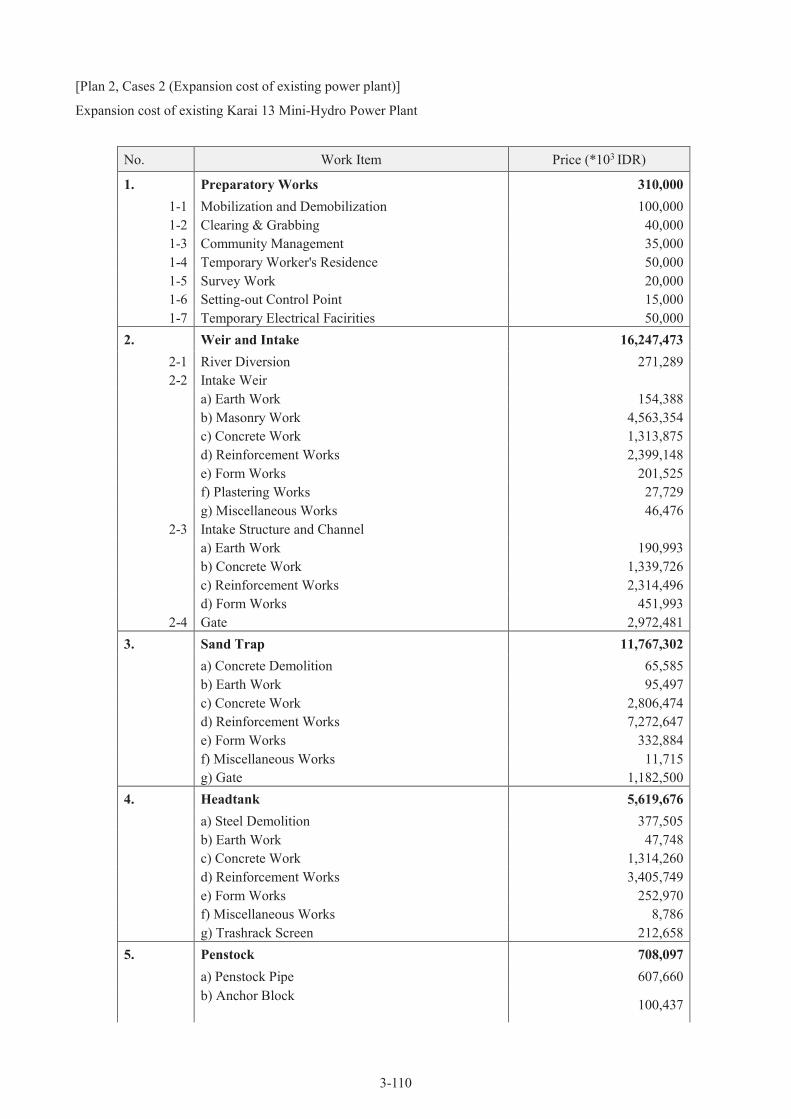
3-110
[Plan 2, Cases 2 (Expansion cost of existing power plant)]
Expansion cost of existing Karai 13 Mini-Hydro Power Plant
No. Work Item Price (*103 IDR)
1. Preparatory Works 310,000
1-1 Mobilization and Demobilization 100,000
1-2 Clearing & Grabbing 40,000
1-3 Community Management 35,000
1-4 Temporary Worker's Residence 50,000
1-5 Survey Work 20,000
1-6 Setting-out Control Point 15,000
1-7 Temporary Electrical Facirities 50,000
2. Weir and Intake 16,247,473
2-1 River Diversion 271,289
2-2 Intake Weir
a) Earth Work 154,388
b) Masonry Work 4,563,354
c) Concrete Work 1,313,875
d) Reinforcement Works 2,399,148
e) Form Works 201,525
f) Plastering Works 27,729
g) Miscellaneous Works 46,476
2-3 Intake Structure and Channel
a) Earth Work 190,993
b) Concrete Work 1,339,726
c) Reinforcement Works 2,314,496
d) Form Works 451,993
2-4 Gate 2,972,481
3. Sand Trap 11,767,302
a) Concrete Demolition 65,585
b) Earth Work 95,497
c) Concrete Work 2,806,474
d) Reinforcement Works 7,272,647
e) Form Works 332,884
f) Miscellaneous Works 11,715
g) Gate 1,182,500
4. Headtank 5,619,676
a) Steel Demolition 377,505
b) Earth Work 47,748
c) Concrete Work 1,314,260
d) Reinforcement Works 3,405,749
e) Form Works 252,970
f) Miscellaneous Works 8,786
g) Trashrack Screen 212,658
5. Penstock 708,097
a) Penstock Pipe 607,660
b) Anchor Block
100,437

3-111
No. Work Item Price (*103 IDR)
6. Powerhouse 10,856,433
a) Earth Work 1,070,721
b) Masonry Work 699,881
c) Sand Filling Works 7,920
d) Concrete Works 835,297
e) Reinforcement Works 2,886,098
f) Form Works 233,569
g) Plastering Works 26,420
h) Powerhouse Superstructure 1,096,527
i) Oversead Traveling Crane 4,000,000
Total Cost 45,508,981

3-112
Expansion cost of existing Karai 7 Mini-Hydro Power Plant
No. Work Item Price (*103 IDR)
1. Preparatory Works 310,000
1-1 Mobilization and Demobilization 100,000
1-2 Clearing & Grabbing 40,000
1-3 Community Management 35,000
1-4 Temporary Worker's Residence 50,000
1-5 Survey Work 20,000
1-6 Setting-out Control Point 15,000
1-7 Temporary Electrical Facirities 50,000
2. Weir and Intake 20,232,796
2-1 River Diversion 548,931
2-2 Intake Weir
a) Earth Work 171,371
b) Masonry Work 4,771,879
c) Concrete Work 1,227,894
d) Reinforcement Works 2,243,570
e) Form Works 223,693
f) Plastering Works 29,038
g) Miscellaneous Works 51,588
2-3 Intake Structure and Channel
a) Earth Work 327,916
b) Concrete Work 2,000,094
c) Reinforcement Works 3,455,340
d) Form Works 583,083
2-4 Gate 4,598,399
3. Sand Trap 10,906,056
a) Concrete Demolition 51,812
b) Earth Work 137,172
c) Concrete Work 2,455,819
d) Reinforcement Works 6,363,967
e) Form Works 363,366
f) Miscellaneous Works 12,620
g) Gate 1,521,300
4. Headtank 6,510,537
a) Concrete Demolition 38,859
b) Earth Work 58,253
c) Concrete Work 1,603,397
d) Reinforcement Works 4,155,014
e) Form Works 308,623
f) Miscellaneous Works 10,719
g) Trashrack Screen 335,672
5. Penstock 1,075,134
a) Penstock Pipe 721,596
b) Anchor Block
353,538
6. Powerhouse 10,856,433
a) Earth Work 1,070,721

3-113
No. Work Item Price (*103 IDR)
b) Masonry Work 699,881
c) Sand Filling Works 7,920
d) Concrete Works 835,297
e) Reinforcement Works 2,886,098
f) Form Works 233,569
g) Plastering Works 26,420
h) Powerhouse Superstructure 1,096,527
i) Oversead Traveling Crane 4,000,000
Total Cost 49,890,956

3-114
Chapter End Document 3-2 Basic Design Drawing of Karai 12 Mini-Hydro Power Plant
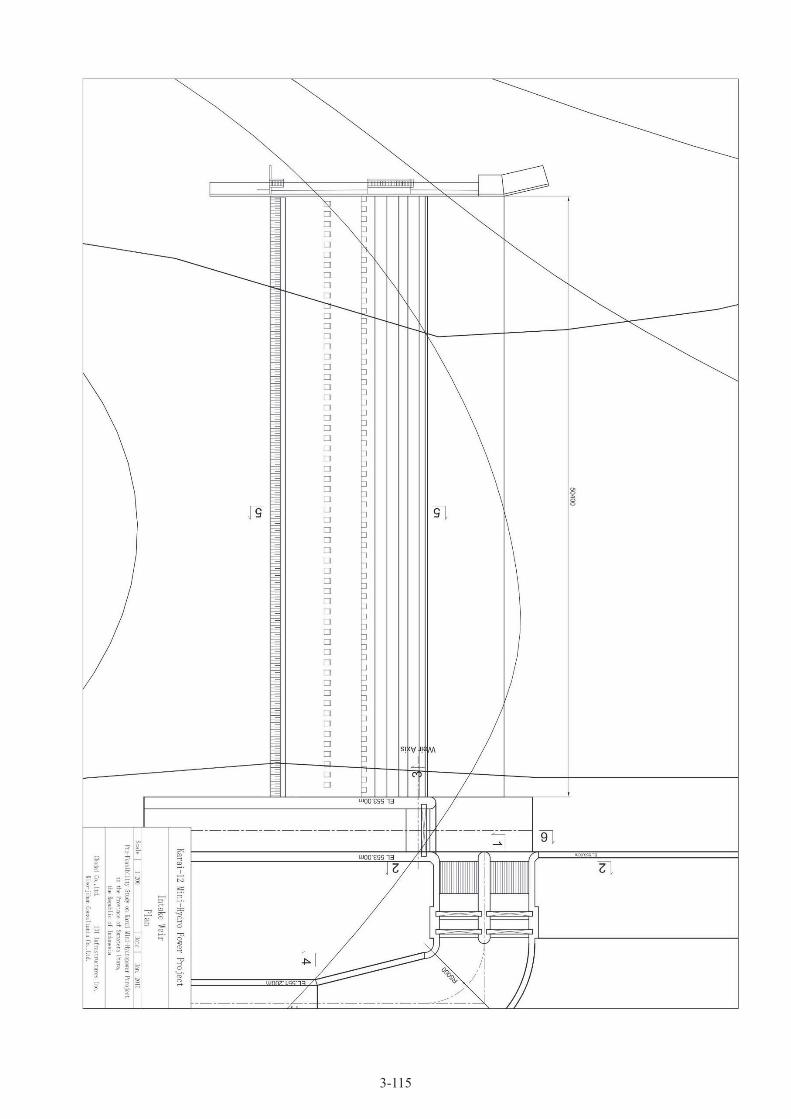
3-115
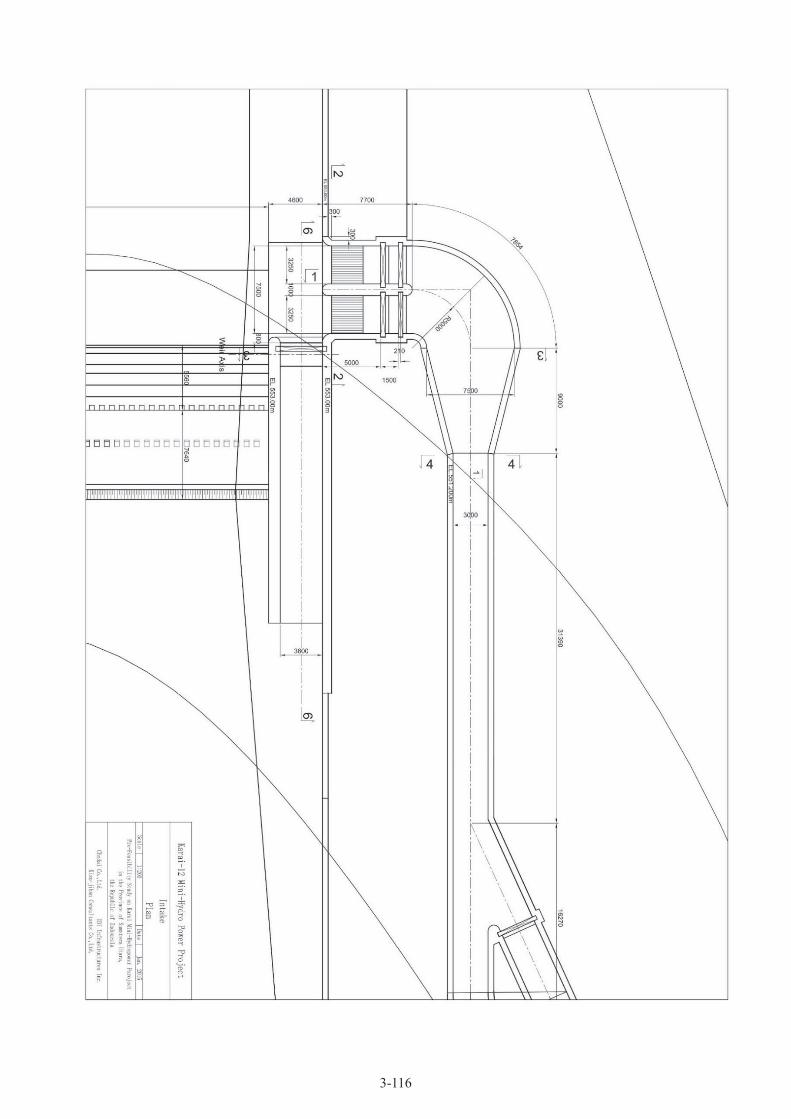
3-116
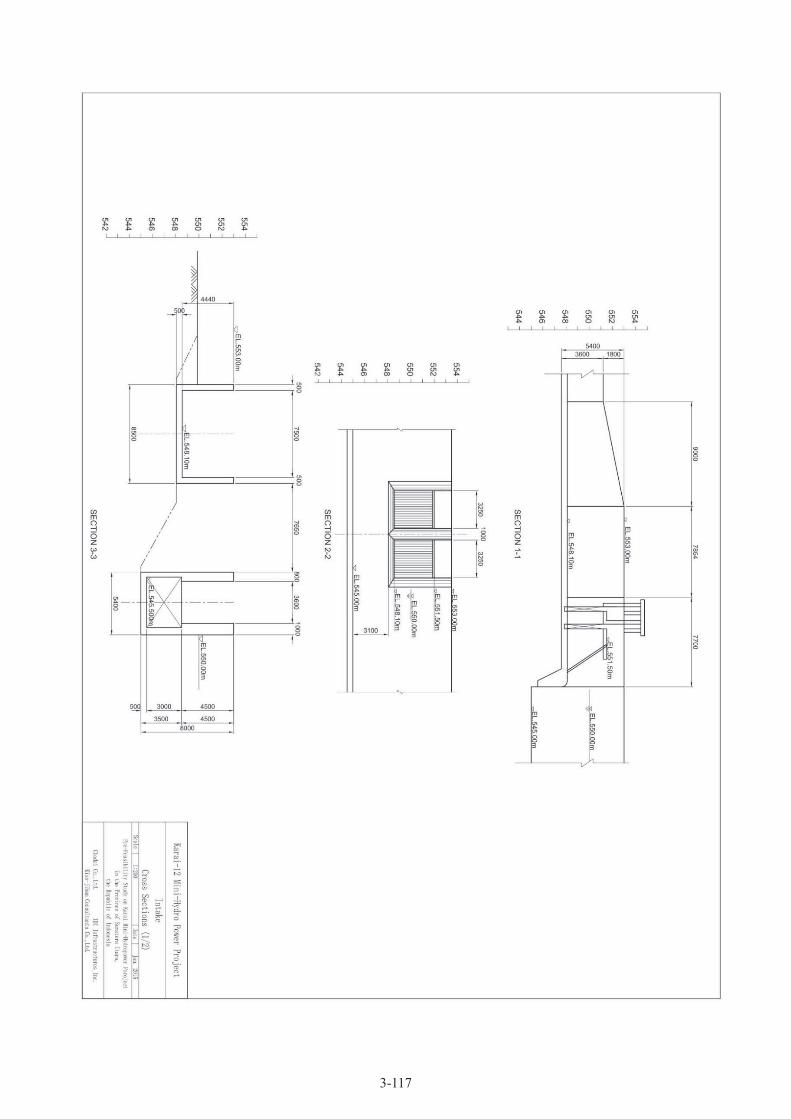
3-117

3-118
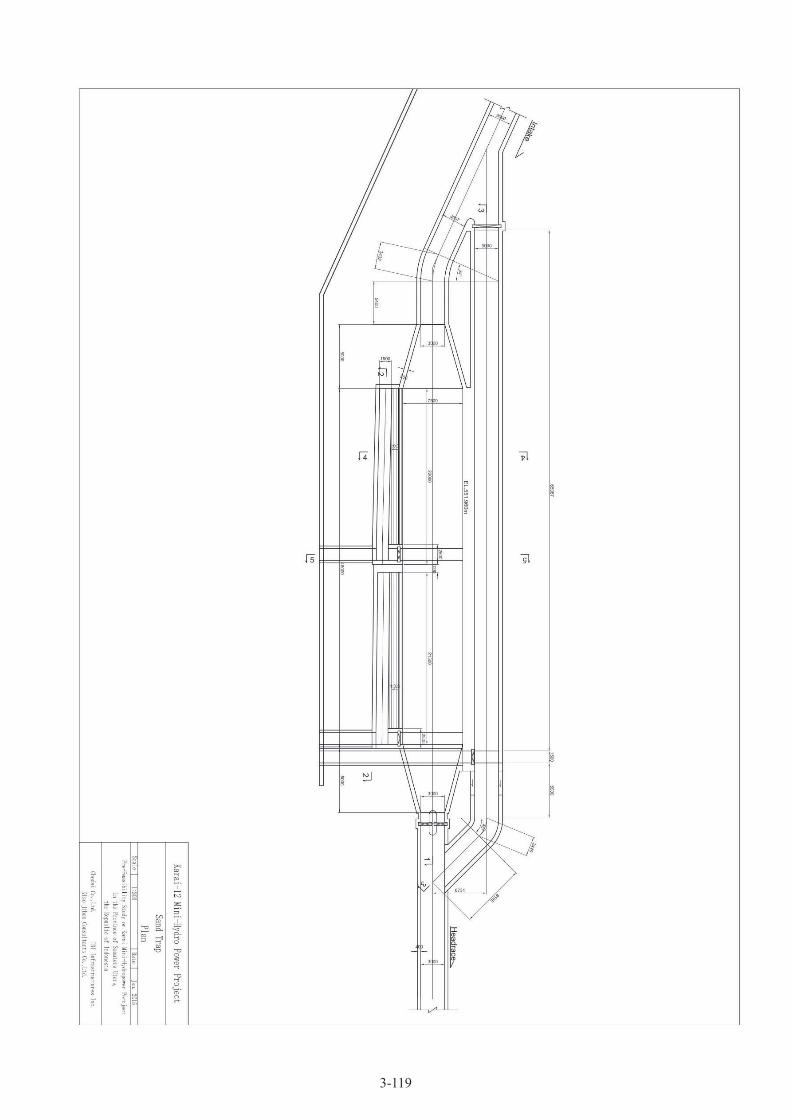
3-119
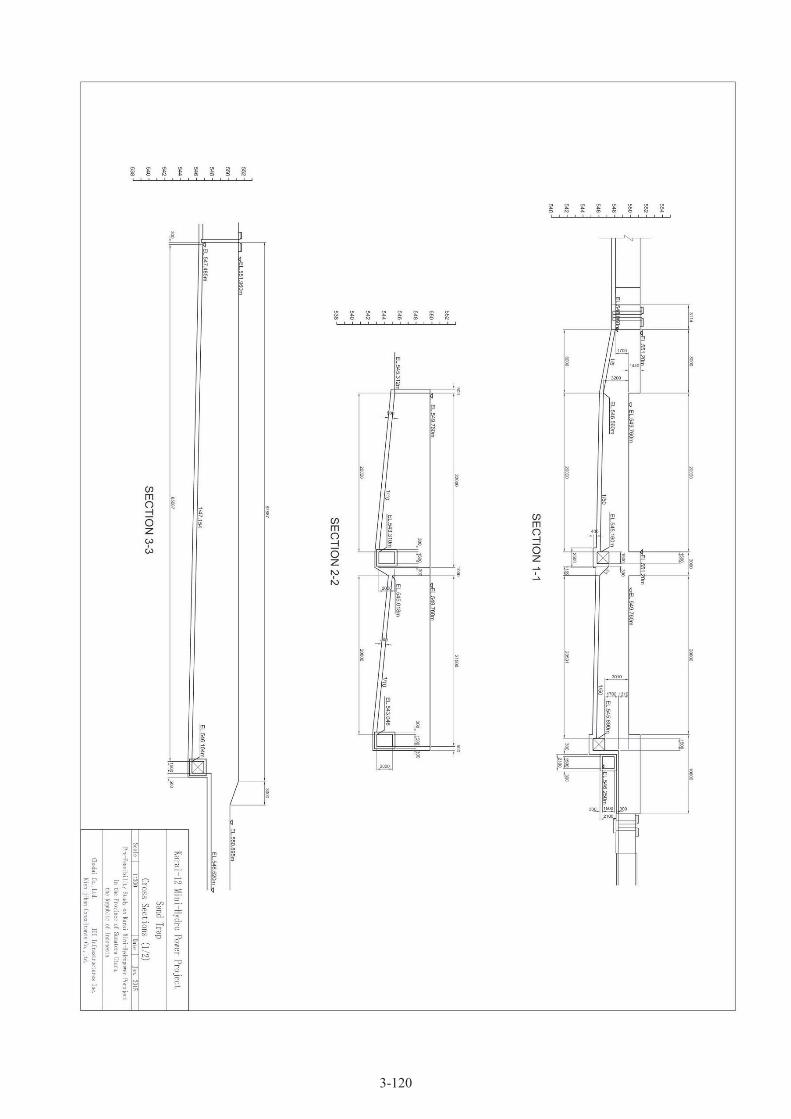
3-120
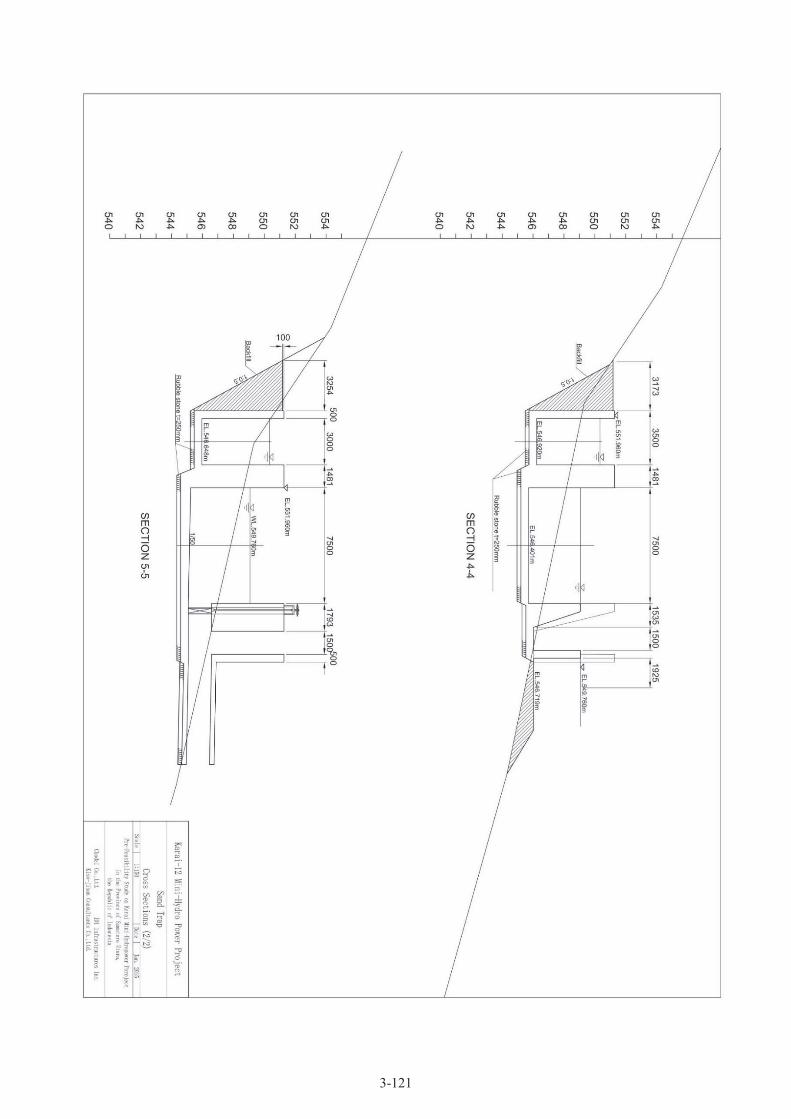
3-121

3-122
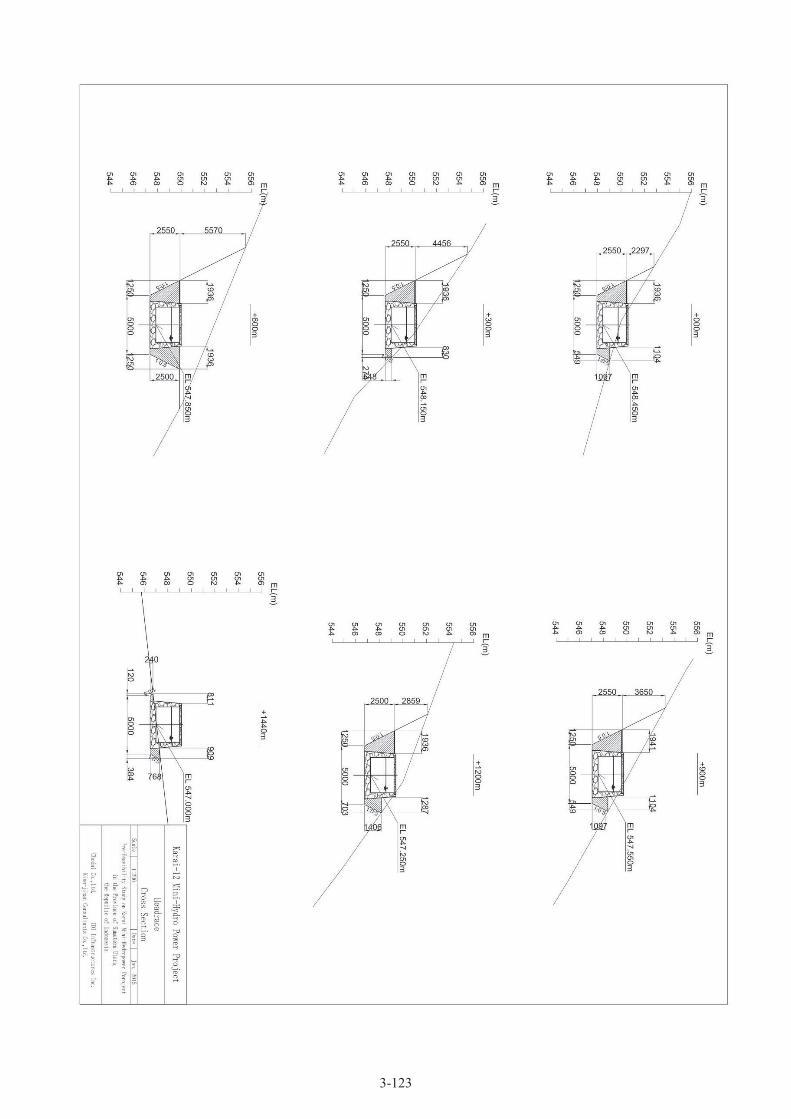
3-123
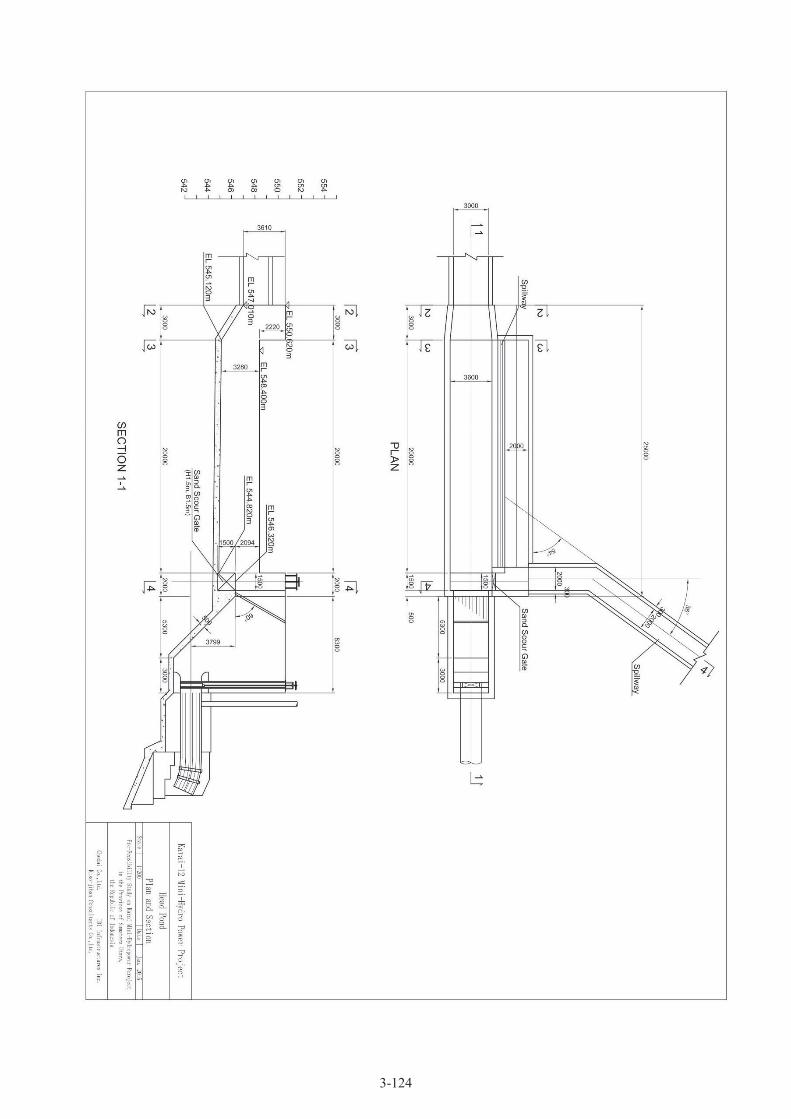
3-124
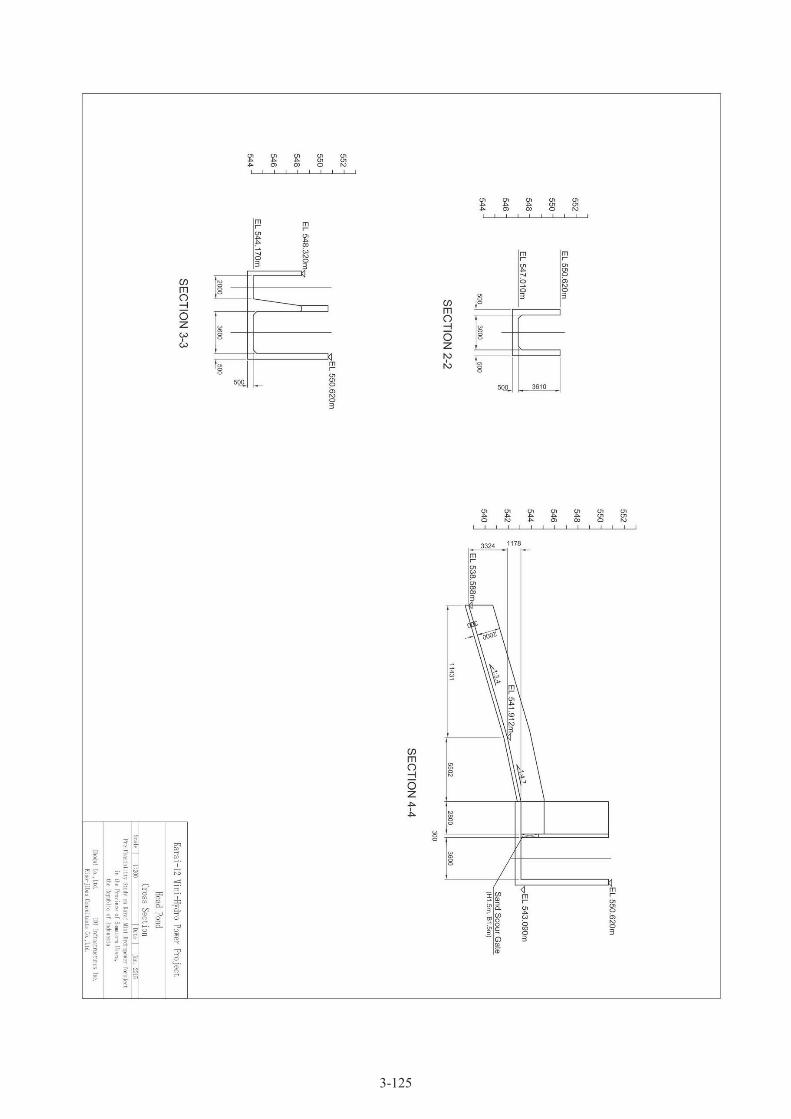
3-125

3-126

3-127

3-128

3-129

3-130
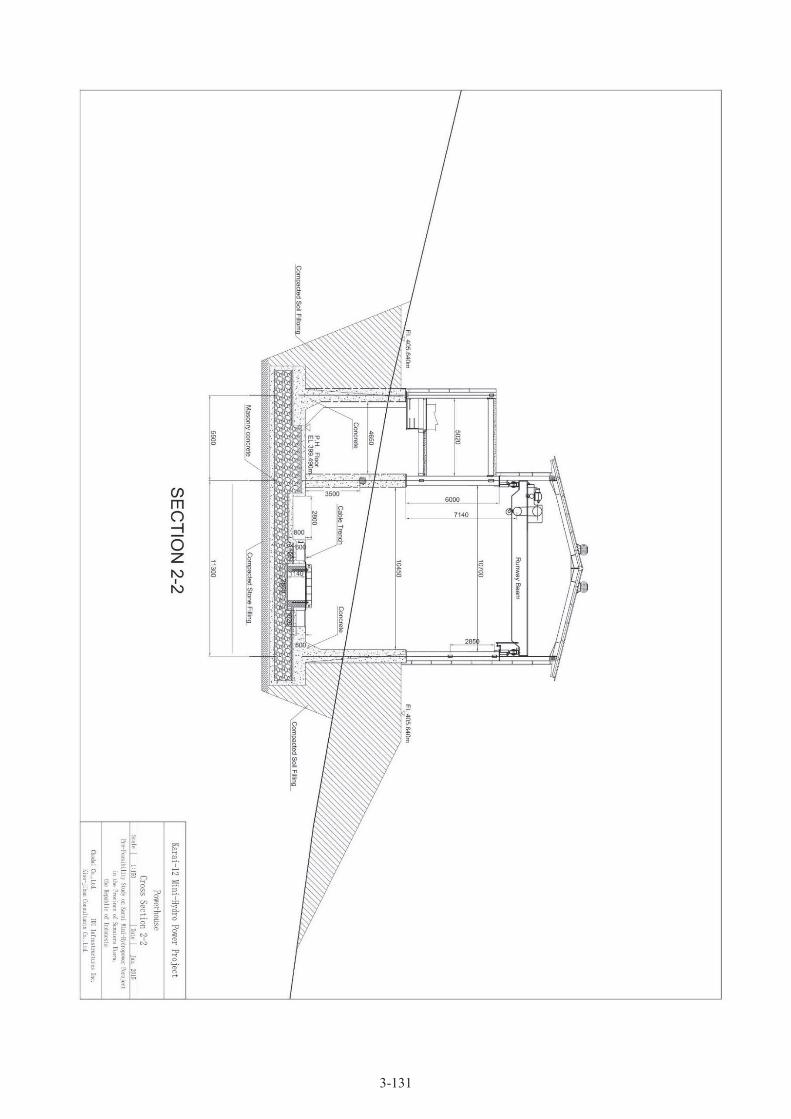
3-131

3-132
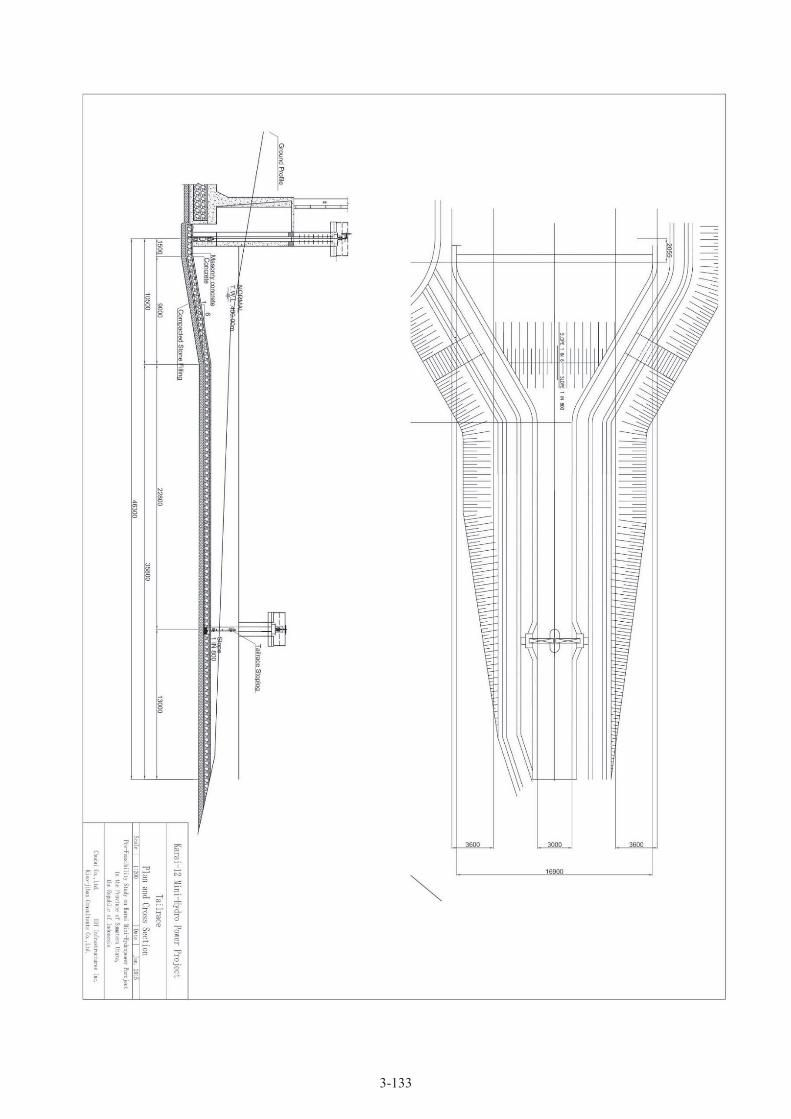
3-133

3-134
Chapter End Document 3-3 Calculation Result for Karai 12 Head Loss
Symbol
1. Intake~Intake Canal
(1) he
(2) hp
(3) hr
(4) hgc
(5) hf
(6)
2. Sand Trap
(1) hgc
(2)
3. Hredrace
(1) hf
4. Head Pond
(1) hsc
(2) hr
(3)
5. Penstock
(1) hc
(2) hf
(3) hb
(4) hB
(5) hv
(6)
6. Tailrace
(1) hc
(2) hgc
(3) hf
(4) hl
(5)
H
He
Items Head Loss (m) Remarks
Inflow 0.014
Pier 0.007
Trash Screen 0.004
Reduction of cross section 0.165
Friction 0.000
Other loss 0.019 Σ(1)~(5)*0.1
Subtotal 0.209
Reduction of cross section 0.162
Other loss 0.016 (1)*0.1
Subtotal 0.178
Slope of headrace 1.440
Subtotal 1.440
Reduction of cross section 0.019
Trash Screen 0.007
Other loss 0.003 Σ(1)~(2)*0.1
Subtotal 0.029
Inflow 0.039
Friction 1.489
Curve 0.192
Junction 0.290
Valve 0.304
Other loss 0.231 Σ(1)~(5)*0.1
Subtotal 2.545
Outlet of draft tube 0.083
Reduction of cross section 0.208
Friction 0.038
Outlet of tailrace 0.190
Intake water level 550.00
Tail water level 400.00
Other loss 0.052 Σ(1)~(4)*0.1
Subtotal 0.571
Gross head 150.00
Effective head 145.03
Total head loss 4.972
Chapter 4 Evaluation of Environment and Social
Impacts

4-1
(1) Analysis of the Current State of the Environment and Society
1) Current Environment and Society Data Analysis
a) The State of Socioeconomic Affairs and Land Use
This target region for this project is located in Simalungun Regency, the mountainous region in North
Sumatra Province. Simalungun has an area of 4,372.50km2 a population of 830,000 people (2012), and is
made up of 31 sub districts. Among those districts is the target area for Karai 7 (under construction) and
Karai 12 (new construction plan), Silou Kahean, which has an area of 228.74km2. There is also the target
region for the river diversion plans 1 and 2, Dolok Silou, which has an area of 302.66km2. Lastly is the
area for Karai 13 (currently operating), Raya, which has an area of 331.83km2. These three areas make up
20% of the total area of Simalungun, and rest at 100m above sea level. Also, Silou Kahean’s “Dolok
Marawa” is a “Nagori” that is made up of six villages, including Buntu Siantar, the closest to Karai 12
(new construction plan), and has an area of 19.78km2, and a population of 988 people (2012).
Simalungun’s is a hot and humid tropical rainforest climate, with an average temperature of 25.2℃, a low
of 21.8℃ and a high of 31.4℃ (2012).
Simalungun possesses 138,741.72ha of forest land, with 98,200.48ha (70.8%) of production forest,
10,841.74ha (7.8%) of restricted production forest, and 27,668.09ha (19.9%) of forest conservation.
Simalungun’s main industry is agriculture, and besides paddy fields (wetland: 79,113ha, dry land:
13,198ha), corn (64,643ha), cassava (11,693ha), petai (3,491ha), cabbage (3,478ha), sweet potatoes
(3,469ha), and chili peppers (3,091) are being produced. Additionally, palm oil (28,950.61ha), rubber
(14,013.51ha), and coffee (10,053.5ha) plantations are serving an important role in the economy of
Simalungun. Of the three sub districts, Silou Kahean’s highest production is in paddy fields (dry land),
corn, cassava, and palm oil. Dolok Silou’s highest production is in paddy fields (dry land), corn, chili
peppers, and rubber. Raya’s highest production is in paddy fields (wet land), corn, petai, rubber, and coffee.
The stretch of road in Silou Kahean for Karai 12 (new construction plan) is 74.13km (2012), and the
proportion of road in good/average condition was 60%, while the proportion of broken/very damaged road
was 40%. Additionally, according to the field survey conducted in Dolok Marawa and Buntu Siantar
villages, each house had electricity and water (refer to d) State of Neighboring Communities).
b) Natural Environment
The target region for this project is the mountainous region in North Sumatra. There are no existing results
from an environmental survey done by a public institution for this area. However, there is an
environmental management program and environmental monitoring (UKL-UPL) report1※ concerning
1 “DOKUMRN Upaya Pengelolaan Lingkungan Hidup dan Upaya Pemantauan Lingkungan
Hidup(UKL-UPL) Kegiatan Usaha Pemanfaatan Hasil Hutan Kayu Pada Hutan Tanaman
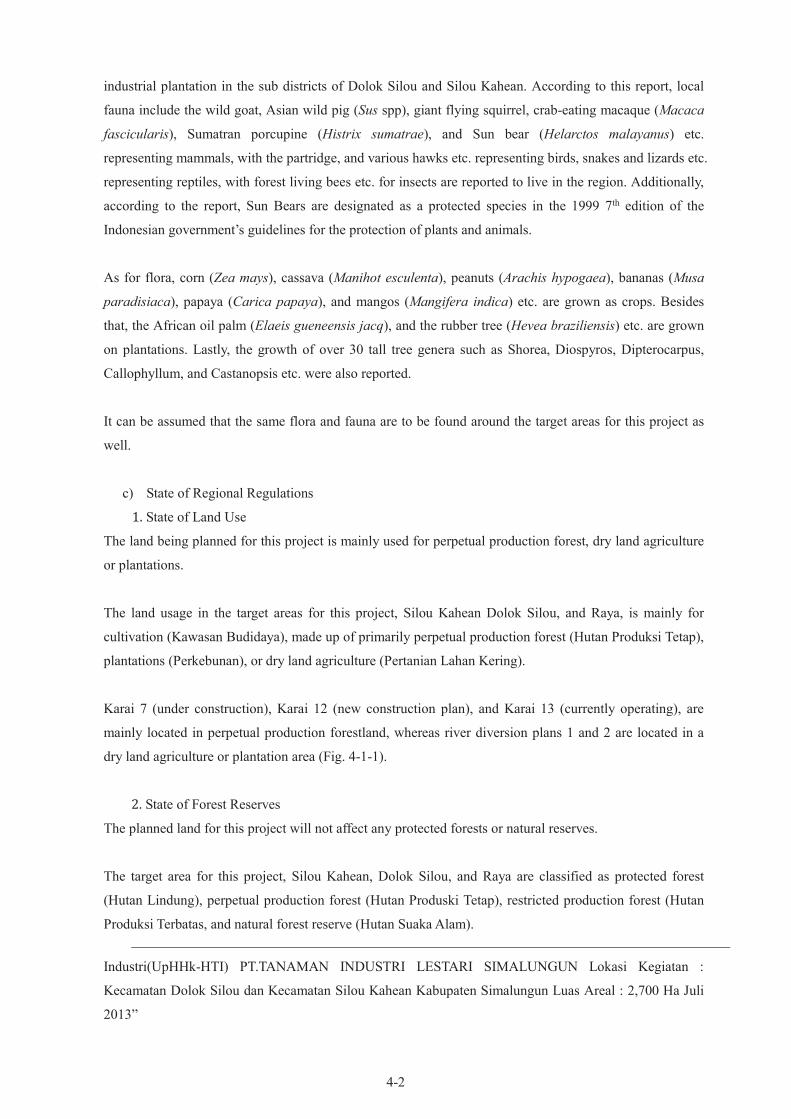
4-2
industrial plantation in the sub districts of Dolok Silou and Silou Kahean. According to this report, local
fauna include the wild goat, Asian wild pig (Sus spp), giant flying squirrel, crab-eating macaque (Macaca
fascicularis), Sumatran porcupine (Histrix sumatrae), and Sun bear (Helarctos malayanus) etc.
representing mammals, with the partridge, and various hawks etc. representing birds, snakes and lizards etc.
representing reptiles, with forest living bees etc. for insects are reported to live in the region. Additionally,
according to the report, Sun Bears are designated as a protected species in the 1999 7th edition of the
Indonesian government’s guidelines for the protection of plants and animals.
As for flora, corn (Zea mays), cassava (Manihot esculenta), peanuts (Arachis hypogaea), bananas (Musa
paradisiaca), papaya (Carica papaya), and mangos (Mangifera indica) etc. are grown as crops. Besides
that, the African oil palm (Elaeis gueneensis jacq), and the rubber tree (Hevea braziliensis) etc. are grown
on plantations. Lastly, the growth of over 30 tall tree genera such as Shorea, Diospyros, Dipterocarpus,
Callophyllum, and Castanopsis etc. were also reported.
It can be assumed that the same flora and fauna are to be found around the target areas for this project as
well.
c) State of Regional Regulations
1. State of Land Use
The land being planned for this project is mainly used for perpetual production forest, dry land agriculture
or plantations.
The land usage in the target areas for this project, Silou Kahean Dolok Silou, and Raya, is mainly for
cultivation (Kawasan Budidaya), made up of primarily perpetual production forest (Hutan Produksi Tetap),
plantations (Perkebunan), or dry land agriculture (Pertanian Lahan Kering).
Karai 7 (under construction), Karai 12 (new construction plan), and Karai 13 (currently operating), are
mainly located in perpetual production forestland, whereas river diversion plans 1 and 2 are located in a
dry land agriculture or plantation area (Fig. 4-1-1).
2. State of Forest Reserves
The planned land for this project will not affect any protected forests or natural reserves.
The target area for this project, Silou Kahean, Dolok Silou, and Raya are classified as protected forest
(Hutan Lindung), perpetual production forest (Hutan Produski Tetap), restricted production forest (Hutan
Produksi Terbatas, and natural forest reserve (Hutan Suaka Alam).
Industri(UpHHk-HTI) PT.TANAMAN INDUSTRI LESTARI SIMALUNGUN Lokasi Kegiatan :
Kecamatan Dolok Silou dan Kecamatan Silou Kahean Kabupaten Simalungun Luas Areal : 2,700 Ha Juli
2013”

4-3
Karai 7 (under construction) and Karai 12 (new construction plan) correspond to perpetual production
forest, while Karai 13 (currently operating) is in a perpetual production forest and a “should be considered
for other use” area (Areal Penggunaan Lain). The river diversion plans 1 and 2 are located outside of the
forest classification areas (Fig. 4-1-2).
3. State of Conservation Areas
The projects planned land will not affect any conservation areas.
As for the target areas for this project, the Simaclk mountain (PPA Gunung Simaclk di kec. Dolok Silau)
resides in Dolok Silou, Tinggi Raja Conservation area (Kawasan Konservasi Tinggi Raja) is in Silou
Kahean, but both of these are not located in the area affected by this project (Fig. 4-1-3).
Also, on the western side of Dolok Marawa village is the Dolok Tinggi Raja Conservation area (Cagar
Alam Dolok Tinggi Raja), which possesses a hot spring and is partly being used as a tourism site, but it is
more than 3km away from Karai 12 (new construction plan) (Fig. 4-1-4 and 5, Photo 4-1-1).

4-4
Fig. 4-1-1 State of Land Use
Source: “RENCANA TATA RUANG WILAYAH (RTRW) KABUPATEN SIMALUNGUN TAHUN
2011-2031” (REMERINTAH KABUPATEN SIMALUNGUN BADAN PERENCANAAN
PEMBANGUNAN DAERAH PAMATANG Raya 2012)
LAMPIRANⅢ RENCANA POLA RUANG KABUPATEN SIMALUNGUN used for creation by Study
Team
Karai 12 new
Karai 7 construction
Karai 13 operating
River Div. 1
River Div. 2
Other Uses
Tourist Area
Perpetual Production
Forest
Natural Reserve
Plantation
(Cultivation Land)
(Protected Land)
Restricted Production
Forest
Protected Forest
Dry Land Agriculture

4-5
Fig. 4-1-2 State of Forest Reserves
Source: “RENCANA TATA RUANG WILAYAH (RTRW) KABUPATEN SIMALUNGUN TAHUN
2011-2031” (REMERINTAH KABUPATEN SIMALUNGUN BADAN PERENCANAAN
PEMBANGUNAN DAERAH PAMATANG Raya 2012)
LAMPIRANⅣ USULAN REVISI KAWASAN HUTAN used for creation by Study Team
Protected Forest
Perp. Prod. Forest
Restricted Prod.
Natural Conserve
Other Use
Karai 12
Karai 7
Karai 13
River Div. 1
River Div. 2
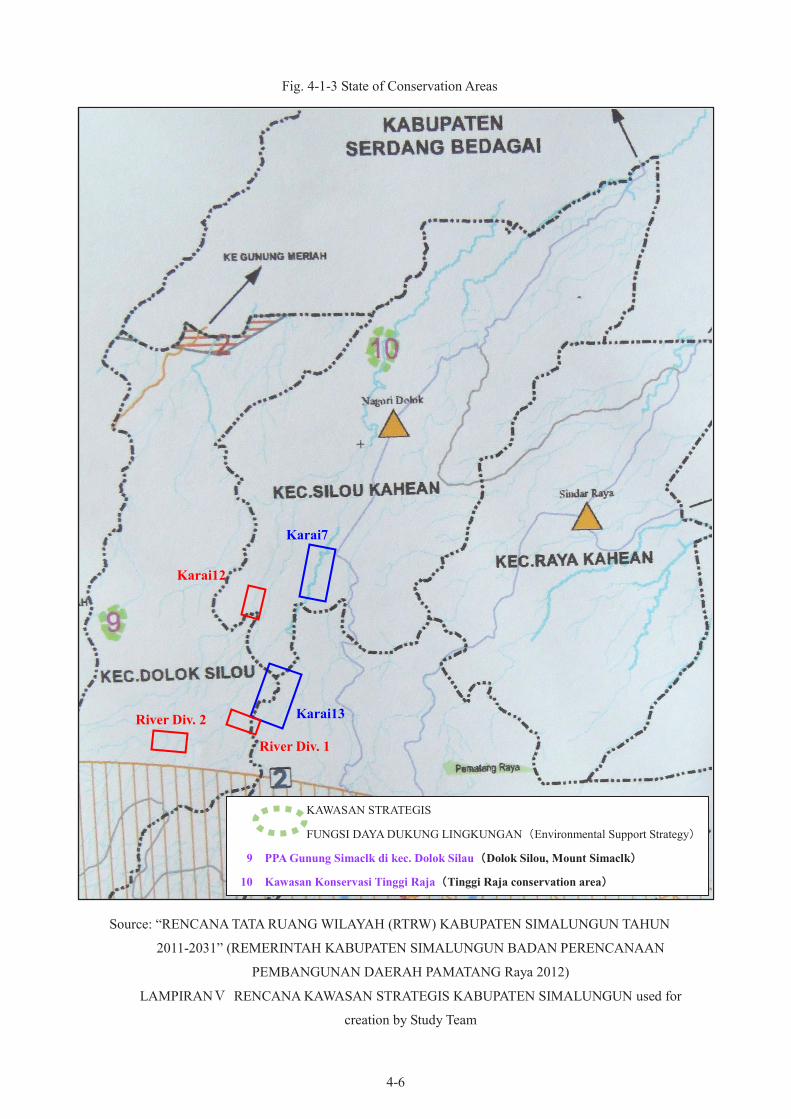
4-6
Fig. 4-1-3 State of Conservation Areas
Source: “RENCANA TATA RUANG WILAYAH (RTRW) KABUPATEN SIMALUNGUN TAHUN
2011-2031” (REMERINTAH KABUPATEN SIMALUNGUN BADAN PERENCANAAN
PEMBANGUNAN DAERAH PAMATANG Raya 2012)
LAMPIRANⅤ RENCANA KAWASAN STRATEGIS KABUPATEN SIMALUNGUN used for
creation by Study Team
KAWASAN STRATEGIS
FUNGSI DAYA DUKUNG LINGKUNGAN(Environmental Support Strategy)
9 PPA Gunung Simaclk di kec. Dolok Silau(Dolok Silou, Mount Simaclk)
10 Kawasan Konservasi Tinggi Raja(Tinggi Raja conservation area)
Karai12
Karai7
Karai13
River Div. 1
River Div. 2

4-7
Fig. 4-1-4 Dolok Tinggi Raja Nature Conservation Area (Hot spring Location)
Source: NAGORI DOLOK MARAWA mid-development plan (2011-2015)
“PEMERINTAH KABUPATEN SIMALUNGUN KECAMATAN Silou Kahean NAGORI DOLOK
MARAWA RENCANA PEMBANGUNAN JANGKA MENENGAH DESA (RPJMDes) TAHUN
2011-2015” used for creation by Study Team
Pulung River
Dolok Marawa
Buntu Siantar
TINGGI RAJA
Conservation Area
N
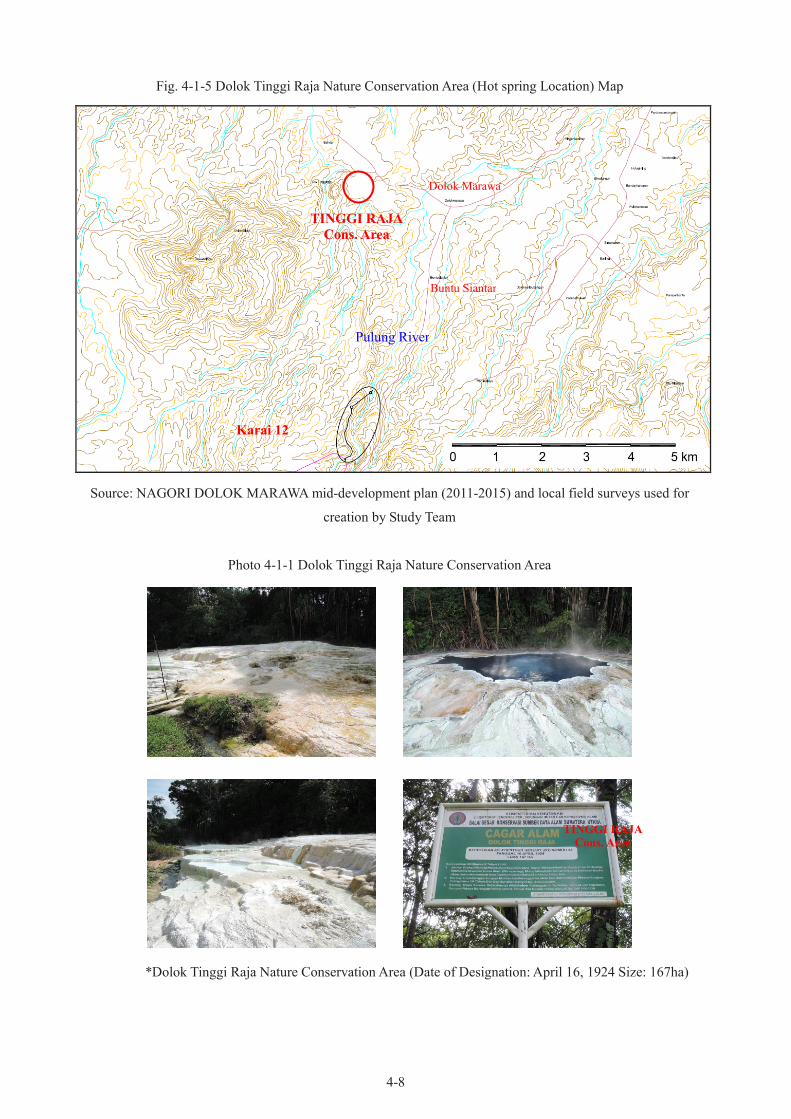
4-8
Fig. 4-1-5 Dolok Tinggi Raja Nature Conservation Area (Hot spring Location) Map
Source: NAGORI DOLOK MARAWA mid-development plan (2011-2015) and local field surveys used for
creation by Study Team
Photo 4-1-1 Dolok Tinggi Raja Nature Conservation Area
*Dolok Tinggi Raja Nature Conservation Area (Date of Designation: April 16, 1924 Size: 167ha)
TINGGI RAJA Cons. Area
TINGGI RAJA
Cons. Area
Dolok Marawa
Buntu Siantar
Karai 12
Pulung River

4-9
d) State of Neighboring Communities (Local Resident Hearing Results)
Below are the results of a local resident hearing held at Buntu Siantar village, the closest village to the
Karai 12 proposed new facility in the target region.
Also, it should be noted that the Pulung river water planned for use with the new Karai 12 facility is not
being used for livelihood by the residents.
■ Buntu Siantar〔Nov. 13, 2014 (Thurs)〕
Photo 4-1-2 Buntu Siantar Photo 4-1-3 Local Resident Hearing
Photo 4-1-4 Investigation of Community Photo 4-1-5 State of Private Water System
Photo 4-1-6 Water Tank
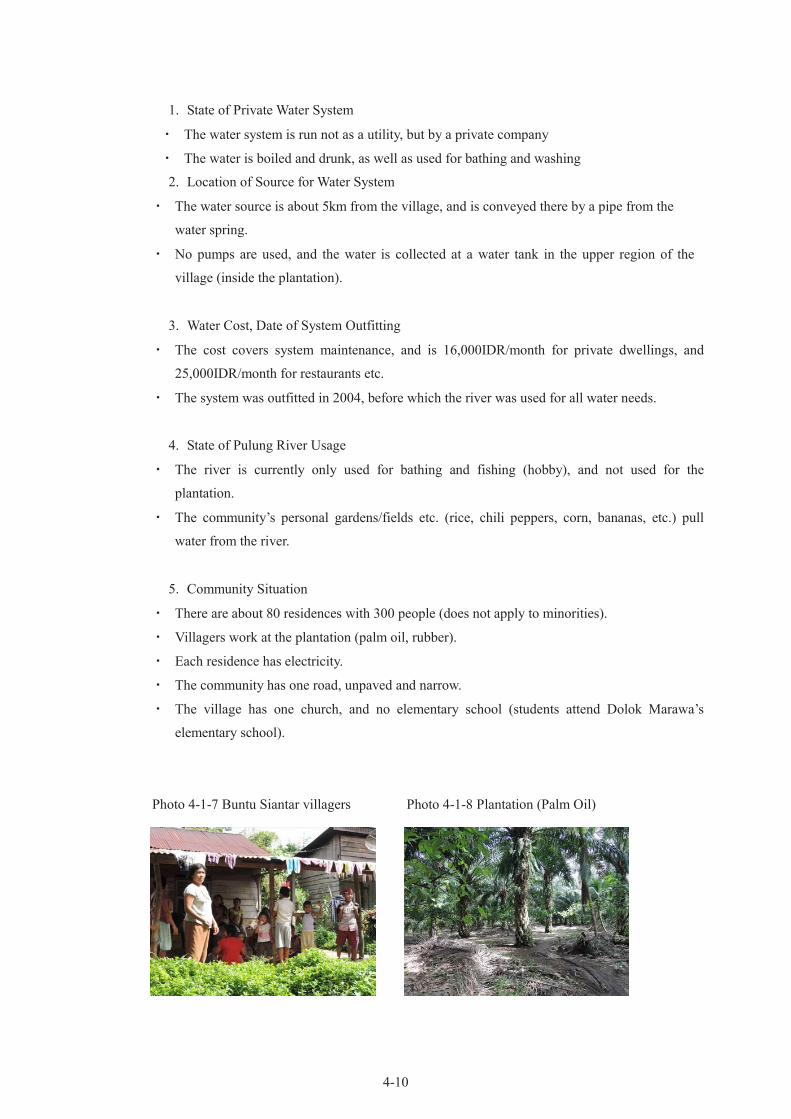
4-10
1. State of Private Water System
・ The water system is run not as a utility, but by a private company
・ The water is boiled and drunk, as well as used for bathing and washing
2. Location of Source for Water System
・ The water source is about 5km from the village, and is conveyed there by a pipe from the
water spring.
・ No pumps are used, and the water is collected at a water tank in the upper region of the
village (inside the plantation).
3. Water Cost, Date of System Outfitting
・ The cost covers system maintenance, and is 16,000IDR/month for private dwellings, and
25,000IDR/month for restaurants etc.
・ The system was outfitted in 2004, before which the river was used for all water needs.
4. State of Pulung River Usage
・ The river is currently only used for bathing and fishing (hobby), and not used for the
plantation.
・ The community’s personal gardens/fields etc. (rice, chili peppers, corn, bananas, etc.) pull
water from the river.
5. Community Situation
・ There are about 80 residences with 300 people (does not apply to minorities).
・ Villagers work at the plantation (palm oil, rubber).
・ Each residence has electricity.
・ The community has one road, unpaved and narrow.
・ The village has one church, and no elementary school (students attend Dolok Marawa’s
elementary school).
Photo 4-1-7 Buntu Siantar villagers Photo 4-1-8 Plantation (Palm Oil)
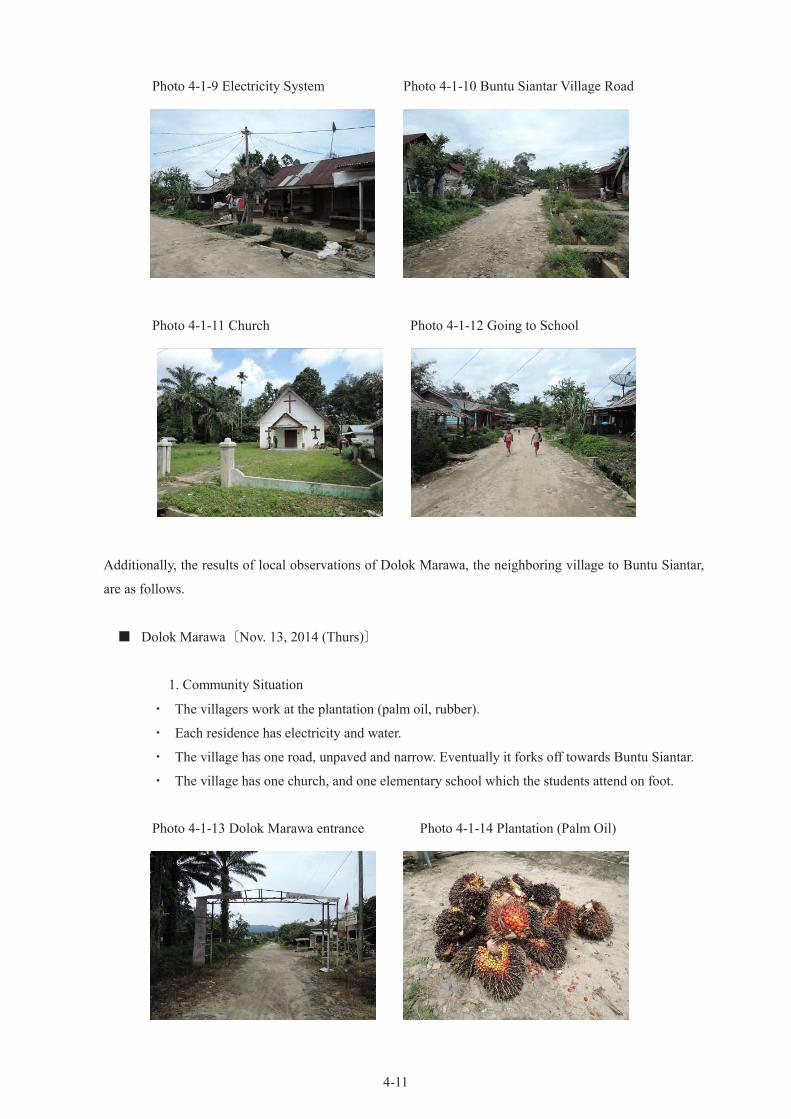
4-11
Photo 4-1-9 Electricity System Photo 4-1-10 Buntu Siantar Village Road
Photo 4-1-11 Church Photo 4-1-12 Going to School
Additionally, the results of local observations of Dolok Marawa, the neighboring village to Buntu Siantar,
are as follows.
■ Dolok Marawa〔Nov. 13, 2014 (Thurs)〕
1. Community Situation
・ The villagers work at the plantation (palm oil, rubber).
・ Each residence has electricity and water.
・ The village has one road, unpaved and narrow. Eventually it forks off towards Buntu Siantar.
・ The village has one church, and one elementary school which the students attend on foot.
Photo 4-1-13 Dolok Marawa entrance Photo 4-1-14 Plantation (Palm Oil)
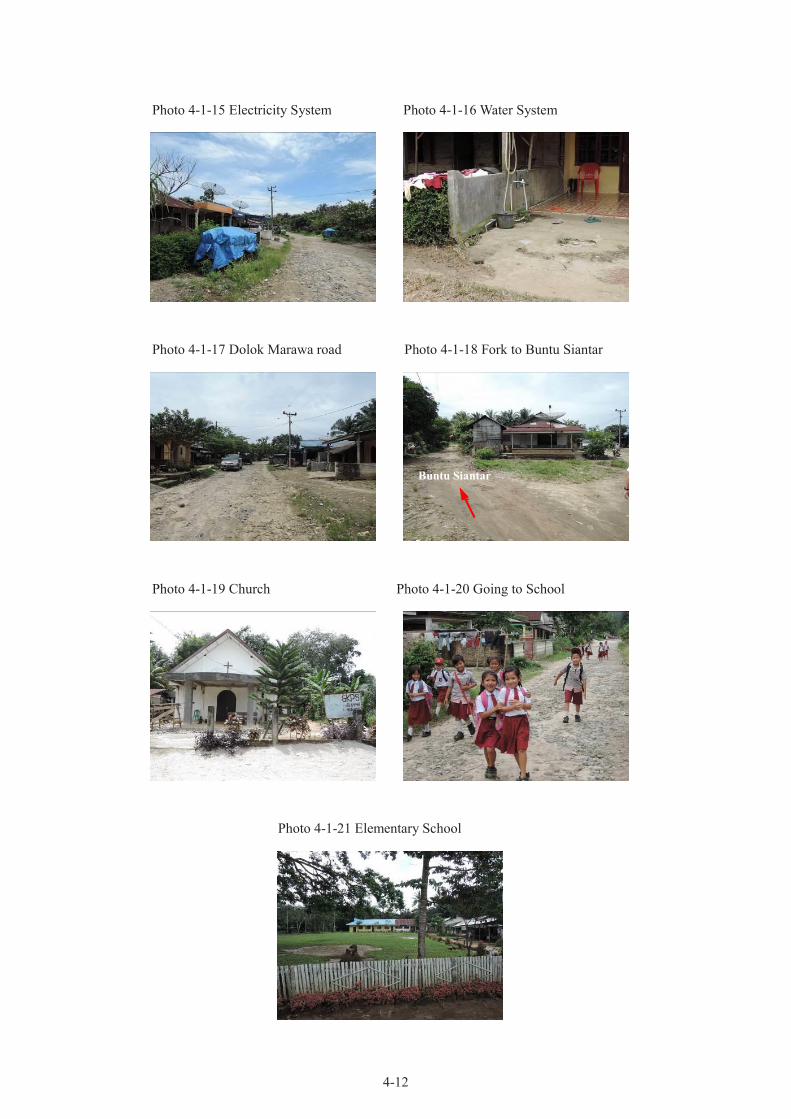
4-12
Photo 4-1-15 Electricity System Photo 4-1-16 Water System
Photo 4-1-17 Dolok Marawa road Photo 4-1-18 Fork to Buntu Siantar
Photo 4-1-19 Church Photo 4-1-20 Going to School
Photo 4-1-21 Elementary School
Buntu Siantar
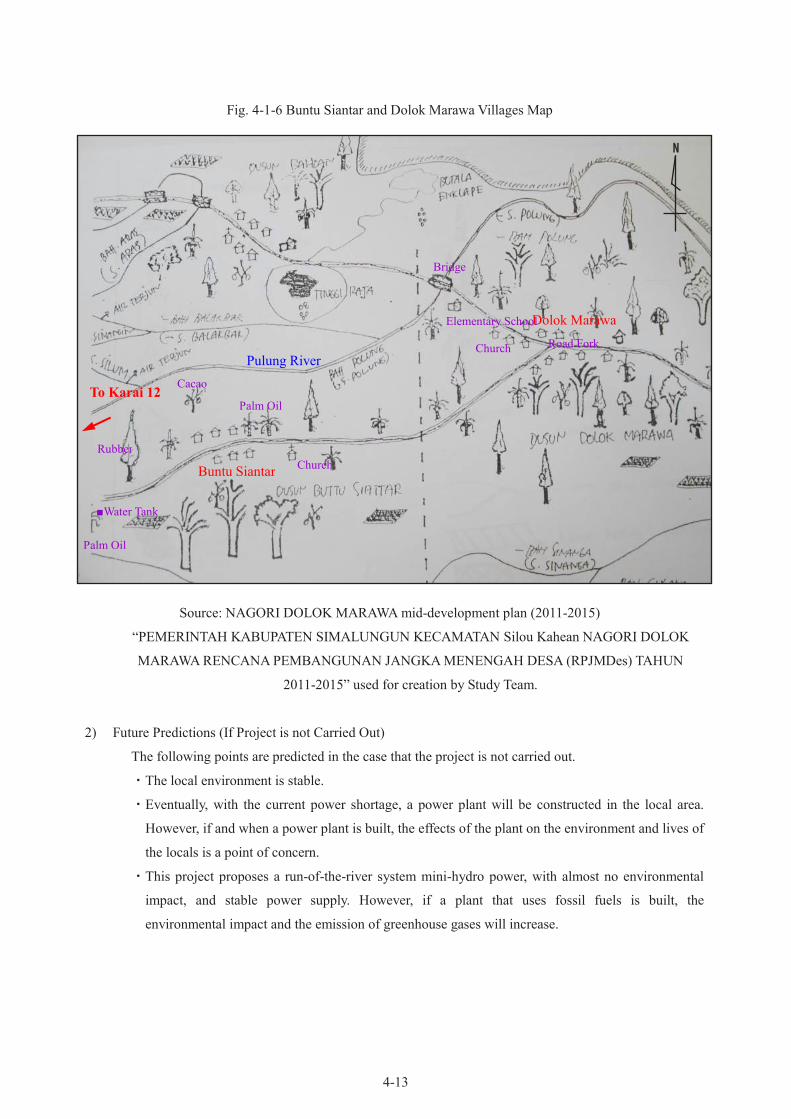
4-13
Fig. 4-1-6 Buntu Siantar and Dolok Marawa Villages Map
Source: NAGORI DOLOK MARAWA mid-development plan (2011-2015)
“PEMERINTAH KABUPATEN SIMALUNGUN KECAMATAN Silou Kahean NAGORI DOLOK
MARAWA RENCANA PEMBANGUNAN JANGKA MENENGAH DESA (RPJMDes) TAHUN
2011-2015” used for creation by Study Team.
2) Future Predictions (If Project is not Carried Out)
The following points are predicted in the case that the project is not carried out.
・The local environment is stable.
・Eventually, with the current power shortage, a power plant will be constructed in the local area.
However, if and when a power plant is built, the effects of the plant on the environment and lives of
the locals is a point of concern.
・This project proposes a run-of-the-river system mini-hydro power, with almost no environmental
impact, and stable power supply. However, if a plant that uses fossil fuels is built, the
environmental impact and the emission of greenhouse gases will increase.
Pulung River
Dolok Marawa
To Karai 12
N
Church
Church
Elementary School
Palm Oil
Cacao
Rubber
Buntu Siantar
Palm Oil
■Water Tank
Bridge
Road Fork
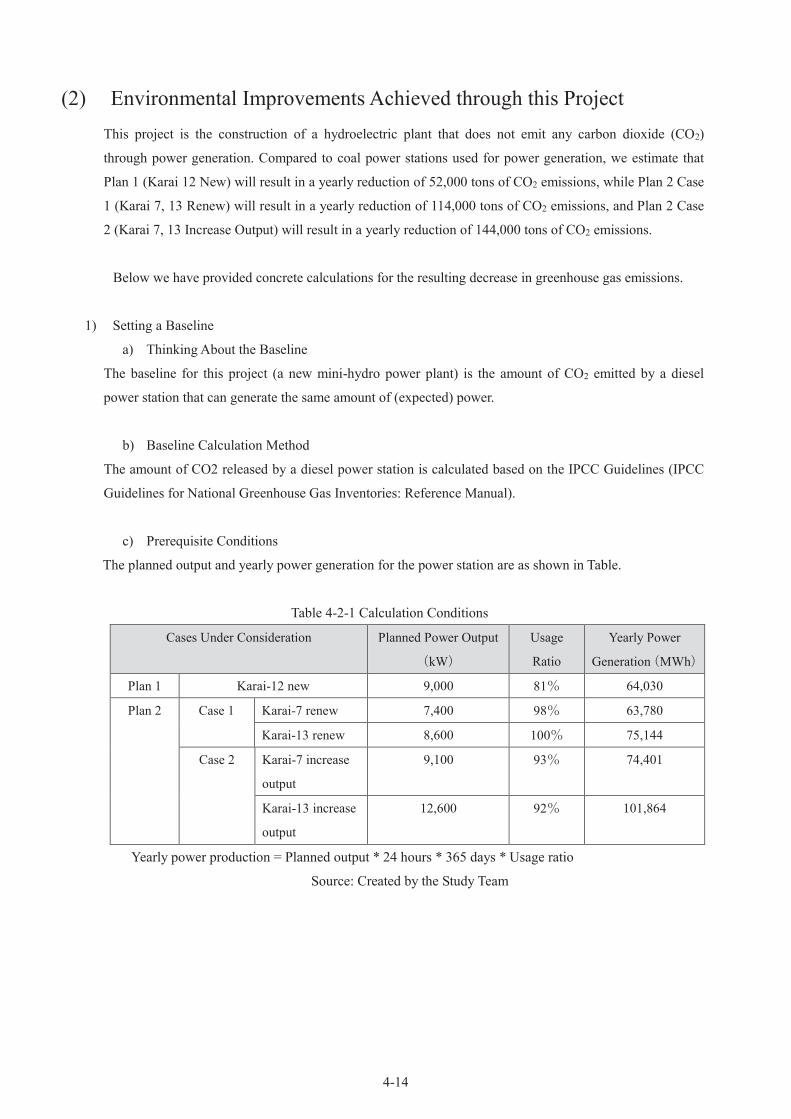
4-14
(2) Environmental Improvements Achieved through this Project
This project is the construction of a hydroelectric plant that does not emit any carbon dioxide (CO2)
through power generation. Compared to coal power stations used for power generation, we estimate that
Plan 1 (Karai 12 New) will result in a yearly reduction of 52,000 tons of CO2 emissions, while Plan 2 Case
1 (Karai 7, 13 Renew) will result in a yearly reduction of 114,000 tons of CO2 emissions, and Plan 2 Case
2 (Karai 7, 13 Increase Output) will result in a yearly reduction of 144,000 tons of CO2 emissions.
Below we have provided concrete calculations for the resulting decrease in greenhouse gas emissions.
1) Setting a Baseline
a) Thinking About the Baseline
The baseline for this project (a new mini-hydro power plant) is the amount of CO2 emitted by a diesel
power station that can generate the same amount of (expected) power.
b) Baseline Calculation Method
The amount of CO2 released by a diesel power station is calculated based on the IPCC Guidelines (IPCC
Guidelines for National Greenhouse Gas Inventories: Reference Manual).
c) Prerequisite Conditions
The planned output and yearly power generation for the power station are as shown in Table.
Table 4-2-1 Calculation Conditions
Cases Under Consideration Planned Power Output
(kW)
Usage
Ratio
Yearly Power
Generation(MWh)
Plan 1 Karai-12 new 9,000 81% 64,030
Plan 2 Case 1 Karai-7 renew 7,400 98% 63,780
Karai-13 renew 8,600 100% 75,144
Case 2 Karai-7 increase
output
9,100 93% 74,401
Karai-13 increase
output
12,600 92% 101,864
Yearly power production = Planned output * 24 hours * 365 days * Usage ratio
Source: Created by the Study Team
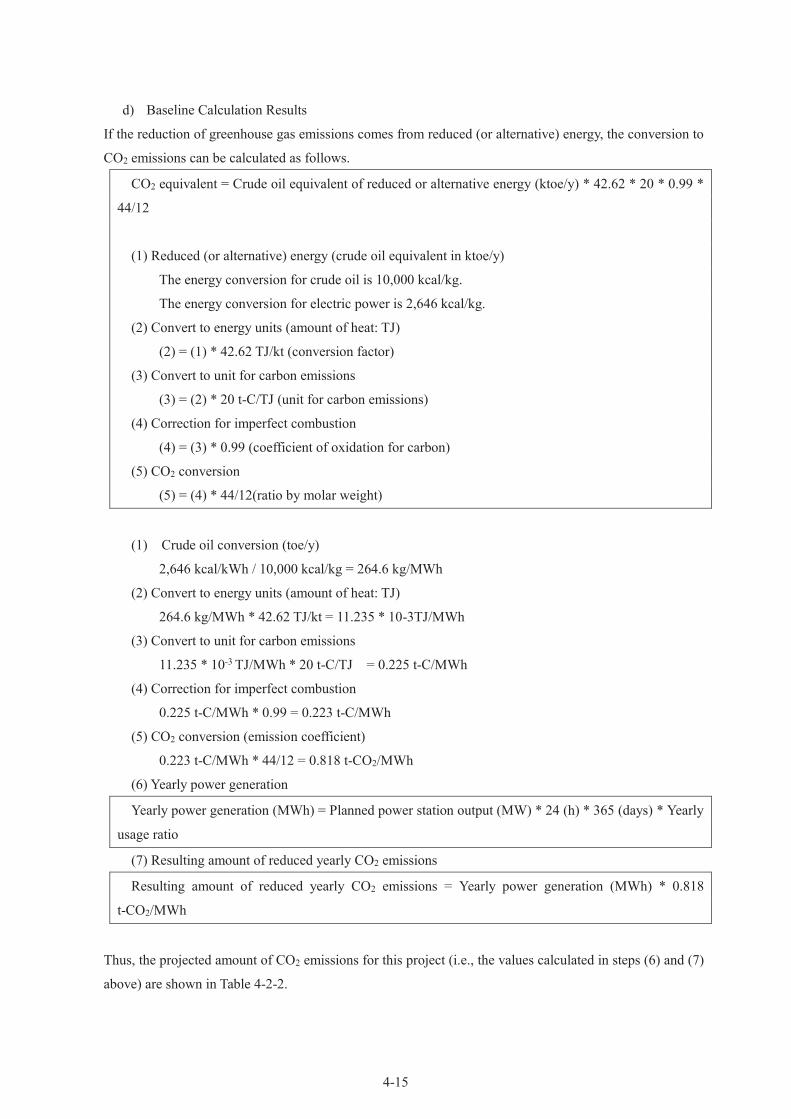
4-15
d) Baseline Calculation Results
If the reduction of greenhouse gas emissions comes from reduced (or alternative) energy, the conversion to
CO2 emissions can be calculated as follows.
CO2 equivalent = Crude oil equivalent of reduced or alternative energy (ktoe/y) * 42.62 * 20 * 0.99 *
44/12
(1) Reduced (or alternative) energy (crude oil equivalent in ktoe/y)
The energy conversion for crude oil is 10,000 kcal/kg.
The energy conversion for electric power is 2,646 kcal/kg.
(2) Convert to energy units (amount of heat: TJ)
(2) = (1) * 42.62 TJ/kt (conversion factor)
(3) Convert to unit for carbon emissions
(3) = (2) * 20 t-C/TJ (unit for carbon emissions)
(4) Correction for imperfect combustion
(4) = (3) * 0.99 (coefficient of oxidation for carbon)
(5) CO2 conversion
(5) = (4) * 44/12(ratio by molar weight)
(1) Crude oil conversion (toe/y)
2,646 kcal/kWh / 10,000 kcal/kg = 264.6 kg/MWh
(2) Convert to energy units (amount of heat: TJ)
264.6 kg/MWh * 42.62 TJ/kt = 11.235 * 10-3TJ/MWh
(3) Convert to unit for carbon emissions
11.235 * 10-3 TJ/MWh * 20 t-C/TJ = 0.225 t-C/MWh
(4) Correction for imperfect combustion
0.225 t-C/MWh * 0.99 = 0.223 t-C/MWh
(5) CO2 conversion (emission coefficient)
0.223 t-C/MWh * 44/12 = 0.818 t-CO2/MWh
(6) Yearly power generation
Yearly power generation (MWh) = Planned power station output (MW) * 24 (h) * 365 (days) * Yearly
usage ratio
(7) Resulting amount of reduced yearly CO2 emissions
Resulting amount of reduced yearly CO2 emissions = Yearly power generation (MWh) * 0.818
t-CO2/MWh
Thus, the projected amount of CO2 emissions for this project (i.e., the values calculated in steps (6) and (7)
above) are shown in Table 4-2-2.
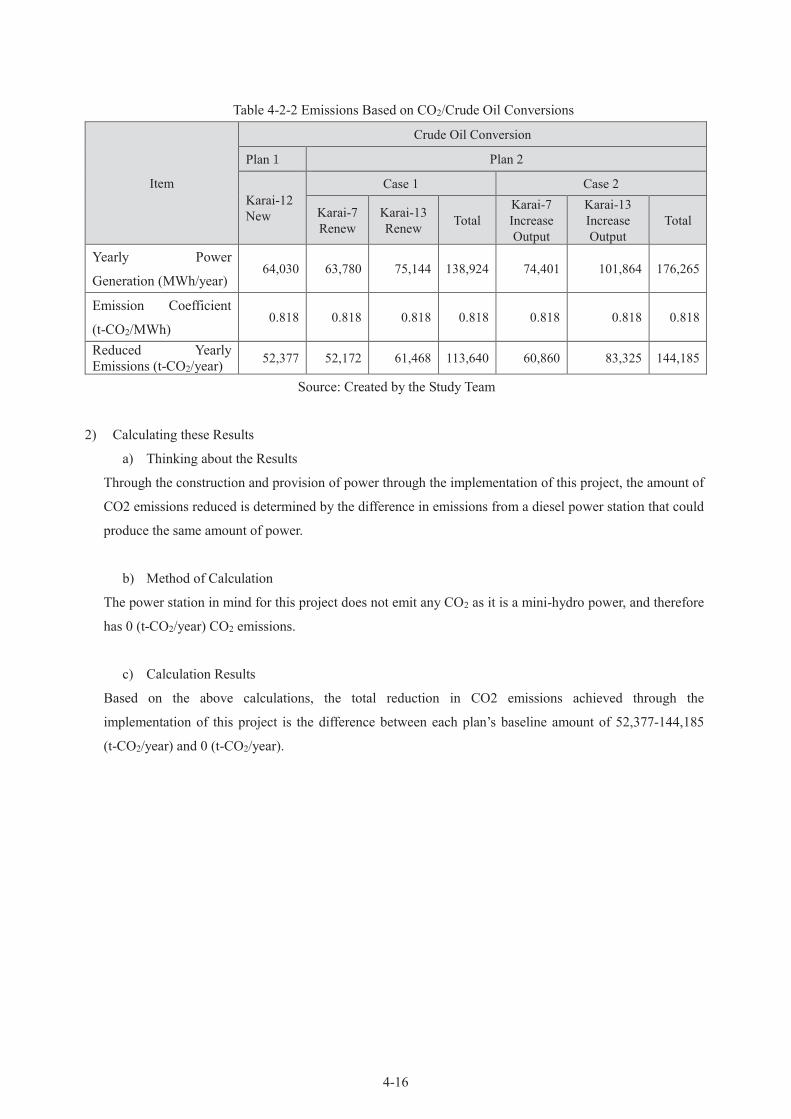
4-16
Table 4-2-2 Emissions Based on CO2/Crude Oil Conversions
Item
Crude Oil Conversion
Plan1 Plan 2
Karai-12
New
Case 1 Case 2
Karai-7
Renew
Karai-13
Renew Total
Karai-7
Increase
Output
Karai-13
Increase
Output
Total
Yearly Power
Generation (MWh/year) 64,030 63,780 75,144 138,924 74,401 101,864 176,265
Emission Coefficient
(t-CO2/MWh) 0.818 0.818 0.818 0.818 0.818 0.818 0.818
Reduced Yearly
Emissions (t-CO2/year) 52,377 52,172 61,468 113,640 60,860 83,325 144,185
Source: Created by the Study Team
2) Calculating these Results
a) Thinking about the Results
Through the construction and provision of power through the implementation of this project, the amount of
CO2 emissions reduced is determined by the difference in emissions from a diesel power station that could
produce the same amount of power.
b) Method of Calculation
The power station in mind for this project does not emit any CO2 as it is a mini-hydro power, and therefore
has 0 (t-CO2/year) CO2 emissions.
c) Calculation Results
Based on the above calculations, the total reduction in CO2 emissions achieved through the
implementation of this project is the difference between each plan’s baseline amount of 52,377-144,185
(t-CO2/year) and 0 (t-CO2/year).
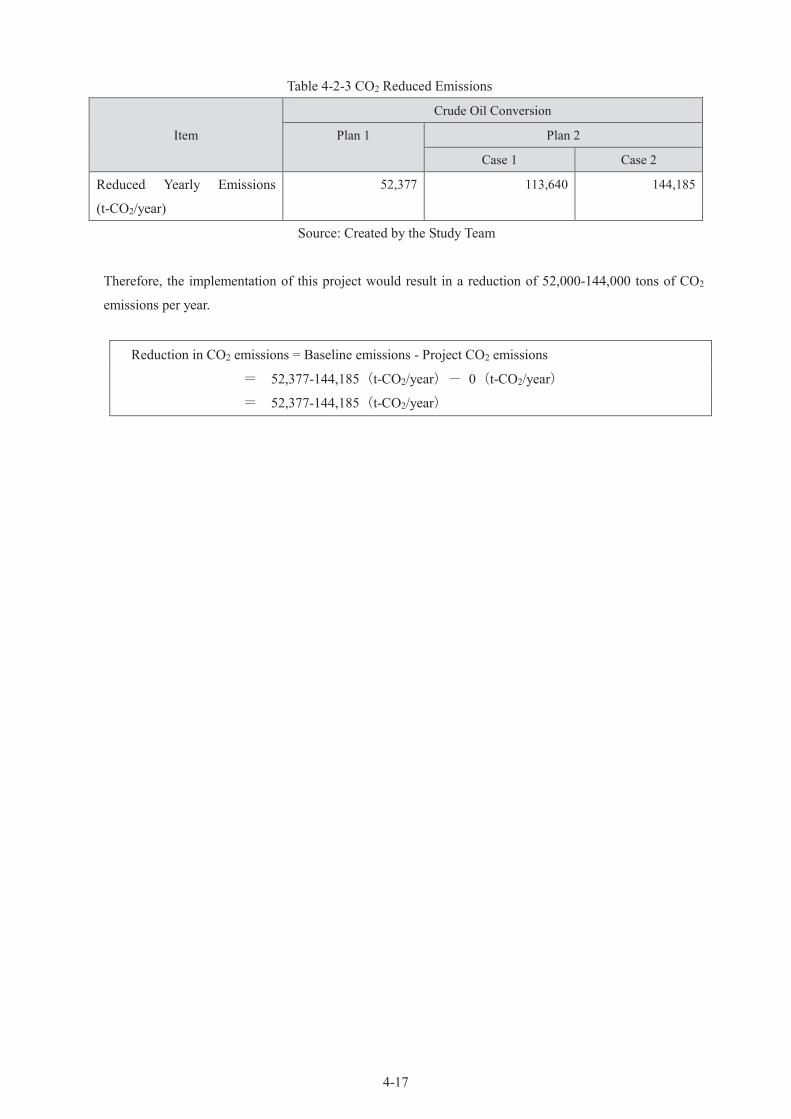
4-17
Table 4-2-3 CO2 Reduced Emissions
Item
Crude Oil Conversion
Plan 1 Plan 2
Case 1 Case 2
Reduced Yearly Emissions
(t-CO2/year)
52,377 113,640 144,185
Source: Created by the Study Team
Therefore, the implementation of this project would result in a reduction of 52,000-144,000 tons of CO2
emissions per year.
Reduction in CO2 emissions = Baseline emissions - Project CO2 emissions
= 52,377-144,185(t-CO2/year)- 0(t-CO2/year)
= 52,377-144,185(t-CO2/year)
4-18
(3) Environmental and Social Improvements Achieved through the
Implementation of this Project
1) Screening of Economic and Social Topics Referred to in the JICA and JBIC Guidelines
As part of the work for this investigation, we conducted on-site investigations and held hearings with and
collected materials from all relevant organizations with reference to the following materials: Appendix 4:
Screening Methods and Table of Checklists included in the JICA Social and Environmental Guidelines and
the Screening Form and Table of Checklists included in the reference materials with the JBIC Bank for
International Cooperation Guidelines for Social and Environmental Issues. After the on-site investigation,
we screened for items that might affect social and environmental issues, keeping in consideration the scale
of the project.
Our results conclude that there would be no major negative effects on either the environmental or social
landscape. The power station planned for this project is not large in scale and uses a river flow
methodology for water intake, which makes it a safe power station for the environment. Due to the fact
that we do not project any major environmental influences after operation of the power station is started
and that no rivers that are used by neighboring indigenous peoples for their daily lives are affected by its
construction (Local Resident Hearing Result), we project that there will be very little environmental or
social effects.
However, according to an environmental management program and environmental monitoring
(UKL-UPL) report concerning industrial plantation in the sub districts of Dolok Silou and Silou Kahean,
Sun Bears are designated as a protected species in the 1999 7th edition of the Indonesian government’s
guidelines for the protection of plants and animals. Also, there is no survey data concerning amphibious,
fish, and insect species that depend on the target rivers, Pulung and Karai, to live. Because of this, it will
be necessary to show intelligence gathering, surveys, and countermeasures from the UKL-UPL creation
stage.
The following table shows the results of our investigation based on the above guidelines and checklists.

4-19
Table 4-3-1 Investigation Results Based on Environmental Checklists
Environmental Item Investigation Results
Permits,
Licenses, and
Explanations
EIA and
environmental
permits
・This project does not meet the scale to be considered.
・Projects that are exempt from AMDAL must create an
environmental management program and environmental
monitoring program (UKL-UPL).
Explanation to
indigenous peoples
・Because this project is still in the initial consideration phase,
explanation to indigenous peoples has not been conducted.
Pollution
Countermeasures
Air quality Hydro power does not produce any dust or air-polluting
materials.
Water quality Hydro power does not produce any water pollution.
Waste materials Hydro power does not produce any water pollution.
Land pollution Hydro power does not produce any harmful, land-polluting
materials from its power station facilities.
Noise/Vibrations ・The nearest village (Buntu Siantar) Is about 2km away, so
there will be no noise or vibration impact.
Ground settlement ・Because this is a mini facility using a run-of-the-river
system, there is no chance of drawing up groundwater
ground settlement from foundation construction.
Smell ・No waste or polluting materials are produced that could
result in any smells or odors.
Natural
Environment
Protected areas ・Near the proposed construction site is the Dolok Tinggi Raja
Nature Conservation Area, and the surrounding area is
classified as forest reserve, but both are about 3km away.
・The proposed site is mainly perpetual production forest, dry
land agriculture, or plantations.
Ecosystem ・The project target location is in a mountainous region, and
there is no information of important or endangered species
in the area. However, according to (UKL-UPL) report
concerning industrial plantation in the target area, Sun
Bears are designated as a protected species in the 1999
7th edition of the Indonesian government’s guidelines for
the protection of plants and animals. Also, there is no
survey data concerning amphibious, fish, and insect
species that depend on the target rivers, Pulung and
Karai, to live. Because of this, it will be necessary to
show intelligence gathering, surveys, and
countermeasures from the UKL-UPL creation stage.
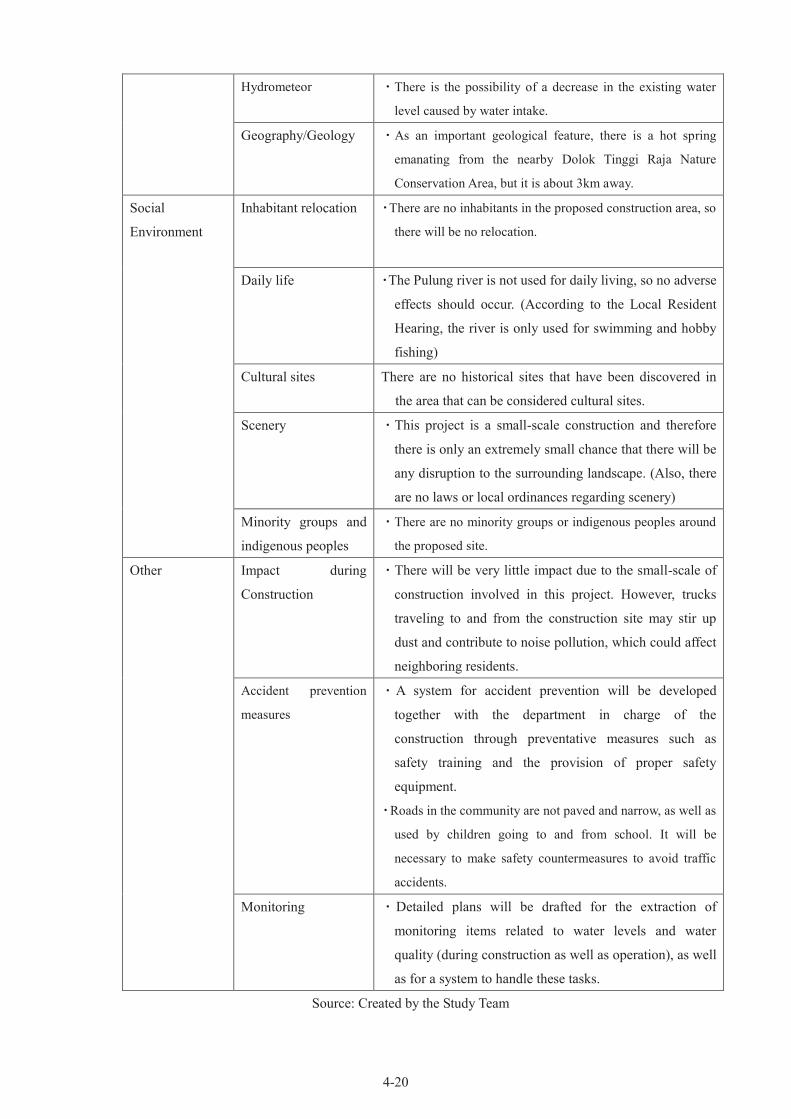
4-20
Hydrometeor ・There is the possibility of a decrease in the existing water
level caused by water intake.
Geography/Geology
・As an important geological feature, there is a hot spring
emanating from the nearby Dolok Tinggi Raja Nature
Conservation Area, but it is about 3km away.
Social
Environment
Inhabitant relocation
・There are no inhabitants in the proposed construction area, so
there will be no relocation.
Daily life
・The Pulung river is not used for daily living, so no adverse
effects should occur. (According to the Local Resident
Hearing, the river is only used for swimming and hobby
fishing)
Cultural sites There are no historical sites that have been discovered in
the area that can be considered cultural sites.
Scenery
・This project is a small-scale construction and therefore
there is only an extremely small chance that there will be
any disruption to the surrounding landscape. (Also, there
are no laws or local ordinances regarding scenery)
Minority groups and
indigenous peoples
・There are no minority groups or indigenous peoples around
the proposed site.
Other Impact during
Construction
・There will be very little impact due to the small-scale of
construction involved in this project. However, trucks
traveling to and from the construction site may stir up
dust and contribute to noise pollution, which could affect
neighboring residents.
Accident prevention
measures
・A system for accident prevention will be developed
together with the department in charge of the
construction through preventative measures such as
safety training and the provision of proper safety
equipment.
・Roads in the community are not paved and narrow, as well as
used by children going to and from school. It will be
necessary to make safety countermeasures to avoid traffic
accidents.
Monitoring ・Detailed plans will be drafted for the extraction of
monitoring items related to water levels and water
quality (during construction as well as operation), as well
as for a system to handle these tasks.
Source: Created by the Study Team

4-21
2) Other Options and Comparisons for Less Environmental and Social Impact
The mini-hydro power project proposed in this project is a clean, economical, and stable solution for the
provision of power and we are unable to find any other options that may result in less environmental and
social impact.
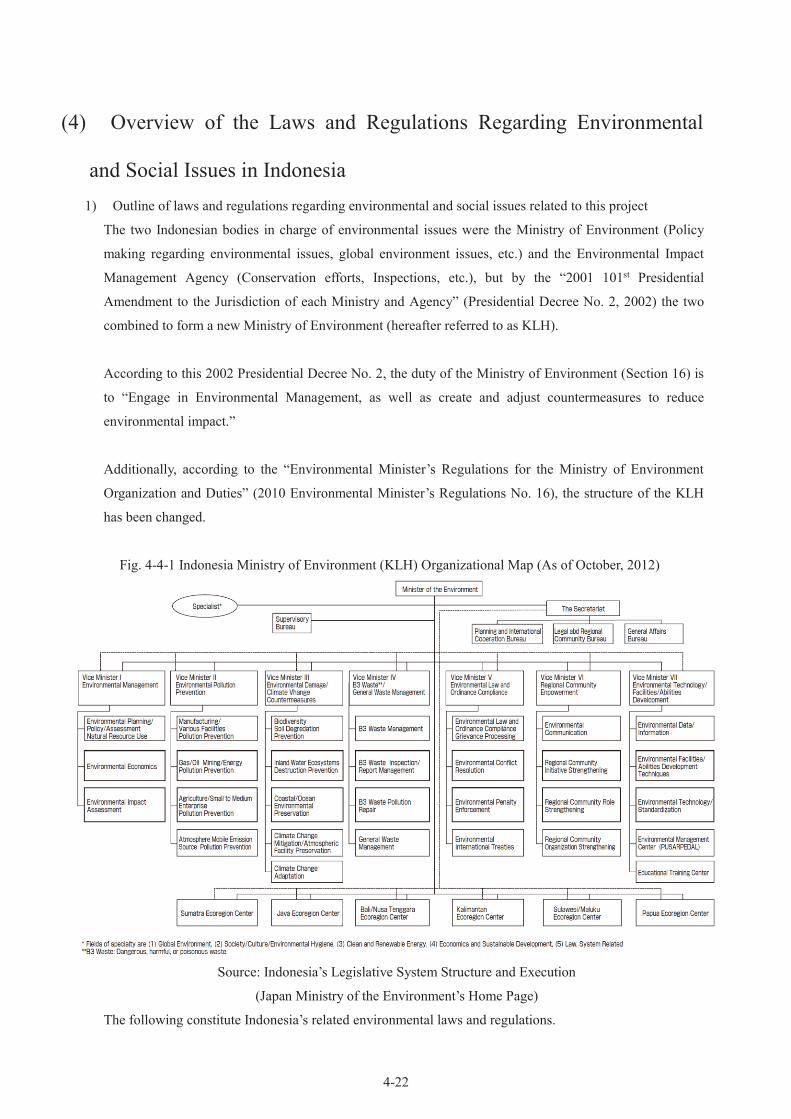
4-22
(4) Overview of the Laws and Regulations Regarding Environmental
and Social Issues in Indonesia
1) Outline of laws and regulations regarding environmental and social issues related to this project
The two Indonesian bodies in charge of environmental issues were the Ministry of Environment (Policy
making regarding environmental issues, global environment issues, etc.) and the Environmental Impact
Management Agency (Conservation efforts, Inspections, etc.), but by the “2001 101st Presidential
Amendment to the Jurisdiction of each Ministry and Agency” (Presidential Decree No. 2, 2002) the two
combined to form a new Ministry of Environment (hereafter referred to as KLH).
According to this 2002 Presidential Decree No. 2, the duty of the Ministry of Environment (Section 16) is
to “Engage in Environmental Management, as well as create and adjust countermeasures to reduce
environmental impact.”
Additionally, according to the “Environmental Minister’s Regulations for the Ministry of Environment
Organization and Duties” (2010 Environmental Minister’s Regulations No. 16), the structure of the KLH
has been changed.
Fig. 4-4-1 Indonesia Ministry of Environment (KLH) Organizational Map (As of October, 2012)
Source: Indonesia’s Legislative System Structure and Execution
(Japan Ministry of the Environment’s Home Page)
The following constitute Indonesia’s related environmental laws and regulations.
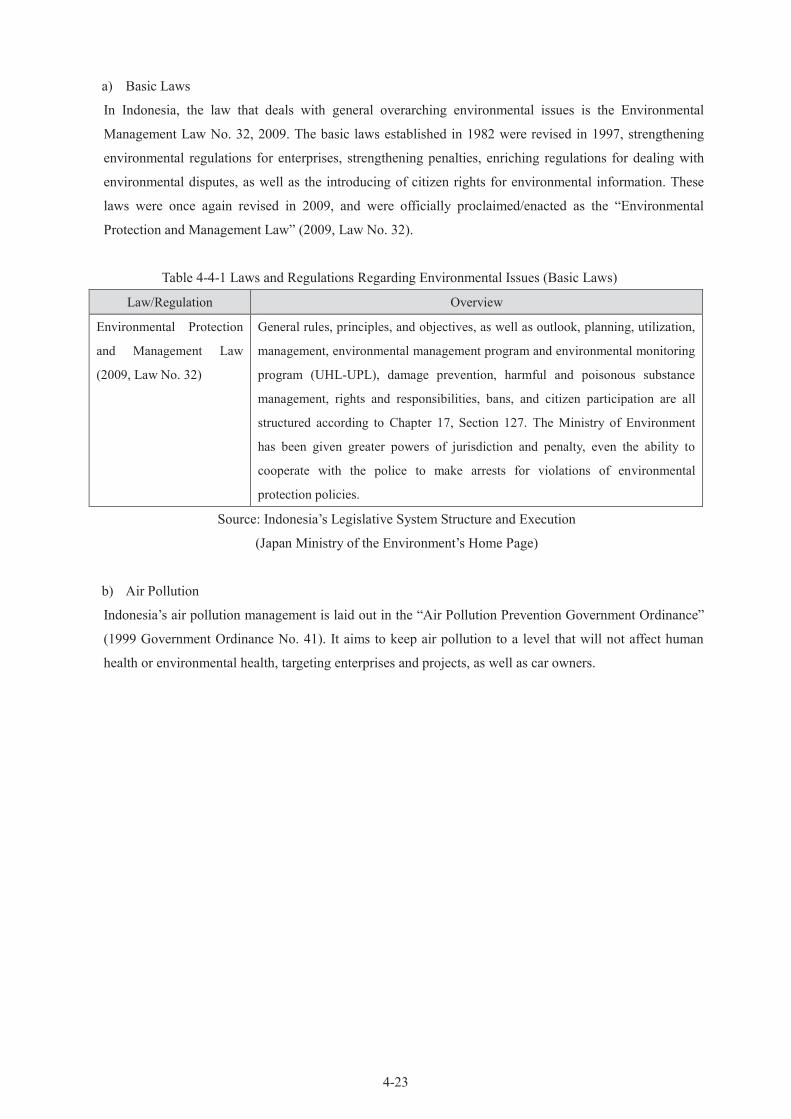
4-23
a) Basic Laws
In Indonesia, the law that deals with general overarching environmental issues is the Environmental
Management Law No. 32, 2009. The basic laws established in 1982 were revised in 1997, strengthening
environmental regulations for enterprises, strengthening penalties, enriching regulations for dealing with
environmental disputes, as well as the introducing of citizen rights for environmental information. These
laws were once again revised in 2009, and were officially proclaimed/enacted as the “Environmental
Protection and Management Law” (2009, Law No. 32).
Table 4-4-1 Laws and Regulations Regarding Environmental Issues (Basic Laws)
Law/Regulation Overview
Environmental Protection
and Management Law
(2009, Law No. 32)
General rules, principles, and objectives, as well as outlook, planning, utilization,
management, environmental management program and environmental monitoring
program (UHL-UPL), damage prevention, harmful and poisonous substance
management, rights and responsibilities, bans, and citizen participation are all
structured according to Chapter 17, Section 127. The Ministry of Environment
has been given greater powers of jurisdiction and penalty, even the ability to
cooperate with the police to make arrests for violations of environmental
protection policies.
Source: Indonesia’s Legislative System Structure and Execution
(Japan Ministry of the Environment’s Home Page)
b) Air Pollution
Indonesia’s air pollution management is laid out in the “Air Pollution Prevention Government Ordinance”
(1999 Government Ordinance No. 41). It aims to keep air pollution to a level that will not affect human
health or environmental health, targeting enterprises and projects, as well as car owners.
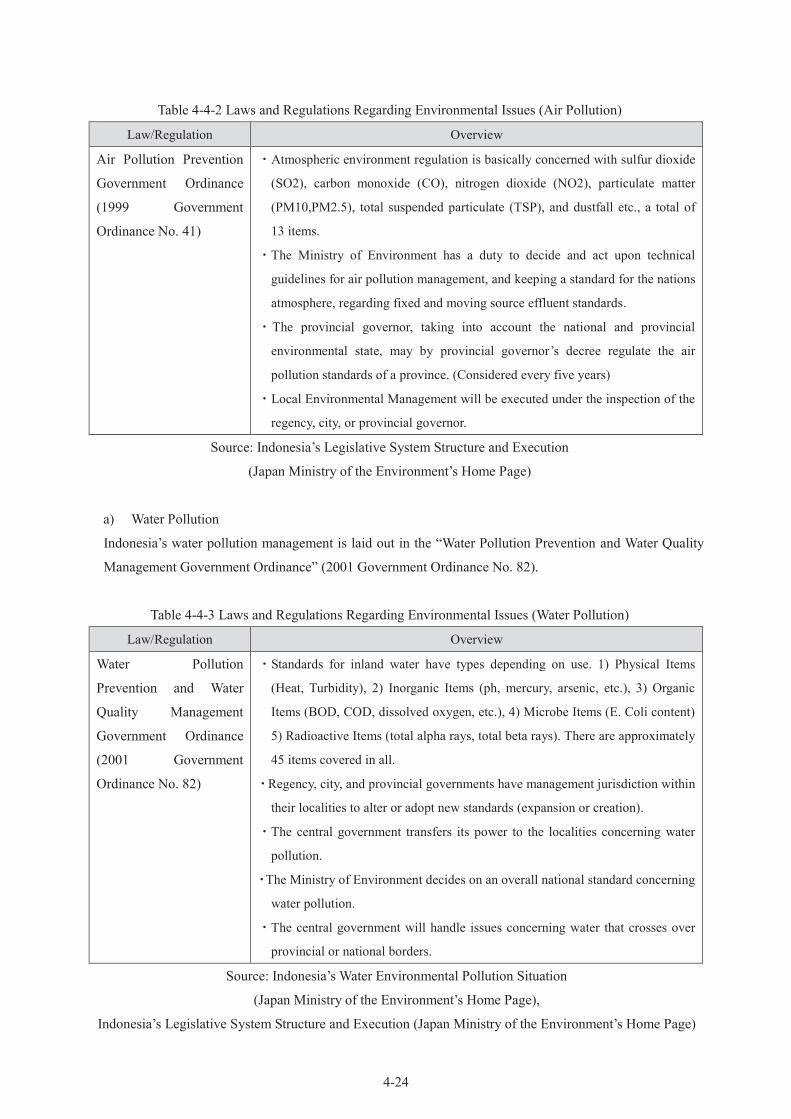
4-24
Table 4-4-2 Laws and Regulations Regarding Environmental Issues (Air Pollution)
Law/Regulation Overview
Air Pollution Prevention
Government Ordinance
(1999 Government
Ordinance No. 41)
・Atmospheric environment regulation is basically concerned with sulfur dioxide
(SO2), carbon monoxide (CO), nitrogen dioxide (NO2), particulate matter
(PM10,PM2.5), total suspended particulate (TSP), and dustfall etc., a total of
13 items.
・The Ministry of Environment has a duty to decide and act upon technical
guidelines for air pollution management, and keeping a standard for the nations
atmosphere, regarding fixed and moving source effluent standards.
・The provincial governor, taking into account the national and provincial
environmental state, may by provincial governor’s decree regulate the air
pollution standards of a province. (Considered every five years)
・Local Environmental Management will be executed under the inspection of the
regency, city, or provincial governor.
Source: Indonesia’s Legislative System Structure and Execution
(Japan Ministry of the Environment’s Home Page)
a) Water Pollution
Indonesia’s water pollution management is laid out in the “Water Pollution Prevention and Water Quality
Management Government Ordinance” (2001 Government Ordinance No. 82).
Table 4-4-3 Laws and Regulations Regarding Environmental Issues (Water Pollution)
Law/Regulation Overview
Water Pollution
Prevention and Water
Quality Management
Government Ordinance
(2001 Government
Ordinance No. 82)
・Standards for inland water have types depending on use. 1) Physical Items
(Heat, Turbidity), 2) Inorganic Items (ph, mercury, arsenic, etc.), 3) Organic
Items (BOD, COD, dissolved oxygen, etc.), 4) Microbe Items (E. Coli content)
5) Radioactive Items (total alpha rays, total beta rays). There are approximately
45 items covered in all.
・Regency, city, and provincial governments have management jurisdiction within
their localities to alter or adopt new standards (expansion or creation).
・The central government transfers its power to the localities concerning water
pollution.
・The Ministry of Environment decides on an overall national standard concerning
water pollution.
・The central government will handle issues concerning water that crosses over
provincial or national borders.
Source: Indonesia’s Water Environmental Pollution Situation
(Japan Ministry of the Environment’s Home Page),
Indonesia’s Legislative System Structure and Execution (Japan Ministry of the Environment’s Home Page)

4-25
c) Noises, Vibrations, and Smells
Indonesia’s regulations regarding noise, vibration, and smell pollution are laid out in the 1996 Minister of
the Environment’s Decree Numbers 48, 49, and 50. Noises, vibrations, and smells should be regulated to a
level that does not impact human health or environmental health, targeting enterprises and projects for
regulation.
Table 4-4-4 Laws and Regulations Regarding Environmental Issues (Noise, Vibration, Smells)
Law/Regulation Overview
Minister of the
Environment’s Decree on
Noise Standards (1996
No. 48)
・Standards for noise levels are decided depending on the type of land use
(Residence, Business, Office, Green Land, Manufacturing, Government Office,
Public Facilities, Recreational Facilities, Other including Airports, Stations,
Ports, Cultural Assets), as well as the type of activity (Hospital, School, Place
of Prayer).
Minister of the
Environment’s Decree on
Vibration Standards
(1996 No. 49)
・Standards for vibration are decided based on wave frequency including
standards for vibration from machine damage, vibration from other building
machines, and impact vibrations.
Minister of the
Environment’s Decree on
Smell Standards (1996
No. 50)
・Standards for smells are made up of five points, including Ammonia, Hydrogen
Sulfide, and Methyl Sulfide, etc.
Source: Indonesia’s Legislative System Structure and Execution
(Japan Ministry of the Environment’s Home Page)
d) Waste Related
Information on Indonesia’s waste management policy can be found in the “Rules No. 18 on the
Management of Harmful Waste” (1999). Regulation targets and contents are laid out for the limiting and
prevention environmental pollution through management of harmful wastes. Also, a list of harmful
substances such as 1) Unspecified Origin, 2) Specific Origin, 3) Expired Chemical Substances, etc. is
included.
2) Contents of the EIA (Environmental Impact Assessment) Required for Implementation of the Project
The Indonesian Environmental Impact Assessment (AMDAL) was created based on the 1983
Environmental Management Standards Law No. 16 in 1986, and in 1993 was revised by the “Ordinance
Concerning the Environmental Impact Assessment” (No. 51). The revision mainly simplified the initial
screening process, and strengthened the environmental impact management agency’s jurisdiction
concerning inspection of enterprises that involve several ministries/agencies. It was revised once more in
1999, and again in 2012 (2012 Ordinance No. 27).
Types and scopes of projects that qualify as targets for an environmental impact assessment are laid out in
4-26
the “Minister of the Environment’s Standards for Target Enterprise Activities and Scopes for
Environmental Impact Planning” (2012 Minister of the Environment’s Standards No. 5), and those types
and sizes are reconsidered once each five years.
According to the 2012 Minister of the Environment’s Standards No. 5, in the fields of energy and mineral
resources, “Intake Weir Height≧15m or Water Storage Area≧200ha or Energy Capacity≧50MW” are the
standards for an AMDAL requirement for hydroelectric power generation.
As for this project, Plan 1 (Karai 12 New Construction) is 9MW, Plan 2 Case 1 (Karai 7 and Karai 13
Improvement) is 16 MW, and Plan 2 Case 2 (Karai 7 and Karai 13 Output Increase) totals at 22 MW of
hydroelectric power generation. The intake weir is 5m, and the other requirements are not applicable, so all
of the plans fall outside the requirement for AMDAL.
3) Measures required to Satisfy Related Rules and Regulations
This project does not fall under the AMDAL requirement. However, according to the 34th section of “Laws
Concerning Environmental Conservation and Management” (2009 Law No. 32), “Enterprises and activities
which do not have an AMDAL requirement must create an environmental management program and
environmental monitoring program (UKL-UPL).” UKL-UPL is aimed to manage and monitor enterprises
and activities which do not have a large environmental impact, and is a necessary item for decision-making
concerning operating procedures for those enterprises/activities.
Additionally, according to section 36 in the same document, “Enterprises and activities with a UKL-UPL
requirement must receive an environmental permit.” An environmental permit is necessary to be permitted
to engage in project activities, and is given to all parties undertaking enterprises and activities that fall
under the UKL-UPL requirement. Also, an environmental permit must be received from the Minister, and
various provincial, regency, and city governors for their various jurisdictions.
In order to satisfy all related rules and regulations, the documents required of all of the above laws and
ordinances must be submitted, and agreement must be gained from the local governing body through a
local resident hearing. Lastly, firm countermeasures and steps must be taken in regards to any of the above
environmental impact points that might apply to this project.
4-27
(5) Necessary Actions from Indonesia (Implementing Agencies and
Other Organizations) to Fulfill this Project
The following actions should be taken by the Indonesian government and related agencies in order to make
this project a reality.
-Smooth handling of the permitting process, including the evaluation of environmental impact
assessments (UKL-UPL)
-Have discussions with indigenous peoples in the region and provide support in times of conflict
-Public and fair discourse in relation to information regarding the project
The importance of considering the impact we have on the environment and society will only increase as
time goes on. With this in mind, this project must be organized so that consideration is placed on the
impact the project will have on the regional society during its execution, as well as the benefits it may
bring. Most importantly, an agreement must be reached with the indigenous peoples of the region. When
the implementing private firms work to obtain the agreement of the indigenous peoples of the region, we
must place careful consideration on explaining the project clearly to them and progress smoothly as we can
the support and cooperation of the Philippine government.


Chapter 5 Financial and Economic Evaluation


5-1
(1) Estimated Project Cost
The overall cost of this project, in each case, is estimated as shown in Table 5-1-1. The project cost listed
includes the cost of civil engineering, electrical equipment, power transmission facilities, and other
building costs. The exchange rate was 119.23 JPY/USD, 0.0110 JPY/IDR1.
Table 5-1-1 Case-by-case Project Cost Breakdown
Plan 1 Plan 2
Case 1 Case 2
Karai 12 New
Karai Facility 7, 13
Renovation
+River Diversion Plan
1, 2
Karai Facility 7, 13
Expansion
+River Diversion Plan
1, 2
Output Increases By kW 9,000 - 5,700
Construction Cost (Civil
Engineering) millions IDR 62,293 64,084 95,400
Construction Cost
(Electrical Equipment)
thousands
USD 5,940 0 5,770
Construction Cost
(Transmission Equipment) millions IDR 15,400 0 15,400
Total Construction Cost millions IDR 142,077 64,084 173,342
Value-Added Tax (10%) millions IDR 14,208 6,408 17,334
Grand Total millions IDR 156,285 70,492 190,676
millions JPY 1,719 775 2,097
Source: Created by the Survey Commission
(2) Results Summary of Preliminary Financial/Economic Analyses
1) Fundraising
The current estimated total cost of constructing the new Karai 12 facility (as in Plan 1) is 156,285 million
IDR (about 1.7 billion JPY). Regarding fundraising, Syaria Mandiri, which has an established record as a
senior lender in the BIE, as well as Bank Muamalat and government financial institution SMI (Sarana
Multi Infrastruktur) can be offered as candidates. Further, we are anticipating IDI Infrastructures Inc.
(hereafter referred to as IDI-I) as a mezzanine lender.
1 Mitsubishi USJ Research and Consulting, Nov. 2014 TTS

5-2
It is estimated that senior loans will comprise 60 percent of the necessary funding, mezzanine financing 10
percent, with equity providing the final 30 percent.
If Karai 7 and Karai 13 are renovated, and their performance improved—as in Plan 2 Case 1—or if the
facilities are expanded and their output increased—as in Plan 2 Case 2—senior lenders and BIE funds
covered the existing equipment, and it is estimated that mezzanine financing will supply all additional
construction costs.
2) Detailed Statement
The following is a detailed statement of the basic elements, financial conditions, and operating costs of this
project. However, as there are still unconfirmed items within this statement, general figures from the BIE
hearing and other projects have been used for reference.

5-3
Table 5-2-1 Detailed Statement of the Confirmed Business Plan
Plan 1 Plan 2
Case 1 Case 2
Basic Elements Rated Output kW 9,000 16,000 21,700
Maximum Annual
Generation MWh 64,030 138,924 176,265
Equipment Capacity % 90% 90% 90%
Electricity Sold MWh 57,627 125,032 158,639
Unit Price (Sold) IDR/kWh
1,183
(Years 1-8)
878
(Year 1)
878
(Year 1)
IDR/kWh
825
(Years 9-20)
1,000
(Years 2-20)
1,000
(Years 2-20)
Annual Revenue
millions
IDR
68,173
(Years 1-8)
54,889
(Under
construction for
half of Year 1)
0
(Under
construction for
Year 1)
millions
IDR
47,542
(Years 9-20)
125,032
(Years 2-20)
158,639
(Years 2-20)
Capital Structure Senior Loans % 60% - -
Mezzanine Financing % 10%
100%
Additional
Construction
+ Operating
Costs
100%
Additional
Construction
+Operating
Costs
Equity % 30% - -
Senior Loans Interest Rate % 12% 12% 12%
Principal Deferment
Period years 2
Upon
commencement
of repayment
Upon
commencement
of repayment
Repayment Period years 10 10 10
Binding Deposit - 3 Months’ Interest
Mezzanine Financing Interest % 15% 15% 15%
Repayment Period years 10 10 10
Operating Cost Water Supply Cost IDR/kWh 5 5 5
Operating Cost
millions
IDR 3% of Construction Cost
Additional Costs
millions
IDR 1,200 1,200 1,200
Source: Created by the Survey Commission

5-4
Indonesia is promoting renewable energy as one part of a government plan to reduce crude oil
consumption, and the cost of mini-hydro power is continually under consideration for a price increase
under Feed-in Tariff system. The current unit price for the island of Sumatra is 1,183 IDR/kWh for the first
year through the eighth year following activation, and 825 IDR/kWh for years nine through twenty. This
applies to the construction of a new facility, Karai 12 (Case 1).
In Case 2, a PPA was executed for Karai 7 and 13 prior to the price increase. However, according to Law
22 of 2014 from the Ministry of Energy and Mineral Resources, a previously executed PPA may still be
subject to price revisions based on individual negotiations, so the purchase price has been set at 878
IDR/kWh for the first year, and 1,000 IDR/kWh for years two through twenty.
The duration of construction for the new construction in Plan 1 is two years, while the renovation of
existing equipment only in Plan 2 Case 1 is six months, and the accompanying expansion of Plan 2 Case 2
is one year. Plan 2 assumes that the existing power plants will be shut down during construction, and
therefore will not generate revenue during this period.
3) Project Plan
The following is profit and loss statement, balance sheet, and cash flow statement (for the 10 years
following investment). In any event, assuming proper management, this project can be implemented using
a steady revenue from electricity sales as capital.
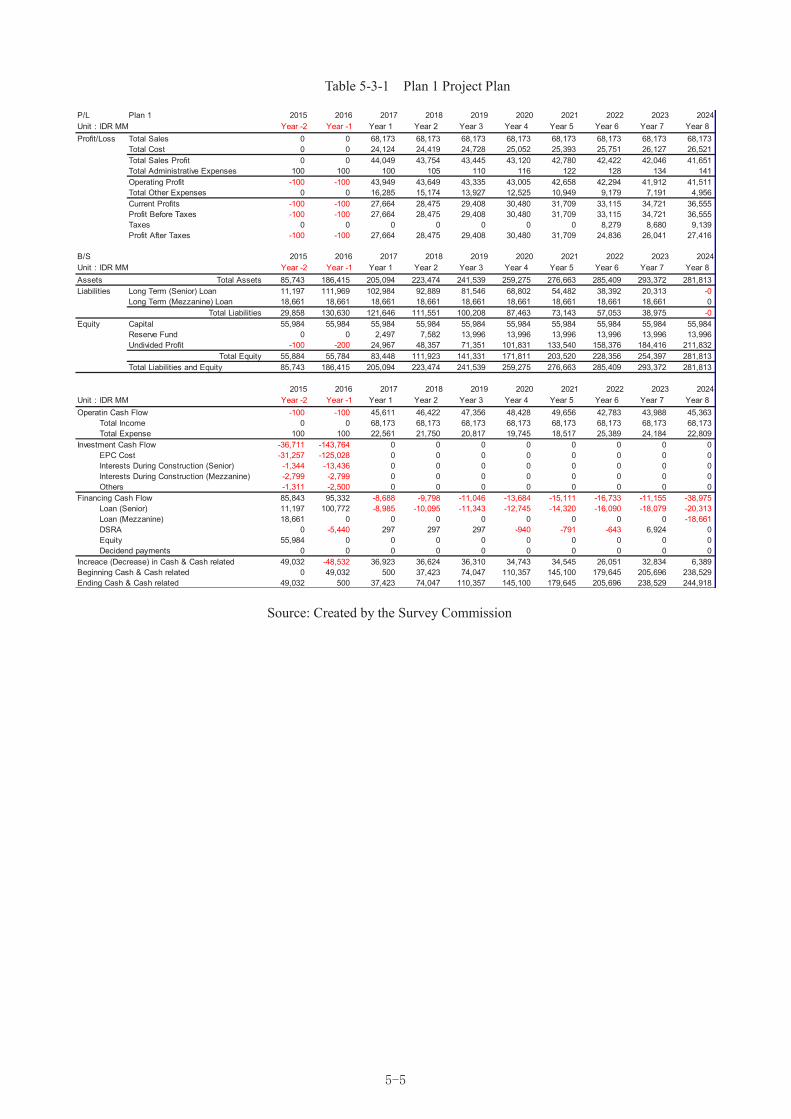
5-5
Table 5-3-1 Plan 1 Project Plan
P/L Plan 1 2015 2016 2017 2018 2019 2020 2021 2022 2023 2024
Unit:IDR MM Year -2 Year -1 Year 1 Year 2 Year 3 Year 4 Year 5 Year 6 Year 7 Year 8
Profit/Loss Total Sales 0 0 68,173 68,173 68,173 68,173 68,173 68,173 68,173 68,173
Total Cost 0 0 24,124 24,419 24,728 25,052 25,393 25,751 26,127 26,521
Total Sales Profit 0 0 44,049 43,754 43,445 43,120 42,780 42,422 42,046 41,651
Total Administrative Expenses 100 100 100 105 110 116 122 128 134 141
Operating Profit -100 -100 43,949 43,649 43,335 43,005 42,658 42,294 41,912 41,511
Total Other Expenses 0 0 16,285 15,174 13,927 12,525 10,949 9,179 7,191 4,956
Current Profits -100 -100 27,664 28,475 29,408 30,480 31,709 33,115 34,721 36,555
Profit Before Taxes -100 -100 27,664 28,475 29,408 30,480 31,709 33,115 34,721 36,555
Taxes 0 0 0 0 0 0 0 8,279 8,680 9,139
Profit After Taxes -100 -100 27,664 28,475 29,408 30,480 31,709 24,836 26,041 27,416
B/S 2015 2016 2017 2018 2019 2020 2021 2022 2023 2024
Unit:IDR MM Year -2 Year -1 Year 1 Year 2 Year 3 Year 4 Year 5 Year 6 Year 7 Year 8
Assets Total Assets 85,743 186,415 205,094 223,474 241,539 259,275 276,663 285,409 293,372 281,813
Liabilities Long Term (Senior) Loan 11,197 111,969 102,984 92,889 81,546 68,802 54,482 38,392 20,313 -0
Long Term (Mezzanine) Loan 18,661 18,661 18,661 18,661 18,661 18,661 18,661 18,661 18,661 0
Total Liabilities 29,858 130,630 121,646 111,551 100,208 87,463 73,143 57,053 38,975 -0
Equity Capital 55,984 55,984 55,984 55,984 55,984 55,984 55,984 55,984 55,984 55,984
Reserve Fund 0 0 2,497 7,582 13,996 13,996 13,996 13,996 13,996 13,996
Undivided Profit -100 -200 24,967 48,357 71,351 101,831 133,540 158,376 184,416 211,832
Total Equity 55,884 55,784 83,448 111,923 141,331 171,811 203,520 228,356 254,397 281,813
Total Liabilities and Equity 85,743 186,415 205,094 223,474 241,539 259,275 276,663 285,409 293,372 281,813
2015 2016 2017 2018 2019 2020 2021 2022 2023 2024
Unit:IDR MM Year -2 Year -1 Year 1 Year 2 Year 3 Year 4 Year 5 Year 6 Year 7 Year 8
Operatin Cash Flow -100 -100 45,611 46,422 47,356 48,428 49,656 42,783 43,988 45,363
Total Income 0 0 68,173 68,173 68,173 68,173 68,173 68,173 68,173 68,173
Total Expense 100 100 22,561 21,750 20,817 19,745 18,517 25,389 24,184 22,809
Investment Cash Flow -36,711 -143,764 0 0 0 0 0 0 0 0
EPC Cost -31,257 -125,028 0 0 0 0 0 0 0 0
Interests During Construction (Senior) -1,344 -13,436 0 0 0 0 0 0 0 0
Interests During Construction (Mezzanine) -2,799 -2,799 0 0 0 0 0 0 0 0
Others -1,311 -2,500 0 0 0 0 0 0 0 0
Financing Cash Flow 85,843 95,332 -8,688 -9,798 -11,046 -13,684 -15,111 -16,733 -11,155 -38,975
Loan (Senior) 11,197 100,772 -8,985 -10,095 -11,343 -12,745 -14,320 -16,090 -18,079 -20,313
Loan (Mezzanine) 18,661 0 0 0 0 0 0 0 0 -18,661
DSRA 0 -5,440 297 297 297 -940 -791 -643 6,924 0
Equity 55,984 0 0 0 0 0 0 0 0 0
Decidend payments 0 0 0 0 0 0 0 0 0 0
Increace (Decrease) in Cash & Cash related 49,032 -48,532 36,923 36,624 36,310 34,743 34,545 26,051 32,834 6,389
Beginning Cash & Cash related 0 49,032 500 37,423 74,047 110,357 145,100 179,645 205,696 238,529
Ending Cash & Cash related 49,032 500 37,423 74,047 110,357 145,100 179,645 205,696 238,529 244,918
Source: Created by the Survey Commission
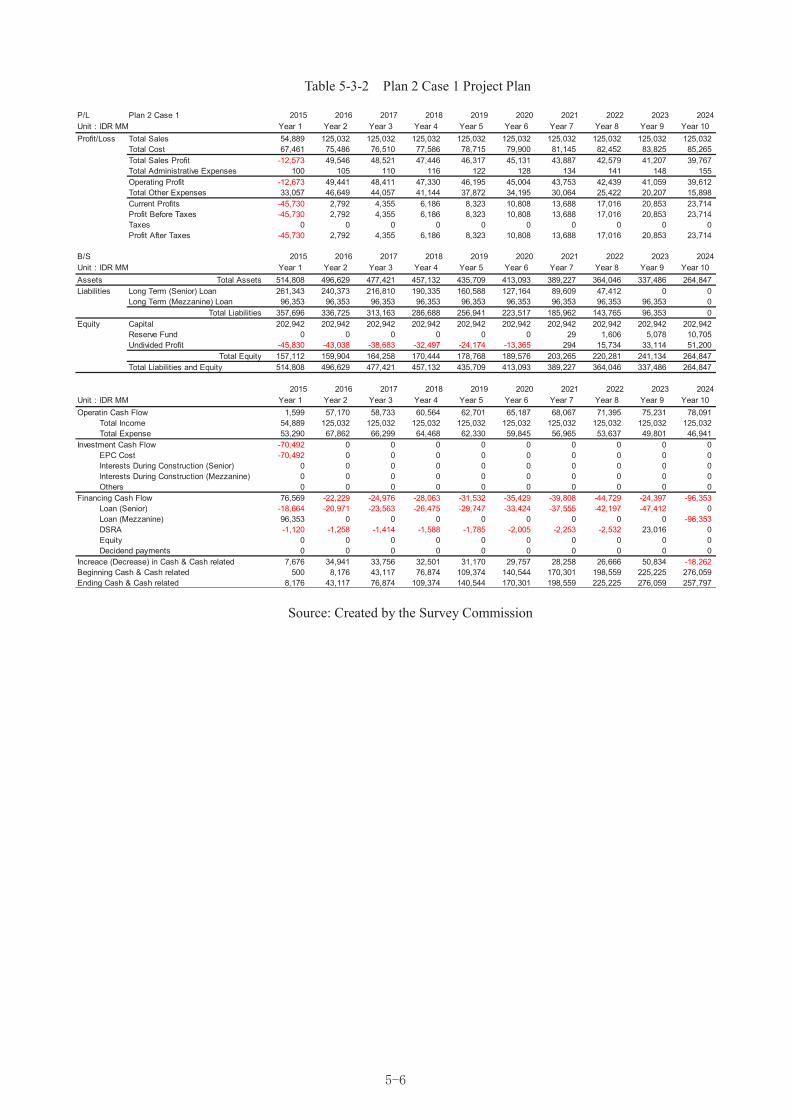
5-6
Table 5-3-2 Plan 2 Case 1 Project Plan
P/L Plan 2 Case 1 2015 2016 2017 2018 2019 2020 2021 2022 2023 2024
Unit:IDR MM Year 1 Year 2 Year 3 Year 4 Year 5 Year 6 Year 7 Year 8 Year 9 Year 10
Profit/Loss Total Sales 54,889 125,032 125,032 125,032 125,032 125,032 125,032 125,032 125,032 125,032
Total Cost 67,461 75,486 76,510 77,586 78,715 79,900 81,145 82,452 83,825 85,265
Total Sales Profit -12,573 49,546 48,521 47,446 46,317 45,131 43,887 42,579 41,207 39,767
Total Administrative Expenses 100 105 110 116 122 128 134 141 148 155
Operating Profit -12,673 49,441 48,411 47,330 46,195 45,004 43,753 42,439 41,059 39,612
Total Other Expenses 33,057 46,649 44,057 41,144 37,872 34,195 30,064 25,422 20,207 15,898
Current Profits -45,730 2,792 4,355 6,186 8,323 10,808 13,688 17,016 20,853 23,714
Profit Before Taxes -45,730 2,792 4,355 6,186 8,323 10,808 13,688 17,016 20,853 23,714
Taxes 0 0 0 0 0 0 0 0 0 0
Profit After Taxes -45,730 2,792 4,355 6,186 8,323 10,808 13,688 17,016 20,853 23,714
B/S 2015 2016 2017 2018 2019 2020 2021 2022 2023 2024
Unit:IDR MM Year 1 Year 2 Year 3 Year 4 Year 5 Year 6 Year 7 Year 8 Year 9 Year 10
Assets Total Assets 514,808 496,629 477,421 457,132 435,709 413,093 389,227 364,046 337,486 264,847
Liabilities Long Term (Senior) Loan 261,343 240,373 216,810 190,335 160,588 127,164 89,609 47,412 0 0
Long Term (Mezzanine) Loan 96,353 96,353 96,353 96,353 96,353 96,353 96,353 96,353 96,353 0
Total Liabilities 357,696 336,725 313,163 286,688 256,941 223,517 185,962 143,765 96,353 0
Equity Capital 202,942 202,942 202,942 202,942 202,942 202,942 202,942 202,942 202,942 202,942
Reserve Fund 0 0 0 0 0 0 29 1,606 5,078 10,705
Undivided Profit -45,830 -43,038 -38,683 -32,497 -24,174 -13,365 294 15,734 33,114 51,200
Total Equity 157,112 159,904 164,258 170,444 178,768 189,576 203,265 220,281 241,134 264,847
Total Liabilities and Equity 514,808 496,629 477,421 457,132 435,709 413,093 389,227 364,046 337,486 264,847
2015 2016 2017 2018 2019 2020 2021 2022 2023 2024
Unit:IDR MM Year 1 Year 2 Year 3 Year 4 Year 5 Year 6 Year 7 Year 8 Year 9 Year 10
Operatin Cash Flow 1,599 57,170 58,733 60,564 62,701 65,187 68,067 71,395 75,231 78,091
Total Income 54,889 125,032 125,032 125,032 125,032 125,032 125,032 125,032 125,032 125,032
Total Expense 53,290 67,862 66,299 64,468 62,330 59,845 56,965 53,637 49,801 46,941
Investment Cash Flow -70,492 0 0 0 0 0 0 0 0 0
EPC Cost -70,492 0 0 0 0 0 0 0 0 0
Interests During Construction (Senior) 0 0 0 0 0 0 0 0 0 0
Interests During Construction (Mezzanine) 0 0 0 0 0 0 0 0 0 0
Others 0 0 0 0 0 0 0 0 0 0
Financing Cash Flow 76,569 -22,229 -24,976 -28,063 -31,532 -35,429 -39,808 -44,729 -24,397 -96,353
Loan (Senior) -18,664 -20,971 -23,563 -26,475 -29,747 -33,424 -37,555 -42,197 -47,412 0
Loan (Mezzanine) 96,353 0 0 0 0 0 0 0 0 -96,353
DSRA -1,120 -1,258 -1,414 -1,588 -1,785 -2,005 -2,253 -2,532 23,016 0
Equity 0 0 0 0 0 0 0 0 0 0
Decidend payments 0 0 0 0 0 0 0 0 0 0
Increace (Decrease) in Cash & Cash related 7,676 34,941 33,756 32,501 31,170 29,757 28,258 26,666 50,834 -18,262
Beginning Cash & Cash related 500 8,176 43,117 76,874 109,374 140,544 170,301 198,559 225,225 276,059
Ending Cash & Cash related 8,176 43,117 76,874 109,374 140,544 170,301 198,559 225,225 276,059 257,797
Source: Created by the Survey Commission
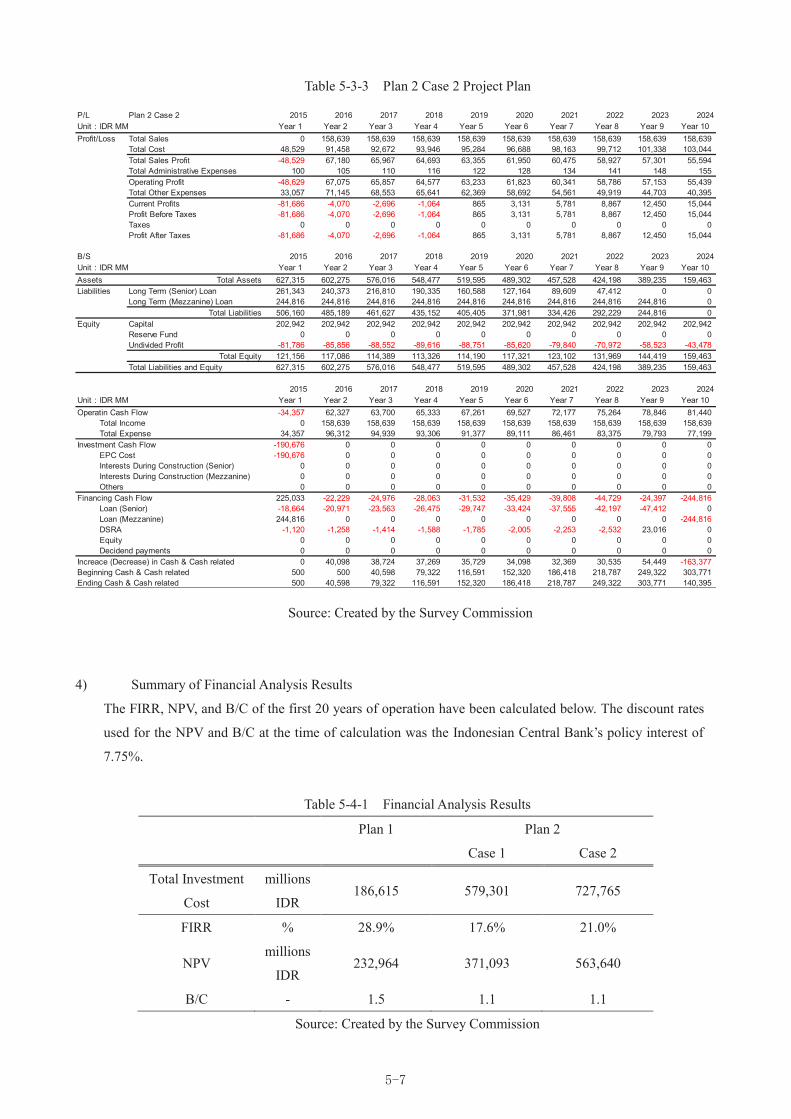
5-7
Table 5-3-3 Plan 2 Case 2 Project Plan
P/L Plan 2 Case 2 2015 2016 2017 2018 2019 2020 2021 2022 2023 2024
Unit:IDR MM Year 1 Year 2 Year 3 Year 4 Year 5 Year 6 Year 7 Year 8 Year 9 Year 10
Profit/Loss Total Sales 0 158,639 158,639 158,639 158,639 158,639 158,639 158,639 158,639 158,639
Total Cost 48,529 91,458 92,672 93,946 95,284 96,688 98,163 99,712 101,338 103,044
Total Sales Profit -48,529 67,180 65,967 64,693 63,355 61,950 60,475 58,927 57,301 55,594
Total Administrative Expenses 100 105 110 116 122 128 134 141 148 155
Operating Profit -48,629 67,075 65,857 64,577 63,233 61,823 60,341 58,786 57,153 55,439
Total Other Expenses 33,057 71,145 68,553 65,641 62,369 58,692 54,561 49,919 44,703 40,395
Current Profits -81,686 -4,070 -2,696 -1,064 865 3,131 5,781 8,867 12,450 15,044
Profit Before Taxes -81,686 -4,070 -2,696 -1,064 865 3,131 5,781 8,867 12,450 15,044
Taxes 0 0 0 0 0 0 0 0 0 0
Profit After Taxes -81,686 -4,070 -2,696 -1,064 865 3,131 5,781 8,867 12,450 15,044
B/S 2015 2016 2017 2018 2019 2020 2021 2022 2023 2024
Unit:IDR MM Year 1 Year 2 Year 3 Year 4 Year 5 Year 6 Year 7 Year 8 Year 9 Year 10
Assets Total Assets 627,315 602,275 576,016 548,477 519,595 489,302 457,528 424,198 389,235 159,463
Liabilities Long Term (Senior) Loan 261,343 240,373 216,810 190,335 160,588 127,164 89,609 47,412 0 0
Long Term (Mezzanine) Loan 244,816 244,816 244,816 244,816 244,816 244,816 244,816 244,816 244,816 0
Total Liabilities 506,160 485,189 461,627 435,152 405,405 371,981 334,426 292,229 244,816 0
Equity Capital 202,942 202,942 202,942 202,942 202,942 202,942 202,942 202,942 202,942 202,942
Reserve Fund 0 0 0 0 0 0 0 0 0 0
Undivided Profit -81,786 -85,856 -88,552 -89,616 -88,751 -85,620 -79,840 -70,972 -58,523 -43,478
Total Equity 121,156 117,086 114,389 113,326 114,190 117,321 123,102 131,969 144,419 159,463
Total Liabilities and Equity 627,315 602,275 576,016 548,477 519,595 489,302 457,528 424,198 389,235 159,463
2015 2016 2017 2018 2019 2020 2021 2022 2023 2024
Unit:IDR MM Year 1 Year 2 Year 3 Year 4 Year 5 Year 6 Year 7 Year 8 Year 9 Year 10
Operatin Cash Flow -34,357 62,327 63,700 65,333 67,261 69,527 72,177 75,264 78,846 81,440
Total Income 0 158,639 158,639 158,639 158,639 158,639 158,639 158,639 158,639 158,639
Total Expense 34,357 96,312 94,939 93,306 91,377 89,111 86,461 83,375 79,793 77,199
Investment Cash Flow -190,676 0 0 0 0 0 0 0 0 0
EPC Cost -190,676 0 0 0 0 0 0 0 0 0
Interests During Construction (Senior) 0 0 0 0 0 0 0 0 0 0
Interests During Construction (Mezzanine) 0 0 0 0 0 0 0 0 0 0
Others 0 0 0 0 0 0 0 0 0 0
Financing Cash Flow 225,033 -22,229 -24,976 -28,063 -31,532 -35,429 -39,808 -44,729 -24,397 -244,816
Loan (Senior) -18,664 -20,971 -23,563 -26,475 -29,747 -33,424 -37,555 -42,197 -47,412 0
Loan (Mezzanine) 244,816 0 0 0 0 0 0 0 0 -244,816
DSRA -1,120 -1,258 -1,414 -1,588 -1,785 -2,005 -2,253 -2,532 23,016 0
Equity 0 0 0 0 0 0 0 0 0 0
Decidend payments 0 0 0 0 0 0 0 0 0 0
Increace (Decrease) in Cash & Cash related 0 40,098 38,724 37,269 35,729 34,098 32,369 30,535 54,449 -163,377
Beginning Cash & Cash related 500 500 40,598 79,322 116,591 152,320 186,418 218,787 249,322 303,771
Ending Cash & Cash related 500 40,598 79,322 116,591 152,320 186,418 218,787 249,322 303,771 140,395
Source: Created by the Survey Commission
4) Summary of Financial Analysis Results
The FIRR, NPV, and B/C of the first 20 years of operation have been calculated below. The discount rates
used for the NPV and B/C at the time of calculation was the Indonesian Central Bank’s policy interest of
7.75%.
Table 5-4-1 Financial Analysis Results
Plan 1 Plan 2
Case 1 Case 2
Total Investment
Cost
millions
IDR 186,615 579,301 727,765
FIRR % 28.9% 17.6% 21.0%
NPV millions
IDR 232,964 371,093 563,640
B/C - 1.5 1.1 1.1
Source: Created by the Survey Commission
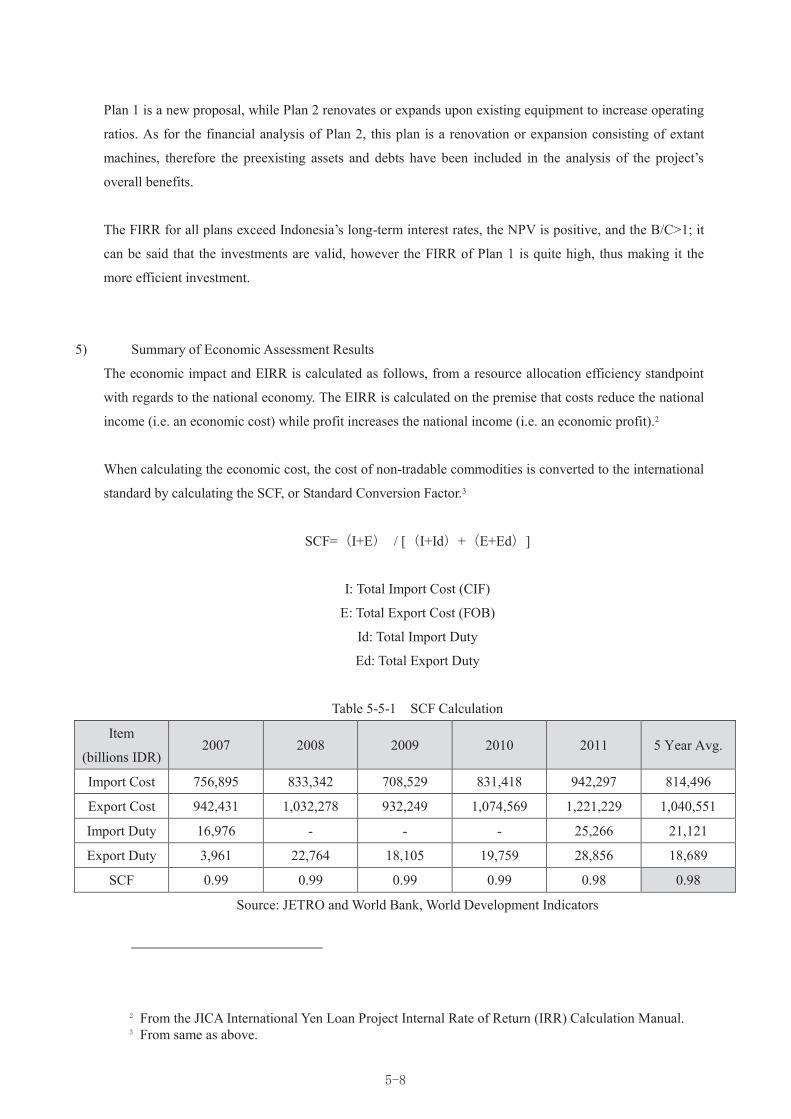
5-8
Plan 1 is a new proposal, while Plan 2 renovates or expands upon existing equipment to increase operating
ratios. As for the financial analysis of Plan 2, this plan is a renovation or expansion consisting of extant
machines, therefore the preexisting assets and debts have been included in the analysis of the project’s
overall benefits.
The FIRR for all plans exceed Indonesia’s long-term interest rates, the NPV is positive, and the B/C>1; it
can be said that the investments are valid, however the FIRR of Plan 1 is quite high, thus making it the
more efficient investment.
5) Summary of Economic Assessment Results
The economic impact and EIRR is calculated as follows, from a resource allocation efficiency standpoint
with regards to the national economy. The EIRR is calculated on the premise that costs reduce the national
income (i.e. an economic cost) while profit increases the national income (i.e. an economic profit).2
When calculating the economic cost, the cost of non-tradable commodities is converted to the international
standard by calculating the SCF, or Standard Conversion Factor.3
SCF=(I+E) / [(I+Id)+(E+Ed)]
I: Total Import Cost (CIF)
E: Total Export Cost (FOB)
Id: Total Import Duty
Ed: Total Export Duty
Table 5-5-1 SCF Calculation
Item
(billions IDR) 2007 2008 2009 2010 2011 5 Year Avg.
Import Cost 756,895 833,342 708,529 831,418 942,297 814,496
Export Cost 942,431 1,032,278 932,249 1,074,569 1,221,229 1,040,551
Import Duty 16,976 - - - 25,266 21,121
Export Duty 3,961 22,764 18,105 19,759 28,856 18,689
SCF 0.99 0.99 0.99 0.99 0.98 0.98
Source: JETRO and World Bank, World Development Indicators
2 From the JICA International Yen Loan Project Internal Rate of Return (IRR) Calculation Manual. 3 From same as above.

5-9
When calculating the total economic cost, civil engineering and electric supply construction costs are
considered domestic, while turbine equipment and other costs are considered foreign. Further, looking at
society at large, interest and taxes do not count as a consumption of resources, and have been excluded
from the economic cost calculations.
Table 5-5-2 Economic Cost Calculation
Plan 1 Plan 2
(millions
IDR) Case 1 Case 2
Domestic Costs Construction (Civil
Engineering) 62,293 64,084 95,400
Construction (Power
Supply) 15,400 0 15,400
Total 77,693 64,084 110,800
SFC 0.98 0.98 0.98
Economic Cost (1) 76,061 62,738 108,472
Foreign Costs Construction (Generator) 64,384 0 62,542
Other (Legal Fees, etc.) 1,200 1,200 1,200
Economic Cost (2) 65,584 1,200 63,742
Total Economic
Cost 141,645 63,938 172,214
Source: Created by the Survey Commission
The Economic Benefit calculation—a basic component of the benefits—is the value of the retrenched
replacement costs of the project (replacement cost reduction value).4 According to those on the project,
since diesel engines are being used to generate electricity in the area, the difference in the 20-year unit
price of electricity between this diesel and this project—to which the FIT applies—is calculated as the
replacement cost reduction value, and therefore the economic benefit. The unit price for diesel generation
is 3,286 IDR/kWh.5
The following cash flow table was made using this economic cost and benefit data. Maintenance costs
have been derived using similar projects as a reference. As price increases are not costs related to the
consumption of resources, they have not been included.
4 From the JICA International Yen Loan Project Internal Rate of Return (IRR) Calculation Manual. 5 PLN Statistics 2013

5-10
Table 5-5-3 Cash Flow for Economic Analysis (Plan 1)
Plan 1
(millions IDR) Economic CostOperation andMaintenance
Total CostSubstitute
Generation CostMini HydroPower Cost
Economic Benefit Net Benefit
1 29,289 29,289 -29,289
2 112,356 112,356 -112,356
3 5,277 5,277 189,362 68,173 121,190 115,913
4 5,277 5,277 189,362 68,173 121,190 115,913
5 5,277 5,277 189,362 68,173 121,190 115,913
6 5,277 5,277 189,362 68,173 121,190 115,913
7 5,277 5,277 189,362 68,173 121,190 115,913
8 5,277 5,277 189,362 68,173 121,190 115,913
9 5,277 5,277 189,362 68,173 121,190 115,913
10 5,277 5,277 189,362 68,173 121,190 115,913
11 5,277 5,277 189,362 47,542 141,820 136,543
12 5,277 5,277 189,362 47,542 141,820 136,543
13 5,277 5,277 189,362 47,542 141,820 136,543
14 5,277 5,277 189,362 47,542 141,820 136,543
15 5,277 5,277 189,362 47,542 141,820 136,543
16 5,277 5,277 189,362 47,542 141,820 136,543
17 5,277 5,277 189,362 47,542 141,820 136,543
18 5,277 5,277 189,362 47,542 141,820 136,543
19 5,277 5,277 189,362 47,542 141,820 136,543
20 5,277 5,277 189,362 47,542 141,820 136,543
Total 141,645 94,980 236,625 3,408,522 1,020,805 2,387,717 2,151,092
EIRR 71%
Source: Created by the Survey Commission
Table 5-5-4 Cash Flow for Economic Analysis (Plan 2 Case 1)
Plan 2 Case 1
(millions IDR) Economic CostOperation andMaintenance
Total CostSubstitute
Generation CostMini HydroPower Cost
Economic Benefit Net Benefit
1 63,938 1,804 65,742 19,272 5,149 14,123 -51,619
2 1,804 1,804 38,544 11,730 26,814 25,010
3 1,804 1,804 38,544 11,730 26,814 25,010
4 1,804 1,804 38,544 11,730 26,814 25,010
5 1,804 1,804 38,544 11,730 26,814 25,010
6 1,804 1,804 38,544 11,730 26,814 25,010
7 1,804 1,804 38,544 11,730 26,814 25,010
8 1,804 1,804 38,544 11,730 26,814 25,010
9 1,804 1,804 38,544 11,730 26,814 25,010
10 1,804 1,804 38,544 11,730 26,814 25,010
11 1,804 1,804 38,544 11,730 26,814 25,010
12 1,804 1,804 38,544 11,730 26,814 25,010
13 1,804 1,804 38,544 11,730 26,814 25,010
14 1,804 1,804 38,544 11,730 26,814 25,010
15 1,804 1,804 38,544 11,730 26,814 25,010
16 1,804 1,804 38,544 11,730 26,814 25,010
17 1,804 1,804 38,544 11,730 26,814 25,010
18 1,804 1,804 38,544 11,730 26,814 25,010
19 1,804 1,804 38,544 11,730 26,814 25,010
20 1,804 1,804 38,544 11,730 26,814 25,010
Total 63,938 36,086 100,023 751,604 228,014 523,590 423,567
EIRR 48%
Source: Created by the Survey Commission

5-11
Table 5-5-5 Cash Flow for Economic Analysis (Plan 2 Case 2)
Plan 2 Case 2
(millions IDR) Economic CostOperation andMaintenance
Total CostSubstitute
Generation CostMini HydroPower Cost
Economic Benefit Net Benefit
1 172,214 172,214 -172,214
2 0 6,575 6,575 148,976 45,337 103,639 97,065
3 0 6,575 6,575 148,976 45,337 103,639 97,065
4 0 6,575 6,575 148,976 45,337 103,639 97,065
5 0 6,575 6,575 148,976 45,337 103,639 97,065
6 0 6,575 6,575 148,976 45,337 103,639 97,065
7 0 6,575 6,575 148,976 45,337 103,639 97,065
8 0 6,575 6,575 148,976 45,337 103,639 97,065
9 0 6,575 6,575 148,976 45,337 103,639 97,065
10 0 6,575 6,575 148,976 45,337 103,639 97,065
11 0 6,575 6,575 148,976 45,337 103,639 97,065
12 0 6,575 6,575 148,976 45,337 103,639 97,065
13 0 6,575 6,575 148,976 45,337 103,639 97,065
14 0 6,575 6,575 148,976 45,337 103,639 97,065
15 0 6,575 6,575 148,976 45,337 103,639 97,065
16 0 6,575 6,575 148,976 45,337 103,639 97,065
17 0 6,575 6,575 148,976 45,337 103,639 97,065
18 0 6,575 6,575 148,976 45,337 103,639 97,065
19 0 6,575 6,575 148,976 45,337 103,639 97,065
20 0 6,575 6,575 148,976 45,337 103,639 97,065
Total 172,214 124,922 297,135 2,830,545 861,395 1,969,150 1,672,015
EIRR 56%
Source: Created by the Survey Commission
As all the above plans exceed the general social discount rate of 12% by a large margin, we have
determined that there is sufficient value in following through on this project. Just as the financial analysis
suggests, the EIRR of Plan 1 is the highest, and represents the most efficient investment of the three plans.


Chapter 6 Planned Project Schedule

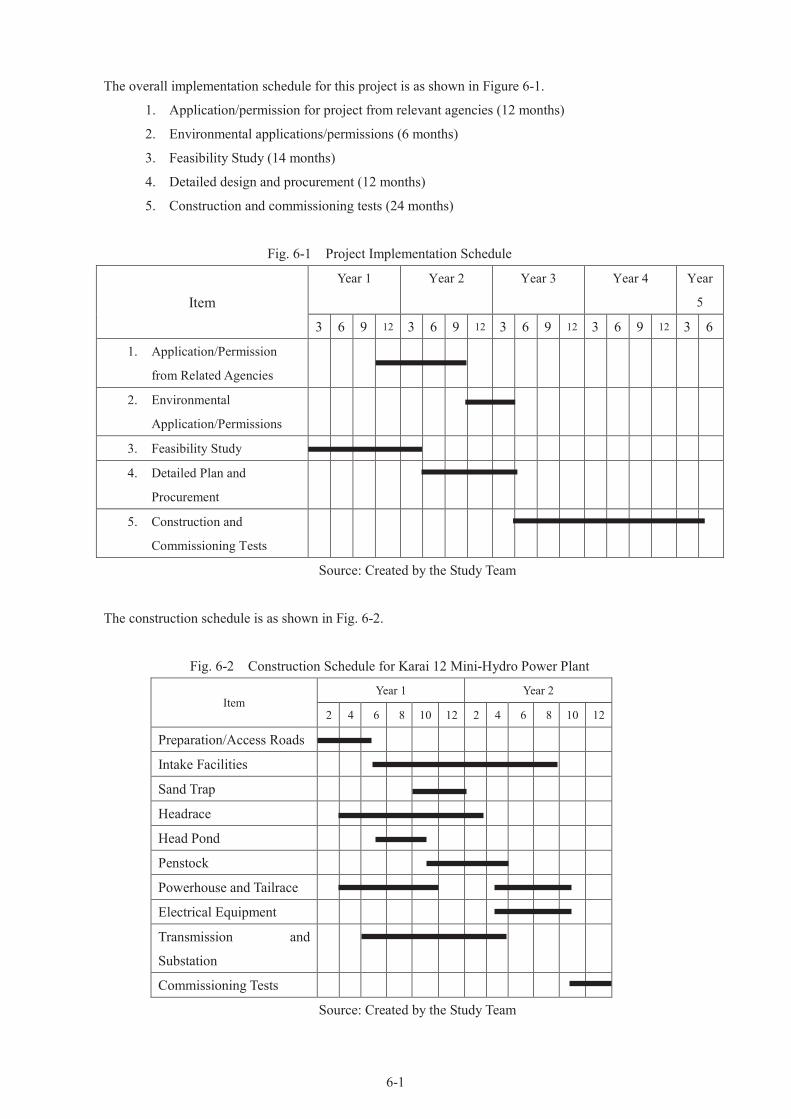
6-1
The overall implementation schedule for this project is as shown in Figure 6-1.
1. Application/permission for project from relevant agencies (12 months)
2. Environmental applications/permissions (6 months)
3. Feasibility Study (14 months)
4. Detailed design and procurement (12 months)
5. Construction and commissioning tests (24 months)
Fig. 6-1 Project Implementation Schedule
Item
Year 1 Year 2 Year 3 Year 4 Year
5
3 6 9 12 3 6 9 12 3 6 9 12 3 6 9 12 3 6
1. Application/Permission
from Related Agencies
2. Environmental
Application/Permissions
3. Feasibility Study
4. Detailed Plan and
Procurement
5. Construction and
Commissioning Tests
Source: Created by the Study Team
The construction schedule is as shown in Fig. 6-2.
Fig. 6-2 Construction Schedule for Karai 12 Mini-Hydro Power Plant
Item Year 1 Year 2
2 4 6 8 10 12 2 4 6 8 10 12
Preparation/Access Roads
Intake Facilities
Sand Trap
Headrace
Head Pond
Penstock
Powerhouse and Tailrace
Electrical Equipment
Transmission and
Substation
Commissioning Tests
Source: Created by the Study Team


Chapter 7 Implementing Organization


7-1
The host country’s implementing organization of this survey, Bumi Investco Energi (BIE) is engaged not
only in the mini-hydro power project mentioned in this report, but also in the development and operation
of Silau 2 (9MW, operating since 2011), Karai 13 (7.6MW, operating since March 2014) and Karai 7
(6.8MW, under construction, expected to be completed December 2014) mini-hydro power projects in the
nearby area. Further, its subsidiary company, Bumi Hidro Engineering Construction (BHE) specializes in
the construction of mini-hydro power plants, building a value chain of the mini-hydro power generation
business. BIE has made a large commitment to mini-hydro power projects in Indonesia, and actively
endorses this survey while maintaining close relationships with the local governments which issue relevant
permissions.
However, in the technical fields such as planning and design, design and construction supervision, and
O&M management, there are some cases that the power plants experience the decrease of availability
factor due to the lack of accumulation of know-how. These are the fields where Japanese companies have
predominant expertise, and BIE expects to leverage the technique and know-how that Japanese
organizations bring to the planning projects in order to increase power generation as the result of increased
reliability and fewer cases of equipment breakdowns.
For this project, the duties and authorities of the relevant agencies of the host country have been organized
into Table 7-1. Each agency has the ability to fully perform all assigned tasks.
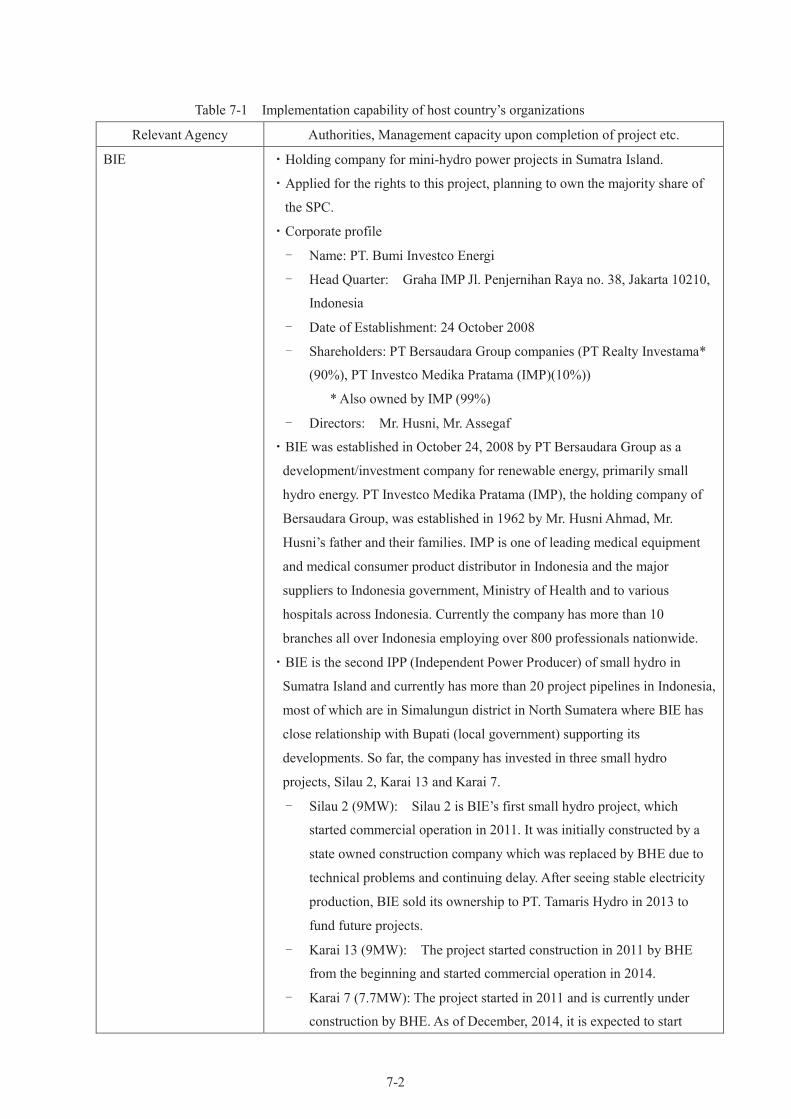
7-2
Table 7-1 Implementation capability of host country’s organizations
Relevant Agency Authorities, Management capacity upon completion of project etc.
BIE ・Holding company for mini-hydro power projects in Sumatra Island.
・Applied for the rights to this project, planning to own the majority share of
the SPC.
・Corporate profile
- Name: PT. Bumi Investco Energi
- Head Quarter: Graha IMP Jl. Penjernihan Raya no. 38, Jakarta 10210,
Indonesia
- Date of Establishment: 24 October 2008
- Shareholders: PT Bersaudara Group companies (PT Realty Investama*
(90%), PT Investco Medika Pratama (IMP)(10%))
* Also owned by IMP (99%)
- Directors: Mr. Husni, Mr. Assegaf
・BIE was established in October 24, 2008 by PT Bersaudara Group as a
development/investment company for renewable energy, primarily small
hydro energy. PT Investco Medika Pratama (IMP), the holding company of
Bersaudara Group, was established in 1962 by Mr. Husni Ahmad, Mr.
Husni’s father and their families. IMP is one of leading medical equipment
and medical consumer product distributor in Indonesia and the major
suppliers to Indonesia government, Ministry of Health and to various
hospitals across Indonesia. Currently the company has more than 10
branches all over Indonesia employing over 800 professionals nationwide.
・BIE is the second IPP (Independent Power Producer) of small hydro in
Sumatra Island and currently has more than 20 project pipelines in Indonesia,
most of which are in Simalungun district in North Sumatera where BIE has
close relationship with Bupati (local government) supporting its
developments. So far, the company has invested in three small hydro
projects, Silau 2, Karai 13 and Karai 7.
- Silau 2 (9MW): Silau 2 is BIE’s first small hydro project, which
started commercial operation in 2011. It was initially constructed by a
state owned construction company which was replaced by BHE due to
technical problems and continuing delay. After seeing stable electricity
production, BIE sold its ownership to PT. Tamaris Hydro in 2013 to
fund future projects.
- Karai 13 (9MW): The project started construction in 2011 by BHE
from the beginning and started commercial operation in 2014.
- Karai 7 (7.7MW): The project started in 2011 and is currently under
construction by BHE. As of December, 2014, it is expected to start
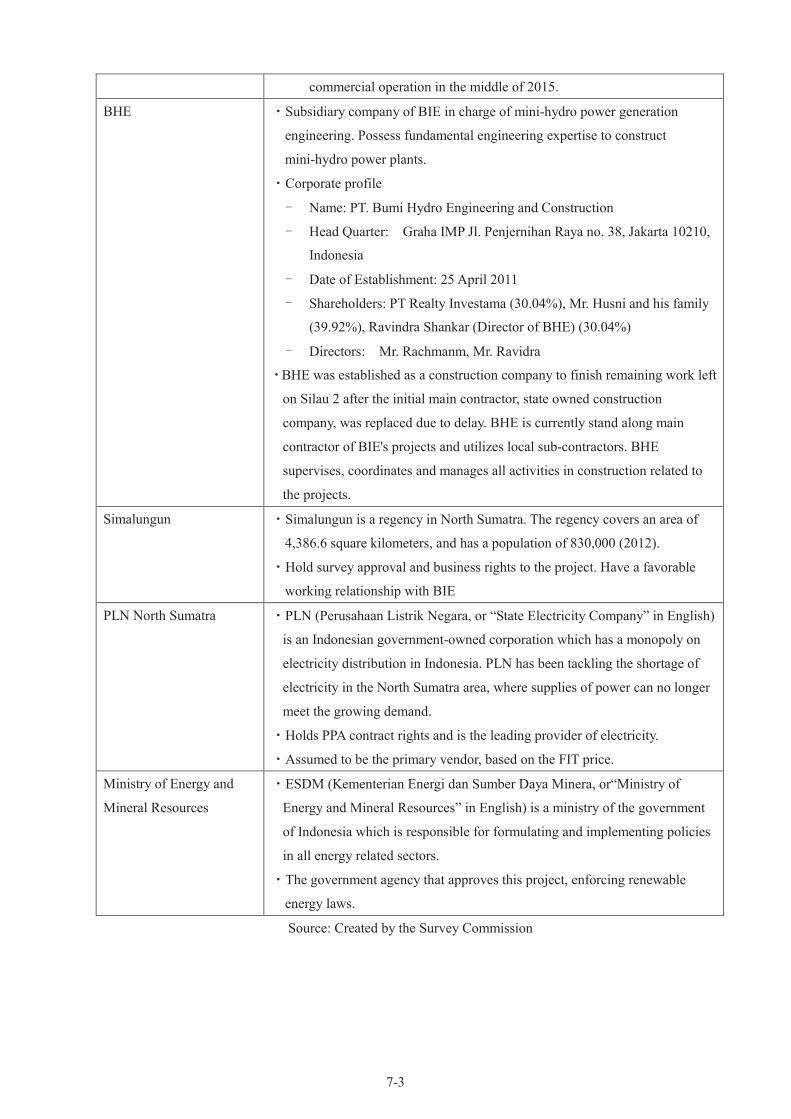
7-3
commercial operation in the middle of 2015.
BHE ・Subsidiary company of BIE in charge of mini-hydro power generation
engineering. Possess fundamental engineering expertise to construct
mini-hydro power plants.
・Corporate profile
- Name: PT. Bumi Hydro Engineering and Construction
- Head Quarter: Graha IMP Jl. Penjernihan Raya no. 38, Jakarta 10210,
Indonesia
- Date of Establishment: 25 April 2011
- Shareholders: PT Realty Investama (30.04%), Mr. Husni and his family
(39.92%), Ravindra Shankar (Director of BHE) (30.04%)
- Directors: Mr. Rachmanm, Mr. Ravidra
・BHE was established as a construction company to finish remaining work left
on Silau 2 after the initial main contractor, state owned construction
company, was replaced due to delay. BHE is currently stand along main
contractor of BIE's projects and utilizes local sub-contractors. BHE
supervises, coordinates and manages all activities in construction related to
the projects.
Simalungun ・Simalungun is a regency in North Sumatra. The regency covers an area of
4,386.6 square kilometers, and has a population of 830,000 (2012).
・Hold survey approval and business rights to the project. Have a favorable
working relationship with BIE
PLN North Sumatra ・PLN (Perusahaan Listrik Negara, or “State Electricity Company” in English)
is an Indonesian government-owned corporation which has a monopoly on
electricity distribution in Indonesia. PLN has been tackling the shortage of
electricity in the North Sumatra area, where supplies of power can no longer
meet the growing demand.
・Holds PPA contract rights and is the leading provider of electricity.
・Assumed to be the primary vendor, based on the FIT price.
Ministry of Energy and
Mineral Resources
・ESDM (Kementerian Energi dan Sumber Daya Minera, or“Ministry of
Energy and Mineral Resources” in English) is a ministry of the government
of Indonesia which is responsible for formulating and implementing policies
in all energy related sectors.
・The government agency that approves this project, enforcing renewable
energy laws.
Source: Created by the Survey Commission


Chapter 8 Technical Advantages Japanese Company

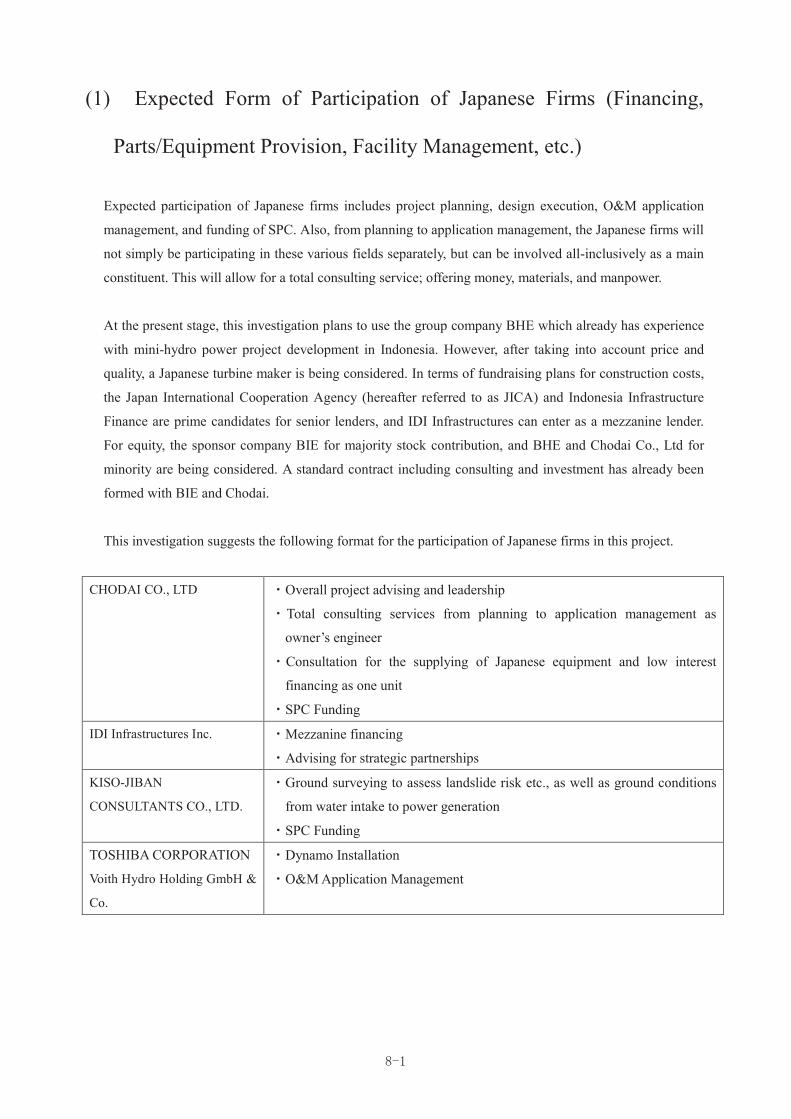
8-1
(1) Expected Form of Participation of Japanese Firms (Financing,
Parts/Equipment Provision, Facility Management, etc.)
Expected participation of Japanese firms includes project planning, design execution, O&M application
management, and funding of SPC. Also, from planning to application management, the Japanese firms will
not simply be participating in these various fields separately, but can be involved all-inclusively as a main
constituent. This will allow for a total consulting service; offering money, materials, and manpower.
At the present stage, this investigation plans to use the group company BHE which already has experience
with mini-hydro power project development in Indonesia. However, after taking into account price and
quality, a Japanese turbine maker is being considered. In terms of fundraising plans for construction costs,
the Japan International Cooperation Agency (hereafter referred to as JICA) and Indonesia Infrastructure
Finance are prime candidates for senior lenders, and IDI Infrastructures can enter as a mezzanine lender.
For equity, the sponsor company BIE for majority stock contribution, and BHE and Chodai Co., Ltd for
minority are being considered. A standard contract including consulting and investment has already been
formed with BIE and Chodai.
This investigation suggests the following format for the participation of Japanese firms in this project.
CHODAI CO., LTD ・Overall project advising and leadership
・Total consulting services from planning to application management as
owner’s engineer
・Consultation for the supplying of Japanese equipment and low interest
financing as one unit
・SPC Funding
IDI Infrastructures Inc. ・Mezzanine financing
・Advising for strategic partnerships
KISO-JIBAN
CONSULTANTS CO., LTD.
・Ground surveying to assess landslide risk etc., as well as ground conditions
from water intake to power generation
・SPC Funding
TOSHIBA CORPORATION
Voith Hydro Holding GmbH &
Co.
・Dynamo Installation
・O&M Application Management

8-2
(2) Advantages of Japanese Firms for this Project (Technological,
Economical)
The most important aspects when it comes to developing mini-hydro power projects is, from the initial
stages of planning, the rationality of the project site, safety, economy, efficiency, and management that can
create and implement the project with a big-picture view, and engineering ability to support it. This does
not come from just technical skill, but is a wisdom that comes experience and achievements gathered over
a long period of time, an intangible asset. When Japanese firms proactively participate in the project, the
high level of technical proficiency goes without saying, but are also backed up by more than 100 years of
carefully cultivated superior engineering skill in the field of hydroelectric power generation that deserves
special attention.
Besides these, it is highly likely that the participation of Japanese firms will participate in this project, and
will serve as a strong basis for convincing potential financers to invest.
Management
Ability
Ability to consider a problem from many angles, look at the big picture, and consider
issues with the project goal in mind
Japanese project management which can control manufacturing process, product
quality, and cost until project completion
Problem-solving
Ability
Ability to solve problem areas using new ideas and ingenuity
Ability to predict and avoid long term issues, not just problems at hand
Engineering
ability
Ability to design hydroelectric plans to increase output and yearly power generation
Use of cutting edge fluid dynamics for water turbine performance analysis to increase
turbine performance and power output
Technical
competitiveness
Designs, production, repair, and maintenance technological strength, wide scope for
choosing materials
O&M technological ability for increased reliability and lifespan
High Performance assessed by life cycle cost
Ability to create superior hydraulic plans to increase output and yearly power
generation with the same drainage systems
Superior schedule management of Japanese businesses for strict observance of
construction timeline and process
Know-how and for taking into account and prevention of sedimentation and water
damage based on area terrain and environmental factors (Ensuring long term safety)
Know-how for the removal of sand and grit in rivers with high quicksand content
Overseas order
history
Experience with investment and engineering for overseas mini-hydro power projects
Experience with supplying Japanese-made turbines for overseas mini-hydro power

8-3
projects
Funding ability Experience financing overseas mini-hydro power projects (Investment, Mezzanine
Financing)
Alliance building and consultation with JICA overseas investment program’s Jakarta
office concerning future financing prospects with this project
(3) Necessary Policies to Facilitate Successful Bid for Japanese Firms
In terms of the supply of equipment assets, it is difficult for Japanese firms to have competitive power
when it comes to the price of an individual machine. It is necessary to gain competitive advantage by
recommending Japanese firms from a life cycle cost perspective, such as product quality, reliability,
replacement part availability, and delivery speed, as well as the careful and comprehensive inspection,
repair, and leadership that comes with choosing a Japanese firm. In order to fully display the technological
advantages of Japanese firms, it is necessary to set up a system for smooth and easy financing negotiations
in Indonesia.
For the adoption of this project, the full commitment of Japanese enterprises, as well as building a
relationship of trust and mutual understanding with the relevant agencies in Indonesia as well. The main
proposal corporation, collaborative proposal corporation, and cooperative proposal corporations have been
working towards adoption in the following capacities:
・Chodai is committed to investment and engineering services for mini-hydro power projects in
Indonesia. Additionally, in October of 2013, it agreed upon a general contract for investment and
engineering services for this project.
・This was brought about when this project’s management from BIE and BHE management were
invited to Japan in October, 2013 when the “Training for the planning, designing, operation, and
maintenance for mini-hydro power projects in Indonesia” was adopted. It had been proposed as a
joint effort of Industrial Decisions and Toshiba stemming from the “2013 Business Infrastructure
Aid for Overseas Growth Training” enacted by The Overseas Human Resources and Industry
Development Association, which was entrusted to it by the Ministry of Economy.
・Japan’s extensive experience with hydroelectric systems, manufacturing processes for reliable
generators, and efficient operating procedures on site was introduced, and after recommending
the technological superiority of Japan throughout the life cycle, the above general contract was
agreed upon.
In the past, the Indonesian government has generally funded large-scale hydroelectric power
facilities through such methods as ODA. Now, with the demand for power in each region of
Indonesia continuing to increase, the government has adopted a new strategy. Taking into
account awareness of the environment and seeking to further promote electrification, the
energy market has been privatized, with the intent of expanding the construction and supply

8-4
of mini-hydro power plants.
Traditionally, large-scale hydroelectric power facilities funded through ODA comprised the majority, but
taking into account the increased power needs in rural Asia, as well as a focus on environmental
consciousness, the strategy has begun to change to one that increases the supply and construction of
mini-hydro power projects.
Recently, mini-hydro power projects are becoming more and more popular as an important actor on the
renewable energy stage. In many countries around the world, incentives to speed the development of
mini-hydro power projects such as the “Feed-in Tariff” (FIT) system are being introduced. Faced with this
state of events, Japanese firms are making the following considerations in regards to a likely increase in
orders.
・Japanese turbine generator makers see the global rise in need for mini-hydro power as a business
opportunity, and are focusing their attention on Asia’s markets, starting with Japan itself. By
using local subsidiaries in China and India but keeping to the Japanese standard in project
management, quality assurance, and product reliability, Japanese firms are creating a competitive
edge over foreign competition.
・Business partners Toshiba, and Voith Hydro already have systems in place for the supply and
development of machinery through local subsidiaries in China and India.
・Both companies intend to participate in this project through the fullest use of foreign subsidiaries,
and are assuming about 20% of the contract price from machinery exported from Japan. They
plan to increase group operations overall through coupling sales with foreign subsidiaries for the
remainder.

Chapter 9 Project Financing Prospects

9-1
(1) Funding Sources and Financing Plan
In the case that BIE adopts Plan 1, it plans to fund the total costs of the mini-hydro power project with
60% senior loans, 10% mezzanine financing, and 30% equity. In the case that Plan 2 is adopted, the current
plan is to fund additional construction fees through mezzanine financing. The amount of funding that the
senior lenders can offer is limited, so in order to secure adequate equity for this next project, BIE is
considering a mezzanine financing option.
1) Confirming the Amount of Debt Contributable by Senior Lenders
a) The financing stance of local Indonesian financial institutions regarding mini-hydro power projects
It is imperative to confirm the financing requirements to receive funding during the construction phase of a
mini-hydro power project in Indonesia for local, governmental, and foreign financial institutions. Even
though the introduction of FIT for energy sources like mini-hydro power that can function as a base load
energy source has caused a steady increase in the of usage of mini-hydro power facilities, financial
institutions with experience financing mini-hydro power projects are still few and far between. As a result,
most financial institutions utilize a corporate financing, relying on the credibility of the developer, or
individual guarantee and collateral when conducting funding operations. This is the current norm, and
project financing that creates security packages rating project risk with some construction risk is very rare.
However, since the revision of the FIT system in April of 2014, the increase in purchase price of
mini-hydro power has caused all players to begin to consider mini-hydro power as an attractive area.
Additionally, even in regards to financial institutions that are accepting of risks during the construction
period, many have in-house regulations that put an upper limit to the debt that they are allowed to provide.
In other words, even a reputable developer must provide a certain amount of equity. However, for an
developer that has several project pipelines in which to distribute limited assets, or for a small scale
developer that can’t provide the necessary amount, it is necessary to find mezzanine lenders, meaning
lenders that are subordinated to senior lenders. Also, considering the fact that many financial institutions
do not contribute funding for the interest that accrues during the construction period, it is necessary for the
sponsor to cover the difference with equity or funding from mezzanine lenders.
Senior lender candidates Syariah Mandiri and Bank Muamalat are financing Karai 13 and Karai 7, and
have indicated that they are open to financing continuing projects by BIE. Therefore, as soon as the other
materials are in place to make a financing decision, this project is planning to hold detailed conferences
with the above, including SMI and other financial institutions.
2) Feasibility of Assembling Mezzanine Lenders
Mezzanine Financing is a type of financing that has a mid-level priority. It is both subordinate to
repayment of senior loan, and prioritized over equity. It becomes necessary to assemble mezzanine lenders
when: (1) available equity is limited, and (2) senior lender funding is limited. If the sum of (1) and (2) is
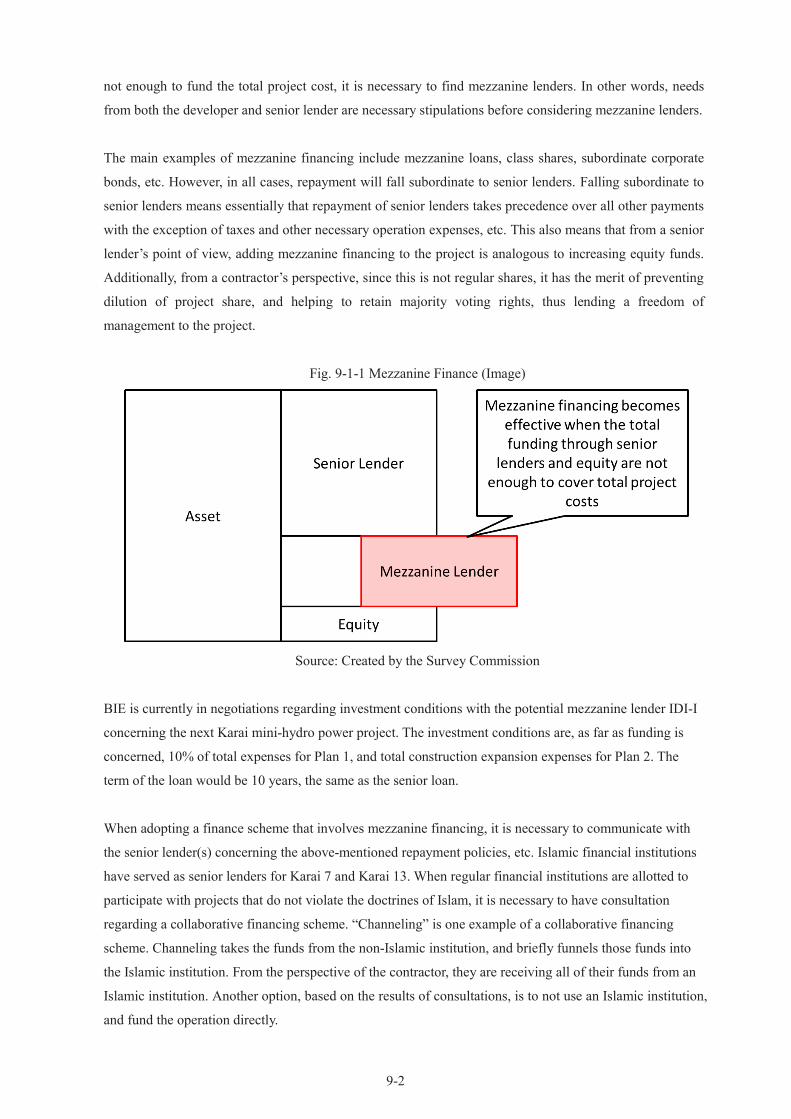
9-2
not enough to fund the total project cost, it is necessary to find mezzanine lenders. In other words, needs
from both the developer and senior lender are necessary stipulations before considering mezzanine lenders.
The main examples of mezzanine financing include mezzanine loans, class shares, subordinate corporate
bonds, etc. However, in all cases, repayment will fall subordinate to senior lenders. Falling subordinate to
senior lenders means essentially that repayment of senior lenders takes precedence over all other payments
with the exception of taxes and other necessary operation expenses, etc. This also means that from a senior
lender’s point of view, adding mezzanine financing to the project is analogous to increasing equity funds.
Additionally, from a contractor’s perspective, since this is not regular shares, it has the merit of preventing
dilution of project share, and helping to retain majority voting rights, thus lending a freedom of
management to the project.
Fig. 9-1-1 Mezzanine Finance (Image)
Source: Created by the Survey Commission
BIE is currently in negotiations regarding investment conditions with the potential mezzanine lender IDI-I
concerning the next Karai mini-hydro power project. The investment conditions are, as far as funding is
concerned, 10% of total expenses for Plan 1, and total construction expansion expenses for Plan 2. The
term of the loan would be 10 years, the same as the senior loan.
When adopting a finance scheme that involves mezzanine financing, it is necessary to communicate with
the senior lender(s) concerning the above-mentioned repayment policies, etc. Islamic financial institutions
have served as senior lenders for Karai 7 and Karai 13. When regular financial institutions are allotted to
participate with projects that do not violate the doctrines of Islam, it is necessary to have consultation
regarding a collaborative financing scheme. “Channeling” is one example of a collaborative financing
scheme. Channeling takes the funds from the non-Islamic institution, and briefly funnels those funds into
the Islamic institution. From the perspective of the contractor, they are receiving all of their funds from an
Islamic institution. Another option, based on the results of consultations, is to not use an Islamic institution,
and fund the operation directly.

9-3
(2) Feasibility of Funding
This project producing sufficient cash flow is prerequisite to the feasibility of funding coming from both
financing and investment. As Chapter 5 attests, looking at the financial and economic value that this
project possesses, there should be no issues in achieving sufficient funding.
Below is a layout of the feasibility of funding from both a financing and investment point of view.
1) Feasibility of Financing from Local Indonesian Banks
a) Conditions for financing from local financial institutions
For Plan 1, it will be necessary to hold a conference concerning senior lender and new conditions for
financing. Below are the main points to be confirmed during negotiations.
Table 9-2-1 Financing Conditions for Local Financial Institutions (Projected)
Contract Parties The lessor is the senior lender, and the lessee is the developer
Fund Amount It is necessary to confirm if the construction interest, which is the interest that
occurs during the construction period, contributes to the total financing
amount
60% of the total project cost, approximately 100 billion IDR, will be funded
through financing
Repayment Period In general, the construction period (projected 2 years) is the grace period, and
principal repayment starts after the first day of operation
The principal repayment period is projected to be 10 years, but it is necessary
to confirm if there is an appropriate repayment schedule for if the cash flow
goes in the red during that period.
Interest This depends on the credibility of the developer and project, so it is necessary
to confirm
In general this is a moving rate, and is usually the sum of the rate decided by
local financial institutions based on political policy(1 year period), as well as
a margin set by the local financial institution
Funding Period Usually this provided to the developer in steps as construction progresses, but
it is necessary to confirm the payment stipulations
Upfront Fees/Agent Fees Financial Institutions will require a fixed upfront fee and/or agent fee
depending on the amount of financing, so it is necessary to confirm this
Prepayment There can be penalties affiliated with repaying part or all of the money before
the set limit, so this is also necessary to confirm
Late/Damage Penalty In general, if there is a circumstance that stops or delays payment on interest
or principal, late and/or damage penalties may occur
Cash Waterfall Mechanism This project will employ a cash waterfall payment method. A repayment
priority order will be defined in advance, and a special account for this

9-4
project will be managed by Escrow Agent.
Generally accounts are comprised of a Project Account, Operations Account
(Tax and expenses payment), Senior Repayment Cumulative Account, Debt
Service Reserve Account, Mezzanine Repayment Allocation Account,
Sponsor Release Account, etc.
Covenants A usual covenant is separated into legal duties, and legally forbidden acts.
These are acts laid out in the contract that the developer either must conform
to, or is forbidden to do.
In general, a covenant of legal duties includes such items as the preservation
of all proper permissions and licenses, submission of inspected financial
statements, preservation of financial covenants such as the Debt Service
Coverage Ration, etc. It is necessary to confirm the details here.
Forfeit the Benefit of Time When in violation of one of the above covenants, the lender will immediately
request the payment of principal, interest, or settlement funds. However, there
is sometimes a grace period available, so it is necessary to confirm the details
Collateral Usually for mini-hydro power projects the senior lender reserves rights on all
land, facilities, and assets of the project as primary collateral.
Additionally, the private assets of the management of the primary governing
organization of the project may also be acquired as collateral.
Source: Created by the Survey Commission
In general, the senior lender will write a clause in the lending contract stipulating that financing will not
occur if conditions are not met by the financing deadline. In the case of mini-hydro power projects,
generally it is a condition entering related project contracts as land use contracts, EPC related contracts,
turbine purchasing contracts, PPA, and insurance contracts etc. must be signed before lending can begin.
2) Feasibility of Funding from Mezzanine Lenders
In Indonesia, price for construction contracts is not always a fixed lump-sum, and there is the risk of
increased project costs. Additionally, Indonesian local financial institutions mainly operate based off of a
movable interest rate, and there is the possibility that the developers may have to bear the cost of an
increase in the interest rate that occurs during the construction period. Because repayment to mezzanine
lenders is subordinate to repayment to senior lenders, mezzanine lenders must also face risks of cost and
interest rate increases, similar to developers. It is essential to show that the developers have will have the
assets necessary to cope appropriately if these risks were to become actualities in order to secure
mezzanine financing. When the developer itself lacks the assets to cope by themselves, a potential strategy
would be to find an investor that wants to work with mini-hydro power project. Regarding BIE and
mezzanine lender candidate IDI-I, strategies for when risks become actualized, including the one
mentioned above, are under consideration, and it will be necessary to confirm the details of these
negotiations from here on out.

9-5
(3) Cash Flow Analysis
As described in Chapter 5, the Karai mini-hydro power project has been proven to be possible as a stable
form of revenue by selling power. This was proven by the financing conditions based on the general
numbers and assumptions based on the current financing plan under consideration, as well as contractual
provisions and hearings, etc. On the other hand, as described above, there is the risk of increased project
costs due to jumps in the prices of materials, or an increase in interest rates. As for Indonesia’s FIT system,
the purchase of mini-hydro power will be reformed, and before the reform even developers that enter into a
PPA may be subject to price increases. Additionally, changes in energy production capacity caused by
increases or decreases in the water level can affect cash flow. Because of this, using the assumptions laid
out in Chapter 5 as base cases, we conducted sensitivity analyses for construction cost changes, interest
changes, FIT price changes, and power production capacity changes. Furthermore, even in the case of an
increase or decrease in total project cost, the financing ratio has been set so that senior loans will comprise
60%, mezzanine financing 10%, and equity 30%.
1) Sensitivity Analysis for Changes in Construction Costs
There is the possibility in Indonesia that construction costs may increase because of construction delays,
exchange rate changes, and price increases, etc. This FIRR analysis will investigate the case in which
construction costs increase by 10%, as well as a case where they increase by 20%. Additionally, in the case
of Plan 2, we only looked at the costs associated with renewal/expansion.
Table 9-3-1 FIRR Sensitivity Analysis of Construction Cost Changes
Plan 1 Plan 2
Case 1 Case 2
Construction
Cost Base Case
28.9% 17.6% 21.0%
10% increase 25.7% 17.5% 20.8%
20% increase 23.0% 17.4% 20.7%
Source: Created by the Survey Commission
Both cases have a more than high enough FIRR level to justify investment, so the impact of changes on the
project are trivial.
2) Sensitivity Analysis for Changes in Interest
In the base case, the senior lender interest rate is set at 12%, but a moving interest rate has been generally
adopted in Indonesia, and future political policies may cause great changes in the interest rate, both up and
down. In this FIRR analysis, we will investigate a case where the 12% standard deviates by -1% and +2%.

9-6
Table 9-3-2 FIRR Sensitivity Analysis of Interest Changes
Plan 1 Plan 2
Case 1 Case 2
Senior Interest -1%
29.2% 17.6% 21.0%
Base Case 28.9% 17.6% 21.0%
+1%
28.7% 17.6% 21.0%
+2%
28.5% 17.6% 21.0%
Source: Created by the Survey Commission
For Plan 1, the FIRR changed in relation to the changes in the interest rate, but since payment of interest is
not viewed as a cost in FIRR calculations, there was no effect on the FIRR of Plan 2. Both cases have a
more than high enough FIRR level to justify investment however, so the impact of changes on the project
are trivial.
3) Sensitivity Analysis of the FIT Price
The FIT price is fixed by a Feed-in-Tariff system, and has some political policy risk. The current political
policy is a pattern of reducing oil consumption, thus the FIT price for mini-hydro power is on the rise, but
this FIRR sensitivity analysis will investigate the case where the PPA price drops to 800 IDR/kWh, and the
case where it rises to 1,300 IDR/kWh.
Table 9-3-3 FIRR Sensitivity Analysis of FIT Price Changes
Plan 1 Plan 2
Case 1 Case 2
FIT Price 1,300 IDR/kWh 33.4% 25.1% 28.2%
Base Case 28.9% 17.6% 21.0%
800 IDR/kWh 18.3% 12.3% 15.4%
Source: Created by the Survey Commission
If the FIT price increases, the FIRR of all plans and cases will also increase, thereby increasing the value
of the investment. However, if the FIT price falls to 800 IDR/kWh, the FIRR for Plan 1 and Plan 2 Case 2
remain above the mezzanine finance interest rate of 15%, but Plan 2 Case 1 falls below that level, requiring
some consideration.
4) Sensitivity Analysis of Power Generation Capacity
The base case makes the assumption that over the course of one year 10% of the time the plant will not be
operating due to inspections, or plant shut down, etc., resulting in a facility usage rate of 90%. However, in
the case of breakdown or other issues, there is a risk of long term shutdown. In this FIRR analysis, we will
look at cases where the facility usage rate drops another 10% or 20%.

9-7
Table 9-3-4 FIRR Sensitivity Analysis of Power Generation Capacity Changes
Plan 1 Plan 2
Case 1 Case 2
Facility Usage
Rate Base Case
28.9% 17.6% 21.0%
10% decrease 24.9% 14.7% 18.0%
20% decrease 20.7% 11.5% 14.8%
Source: Created by the Survey Commission
It can be said that a fall in the facility usage rate has a large impact on the FIRR. In the case of Plan 1, even
if the facility usage rate falls 20% to 70%, it still retains an eligible FIRR level for investment, but in the
case of Plan 2, it sees a drop below the finance interest rate, requiring some consideration.

Chapter 10 Plan of Action and Issues to Consider
Moving Forward to Implementation


10-1
(1) Status of Work Moving Forward to Implementation of the Project
As the power shortage issue in North Sumatra becomes more and more serious, projects like mini-hydro
power which are able to provide competitive base load energy are highly desired by PLN and local
governments. Especially in surrounding local areas, as development by Palm Kernel Shell (PKS) related
firms in the special industrial park called Sei Mangkei is being planned, it becomes obvious and important to
solve the power shortage for continuous economic growing in the area. This project must confirm with
contractors and related agencies (1) the acquisition and renewal of necessary permits and licenses, (2)
detailed engineering/technical considerations, and (3) financing necessary funds for construction.
1) Acquisition and Renewal of Necessary Permits and Licenses
The general process for development of mini-hydro power projects in Indonesia is as follows. After the
developer selects potential sites, it is necessary to apply for permits with the provincial governor to conduct
field surveys. If the developer has not purchased the land of potential sites, it is necessary to apply for
business permits with the provincial governor to secure the lands for the usage of a mini-hydro power project.
As for environmental considerations, the Environmental Management Plan/Environmental Monitoring Plan
(UKL/UPL) must be submitted to the provincial governor. Once that has been completed, a Power Supply for
Public Use Business License (IUPTL) must be applied for with the Ministry of Energy and Mineral
Resources (MEMR), and a PPA must be enacted through discussions for technical/engineering approval of
the transmission system with PLN. Lastly, if the target location falls within the jurisdiction of the Ministry of
Forestry, an “Izin Penjam Pakan Kawasan Hutan” (IPPKH), a necessary permit for rental, must be acquired.
If this project goes ahead with the new construction plan (Karai 12), the permits that have already been
acquired are laid out in the table below. However, because the IUPTL, the contract for retail power, PPA, and
the IPPKH all will need to be renewed, continued cooperation with the related agencies will be necessary.
Table 10-1-1 Karai 12 Permit/License Acquisition (Survey Commission Confirmation Status)
Name Authority Outline Status
Survey Permit Provincial
Governor
A necessary permit to conduct preliminary
field surveys and detailed field surveys.
Acquired
(Already received)
Business Permit Provincial
Governor
Necessary permit for the right to engage in
business in the target location
Not yet Acquired
(Unnecessary
because of
possession of
IPPKH)
UKL/UPL Provincial
Governor
Plans for environmental management and
monitoring that must be approved for the
execution of the project
Currently being
acquired
IUPTL MEMR Permit for engaging in the distribution and
generation of power for the public good
Acquired
(Already received)
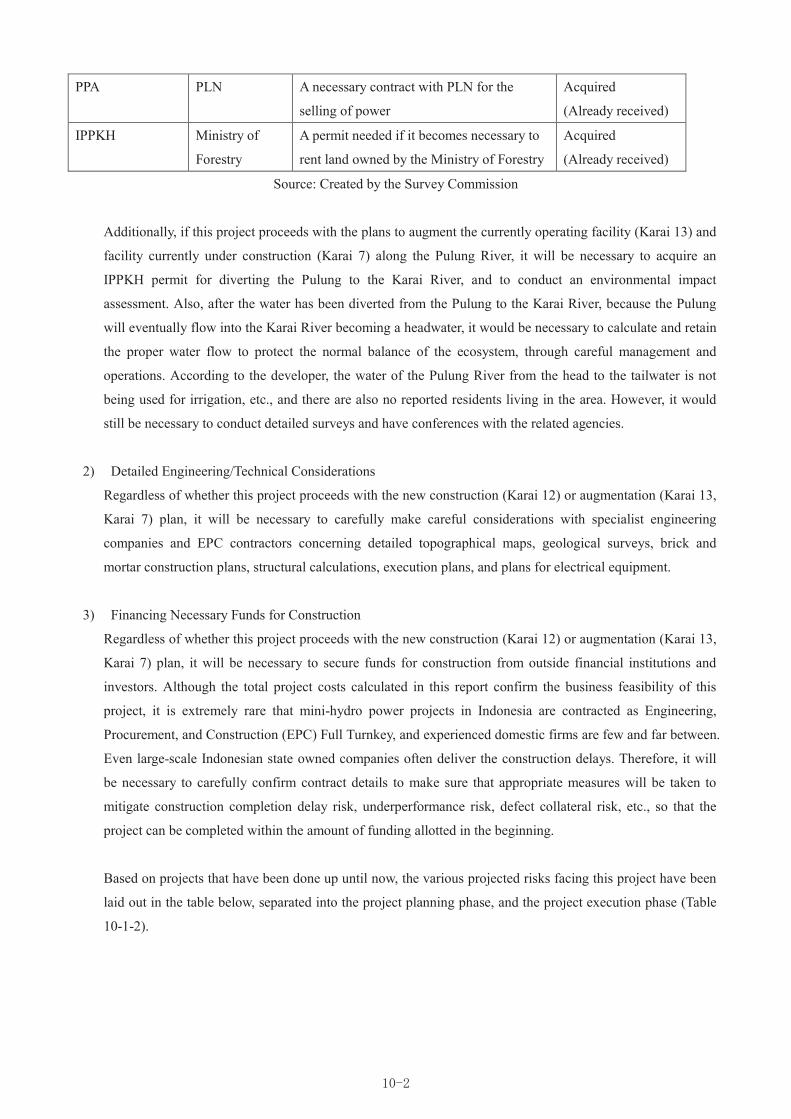
10-2
PPA PLN A necessary contract with PLN for the
selling of power
Acquired
(Already received)
IPPKH Ministry of
Forestry
A permit needed if it becomes necessary to
rent land owned by the Ministry of Forestry
Acquired
(Already received)
Source: Created by the Survey Commission
Additionally, if this project proceeds with the plans to augment the currently operating facility (Karai 13) and
facility currently under construction (Karai 7) along the Pulung River, it will be necessary to acquire an
IPPKH permit for diverting the Pulung to the Karai River, and to conduct an environmental impact
assessment. Also, after the water has been diverted from the Pulung to the Karai River, because the Pulung
will eventually flow into the Karai River becoming a headwater, it would be necessary to calculate and retain
the proper water flow to protect the normal balance of the ecosystem, through careful management and
operations. According to the developer, the water of the Pulung River from the head to the tailwater is not
being used for irrigation, etc., and there are also no reported residents living in the area. However, it would
still be necessary to conduct detailed surveys and have conferences with the related agencies.
2) Detailed Engineering/Technical Considerations
Regardless of whether this project proceeds with the new construction (Karai 12) or augmentation (Karai 13,
Karai 7) plan, it will be necessary to carefully make careful considerations with specialist engineering
companies and EPC contractors concerning detailed topographical maps, geological surveys, brick and
mortar construction plans, structural calculations, execution plans, and plans for electrical equipment.
3) Financing Necessary Funds for Construction
Regardless of whether this project proceeds with the new construction (Karai 12) or augmentation (Karai 13,
Karai 7) plan, it will be necessary to secure funds for construction from outside financial institutions and
investors. Although the total project costs calculated in this report confirm the business feasibility of this
project, it is extremely rare that mini-hydro power projects in Indonesia are contracted as Engineering,
Procurement, and Construction (EPC) Full Turnkey, and experienced domestic firms are few and far between.
Even large-scale Indonesian state owned companies often deliver the construction delays. Therefore, it will
be necessary to carefully confirm contract details to make sure that appropriate measures will be taken to
mitigate construction completion delay risk, underperformance risk, defect collateral risk, etc., so that the
project can be completed within the amount of funding allotted in the beginning.
Based on projects that have been done up until now, the various projected risks facing this project have been
laid out in the table below, separated into the project planning phase, and the project execution phase (Table
10-1-2).
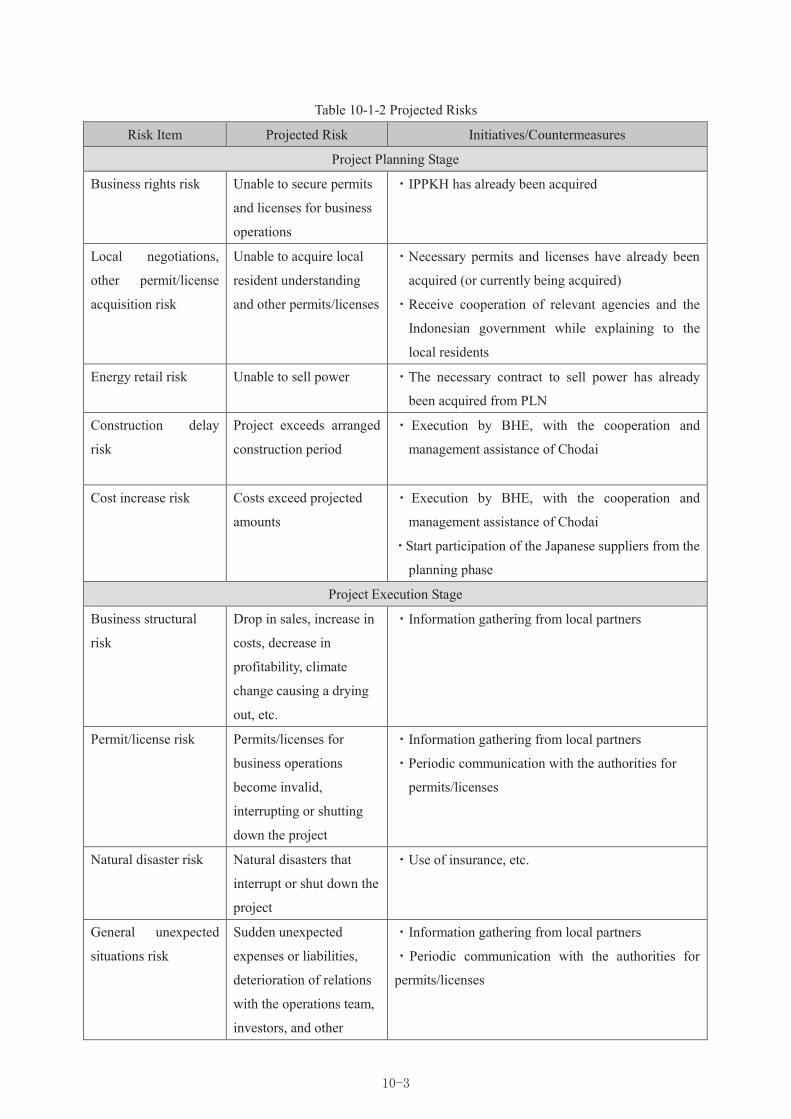
10-3
Table 10-1-2 Projected Risks
Risk Item Projected Risk Initiatives/Countermeasures
Project Planning Stage
Business rights risk
Unable to secure permits
and licenses for business
operations
・IPPKH has already been acquired
Local negotiations,
other permit/license
acquisition risk
Unable to acquire local
resident understanding
and other permits/licenses
・Necessary permits and licenses have already been
acquired (or currently being acquired)
・Receive cooperation of relevant agencies and the
Indonesian government while explaining to the
local residents
Energy retail risk
Unable to sell power
・The necessary contract to sell power has already
been acquired from PLN
Construction delay
risk
Project exceeds arranged
construction period
・ Execution by BHE, with the cooperation and
management assistance of Chodai
Cost increase risk Costs exceed projected
amounts
・ Execution by BHE, with the cooperation and
management assistance of Chodai
・Start participation of the Japanese suppliers from the
planning phase
Project Execution Stage
Business structural
risk
Drop in sales, increase in
costs, decrease in
profitability, climate
change causing a drying
out, etc.
・Information gathering from local partners
Permit/license risk
Permits/licenses for
business operations
become invalid,
interrupting or shutting
down the project
・Information gathering from local partners
・Periodic communication with the authorities for
permits/licenses
Natural disaster risk
Natural disasters that
interrupt or shut down the
project
・Use of insurance, etc.
General unexpected
situations risk
Sudden unexpected
expenses or liabilities,
deterioration of relations
with the operations team,
investors, and other
・Information gathering from local partners
・Periodic communication with the authorities for
permits/licenses

10-4
important related
corporate bodies, change
in laws and regulations,
etc.
Unexpected
international situation
risk
Economic crisis, political
crisis, etc.
・For government and policy change risks that are not
covered by general insurance, use of insurance
through the World Bank Group’s Multilateral
Investment Guarantee Agency (MIGA) is being
considered.
Source: Created by the Survey Commission
4) History of Formation of the Project and Future Intentions
a) History of Formation of the Project
IDI, a former industrial bank now working in the operation of funds and advisory business in
the environmental and renewable energy fields and who were involved as an investor candidate
in the FY 2012 Project Feasibility Study for Export Promotion of Infrastructure Systems
(Philippines Mini-hydro Power Project Study for the Wawa River in the Province of Agusan del
Sur), approached us in December 2012 concerning participation in mini-hydro power in
Indonesia.
The owner of the mini-hydro power proposal in question, BIE, were looking for an
international consulting firm who could invest in the project and participate in planning over
the long term. We determined that they met with our own development policy for mini-hydro
power projects, and in mid-April 2013 held talks with the owner company. This led to the
conclusion of a three party basic contract on October 30, 2013 with BIE and the construction
company that BIE established specifically for mini-hydro power projects, BHE, for the purposes
of implementing all forms of consulting, and including investment in the project.
b) On-site survey and future intentions
After the on-site survey was performed and report draft created for this project, in January
2015, we received the information that the turbine generation facilities at Karai 13 had
suffered a malfunction, and that power generation had stopped.
Our company had already conducted technical guidance with the help of specialists
dispatched by The Overseas Human Resources and Industry Development Association (HIDA),
and as technical guidance for the Karai 13 mini-hydro power plant we sent one of our own
electrical engineers to the site for one month, starting from January 13, who then investigated
the cause of the malfunction with the Karai 13 turbine generation facilities and conducted
technical guidance to the on-site technicians.
In regard to the new establishment of Karai 12 and the repair of the Karai 13

10-5
malfunction, it is the intent of the owner to cover the damages to Karai 13 using insurance. If
Karai 12 will be newly established, future funds will be focused into the construction of Karai
12, and in regard to Karai 13 that suffered the damage, the intent is to continue to generate
power under O&M of the current facilities with the support of our company.
In regard to the new establishment of Karai 12, and taking funds into account, we intend to
make internal adjustments that will allow work to begin as quickly as possible, as well as
continuing discussions with those involved in the project to proactively contribute to new
development proposals in the future. Furthermore, we are also intending to make use of the
Ministry of Economy, Trade and Industry’s Joint Crediting Mechanism (JCM) in order to help
those involved in the project begin work on implementing a FS and commercialization
proposal.
10-6
(2) Status of Work with Affiliated Government and Implementing
Agencies Moving Forward to Implementation of the Project
The energy shortage in North Sumatra is becoming a more and more urgent issue, and in the consultations
conducted with PLN and MEMR in October of 2014 also indicated, the target area has very high
expectations for the development of mini-hydro power projects. Not only from a power generation standpoint,
but also because this project is a step towards the spread of renewable energy, as well as to reduce the
dependence upon high-cost alternatives such as diesel power.
Currently, mini-hydro power projects under 10 MW are not required to negotiate a PPA price with PLN,
and the FIT system which allows for a long-term fixed selling price has been introduced by the Ministry of
Energy and Mineral Resources. FIT is a system laid out in the energy law of 2009 that applies to power
distribution by government-owned enterprises, public enterprises, private businesses, cooperatives, and
NGOs. The FIT price was reformed in May of 2014, and for mini-hydro power projects in the Sumatra
Islands, the selling price has risen from IDR787/kWh to IDR1,182.5/kWh (FIT Price term is from year 1 to
year 8 of operation). As for the application to currently existing mini-hydro power projects. MEMR and
PLN are still continuing their discussions. Although it is projected that the price will increase, how much
increase and the effective period still must be confirmed with the government and related agencies. Exactly
how the FIT price and period will apply to existing projects will have a big impact upon the business
feasibility of the various plans for this current project, and will greatly affect whether this project proceeds
with the new construction option (Karai 12) or the augmentation option (Karai 13, Karai 7).
Additionally, it is essential to understand the lending stance of local financial institutions toward mini-hydro
power projects. Although the introduction of the FIT system has seen an increase in the adoption of
mini-hydro power that can be used for base load energy, financial institutions that are readily willing to fund
mini-hydro power projects are still few and far between. There are number of mini-hydro power projects that
fall behind schedule, or exceed initial projected costs,; therefore many of financial institutions rely on a
corporate financing scheme, relying on the reputation of the developer, or personal guarantee and additional
collateral. In order to assess the risk and adopt a project finance system including a security package, it is
necessary for the funding financial institutions to receive the cooperation of technical consulting firms and
engineering firms, so that the institutions would be able to identify the foreseeable project risks. The
currently operating Karai 13 plant and the currently under construction Karai 7 plant are both making use of
Syariah financing through a corporate financing method. However, after conducting technical, social,
environmental, financial, and economic analyses, it appears to be possible to pursue a financing structure
similar to a non-recourse, project risk dependent style. Currently, this project has requested financing
consideration from the potential senior lenders and sharia financial institutions of Syariah Mandiri and
Muamalat banks. Also, this project is in conference with potential mezzanine lender IDI Infrastructures
concerning funding potential.

10-7
(3) Indonesia Legal and Financial Restrictions
At this point, it is thought that this project will not be subject to any Indonesian legal or financial restrictions.
However, the 2014 Presidential Provision No. 39 on April 23, 2014, “Provisions Concerning the List of
Closed Business Fields and Business Fields Open on Conditions for Investment,” has been announced,
reforming prohibited investments, regulated fields, and upper limits for proportion of foreign investment. The
field of this project is mini-hydro power projects (1-10MW), and previously the only condition for unlimited
foreign investment was that the enterprise was a “partnership.” However, with the new reformations, foreign
investment has been restricted to a 49% stock shareholding. At present, there is no restriction upon
mezzanine financing, but at the time of changing mezzanine loans into regular stocks, it is necessary to keep
the foreign investment proportion in mind. It will also be necessary to continue to watch the government
trends.
On the other hand, in terms of legal restrictions, since this project is a private enterprise mini-hydro power
facility and not receiving any funding from the Indonesian government, there should be no legal restrictions
to consider.

10-8
(4) Necessity for Additional Detailed Analyses
This investigation determined the business feasibility of the establishment of a new facility (Karai 12) as
compared to the installed capacity improvement of two other facilities (Karai 13, Karai 7) through the
application of technical, financial, and economical analyses. The results of these analyses indicated that the
Karai 12 plan is preferable. As laid out in Chapter 3, in order to proceed with the Karai 12 plan, enactment of
detailed technical plans and facility designs is necessary. At present, however, the project is not outfitted with
enough of these various documents and materials. Therefore, in order to continue advancing this project, it
will be necessary to pursue various detailed investigations. Also, this report has used information in which
many of them are still not yet fully fixed and still need to investigate accuracy of the data. During detailed
financing negotiations with various financial institutions, it will become necessary to revile definitive project
costs on a detailed engineering basis for each, as well as to justify the source of data and to make sure the
investment contributions from business partners.
1) River Flow Study
As there is no documentation of the actual river flow for the project area, theoretical flows will be created
using local observed rainfall data. As this data is essential for generation plans as well as equipment design, a
rainfall observation place (gauging station) will be installed near the planned site of the Karai 12 intake weir
during the initial stage of the next round of surveys, observations will be recorded, and a minimum of 1
years’ worth of river flow data will be collected. The details of the surveys are as follows: installment of a
gauging station, measurement of the river cross-section, measurement of rainfall (once a month),
measurement of water level (once a day), and creation of an H-Q curve.
2) Topographical Survey
The final layout of each piece of generation equipment must be scrutinized; a topographic map of 1m of the
entire contour line must be made, from the intake weir site to the power plant site. A detailed 1/200
topographic measurement of the area around each structure will be conducted. Further, along with
measurements of a cross-section of the river, the width of the river will be measured in 50m intervals for
drainage and flood calculation purposes. Details of the survey are as follows: establishment of reference
measurements (3 locations), topographical survey (total ground plan: scale 1/1,000, detailed structural
blueprints: scale 1/200), measurement of river cross section, measurement of river width (50m pitch).
3) Geological Survey
In order to understand the relevant terrain and geological characteristics around the various structures being
planned, field surveys from general to detailed are required. As far as specific survey contents go, the
following should be considered. (1)Make a general survey in a wide area around the project location, and
once the specifics have been narrowed down, take detailed measurements, and conduct detailed studies. (2)
Once a particular site has been narrowed down from the general field survey and plan outline, make a boring
survey to determine the ground conditions at the site. Conduct a Lugeon test using the boring hole. The

10-9
Lugeon test would be conducted with the aim of examining the groundwater characteristics beneath the
foundation, and the presence of leaks brought on by the intake weir, etc. (3) In order to evaluate the
applicability of shirasu concrete, collect shirasu samples and test for particle size, density, water absorption,
unit weight, and percentage of volume solids, etc. and evaluate its characteristics in concrete via more
comprehensive tests.
4) Basic Execution Plan Draft
In order to secure long term reliability of a power generation facility as beneficial social capital, it is
necessary to draft a plan taking into account materials quality, manufacturing process, and safety; specifically,
supply methods (introduction of Japanese machinery), schedule consideration, execution management
system, and safety countermeasures.
5) Environmental and Social Considerations
Survey results regarding the various species of amphibians, fish, water-dwelling insects, and river-based flora
etc. that subsist near the target rivers for this project, the Pulung and Karai rivers, is not available. Detailed
information regarding these plants and animals, as well as the impact of the project upon them, must be
gathered at the time of the UKL-UPL. Social and environmental impact considerations will only become more
and more important, and it is essential to gain the support of the local residents. It is especially important for the
private businesses engaged in the project undertaking to obtain local understanding and support.
6) Operation Scheme, Funding Method
As this project goes on to sign financing contracts with senior and mezzanine lenders, construction costs,
financial institution fees, management costs, etc. must be confirmed. If this project is able to be managed
according to the projections and assumptions of this investigation, it is expected to make stable income sales
that can be used to repay the debts to the senior and mezzanine lenders on timely manner.