Study on Housing Demand - Legislative Council of Hong Kong · Study on Housing Demand October 1996...
38
RP02/96-97 Study on Housing Demand October 1996 Prepared by Miss Eva LIU Mr Jackie WU Ms Vicky LEE Mr Joseph LEE Research and Library Services Division Legislative Council Secretariat 4th Floor, Central Government Offices (West Wing) 11 Ice House Street, Central, Hong Kong Telephone : (852) 2869 7735 Facsimile : (852) 2525 0990
Transcript of Study on Housing Demand - Legislative Council of Hong Kong · Study on Housing Demand October 1996...

RP02/96-97
Study on Housing Demand
October 1996
Prepared by
Miss Eva LIUMr Jackie WUMs Vicky LEE
Mr Joseph LEE
Research and Library Services DivisionLegislative Council Secretariat
4th Floor, Central Government Offices (West Wing)11 Ice House Street, Central, Hong Kong
Telephone : (852) 2869 7735Facsimile : (852) 2525 0990
C O N T E N T S
pageExecutive Summary
Part 1 - Introduction 1
Background 1Objective 1Methodology 1
Part 2 - Situation Analysis on Accommodation 2Number of Living Quarters 2Number of Persons Accommodated 2Production of Housing in Hong Kong 3
Part 3 - Demand For Housing 6Demand for Private Housing 6Demand for Public Housing 6
Public Rental Housing 6Public Housing in Home Ownership Scheme / Private Sector ParticipationScheme
9
Demand from Applicants on the Waiting List 11Demand from Redevelopment of Public Rental Estates 14Demand from Clearance of Temporary Housing Areas 15Demand from Residents in Squatters 17Demand from Residents in Cottage Areas 19Demand from Emergency/Natural Disasters and Compassionate Cases 20Allocation of Public Rental Housing 21
Part 4 - Factors Affecting Housing Demand 24Population Growth 24
Reasons for Increase in Population 24Other Factors Attributed to Population Growth 26
Other Housing Needs 28Single Elderly 28Street Sleepers 29Bedspace Apartments 29
Part 5 - Summary Table 30
Appendix 1 31
Appendix 2 32
Appendix 3 33
References 34

EXECUTIVE SUMMARY
1. Overall accommodation for Hong Kong people has improved significantly in thepast ten years. In 1995, 97% of total population lived in permanent housing, amongwhich public rental housing and Home Ownership Scheme/Private SectorParticipation Scheme residents accounting for 39% and 11% respectively.
2. Production of flats fluctuated drastically between 1986-1995. The highestproduction was recorded in 1989 and 1993, amounting to 95,790 and 92,630 unitsrespectively. However, the number dropped substantially to 56,000 units in 1994and further to 55,000 in 1995.
3. The proportion of private and public housing produced also varied in the past tenyears, ranging from 30:70 in 1993 to 61:39 in 1994.
4. Major sources of existing demand for public rental housing are PRH Waiting Listapplicants (148,600 households), public housing tenants affected by ComprehensiveRedevelopment Program (88,262 households), persons living in squatters (247,000persons), Temporary Housing Areas (53,077 persons) and Cottage Areas (9,000persons).
5. Between 1986-1995, the average PRH allocation to eligible applicants amounted to38,430 units per year, among which the Waiting List applicants were allocated thegreatest share (40% of total PRH flats). For applicants from CRP, annual allocationamounted to 30% whilst allocation to persons due to clearance, the proportionfluctuated between 15-25% during 1990-1995.
6. Future demand for housing is mainly stemmed from population growth. By 2011,total population in Hong Kong is estimated to be 8.1 million. Reasons attributed tothe immense growth are: more overseas Hong Kong residents returning to theterritory, the relaxation of immigrant quota for people living in China, increase incross-border marriages which lead to more family reunion of spouse and children,an increase in Nepalese applications as permanent residents.
7. There is also an immediate housing need arising from single elderly, street sleepersand tenants living in bedspace apartments, although the number concerned isrelatively small.

STUDY ON HOUSING DEMAND
PART 1 - INTRODUCTION
1. Background
1.1 In June 1996, the Housing Panel of the Legislative Council (LegCo) setup a Working Group on Long Term Housing Strategy Review (LTHSR)1 to monitor theformulation of the Long Term Housing Strategy (LTHS) for the next ten years. Toassist Members discussions, the Research and Library Services Division (RLS) of theLegCo Secretariat was asked to research on the overall housing needs in Hong Kong.
2. Objective
2.1 The objective of this paper is to list all the possible housing demand inHong Kong, in particular, the demand for public housing.
2.2 The scope of the study is to identify all the variables which may affectthe housing demand in the territory. This paper is divided into five parts. Part 1 is theintroduction. Part 2 presents the situation on accommodation in the past ten years. Part3 analyses the current demand for housing. Part 4 lists the factors which may attributeto the additional demand for housing in the territory in the future and Part 5 is asummary table outlined all the possible housing needs.
3. Methodology
3.1 To obtain the information for analysis, the researchers studied therelevant materials such as the government information papers, research reports ofvarious institutions, Hong Kong Hansard and LegCo Briefs. Meetings were organizedwith academics and Housing Branch (HB). Letter and faxes were also sent to enquireabout the necessary information and statistics from Housing Department (HD), HousingAuthority (HA), Immigration Department, Census and Statistics Department (C&SD),Planning Department, Rating & Valuation Department and Hong Kong Association ofPrivate Homes for the Elderly.
3.2 This research paper is based on the available information from thesesources.
1 In July 1996, the Working Group on LTHSR was named as Subcommittee on LTHSR.
Legislative Council Secretariat Study on Housing Demand
Research and Library Services Division page 2
PART 2 - SITUATION ANALYSIS ON ACCOMMODATION
4. Number of Living Quarters2
4.1 There are two types of living quarters in Hong Kong, namely thepermanent and temporary living quarters. The former refers to living quarters built ofpermanent or semi-permanent materials whereas the latter are built of temporarymaterials.
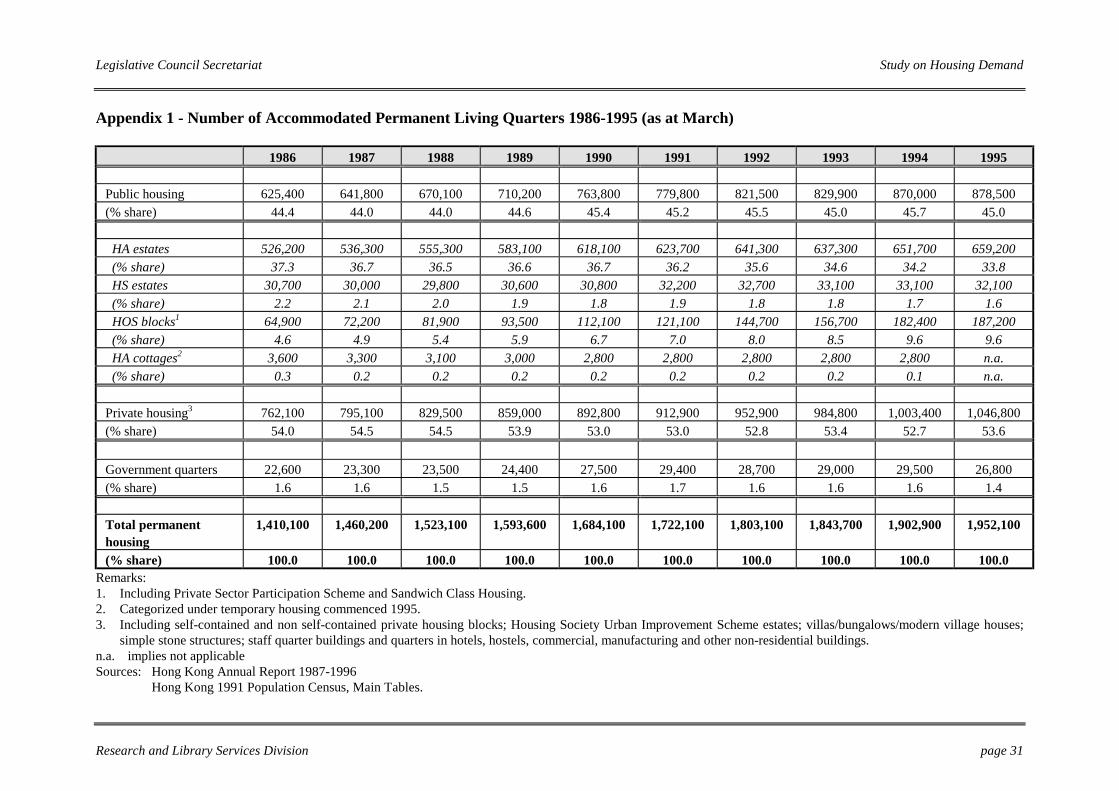
4.2 Appendix 1 shows the changes in the profile of different accommodatedpermanent living quarters in the past ten years. It can be noted that the total number ofpermanent living quarters increased by 38% from 1.4 million in 1986 to almost 2million in 1995. Public housing increased by 40% from 625,400 to 878,500 in thecorresponding period, accounting for 45% of total permanent housing; private housingalso exceeded the one million mark in 1994 and reached 1,046,800 in 1995.
4.3 There is no information on the number of existing units of temporaryhousing.
5. Number of Persons Accommodated
5.1 Appendix 2 shows that most people (97%) lived in permanent housingin 1995. Over 3 million people now live in public housing, representing 50% of totalpopulation, among which Home Ownership Scheme (HOS)/Private Sector ParticipationScheme (PSPS)3 residents had increased two fold from 221,500 in 1986 to 668,600 in1995, representing an increase from 4% to 11% of total population. Over 2.85 millionpeople (46%) lived in private housing and 58,400 (1%) stayed in government quarters.
5.2 Although there is no information on the profile of temporary livingquarters, they accommodated 3% of Hong Kong’s total population, as shown inAppendix 2. This represented 145,100 and 16,600 persons staying in temporaryhousing and remaining in boats respectively. Comparing with the situation in 1986when 400,000 people (7% of total population) were living in temporary housing and inthe boat, overall accommodation for Hong Kong people has improved significantly.
2 Living quarters refer to the quarters built for residential purposes irrespective of whether there is
anybody living there. It also includes quarters built for non-residential purposes which normally hasone or more persons living there or was occupied on the census reference night.
3 Including flats produced by Housing Society.

Legislative Council Secretariat Study on Housing Demand
Research and Library Services Division page 3
6. Production of Housing in Hong Kong
6.1 Table 1 shows the number of domestic units produced in 1986-1995. In1989, the number of units being produced reached the first peak at 95,790. It declineddrastically to 42,462 in 1992. The downward trend reversed in 1993 to reach anotherpeak of 92,603 units. However, production decreased substantially again in 1994 andfurther down to 54,774 units in 1995.
6.2 The number of private housing produced maintained at 31,000-33,000units in 1986-1990. It increased by almost 10,000 units in 1991, but droppedsubstantially by 15,000 units in both 1992 and 1993. In 1995, it further decreased to20,753 units.
6.3 Comparing to private housing, production of public housing also variedsignificantly in the corresponding period. It ranged from 16,779 units in 1992 to 65,749units in 1993. In 1995, the total number of public housing produced amounted to34,021 units.
Table 1 - Number of Domestic Units Produced 1986-1995
Public housingYear Private
housing Rental HOS/PSPS* TotalTotal
1986 33,013 28,432 6,480 34,912 67,925
1987 33,629 24,976 8,974 33,950 67,579
1988 30,122 31,701 8,802 40,503 70,625
1989 30,621 46,393 18,776 65,169 95,790
1990 31,483 32,885 17,518 50,403 81,886
1991 40,728 25,486 16,726 42,212 82,940
1992 25,683 11,039 5,740 16,779 42,462
1993 26,854 31,533 34,216 65,749 92,603
1994 34,350 17,098 4,594 21,692 56,042
1995 20,753 17,349 16,672 34,021 54,774
Remark: * including flats produced by Housing SocietySources : Hong Kong Monthly Digest of Statistics December 1989, December 1994, August 1996
Legislative Council Secretariat Study on Housing Demand
Research and Library Services Division page 4
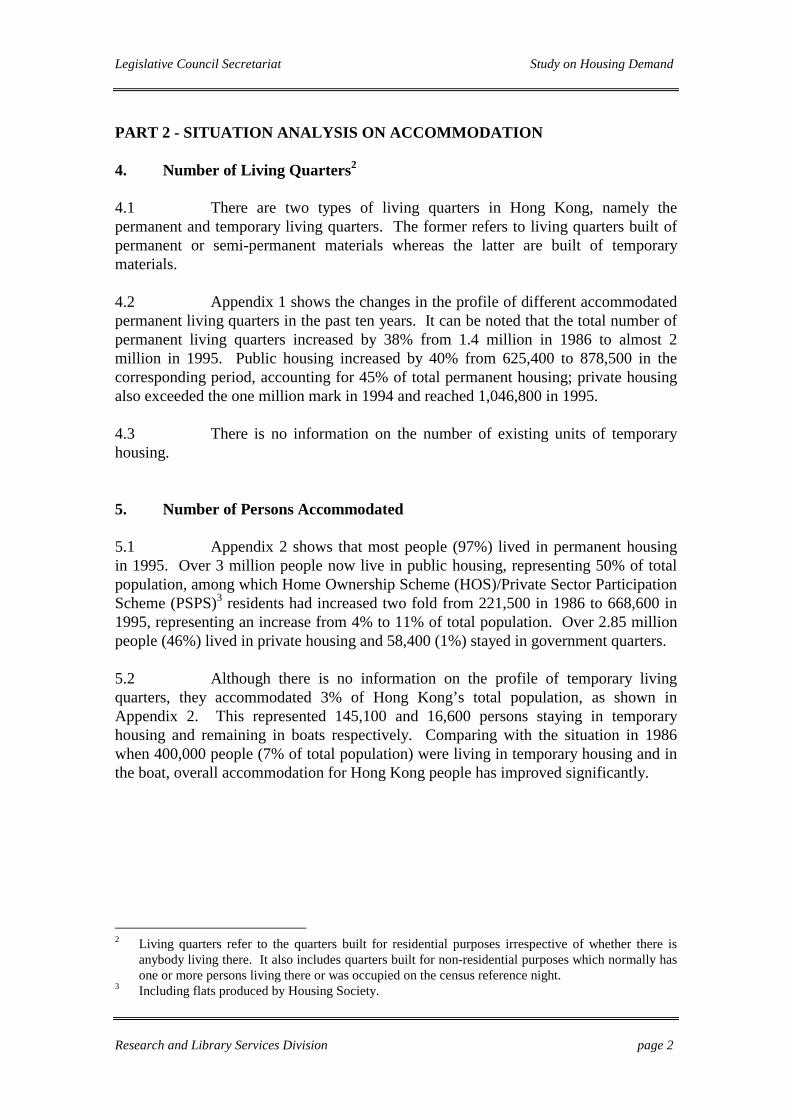
6.4 Figure 1 presents the proportion of private and public housing producedin the past ten years. The private to public housing ratio fluctuated drastically from30:70 in 1993 to 61:39 in 1994. However, the proportion of private housing produceddropped to 38% in 1995.
Figure 1 - Proportion of Domestic Units Produced 1986-1995
0%
10%
20%
30%
40%
50%
60%
70%
80%
90%
100%
1986 1987 1988 1989 1990 1991 1992 1993 1994 1995
Public housingPrivate housing
Sources : Hong Kong Monthly Digest of Statistics December 1989, December 1994, August 1996
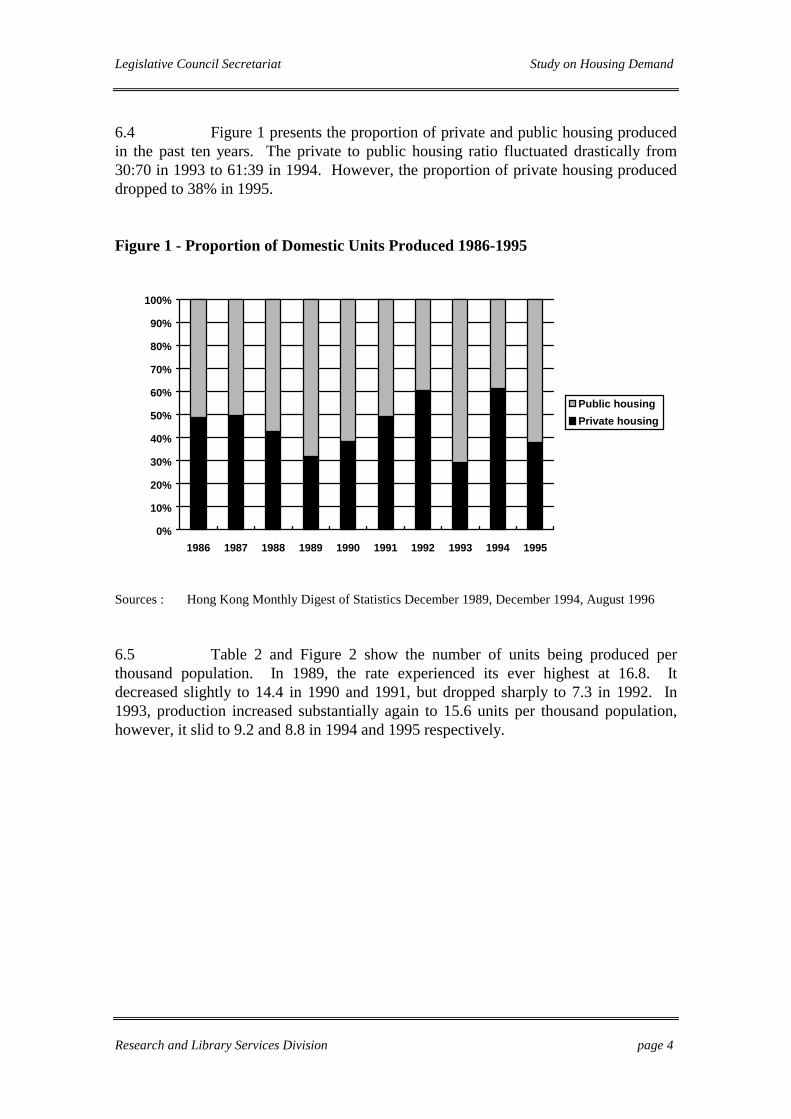
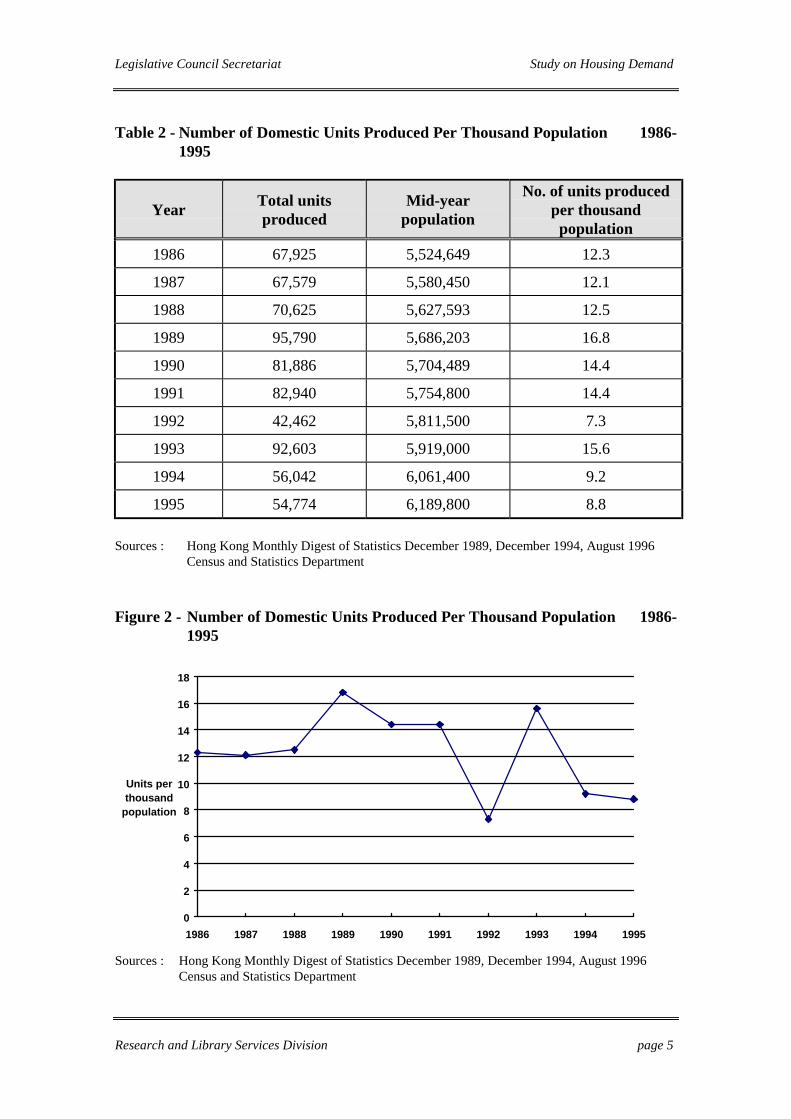
6.5 Table 2 and Figure 2 show the number of units being produced perthousand population. In 1989, the rate experienced its ever highest at 16.8. Itdecreased slightly to 14.4 in 1990 and 1991, but dropped sharply to 7.3 in 1992. In1993, production increased substantially again to 15.6 units per thousand population,however, it slid to 9.2 and 8.8 in 1994 and 1995 respectively.
Legislative Council Secretariat Study on Housing Demand
Research and Library Services Division page 5
Table 2 - Number of Domestic Units Produced Per Thousand Population 1986-1995
Year Total unitsproduced
Mid-yearpopulation
No. of units producedper thousand
population1986 67,925 5,524,649 12.3
1987 67,579 5,580,450 12.1
1988 70,625 5,627,593 12.5
1989 95,790 5,686,203 16.8
1990 81,886 5,704,489 14.4
1991 82,940 5,754,800 14.4
1992 42,462 5,811,500 7.3
1993 92,603 5,919,000 15.6
1994 56,042 6,061,400 9.2
1995 54,774 6,189,800 8.8
Sources : Hong Kong Monthly Digest of Statistics December 1989, December 1994, August 1996Census and Statistics Department
Figure 2 - Number of Domestic Units Produced Per Thousand Population 1986-1995
0
2
4
6
8
10
12
14
16
18
1986 1987 1988 1989 1990 1991 1992 1993 1994 1995
Units perthousand
population
Sources : Hong Kong Monthly Digest of Statistics December 1989, December 1994, August 1996Census and Statistics Department
Legislative Council Secretariat Study on Housing Demand
Research and Library Services Division page 6
PART 3 - DEMAND FOR HOUSING
7. Demand for Private Housing
7.1 The demand for private housing is determined by many variables. Theseinclude personal factors such as the affordability of a household to finance the 30% up-front mortgage payment and the monthly instalments of the property. As there is nostatistics on the number of households who wish to buy private property and havesufficient money to cover the down payment, the potential demand for private housingis unknown.
7.2 Some economic factors also attributed to the change in demand forprivate properties. Fluctuation in interest rate, rent, property price and the yield fromstock market, all affect the demand for private housing. As it is difficult to estimate towhat extent these variables may affect the private housing demand, this paper mainlyfocus on analyzing the demand for public housing.
8. Demand for Public Housing
8.1 Public housing can be categorized into Public Rental Housing (PRH)and HOS/PSPS. Paragraphs 8.2 to 8.10 below present the potential demand for publichousing in a broad sense and Paragraphs 8.11 to 8.30 analyze the actual demand forpublic housing.
Public Rental Housing
Eligibility for Public Rental Housing
8.2 Eligibility for PRH is bound by the income limits prescribed by HA.Table 3 lists the income limits for PRH applications and the median monthly householdincome in the first quarter of 1991 and 1996. This shows that less than 50% ofhouseholds in the various income brackets were eligible for public rental housing onfinancial grounds above.

Legislative Council Secretariat Study on Housing Demand
Research and Library Services Division page 7
Table 3 - Income Limits for PRH Applications and Median Monthly HouseholdIncome by Household Size 1991, 1996
Householdsize
(no. ofpersons)
Max. incomelimit effective1 April 1991
(HK$)
Median monthlyhousehold
income 1Q 1991(HK$)
Max. incomelimit effective1 April 1996
(HK$)
Median monthlyhousehold
income 1Q 1996(HK$)
1 3,200 5,000 6,000 8,500
2 5,100 9,500 9,900 16,000
3 6,800 10,800 12,000 18,000
4 7,900 11,000 14,700 19,800
5 8,800 14,000 15,900 23,000
6 9,800 15,500 18,100 27,000
7 10,600 19,000 19,800 30,500
8 11,600 20,700 22,400 34,600
9 12,400 n.a. 24,000 n.a.
10 or more 13,100 n.a. 25,800 n.a.
Remark: n.a. implies not availableSources: Hong Kong Housing Authority Annual Report 1990/91
Housing BranchCensus and Statistics Department
8.3 In addition to the financial requirements, the applicants and their familymembers must have resided in Hong Kong for at least seven years, and must not haveowned any private domestic property within two years preceding the application. Thesecriteria further limit the potential demand for PRH. If any of these criteria were to bechanged, the potential demand for PRH would change immediately.
Potential Demand for Public Rental Housing
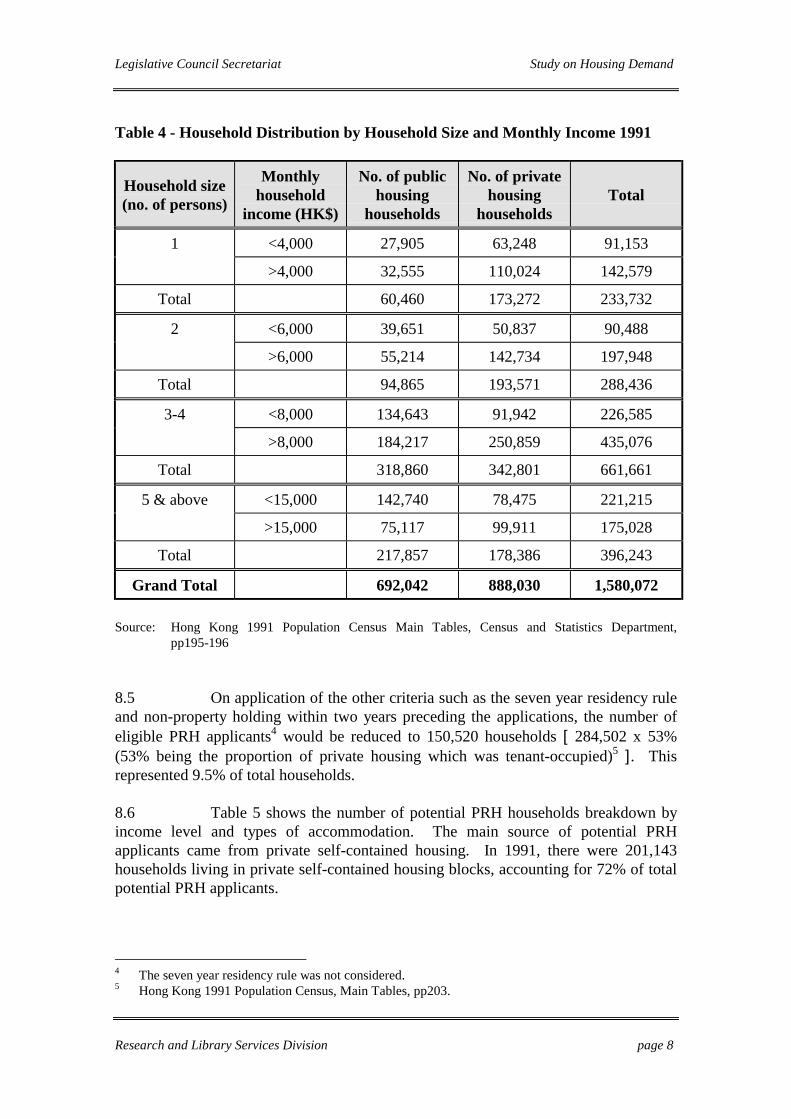
8.4 As information on the 1996 By-Census is not yet available, noestimation can be made on the number of potential PRH applicants for 1996. For easyreference, the 1991 Census is being taken as a proxy to estimate the number of familieswhich were eligible for applying PRH in that year. According to the 1991 PopulationCensus, there were a total of 1,580,072 households living in different types of livingquarters, among which 284,502 families (63,248+50,837+91,942+78,475) received amonthly income which fell within the PRH prescribed income limit (Table 4),accounting for 18% of total number of households in Hong Kong.
Legislative Council Secretariat Study on Housing Demand
Research and Library Services Division page 8
Table 4 - Household Distribution by Household Size and Monthly Income 1991
Household size(no. of persons)
Monthlyhousehold
income (HK$)
No. of publichousing
households
No. of privatehousing
householdsTotal
1 <4,000 27,905 63,248 91,153
>4,000 32,555 110,024 142,579
Total 60,460 173,272 233,732
2 <6,000 39,651 50,837 90,488
>6,000 55,214 142,734 197,948
Total 94,865 193,571 288,436
3-4 <8,000 134,643 91,942 226,585
>8,000 184,217 250,859 435,076
Total 318,860 342,801 661,661
5 & above <15,000 142,740 78,475 221,215
>15,000 75,117 99,911 175,028
Total 217,857 178,386 396,243
Grand Total 692,042 888,030 1,580,072
Source: Hong Kong 1991 Population Census Main Tables, Census and Statistics Department, pp195-196
8.5 On application of the other criteria such as the seven year residency ruleand non-property holding within two years preceding the applications, the number ofeligible PRH applicants4 would be reduced to 150,520 households [ 284,502 x 53%(53% being the proportion of private housing which was tenant-occupied)5 ]. Thisrepresented 9.5% of total households.
8.6 Table 5 shows the number of potential PRH households breakdown byincome level and types of accommodation. The main source of potential PRHapplicants came from private self-contained housing. In 1991, there were 201,143households living in private self-contained housing blocks, accounting for 72% of totalpotential PRH applicants.
4 The seven year residency rule was not considered.5 Hong Kong 1991 Population Census, Main Tables, pp203.

Legislative Council Secretariat Study on Housing Demand
Research and Library Services Division page 9
Table 5 - Number of Potential PRH Households by Household Size and Types ofAccommodation 1991
House-holdsize
(no. ofpersons)
Monthlyhousehold
income(HK$)
Privateself-
containedhousingblocks
Privatenon self-containedhousingblocks
Villas/Bungalows/
Modernvillagehouses
Simplestone
structuresInstitutions1
Otherpermanent
housing2
Roof-topstructures
Othertemporaryhousing3
Total
1 <4,000 42,880 315 2,790 5,059 399 2,628 685 8,492 63,248
2 <6,000 36,201 114 3,256 3,621 110 1,371 352 5,812 50,837
3-4 <8,000 66,523 162 5,330 4,920 1,038 1,067 789 12,113 91,942
5 &above
<15,000 55,539 106 6,129 4,962 244 1,521 403 9,571 78,475
Total 201,143 697 17,505 18,562 1,791 6,587 2,229 35,988 284,502
Remarks:1. Including hospitals, prisons, old people’s homes, religious houses and British forces barracks.2. Including hotels, hostels, staff quarters buildings and other non-domestic buildings like offices,
factories, clinics, etc.3. Including HA cottages and temporary huts, and private temporary housing as contractor’s matsheds,
nissen huts, derelict boats, huts and places not intended for residential purpose (e.g. landings,staircases, corridors, etc.) but were occupied on the Census reference date.
Source: Hong Kong 1991 Population Census Main Tables, Census and Statistics Department, pp195-196
Public Housing in Home Ownership Scheme/ Private Sector Participation Scheme
Eligibility for Public Housing in Home Ownership Scheme/ Private SectorParticipation Scheme
8.7 Eligibility is prescribed by age, household size, residency status, tenancystatus and income limit. Our analysis is made on the assumption that none of thesecriteria would change. Any policy alteration on the eligibility criteria would lead to achange in the potential demand for this kind of public housing.
8.8 The applicant must be at least 18 years of age with a household size ofnot less than two persons.6 Besides, the applicant and at least one family member mustbe permanent residents. There are two kinds of applications available for differentcategories of applicants: the “Green Form” and the “White Form”. According to HB,allocation ratio between the former and the latter was 67:33 in the past years. It willincrease to 80:20 in 1996/97 and 1997/98. If more public housing applicants move toHOS flats, the Government can reallocate the vacated PRH units to people who requireimmediate housing.
6 Exception: Under a trial scheme implemented in Phase 17B HOS sales exercise, single-person
households with Green Form entitlement are allowed to purchase small HOS flats with a saleablefloor area of 20 m2 in Hin Ming Court, Tseung Kwan O.
Legislative Council Secretariat Study on Housing Demand
Research and Library Services Division page 10
! “Green Form” applications are available to tenants of HA andHousing Society (HS), authorized persons of Temporary HousingAreas (THAs) and Cottage Areas (CAs) of HA, PRH Waiting List(WL) applicants, clearees, disaster victims and junior civil servantsprovided they surrender their existing public housing/ temporaryhousing unit/cottage or “Green Form certificate” upon the purchaseof the HOS/PSPS flats.
! “White Form” applications are available to all other families,
including residents of HA/HS estates who plan to split from theirpresent households without surrendering their public housing units.There is a limit of family income (not exceeding HK$26,000 permonth in 1996 or HK$14,000 per month in 1991) and a limit on non-possession of any property within two years prior to the closing dateof the application.
Potential Demand for Home Ownership Scheme/Private Sector Participation Scheme
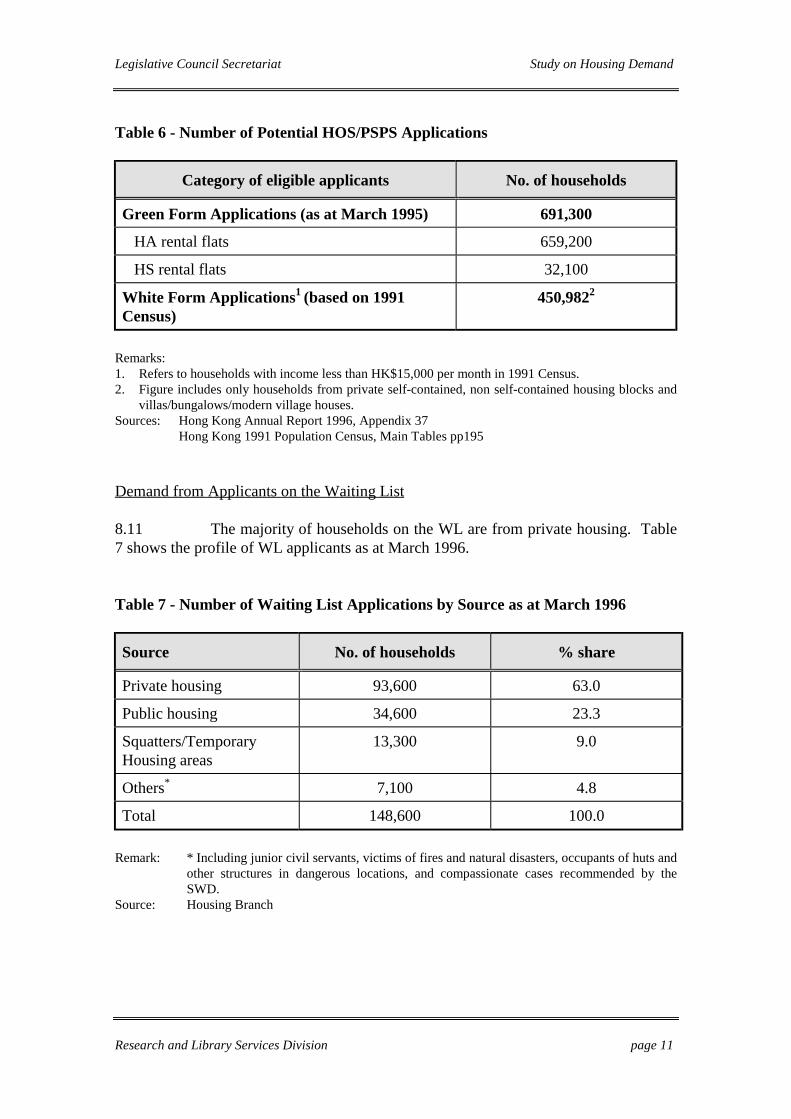
8.9 Table 6 shows the total number of potential HOS/PSPS applicationsfrom the main categories7. It can be noted that the potential “Green Form” applicantsamounted to 691,300 households in 1995.
8.10 Concerning “White Form” applicants, the prescribed monthly incomelimit in 1991 was HK$14,000. The 1991 Census showed that about 451,000households earned less than HK$15,000 per month. Taking the proportion of tenants inprivate housing which was 53% (as mentioned in paragraph 8.5), the “White Form”applicants8 in 1991 could be estimated to be about 239,000 (450,982 x 53%)households. We are not able to extrapolate the figure for 1996 because of lack of datato show the change in income received by these households.
7 Including only households living in HA/HS rental flats, private self-contained, non self-contained
housing blocks and villas/bungalows/modern village houses.8 The seven year residency rule was not considered.
Legislative Council Secretariat Study on Housing Demand
Research and Library Services Division page 11
Table 6 - Number of Potential HOS/PSPS Applications
Category of eligible applicants No. of households
Green Form Applications (as at March 1995) 691,300
HA rental flats 659,200
HS rental flats 32,100
White Form Applications1 (based on 1991Census)
450,9822
Remarks:1. Refers to households with income less than HK$15,000 per month in 1991 Census.2. Figure includes only households from private self-contained, non self-contained housing blocks and
villas/bungalows/modern village houses.Sources: Hong Kong Annual Report 1996, Appendix 37
Hong Kong 1991 Population Census, Main Tables pp195
Demand from Applicants on the Waiting List
8.11 The majority of households on the WL are from private housing. Table7 shows the profile of WL applicants as at March 1996.
Table 7 - Number of Waiting List Applications by Source as at March 1996
Source No. of households % share
Private housing 93,600 63.0
Public housing 34,600 23.3
Squatters/TemporaryHousing areas
13,300 9.0
Others* 7,100 4.8
Total 148,600 100.0
Remark: * Including junior civil servants, victims of fires and natural disasters, occupants of huts andother structures in dangerous locations, and compassionate cases recommended by theSWD.
Source: Housing Branch

Legislative Council Secretariat Study on Housing Demand
Research and Library Services Division page 12
8.12 In the 1987 LTHS, it was estimated that by 1996-97, the supply of PRHwould have substantially met the outstanding demand for PRH on the WL. However, itcan be noted from Table 8 that there were still 148,584 applications outstanding as atMarch 1996. Over 60% (89,623 households) were households of three or moremembers and nearly a quarter (23.5% or 35,005 households) were households with twomembers.
Table 8 - Number of Waiting List Applications by Household Size 1986-1996 (as at March)
House-holdsize
(no. ofpersons)
1986 1987 1988 1989 1990 1991 1992 1993 1994 1995 1996
1 14,623 16,178 18,692 21,847 24,124 26,016 27,010 23,970 20,050 22,255 23,956
% Share 8.1 9.4 11.2 13.8 16.2 16.6 15.8 13.6 13.3 14.9 16.1
2 33,243 35,115 37,974 38,460 38,172 39,907 44,290 46,430 37,940 35,925 35,005
% Share 18.4 20.3 22.7 24.3 25.7 25.5 26.0 26.4 25.3 24.1 23.5
3 andabove
132,720 121,564 110,936 98,265 86,346 90,804 99,360 105,640 92,210 91,000 89,623
% Share 73.5 70.3 66.2 62.0 58.1 57.9 58.2 60.0 61.4 61.0 60.3
Total 180,586 172,857 167,602 158,572 148,642 156,727 170,660 176,040 150,200 149,180 148,584
% Share 100.0 100.0 100.0 100.0 100.0 100.0 100.0 100.0 100.0 100.0 100.0
Source: Housing Branch
8.13 Table 9 shows that in the past three years, only 10% of the WLapplicants were allocated PRH flats. The total number of PRH allocations decreasedfrom 16,721 units in 1993/94 to 12,476 units in 1995/96. Among the allocations, theproportion of single-member household allocations increased from 5% in 1993/94 to18% in 1995/96 whereas the proportion of allocations to households with four or moremembers decreased from 49% to 36% in the corresponding period. The number mayexplain the long waiting period of PRH allocations among the WL applicants, inparticular, the larger households.

Legislative Council Secretariat Study on Housing Demand
Research and Library Services Division page 13
Table 9 - Number of Public Rental Flats Allocated to Waiting List Applicationsby Household Size 1993/94-1995/96
1993/94 1994/95 1995/96Household size(no. of
persons) No. % share No. % share No. % share
1 852 5.1 1,551 10.2 2,284 18.3
2 3,322 19.9 3,799 24.9 2,779 22.2
3 4,407 26.4 3,997 26.2 2,957 23.7
4 5,197 31.1 3,686 24.2 2,524 20.2
5 and above 2,943 17.6 2,223 14.6 1,932 15.5
Total 16,721 100.0 15,256 100.0 12,476 100.0
Source: Housing Branch
8.14 According to the information provided by HD, the total number ofapplicants on the WL in 1996 should be smaller because some applicants may haveexceeded the family income limits or others do not meet the seven-year residency rule.Therefore eligible applications in 1996 are estimated to be about 80,000 households9.
8.15 One reason for the slow progress in housing the WL applicants is thatthe majority of them did not consider taking other forms of housing assistance. In1987, the gross outstanding demand from the WL was forecast to be 240,000households10 up to 1996/97. It was expected that 49% of this total would either buyHOS/PSPS flats or make use of the Home Purchase Loan Scheme (HPLS) loan topurchase private housing11. However, only 4% of the original estimates (4,600families)12 have bought public housing, leaving a good 45% (108,000 households) stillwaiting to be housed in PRH.
8.16 Another reason for the slow progress in housing the WL applications isdue to the increasing number of PRH tenants requesting for units transfer.13 Asindicated in Table 7, 23% of the WL applicants were existing public housing tenantswho wish to move to a bigger flat or to a new location. This group does not haveimmediate needs for housing.
9 Information paper on The 1987 LTHS provided by the Administration at the Panel meeting on 27
May 1996, pp5.10 Information paper on The 1987 LTHS provided by the Administration at the Panel meeting on 27
May 1996, pp9.11 Same as Footnote 10.12 Same as Footnote 10.13 Same as Footnote 10.
Legislative Council Secretariat Study on Housing Demand
Research and Library Services Division page 14
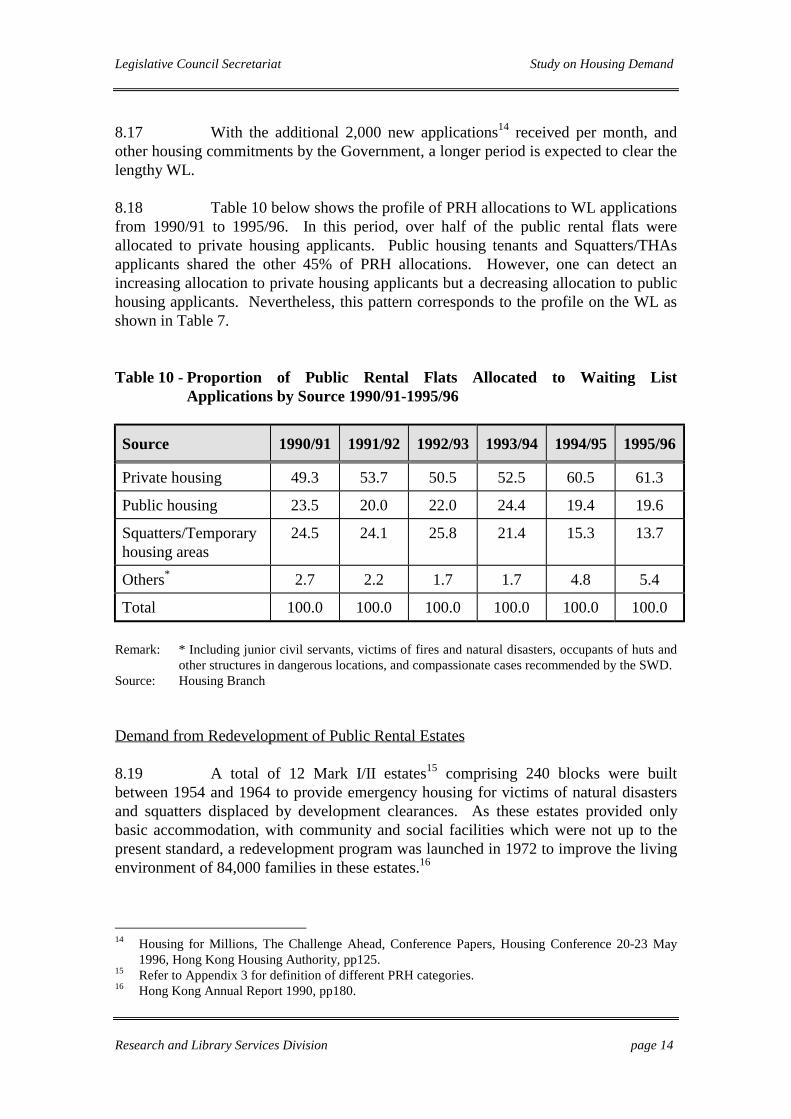
8.17 With the additional 2,000 new applications14 received per month, andother housing commitments by the Government, a longer period is expected to clear thelengthy WL.
8.18 Table 10 below shows the profile of PRH allocations to WL applicationsfrom 1990/91 to 1995/96. In this period, over half of the public rental flats wereallocated to private housing applicants. Public housing tenants and Squatters/THAsapplicants shared the other 45% of PRH allocations. However, one can detect anincreasing allocation to private housing applicants but a decreasing allocation to publichousing applicants. Nevertheless, this pattern corresponds to the profile on the WL asshown in Table 7.
Table 10 - Proportion of Public Rental Flats Allocated to Waiting ListApplications by Source 1990/91-1995/96
Source 1990/91 1991/92 1992/93 1993/94 1994/95 1995/96
Private housing 49.3 53.7 50.5 52.5 60.5 61.3
Public housing 23.5 20.0 22.0 24.4 19.4 19.6
Squatters/Temporaryhousing areas
24.5 24.1 25.8 21.4 15.3 13.7
Others* 2.7 2.2 1.7 1.7 4.8 5.4
Total 100.0 100.0 100.0 100.0 100.0 100.0
Remark: * Including junior civil servants, victims of fires and natural disasters, occupants of huts andother structures in dangerous locations, and compassionate cases recommended by the SWD.
Source: Housing Branch
Demand from Redevelopment of Public Rental Estates
8.19 A total of 12 Mark I/II estates15 comprising 240 blocks were builtbetween 1954 and 1964 to provide emergency housing for victims of natural disastersand squatters displaced by development clearances. As these estates provided onlybasic accommodation, with community and social facilities which were not up to thepresent standard, a redevelopment program was launched in 1972 to improve the livingenvironment of 84,000 families in these estates.16
14 Housing for Millions, The Challenge Ahead, Conference Papers, Housing Conference 20-23 May
1996, Hong Kong Housing Authority, pp125.15 Refer to Appendix 3 for definition of different PRH categories.16 Hong Kong Annual Report 1990, pp180.

Legislative Council Secretariat Study on Housing Demand
Research and Library Services Division page 15
8.20 The LTHS constructed in 1987 further extended the redevelopmentprogram to include all the Mark III/IV and Former Government Low-Cost Housingestates. During 1988-1994, 260 housing blocks in these categories had beenredeveloped. About 81,400 households were rehoused.17
8.21 According to the HA’s proposed 1996 Five-Year RedevelopmentProgram (1996/97-2000/01), 209 blocks comprising 88,262 flats will be cleared duringthe period 1996/97 to 2000/01. This will become a significant source of demand forPRH. Table 11 below shows the number of blocks and flats to be redeveloped in eachof the following years.
Table 11 - Number of Public Rental Estate Blocks Proposed for Redevelopment1996-2001
Year No. of blocks No. of flats (households)
1996/97 57 21,752*
1997/98 12 10,486
1998/99 35 13,697
1999/00 37 11,790
2000/01 68 30,537
Total 209 88,262*
Remark: * indicates 9,028 flats have been vacated as at 31/3/96.Source: Five-Year Redevelopment Program 1996/97-2000/01, Hong Kong Housing Authority
8.22 The Government planned that by 2005, the remaining 61 Mark IV to VIand Former Government Low Cost Housing blocks involving an additional 27,100households will be completely demolished. Thus, a similar number of PRH will needto be built to house these families.
Demand from Clearance of Temporary Housing Areas
8.23 Accommodation in THAs is provided to people who are made homelessby development clearances, fires and natural disasters, clearance of squatters outsidedevelopment areas but ineligible for immediate allocation of permanent public housing.
17 Hong Kong Annual Report 1995, pp220.

Legislative Council Secretariat Study on Housing Demand
Research and Library Services Division page 16
8.24 Table 12 shows that the number of authorized persons living in THAscontinued to decrease from the peak of almost 150,000 in 1989 to 53,077 in 1996.According to HA, only six THAs18 will remain in use after July 1997. However, in the1995 Policy Address, the Government revised its plan to retain 13 sites after 1997.19
Table 12 - Number of THAs and Authorized Persons 1986-1996 (as at March)
Year No. of THA1 Number of authorizedTHA persons2
1986 51 146,620
1987 58 132,187
1988 70 140,029
1989 74 149,744
1990 77 149,360
1991 65 132,843
1992 55 106,403
1993 52 96,216
1994 44 89,083
1995 34 67,157
1996 333 53,077
Remarks:1. Source from Hong Kong Annual Report 1987-19962. Source from Housing Branch3. Source from Information Paper provided to LegCo Panel on Housing on 12 March 1996, Progress on
Clearance of Temporary Housing AreasSources: Hong Kong Annual Report 1987-1996
Housing BranchInformation Paper provided to LegCo Panel on Housing on 12 March 1996, Progress onClearance of Temporary Housing Areas
18 LTHS, Mid-Term Review, Final Report, HA, June 1994, pp4519 Hong Kong: Our Work Together, Address by the Governor, The Right Honourable Christopher
Patten at the opening of the 1995/96 session of the Legislative Council, 11 October 1995, paragraph88.
Legislative Council Secretariat Study on Housing Demand
Research and Library Services Division page 17
Demand from Residents in Squatters
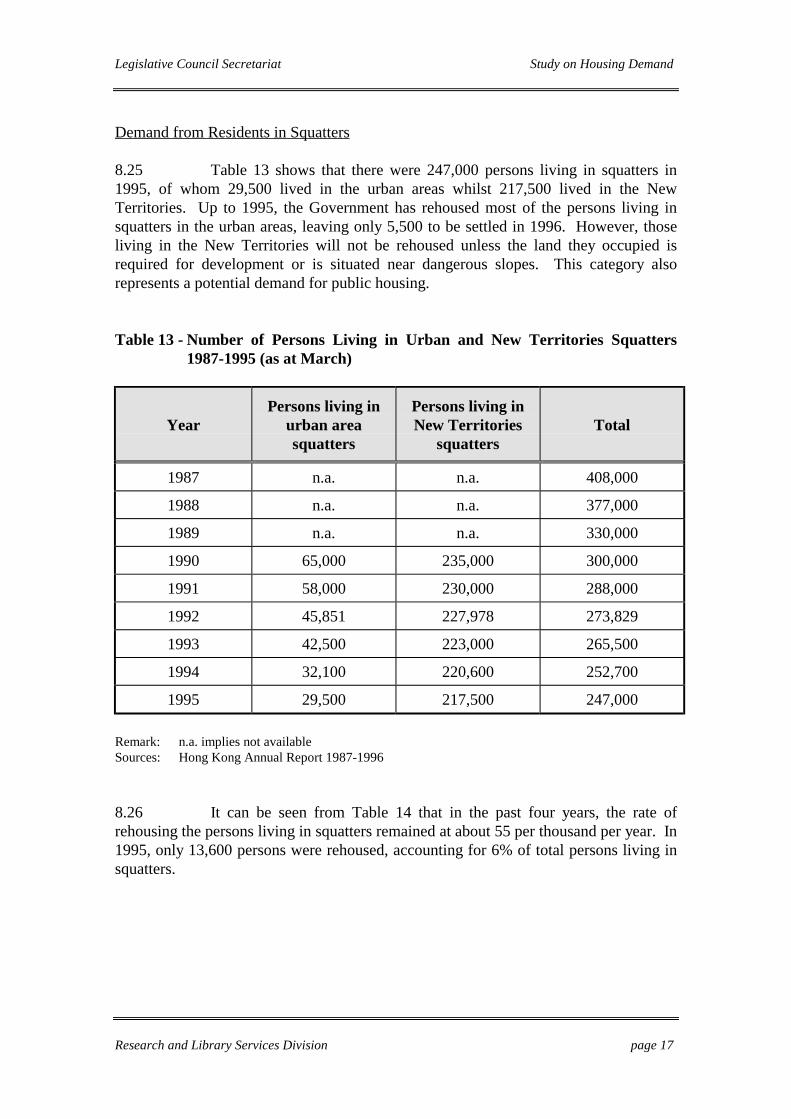
8.25 Table 13 shows that there were 247,000 persons living in squatters in1995, of whom 29,500 lived in the urban areas whilst 217,500 lived in the NewTerritories. Up to 1995, the Government has rehoused most of the persons living insquatters in the urban areas, leaving only 5,500 to be settled in 1996. However, thoseliving in the New Territories will not be rehoused unless the land they occupied isrequired for development or is situated near dangerous slopes. This category alsorepresents a potential demand for public housing.
Table 13 - Number of Persons Living in Urban and New Territories Squatters1987-1995 (as at March)
YearPersons living in
urban areasquatters
Persons living inNew Territories
squattersTotal
1987 n.a. n.a. 408,000
1988 n.a. n.a. 377,000
1989 n.a. n.a. 330,000
1990 65,000 235,000 300,000
1991 58,000 230,000 288,000
1992 45,851 227,978 273,829
1993 42,500 223,000 265,500
1994 32,100 220,600 252,700
1995 29,500 217,500 247,000
Remark: n.a. implies not availableSources: Hong Kong Annual Report 1987-1996
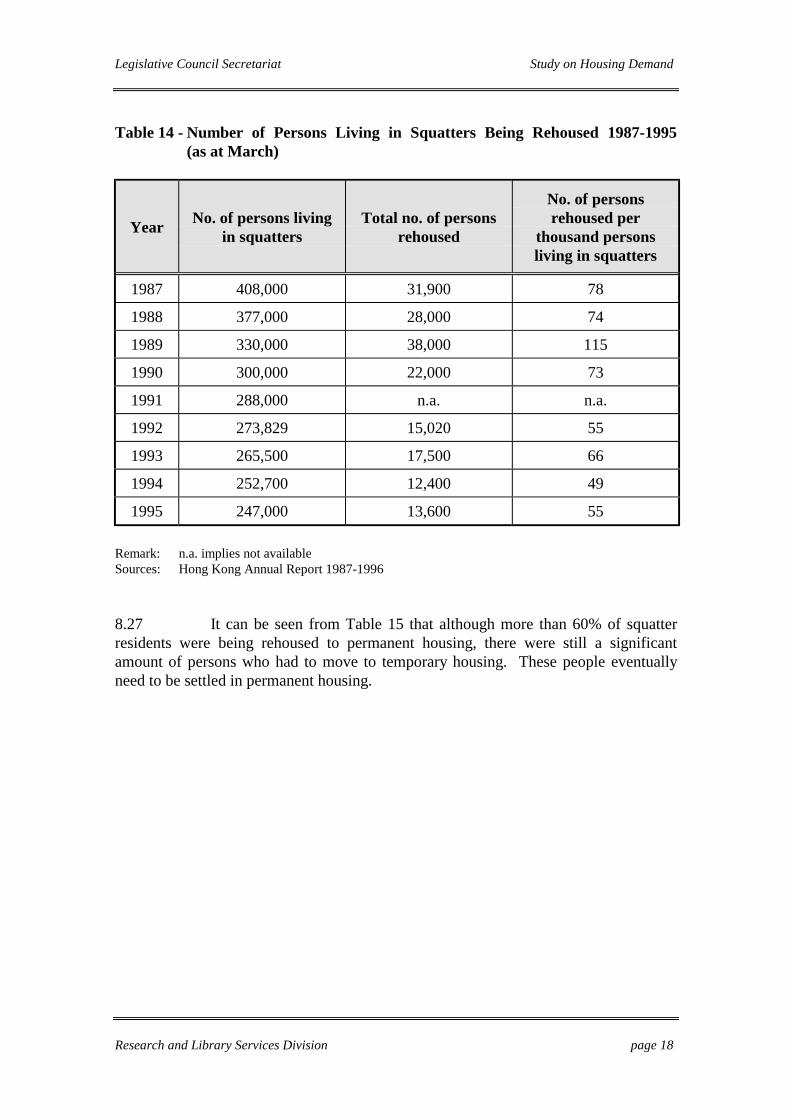
8.26 It can be seen from Table 14 that in the past four years, the rate ofrehousing the persons living in squatters remained at about 55 per thousand per year. In1995, only 13,600 persons were rehoused, accounting for 6% of total persons living insquatters.
Legislative Council Secretariat Study on Housing Demand
Research and Library Services Division page 18
Table 14 - Number of Persons Living in Squatters Being Rehoused 1987-1995 (as at March)
Year No. of persons livingin squatters
Total no. of personsrehoused
No. of personsrehoused per
thousand personsliving in squatters
1987 408,000 31,900 78
1988 377,000 28,000 74
1989 330,000 38,000 115
1990 300,000 22,000 73
1991 288,000 n.a. n.a.
1992 273,829 15,020 55
1993 265,500 17,500 66
1994 252,700 12,400 49
1995 247,000 13,600 55
Remark: n.a. implies not availableSources: Hong Kong Annual Report 1987-1996
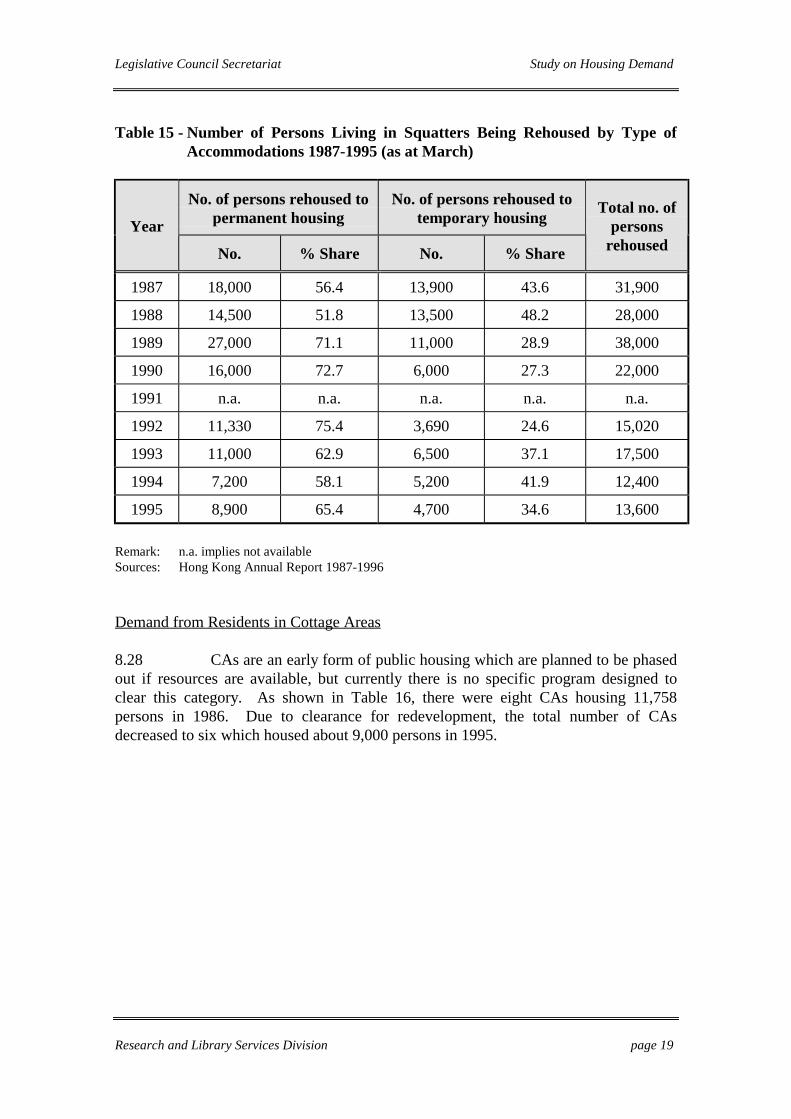
8.27 It can be seen from Table 15 that although more than 60% of squatterresidents were being rehoused to permanent housing, there were still a significantamount of persons who had to move to temporary housing. These people eventuallyneed to be settled in permanent housing.
Legislative Council Secretariat Study on Housing Demand
Research and Library Services Division page 19
Table 15 - Number of Persons Living in Squatters Being Rehoused by Type ofAccommodations 1987-1995 (as at March)
No. of persons rehoused topermanent housing
No. of persons rehoused totemporary housingYear
No. % Share No. % Share
Total no. ofpersons
rehoused
1987 18,000 56.4 13,900 43.6 31,900
1988 14,500 51.8 13,500 48.2 28,000
1989 27,000 71.1 11,000 28.9 38,000
1990 16,000 72.7 6,000 27.3 22,000
1991 n.a. n.a. n.a. n.a. n.a.
1992 11,330 75.4 3,690 24.6 15,020
1993 11,000 62.9 6,500 37.1 17,500
1994 7,200 58.1 5,200 41.9 12,400
1995 8,900 65.4 4,700 34.6 13,600
Remark: n.a. implies not availableSources: Hong Kong Annual Report 1987-1996
Demand from Residents in Cottage Areas
8.28 CAs are an early form of public housing which are planned to be phasedout if resources are available, but currently there is no specific program designed toclear this category. As shown in Table 16, there were eight CAs housing 11,758persons in 1986. Due to clearance for redevelopment, the total number of CAsdecreased to six which housed about 9,000 persons in 1995.

Legislative Council Secretariat Study on Housing Demand
Research and Library Services Division page 20
Table 16 - Number of Cottage Areas and Authorized Persons 1986-1996 (as at March)
Year No. of cottage areas
No. of domesticcottages*
No. of authorizedpersons
1986 8 3,310 11,758
1987 7 2,867 10,456
1988 6 2,635 10,400
1989 6 2,614 10,400
1990 6 2,531 10,000
1991 6 2,528 10,000
1992 6 2,519 9,900
1993 6 2,508 9,900
1994 6 2,494 9,850
1995 6 2,483 9,000
1996 6 1,829 n.a.
Remarks: * Source from Housing Branchn.a. implies not available
Sources: Hong Kong Annual Report 1987-1996Housing Branch
Demand from Emergency/Natural Disasters and Compassionate Cases
8.29 Table 17 lists the number of people being rehoused due to emergency,fire, natural disasters and landslips. In 1995, the number of persons being rehousedamounted to 6,600. For other years, about 2,000-4,000 persons were being rehousedannually.
8.30 In 1995, there were 2,300 PRH units allocated to this category,accounting for 6% of total allocated PRH units (Table 19). Comparing to other sourceof demand for PRH, the number is considered relatively small. This is also a categoryof demand for which forecast is not possible.

Legislative Council Secretariat Study on Housing Demand
Research and Library Services Division page 21
Table 17 - Number of Persons Rehoused due to Landslips and Fire/NaturalDisasters 1986-1995 (as at March)
YearNo. of persons being
rehoused due tolandslips
No. of persons beingrehoused due to fire/
Natural disastersTotal
1986 n.a. n.a. 4,600
1987 n.a. n.a. 3,100
1988 n.a. n.a. 3,500
1989 n.a. n.a. 3,000
1990 n.a. n.a. 2,300
1991 n.a. n.a. n.a.
1992 n.a. n.a. 2,860
1993 1,200 2,000 3,200
1994 3,200 620 3,820
1995 5,300 1,300 6,600
Remark: n.a. implies not availableSources: Hong Kong Annual Report 1987-1996
Allocation of Public Rental Housing
8.31 Table 18 lists the number of new and refurbished public rental flatsallocated to eligible PRH applicants. Between 1986-1995, the average PRH allocationto eligible applicants amounted to 38,430 units per year, among which new flatsaccounted for 72% (27,520 units) whilst refurbished flats shared 28% (10,909 units).Refurbished public rental flats are sourced from tenants who moved to HOS/PSPS flatsor transferred to other PRH units.

Legislative Council Secretariat Study on Housing Demand
Research and Library Services Division page 22
Table 18 - Number of New and Refurbished Public Rental Flats Allocated toEligible PRH Applicants 1986-1995 (as at March)
Year New flats Refurbished flats Total
1986 25,161 9,006 34,1671987 27,000 7,000 34,000
1988 24,000 6,000 30,000
1989 41,600 8,000 49,600
1990 35,600 8,800 44,400
1991 38,000 14,000 52,000
1992 23,000 14,000 37,000
1993 27,500 12,600 40,100
1994 11,400 14,000 25,400
1995 21,943 15,688 37,631
1986-1995Average
27,520 10,909 38,430
Source: Housing Branch
8.32 Table 19 indicates the proportion of PRH units allocated to differentcategories of households between 1986-1995. The WL applicants were allocated thegreatest share of public rental flats in the past ten years. For applicants from CRP, theannual allocation amounted to 30% since 1990, but the proportion dropped to 19% in1995. For allocation due to clearance, the proportion fluctuated between 15-25%during 1990-1995. For unit transfer applicants, the proportion increased sharply from3% in 1994 to 9% in 1995. For emergency/natural disasters/compassionate cases andjunior civil servant categories, allocation proportion maintained at 6% and 3%respectively.

Legislative Council Secretariat Study on Housing Demand
Research and Library Services Division page 23
Table 19 - Percentage Share of Allocation of PRH by Types of Applications 1986-1995 (as at March)
Year Waitinglist
Redevelop-ment Clearance1 Transfer2 Emergency &
compassionate
Juniorcivil
servantTotal
1986 49 23 13 5 4 5 100
1987 48 23 15 7 3 5 100
1988 49 24 14 6 4 4 100
1989 39 27 15 10 4 5 100
1990 41 30 15 7 3 4 100
1991 35 30 25 3 4 3 100
1992 37 33 21 1 4 3 100
1993 44 28 15 4 6 4 100
1994 42 32 15 3 6 2 100
1995 38 19 25 9 6 3 100
Remarks:1. The rehousing sub-category “Re-use of THAs’ is excluded from ‘Waiting List Applicants’ and
included in ‘Clearance’ as from 1990/91, rendering figures for these two categories from 1990/91 notcomparable with those for previous years.
2. Transfer cases not charged to quota of the year are excluded as from 1989/90-1993/94.Sources: Hong Kong Annual Digest 1993, 1995
8.33 The above analysis shows that a substantial number of households awaitpublic housing settlement, with the major sources of demand arising from the WLapplicants and persons living in CRP, THAs, CAs, and squatter areas.

Legislative Council Secretariat Study on Housing Demand
Research and Library Services Division page 24
PART 4 - FACTORS AFFECTING HOUSING DEMAND
9. Population Growth
9.1 C&SD statistics showed that population growth in the past few yearswas faster than expected. The Department projected the mid-1995 population to be5,852,000 when the actual total population amounted to 6,164,700, which was 312,500more than expected.20
9.2 In the Territorial Development Strategy Review (TDSR) ‘96, thePlanning, Environment and Lands Branch forecast Hong Kong’s population may furtherincrease by two million within the next 15 years, based on the population growth trendsof the past two decades and the economic growth of China in the future. Thus, morehousing or larger living quarters are needed to accommodate the increased population.
Reasons for Increase in Population
Returned Hong Kong Residents
9.3 Among the 312,500 extra population, 59% was due to a lower level ofnet outflow of Hong Kong residents21. The Government assumed in 1992 that thearrival and departure pattern of Hong Kong residents followed the trend of thepreceding five years, but it turned out that the number of Hong Kong resident arrivalswas a lot higher than expected. However, there is no information showing the arrivalsare mainly composed of returned overseas Hong Kong migrants.
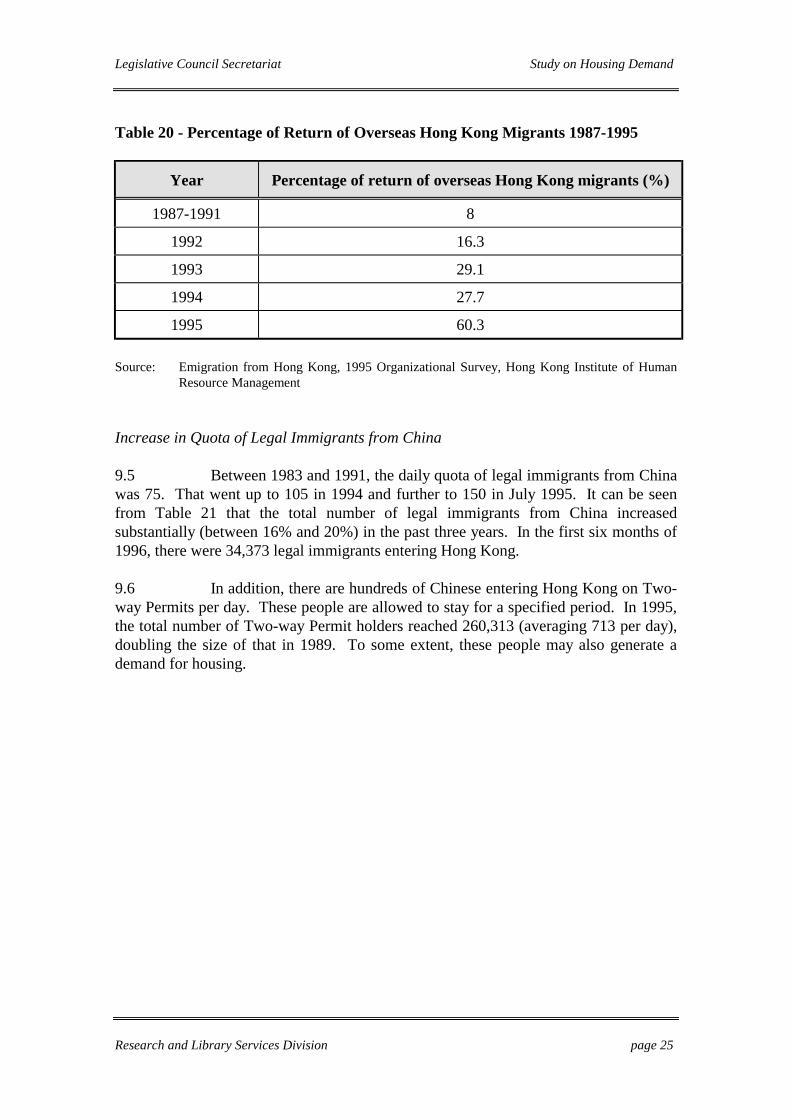
9.4 Nonetheless, the results of a survey conducted by the Hong KongInstitute of Human Resource Management recorded an upward trend for overseas HongKong migrants returning to the territory. Table 20 shows that between 1987-1991, therate of return remained low at around 8%. It rose steadily since 1992 and hit 60% in1995. It is expected more overseas Hong Kong migrants will return to the territory inthe coming years due to an optimistic economic outlook for Hong Kong. This maycreate a new housing demand.
20 A Note on Population Estimates and Population Projections, Census and Statistics Department, June
1996.21 Same as Footnote 20.
Legislative Council Secretariat Study on Housing Demand
Research and Library Services Division page 25
Table 20 - Percentage of Return of Overseas Hong Kong Migrants 1987-1995
Year Percentage of return of overseas Hong Kong migrants (%)
1987-1991 8
1992 16.3
1993 29.1
1994 27.7
1995 60.3
Source: Emigration from Hong Kong, 1995 Organizational Survey, Hong Kong Institute of HumanResource Management
Increase in Quota of Legal Immigrants from China
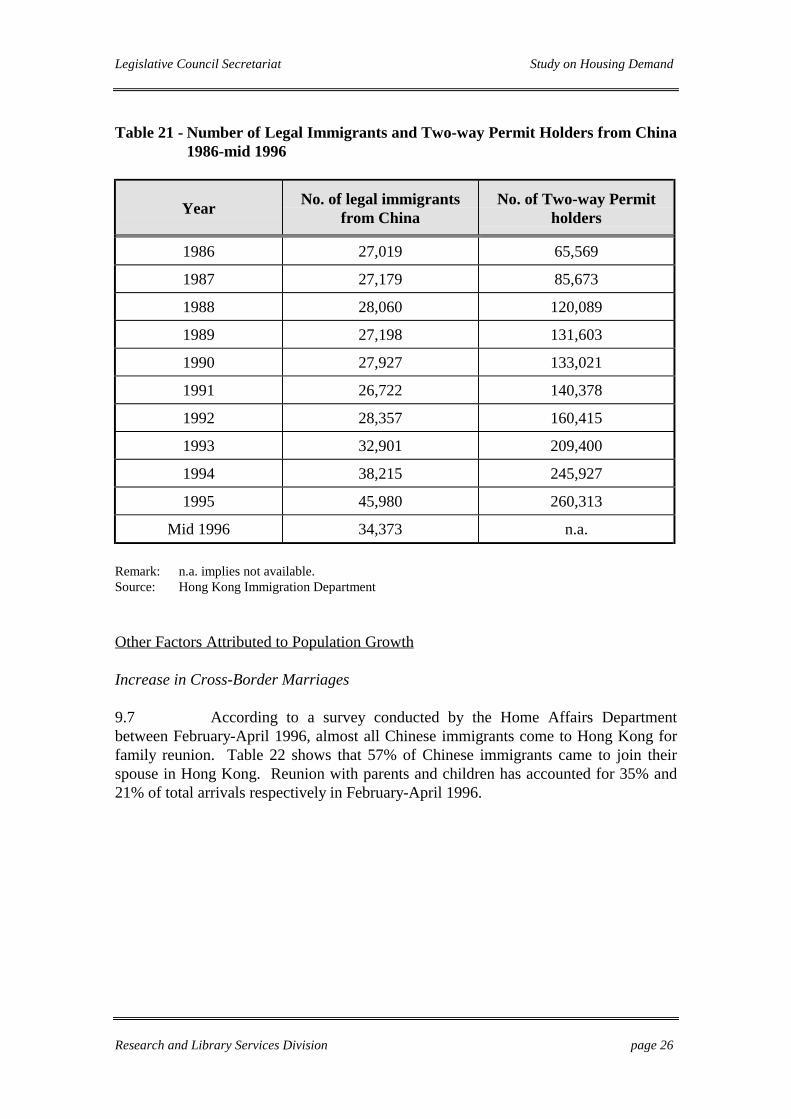
9.5 Between 1983 and 1991, the daily quota of legal immigrants from Chinawas 75. That went up to 105 in 1994 and further to 150 in July 1995. It can be seenfrom Table 21 that the total number of legal immigrants from China increasedsubstantially (between 16% and 20%) in the past three years. In the first six months of1996, there were 34,373 legal immigrants entering Hong Kong.
9.6 In addition, there are hundreds of Chinese entering Hong Kong on Two-way Permits per day. These people are allowed to stay for a specified period. In 1995,the total number of Two-way Permit holders reached 260,313 (averaging 713 per day),doubling the size of that in 1989. To some extent, these people may also generate ademand for housing.
Legislative Council Secretariat Study on Housing Demand
Research and Library Services Division page 26
Table 21 - Number of Legal Immigrants and Two-way Permit Holders from China1986-mid 1996
Year No. of legal immigrantsfrom China
No. of Two-way Permitholders
1986 27,019 65,569
1987 27,179 85,673
1988 28,060 120,089
1989 27,198 131,603
1990 27,927 133,021
1991 26,722 140,378
1992 28,357 160,415
1993 32,901 209,400
1994 38,215 245,927
1995 45,980 260,313
Mid 1996 34,373 n.a.
Remark: n.a. implies not available.Source: Hong Kong Immigration Department
Other Factors Attributed to Population Growth
Increase in Cross-Border Marriages
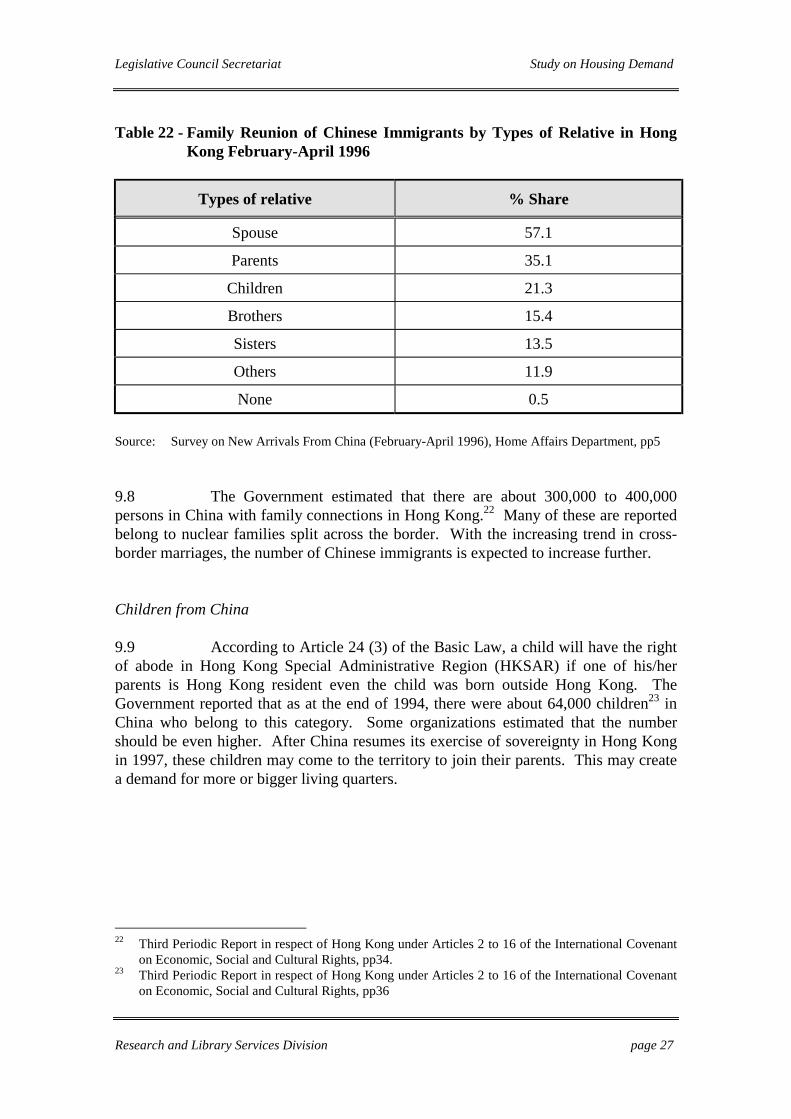
9.7 According to a survey conducted by the Home Affairs Departmentbetween February-April 1996, almost all Chinese immigrants come to Hong Kong forfamily reunion. Table 22 shows that 57% of Chinese immigrants came to join theirspouse in Hong Kong. Reunion with parents and children has accounted for 35% and21% of total arrivals respectively in February-April 1996.
Legislative Council Secretariat Study on Housing Demand
Research and Library Services Division page 27
Table 22 - Family Reunion of Chinese Immigrants by Types of Relative in HongKong February-April 1996
Types of relative % Share
Spouse 57.1
Parents 35.1
Children 21.3
Brothers 15.4
Sisters 13.5
Others 11.9
None 0.5 Source: Survey on New Arrivals From China (February-April 1996), Home Affairs Department, pp5
9.8 The Government estimated that there are about 300,000 to 400,000persons in China with family connections in Hong Kong.22 Many of these are reportedbelong to nuclear families split across the border. With the increasing trend in cross-border marriages, the number of Chinese immigrants is expected to increase further.
Children from China
9.9 According to Article 24 (3) of the Basic Law, a child will have the rightof abode in Hong Kong Special Administrative Region (HKSAR) if one of his/herparents is Hong Kong resident even the child was born outside Hong Kong. TheGovernment reported that as at the end of 1994, there were about 64,000 children23 inChina who belong to this category. Some organizations estimated that the numbershould be even higher. After China resumes its exercise of sovereignty in Hong Kongin 1997, these children may come to the territory to join their parents. This may createa demand for more or bigger living quarters.
22 Third Periodic Report in respect of Hong Kong under Articles 2 to 16 of the International Covenant
on Economic, Social and Cultural Rights, pp34.23 Third Periodic Report in respect of Hong Kong under Articles 2 to 16 of the International Covenant
on Economic, Social and Cultural Rights, pp36
Legislative Council Secretariat Study on Housing Demand
Research and Library Services Division page 28
Increase in the Application of Nepalese as Permanent Residents
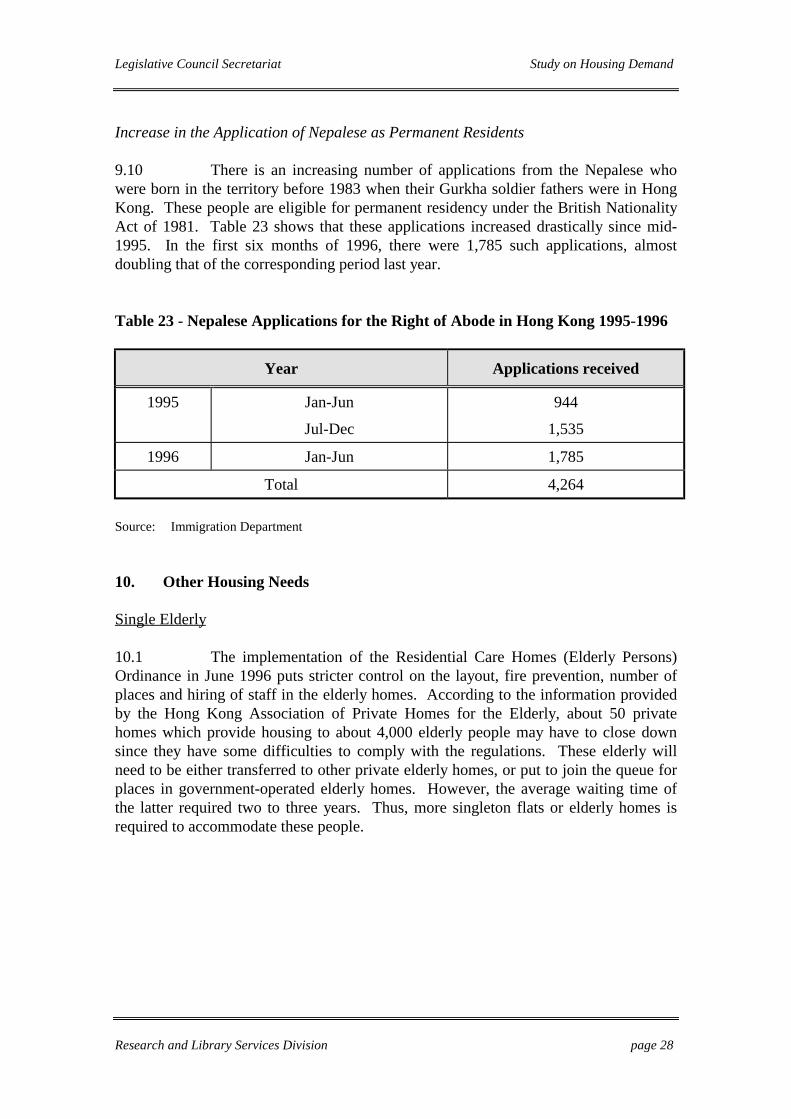
9.10 There is an increasing number of applications from the Nepalese whowere born in the territory before 1983 when their Gurkha soldier fathers were in HongKong. These people are eligible for permanent residency under the British NationalityAct of 1981. Table 23 shows that these applications increased drastically since mid-1995. In the first six months of 1996, there were 1,785 such applications, almostdoubling that of the corresponding period last year.
Table 23 - Nepalese Applications for the Right of Abode in Hong Kong 1995-1996
Year Applications received
1995 Jan-Jun 944
Jul-Dec 1,535
1996 Jan-Jun 1,785
Total 4,264
Source: Immigration Department
10. Other Housing Needs
Single Elderly
10.1 The implementation of the Residential Care Homes (Elderly Persons)Ordinance in June 1996 puts stricter control on the layout, fire prevention, number ofplaces and hiring of staff in the elderly homes. According to the information providedby the Hong Kong Association of Private Homes for the Elderly, about 50 privatehomes which provide housing to about 4,000 elderly people may have to close downsince they have some difficulties to comply with the regulations. These elderly willneed to be either transferred to other private elderly homes, or put to join the queue forplaces in government-operated elderly homes. However, the average waiting time ofthe latter required two to three years. Thus, more singleton flats or elderly homes isrequired to accommodate these people.
Legislative Council Secretariat Study on Housing Demand
Research and Library Services Division page 29
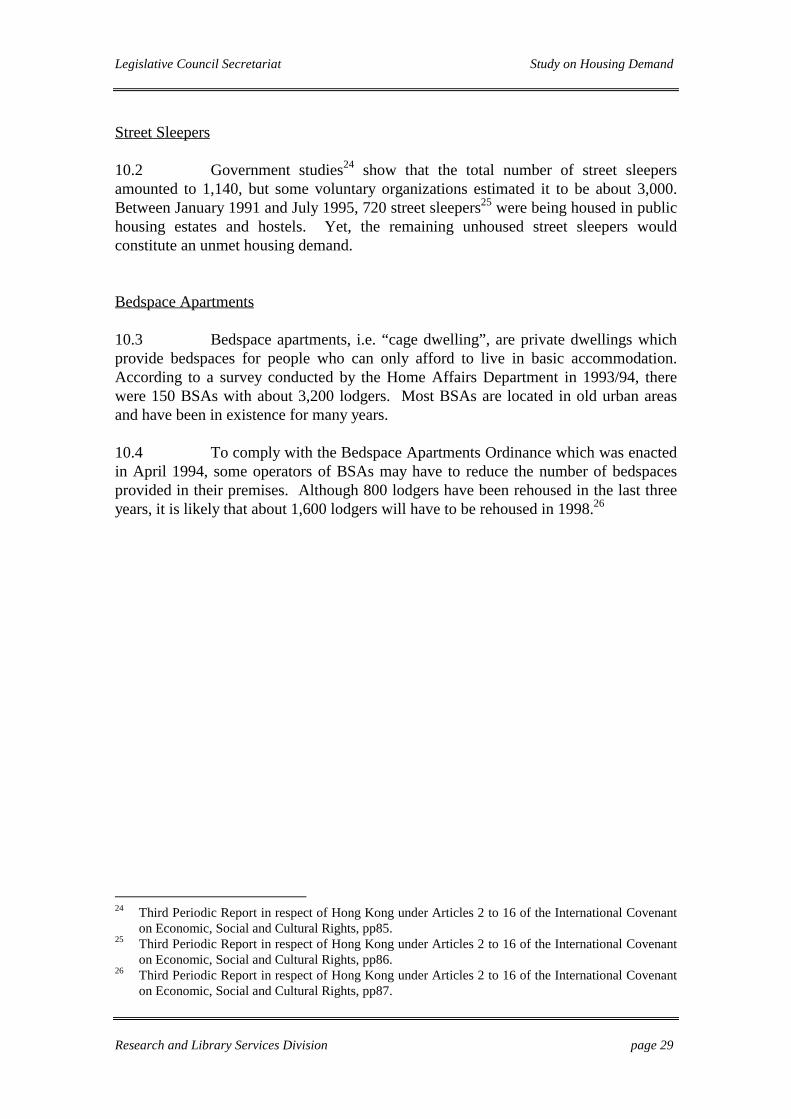
Street Sleepers
10.2 Government studies24 show that the total number of street sleepersamounted to 1,140, but some voluntary organizations estimated it to be about 3,000.Between January 1991 and July 1995, 720 street sleepers25 were being housed in publichousing estates and hostels. Yet, the remaining unhoused street sleepers wouldconstitute an unmet housing demand.
Bedspace Apartments
10.3 Bedspace apartments, i.e. “cage dwelling”, are private dwellings whichprovide bedspaces for people who can only afford to live in basic accommodation.According to a survey conducted by the Home Affairs Department in 1993/94, therewere 150 BSAs with about 3,200 lodgers. Most BSAs are located in old urban areasand have been in existence for many years.
10.4 To comply with the Bedspace Apartments Ordinance which was enactedin April 1994, some operators of BSAs may have to reduce the number of bedspacesprovided in their premises. Although 800 lodgers have been rehoused in the last threeyears, it is likely that about 1,600 lodgers will have to be rehoused in 1998.26
24 Third Periodic Report in respect of Hong Kong under Articles 2 to 16 of the International Covenant
on Economic, Social and Cultural Rights, pp85.25 Third Periodic Report in respect of Hong Kong under Articles 2 to 16 of the International Covenant
on Economic, Social and Cultural Rights, pp86.26 Third Periodic Report in respect of Hong Kong under Articles 2 to 16 of the International Covenant
on Economic, Social and Cultural Rights, pp87.
Legislative Council Secretariat Study on Housing Demand
Research and Library Services Division page 30
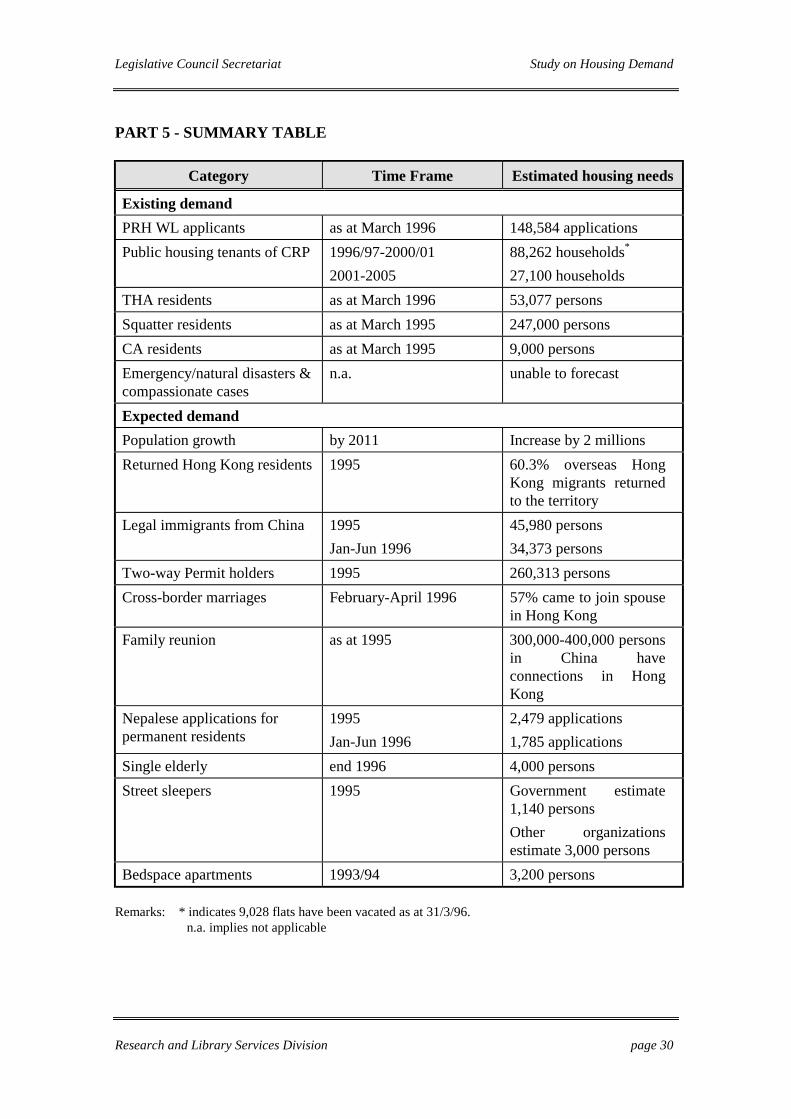
PART 5 - SUMMARY TABLE
Category Time Frame Estimated housing needs
Existing demandPRH WL applicants as at March 1996 148,584 applicationsPublic housing tenants of CRP 1996/97-2000/01
2001-200588,262 households*
27,100 householdsTHA residents as at March 1996 53,077 personsSquatter residents as at March 1995 247,000 personsCA residents as at March 1995 9,000 personsEmergency/natural disasters &compassionate cases
n.a. unable to forecast
Expected demandPopulation growth by 2011 Increase by 2 millionsReturned Hong Kong residents 1995 60.3% overseas Hong
Kong migrants returnedto the territory
Legal immigrants from China 1995Jan-Jun 1996
45,980 persons34,373 persons
Two-way Permit holders 1995 260,313 personsCross-border marriages February-April 1996 57% came to join spouse
in Hong KongFamily reunion as at 1995 300,000-400,000 persons
in China haveconnections in HongKong
Nepalese applications forpermanent residents
1995Jan-Jun 1996
2,479 applications1,785 applications
Single elderly end 1996 4,000 personsStreet sleepers 1995 Government estimate
1,140 personsOther organizationsestimate 3,000 persons
Bedspace apartments 1993/94 3,200 persons
Remarks: * indicates 9,028 flats have been vacated as at 31/3/96.n.a. implies not applicable
Legislative Council Secretariat Study on Housing Demand
Research and Library Services Division page 31
Appendix 1 - Number of Accommodated Permanent Living Quarters 1986-1995 (as at March)
1986 1987 1988 1989 1990 1991 1992 1993 1994 1995
Public housing 625,400 641,800 670,100 710,200 763,800 779,800 821,500 829,900 870,000 878,500(% share) 44.4 44.0 44.0 44.6 45.4 45.2 45.5 45.0 45.7 45.0
HA estates 526,200 536,300 555,300 583,100 618,100 623,700 641,300 637,300 651,700 659,200 (% share) 37.3 36.7 36.5 36.6 36.7 36.2 35.6 34.6 34.2 33.8 HS estates 30,700 30,000 29,800 30,600 30,800 32,200 32,700 33,100 33,100 32,100 (% share) 2.2 2.1 2.0 1.9 1.8 1.9 1.8 1.8 1.7 1.6 HOS blocks1 64,900 72,200 81,900 93,500 112,100 121,100 144,700 156,700 182,400 187,200 (% share) 4.6 4.9 5.4 5.9 6.7 7.0 8.0 8.5 9.6 9.6 HA cottages2 3,600 3,300 3,100 3,000 2,800 2,800 2,800 2,800 2,800 n.a. (% share) 0.3 0.2 0.2 0.2 0.2 0.2 0.2 0.2 0.1 n.a.
Private housing3 762,100 795,100 829,500 859,000 892,800 912,900 952,900 984,800 1,003,400 1,046,800(% share) 54.0 54.5 54.5 53.9 53.0 53.0 52.8 53.4 52.7 53.6
Government quarters 22,600 23,300 23,500 24,400 27,500 29,400 28,700 29,000 29,500 26,800(% share) 1.6 1.6 1.5 1.5 1.6 1.7 1.6 1.6 1.6 1.4
Total permanenthousing
1,410,100 1,460,200 1,523,100 1,593,600 1,684,100 1,722,100 1,803,100 1,843,700 1,902,900 1,952,100
(% share) 100.0 100.0 100.0 100.0 100.0 100.0 100.0 100.0 100.0 100.0Remarks:1. Including Private Sector Participation Scheme and Sandwich Class Housing.2. Categorized under temporary housing commenced 1995.3. Including self-contained and non self-contained private housing blocks; Housing Society Urban Improvement Scheme estates; villas/bungalows/modern village houses;
simple stone structures; staff quarter buildings and quarters in hotels, hostels, commercial, manufacturing and other non-residential buildings.n.a. implies not applicableSources: Hong Kong Annual Report 1987-1996
Hong Kong 1991 Population Census, Main Tables.

Legislative Council Secretariat Study on Housing Demand
Research and Library Services Division page 32
Appendix 2 - Estimated Number of Persons Accommodated 1986-1995 (as at March)
1986 1987 1988 1989 1990 1991 1992 1993 1994 1995
Public housing 2,437,200 2,592,300 2,630,000 2,669,000 2,759,100 2,688,900 2,882,100 2,871,900 2,965,300 3,068,300(% share) 44.5 46.4 46.7 46.8 48.0 47.7 50.1 49.1 50.0 50.0
HA estates 2,076,700 2,196,700 2,195,900 2,199,200 2,236,000 2,151,600 2,245,800 2,229,200 2,211,400 2,288,900 (% share) 37.9 39.3 39.0 38.5 38.9 38.2 39.1 38.1 37.3 37.2 HS estates 127,900 130,800 124,600 123,100 118,900 108,600 119,900 116,100 109,100 110,800 (% share) 2.3 2.3 2.2 2.2 2.1 1.9 2.1 2.0 1.8 1.8 HOS blocks1 221,500 253,800 300,100 337,700 396,500 420,500 510,700 520,800 639,000 668,600 (% share) 4.0 4.5 5.3 5.9 6.9 7.5 8.9 8.9 10.8 10.9 HA cottages2 11,100 11,000 9,400 9,000 7,700 8,200 5,700 5,800 5,800 n.a. (% share) 0.2 0.2 0.2 0.2 0.1 0.1 0.1 0.1 0.1 n.a.
Private housing3 2,577,100 2,539,100 2,596,500 2,616,800 2,605,800 2,661,300 2,617,600 2,720,300 2,729,400 2,852,300(% share) 47.0 45.4 46.1 45.9 45.3 47.2 45.5 46.5 46.0 46.4
Government quarters 65,200 62,000 59,100 58,400 63,800 69,500 62,000 63,200 63,800 58,400(% share) 1.2 1.1 1.0 1.0 1.1 1.2 1.1 1.1 1.1 1.0
Total permanent housing 5,079,500 5,193,400 5,285,600 5,344,200 5,428,700 5,419,700 5,561,700 5,655,400 5,758,500 5,979,000(% share) 92.7 92.9 93.9 93.6 94.4 96.2 96.7 96.8 97.0 97.4Temporary housing4 363,200 362,300 309,700 330,800 291,100 197,300 168,500 170,300 156,900 145,100(% share) 6.6 6.5 5.5 5.8 5.1 3.5 2.9 2.9 2.6 2.4Marine 36,400 35,000 33,700 32,100 30,500 19,400 20,800 19,300 17,800 16,600(% share) 0.7 0.6 0.6 0.6 0.5 0.3 0.4 0.3 0.3 0.3
Total population 5,479,100 5,590,700 5,629,000 5,707,100 5,750,300 5,636,400 5,751,000 5,845,000 5,933,200 6,140,700100.0 100.0 100.0 100.0 100.0 100.0 100.0 100.0 100.0 100.0
Remarks:1. Including Private Sector Participation Scheme and Sandwich Class Housing.2. Categorized under temporary housing commenced 1995.3. Including self-contained and non self-contained private housing blocks; Housing Society Urban Improvement Scheme estates; villas/bungalows/modern village houses; simple stone structures; staff quarter
buildings and quarters in hotels, hostels, commercial, manufacturing and other non-residential buildings.4. Refers to HA cottages and temporary huts, roof-top structures and other private temporary housing such as the contractor’s matsheds, nissen huts, derelict boats etc.n.a. implies not applicableSources: Hong Kong Annual Report 1987-1996
Hong Kong 1991 Population Census, Main Tables

Legislative Council Secretariat Study on Housing Demand
Research and Library Services Division page 33
Appendix 3 - Characteristics of Major Types of Public Housing
Type Initial standard of provision Period of provision Remarks
Resettlement Housing
Marks I and II One cubicle per household with 2.3m² per adult.Communal lavatories and wash-in places.
1954 to 1964 Space provision improving since 1972. Allearmarked for redevelopment since 1972. A total of240 blocks were cleared.
Mark III Individual water supply and balcony per unit.Lavatory shared by two units.
1963 to 1972 All earmarked for redevelopment since 1988. Spaceprevision improving since 1972.
Marks IV and V One lavatory per unit.
Marks VI Space standard at 3.3m² per adult.
Government Low Cost Housing Similar to Mark VI Blocks. 1963 to 1972 Space provision improving since 1972. 26substandard blocks being redeveloped since 1985.Rest all ear-marked for redevelopment.
Housing Authority/ HousingSociety Flats
Self-contained units with kitchen, bathroom andbalcony per unit. Space allocation at 3.3m² till late1970s since then at about 5m² per person.
1949 to present All new rental housing for all approved purposes willbe in this type.
Home Ownership Scheme Flats Self-contained units with kitchen, bathroom andseparate living/dinning and bedrooms per unit. Sizeof flat related to household income of applicant.
1980 to present All new home-ownership scheme flats will be of thesame standard.
Source: Luke S.K. Wong, Housing and the Residential Environment, The Other Hong Kong Report 1989, pp.232
Legislative Council Secretariat Study on Housing Demand
Research and Library Services Division page34
References
1. Hong Kong Annual Report 1986-1996.
2. Long Term Housing Strategy, A Policy Statement, April 1987, Hong KongHousing Authority.
3. Hong Kong 1991 Population Census, Main Tables, Census and StatisticsDepartment.
4. A Report on the Mid-Term Review, October 1993, Hong Kong HousingAuthority.
5. Final Report on the Mid-Term Review, June 1994, Hong Kong Housing Authority.
6. Hong Kong Housing Authority 1990/91 Annual Report.
7. General Housing Policies, Housing Department, December 1995.
8. Hong Kong Monthly Digest of Statistics December 1989, December 1994, August1996, Census and Statistics Department.
9. Hong Kong Annual Digest of Statistics 1993 and 1995, Census and StatisticsDepartment.
10. Five Year Comprehensive Redevelopment Program (1996-97 to 2000-01), HongKong Housing Authority.
11. Record of Meeting held on 16 January 1996, LegCo Panel on Housing.
12. Minutes of Special Meeting held on 23 April 1996, LegCo Panel on Housing.
13. Minutes of Meeting held on 27 May 1996, LegCo Panel on Housing.
14. Information Paper on Follow up to Meeting on 27 May 1996, LegCo Panel onHousing.
15. Draft Minutes of Joint Meeting on 12 June 1996, LegCo Panel on Housing andPanel on Planning, Lands and Works.
16. Information Paper on Follow up to Meeting on 12 July 1996, LegCo Panel onHousing.
17. Answers to Questions raised by LI Wing-Tat re Subcommittee on LTHS Review,Housing Branch, July 1996.

Legislative Council Secretariat Study on Housing Demand
Research and Library Services Division page 35
18. Housing for Millions, The Challenge Ahead, Conference Papers, HousingConference 20-23 May 1996, Hong Kong Housing Authority.
19. Hong Kong: Our Work Together, Address by the Governor, The Right HonourableChristopher Patten at the opening of the 1995/96 session of the LegislativeCouncil, 11 October 1995.
20. Emigration from Hong Kong, 1995 Organizational Survey, Hong Kong Institute ofHuman Resource Management.
21. Survey on New Arrivals From China (February-April 1996), Home AffairsDepartment.
22. A Note on Population Estimates and Population Projections, Census and StatisticsDepartment, June 1996.
23. A Consultative Digest, Territorial Development Strategy Review (TDSR) ‘96.
24. Third Periodic Report in respect of Hong Kong under Articles 2 to 16 of theInternational Covenant on Economic, Social and Cultural Rights.
25. Luke S.K. Wong, Housing and the Residential Environment, The Hong KongReport.