Study on Coexistence between Long Term Evolution and ... · Study on Coexistence between Long Term...
18
International Journal of Advanced Science and Technology Vol. 38, January, 2012 75 Study on Coexistence between Long Term Evolution and Digital Broadcasting services In-kyoung Cho* 1,3 , Il-kyoo Lee 2 and Youn-ok Park 3 1 Department of Information & Communication, College of Engineering, Kongju National University, Budae-dong, Cheonan, Chungnam, 330-717, Korea 2 Department of Electrical, Electronic & Control, College of Engineering, Kongju National University, Budae-dong, Cheonan, Chungnam, 330-717, Korea 3 Mobile Packet Transmission Research Team, Electronics and Telecommunications Research Institute,138 Gajeongno, Yuseong-gu, Daejeon, 305-350, Korea [email protected], [email protected] (Corresponding author), [email protected] Abstract Korea has made a plan to transfer from analog television to Digital Television (DTV). Therefore, TV White Spaces (TVWS)are the unused TV broadcast channels which can be available for wireless communication systems. This paper assumes that DTV operates on Channel 34 and Long Term Evolution (LTE) is assumed that it uses Frequency Division Duplexing (FDD), and then upper 4 MHz of Channel 32 and channel 33 are assumed to allocate to LTE Uplink, and channel 35 and lower 4 MHz of channel 36 are assumed to allocate to Downlink. However, the interference effect of LTE on DTV has to be taken into account. Therefore, according to the interference probability of 5% required by DTV receiver and the allowable transmit power of LTE Base Station (BS) and Mobile Station (MS), the protection distance from the reference LTE BS and MS to DTV receiver and the guard band will be analyzed by using Spectrum Engineering Advanced Monte-Carlo Analysis Tool (SEAMCAT). As a result, in the case that 8 MHz guard band is required and the assumed emission mask of LTE BS is used, the required protection distance between the LTE BS and DTV receiver is about 2 km. In the case of interference between LTE MS and DTV receiver considering the assumed emission mask of LTE MS, the protection distance is negligible above 8 MHz of guard band. The results can be as a guideline and reference in making plan for the coexistence of LTE and DTV. Keywords: TV White Spaces (TVWS), Long Term Evolution (LTE), Digital Television (DTV), Guard Band, Protection Distance 1. Introduction TV White Spaces (TVWS) are the unused TV broadcast channels which can be available for wireless communication systems. Specially, more available TVWS is freed up after the transition from analog television to digital television. Because TVWS is located in the VHF and UHF bands, it has several important properties that make them highly desirable for wireless communications as following [1]: Ability to penetrate buildings and foliage, non-line
Transcript of Study on Coexistence between Long Term Evolution and ... · Study on Coexistence between Long Term...

International Journal of Advanced Science and Technology
Vol. 38, January, 2012
75
Study on Coexistence between Long Term Evolution and Digital
Broadcasting services
In-kyoung Cho*1,3
, Il-kyoo Lee2 and Youn-ok Park
3
1Department of Information & Communication, College of Engineering, Kongju
National University, Budae-dong, Cheonan, Chungnam, 330-717, Korea
2Department of Electrical, Electronic & Control, College of Engineering, Kongju
National University, Budae-dong, Cheonan, Chungnam, 330-717, Korea
3Mobile Packet Transmission Research Team, Electronics and Telecommunications
Research Institute,138 Gajeongno, Yuseong-gu, Daejeon, 305-350, Korea
[email protected], [email protected] (Corresponding author),
Abstract
Korea has made a plan to transfer from analog television to Digital Television (DTV).
Therefore, TV White Spaces (TVWS)are the unused TV broadcast channels which can be
available for wireless communication systems. This paper assumes that DTV operates on
Channel 34 and Long Term Evolution (LTE) is assumed that it uses Frequency Division
Duplexing (FDD), and then upper 4 MHz of Channel 32 and channel 33 are assumed to
allocate to LTE Uplink, and channel 35 and lower 4 MHz of channel 36 are assumed to
allocate to Downlink. However, the interference effect of LTE on DTV has to be taken into
account. Therefore, according to the interference probability of 5% required by DTV receiver
and the allowable transmit power of LTE Base Station (BS) and Mobile Station (MS), the
protection distance from the reference LTE BS and MS to DTV receiver and the guard band
will be analyzed by using Spectrum Engineering Advanced Monte-Carlo Analysis Tool
(SEAMCAT).
As a result, in the case that 8 MHz guard band is required and the assumed emission mask
of LTE BS is used, the required protection distance between the LTE BS and DTV receiver is
about 2 km. In the case of interference between LTE MS and DTV receiver considering the
assumed emission mask of LTE MS, the protection distance is negligible above 8 MHz of
guard band. The results can be as a guideline and reference in making plan for the
coexistence of LTE and DTV.
Keywords: TV White Spaces (TVWS), Long Term Evolution (LTE), Digital Television
(DTV), Guard Band, Protection Distance
1. Introduction
TV White Spaces (TVWS) are the unused TV broadcast channels which can be available
for wireless communication systems. Specially, more available TVWS is freed up after the
transition from analog television to digital television. Because TVWS is located in the VHF
and UHF bands, it has several important properties that make them highly desirable for
wireless communications as following [1]: Ability to penetrate buildings and foliage, non-line
International Journal of Advanced Science and Technology
Vol. 38, January, 2012
76
of sight connectivity, broadband payload capacity. Therefore, TVWS channels can be used in
certain locations by certain devices, such as Long Term Evolution (LTE), Wireless Mobile
World Interoperability for Microwave Access (WiMAX), Wireless Microphone and etc.
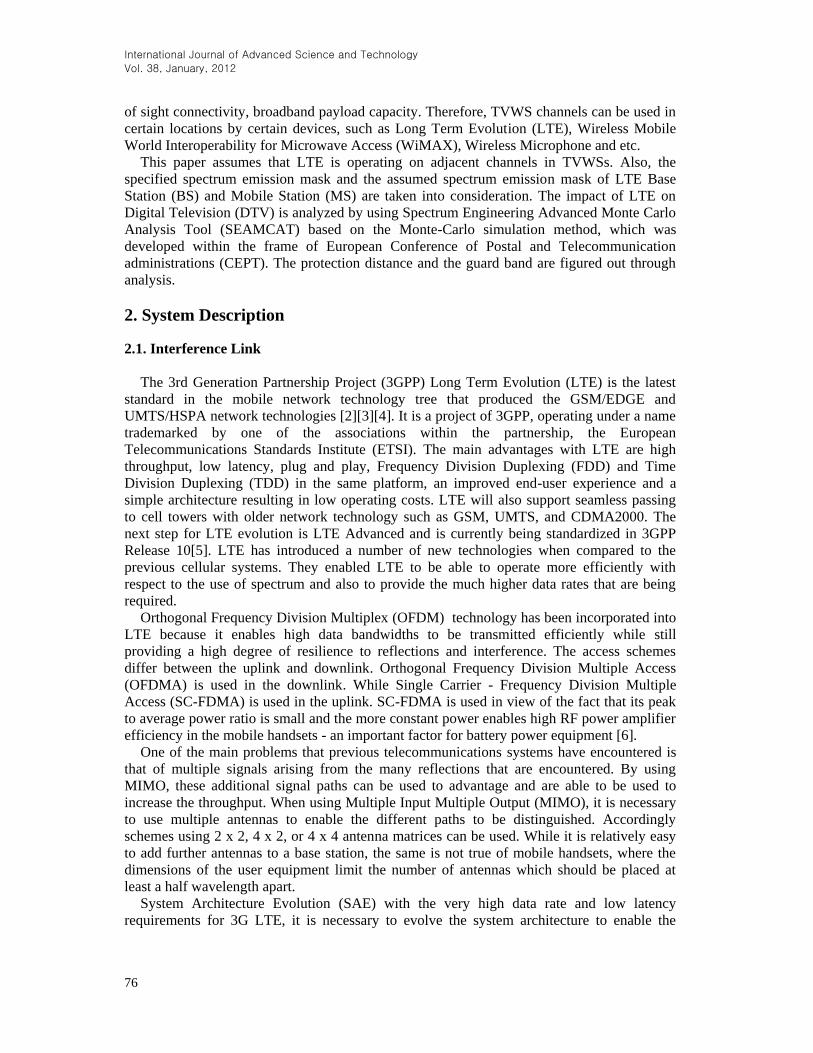
This paper assumes that LTE is operating on adjacent channels in TVWSs. Also, the
specified spectrum emission mask and the assumed spectrum emission mask of LTE Base
Station (BS) and Mobile Station (MS) are taken into consideration. The impact of LTE on
Digital Television (DTV) is analyzed by using Spectrum Engineering Advanced Monte Carlo
Analysis Tool (SEAMCAT) based on the Monte-Carlo simulation method, which was
developed within the frame of European Conference of Postal and Telecommunication
administrations (CEPT). The protection distance and the guard band are figured out through
analysis.
2. System Description
2.1. Interference Link
The 3rd Generation Partnership Project (3GPP) Long Term Evolution (LTE) is the latest
standard in the mobile network technology tree that produced the GSM/EDGE and
UMTS/HSPA network technologies [2][3][4]. It is a project of 3GPP, operating under a name
trademarked by one of the associations within the partnership, the European
Telecommunications Standards Institute (ETSI). The main advantages with LTE are high
throughput, low latency, plug and play, Frequency Division Duplexing (FDD) and Time
Division Duplexing (TDD) in the same platform, an improved end-user experience and a
simple architecture resulting in low operating costs. LTE will also support seamless passing
to cell towers with older network technology such as GSM, UMTS, and CDMA2000. The
next step for LTE evolution is LTE Advanced and is currently being standardized in 3GPP
Release 10[5]. LTE has introduced a number of new technologies when compared to the
previous cellular systems. They enabled LTE to be able to operate more efficiently with
respect to the use of spectrum and also to provide the much higher data rates that are being
required.
Orthogonal Frequency Division Multiplex (OFDM) technology has been incorporated into
LTE because it enables high data bandwidths to be transmitted efficiently while still
providing a high degree of resilience to reflections and interference. The access schemes
differ between the uplink and downlink. Orthogonal Frequency Division Multiple Access
(OFDMA) is used in the downlink. While Single Carrier - Frequency Division Multiple
Access (SC-FDMA) is used in the uplink. SC-FDMA is used in view of the fact that its peak
to average power ratio is small and the more constant power enables high RF power amplifier
efficiency in the mobile handsets - an important factor for battery power equipment [6].
One of the main problems that previous telecommunications systems have encountered is
that of multiple signals arising from the many reflections that are encountered. By using
MIMO, these additional signal paths can be used to advantage and are able to be used to
increase the throughput. When using Multiple Input Multiple Output (MIMO), it is necessary
to use multiple antennas to enable the different paths to be distinguished. Accordingly
schemes using 2 x 2, 4 x 2, or 4 x 4 antenna matrices can be used. While it is relatively easy
to add further antennas to a base station, the same is not true of mobile handsets, where the
dimensions of the user equipment limit the number of antennas which should be placed at
least a half wavelength apart.
System Architecture Evolution (SAE) with the very high data rate and low latency
requirements for 3G LTE, it is necessary to evolve the system architecture to enable the

International Journal of Advanced Science and Technology
Vol. 38, January, 2012
77
improved performance to be achieved. One change is that a number of the functions
previously handled by the core network have been transferred out to the periphery. Essentially
this provides a much "flatter" form of network architecture. In this way latency times can be
reduced and data can be routed more directly to its destination.
In view of the fact that there are a number of differences between the operation of the
uplink and downlink, these naturally differ in the performance they can offer. The LTE
specification provides downlink peak rates of at least 100 Mbps, an uplink of at least 50 Mbps
and RAN round-trip times of less than 10 ms. LTE supports scalable carrier bandwidths, from
1.4 MHz to 20 MHz and supports both Frequency Division Duplexing (FDD) and Time
Division Duplexing (TDD)[6]. The key parameters of the 3G LTE specification are
summarized in Table 1[3][7].
Table 1. The Key Parameters of the LTE
Parameter Details
Peak downlink speed 64QAM (Mbps)
100 (SISO), 172 (2x2 MIMO), 326 (4x4 MIMO)
Peak uplink speeds (Mbps) 50 (QPSK), 57 (16QAM), 86 (64QAM)
Channel bandwidths (MHz) 1.4, 3, 5, 10, 15, 20
Duplex schemes FDD and TDD
Mobility
0 - 15 km/h (optimised), 15 - 120 km/h (high performance)
120 ~ 350km/h(Mobility maintained) 350 ~ 500km/h(Under consideration
depending on frequency band )
Spectral efficiency Downlink: 3 - 4 times Rel 6 HSDPA
Uplink: 2 -3 x Rel 6 HSUPA
Access schemes OFDMA (Downlink) SC-FDMA (Uplink)
Cell Range
~ 5 km: Best Throughput, Spectrum Efficiency and mobility ~ 30 km: Mobility as defined above, some degradation in Throughput, Spectrum Efficiency ~ 100 km: Supported, Degradations accepted
Modulation types supported QPSK, 16QAM,
64QAM (Uplink and downlink)
Main parameters of LTE are summarized in Table 2, Table 3, Table 4, Table 5, Table 6,
Table 7 and Table 8, respectively.

International Journal of Advanced Science and Technology
Vol. 38, January, 2012
78
Table 2. Parameters of the LTE BS [8][9]
Parameters Value
BS Maximum Power Amplifier Power 43dBm
BS Antenna Maximum Gain 15 dBi
BS Height 32 m
BS Noise Figure 5 dB
BS RX Sensitivity -101.5 dBm
ACS[10] 43.5 dB
Table 3. LTE BS Spectrum Emission Limit for 10MHz Bandwidth [11]
On the basis of specified LTE BS spectrum emission limit in Table 3, the assumed LTE BS
Spectrum emission limit is summarized in Table 4.
Table 4. Assumed LTE BS Spectrum Emission Limit
Frequency offset from channel edge
(MHz)
Minimum requirement
(dBm)
Attenuation (dBc)
Measurement bandwidth
0~0.2 -19 -62 30 kHz
1~2 -18 -61 1 MHz
2 ~3 -23 -66 1 MHz
3~4 -28 -71 1 MHz
4~5 -33 -76 1 MHz
5~15 -38 -81 1 MHz
According to the specified spectrum emission mask in Table 3 and the assumed spectrum
emission mask in Table 4, two spectrum emission masks are illustrated in Figure 1.
Frequency offset from channel edge
(MHz)
Minimum requirement
(dBm)
Attenuation (dBc)
Measurement bandwidth
0~0.2 -14 -57 30 kHz
1~10 -13 -56 1 MHz
10 ~25 -15 -58 1 MHz

International Journal of Advanced Science and Technology
Vol. 38, January, 2012
79
-30 -20 -10 0 10 20 30-90
-80
-70
-60
-50
-40
-30
-20
-10
0
Frequency (MHz)
dBc
specif ied esmission mask
assumed emission mask
Figure 1. Spectrum Emission Mask of LTE BS
Table 5. . Parameters of the LTE MS
Parameters Value
MS Antenna Maximum Power Amplifier Power 24 dBm
MS Antenna Minimum Power Amplifier Power -30 dBm
MS Antenna Gain 0 dBi
MS Height 1.5 m
MS Noise Figure 9 dB
MS RX Sensitivity -94 dBm
ACS[10] 33 dB
Table 6. LTE MS Spectrum Emission Limit for 10 MHz Bandwidth [11]
Frequency offset from channel edge
(MHz)
Minimum requirement
(dBm)
Attenuation (dBc)
Measurement bandwidth
0~1 -18 -42 30 kHz
1~5 -10 -34 1 MHz
5~10 -13 -37 1 MHz
10~25 -25 -49 1 MHz
On the basis of specified LTE MS Spectrum emission limit in Table 6, the assumed LTE
MS Spectrum emission limit is summarized in Table 7.

International Journal of Advanced Science and Technology
Vol. 38, January, 2012
80
Table 7. Assumed LTE MS Spectrum Emission Limit
Frequency offset from channel edge
(MHz)
Minimum requirement
(dBm)
Attenuation (dBc)
Measurement bandwidth
0~1 -23 -47 30 kHz
1~2 -15 -39 1 MHz
2 ~3 -20 -54 1 MHz
3~4 -25 -59 1 MHz
4~5 -30 -64 1 MHz
5~6 -35 -69 1 MHz
6~7 -40 -74 1 MHz
7~8 -45 -79 1 MHz
According to the specified spectrum emission mask in Table 6 and the assumed spectrum
emission mask in Table 7, two spectrum emission masks are illustrated in Figure 2.
-30 -20 -10 0 10 20 30-80
-70
-60
-50
-40
-30
-20
-10
0
Frequency (MHz)
dB
c
specif ied emission mask
assumed emission mask
Figure 2. Spectrum Emission Mask of LTE MS

International Journal of Advanced Science and Technology
Vol. 38, January, 2012
81
Table 8. Some Necessary Parameters of LTE for Simulation
Parameters Value
Duplex FDD
Carrier Frequency 579 MHz
Band Width 10 MHz
Thermal Noise -174 dBm/Hz
I/N -10 dB
LTE Link Coverage requirement 95% at the coverage edge[12] Log-normal shadowing=10 dB
Building Penetration Loss 8 dB[13]
Propagation Model Macro cell propagation model Urban [10]
Coverage Radius 2.8668km
Network Topology Hexagonal Grid, 19 sites (57 cells) with wrap
around.
Inter-Side Distance 4.9654km
Sectorization Tri- sector antennas
Minimum Coupling Loss 70 dB
Number of Available Resource Blocks (M)
24
Number of Resource Block per UE (N)
1
Number of Active UEs per Cell (K)
24 (K=M/N)
Minimum subcarrier usage per Base Station
assumed full loaded system 100%
Bandwidth of Resource Block 375 kHz (180kHz is the size of resource block
later defined, but this has no big impact on the simulation results)
Hand Over (HO) Margin 3 dB
Link Performance Model Attenuated and truncated form of the
Shannon bound
3GPP TR 36.942 V10.1.0 [10] introduced that Macro cell propagation model for urban area
is applicable for scenarios in urban and suburban areas outside the high rise core where the
buildings are of nearly uniform height:
80dB(f)log21(Dhb)log18(R)logDhb)104(140L 101010
3
(1)

International Journal of Advanced Science and Technology
Vol. 38, January, 2012
82
Where Dhb is the base station antenna height in metres, measured from the average rooftop
level and R is the base station separation in kilometers and f is the carrier frequency in MHz.
Considering a carrier frequency of 579 MHz and a base station antenna height of 15 metres
above average rooftop level, the propagation model is given by the following formula:
10L 116.8 37.6log (R) (2)
Here, R is the protection distance between the base station (BS) and mobile station (MS) in
kilometers.
After L is calculated, log-normally distributed shadowing (Log(F)) with standard deviation
of 10 dB should be added. A Shadowing correlation factor of 0.5 for the shadowing between
sites (regardless aggressing or victim system) and of between sectors of the same site shall be
used the pathloss is given by the following formula:
Pathloss_macro L Log(F) (3) 2.1. Victim Link
DTV is an advanced broadcasting technology that transmits audio and video by digital
signals. In contrast to the analog signals used by analog TV, it has several advantages over
analog TV such as requiring less bandwidth, providing high-definition television service,
providing multimedia or interactivity [14]. Therefore, many countries are replacing over the
air broadcast analog television with digital television to allow other uses of the radio spectrum
formerly used for analog TV broadcast. The US DTV standard (ATSC) is used in this paper
and the main relevant characteristics of DTV are summarized in Table 9 [15].
Table 9. Characteristics of DTV
Characteristic Value
Transmit power 4 kW (66 dBm)
Frequency band 587 MHz(Channel 34)
Bandwidth 6 MHz
Tx antenna height 100 m
Tx antenna gain 0 dBi
Rx antenna height 10 m
Rx antenna gain 10 dBi
Noise Figure 10 dB
Sensitivity -83 dBm
C/I 23 dB
Modulation FM or QPSK
On the basis of Federal Communications Commission (FCC) emission mask for DTV is
illustrated as in Figure 3.

International Journal of Advanced Science and Technology
Vol. 38, January, 2012
83
Figure 3. FCC DTV Emission Mask (measurement bandwidth of 500 kHz)
DTV blocking response is defined as in Table 10 by referring to Digital video
Broadcasting-Terrestrial (DVB-T) blocking response as the opposite of the protection ratio
for DVB-T signal interfered with by emission of Code Division Multiple Access-1X(CDMA-
1X) in reference [16].
Table 10. DTV Blocking Response
△Frequency (MHz)
-15 -12 -6 -3 0 3 6 12 15
Blocking(dB) 45 38 20 3 -10 3 20 38 45
3. Interference Analysis Method
3.1. Interference Analysis Method (SEAMCAT)
The classical approach such as Minimum Coupling Loss (MCL) appear being too rigid and
difficult to implement in many cases, where operation of radiocommunications systems may
not be described in static terms, e.g. random nature of operation of user terminals in the
mobile systems. While compromise in such cases may be found by making certain
(pessimistic) assumptions and simplifications on the operation of the considered systems, this
may produce unnecessarily stiff and static interference assessment, which becomes often
biased towards one of the considered systems depending on the partiality of assumptions/
simplifications made. However, a Monte Carlo simulation can completely achieve above-
mentioned requirements.

International Journal of Advanced Science and Technology
Vol. 38, January, 2012
84
Within the frame of the European Conference of Postal and Telecommunications
Administrations (CEPT) Working Group Spectrum Engineering, a new statistical simulation
model has been developed based on the Monte-Carlo method, named SEAMCAT. This model
and its supporting software implementation allow quick yet reliable consideration of spatial
and temporal distributions of the received signals and the resulting statistical probability of
interference in a wide variety of scenarios. It therefore enables more precise mutual
positioning of those considered systems, hence more efficient use of the radio spectrum [17] .
3.2. Main Principles of SEAMCAT
The Monte-Carlo simulation method is based upon the principle of taking samples of
random variables, using their defined probability density functions (for simplicity called
"distributions" in the SEAMCAT environment). Hence, first a user defines the distributions of
possible values of the parameters of considered radiocommunication systems (e.g. antenna
heights, powers, operating frequencies, positions of the transceivers, etc.) and then, the
SEAMCAT uses those distributions to generate random samples (also called trials or
snapshots) of subject parameters. Afterwards for each trial SEAMCAT calculates the strength
of the interfering and the desired signals and stores them in data arrays [18][19]. Figure 4
illustrates a typical victim and interferer scenario for a Monte Carlo simulation trial.
Figure 4. A Typical Scenario of Victim and Interferer
As a final step, the SEAMCAT derives the probability of interference taking into account
the quality of the receiver in a known environment, and the calculated signals.
The criterion for interference to occur is for the victim receiver (Vr) to have a carrier to
interference ratio (C/I) less than the minimum allowable value. In order to calculate the
victim’s C/I, it is necessary to establish the victim’s desired received signal strength(dRSS)
corresponding to the C, as well as the interfering received signal strength (iRSS)
corresponding to the I. Figure 5 illustrates the various signal levels. Figure 5 (a) represents the
situation when there is no interference and the victim is receiving the desired signal with
wanted signal margin. Figure 5 (b) illustrates what happens when interference occurs. The
interference adds to the noise floor. The difference between the wanted signal strength and
the interference signal is measured in dB, which is defined as the signal to interference ratio.
This ratio must be more than the required C/I threshold if interference is to be avoided. The
Monte Carlo simulation methodology is used to check for this condition and records whether
or not interference is occurring, which is illustrated further in Figure 6.

International Journal of Advanced Science and Technology
Vol. 38, January, 2012
85
Figure 5. The Signal Levels Used to determine whether or not Interference
is Occurring
Figure 6. Scenario of LTE Interfering with DTV & Illustrative Summary of the Interference Criteria Computation
SEAMCAT calculates the probability of interference (PI) of the victim receiver as
follows:
PI=1-PNI (4)
Here, PI is the probability of interference in the victim receiver. The PNI is the probability
of non interference in victim receiver. When a C/I criteria is considered, PNI is defined as: P
PNI (5)

International Journal of Advanced Science and Technology
Vol. 38, January, 2012
86
By definition of P(A|B)=P(A∩B)/P(B), the PNI becomes:
PNI (6)
In such manner, the SEAMCAT can address virtually all radio interference scenarios in
both co-channel (sharing) and adjacent frequency (compatibility) interference studies. This
flexibility is achieved by the way the system parameters are defined as variable (or constant)
through their distribution functions. It is therefore possible to model even very complex
situations by relatively simple elementary functions [17].
3.3. SEAMCAT Architecture
The architecture of SEAMCAT software is composed of the Event Generation Engine
(EGE), Interference Calculation Engine (ICE), CDMA/OFDMA Engine, any potential future
calculation engine as well as an extended user interface outputs. The data storage is XML-
based files. The architecture of SEAMCAT-3 is shown below in Figure 7 [17].
Figure 7. Architecture of SEAMCAT
4. Assumption of frequency allocation and interference scenario
4.1. Assumption of Frequency Allocation for LTE and DTV
Firstly, channel 34 (CH34) in DTV bands is assumed to allocate to DTV. It is assumed that
LTE uses Frequency Division Duplexing (FDD), and then upper 4 MHz of Channel 32
(CH32) and channel 33 (CH33) are assumed to allocate to LTE Uplink (UL), and channel
35(CH35) and lower 4 MHz of channel 36 (CH36) are assumed to allocate to Downlink (DL).
Figure 8 illustrates the assumption of frequency allocation for LTE and DTV.

International Journal of Advanced Science and Technology
Vol. 38, January, 2012
87
Figure 8. Assumption of Frequency Allocation for LTE and DTV
4.2. Interference Scenario
Figure 9 illustrates scenario of interference impact of LTE on DTV receiver. In the case of
LTE potentially interfering with DTV, there are two scenarios to be taken into account:LTE
BS is interferer and DTV rece iver is victim and LTE MS is interferer and DTV receiver is
victim.
Figure 9. Interference Scenario of LTE Interfering with DTV
4. Simulation Results and Analysis
4.1 The Case of LTE BS Interfering with DTV
In the case of LTE BS interfering with DTV receiver, main parameters such as power,
frequency, C/I, and so on are set up for the interference simulation. Therefore, the evaluation
of the relationship between the guard band and the protection distance is conducted. One
snapshot of simulation status is illustrated Figure 10.
International Journal of Advanced Science and Technology
Vol. 38, January, 2012
88
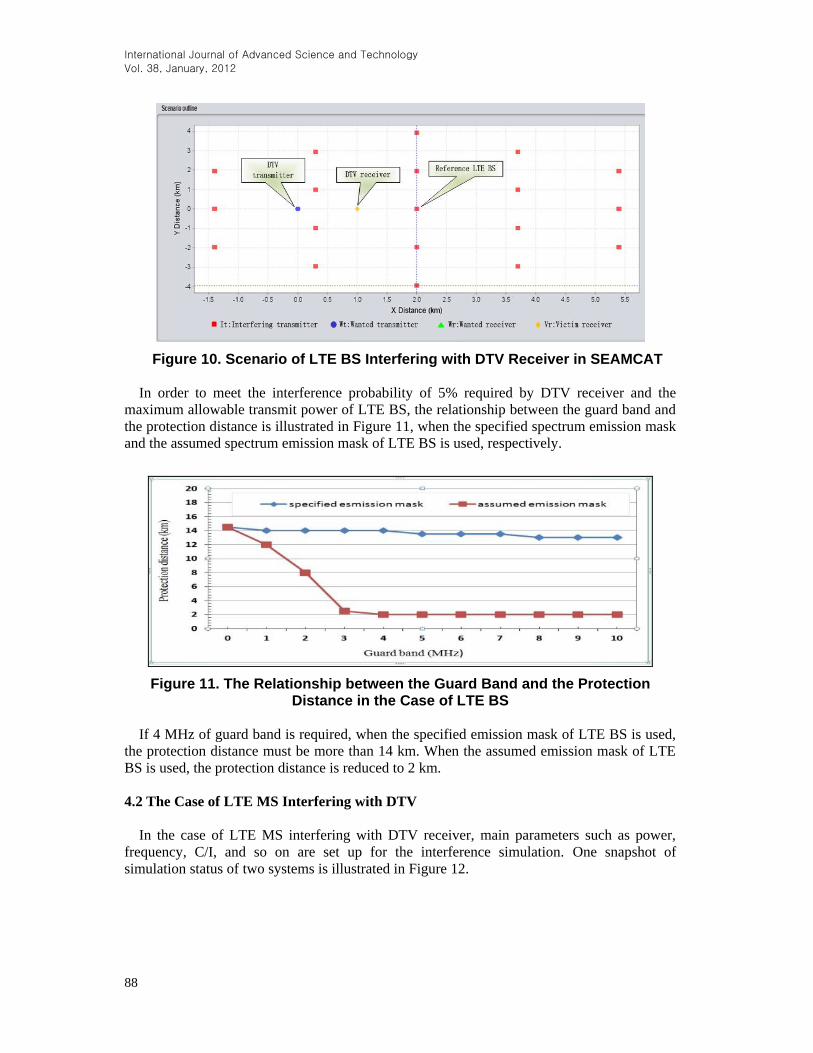
Figure 10. Scenario of LTE BS Interfering with DTV Receiver in SEAMCAT
In order to meet the interference probability of 5% required by DTV receiver and the
maximum allowable transmit power of LTE BS, the relationship between the guard band and
the protection distance is illustrated in Figure 11, when the specified spectrum emission mask
and the assumed spectrum emission mask of LTE BS is used, respectively.
Figure 11. The Relationship between the Guard Band and the Protection Distance in the Case of LTE BS
If 4 MHz of guard band is required, when the specified emission mask of LTE BS is used,
the protection distance must be more than 14 km. When the assumed emission mask of LTE
BS is used, the protection distance is reduced to 2 km.
4.2 The Case of LTE MS Interfering with DTV
In the case of LTE MS interfering with DTV receiver, main parameters such as power,
frequency, C/I, and so on are set up for the interference simulation. One snapshot of
simulation status of two systems is illustrated in Figure 12.

International Journal of Advanced Science and Technology
Vol. 38, January, 2012
89
Figure 12. Scenario of LTE MS Interfering with DTV Receiver in SEAMCAT
To meet the interference probability of 5% required by DTV receiver, the relationship
between the guard band and the protection distance is shown in Figure 13 The specified
spectrum emission mask and the assumed spectrum emission mask of LTE MS are used.
Figure 13. The Relationship between the Guard Band and the Protection Distance in the Case of LTE MS
Figure 13 shows that if 4 MHz of guard band is required, when the specified emission
mask of LTE MS is used, the protection distance between the LTE MS and DTV receiver
should be at least 13 km. If the assumed emission mask of LTE MS is used, the protection
distance should be at least 8.5 km. However, the protection distance is negligible when the
guard band is 8 MHz and above.
5. Conclusions
The interference scenario of LTE in TVWS potentially interfering with DTV is assumed.
The relationship between the protection distance and the guard band for protecting DTV from
interference of LTE is analyzed by using SEAMCAT.

International Journal of Advanced Science and Technology
Vol. 38, January, 2012
90
As a result of study, the worst case is taken into account. The 5 % below of interference
probability of DTV receiver is required along with maximum allowable transmit power of
LTE. In order to meet 4 MHz guard band, the protection distance must be more than 14 km
when the specified emission mask of LTE BS is used. But when the assumed emission mask
of LTE BS is used, the protection distance is reduced to 2 km. If the specified emission mask
of LTE MS is used, the protection distance should be at least 13 km. If the assumed emission
mask of LTE MS is used under 8 MHz of guard band, the protection distance is almost
negligible. The analysis result may offer a reference and be helpful to resolve the interference
problem between DTV and other wireless communication systems.
References [1] Office of communications (Ofcom), Digital Dividend Review: 550-630MHz and 790-854MHz, Consultation
on detailed award design, (2008) June 6.
[2] WGSE - SEAMCAT Technical Group(STG), OFDMA algorithm description, Electronic communication
committee, Copenhagen (2010) February 24.
[3] 3GPP LTE Encyclopedia, An Introduction to LTE, (2010)
[4] Motorola, Long Term Evolution (LTE): A Technical Overview, (2010)
[5] 3GPP LTE Encyclopedia, LTE – An End-to-End Description of Network Architecture and Elements, (2009)
[6] Jim Zyren, Overview of the 3GPP Long Term Evolution Physical Layer, Freescale, , (2007), pp. 1~13.
[7] Technical Overview of 3GPP LTE, (2008) May18.
[8] STG(10)01, Part4 - Calibration test of the SEAMCAT UL OFDMA module, ECO, (2009) December 17.
[9] STG(09)24rev2, Part3bis - Calibration test of the SEAMCAT DL OFDMA module,ERO, (2009) May 19.
[10] 3rd Generation Partnership Project, Technical Specification Group Radio Access Network; Evolved
Universal Terrestrial Radio Access (E-UTRA);Radio Frequency (RF) system scenarios(Release 10), 3GPP
TR 36.942 V10.2.0, (2010) December, pp. 14~15, pp. 23, pp. 39, pp. 76~77.
[11] CEPT, Compatibility study for LTE and WiMAX operating within the bands 880-915 MHz / 925-960 MHz
and 1710-1785 MHz / 1805-1880 MHz (900/1800 MHz bands), pp. 50~51 and,pp. 61~62, CEPT Report 40,
(2010) November.
[12] DVB, Digital Video Broadcasting (DVB) document A092r3, DVB-H Implementation Guidelines, DVB,
(2009) April.
[13] MWG/AWG, A comparative Analysis of Spectrum Alternatives for WiMAXTM Networks Based on the
U.S.700MHz Band, WiMAX Forum, (2008) June, pp. 19.
[14] White Spaces Report 2Q 2010, White Spaces Usage and Availability Analysis: United States,
Spectrumbridge, (2010)
[15] Seong-kweon Kim, Interference Analysis based on the Monte-Carlo Method, Korea Information and
Communications Society, Korea (2008) May, pp.58
[16] Electronic Communications Committee (ECC) Report 104, Compatibility between mobile radio system
operating in the range 450-470MHz and digital video broadcasting-terrestrial (DVB-T) system operating in
UHF TV channel 21(470-478 MHz), Electronic Communications Committee (ECC) within the European
Conference of Postal and Telecommunications Administrations (CEPT), Amstelveen, (2007) June.
[17] ERC, SEAMCAT SoftwareVersion2.1 User Manual, European Radio communications Office, (2004)
February 23.
[18] ECO, SEAMCAT Handbook, (2010) January, ECO.
[19] ERC REPORT 68, Monte-carlo simulation methodology for the use in sharing and Compatibility studies
between different radio services or systems, European Radiocommunications Committee (ERC), (2000)
February.
[20] ERC REPORT 68, Monte-carlo simulation methodology for the use in sharing and Compatibility studies
between different radio services or systems, European Radiocommunications Committee (ERC), (2000)
February.

International Journal of Advanced Science and Technology
Vol. 38, January, 2012
91
Authors
In-Kyoung Cho
Received the B.E. and M.E. degrees in department of Information &
Communication engineering from Kongju National University, Cheonan,
Chungnam, Korea in 2009 and 2012, respectively.
Since 2011, she has been with Electronics and Telecommunications
Research Institude, Daejon, Korea, where she is the Research Staff of
Wireless Packet Modem Research Team. Her research interests include
propagation interference and RF systems.
Il-Kyoo Lee
Received the B.E., M.E. and Ph.D. degrees in electronics engineering
from Chungnam National University, Daejon, Korea in 1992, 1994, and
2003, respectively.
From 1994 to 2003, he was with ETRI, Daejon, Korea, as a Senior
Member of the Research Staff of the Radio Technology Department.
Since 2004, he has been with Kongju National University, Cheonan,
Chungnam, Korea, where he is an Associate Professor with the
Department of Information and Communications. His research interests
include RF circuit and wireless communication systems.
Youn Ok Park
Team Leader/Principle Engineer, Wireless Packet Modem Research
Team, Electronics and Telecommunications Research Institude.
Youn Ok Park leads WiBro(Wireless Broadband) Modem
development activities within ETRI since 2003. He manages HPi modem
algorithm and architecture including channel coding and WiBro
standards. From February 1987 to December 1997, he has served as
senior researcher on NAIS Project and developed 3 kinds of middle range
supper computer such as TiCOM II, TiCOMIII and TiCOM IV. From
July 1997 to December 1998, he has served as senior researcher on base
station modem development project using Smart Antenna System. From
January 1999 to December 1999, he has developed synchronous wide
band CDMA systems mobile station modem. From January 2000 to
December 2001, he has developed mobile station modem which used in
WCDMA system compliant to 3GPP. From January 2002 to December
2002, he developed 2 kinds of Mobile/Base station modem for 4th
Generation Mobile system using OFDM and QAM CDMA. From
January 2003 to December 2011, he developed WiBro Modem including
base station and mobile station compliant to the standard of IEEE802.16e
& IEEE802.16m. Before joining ETRI, Youn Ok Park had 1 year’s
research experience in Samsung Electronics Complex Research Center.
Youn Ok Park presented more than 30 technical papers in IEEK and
other conferences. He holds B.S. degree from Hanyang University,

International Journal of Advanced Science and Technology
Vol. 38, January, 2012
92
Seoul, Korea in 1986, in Electronics Engineering, M.S. from Chungnam
National University, Taejon, Korea in 1997, in Computer Engineering
and he hols Ph.D. from Chungnam national University, in Information
Engineering, in 2011.