Study on applying MODIS image into drought indicator analysis in Taiwan Yuh-Lurng Chung, Chaur-Tzuhn...
32
Study on applying MODIS image into drought indicator analysis in Taiwan Yuh-Lurng Chung, Chaur-Tzuhn Ch en Chen-Ni Hsi , Shih-Ming Liu 2004.11.04
-
Upload
irma-flowers -
Category
Documents
-
view
220 -
download
1
Transcript of Study on applying MODIS image into drought indicator analysis in Taiwan Yuh-Lurng Chung, Chaur-Tzuhn...

Study on applying MODIS image into drought indicator analysis in TaiwanStudy on applying MODIS image into drought indicator analysis in Taiwan
Yuh-Lurng Chung, Chaur-Tzuhn Chen Chen-Ni Hsi , Shih-Ming Liu
2004.11.04
Yuh-Lurng Chung, Chaur-Tzuhn Chen Chen-Ni Hsi , Shih-Ming Liu
2004.11.04

Introduction Introduction
When drought occurs, due to insufficient water supply, the variation/change of leaves in aridity can be sensed by spectral reflection of multi-temporal satellites.
When drought occurs, due to insufficient water supply, the variation/change of leaves in aridity can be sensed by spectral reflection of multi-temporal satellites.

Overseas researches of employing satellite images to efficiently forecast and manage drought has achieved great outcomes.
Overseas researches of employing satellite images to efficiently forecast and manage drought has achieved great outcomes.

Introduction Introduction
This research employ MODIS images to select sensitive thermal bands suitable for monitoring drought. And by using bands for the calculation of all kinds of vegetation indices, it is expected to find proper and practical indices for drought monitoring, which could be used for future management and determination of drought disaster.
This research employ MODIS images to select sensitive thermal bands suitable for monitoring drought. And by using bands for the calculation of all kinds of vegetation indices, it is expected to find proper and practical indices for drought monitoring, which could be used for future management and determination of drought disaster.

Using bands for the calculation of all kinds of vegetation indices, it is expected to find proper and practical indices for drought monitoring, which could be used for future management and determination of drought disaster.
Using bands for the calculation of all kinds of vegetation indices, it is expected to find proper and practical indices for drought monitoring, which could be used for future management and determination of drought disaster.

Research Data/Information and Methodology
Research Data/Information and Methodology
1. Study Area 1. Study Area
Include whole Taiwan area of 19 districts. Include whole Taiwan area of 19 districts.
2. Required Data/Information 2. Required Data/Information
Precipitation Data Precipitation Data Information concerned includes the records of all rainfall stations from the January of 1991 to the March of 2004 in the entire Taiwan area.
Information concerned includes the records of all rainfall stations from the January of 1991 to the March of 2004 in the entire Taiwan area.
Legend
Boundary
Rainfall station
LocationsLocations of All of All Taiwan Taiwan Rainfall Stations Rainfall Stations

MODIS Images MODIS Images
BandBand Width
(μm)Central Wavelen
gth (μm)Required NeΔT (K)
Primary use*
20 3.660- 3.841 3.7882 0.05 O,L
21 3.929- 3.989 3.9921 2.00 Fire,volcano
22 3.929- 3.989 3.9719 0.07 A,L
23 4.020- 4.080 4.0567 0.07 A,L
29 8.400- 8.700 8.5288 0.05 L
31 10.78- 11.28 11.0186 0.05 A,L
32 11.77- 12.27 12.0325 0.05 A,L* A:atmospheric studies, L:land studies, O:oceanstudies * A:atmospheric studies, L:land studies, O:oceanstudies
Thermal Bands of MODIS Image Thermal Bands of MODIS Image Seven MODIS Bands for Monitoring Earth’s Surface Seven MODIS Bands for Monitoring Earth’s Surface
By utilizing the information of surface regression through Kriging Model, our approach then can get drought indicator and drought amount of this area.
Two images of the dry season (January 25, 2004) and wet season (June 30, 2004) are accordingly chosen for further analysis.
By utilizing the information of surface regression through Kriging Model, our approach then can get drought indicator and drought amount of this area.
Two images of the dry season (January 25, 2004) and wet season (June 30, 2004) are accordingly chosen for further analysis.

Research MethodologyResearch Methodology
Select clear MODIS Select clear MODIS images without cloudimages without cloud
Select clear MODIS Select clear MODIS images without cloudimages without cloud
Rainfall of Rainfall of continuous 30 continuous 30
daysdays
Rainfall of Rainfall of continuous 30 continuous 30
daysdays
Data from Data from rainfall stationsrainfall stations
Data from Data from rainfall stationsrainfall stations
Cumulative Cumulative rainfall of allrainfall of all Cumulative Cumulative
rainfall of allrainfall of all
Drought Drought AmountAmount>130m>130m
mm
Drought Drought AmountAmount>130m>130m
mm
Th
resho
ld
Th
resho
ld
of E
ach
of E
ach
Co
un
ty and
C
ou
nty an
d
City
City
Th
resho
ld
Th
resho
ld
of E
ach
of E
ach
Co
un
ty and
C
ou
nty an
d
City
City
Climate Drought IndicesClimate Drought Indices Climate Drought IndicesClimate Drought Indices
NONO
YESYES
PrePreprocessingprocessing of MO of MODIS imagesDIS images
PrePreprocessingprocessing of MO of MODIS imagesDIS images
Use MODIS images of dry and wet Use MODIS images of dry and wet seasons to select thermal bands fseasons to select thermal bands f
or drought or drought monitormonitor
Use MODIS images of dry and wet Use MODIS images of dry and wet seasons to select thermal bands fseasons to select thermal bands f
or drought or drought monitormonitor
Locate sample grasslLocate sample grasslandand areas areas
Locate sample grasslLocate sample grasslandand areas areas
Choose index for Choose index for droughtdrought
Choose index for Choose index for droughtdrought
Specify Ranges of Dry Specify Ranges of Dry and Wet Seasons Using and Wet Seasons Using Climate Drought IndicesClimate Drought Indices
Specify Ranges of Dry Specify Ranges of Dry and Wet Seasons Using and Wet Seasons Using Climate Drought IndicesClimate Drought Indices
Calculate all indices& select Calculate all indices& select some for preliminary analysissome for preliminary analysis Calculate all indices& select Calculate all indices& select
some for preliminary analysissome for preliminary analysis

Discussions on Applying Drought Indices to Drought Monitor Discussions on Applying Drought Indices to Drought Monitor
Normalized Thermal Index (NTI) Normalized Thermal Index (NTI)
Normalized Difference Vegetation Index (NDVI) Normalized Difference Vegetation Index (NDVI)
bands) hermal()
bands) (thermal)(
t22or (Band21
22or Band21NTI
Band1Band2Band1and2
B
NDVI

Normalized Difference Water Index (NDWI) Normalized Difference Water Index (NDWI)
5
5B
BandBand2Bandand2
NDWI
Shortwave Infrared Water Stress Index (SIWSI) Shortwave Infrared Water Stress Index (SIWSI)
26
26B
BandBandBandand
SIWSI

Results and Discussion Results and Discussion
Characteristics of Taiwan Rainfall Data Characteristics of Taiwan Rainfall Data
Based on the rainfall data of 355 rainfall stations from 1992 to 2003, clearly shows different standards (levels) of different places in different periods. It also indicates the relativity of drought definition due to spatial and temporal factors.
Based on the rainfall data of 355 rainfall stations from 1992 to 2003, clearly shows different standards (levels) of different places in different periods. It also indicates the relativity of drought definition due to spatial and temporal factors.

Historical Curves of the first decile values of Cumulative
0
50
100
150
200
250
300
350
400
一月 三月 五月 七月 九月 十一月 月份
30(m
m)
連續日累積降雨量第ㄧ個十分位數
台北縣桃園縣新竹縣苗栗縣台中縣彰化縣南投縣雲林縣宜蘭縣花蓮縣台東縣嘉義縣台南縣高雄縣
Taipei
Taoyuan
Hsinchu
Miaoli
Taichung
Janghua
Nantou
Yunlin
Yilan
Hualien
Taitung
Chiayi
Tainan
Kaohsiung
January March May July September November Month
Precip
itation w
ithin 30 consecutive days
recorded by rainfall stations in
each county
in wh
ole Taiw
an Province

Application of MODIS Images to Select Thermal Bands for Drought Monitor
Application of MODIS Images to Select Thermal Bands for Drought Monitor
Original MODIS Image Original MODIS Image MODIS Images After Geometric CorrectionMODIS Images After
Geometric Correction
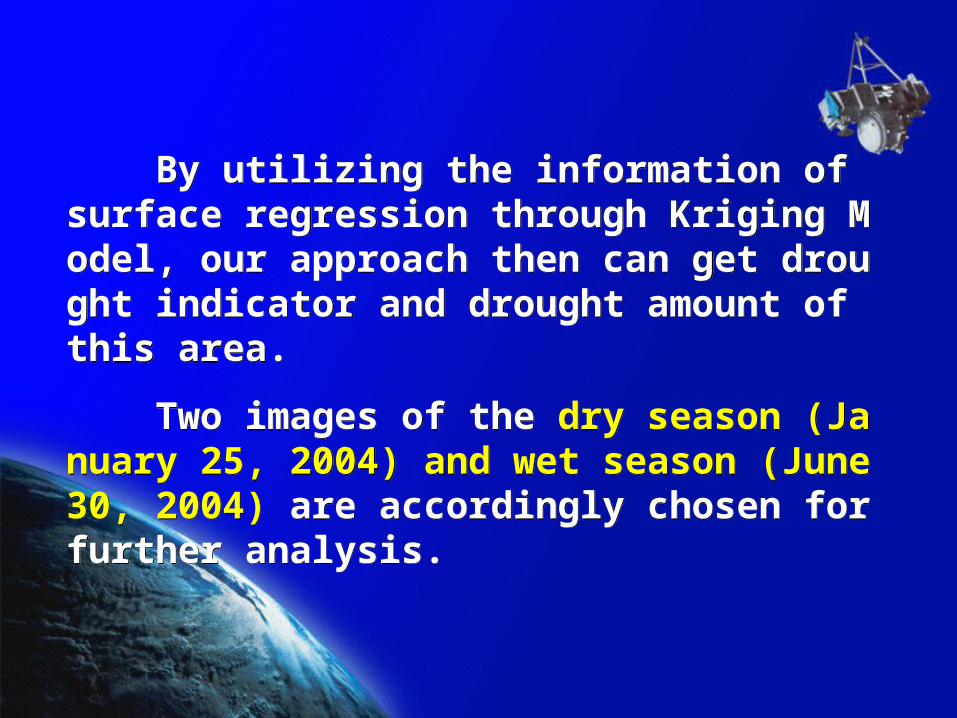
Extraction of Sample Sites of Grasslands Extraction of Sample Sites of Grasslands
SampleBoundary
Legend
From land-use maps we query all natural grasslands from the database of ArcGIS. And after removing those sample cloud hovering, we mark those sample sites on the extracted images of natural grasslands without cloud covered.
From land-use maps we query all natural grasslands from the database of ArcGIS. And after removing those sample cloud hovering, we mark those sample sites on the extracted images of natural grasslands without cloud covered.

Select Thermal Bands of MODIS images for Drought MonitorSelect Thermal Bands of MODIS images for Drought Monitor
Extracts data for the seven MODIS
bands, and compares the seven bands o
f dry season and wet season to find out
what are the real differences.
Extracts data for the seven MODIS
bands, and compares the seven bands o
f dry season and wet season to find out
what are the real differences.

0
0.1
0.2
0.3
0.4
0.5
0.6
0.7
0.8
0.9
1
B20(3.660-3.840)
B22(3.929-3.989)
B23(4.020-4.080)
B29(8.400-8.700)
B31(10.780-11.280)
B32(11.770-12.270)
B33(13.185-13.485)
0
0.1
0.2
0.3
0.4
0.5
0.6
0.7
0.8
0.9
1
B20(3.660-3.840) B22(3.929-3.989) B23(4.020-4.080) B29(8.400-8.700) B31(10.780-11.280) B32(11.770-12.270) B33(13.185-13.485)
Differences of Differences of Thermal Infrared Thermal Infrared Band Values of Band Values of MODIS Images of MODIS Images of Grasslands in Dry Grasslands in Dry and Wet Seasonsand Wet Seasons
Differences of Differences of Thermal Infrared Thermal Infrared Band Values of Band Values of MODIS Images of MODIS Images of Grasslands in Dry Grasslands in Dry and Wet Seasonsand Wet Seasons
Differences of Mean Differences of Mean Thermal Infrared Thermal Infrared Bands of Taiwan Bands of Taiwan Grasslands MODIS Grasslands MODIS Images in Dry and Images in Dry and Wet SeasonsWet Seasons
Differences of Mean Differences of Mean Thermal Infrared Thermal Infrared Bands of Taiwan Bands of Taiwan Grasslands MODIS Grasslands MODIS Images in Dry and Images in Dry and Wet SeasonsWet Seasons

The Calculation of Normalized TherThe Calculation of Normalized Thermal Indexmal Index (NTI) (NTI)
The Calculation of Normalized TherThe Calculation of Normalized Thermal Indexmal Index (NTI) (NTI)
NTINTI
Nu
mb
er of P
ixelsN
um
ber o
f Pixels
NTINTI
Nu
mb
er of P
ixelsN
um
ber o
f Pixels
STD
Mean
STD =
Mean=
NTINTI Image and Histogram In Image and Histogram In Dry SeasonDry Season
NTINTI Image and Histogram In Image and Histogram In Wet SeasonWet Season
The research done by Robert et al. (2002) about monitoring volcano indicates that NTI value are ranged between -0.850 ~ -0.950 due to the high surface temperature of the volcanic region.
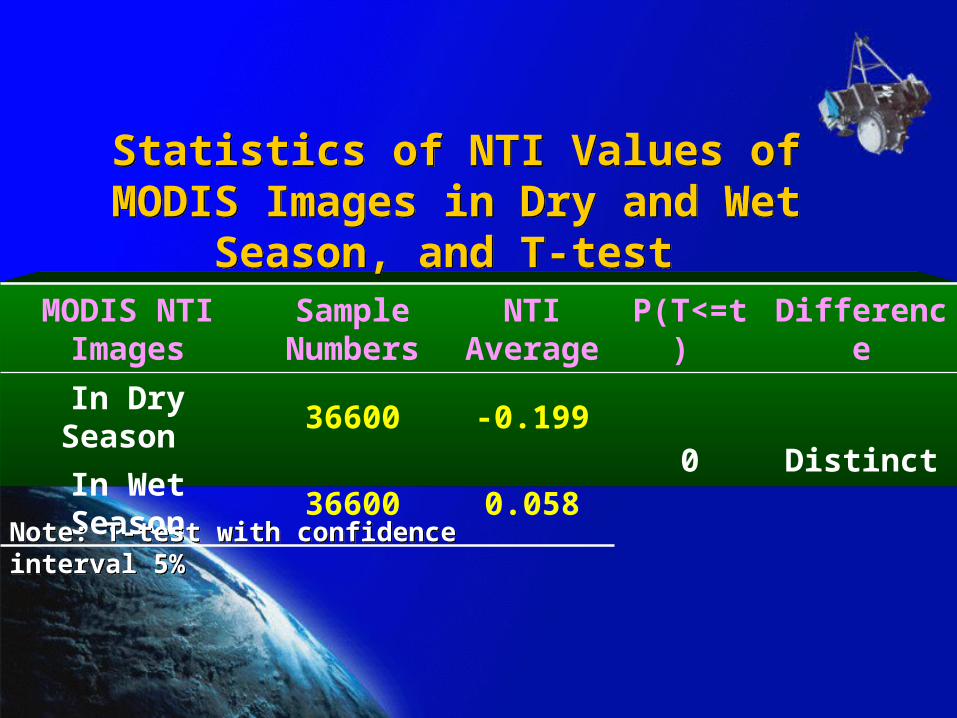
Statistics of NTI Values of MODIS Images in Dry and Wet Season, and T-test
Statistics of NTI Values of MODIS Images in Dry and Wet Season, and T-test
MODIS NTI Images
Sample Numbers
NTI Average
P(T<=t) Difference
In Dry Season 36600 -0.1990 Distinct
In Wet Season 36600 0.058
Note: T-test with confidence interval 5% Note: T-test with confidence interval 5%

The Calculation of Normalized DifferThe Calculation of Normalized Difference ence VegetationVegetation Index (NDVI Index (NDVI))
The Calculation of Normalized DifferThe Calculation of Normalized Difference ence VegetationVegetation Index (NDVI Index (NDVI))
MODIS NDVI Images in Dry Season
MODIS NDVI Images in Wet Season
NDVINDVI
Nu
mb
er of P
ixelsN
um
ber o
f Pixels
NDVINDVI
Nu
mb
er of P
ixelsN
um
ber o
f PixelsSTD=
Mean=STD=
Mean=

MODIS NDVI Images
SamplesNDVI
AverageP(T<=t) Difference
In Dry Season 78 0.882.84E-12 significant
In Wet Season 78 0.94
Statistics of NDVI Values of MODIS Images in Dry and Wet Season, and T-test
Statistics of NDVI Values of MODIS Images in Dry and Wet Season, and T-test
0
0.1
0.2
0.3
0.4
0.5
0.6
0.7
0.8
0.9
1
1 3 5 7 9 11 13 15 17 19 21 23 25 27 29 31 33 35 37 39 41 43 45 47 49 51 53 55 57 59 61 63 65 67 69 71 73 75 77
草生地樣本數
NDVI
乾季NDVI
濕季NDVI
Dry NDVI
Wet NDVI
Sample
NDVINDVI Differences Differences of of MODISMODIS Grassland Images Grassland Images in Dry and Wet in Dry and Wet SeasonsSeasons
NDVINDVI Differences Differences of of MODISMODIS Grassland Images Grassland Images in Dry and Wet in Dry and Wet SeasonsSeasons

The Calculation of Normalized The Calculation of Normalized Difference Water Index (NDWI)Difference Water Index (NDWI)The Calculation of Normalized The Calculation of Normalized Difference Water Index (NDWI)Difference Water Index (NDWI)
MODIS NDWI Images in Dry Season
MODIS NDWI Images in Wet Season
NDWINDWI
Nu
mb
er of P
ixelsN
um
ber o
f Pixels
NDWINDWI
Nu
mb
er of P
ixelsN
um
ber o
f Pixels STD
Mean
STD
Mean
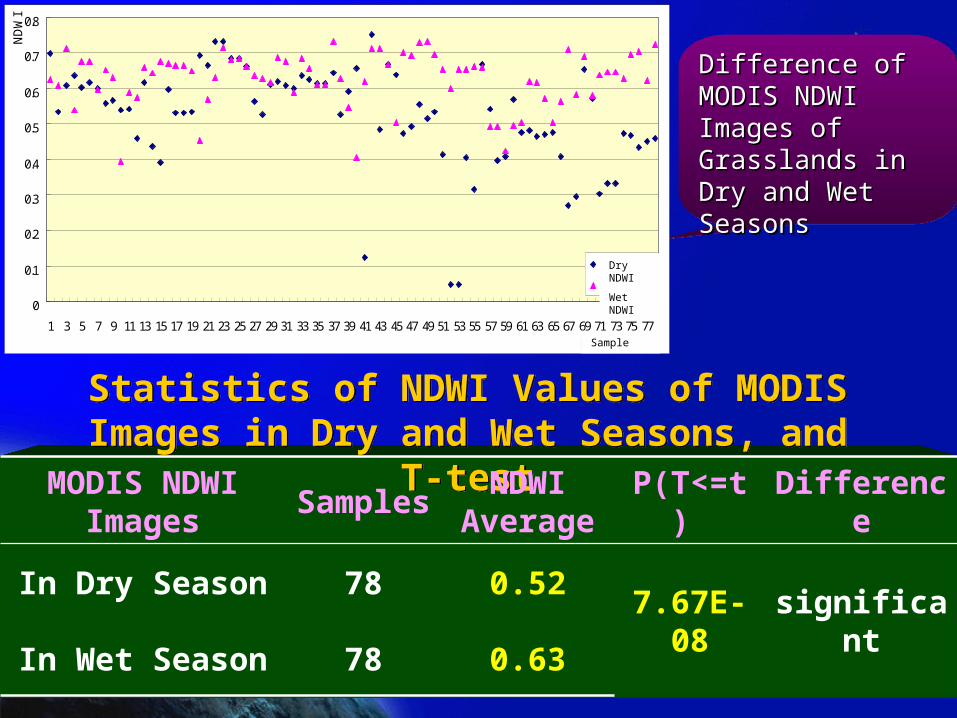
Statistics of NDWI Values of MODIS Images in Dry and Wet Seasons, and T-test
Statistics of NDWI Values of MODIS Images in Dry and Wet Seasons, and T-test
MODIS NDWI Images
Samples NDWI
AverageP(T<=t) Difference
In Dry Season 78 0.527.67E-08 significant
In Wet Season 78 0.63
Difference of Difference of MODIS NDWI MODIS NDWI Images of Images of Grasslands in Dry Grasslands in Dry and Wet Seasonsand Wet Seasons
Difference of Difference of MODIS NDWI MODIS NDWI Images of Images of Grasslands in Dry Grasslands in Dry and Wet Seasonsand Wet Seasons
0
0.1
0.2
0.3
0.4
0.5
0.6
0.7
0.8
1 3 5 7 9 11 13 15 17 19 21 23 25 27 29 31 33 35 37 39 41 43 45 47 49 51 53 55 57 59 61 63 65 67 69 71 73 75 77
草生地樣點數
ND
WI
NDWI乾季
NDWI濕季
Dry NDWI
Wet NDWI
Sample

Difference Between NDVI and NDWI of MODIS Images of Grasslands in Dry and Wet Seasons Difference Between NDVI and NDWI of MODIS Images of Grasslands in Dry and Wet Seasons

NDVI in Dry Season
NDVI in Wet Season
NDWI in Dry Season
NDWI in Wet Season
NDVI in DS 1.000
NDVI in WS 0.079 1.000
NDWI in DS 0.461** 0.045 1.000
NDWI in WS 0.197 0.799** 0.023 1.000
**: Distinct Correlation as distinction level if 0.01(**).
DS: Dry Season WS: Wet Season
**: Distinct Correlation as distinction level if 0.01(**).
DS: Dry Season WS: Wet Season
Correlation Matrix Between NDVI and NDWI in DS and WS
Correlation Matrix Between NDVI and NDWI in DS and WS

Calculation of Shortwave Infrared Calculation of Shortwave Infrared Water Index (SIWSIWater Index (SIWSI))
Calculation of Shortwave Infrared Calculation of Shortwave Infrared Water Index (SIWSIWater Index (SIWSI))
SIWSISIWSI
Nu
mb
er of P
ixelsN
um
ber o
f Pixels
MODIS SIWSI Images of Taiwan in Dry Season
MODIS SIWSI Image of Taiwan in Wet Season
SIWSISIWSI
Nu
mb
er of P
ixelsN
um
ber o
f Pixels STD
MeanMean

Statistics and T-test Table of SIWSI Values of grasslands in Dry and Wet Seasons (MODIS Images)
Statistics and T-test Table of SIWSI Values of grasslands in Dry and Wet Seasons (MODIS Images)
SIWSI Differences SIWSI Differences for Sample Sites of for Sample Sites of Grasslands in Dry Grasslands in Dry and Wet Seasons, and Wet Seasons, based on MODIS based on MODIS ImagesImages
SIWSI Differences SIWSI Differences for Sample Sites of for Sample Sites of Grasslands in Dry Grasslands in Dry and Wet Seasons, and Wet Seasons, based on MODIS based on MODIS ImagesImages
MODIS SIWSI Images
Number of Samples
SIWSI Mean P(T<=t) differences
Dry Season 78 -0.290.3214 Insignificant
Wet Season 78 -0.31

ConclusionConclusion
This research indicates MODIS images with 36 bands have substantial potential in drought sensing. It is hereby possible to replace the NOAA-AVHRR satellite images with MODIS images, for more precise image data/information.
This research indicates MODIS images with 36 bands have substantial potential in drought sensing. It is hereby possible to replace the NOAA-AVHRR satellite images with MODIS images, for more precise image data/information.

The MODIS Band 22 at the spatial resolution of 1,000 m is the most sensitive thermal bands to drought. And the NTI is the unique index of sensing thermal energy only available in MODIS images. Furthermore, this research hence utilizes the important wave bands which are chosen from the Band 22 to calculate NTI.
The MODIS Band 22 at the spatial resolution of 1,000 m is the most sensitive thermal bands to drought. And the NTI is the unique index of sensing thermal energy only available in MODIS images. Furthermore, this research hence utilizes the important wave bands which are chosen from the Band 22 to calculate NTI.

We can conclude that the NDVI, NDWI and NTI are sensitive to the monitoring of surface vegetation status, water content of vegetation and surface temperature respectively. As a result, they hereby have practical usages for drought forecast and monitoring.
We can conclude that the NDVI, NDWI and NTI are sensitive to the monitoring of surface vegetation status, water content of vegetation and surface temperature respectively. As a result, they hereby have practical usages for drought forecast and monitoring.

The EndThe End