Study of Transition Metal Phosphides as Anode Materials
220
Study of Transition Metal Phosphides as Anode Materials for Lithium-ion Batteries: Phase Transitions and the Role of the Anionic Network by Denise Carla Cordeiro da Silva Gosselink A thesis presented to the University of Waterloo in fulfillment of the thesis requirement for the degree of Doctor of Philosophy in Chemistry and Biochemistry Waterloo, Ontario, Canada, 2006 c Denise Carla Cordeiro da Silva Gosselink 2006
Transcript of Study of Transition Metal Phosphides as Anode Materials

Study of Transition Metal Phosphides as Anode
Materials for Lithium-ion Batteries: Phase
Transitions and the Role of the Anionic Network
by
Denise Carla Cordeiro da Silva Gosselink
A thesis
presented to the University of Waterloo
in fulfillment of the
thesis requirement for the degree of
Doctor of Philosophy
in
Chemistry and Biochemistry
Waterloo, Ontario, Canada, 2006
c© Denise Carla Cordeiro da Silva Gosselink 2006

Author’s Declaration for Electronic Submission of a Thesis
I hereby declare that I am the sole author of this thesis. This is a true copy of the
thesis, including any required final revisions, as accepted by my examiners.
I understand that my thesis may be made electronically available to the public.
Denise Carla Cordeiro da Silva Gosselink
ii

Abstract
This study highlights the importance of the anion in the electrochemical uptake
of lithium by metal phosphides. It is shown through a variety of in-situ and ex-situ
analytical techniques that the redox active centers in three different systems (MnP4,
FeP2, and CoP3) are not necessarily cationic but can rest almost entirely upon the
anionic network, thanks to the high degree of covalency of the metal-phosphorus bond
and strong P-character of the uppermost filled electronic bands in the phosphides.
The electrochemical mechanism responsible for reversible Li uptake depends on the
transition metal, whether a lithiated ternary phase exists in the phase diagram with
the same M:P stoichiometry as the binary phase, and on the structure of the starting
phase. When both binary and lithiated ternary phases of the transition metal exist,
as in the case of MnP4 and Li7MnP4, a semi-topotactic phase transformation between
binary and ternary phases occurs upon lithium uptake and removal. When only the
binary phase exists two different behaviours are observed. In the FeP2 system, lithium
uptake leads to the formation of an amorphous material in which short-range order
persists; removal of lithium reforms some the long-range order bonds. In the case of
CoP3, lithium uptake results in phase decomposition to metallic cobalt plus lithium
triphosphide, which becomes the active material for the subsequent cycles.
iii

Acknowledgments
This is perhaps the most difficult section that I have to write on this thesis. I do not
think I will forget the names of all the people that helped to get this done, but it will
be really tough to thank them enough. I will nonetheless try. . .
First and foremost, I want to thank my thesis supervisor, Dr. Linda Nazar, for
accepting me in her research, for the financial support, and the patience along the
years.
I must surely thank Dr. Mario Gauthier, Dr. Richard Oakley, and Dr. Jacek
Lipkowski for serving on my advisory committee and contributing valuable insights
to my thesis work. Special thanks go to Gauthier who, despite having to deal with
everything but polymers, spent so much time in the final revision of the thesis. My
gratitude also to Dr. Holger Kleike, Dr. Robert Hill, and Dr. Stephanie Brock, who
drove all the way from Wayne State University on that beautiful and hot summer
day to fulfil her duties, for serving on my defence committee.
Many thanks to my lab mates, past and present, for all the help and friendship
shared. Special thanks to Gillian Goward, Tracy Kerr, Olivier Crosnier, Joel
Gaubicher, Guillaume Dazzelle (Flower Power!), Fabien Duchene, Subramanian Herle,
Brian Ellis, Mike Makhnouk, Kevin Yin, Jesse Roussel, and Valerie Pralong. Thanks
also to Prof. Holger Kleinke an Prof. Tong Leung, and their respective research
groups, for teaching me so much of sample preparation and characterization, and for
iv

allowing me to use their equipments and lab space so many times.
I, or any experimental science graduate student for that matter, could never
have finished my work without the assistance of the ChemStores, ChemProjects, and
Science Shop crews. I will be forever in debt for your kindness and always promptness
to help. So here is to you: Scott Nicol, Lisa, Slavica, Lew, Sue, Ravi, Michael, Vidya,
Jamus, Stacey, Suehair, Ken, Phil, Chris, Harmen, Jacek, Kruno, Garnet, Reg, Mike,
Rick, Peter, John, and Andy. I also want to extend my gratitude to the ladies in
the office, Janice Campbell, Bev Wrinkler, and a VERY special thank-you to Cathy
van Esch. You girls rock! Thanks also to Jake Fisher, my boss sometimes, my good
friend always.
I have now the pleasure of acknowledging those who have provided me with the
personal foundation which has been so indispensable to my professional life. First
and foremost, I thank my parents, Angelina and Dilton (Mainha and Painho), for
providing the bedrock of support on which my life is built upon and the fortress
of never-ending love which has enabled me to weather all the storms of life. I also
gratefully acknowledge the influence of my parents-in-law, Robert and Mary Karen,
and of my big brothers, Scott and Dirk, and small-big-sister Daniela; I would not have
made it without your love and support. My appreciation to the Brazilian Community
in Waterloo-BRASWAT (good times will never be forgotten), especially to Carlson,
Daniela, and Carolina, more than friends you are family to me.
v

Thanks also to my church families, in Canada (Linconl Road Chapel, and Westhills
Mennonite) and in Brazil (Presbiterian Church of Bahia, specially SAF-Ba and UMP-
Ba), for their support through the difficult times, and for the constant prayers lifted
to our Lord’s Throne. To my very special sisters, Claudia Zini and Angelina So, my
love, my prayers, and a big hug. Let God bless you all.
My biggest personal thanks are to my husband, Ken, and my daughter, Marina,
for their unconditional love, patience, encouragement, and support. I can never thank
God enough for bringing you both into my life.
Finally, my utmost gratitude is to God, faithful and sovereign father. He has set
apart a special place just for me so how can I ever thank you enough. . .
Denise Carla Cordeiro da Silva Gosselink Waterloo, 2006.
vi

Dedicatory
To Mainha and Painho, my parents and friends, example of love and strength;
To Denilton, my brother (in memorian);
To Ken, my friend, my lover, my other half;
To Marina, our first daughter;
To the Gosselinks, my second family;
To God, my creator and saviour, all honor and praise!
vii

Contents
1 Introduction 1
1.1 Lithium-Ion Technology . . . . . . . . . . . . . . . . . . . . . . . . . 3
1.2 Thesis layout . . . . . . . . . . . . . . . . . . . . . . . . . . . . . . . 5
References 7
2 Theoretical Background 9
2.1 Fundamentals . . . . . . . . . . . . . . . . . . . . . . . . . . . . . . . 9
2.1.1 Cell Voltage . . . . . . . . . . . . . . . . . . . . . . . . . . . . 11
2.1.2 Cell Capacity . . . . . . . . . . . . . . . . . . . . . . . . . . . 15
2.1.3 Other Performance Parameters . . . . . . . . . . . . . . . . . 16
2.2 Battery Materials . . . . . . . . . . . . . . . . . . . . . . . . . . . . . 17
2.2.1 Cathodes . . . . . . . . . . . . . . . . . . . . . . . . . . . . . 18
viii

2.2.2 Electrolyte . . . . . . . . . . . . . . . . . . . . . . . . . . . . . 23
2.2.3 Anodes . . . . . . . . . . . . . . . . . . . . . . . . . . . . . . . 27
References 49
3 Techniques and Methodologies 61
3.1 Electrochemistry . . . . . . . . . . . . . . . . . . . . . . . . . . . . . 61
3.1.1 GITT . . . . . . . . . . . . . . . . . . . . . . . . . . . . . . . 61
3.1.2 PITT . . . . . . . . . . . . . . . . . . . . . . . . . . . . . . . 62
3.1.3 Experimental . . . . . . . . . . . . . . . . . . . . . . . . . . . 65
3.2 X-ray Diffraction . . . . . . . . . . . . . . . . . . . . . . . . . . . . . 67
3.2.1 Fundamentals . . . . . . . . . . . . . . . . . . . . . . . . . . . 67
3.2.2 Experimental . . . . . . . . . . . . . . . . . . . . . . . . . . . 78
3.3 Electron Microscopy . . . . . . . . . . . . . . . . . . . . . . . . . . . 78
3.3.1 Experimental . . . . . . . . . . . . . . . . . . . . . . . . . . . 82
3.4 X-ray Photoelectron Spectroscopy . . . . . . . . . . . . . . . . . . . . 83
3.4.1 Principles . . . . . . . . . . . . . . . . . . . . . . . . . . . . . 83
3.4.2 Experimental . . . . . . . . . . . . . . . . . . . . . . . . . . . 86
3.5 X-ray Absorption Spectroscopy . . . . . . . . . . . . . . . . . . . . . 87
ix

3.5.1 Experimental . . . . . . . . . . . . . . . . . . . . . . . . . . . 89
3.6 Magnetic Measurements . . . . . . . . . . . . . . . . . . . . . . . . . 90
3.6.1 SQUID . . . . . . . . . . . . . . . . . . . . . . . . . . . . . . . 91
3.6.2 Mossbauer Spectroscopy . . . . . . . . . . . . . . . . . . . . . 92
3.6.3 Experimental . . . . . . . . . . . . . . . . . . . . . . . . . . . 96
References 97
4 Manganese Phosphide System 99
4.1 Introduction . . . . . . . . . . . . . . . . . . . . . . . . . . . . . . . . 99
4.1.1 Structure of MnP4 and Li7MnP4 . . . . . . . . . . . . . . . . . 100
4.2 Experimental . . . . . . . . . . . . . . . . . . . . . . . . . . . . . . . 102
4.2.1 Synthesis of MnP4 . . . . . . . . . . . . . . . . . . . . . . . . 102
4.2.2 Synthesis of Li7MnP4 . . . . . . . . . . . . . . . . . . . . . . . 103
4.3 Characterization and Properties of MnP4 and Li7MnP4 . . . . . . . . 104
4.3.1 Structure and Composition of the Materials . . . . . . . . . . 104
4.3.2 Electrochemical Properties of Manganese Phosphide Systems . 110
4.3.3 Ex-situ Analysis of Cycled MnP4 and Li7MnP4 . . . . . . . . 116
4.3.4 Proposed Mechanism for Phase Transformation . . . . . . . . 122
x

4.4 Conclusions . . . . . . . . . . . . . . . . . . . . . . . . . . . . . . . . 126
4.4.1 Comparison of Results . . . . . . . . . . . . . . . . . . . . . . 126
References 129
5 Iron Phosphide System 132
5.1 Introduction . . . . . . . . . . . . . . . . . . . . . . . . . . . . . . . . 132
5.2 Experimental . . . . . . . . . . . . . . . . . . . . . . . . . . . . . . . 135
5.2.1 Synthesis of FeP2 Using a Flux of Tin . . . . . . . . . . . . . 135
5.2.2 Synthesis of FeP2 Using Iodine Vapour Transport . . . . . . . 135
5.3 Characterization and Properties of FeP2 . . . . . . . . . . . . . . . . 136
5.3.1 Structure and Composition of the Materials . . . . . . . . . . 136
5.3.2 Electrochemical Studies of FeP2 . . . . . . . . . . . . . . . . . 141
5.3.3 Ex-situ Analysis of Cycled FeP2 . . . . . . . . . . . . . . . . . 148
5.4 Conclusions . . . . . . . . . . . . . . . . . . . . . . . . . . . . . . . . 168
References 171
6 Cobalt Phosphide System 176
6.1 Introduction . . . . . . . . . . . . . . . . . . . . . . . . . . . . . . . . 176
xi

6.2 Experimental . . . . . . . . . . . . . . . . . . . . . . . . . . . . . . . 178
6.2.1 Synthesis of CoP3 . . . . . . . . . . . . . . . . . . . . . . . . . 178
6.2.2 Synthesis of LiP . . . . . . . . . . . . . . . . . . . . . . . . . . 179
6.3 Characterization and Properties CoP3 . . . . . . . . . . . . . . . . . . 179
6.3.1 Structure and Composition of the Materials . . . . . . . . . . 179
6.3.2 Electrochemical Studies of CoP3 . . . . . . . . . . . . . . . . . 183
6.3.3 Ex-situ Analysis of Cycled CoP3 . . . . . . . . . . . . . . . . . 186
6.3.4 Proposed Mechanism . . . . . . . . . . . . . . . . . . . . . . . 194
6.4 Conclusions . . . . . . . . . . . . . . . . . . . . . . . . . . . . . . . . 194
References 196
7 Conclusions 199
7.1 Summary . . . . . . . . . . . . . . . . . . . . . . . . . . . . . . . . . 199
7.2 Future Work . . . . . . . . . . . . . . . . . . . . . . . . . . . . . . . . 202
xii

List of Tables
1.1 Characteristics of some battery systems used commercially . . . . . . 2
2.1 Structure and properties of some solvents used for lithium battery
electrolytes. . . . . . . . . . . . . . . . . . . . . . . . . . . . . . . . . 25
2.2 Electrochemical properties of some Li alloys. . . . . . . . . . . . . . . 32
3.1 Types of photoelectron spectroscopy according to photon source. . . . 86
4.1 Parameters for synthesis of MnP4. . . . . . . . . . . . . . . . . . . . . 103
4.2 Crystallite size of ball-milled Li7MnP4 samples determined by Scherer
equation. . . . . . . . . . . . . . . . . . . . . . . . . . . . . . . . . . . 108
5.1 Reaction parameters for the preparation of FeP2 by I2 vapor transport. 136
5.2 Results of the LeBail fit for FeP2 XRD data in the space group Pmnn. 140
5.3 Matrix for the Factorial Design of Experiments. . . . . . . . . . . . . 145
xiii

5.4 Responses of the DOE for electrochemical performance of FeP2. . . . 146
5.5 Multiple regression and analysis of variance results for D1 and RC1. . 149
5.6 Summary of EXAFS data at the Fe K-edge for the first shell of FeP2. 155
5.7 Results of Curie-Weiss and Langevin fitting of FeP2 magnetization data.162
5.8 Magnetic particle diameter calculated for FeP2 samples. . . . . . . . . 164
5.9 Mossbauer parameters calculated for FeP2 samples. . . . . . . . . . . 167
6.1 Results of the CoP3 XRD pattern Rietveld refinement in the space
group Im3. . . . . . . . . . . . . . . . . . . . . . . . . . . . . . . . . 182
6.2 SAED pattern indexing results for pristine and cycled CoP3. . . . . . 191
xiv

List of Figures
1.1 Schematic representation of a lithium-ion battery. . . . . . . . . . . . 5
2.1 Binding energy scale based on Li/Li+ pair. . . . . . . . . . . . . . . . 13
2.2 Reversibility and cycleability of an electrochemical cell. . . . . . . . . 17
2.3 Electrolyte stability window. . . . . . . . . . . . . . . . . . . . . . . . 24
2.4 Lithium-graphite intercalation compounds . . . . . . . . . . . . . . . 29
2.5 Phase transformation in η-Cu6Sn5 upon lithiation. . . . . . . . . . . . 33
2.6 Schematic representation of the DOS for oxides, nitrides, and phosphides. 39
2.7 Proposed mechanism for reversible reaction of Li with Zn3P2 . . . . . 46
3.1 Typical chronoamperograms of diffusion and nucleation controlled
biphasic electrochemical processes . . . . . . . . . . . . . . . . . . . . 65
3.2 Schematic representation of a Swagelok type cell. . . . . . . . . . . . 66
3.3 Bragg’s law of diffraction from parallel planes . . . . . . . . . . . . . 68
xv

3.4 Schematic representation of XRD sample holder for air-sensitive material 78
3.5 Schematic representation of Scanning and Transmission Electron
Microscopy. . . . . . . . . . . . . . . . . . . . . . . . . . . . . . . . . 79
3.6 Schematic representation of the photo-emission process . . . . . . . . 83
3.7 Schematic representation of XAS process . . . . . . . . . . . . . . . . 88
3.8 Schematic representation of Mossbauer effect and spectroscopy . . . . 92
4.1 MnP4 structures . . . . . . . . . . . . . . . . . . . . . . . . . . . . . . 101
4.2 Li7MnP4 structure . . . . . . . . . . . . . . . . . . . . . . . . . . . . 101
4.3 XRD patterns of MnP4 variants. . . . . . . . . . . . . . . . . . . . . . 105
4.4 XRD patterns of Li7MnP4. . . . . . . . . . . . . . . . . . . . . . . . . 107
4.5 XRD and SEM of ball-milled Li7MnP4. . . . . . . . . . . . . . . . . . 109
4.6 Galvanostatic profiles for MnP4 . . . . . . . . . . . . . . . . . . . . . 110
4.7 GITT profiles for 8 -MnP4 . . . . . . . . . . . . . . . . . . . . . . . . 112
4.8 Li7MnP4 galvanostatic profile . . . . . . . . . . . . . . . . . . . . . . 113
4.9 MnP4 and Li7MnP4 chronoamperograms . . . . . . . . . . . . . . . . 114
4.10 Cycling performance of 8 -MnP4 and Li7MnP4. . . . . . . . . . . . . . 115
4.11 Cycling performance of Li7MnP4. . . . . . . . . . . . . . . . . . . . . 117
xvi

4.12 Ex-situ XRD patterns of cycled MnP4 and Li7MnP4 samples. . . . . . 119
4.13 Ex-situ SEM micrographies of cycled MnP4 and Li7MnP4 electrodes. 121
4.14 Ex-situ TEM of manganese phosphides electrodes at different cycling
stages. . . . . . . . . . . . . . . . . . . . . . . . . . . . . . . . . . . . 123
4.15 Schematic of the mechanism for phase transformation between MnP4
and Li7MnP4 . . . . . . . . . . . . . . . . . . . . . . . . . . . . . . . 125
5.1 Polyhedral representation of the FeP2 structure . . . . . . . . . . . . 134
5.2 LeBail refinement of XRD pattern of FeP2 obtained by the tin flux
technique . . . . . . . . . . . . . . . . . . . . . . . . . . . . . . . . . 137
5.3 Ex-situ XRD pattern of different FeP2/I2 samples . . . . . . . . . . . 139
5.4 XRD profiles from full pattern matching of FeP2/I2 . . . . . . . . . . 141
5.5 Electrochemical cycling performance of FeP2 . . . . . . . . . . . . . . 143
5.6 Adequacy of models obtained for the electrochemical performance of
FeP2 during the first cycle. . . . . . . . . . . . . . . . . . . . . . . . . 147
5.7 Ex-situ XRD patterns of cycled FeP2 samples . . . . . . . . . . . . . 150
5.8 Ex-situ Fe K-edge X-Ray Absorption spectra of FeP2 samples . . . . 152
5.9 Pseudo-RDF obtained from the EXAFS signal of FeP2 samples. . . . 154
xvii

5.10 Field-dependent magnetization and temperature-dependent
suscepitibility curves of pristine FeP2. . . . . . . . . . . . . . . . . . . 157
5.11 Temperature dependence of magnetization in ZFC and FC modes for
FeP2 samples. . . . . . . . . . . . . . . . . . . . . . . . . . . . . . . . 159
5.12 Ex-situ magnetization curves of discharged FeP2. . . . . . . . . . . . 161
5.13 Ex-situ magnetization curves of charged FeP2. . . . . . . . . . . . . . 163
5.14 Mossbauer spectra for FeP2 samples. . . . . . . . . . . . . . . . . . . 166
5.15 Comparison between the Li3P and FeP2 structures. . . . . . . . . . . 169
6.1 Crystal structure of CoP3 . . . . . . . . . . . . . . . . . . . . . . . . 178
6.2 CoP3 and CoP powder XRD pattern. . . . . . . . . . . . . . . . . . . 181
6.3 Galvanostatic profile of CoP3. . . . . . . . . . . . . . . . . . . . . . . 184
6.4 First cycle PITT profile of CoP3 at C/5. . . . . . . . . . . . . . . . . 185
6.5 Ex-situ and in-situ XRD patterns of cycled CoP3. . . . . . . . . . . . 187
6.6 Ex-situ TEM micrographs and SAED patterns of pristine and cycled
CoP3. . . . . . . . . . . . . . . . . . . . . . . . . . . . . . . . . . . . 190
6.7 Ex-situ XPS spectra of cycled CoP3. . . . . . . . . . . . . . . . . . . 193
xviii

Chapter 1
Introduction
Batteries are energy storage devices that deliver electrical current produced by an
electrochemical reaction. They are divided in two main groups, namely primary
and secondary, according to their ability of being recharged and reused. Secondary
batteries, also called rechargeable batteries, are used on a daily basis in a variety
of consumer, industrial, and military applications. The tendency towards small
size portable devices, especially the 3C’s – camcorders, cellular phones and portable
computers, demand lightweight, small volume, high energy-density batteries.1,2 An
alternative power source for transportation also garners great current interest;
combustion engines emit greenhouse gases that have enormous effects on the
global climate. The recently developed hybrid electric vehicle (HEV), which uses
rechargeable batteries in conjunction with small, energy efficient engines, represents a
1

Chapter 1. Introduction 2
step towards the solution of the problem.3,4 Size matters even more when considering
medical applications such as pacemakers and artificial organs and limbs.5
Rechargeable batteries are usually named according the chemical materials that
form their individual parts. A complete description of the different battery systems
available in the market is outside of the scope of this work – extensive reviews of
the topic are available in the literature.1,2,6 Table 1.1 briefly summarizes some basic
characteristics of secondary batteries systems available commercially, showing the
overall superior performance of Li-ion cells.
Table 1.1: Characteristics of some battery systems used commercially.7
Battery Type Pb-acid Ni-Cd Ni-MH Li-ion
Nominal Voltage, V 2 1.25 1.25 3.6
Specific Energy, Wh/kg 30–50 45–80 60–120 110–160
Energy Density, Wh/l 70 100 245 440
Cycle Lifea 200–300 1500 300–500 500–1000
Self-discharge timeb, (months) 5 20 30 10
Operating Temperaturec, ◦C -20–60 -40–60 -20–60C -40–70C
a 80% of initial capacityb At room temperaturec Discharge
Chapter 1. Introduction 3
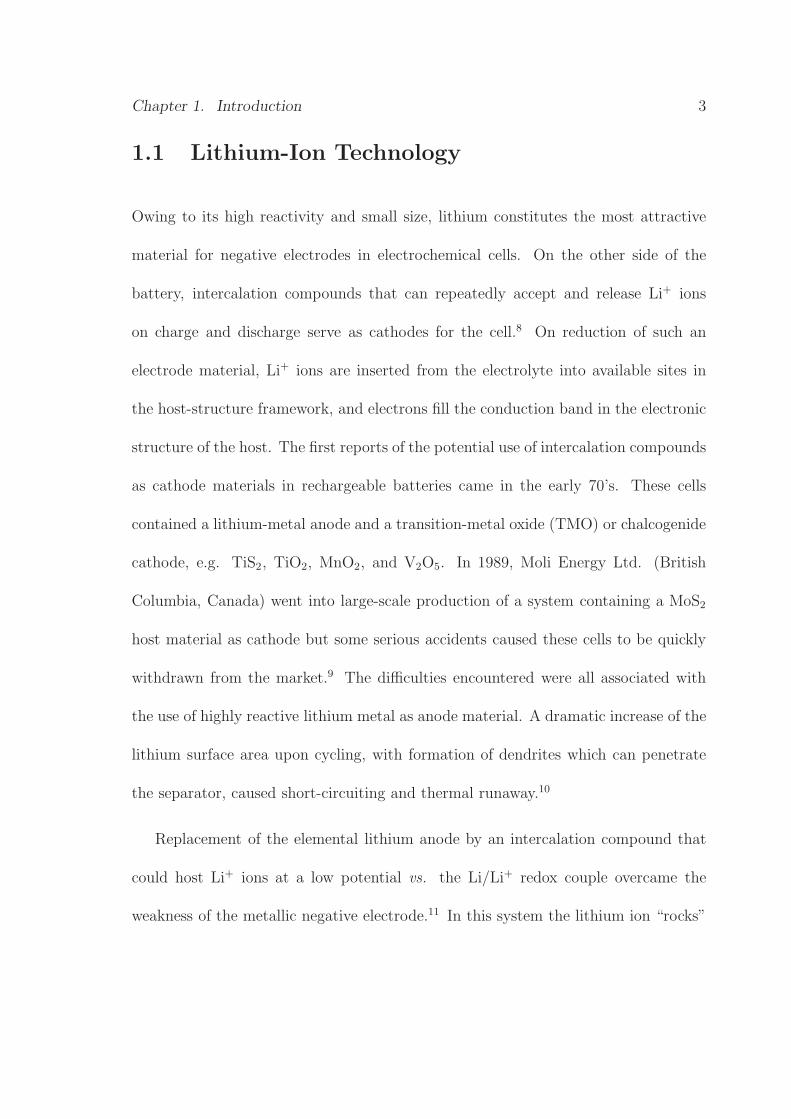
1.1 Lithium-Ion Technology
Owing to its high reactivity and small size, lithium constitutes the most attractive
material for negative electrodes in electrochemical cells. On the other side of the
battery, intercalation compounds that can repeatedly accept and release Li+ ions
on charge and discharge serve as cathodes for the cell.8 On reduction of such an
electrode material, Li+ ions are inserted from the electrolyte into available sites in
the host-structure framework, and electrons fill the conduction band in the electronic
structure of the host. The first reports of the potential use of intercalation compounds
as cathode materials in rechargeable batteries came in the early 70’s. These cells
contained a lithium-metal anode and a transition-metal oxide (TMO) or chalcogenide
cathode, e.g. TiS2, TiO2, MnO2, and V2O5. In 1989, Moli Energy Ltd. (British
Columbia, Canada) went into large-scale production of a system containing a MoS2
host material as cathode but some serious accidents caused these cells to be quickly
withdrawn from the market.9 The difficulties encountered were all associated with
the use of highly reactive lithium metal as anode material. A dramatic increase of the
lithium surface area upon cycling, with formation of dendrites which can penetrate
the separator, caused short-circuiting and thermal runaway.10
Replacement of the elemental lithium anode by an intercalation compound that
could host Li+ ions at a low potential vs. the Li/Li+ redox couple overcame the
weakness of the metallic negative electrode.11 In this system the lithium ion “rocks”

Chapter 1. Introduction 4
back and forth as it intercalates in either electrodes and the lack of metallic lithium
plating avoids safety problems. During the discharge of this battery, referred to as
swing, rocking chair, lithium-ion, or simply Li-ion battery (Figure 1.1), Li+ ions
move out of the anode and into the cathode. The driving force for the process is
the difference in the electro-chemical potential experienced by the lithium ion in the
anode and the cathode material. Since the electrolyte is an ionic but not an electronic
conductor the electrons are forced to travel from the anode to cathode externally.
Finally the electrons and Li+ ions meet again in the cathode. Charging the battery
reverses this procedure, the driving force now coming from the applied voltage which
is higher than the difference in electro-chemical potential between anode and cathode.
The absence of metallic lithium immensely improves the safety of the cells. The
Li+ ions are usually supplied by some lithium-containing TMO cathode material
(LiMOx), such as LiCoO2, LiNiO2, or LiMn2O4. Carbonaceous materials make the
most appropriate anodes. In 1991, Sony made the first commercial Li-ion battery
and, today, more than ten companies produce these batteries.13,14 Nonetheless, these
batteries still have serious drawbacks and the effects of prolonged cycling and/or
storage (e.g. capacity loss, poor cycleability, power fade, and self discharge) limit their
theoretical or initially excellent performance.15–17 In addition, the new technologies
demand smaller, more endurable, improved battery materials.

Chapter 1. Introduction 5
Figure 1.1: Schematic representation of a lithium-ion battery.12
1.2 Thesis layout
This thesis reports of new anode materials for Li-ion batteries, more specifically,
transition metal phosphides. Three compounds, namely MnP4, FeP2 and CoP3, were
studied in this context. The next chapter describes some theoretical electrochemistry
concepts and briefly reviews the state of the art in the research on Li-ion batteries.
Chapter 3 provides theoretical input on the techniques and methodologies employed
in the investigations. Chapters 4, 5, and 6 report on the electrochemical performance

Chapter 1. Introduction 6
and the mechanism for lithium uptake/extraction by the different compounds.
Finally, Chapter 7 summarizes the conclusions.

References
[1] Manthiran, A. J. Miner. 1997, March, 43.
[2] Jacoby, M. Chem. Eng. News 1998, August, 37.
[3] Arai, J.; Muranaka, Y.; Koseki, M. Hitachi Rev. 1900, 53, 182.
[4] Takeda, N.; Imai, S.; Horii, Y.; Yoshida, H. Tech. Rev. 2003, 15, 68.
[5] Bruce, P. G. Science 2003, 350, 1645.
[6] Nishi, Y. J. Power Sources 2001, 100, 101.
[7] Linden, D.; Reddy, T. Handbook of Bateries; McGraw Hill: New York, 3rd. ed.;
2002 Chapter 2.
[8] Winter, M.; Besenhard, J. O.; Spahr, M.; Novak, P. Adv. Mater. 1998, 10,
725.
[9] 1989.
7

References 8
[10] Dahn, J.; Sleigh, A.; Shi, H.; Way, B.; Weydanz, W.; Reimers, J.; Zhong, Q.;
von Sacken, U. Carbons and Graphites as Substitutes for the Lithium Anode. In
Lithium Batteries - New Materials, Developments and Perspectives ; Pistoia, G.,
Ed.; Elsevier: Amsterdam, 1994.
[11] Fong, R.; von Sacken, U.; DahnSig, J. J. Electrochem. Soc. 1990, 137, 2209.
[12] http : //www.tech− libat.com.
[13] Sekai, K.; Azuma, H.; Omaru, A.; Fujita, S.; Imoto, H.; Endo, T.;
Yamaura, K.; Nishi, Y.; Mashiko, S.; Yokogawa, M. 1993, 43, 241.
[14] Moshtev, R.; Johnson, B. J. Power Sources 2000, 91, 86.
[15] Pistoia, G.; Antonini, A.; Rosati, R.; Zane, D. Electrochim. Acta 1996, 41,
2683.
[16] Arora, P.; White, R.; Doyle, M. J. Electrochem. Soc. 1900, .
[17] Amatucci, G.; Schmutz, C.; Blyr, A.; Sigala, A.; Gozdz, A.; Larcher, D.;
Tarascon, J.-M. J. Power Sources 1997, 69, 11.

Chapter 2
Theoretical Background
2.1 Fundamentals
Electrochemical cells are ordinarily used to study reactions involving ions in solution
and solids. They are formed by a positive and a negative electrode (cathode
and anode, respectively) which are kept in contact by a suitable ionic conducting
electrolyte. The electrodes are separated by an ionically permeable and electronically
insulating separator to prevent self discharge of the cell; the electrical contact is
thus made by an external circuit. Depending on the spontaneity of the reaction, an
electrochemical cell is defined as galvanic or electrolytic. The spontaneous chemical
reactions that occur in the electrodes of galvanic cells generate an electrical current
(power out) whereas in electrolytic cells, the reactions occur at the expense of an
9

Chapter 2. Theoretical Background 10
externally applied current (power in). The charge and discharge processes in a typical
secondary lithium battery (with lithium initially stored in the crystal structure of the
host material that forms the cathode, Figure 1.1) can thus be classified respectively
as electrolytic and galvanic.
Electrochemical systems store charge via four basic mechanisms:1
Double-layer: small amounts of charge (≈15 µF/cm2) are stored in the electrical
double-layer within the electrolyte, in the vicinity of the electrode/electrolyte
interface. The amount of stored energy is a linear function of the applied voltage.
Adsorption: charge storage results from the electrodeposition of active species on
specific crystallographic sites partially covering the electrode surface at lower
potentials than those needed for bulk deposition. This mechanism leads to an
“adsorption pseudo-capacitance” in the range of 200−400 µF/cm2 of interface.
Insertion: electroactive species diffuse and insert into the bulk of an electrode
forming a solid solution, allowing for the storage of high amounts of charge since
the latter is proportional to the amount of species inserted. The electrochemical
potential of the guest species in the solid determines the electrode potential. For
random solid solutions, the major contributions to the potential are from the
Fermi level of the degenerate electron orbitals and the entropy and enthalpy of
the guest species.
Reconstruction: faradic deposition promotes phase transformation reactions in

Chapter 2. Theoretical Background 11
some battery systems, which results in an open-circuit electrode potential
independent of the state of charge. The amount of charge and reaction kinetic
depends on the specific characteristics of the system.
The basic characteristic of an electroactive intercalation compound is the
thermodynamic voltage-composition relation, which corresponds to the equilibrium
phase diagram of the system. This relation depends on the changes in electronic
and structural properties upon intercalation/deintercalation. Basically, a continuous
dependence of the potential vs. composition corresponds to a solid-solution single-
phase domain, whereas a potential plateau corresponds to a two-phase domain.2
Other properties of interest, particularly in view of possible applications as active
electrode in a battery are the potential window of electrochemical stability, kinetics
and reversibility of the intercalation process.
2.1.1 Cell Voltage
During the cell discharge the flow of negative charge into the cathode is compensated
by a migration of positive alkali metal ions from the electrolyte into the host structure.
At the anode the removal of electrons is compensated by a release of cations to the
electrolyte. The sum of the two electrochemical half-reactions is the intercalation
reaction. The spontaneity of the galvanic reaction results from the difference between
Chapter 2. Theoretical Background 12
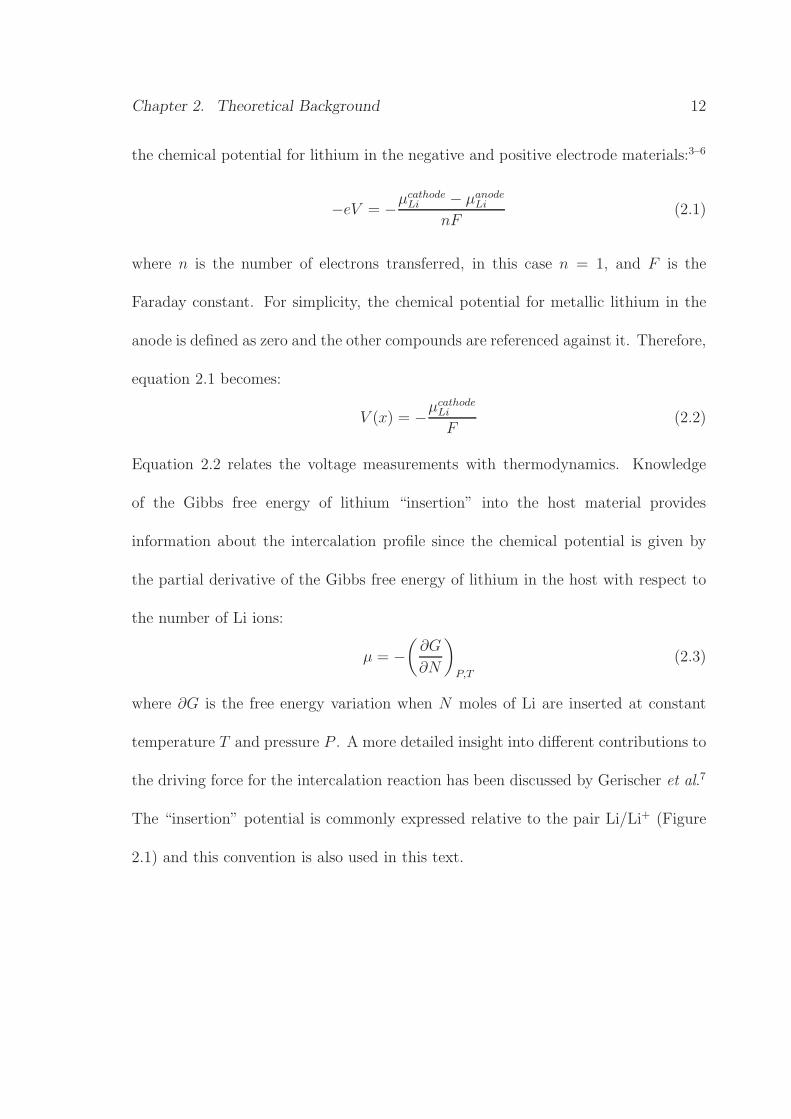
the chemical potential for lithium in the negative and positive electrode materials:3–6
−eV = −µcathode
Li − µanodeLi
nF(2.1)
where n is the number of electrons transferred, in this case n = 1, and F is the
Faraday constant. For simplicity, the chemical potential for metallic lithium in the
anode is defined as zero and the other compounds are referenced against it. Therefore,
equation 2.1 becomes:
V (x) = −µcathode
Li
F(2.2)
Equation 2.2 relates the voltage measurements with thermodynamics. Knowledge
of the Gibbs free energy of lithium “insertion” into the host material provides
information about the intercalation profile since the chemical potential is given by
the partial derivative of the Gibbs free energy of lithium in the host with respect to
the number of Li ions:
µ = −
(
∂G
∂N
)
P,T
(2.3)
where ∂G is the free energy variation when N moles of Li are inserted at constant
temperature T and pressure P . A more detailed insight into different contributions to
the driving force for the intercalation reaction has been discussed by Gerischer et al.7
The “insertion” potential is commonly expressed relative to the pair Li/Li+ (Figure
2.1) and this convention is also used in this text.

Chapter 2. Theoretical Background 13
Figure 2.1: Binding energy scale based on Li/Li+ pair. Voltage of the Standard Hydrogen
Electrode (SHE) shown for comparison.
Polarization
Polarization is the departure of working potential of an electrode from its nernstian
value upon the application of a current due to local inhomogeneities. The ionic
motion is driven by chemical diffusion which in turn depends on the difference in
chemical potentials of the same ions between bulk and surface of the electrode. During
measurements, the applied electrical current determines the concentration gradient
necessary to establish the appropriate diffusional flux. Since the cell voltage measures
the chemical potential of the active species at the electrode surface, measured and

Chapter 2. Theoretical Background 14
equilibrium voltage differ.
In binary processes, voltage polarization is also related to the extra energy needed
to force the electrode reaction to proceed at a required rate (or its equivalent current
density). Higher current densities induce larger polarizations which also depend
on the “inherent rate” of the electrode reaction. Even for the simplest case, the
polarization is the sum of different contributions of three processes which cause
changes in potential arising from current flowing across a metal-solution interface:
Activation: the change in potential required just to make the reaction go faster. It
can be analyzed in terms of the energy barrier between the reactant and the
product states giving rise to a relationship between current and potential. A
reaction for which activation polarization dominates is referred to as activation
controlled.
Concentration: the rate of reactions involving species which participate as
reactants in the rate-determining step depends on their concentration. As the
reaction consumes the active species, a greater change in potential is required to
maintain the current. A reaction for which concentration polarization dominates
is referred to as mass-transport or diffusion controlled.
Resistance: solutions of electrolytes, particularly dilute ones, generally have a
rather poor conductivity compared to metals. Solutions with high electrical
resistance produce a potential difference between the anodic and cathodic sites,

Chapter 2. Theoretical Background 15
which is known as resistance polarization. If resistance polarization dominates
a reaction, it is referred as resistance or IR controlled (the latter term arises
from Ohm’s Law, V = IR).
2.1.2 Cell Capacity
Faraday’s first law establishes that the mass of anodic material of a galvanic cell
depends on the current I passing by the system according to:8
m =MIδt
xF(2.4)
with m the mass of active material, M the molar (or formula) mass, x the number of
electrons exchanged, δt the elapsed time, and F Faraday’s constant. The capacity Q
of a cell is given by:
Q = Iδt (2.5)
So, rearranging Equation 2.4 one obtains the expression for gravimetric capacity, Qm:
Qm =Iδt
m=
xF
M(2.6)
which, multiplied by the density d of the active material, becomes:
Qv = Qm.d (2.7)
Equation 2.6 defines the Gravimetric Capacity of a cell, the amount of electric
charge exchanged in 1 hour per unit mass of material. The Volumetric Capacity
Chapter 2. Theoretical Background 16
(Equation 2.7), is of extreme importance for industrial purposes since it determines
the limit for miniaturization. This study rates the performance of the materials in
terms of gravimetric capacity.
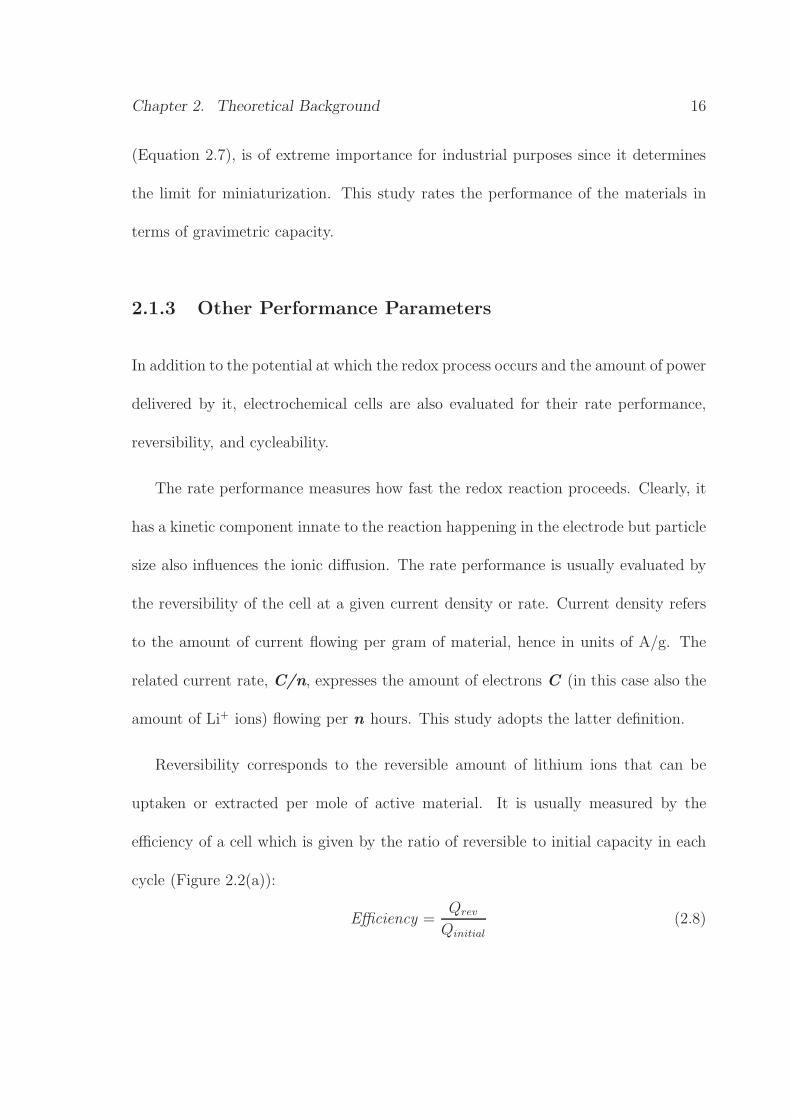
2.1.3 Other Performance Parameters
In addition to the potential at which the redox process occurs and the amount of power
delivered by it, electrochemical cells are also evaluated for their rate performance,
reversibility, and cycleability.
The rate performance measures how fast the redox reaction proceeds. Clearly, it
has a kinetic component innate to the reaction happening in the electrode but particle
size also influences the ionic diffusion. The rate performance is usually evaluated by
the reversibility of the cell at a given current density or rate. Current density refers
to the amount of current flowing per gram of material, hence in units of A/g. The
related current rate, C/n, expresses the amount of electrons C (in this case also the
amount of Li+ ions) flowing per n hours. This study adopts the latter definition.
Reversibility corresponds to the reversible amount of lithium ions that can be
uptaken or extracted per mole of active material. It is usually measured by the
efficiency of a cell which is given by the ratio of reversible to initial capacity in each
cycle (Figure 2.2(a)):
Efficiency =Qrev
Qinitial
(2.8)

Chapter 2. Theoretical Background 17
Vo
lts
vsL
i/L
i+
Specific Capacity (mAh/g)
(a)
0 20 40 60 80 100
Rev
ers
ible
Ca
pa
city
Cycle Number
(b)
Figure 2.2: Schematic representation of (a) reversibility and (b) cycleability of an
electrochemical cell.
Related to the reversibility, the cycleability of a cell depends on the stability of
the active material towards repeated cycles of lithium insertion and de-insertion. A
cell with good cycleability maintains good reversibility upon charge and discharge
exhibiting minute reduction of reversible capacity (Figure 2.2(b)). Both the achieved
capacity and cycleability of a cell depend strongly on the cycling rate, morphology
and composition of the electrode, and on the active material particle size.
2.2 Battery Materials
Electrode materials for Li-ion batteries must comply with some important criteria
established by the equations presented in the previous section: (i) high charge

Chapter 2. Theoretical Background 18
density, (ii) good electronic and ionic conductivity, (iii) low formula weight, (iv) fast
kinetics of de-intercalation (v) reversibility, (vi) adequate oxidation potential (high
for cathodes and low for anodes), (vii) structural stability, (viii) low toxicLiPF6ity,
and (ix ) low cost. Materials that incorporate all these characteristics elude discovery,
hence the large amount of research in the area of Li-ion batteries.
Comprehensive reviews on materials for Li-ion batteries are available in the
literature.9,10 The following sections present a brief description of some systems
studied as positive and negative electrodes and their mechanisms of lithium uptake,
as well as the electrolytes employed.
2.2.1 Cathodes
Transition Metal Oxides
Because they are air-stable compounds, cathode materials are usually produced in
the lithiated form and act as a initial source of lithium when coupled with standard
graphitic anodes. Transition metal oxides (TMO) constitute the most studied and
commercially used compounds. The strong electronegativity of oxygen guarantees
a highly ionic character to the TM-O bond which in turn is associated with a high
potential of the metal redox couple. Elements of the first row in the periodic table
form TMOs with lowest mass, high valence states, and open structures (channels,
layers, or frameworks) that withstand lithium uptake and removal.11

Chapter 2. Theoretical Background 19
Layered LiCoO2 is the commonly used cathode material in commercial Li-ion
batteries today by virtue of its high working voltage (3.6V), structural stability
and long cycle life.12 It has a good cycle life but the stability window of the
electrolytes limits its specific capacity to only ≈140 mAh/g (x<0.5 in Li1−xCoO2).
In addition, the toxicity and high cost of cobalt spurred recent efforts to find a better
alternative. The isostructural LiNiO2 is an attractive choice because of its high
specific capacity and better elevated-temperature performance. Nonetheless, because
of the difficult synthetic procedure,13 poor structural stability on cycling,14 and
poor thermal stability of the delithiated state,15 LiNiO2 has not been commercially
successful.
Attempts have been made to improve the electrochemical lithium insertion
properties of layered LiMO2 (M=Co or Ni). The series of compounds with general
formula LiNixCo1−xO2 has been extensively investigated.14,16,17 These compounds,
easier to prepare and presenting lower insertion potentials than the pure cobalt
or nickel phases, are less demanding on the electrolyte. Nevertheless, neither
specific capacity nor cycleability are improved. Another approach employs partial
substitution of Co or Ni by another transition metal (e.g. chromium, manganese,
and iron).18–22 Unfortunately, such substitutions are deleterious to both capacity
and reversibility. Layered LiMnO2, LiFeO2, and V2O5 have also been investigated as
possible candidates for cathode materials but they exhibit low reversible capacities.
Manganese dioxide has been the most studied compound with one-dimensional

Chapter 2. Theoretical Background 20
interstitial space for Li+ transport and exhibits an initial specific capacity of
200 mAh/g. Polymorphs of MnO2 with different size channels, comprising of edge and
corner shared MnO6 octahedra, show different stabilities towards lithium intercalation
and removal; hence, their performance is strongly affected by methods of synthesis as
well as by the cycling current rates.23,24 A modification of γ-MnO2, named CDMO
(Composite Dimensional Manganese Oxide) by Sanyo Corp., obtained by reaction
with LiOH at 375-420◦C, shows better stability upon cycling.25–27
In the framework class of compounds, research concentrates on manganese,
vanadium, cobalt, and titanium oxides and/or lithiated derivatives with a spinel type
structure, A[B2]X4. A vast number of compositions can be prepared with the spinel
structure by changing both the type and valency of cations A and B as well as anions
X. Lithium transition metal oxide spinels, Lix[B2]O4, can be used for both insertion
and extraction purposes and, because the oxidation potential depends on the metal
cation on the octahedral B sites, the cell voltage can be tailored accordingly.28,29 Of
these, Li-Mn-O spinels have been extensively studied due to their low cost, abundance
of manganese, good electronic conductivity, and high oxidation potential range (3-
4V vs. Li). The end member LiMn2O4 adopts the spinel type structure with 3D
paths for Li+ diffusion. Its electrochemical performance depends strongly on the
preparation method − high crystallinity materials with low amounts of impurities
are desirable for maintaining good stability and rechargeablity of the cells. Complete
lithium extraction from the structure is hindered in practice by the instability of

Chapter 2. Theoretical Background 21
electrolytes at such potentials. On the other hand, lithium insertion is possible
at the 3V range but the cycling performance above this region is compromised
by a Jahn-Teller distortion of the structure, reducing the symmetry from cubic to
tetragonal.28,30,31 At the end of discharge, when high amounts of Mn3+ ions are
present, a disproportionation reaction followed by loss of Mn2+ ions (Eq. 2.9) causes
framework dissolution into the electrolyte. Together with the already low specific
capacity offered by the compound (≈160 mAh/g), these facts preclude the commercial
use of LiMn2O4 in Li-ion batteries.
2Mn3+(solid) → Mn4+
(solid) + Mn2+(solution) (2.9)
Phosphates and Sulphates
In recent years, lithium transition metal phosphates and sulphates received significant
attention among the research and industrial communities as possible candidates for
cathode materials in Li-ion batteries. Compounds with the NASICON (Na=Sodium
Super Ionic Conductor) type framework exhibit high diffusion rates for Li+ transport
and demonstrate good cycling reversibility. Namely Li3Fe2(PO4)3, Li3V2(PO4)3,
LixFe2(SO4)3, Li3FeV(PO4)3, and Li3FeTi(PO4)3, the phospho-olivines modifications
LiFePO4 and LiCoPO4, and vanadyl phosphates VOPO4 have been extensively
investigated.32,33 These compounds intercalate lithium ions at higher potentials than
their oxide counterparts, increasing the voltage range available for Li-ion cells, due
to a reduction of the electron charge density of oxygen by the highly charged cation

Chapter 2. Theoretical Background 22
in the (XO4)3− group. This is a result of the more ionic character of the TM-O bond
which lowers the energy of the transition metal antibonding d orbitals.
Conducting Polymers
Electronically conducting polymers can be molded into different shapes making
these materials a very versatile and cheap choice. Their conductivity, however, is
usually very low (≤10−5 S cm−1) for battery application purposes. Nevertheless, an
increase of conductivity by orders of magnitude can be achieved by appropriate doping
processes.34 Chemical oxidation or reduction of electrically conducting polymers (p-
and n-doping, respectively) form positively or negatively charged polyion complexes
associated with their respective counter ions.
The doping process can be achieved electrochemically by reversible polarization
of the polymer film.35 The mechanism for lithium insertion by polymeric materials
differs from the inorganic counterpart; concomitant anion insertion is required for
electronic neutrality of the system. Hence, anodic or cathodic polarization of
electronically conducting polymers in the presence of a suitable electrolyte (e.g.
LiClO4) can lead to the respective oxidation or reduction of the polymeric material,
accompanied by ionic insertion (perchlorate or lithium ions). The ionic conduction
process during charge and discharge is very slow and large amounts of electrolyte are
necessary. Because of the reduced amounts of lithium in the polymeric material, the
specific and volumetric capacities are compromised. Finally, poor cycleability and

Chapter 2. Theoretical Background 23
large self-discharge contribute to the lack of research interest in these materials.
2.2.2 Electrolyte
Because of the strong reducing power of Li, the working potential for Li-ion cells
lies commonly around 4V, but can be as high as 5V in some cases. The main
requirement for the electrolyte is, therefore, that it must have a wide electrochemical
stability window (Figure 2.3). Therefore, aqueous electrolytes cannot be used and
only a few aprotic, non-aqueous alternatives are suitable for practical cells, including
liquid, solid, and polymeric electrolytes. Liquid alternatives are those most commonly
exploited so far because of their superior ionic conductivity at ambient temperature.
An extensive review on the subject is available in the literature.36
Solvents
Liquid solvents that fulfill the dual requirement of a high lithium ion conductivity
(10−3 S cm−1), and a broad electrochemical stability window are mainly carbonates,
ethers and esters of various kinds (see Table 2.1). Carbonates are by far the most
common choice under ambient conditions, because of their superior cycling behaviour.
Ethylene carbonate (EC) and propylene carbonate (PC) provide a sufficiently high
conductivity and a broad stability window. Severe exfoliation of graphitic carbon
electrodes is observed when using PC, due to extensive co-intercalation during

Chapter 2. Theoretical Background 24
Figure 2.3: Schematic representation of electrode energy relative to electrolyte stability
window (Eg).
charging.37–39 EC is the preferred solvent in that context but it is a solid at room
temperature (RT). It is therefore common to mix these with other solvents with a
lower conductivity to obtain a working electrolyte over a wider temperature interval,
especially mixtures of EC with dimethyl carbonate (DMC) or diethyl carbonate
(DEC). Addition of surface film formation agents, such as carbon sulphide (CS2)
and sulphur dioxide (SO2) attenuates the degree of solvent co-intercalation.40

Chapter 2. Theoretical Background 25
Table 2.1: Structure and properties of some solvents used for lithium battery
electrolytes.36,41
Name and
Abbreviation
Structural
Formula
Melting
Point, ◦C
Boiling
Point, ◦C
Dielectric
Constant, ε
Ethylene Carbonate
EC
OO
O
39–40 248 89.6 (40◦C)
Propylene Carbonate
PC
CH3
OO
O
-49 240 64.4
Dimethyl Carbonate
DMC
CH3H3COO
O
4.6 91 3.12
Diethyl Carbonate
DEC
C2H5H5C2
OO
O
-43 126 2.82
2-Methyl-
Tetrahydrofuran
2Me-THF
CH3O
37 79 6.29
Dimethoxyethane
DMECH3H3C OO
-58 85 7.2
γ-Butyrolactone
γ-BL
O
O
-43 204 39.1

Chapter 2. Theoretical Background 26
Lithium Salts
Soluble lithium salts in the electrolyte solutions act as charge carriers during the
electrochemical process. Good solubility and charge separation of anion and cation,
normally achieved by choosing bulky anions with low negative charge density, promote
high conductivity.36 Examples of such salts are LiClO4, LiAsF6, LiPF6, LiBF4,
LiCF3SO3 and LiN(SO22CF3)2. However, LiClO4 and LiAsF6 are not realistic options
for commercial cells since ClO−4 is highly explosive and the AsF−
6 anion and its
degradation products are very toxic. The other salts are currently used or considered
for use in practical cells. LiPF6 gives high ionic conductivities in carbonate-based
solutions, and shows excellent cycling properties at room temperature. It does,
however, have poor thermal stability, bad cycling behaviour for some electrode
materials at slightly elevated temperature, and is easily hydrolysed by traces of
water.42–46 LiBF4, is much like LiPF6 but is less hygroscopic and costs one-third
of the price.43,47
Lithium trifluoromethane sulfonate (LiCF3SO3) and lithium bis-(trifluoromethane
sulfone)imide (LiN(SO2CF3)2), designed specifically for use in polymer electrolytes,
have large anions with a partly delocalized charge, which reduces the formation of
ion pairs, hence increasing the conductivity of the lithium ion, especially in polymer
electrolytes. They surpass LiPF6 and LiBF4 for use in liquid electrolytes, mainly
because of their superior chemical and thermal stability. Nevertheless, these salts

Chapter 2. Theoretical Background 27
do corrode the Al current collector used on the cathode side of Li-ion cells at high
potentials.42,48
2.2.3 Anodes
True Insertion Compounds
Carbon
Commercial rechargeable batteries use graphitic carbon as the anode active
material. Their electrochemical properties and intercalation processes depend on
the structure, crystallinity, size and shape of grains, texture, and morphology of
the carbonaceous material49–51 In general, they exhibit higher specific capacity and
more negative redox potential than most metal oxides, chalcogenides, and polymers;
also, carbon-based anodes exhibit excellent dimensional stability, good cycling
performance, and are cheap and readily available. In addition, the intercalation
chemistry and reactivity of carbon towards lithium is well established.
Graphitic carbon comprises of extended sheets of sp2-hybridized carbon atoms
arranged in hexagonal rings which extend in two dimensions known as graphene
sheets. These sheets can be stacked in an “ABAB” (hexagonal graphite) or
“ABCABC” (rhombohedral graphite, less common) pattern. In practice, a pure
phase never forms because of the occurrence of stacking faults and structural defects.
Therefore, graphitic carbons are characterized by the extension of isolated, perfectly

Chapter 2. Theoretical Background 28
stacked regions (crystallites), which may vary from nano- to micrometres in the
crystallographic a and c directions. Disordered regions (formed of non-stacked
graphene sheets) separate the crystallites and, in the case of non-graphitic carbons,
dominate the structures.
The electrode potential of graphitic carbon is very close to that of the Li/Li+ redox
couple (≈0.2-0.05V vs Li/Li+). A maximum of one lithium per six carbons (LiC6) can
be intercalated in the Van der Waals gaps above and below a carbon hexagon, limiting
the specific theoretical capacity to ≈372 mAh/g. On intercalation, the graphite
structure shifts to an “AA” stacking type (Figure 2.4(a)), passing through a number
of characteristic phases, as the amount of lithium increases.52–54 The different phases
(stages I, II, III, and IV), are shown schematically in Figure 2.4(b).
The repulsive energy originating from the interaction between lithium ions is
smaller than that required to open the gap between two adjacent graphene layers.
As a result, lithium fills one inter-planar gap before filling neighbouring gaps; the
intercalation process occurs sequentially through first-order phase transitions. Co-
existence of two LixC6 phases at equilibrium within an electrode demands that the
chemical potential of lithium, µLi, in each stage must be equal.55 Therefore, the
electrode potential is constant during a phase transition from one stage to another,
according to the relation
E = −µLi/F (2.10)

Chapter 2. Theoretical Background 29
(a) (b)
Figure 2.4: Lithium-graphite intercalation compounds: (a) structure of LiC6 and (b)
schematic representation of potential profile of stage formation.12
with F being Faraday’s constant. Consequently, the potential profile of lithium
intercalation into graphite shows a number of steps, where horizontal and vertical
regions correspond to the two-phase and single phase processes, respectively.
In addition to the limited capacity exhibited by graphitic carbons, some of the
lithium inserted on the first charge does not de-insert during the following discharge
due to a decomposition reaction between carbon and the electrolyte. Reduction
of carbonate-based electrolytes at the negative electrode between 1.5 − 0.7 V vs.
Li/Li+ (i.e. prior to lithium intercalation), depends on the composition of the
electrolyte.37 A surface film, Solid Electrolyte Interphase (SEI), consisting of a
variety of solvent and salt reduction products, forms around the carbon particles

Chapter 2. Theoretical Background 30
as a charge-consumption side reaction, leaving the cathode material under-utilized.
To minimize charge loss, the cell must be loaded with an excess of cathode material,
which is detrimental to the overall volumetric capacity. On the other hand, the SEI
functions as an ionic conductor that allows Li+ ions to be transported through the
film during the subsequent intercalation and de-intercalation processes. The film is
also an electronic insulator that prevents the continuous reduction of electrolyte as
its thickness reaches a certain limit, thus acting as a passivation layer. This limit
has been set as the thickness at which electron tunnelling from the graphite surface
to the electrolyte is prevented (a few nm).56 Surface films formed on lithium metal
and carbon electrodes are very similar and their presence around electrode particles
surface renders stability to lithium metal in certain electrolyte systems, that would
otherwise be thermodynamically unstable.56,57
Other Compounds
Apart from carbon, Li4Ti5O12 is the most studied intercalation material due to
the minute changes that occur in its unit cell upon insertion of up to one lithium.
In the structure, which can be represented as Litet[Li1/3T i5/3]octO4, Li and Ti occupy
half the octahedral (oct) sites and the remaining Li fills the tetrahedral (tet) sites.
Ohzuku et al. suggested that both inserted Li and those migrating from tetrahedral
sites populate the partially filled octahedral sites.58 The small structural hysteresis
and rapid lithium diffusion in the material produces good electrochemical properties
(specific capacity around 150 mAh/g), despite the high average insertion potential

Chapter 2. Theoretical Background 31
(1.5 V). The related Li[CrTi]O4 demonstrates similar behaviour.59
Alloys and Intermetallic Compounds and Composites
In an attempt to achieve better performance, increased cycleability, and improved
safety, some studies have substituted lithium-metal alloy anodes for lithium as anode
material in Li-ion batteries. Even though lithium-aluminium alloys have formerly
been studied in high temperature application cells, their use at low temperature failed
due to the low diffusion coefficient of Li+ in the α-Al phase.60 Other alloys proposed
as anode materials (e.g. LixM, M= Si, Ge, Sn, Pb, and Bi) exhibit large differences in
the volume of the non-alloyed and alloyed phases (up to 400% for Si→ Li22Si5), causing
the electrode to expand and contract during cycling. These mechanical stresses induce
rapid decay of the mechanical properties and finally, pulverization of the electrode,
leading to failure of the battery due to loss of contact between the grains.12
Despite their poor mechanical properties, lithium alloys exhibit very high specific
capacity as seen in Table 2.2. Use of very small particle size, in the micro or
nanoscopic regime, might counteract the mechanical degradation of the lithium-
metal alloy. In this case, the dimensional changes of the crystallites during cycling
do not cause particle cracking, thus suppressing the anode pulverization, and the
reduction of the diffusion pathway improves the ionic conductivity of lithium.61,62
Nanoparticles, however, tend to agglomerate to form larger, more thermodynamically
stable crystals, reestablishing the problem of pulverization. Attempts have been

Chapter 2. Theoretical Background 32
made to circumvent this problem either by surface passivation63,64 or by dispersing
the particles into a matrix which act like an absorber for the dimensional changes
during cycling. Examples of such matrices are intermetallic compounds (MM’, where
M’ is an element that does not alloy with Li and, during the first discharge, forms
an inactive matrix surrounding M, helping maintain the integrity of the electrode
grains),65–68 polymers,32 oxides,62 and carbons.69 A suitable matrix, one that
guarantees mechanical stability without loss of electronic and/or ionic conductivity
nor reduction of the cell’s energy density, is yet to be developed.
Table 2.2: Electrochemical properties of some Li alloys.
Initial
Phase
Lithiated
Phase
Theoretical
Capacity (mAh/g)
Volume
Changes (%)
Li Li 3860 −−
C LiC6 372 12
Si Li21Si5 4010 300
Ge Li17Ge4 1570 280
Sn Li17Sn4 959 260
Al Li9Al4 2235 240
Bi Li3Bi 385 115
In addition to the systems that uptake lithium through alloying reactions,
intermetallic “insertion” hosts based on Cu-Sn phases have also been proposed.70 In

Chapter 2. Theoretical Background 33
these systems, topotactic Li+ intercalation leads to high gravimetric and volumetric
capacities without excessive dimensional changes. For example, at 0.4V vs. Li+/Li,
η-Cu6Sn5 uptakes 10Li+ (Equation 2.11).
Cu6Sn5 + 10Li −→ 5Li2CuSn + Cu (2.11)
Only 61% volume change accompanies the lithiation reaction, thought to occur by
displacement of half the tin atoms in the NiAs-type structure of η-Cu6Sn5. This
creates hexagonal channels in the structure where Li can be inserted (Figure 2.5).
Further discharge to 0V leads to decomposition of Li2CuSn and extrusion of Cu
(a) (b)
Figure 2.5: Phase transformation in (a) η-Cu6Sn5 upon lithiation forming (b) Li2CuSn.
according to Equation 2.12. The specific capacity for the fully lithiated electrode is
reported as 360 mAh/g. At such levels of discharge, however, LixSn alloys form.
Li2CuSn + xLi −→ Li2+xCu1−ySn + yCu (0 ≤ x ≤ 2.4 and 0 ≤ y ≤ 1) (2.12)

Chapter 2. Theoretical Background 34
Conversion or Disproportionation Materials
The capacities of these materials originate from the reaction with lithium to form
another material which is the active specie. Reformation of the starting phase is not
always observed.
Oxides
A high potential and large hysteresis are observed during charge, consonant with
the need of oxygen transport within the bulk during oxidation. Consequently, good
reversibility in these materials demands an intimate mixture of the metal sub-oxide
(or pure metal, depending on the degree of Li uptake) and oxygen from the lithium
oxide matrix. Transition metal oxides with spinel structure, e.g. α-Fe3O4 and Co3O4,
intercalate lithium at moderate voltage by the referred process.71,72 In these systems,
the transition metal cations migrate from the tetrahedral to the empty octahedral
sites during lithium insertion. Cobalt monoxide also uptakes lithium at relative low
voltages but the reaction mechanism involves the decomposition of the material with
the formation of Li2O and nanoscopic reduced Co, all surrounded by a solid electrolyte
interface.73
Interest in compounds containing main group elements arose after the development
of Tin composite oxide (TCO), an amorphous material containing Sn2+ ions
(SnxAlyBzPpOo).74 Studies indicate that in such material the initial Li uptake
corresponds to an irreversible reaction forming metallic Sn and Li2O. Subsequent

Chapter 2. Theoretical Background 35
cycling occurs basically by reversible alloying and de-alloying reactions forming Li4.4Sn
nanoparticles embedded in a Li2O matrix.75,76 The process seems to occur in a
size-limiting regime with strong influence of the particles’ surface energy on the
thermodynamics; surface and interstitial oxygen bound to the matrix is thought to
facilitate the uptake of Li by Sn.77,78
Antimonides
The uptake of lithium by intermetallic (or intermetalloid) antimonide compounds
always involves the extrusion of antimony from the lattice with formation of lithium
antimonide, Li3Sb, independent of the starting stoichiometry or structure.79–83 The
systems exhibit high initial capacities (theoretical capacity 660 mAh/g), which
decay rapidly upon cycling due to expansion/contraction effects. Improvement of
cycleability usually involves the use of an inactive transition metal matrix.
Copper antimonide, Cu2Sb, behaves similarly to the Cu-Sn system (see page 33).
In this case, however, extrusion of 50% of Cu atoms from the structure leads to the
binary phase, CuSb, before the formation of ternary Li2CuSb.84 Further discharge
leads to a Li2+xCu1−xSb solid solution terminating in Li3Sb. The extruded Copper
particles are thought to render better ionic conductivity to the electrode and cause
the good reversibility obtained with a specific capacity of 290 mAh/g.
Silicides
Mg2Si has been extensively investigated due to its anti-fluorite structure which
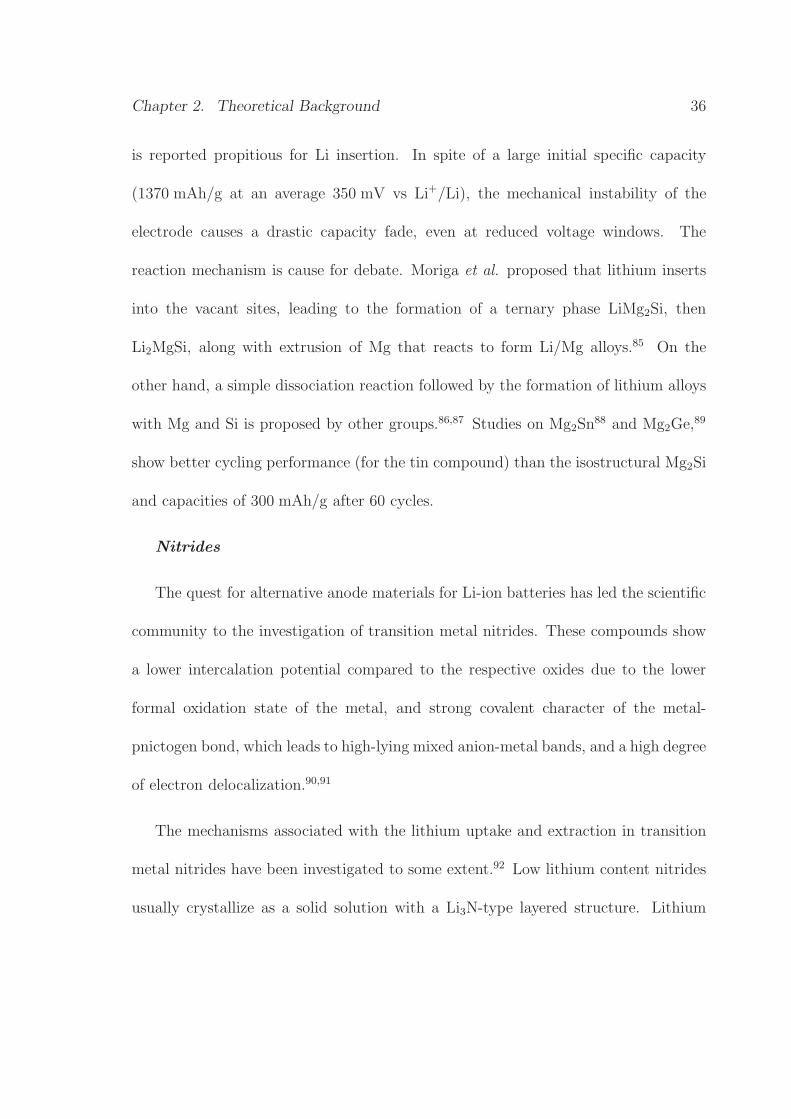
Chapter 2. Theoretical Background 36
is reported propitious for Li insertion. In spite of a large initial specific capacity
(1370 mAh/g at an average 350 mV vs Li+/Li), the mechanical instability of the
electrode causes a drastic capacity fade, even at reduced voltage windows. The
reaction mechanism is cause for debate. Moriga et al. proposed that lithium inserts
into the vacant sites, leading to the formation of a ternary phase LiMg2Si, then
Li2MgSi, along with extrusion of Mg that reacts to form Li/Mg alloys.85 On the
other hand, a simple dissociation reaction followed by the formation of lithium alloys
with Mg and Si is proposed by other groups.86,87 Studies on Mg2Sn88 and Mg2Ge,89
show better cycling performance (for the tin compound) than the isostructural Mg2Si
and capacities of 300 mAh/g after 60 cycles.
Nitrides
The quest for alternative anode materials for Li-ion batteries has led the scientific
community to the investigation of transition metal nitrides. These compounds show
a lower intercalation potential compared to the respective oxides due to the lower
formal oxidation state of the metal, and strong covalent character of the metal-
pnictogen bond, which leads to high-lying mixed anion-metal bands, and a high degree
of electron delocalization.90,91
The mechanisms associated with the lithium uptake and extraction in transition
metal nitrides have been investigated to some extent.92 Low lithium content nitrides
usually crystallize as a solid solution with a Li3N-type layered structure. Lithium

Chapter 2. Theoretical Background 37
extraction from these materials induces the formation of an amorphous phase LiMxN
(M=Co, Fe, Ni and Cu).93,94 The theoretical capacity of the material is thus inversely
proportional to the content of transition metal atoms, but a low degree of substitution
diminishes reversibility. Shodai et al attributed this dependence to the stabilization of
the formed amorphous phase by the strong M−N covalent bond and co-participation
of nitrogen in the redox process.
Highly lithiated transition metal nitrides tend to crystallize with cubic
symmetry − for example, Li7VN4 has an antifluorite-type structure and in Li7MnN4
the MnN4 tetrahedra occupy the corner, face, and centre positions and lithium
atoms are distributed on the remaining tetrahedral sites.95,96 Nishijima and
co-workers reversibly removed up to 1.25 Li+ from Li7MnN4 through a two-
phase reaction that leads to the formation of a cubic structure of smaller lattice
parameter.92 Nevertheless, they identified neither the new formed phase nor the phase
transformation mechanism. Later, Susuki and Shodai studied the charge balance
mechanism between Li7MnN4 and Li6MnN4.97 The authors showed that the lowest
unoccupied orbitals of Li7MnN4 have a strong nitrogen 2p character and that removal
of lithium from the structure introduces holes in these orbitals rather than into the
manganese 3d ones. These results indicate once again that, in contrast to transition
metal oxides, the anionic network plays an important role in the redox process of
nitrides.
Regardless of the mechanism involved in lithium removal and uptake by the

Chapter 2. Theoretical Background 38
nitrides, the electrochemical properties of the materials are not very encouraging.
Vanadium and manganese nitrides exhibit initial specific capacities, 170 and
166 mAh/g, respectively, which are not competitive values relative to carbon
electrodes (352 mAh/g). In addition, the lithiated transition metal nitrides are
extremely reactive phases; the assembly of batteries using such material is not very
practical and the anode acts as a source and not a sink of lithium.
Phosphides
Phosphides exhibit a combination of the other Group V members’ chemical
behaviour. As in nitrides and antimonides, the metal has a low formal oxidation state
due to high-lying mixed anion-metal bands, a high degree of electron delocalization,
and strong covalent character of the M-pnictogen bond, leading to lower intercalation
potentials than the respective oxides.90 Moreover, phosphides display more covalent
bonding than the corresponding nitrides, but less than the predominantly semi-
metallic antimonides. These bonding differences are reflected in the band structure
(Figure 2.6) and chemistry of the materials.

Chapter 2. Theoretical Background 39
Figure 2.6: Schematic representation of the DOS for oxides, nitrides, and phosphides.
In nitrides, the upper band is densely populated with nitrogen orbitals such that
oxidation generates holes in the nitrogen orbitals with consequent evolution of N2
on overcharge.98 In antimonides, the redox reactions involve the metal-Sb bond, and
hence Li uptake/extraction results in phase separation to form metal and LixSb alloys.
In phosphides, the chemistry seems to lie midway between the two. The differences
in strength of the M-pnictogen (PN ) bond, and relative contribution of the PN−PN
bond explain the small amount of transition metal-poor binary nitrides known (and
abundance of antimonides). For example, MnN4, analogous to MnP4, does not exist.
As no binary nitrides are known to uptake Li+/e−, the lithium ions must first be
removed from the structure to give reversible cycling. This constitutes a deficiency of
these materials since the negative electrode in a cell should act as a reservoir, not a
source, of Li. In this respect, phosphides have advantages over nitrides. Additionally,
the delithiation process of ternary nitrides results in irreversible collapse into an

Chapter 2. Theoretical Background 40
amorphous structure.
At the beginning of this research project, no metal phosphide had been evaluated
as anode material for Li-ion batteries; our report in Science Magazine was the first
of its kind.99 Since then, our research group and others have investigated different
transition metal phosphides. The following list depicts their main electrochemical
properties:
VP:100 First discharge exhibits a plateau at 0.05V but subsequent cycling shows
typical solid solution behaviour with a reversible capacity on 2 cycles equivalent
to 230 mAh/g. X-ray diffraction data indicates that topotactic reaction (true
insertion) takes place.
VP4:101 First discharge produces 1460 mAh/g in a four step reaction; three steps
between 1.0 and 0.5V and one close to 0V. The reported reversible specific
capacity in the voltage window of 0.77−2.5V is 430 mAh/g for 100 cycles.
Based on ex-situ analysis of cycled material the authors suggest a reaction
mechanism as follows:
1. Before 0.77V: topotactic insertion of 3 Li in monoclinic VP4;
2. Between 0.77 and 0.65V: non-topotactic uptake of 3 Li (phase
transformation: monoclinic ↔ cubic);
3. Between 0.65 and 0.50V: uptake of 3 Li accompanied by structure
decomposition with formation of Li3P and VP;

Chapter 2. Theoretical Background 41
4. Below 0.50V: lithium insertion into VP lattice.
MnP4 and Li7MnP4:102,103 Gillot and co-workers reported the uptake of up to
7Li by MnP4 between 1.7 and 0.5V of these, only 4.5 were extracted on
oxidation. Increasing the voltage window to 1.7 and 0.01V led to the uptake
of 3 additional Li+ corresponding to an alleged incomplete decomposition
reaction of Li7MnP4 into Li3P and Mn0. Starting the electrochemical redox
process with the lithiated ternary phase gave similar initial capacity results,
but very poor cycling performance. Molecular electronic structure calculations
based on the extended Huckel tight-binding method (EHTB) showed that the
redox center involved in the MnP4 + 7Li reaction is primarily the phosphorus
atoms. Through first-principles electronic structure calculations, the authors
also suggested that the charge process occur via a two-phase reaction between
Li7MnP4 and Li5MnP4.
Li5.5Mn2.5P4:102,103 The system exhibits a specific capacity of up to 900 mAh/g
after the first charge process and only 10% capacity fading after 25 cycles. The
electrochemical Li uptake/removal processes occur through smooth evolution of
the lattice parameters while preserving the crystalline nature of the material.
By comparison with the Li7MnP4, the authors claim that the crystal structure,
and moreover, the stoichiometry of heavy metal atoms, plays a key role in the
electrodes cycling performances.

Chapter 2. Theoretical Background 42
CoP and CoP3:104,105 Alcantara et. al. showed that lithium
reacts electrochemically with CoP3 through a single extended quasi-plateau at
about 0.4−0.25V during the first discharge. The authors concluded that the
process involves reduction of cobalt to Co0, formation of hexagonal Li3P, and
amorphization of the material. Additionally, they suggested that part of the
lithium can be reversibly extracted upon charging, yielding a reversible capacity
of 487 mAh/g on second discharge. On the other hand, Zhang and co-workers
showed that samples prepared by high-energy ball-milling consisted of mixtures
of CoP3 and CoP, their relative amounts depending on the duration of milling.
The initial electrochemical lithiation of CoP and CoPx (CoP3+CoP) yielded
reversible capacities of 533 and 878 mAh/g, respectively. The authors noted a
higher efficiency for CoP (74%) in the first cycle than the expected theoretical
value (66.7%), calculated in the basis of a inactive Co formation mechanism
similar to that proposed for CoP3:105
1st discharge : CoP + 3Li+ + 3e− → Li3P + Co (2.13)
Subsequent cycles : Li3P ⇋ LiP + 2Li+ + 2e− (2.14)
The authors suggested that the reduced metallic Co takes part, at least partially,
in the oxidation reaction and that, for milled samples, a multi-step insertion
process occurs, associated with a LiP intermediate phase. Furthermore, partial
mechanical lithiation of the samples with Li3N (reduction of CoP3 to CoP)
suppressed the initial irreversibility to only 5% at the expense of capacity.

Chapter 2. Theoretical Background 43
NiP2:106 Cubic and monoclinic NiP2 polymorphs react reversibly with 4.2 and 5.0 Li
per unit formula, respectively. The phases exhibited different reaction paths
during the first discharge: the cubic phase undergoes direct decomposition into
metallic nickel and Li3P, whereas Li2NiP2 forms as an intermediate insertion
phase upon reduction of monoclinic NiP2. The authors attributed the different
behaviours to a combination of two factors:
1. Different oxidation states and local environments for Ni in the two
polymorphs, and
2. Close packed nature of cubic phase, which favours the direct conversion
reaction, as opposed to the presence of interlayer space in monoclinic NiP2,
which in turn can accommodate lithium ions, allowing for an insertion
reaction prior to conversion.
Whatever the starting phase, however, the final reduced material had similar
composition, namely Li3P and Ni nanoparticles. On subsequent cycling both
polymorphs react with Li according to a direct conversion process represented
in Equation 2.15. Self supported electrodes, made by vapour-phase transport
of the monoclinic phase on commercial Ni-foam, displayed good cycling
performance (95%) and enhanced rate capability.
NiP2 + 6Li+ + 6e− ⇋ Ni0 + 2Li3P (2.15)
Cu3P:107–111 In 2004 Crosnier and Nazar reported on the two-step electrochemical

Chapter 2. Theoretical Background 44
reaction of Cu3P with 3Li. The authors identified a two-phase process in which
copper is extruded from the Cu3P lattice and a metastable intermediate phase
“LixCu3−xP” is formed, followed by decomposition into Cu0 and Li3P upon
further lithiation. The hexagonal close-packed (hcp) arrangement of phosphorus
atoms in lithiated and non-lithiated phases made such a process possible.
Studies carried out by other research groups showed that the electrochemical
properties of Cu3P, specially the initial capacity and capacity retention, depend
strongly on the powder morphologies, suggesting a slightly more complex
mechanism for lithium uptake by nanoscopic crystalline Cu3P:108–111
(A) Cu3P + 0.3Li+ + 0.3e− → Li0.3Cu3P
(B) Li0.3Cu3P + 0.7Li+ + 0.7e− → LiCu2P + Cumetal
(C) LiCu2P + Li+ + e− → Li2CuP
(D) Reversible reaction of electrolyte with lithium
(E) Li2CuP +αLi+ +αe− → Li3P and/or Li2+αCu1−αP +αCumetal (α ≈ 1)
Self-supported films of Cu3P on copper foil also uptake lithium, however,
through a different non-elucidated mechanism.
Li2CuP:112 This phosphide showed a rather surprising reversible crystalline-
amorphous transformation upon lithium extraction/uptake. In this system,
the Cu−P framework structure reformed at the end of the reduction remains
during the second oxidation. Oxidation and reduction involves the cleavage

Chapter 2. Theoretical Background 45
and reformation of Li−P bonds. Band structure calculations showed that the
majority of the (filled) Cu d-bands are narrow and lie well below the Fermi
level, indicating that these d-orbitals do not participate in the redox process.
Alternatively, the uppermost band that lies just below the Fermi level includes
both Cu and P bonding states. Along with cleavage of the Li−P bonds,
extraction of electron density from this band affects the Cu−P bonding in
the hexagonal framework; the authors suggested this as responsible for the
observed increase in structural disorder on oxidation. Thus, a significant role
in the electrochemical process is adopted by the phosphorus anions.
Zn3P2:113 Zinc phosphide powders of varied morphology and particle size were
synthesized by three different routes: ball-milling, ball-milling followed by
annealing, and ceramic processing at high temperature. The electrochemical
reaction of Zn3P2 with lithium led to a high initial capacity (995 mAh/g).
Bichat et. al. suggested an insertion mechanism that involves two distinct
but parallel reversible pathways (Figure 2.7): one implies exclusively phosphide
phases (Zn3P2, LiZnP, Li4ZnP2, and Li3P) and the second involves only Li-Zn
alloys (Zn, LiZn4, and LiZn). The various phases involved in the overall reaction
are structurally close allowing a high reversibility of the process, although some
of the observed transitions impoverishes the electrochemical performances of
these materials, especially capacity retention.

Chapter 2. Theoretical Background 46
Figure 2.7: Proposed mechanism for reversible reaction of Li with Zn3P2.113
Sn4P3:114 Kim and co-workers evaluated the electrochemical and local structural
characteristics of nanosized layered Sn4P3 during charge/discharge in lithium
batteries. The phosphide showed a good cycleability and sustained 370 mAh/g
for up to 50 cycles when cycled within a limited voltage window (0−0.72V).
With increasing lithium uptake, the tin phosphide was converted into lithium
phosphides followed by formation of a lithium-tin alloy, indicating that both
tin and phosphorus act as active redox centers. Capacity fading at the voltage
region above 0.9 V was attributed to the irreversible formation of LiP and the

Chapter 2. Theoretical Background 47
agglomeration of tin atoms. The following three-step reaction mechanism was
suggested to explain the electrochemical process:∗
Step 1(U>0.82V) : Sn4P3 + 2Li → Li2Sn4P3 (2.16)
Step 2(0.61 V<U<0.82V) : Li2Sn4P3 → Sn + (LiP5 + LiP7) → Sn + LiP (2.17)
Step 3(U<0.61V) : Sn → Li4Sn and LiP → Li3P (2.18)
Li9TiP4:115 Electrochemical extraction/insertion of lithium by Li9TiP4 yields a
specific capacity of 830 mAh/g at an average potential close to 1V. The
reversible structural phase transition observed upon cycling was correlated
to a loss/reconstruction of the unit cell cubic-fcc symmetry. The authors
proposed a reaction mechanism in terms of Ti−P bond contraction/elongation
in the tetrahedral TiP−x4 electronic entities. The two phases involved in the
oxidation process correspond to nearly size-equivalent cubic structures in which
P atoms are ordered (Li-rich) and disordered (Li-poor), hence favouring a redox-
induced mechanism without significant electrode volume change. Nevertheless,
the different kinetic barriers associated with Li+ extraction from P−ordered,
and insertion into P−disordered phases, induce different mechanisms upon
charge and discharge. The authors pointed out that the fcc pnictogen (PN)
networks exhibit most of the crystallographic and electronic features required
for competitive electrode materials: a large number of cationic vacancies, a
large unit cell volume, and large band of nearly PN−PN non-bonding levels.
∗ Non-balanced equations extracted from original reference.

Chapter 2. Theoretical Background 48
Provided that this band is involved in electrochemical redox processes, a host
material structural change should therefore be prevented.
LixVP4:116 The ternary phases LixVP4 show a high specific capacity in their first
charge/discharge cycle, associated with a large variation of lithium content
per formula unit (3 ≤ x ≤ 7.5). XRD analysis and first-principle electronic
structure calculations evidence the stability of the LixVP4 crystal structure for
various lithium compositions. Likewise, in the Li9TiP4 system, the host matrix
behaves as a structurally stable network of weakly interacting tetrahedra, able
to store (or release) a large number of additional electrons (concomitant with
the intercalation or deintercalation of lithium) into a nearly non-bonding Pn-Pn
band. This leads to very small volume variations of the unit cells (< 1%) upon
cycling.

References
[1] Huggins, R. Mat. Res. Soc. Symp. Proc.. In Solid States Ionics IV, Vol. 369;
MRS: Boston, 1995; Chapter Pulse Applications of Electrochemical Cells
Containing Insertion Reacton Electrodes, page 3.
[2] Armand, M. Materials for Advanced Batteries. In ; Plenum: New York, 1980;
Chapter Intercalation Electrodes, page 145.
[3] Ceder, G.; Aydinol, M. K.; Kohan, A. F. Comput. Mater. Sci. 1997, 8, 161.
[4] Aydinol, M. K.; Ceder, G. J. Electrochem. Soc. 1997, 144, 3832.
[5] Ceder, G.; der Ven, A. V. Electrochim. Acta 1999, 44, 254.
[6] Aydinol, M. K.; Kohan, A. F.; Ceder, G.; Cho, K.; Joannopoulos, J. Phys.
Rev. B: Condens. Matter 1997, 56, 1354.
[7] Gerischer, H.; Decker, F.; Scrossati, B. J. Electrochem. Soc. 1994, 141, 2297.
[8] Alberty, R.; Silbey, R. Physical Chemistry; John Wiley: New York, 1996.
49

References 50
[9] Tirado, J. L. Mater. Sci. Eng. R: Reports 2003, 40, 103-136.
[10] Nazri, G.-A.; Pistoia, G., Eds.; Lithium Batteries: Science and Technology;
Springer: New York, 2004.
[11] Thackeray, M. M. The Structural Stability of Transition Metal Oxide
Insertion Electrodes for Lithium Batteries. In Handbook of Battery Materials;
Besenhard, J., Ed.; Wiley-VCH: Weinheim, 2000.
[12] Winter, M.; Besenhard, J. O.; Spahr, M.; Novak, P. Adv. Mater. 1998, 10,
725.
[13] Arai, H.; Okada, S.; Ohtsuk, H.; Ichimura, M.; Yamaki, J. Solid State Ionics
1995, 80, 261.
[14] Ohzuku, T.; Ueda, A.; Nagayama, M. J. Electrochem. Soc. 1993, 140, 1862.
[15] T. Ohzuku, T. Yanagawa, M. K.; Ueda, A. J. Power Sources 1997, 68, 131.
[16] Gummow, R.; Thackeray, M. J. Electrochem. Soc. 1993, 140, 3365.
[17] Dahn, J.; von Sacken, U.; Juzkow, M.; Al-Janaby, H. J. Electrochem. Soc.
1994, 2207.
[18] Garcia, B.; Farcy, J.; Pereira-Ramos, J.; Perichon, J.; Baffier, N. J. Power
Sources 1995, 54, 373.
[19] Li, W.; Reimers, J.; Dahn, J. Solid State Ionics 1994, 67, 123.

References 51
[20] Sawai, K.; Ueda, A.; Nagayama, M.; Iwakoshi, Y.; Ohzuku, T. Denki Kagaku
1993, 61, 715.
[21] Moshtev, R.; ; Zlatilova, P.; Manev, V.; Sato, A. J. Power Sources 1995,
54, 109.
[22] Broussely, M.; Perton, F.; Biesan, P.; Bodet, J.; Labat, J.; Lecerf, A.;
Delmas, C.; Rougier, A.; Peres, J. J. Power Sources 1995, 54, 109.
[23] Ohzuku, T.; Kitagawa, M.; Hirai, T. J. Electrochem. Soc. 1989, 136, 3169.
[24] Ohzuku, T.; Kitagawa, M.; Hirai, T. J. Electrochem. Soc. 1990, 137, 40.
[25] Nohman, T.; Saito, T.; Furukawa, N.; Ikeda, H. J. Power Sources 1989, 26,
389.
[26] Nohman, T.; Yamamoto, Y.; Nishio, K.; Nakane, I.; Furukawa, N. J. Power
Sources 1990, 32, 373.
[27] Nohman, T.; Yamamoto, Y.; Nakane, I.; Furukawa, N. J. Power Sources
1992, 39, 51.
[28] Thackeray, M. M.; David, W.; Bruce, P.; Goodenough, J. Mater. Res. Bull.
1983, 18, 461.
[29] Thackeray, M. M.; Johnson, P.; ”de Picciotto”, L.; Bruce, P.; Goodenough, J.
J. Solid State Chem. 1984, 55, 280.

References 52
[30] Goodenough, J.; Thackeray, M. M.; David, W.; Bruce, P. Rev. Chem. Miner.
1984, 21, 435.
[31] Yamada, A.; Tanaka, M. Mater. Res. Bull. 1995, 30, 278.
[32] Kerr, T. Synthesis, Characterization, and Electrochemical Investigation of Novel
Electrode Materials for Lithium Ion Batteries, Ph.D. thesis, University of
Waterloo, 2002.
[33] Yin, S. Understanding Structure-Property Relationships in Lithium Metal
Phosphates and Oxide Electrode Materials: X-ray/Neutron Diffraction and 7Li
MAS-NMR Coupled with Li-Ion Electrochemistry, Ph.D. thesis, University of
Waterloo, 2005.
[34] Chiang, C.; ad A.J. Heeger, Y. P.; Shirakawa, H.; Louis, E.; MacDiarmid, A.
J. Chem. Phys. 1978, 69, 5098.
[35] MacDiarmid, A.; Maxfield, M. Organic polymers as electroactive materials. In
Electrochemical Science and Technology of Polymers, Vol. 67; Elsevier: London,
1987.
[36] Aurbach, D. Nonaqueous Electrochemistry; Marcel Dekker, Inc.: New York,
1999.
[37] Besenhard, J.; Winter, M.; Yang, J.; Biberacher, W. J. Power Sources 1995,
54, 228.

References 53
[38] Yazami, R.; Genies, S. Denki Kagaku 1998, 66, 1293.
[39] Chung, G.; Kim, H.; Yu, S.; Jun, S.; Choi, J.; Kim, M. J. Electrochem. Soc.
2000, 147, 4391.
[40] Ein-Eli, Y. J. Electroanal. Chem. 2002, 531, 95.
[41] Linden, D.; Reddy, T. Handbook of Bateries; McGraw Hill: New York, 3rd.
ed.; 2002 Chapter 2.
[42] Krause, L.; Lamanna, W.; Summerfield, J.; Engle, M.; Korba, G.; Loch, R.
J. Power Sources 1997, 68, 320.
[43] Nagayama, K.; Kamioka, K.; Iwata, E.; Oka, H.; Tokunaga, Y.; Okada, T.
Electrochemistry 2001, 69, 6.
[44] Smagin, A.; Matyuka, V.; Korobtsev, V. J. Power Sources 1997, 68, 326.
[45] Zhang, X.; Ross, P.; Kostecki, R.; Kong, F.; Sloop, S.; Kerr, J.; Streibel, K.;
Cairns, E.; McLarnon, F. J. Electrochem. Soc. 2001, 148, A463.
[46] DuPasquier, A.; Blyr, A.; Courjal, P.; Larcher, D.; Amatucci, G.; Gand, B.;
Tarascon, J.-M. J. Electrochem. Soc. 1999, 146, 428.
[47] Armstrong, D.; Perkins, P. Electrochim. Acta 1974, 10, 77.
[48] Naoi, K.; Mori, M.; Narupka, Y.; Lamanna, W.; Atanasoski, R.
J. Electrochem. Soc. 1999, 146, 462.

References 54
[49] Dahn, J.; Sleigh, A.; Shi, H.; Way, B.; Weydanz, W.; Reimers, J.; Zhong, Q.;
von Sacken, U. Carbons and Graphites as Substitutes for the Lithium Anode. In
Lithium Batteries - New Materials, Developments and Perspectives ; Pistoia, G.,
Ed.; Elsevier: Amsterdam, 1994.
[50] Billaud, D.; Henry, F.; Willmann, P. J. Power Sources 1995, 54, 383.
[51] Shi, H.; Barker, J.; Koksbang, R. J. Electrochem. Soc. 1996, 143, 3466.
[52] Herold, A. Bull. Soc. Chim. 1955, 187, 999.
[53] Daumas, N.; Herold, A. Bull. Soc. Chim. 1971, 5, 1598.
[54] Dahn, J. Phys. Rev. B: Condens. Matter 1991, 44, 9170.
[55] McKinnon, W. Insertion electrodes I: Atomic and eletronic structure of te hosts
and their insertion compounds. In Solid State Electrochemistry ; Cambridge
University Press: Cambridge, 1995.
[56] Peled, E. J. Electrochem. Soc. 1979, 126, 2047.
[57] Aurbach, D.; Markovsky, B.; Schechter, A.; Ein-Eli, Y. J. Electrochem. Soc.
1996, 143, 3809.
[58] Ohzuku, T.; Ueda, A.; Yamamoto, N. J. Electrochem. Soc. 1995, 142, 1431.
[59] Ohzuku, T.; Tatsumi, K.; Matoba, N.; Sawai, K. J. Electrochem. Soc. 2000,
147, 3592.

References 55
[60] Owen, J. Colloids Surf. Rev. 1997, 26, 259.
[61] Yang, J.; Winter, M.; Besenhard, J. O. Solid State Ionics 1996, 90, 281.
[62] Idota, Y.; Kubota, T.; Matsufuji, A.; Maekawa, Y.; Miyasaki, T. Science
1997, 276, 1395.
[63] Taylor, B.; Kauslaurich, S.; Delgado, G.; Lee, H. Chem. Mat. 1999, 11,.
[64] Mayeri, D.; Phillips, B.; Augustine, M.; Kauzlarich, S. Chem. Mat. 2001, 13,
765.
[65] Anani, A.; Crouch-Baker, S.; Huggins, R. J. Electrochem. Soc. 1988, 135,
2103.
[66] Besenhard, J.; Komenda, P.; Paxinos, A.; Wudy, E.; Josowicz, M. Solid State
Ionics 1986, 18-19, 823.
[67] Mao, O.; Turner, R. L.; Courtney, I. A.; Fredericksen, B. D.; Buckett, M. I.;
Krause, L. J.; Dahn, J. R. Electrochem. Solid State Lett. 1999, 2, 3.
[68] Kepler, K. D.; Vaughey, J. T.; Thackeray, M. M. J. Power Sources 1999, 82,
383-387.
[69] Li, H.; Huang, X.; Chen, L.; Wu, Z.; Liang, Y. Electrochem. Solid State Lett.
1999, 2, 547.
References 56
[70] Kepler, K. D.; Vaughey, J. T.; Thackeray, M. M. Electrochem. Solid State Lett.
1999, 2, 307.
[71] Thackeray, M. M.; David, W.; Goodenough, J. J. Solid State Chem. 1984,
55, 280.
[72] Picciotto, L.; Thackeray, M. M. Mater. Res. Bull. 1986, 21, 583.
[73] Poizot, P.; Laruelle, S.; Grugeon, S.; Dupont, L.; Tarascon, J.-M. Nature
2000, 407, 496.
[74] Iodata, Y.; Kubota, T.; Matsufuji, A.; Maekawa, Y.; Miyasaka, T. Science
1997, 276, 1395.
[75] Courtney, I. A.; Dahn, J. R. J. Electrochem. Soc. 1997, 144, 2045.
[76] Courtney, I. A.; Dahn, J. R. J. Electrochem. Soc. 1997, 144, 2943.
[77] Goward, G.; Leroux, F.; Power, W.; Egami, T.; Dmowski, W.; Nazar, L. F.
Electrochem. Solid State Lett. 1999, 2, 367.
[78] Goward, G.; Nazar, L. F.; Power, W. J. Mater. Chem. 2000, 10, 1.
[79] Yang, J.; Raistrick, I.; Huggins, R. J. Electrochem. Soc. 1986, 133, 457.
[80] Alcantara, R.; Fernandez-Madrigal, F.; P. Lavela, J. T.; Jumas, J.-C.; Olivier-
Fourcade, J. J. Chem. Mat. 1999, 9, 2517.

References 57
[81] Fernandez-Madrigal, F. J.; Lavela, P.; Vicente, C. P.; Tirado, J. L.
J. Electroanal. Chem. 2001, 501, 205.
[82] Crosnier, O.; Souza, D. C. S.; Greedan, J. E.; Nazar, L. F. Reversible Lithium
Uptake by FeP2. In Material Research Society Symposium; MRS: Boston, 2002.
[83] Fransson, L. M. L.; Vaughey, J. T.; Edstrom, K.; Thackeray, M. M.
J. Electrochem. Soc. 2003, 150, A86.
[84] Fransson, L. M. L.; Vaughey, J. T.; Benedek, R.; Edstrom, K.; Thomas, J. O.;
Thackeray, M. M. Electrochem. Comm. 2001, 3, 317.
[85] Moriga, T.; Watanabe, K.; Tsuji, D.; Massaki, S.; Nakabayiasho, I. J. Solid
State Chem. 2000, 153, 386.
[86] Santos-Pena, J.; Brousse, T.; Schleich, D. Ionics 2000, 6, 133.
[87] Kim, H.; Cho, J.; Sohn, H.-J.; Kang, T. J. Electrochem. Soc. 2000, 146, 4401.
[88] Sakaguchi, H.; Maeta, H.; Kubota, M.; Honda, H.; Esaka, T. Electrochemistry
2000, 68, 632-635.
[89] Kim, Y. I.; Yoon, C. S.; Park, J. W. J. Solid State Chem. 2001, 160, 388-393.
[90] Lefebvre-Devos, M. L.; X. Wallart, J. Olivier-Fourcade, L. M.; Jumas, .-C.
Phys. Rev. B: Condens. Matter 2001, 63, 125110.

References 58
[91] Nazar, L. F.; Crosnier, O. Anode and composite anodes: an overview. In
Lithium Batteries: Science and Technology ; Springer: New York, 2004.
[92] Nishijima, M.; Tadokoro, N.; Takeda, Y.; Nobuyuki, I.; Yamamoto, O.
J. Electrochem. Soc. 1994, 141, 2966-2971.
[93] Pralong, V.; Rowsell, J. L. C.; Nazar, L. F. J. Am. Chem. Soc. 2001, 123,
8598-8599.
[94] Shodai, T.; Okada, S.; Tobishima, S.; Yamaki, J. Solid State Ionics 1995,
86-85, 785.
[95] Gudat, A.; Haag, S.; Kniep, R.; Rebenau, A. Z. Naturf. 1990, 456, 111.
[96] Juza, R.; Anschutz, E.; Puff, H. Angew. Chem. 1959, 71, 161.
[97] Suzuki, S.; Shodai, T. Solid State Ionics 1999, 116, 1-9.
[98] Shodai, T.; Sakurai, Y.; Suzuki, T. Solid State Ionics 1999, 122, 85.
[99] Souza, D.; Pralong, V.; Jacobson, A.; Nazar, L. Science 2002, 296, 2012.
[100] Kim, Y.-U.; Sohn, H. “Novel vanadium monophosphide (VP) insertion anode
material for lithium secondary batteries”. In Proceedings of the 207 ECS
Meeting ; Electrochemical Society: QC-Canada, 2005.
[101] Kim, Y.-U.; Cho, B. W.; Sohn, H. J. Electrochem. Soc. 2005, 152, A1475.

References 59
[102] Gillot, F.; Monconduit, L.; Morcrette, M.; Doublet, M.-L.; Dupont, L.;
Tarrascon, J.-M. Chem. Mat. 2005, 17, 3627.
[103] Gillot, F.; Monconduit, L.; Doublet, M.-L. Chem. Mat. 2005, 17, 5817.
[104] Zhang, Z.; Yang, J.; Nuli, Y.; Wang, B.; Xu, J. Solid State Ionics 2005, 176,
693.
[105] Alcantara, R.; Tirado, J.; Jumas, J.; Monconduit, L.; Oliier-Fourcade, J.
J. Power Sources 2002, 109, 308.
[106] Gillot, F.; Boyanov, S.; Dupont, L.; Doublet, M.-L.; Morcrette, M.;
Monconduit, L.; Tarrascon, J.-M. Chem. Mat. 2005, 17, 6327.
[107] Crosnier, O.; Nazar, L. F. Electrochem. Solid State Lett. 2004, 7, A187.
[108] Bichatt, M.-P.; Politova, T.; Pfeiffer, H.; Tancret, F.; Monconduit, L.;
Pascal, J.; Brousse, T.; Favier, F. J. Power Sources 2004, 136, 80.
[109] Bichatt, M.-P.; Politova, T.; Pascal, J.; Favier, F.; Monconduit, L.
J. Electrochem. Soc. 2004, 151, A2074.
[110] Pfeiffer, H.; Tancret, F.; Brousse, T. Electrochim. Acta 2004, 50, 4763.
[111] Pfeiffer, H.; Tancret, F.; Bicatt, M.-P.; Monconduit, L.; Favier, F.; Brousse, T.
Electrochem. Comm. 2004, 6, 263.

References 60
[112] Crosnier, O.; Mounsey, C.; Herle, P. S.; Taylor, N.; Nazar, L. F. Chem. Mat.
2003, 15, 4890.
[113] Bichatt, M.-P.; Pascal, J.; Gillot, F.; Favier, F. Chem. Mat. 2005, 17, 6761.
[114] Kim, Y.-U.; Lee, C.; Sohn, H.; Kang, T. J. Electrochem. Soc. 2004, 151,
A933.
[115] Bichatt, M.-P.; Gillot, F.; Monconduit, L.; Favier, F.; Morcrette, M.;
Lemoigno, F.; Doublet, M.-L. Chem. Mat. 2004, 16, 1002.
[116] Doublet, M.-L.; Lemoigno, F.; Gillot, F.; Monconduit, L. Chem. Mat. 2002,
14, 4126.

Chapter 3
Techniques and Methodologies
3.1 Electrochemistry
The voltage-composition relation was determined using intermittent techniques in
either current or potential controlled mode. These two techniques, usually referred to
as “Galvanostatic Intermittent Titration Techniques” (GITT)1 and “Potentiostatic
Intermittent Titration Techniques” (PITT),2 are described below.
3.1.1 GITT
In this method one applies a constant current to the system for a period of time,
generating successive charge increments. The system is then allowed to relax at
open circuit until it establishes equilibrium (no significant variation in voltage with
61

Chapter 3. Techniques and Methodologies 62
time). This technique allows the determination of equilibrium potential for a given
reaction. Additionally, it gives information on the kinetics of the process (e.g. ohmic
drop, chemical diffusion coefficient, partial ionic conductivity, etc.) with an accuracy
that depends on the conditions of the experiment, particularly the duration of the
current-on period and the geometry of the electrode.
3.1.2 PITT
In the case of PITT, small steps of voltage are imposed to the electrode while recording
the current response over a period of time. The system is then relaxed at open
circuit until its potential reaches equilibrium, which will be as close to the previously
applied potential as the final current was negligible at the cut-off. Integration of the
chronoamperometric response gives the charge increment (∆Q =∫
I(t)δt), whereas
its shape can give information on the kinetics of the process.
Thompson proposed an extension of the PITT protocol as a technique named
Electrochemical Potential Spectroscopy (EPS).3,4 It consists of applying a series of
small voltage steps to the electrochemical cell and allowing it to relax until the
current decays to a limit value (Ilimit = C/300), considered negligible compared to
the capacity of the system, thus obtaining quasi-equilibrium incremental capacities
at periodic potential intervals corresponding to the potential step amplitude. The
plot of ∆Q vs. V in such an experiment is the incremental capacity voltamogram

Chapter 3. Techniques and Methodologies 63
of the reduction/oxidation, i.e. a spectrum of the redox states of the system,
obtained with the resolution of the potential step amplitude. This technique permits
the determination of the system phase diagram, with identification of single-phase
domains and two-phase equilibrium, and of thermodynamic and kinetic properties.5,6
Following is a brief version of the detailed derivation presented in the literature.7
Monophasic Systems
Ionic diffusion controls the kinetics of a monophasic electrochemical reaction. For
short times, the diffusion is approximately infinite and the system obeys Fick’s law:
F lux = J = −Ddc
dx(3.1)
I =nFD1/2c
π1/2t1/2(3.2)
with D the diffusion coefficient, c the concentration of the diffusing species, x the
path of diffusion, F Faraday’s constant, and n the number of electrons involved in the
overall reaction. Solution of Equation 3.1 leads to the Cottrell equation 3.2, which
describes the chronoamperometric behaviour of single-phase processes in transient
state. At equilibrium conditions, the over-potential η = E − E0 is small and the
current is given by the Tafel equation:
I =nFI0
RT(E − E0) (3.3)

Chapter 3. Techniques and Methodologies 64
Biphasic Systems
Electrochemical reactions leading to the formation of immiscible phases display very
different I vs. t transient behaviour, usually containing a rising portion, indicative of
the presence of a nucleation step. Charge transport through the inter-phase surface
S by carriers with mobility µ generates a current defined as:
I ∝= µS(E − E0) (3.4)
where (E − E0), the driving force for the reaction, originates from:
1. For a phase transformation involving homogeneous nucleation of the new phase,
the mobility of the charge carriers in the two phases controls the reaction and
the current tends to have a constant value, proportional to the over-potential.
Extrapolation of the potential to the limit of zero current (Figure 3.1(a)) gives
the approximate value of the equilibrium potential for the reaction:
2. The mobility of the inter-phase A-B limits the reaction kinetics of reactions
controlled by the heterogeneous nucleation of the phase B on surface A; the
current response to an applied potential V (above the equilibrium) varies with
time and the area of the inter-phase (Figure 3.1(b)). The nucleation process
can be of two types, instantaneous and progressive, and overlap of the growth
centers may occur leading to two expressions for the current density:
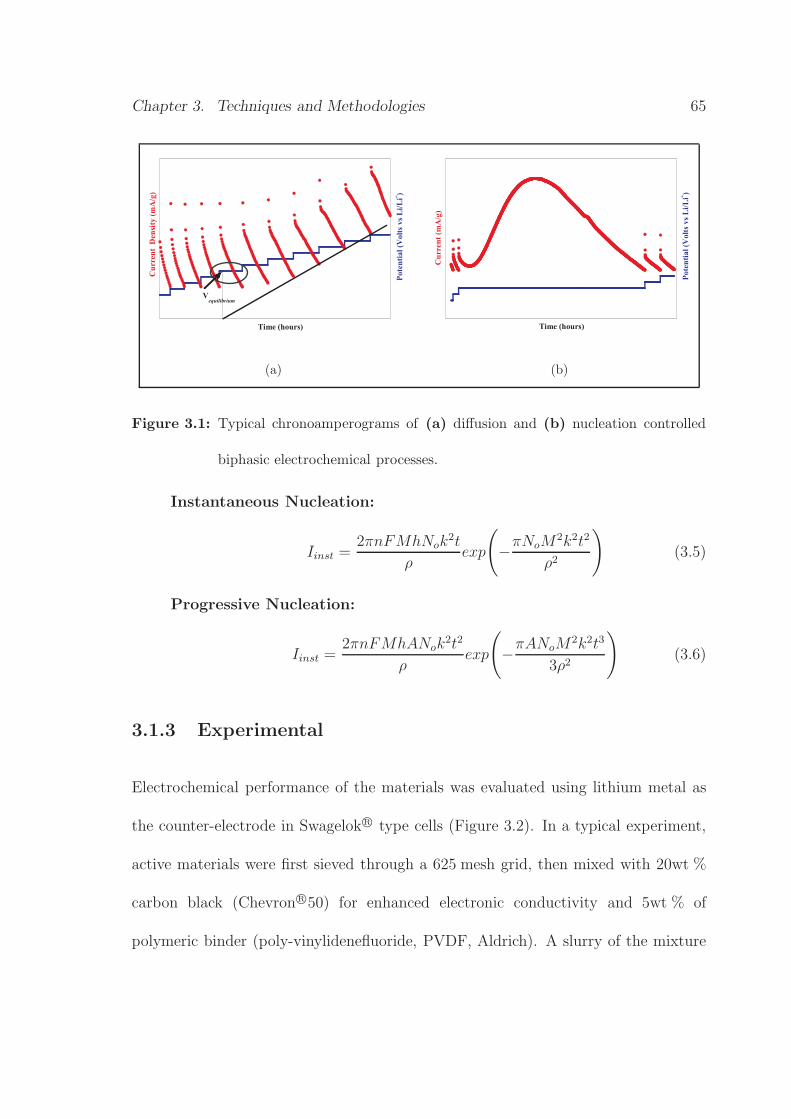
Chapter 3. Techniques and Methodologies 65
(a) (b)
Figure 3.1: Typical chronoamperograms of (a) diffusion and (b) nucleation controlled
biphasic electrochemical processes.
Instantaneous Nucleation:
Iinst =2πnFMhNok
2t
ρexp
(
−πNoM
2k2t2
ρ2
)
(3.5)
Progressive Nucleation:
Iinst =2πnFMhANok
2t2
ρexp
(
−πANoM
2k2t3
3ρ2
)
(3.6)
3.1.3 Experimental
Electrochemical performance of the materials was evaluated using lithium metal as
the counter-electrode in SwagelokR© type cells (Figure 3.2). In a typical experiment,
active materials were first sieved through a 625 mesh grid, then mixed with 20wt %
carbon black (ChevronR©50) for enhanced electronic conductivity and 5wt % of
polymeric binder (poly-vinylidenefluoride, PVDF, Aldrich). A slurry of the mixture

Chapter 3. Techniques and Methodologies 66
in cyclopentanone was then cast on nickel disks and weighed after solvent evaporation.
The cast material was dried for at least 4 hours at 120 ◦C and then transferred to
an argon-filled glove-box where the cells were assembled using a fibreglass separator
between the anode and the cathode. Except for the study of the influence of electrolyte
composition on the electrochemical properties of FeP2 system, presented in Chapter 5,
a 1 M solution of LiPF6 in a 1:1 mixture of EC/DMC (SelectipurR©, Merck) was
employed as electrolyte. Electrochemical experiments were carried out in a MacPileR©
Figure 3.2: Schematic representation of a Swagelok type cell.
potentiostat controller (Biologic S.A., Claix, France). Galvanostatic experiments were
carried out at different rates of intercalation (C/n, where C is the number of lithium
intercalated per n hours) between preset voltage limits. GITT data was collected
using current pulses of equivalent galvanic rate C/30 or C/50, followed of relaxation
periods at OCV limited by voltage changes equal or less than 1mV. Potentiostatic
experiments were performed using voltage steps of 5 to 15mV. Relaxation periods,

Chapter 3. Techniques and Methodologies 67
limited by the time to reach an equilibrium current equivalent to the galvanic rate
of C/n for each cell (PCGA, Potentiostatic Control with Galvanic Acceleration) or a
preset number of hours (whichever is less), were added to the protocols in PITT type
experiments.
3.2 X-ray Diffraction
3.2.1 Fundamentals
In 1912 Friedrich, Knipping and von Laue performed the first diffraction experiment
using single crystals of copper sulfate and zinc sulfite. Based on these experiments
Max von Laue developed his theory of X-ray diffraction. At the same time W. L.
Bragg and W. H. Bragg performed their diffraction experiments and in turn used
an equivalent alternative and simpler way of explaining the observed diffraction
phenomena – the Bragg’s law of diffraction (illustrated in Figure 3.2.1). Two X-
ray beams impinging upon a crystalline sample are reflected from various crystal
planes at specific angles relative to the incident beams. The incident beams 1 and 2
are in phase and, in order to obtain constructive interference, so must be the reflected
beams 1’ and 2’. To satisfy this condition, beam 22’ must travel an extra distance
ABC relative to beam 11’ and this distance must be equal to a whole number of
wavelengths. The distance d (d-spacing) between the two planes of atoms and the

Chapter 3. Techniques and Methodologies 68
angle of incidence θ (Bragg angle) are related to the distances AB and BC by:
AB = BC = d sinθ (3.7)
such that
ABC = 2d sinθ (3.8)
and since ABC = nλ, the Bragg’s law is derived as:
2d sinθ = n λ (3.9)
Figure 3.3: Schematic representation of Bragg’s diffraction from two consecutive planes
of atoms.
At angles of incidence different than the Bragg angle, the reflected beams are
out of phase and interact destructively. Correlation of d with standard data such as
from the JCPDS (Joint Committee on Powder Diffraction Standards) file, allows for

Chapter 3. Techniques and Methodologies 69
the identification of polycrystalline samples. The PDF method of analysis follows the
procedure outlined by HRF (Hanawalt, Rinn, and Frevel8). Basically, the d values and
intensities of the diffraction lines for the sample is compared with those of the standard
files; positive identification of a phase demands agreement within experimental errors
for both position and intensity of all lines. Since a powder sample can be regarded
as a polycrystalline mass with crystallites spread in all possible orientations, powder
XRD can also be used for structure determination. Despite the early development
of the powder diffraction method in 1916, however, it was used for nearly half a
century almost exclusively for qualitative and semi-quantitative phase analysis. This
changed completely with the development of the Rietveld method, a technique for the
refinement of crystal structures using the entire information of a powder diffraction
pattern.
Position of the Bragg Reflection
The dimensions of the unit cell defines the positions of the Bragg-reflections. If the
unit cell parameters are known, indexing of the diffraction pattern can be done by
applying the general formula:
dhkl =√
h2a∗2 + k2b∗2 + l2c∗2 + 2hka∗b∗cosγ∗ + 2hla∗c∗cosβ∗ + 2klb∗c∗cosα∗ (3.10)
where a∗, b∗, c∗, α∗, β∗, and γ∗ are the reciprocal lattice parameters.9

Chapter 3. Techniques and Methodologies 70
Intensity of the Bragg Reflection
The factors influencing the intensity of reflection lines are:
The atomic form factor (f0): Phase differences arise due to the facts that atomic
radii is of the order of X-ray wavelengths and the electrons are distributed over
the entire atomic volume. A reduction of the intensity of the scattered wave
with increasing scattering angle θ is observed. The numerical values for the
atomic form factors for most atoms and ions are tabulated in the International
Tables for Crystallography.10
The structure factor (Fhkl): It can be expressed as the Fourier sum over all atoms j
in a unit cell with the phase φ of the reflection (Equation 3.11) and the intensity
of a diffraction peak (Equation 3.12) is thus proportional to its squared value
(multiplication of the structure factor by its conjugate complex). Because of
the squaring, the differences in scattering power of the atoms are magnified. If
heavy atoms are present in the crystal structure, the phases of diffraction peaks
are mainly determined by these strong scatterers and the determination of the
positions of light atoms is of limited precision.
Fhkl =
N∑
j−1
fjexp[
2πi(
hxj + kyj + lzj
)]
= |F |exp(
iφ)
(3.11)

Chapter 3. Techniques and Methodologies 71
I ≈ |Fhkl|2 =
( N∑
j−1
fjcos2π(hxj + kyj + lzj)
)2
+
+
( N∑
j−1
fjsin2π(hxj + kyj + lzj)
)2
(3.12)
When the intensities are extracted from a diffraction pattern, several systematic
errors must be taken into account and the intensities corrected accordingly:
• The electrons oscillate perpendicularly to the direction of the beam. Therefore,
the component of the oscillation vector in the plane of incoming and diffracted
beam decreases with increasing diffraction angle 2θ. The polarization factor
corrects this effect.
• Diffraction arises when a reciprocal lattice node, which has a finite volume,
crosses the Ewald sphere. The intensity is proportional to the time that the
lattice node remains within the Ewald sphere. The so-called Lorentz factor
takes this effect into account and corrects for it.
• Absorption of X-rays in a crystalline material decreases the intensity depending
on the path-length through the sample. The intensity of the diffracted X-rays
is thus reduced by the factor
I/I0 = e−mx (3.13)
where x is the total path-length and m is the linear absorption coefficient of the
material.

Chapter 3. Techniques and Methodologies 72
• Intensity changes can occur after the X-ray generator is turned on to full power.
It is good practice to wait at least 12 hours before performing a measurement.
• ∗In flat plate powder diffraction geometry, the X-ray beam frequently spills over
the sample at low diffraction angles, underestimating the peak intensities.
• ∗Because of the large number of crystallites in random orientation present in
powder samples, the diffraction patterns are superimposed and form one or
more arcs depending on the orientation of the crystallites.
• ∗The multiplicity M stands for the number of reflections of a face set {hkl},
which have identical d-spacings and therefore overlap systematically in a powder
diffraction pattern. Depending on the crystal system, M can take values from
2 to 48; these values appear in the International Tables of Crystallography.10
• ∗Depending on the crystals’ preferred cleavage the powder grains usually assume
needle or plate-like shapes. On flat plate geometry measurements, the grains are
distributed preferably on the cleavage orientations promoting an enhancement
of the intensities of reflections with plane vectors similar to those of the preferred
orientation.
∗ These factors specifically influence measurements of powder samples.

Chapter 3. Techniques and Methodologies 73
Shape of the Bragg Reflection
The profile of a powder diffraction peak consists of three parts: the background, the
integrated intensity of the reflection, and the profile of the reflection. According to the
theory of diffraction, the pattern of polycrystalline samples consists of sharp lines (Full
Width at Half Maximum (FWHM) in the order of seconds of an arc).9 In practice, the
lines always present some degree of broadening which is determined by the crystallite-
size distribution, by the presence, nature and extension of lattice strains, and by the
spectral distribution of energy. The peak profile can thus be regarded as a interaction
of the spectral distribution of the X-ray radiation with the instrument (instrumental
broadening) and the real structure of the sample (sample broadening). A flexible and
physically meaningful description of the profile function of a powder diffraction peak
is crucial for the precise determination of peak parameters like the position, FWHM,
and intensity. Especially for intensity extraction from single peak or whole powder
pattern fitting, the selection of the ‘correct’ peak profile function mainly determines
the quality of the results.
Pseudo-Voigt function: If all geometrical and physical properties of the X-ray source,
the diffractometer and the sample were known, it would be straightforward to
calculate the peak profile function. In practice the realization of such procedure
is quite complicated; for routine work semi-empirical functions describing the
entire profile of a powder pattern using only few refinable and physically

Chapter 3. Techniques and Methodologies 74
meaningful parameters are used. Since most contributions to the line profile
can somehow be related to Lorentz or Gauss distributions, a combination of the
two functions is often used, the so called pseudo-Voigt function.
Axial divergence: The diffracted radiation in X-ray powder diffraction is distributed
over cones (Debye-Scherrer cones) with opening angle 4θ. These cones intersect
the surface of a cylinder that contains the receiving slit of the detector forming
ellipsoids. Only the segments of ellipsoids which have the same height as the
receiving slits are measured. The smaller the diffraction angle, the smaller the
radius of the diffraction cones and the larger the bending of the ellipsoids and
therefore the asymmetry of the recorded diffraction peaks. The asymmetry is
further increased by the height of the sample, which causes additional diffraction
cones with axes above and below the central cone.
Sample broadening: Two sources for broadening of the powder diffraction profiles
are related to the sample history, namely:
Crystallite size: In 1918 Scherer introduced a treatment approaching the
particle size effect.11 According to Scherrer, it is possible to determine
the average coherence length, which can be roughly approximated to the
average crystallite size, by measuring the FWHM of the diffraction peaks
corrected for the contributions from the diffractometer. The thickness
of a crystallite consisting of p lattice planes of thickness d calculates to

Chapter 3. Techniques and Methodologies 75
Lhkl = p · d. The relation between Lhkl and the FWHM of the diffraction
peak can be derived from the Bragg equation
Bhkl = 4ε1/2 =4 · 1.4λ
2π p d cosθ=
0.89λ
Lhkl cos θ(3.14)
where Bhkl is FWHM, λ the wavelength of incident beam, L the average size
of crystallites, and θ the diffraction angle. The instrumental contribution
can be subtracted from the experimental data by running a strain-free,
flawless standard either mixed with the sample or in a separate experiment
under the same conditions, or by annealing part of the sample and obtain
its diffraction pattern. The annealed material supposedly consists of
perfect crystals large enough so that any line broadening should be caused
solely by instrumental effects. By subtracting these effects from the pattern
of the non-annealed sample, the remaining broadening is due to the particle
size distribution.
Lattice strain: Strain in a crystal lattice is a distribution of lattice parameters
around an average value caused by defects, not by an external force. A
sample with anisotropic strain produces peak broadening in reciprocal
space which is augmenting with increasing distance of the reflections from
the origin.

Chapter 3. Techniques and Methodologies 76
The Rietveld Method
The Rietveld12 method consists of calculating the entire powder pattern using a
variety of refinable parameters. The calculated intensity yi(calc) for a mixture of
phases p contributing H Bragg reflections to the pattern at point i of the powder
pattern is given by
yicalc=∑
p
(
Sp ·∑
pH
(
MpH ·ApH(2θi) ·PpH · |FpHcalc|2 ·LP (2θi)
)
)
+ Biobs(3.15)
where Sp, MpH , ApH(2θi), PpH , |FpHcalc|2, LP (2θi), ΦpH(2θi), and Biobs
represent
the scale factor, multiplicity, absorption correction, preferred orientation correction,
squared absolute value of the structure factor, Lorentz-polarization correction,
normalized profile function, and background contribution, respectively. These
parameters can roughly be divided into three categories: structural parameters, which
mainly affect the intensity of the Bragg reflections; profile parameters, which are
determined by the instrument and the sample; and background parameters. For the
calculation of any single point of the diffraction pattern, all reflections contributing
to this point as well as the height of the background must be taken into account. The
scale factor is used for quantitative phase analysis, the structure factor for refinement
of the crystal structure, and the profile function for the refinement of the micro-
structure (micro-strain, domain size). The weighted sum of the squared differences
between the observed and the calculated powder pattern is minimized by refining
a selection of parameters using least squares methods. The quality of a Rietveld

Chapter 3. Techniques and Methodologies 77
refinement is commonly judged using the weighted profile Rwp-factor:
Rwp =
√
√
√
√
√
√
∑
i
wi
(
yiobs− yicalc
)2
∑
i
wiy2iobs
(3.16)
The graphical representation of a Rietveld refinement shows the observed powder
pattern, the best Rietveld fit profile, the reflection positions and the difference curve
between observed and calculated profiles as the trace below. Due to the decrease of
scattering power at higher diffraction angles, the high angle part is often enlarged.
The major advantage of the Rietveld procedure is the iterative improvement of the
structural information. On the other hand, a reasonably good structural model is
required in advance to ensure the convergence of the refinement.
The LeBail Method
The LeBail13 method is a widely used technique to refine the total envelope of a
powder pattern without knowing the crystal structure and to extract intensities which
can later be used for crystal structure determination by direct methods. The basic
idea is relatively simple as the Le Bail method iterates the Rietveld decomposition
formula, meaning that whereas calculated structure factors |F | are entered in the
Rietveld decomposition formula, a set of identical |F | is given instead. The Rietveld
refinement calculates a set of “|Fobs|” from the decomposition formula, which are then
used as new |Fcalc| and so on.

Chapter 3. Techniques and Methodologies 78
3.2.2 Experimental
X-Ray Powder diffraction (XRD) patterns of the compounds were obtained using
Siemens D5000 or Bruker D8 Advantage diffractometers using CuKα radiation;
both diffractometers are equipped with diffracted beam monochromator. The
analysis of air-sensitive samples was done under argon atmosphere using a homemade
hermetically sealed sample holder (Figure 3.4).
Figure 3.4: Schematic representation of XRD sample holder for air-sensitive material.
3.3 Electron Microscopy
Electron microscopy (EM) takes advantage of the wave nature of rapidly moving
electrons. Whereas visible light has wavelengths from 4000 to 7000 A, electrons
accelerated to 10 keV have a wavelength of 0.12 A, well suited as an inter-atomic
probe. For the same reason, optical microscopes have their resolution limited by
the diffraction of light to about 1000 diameters magnification while modern electron
microscopes scan specimens with resolution of 1 nm at magnifications of up to

Chapter 3. Techniques and Methodologies 79
1 million times.
Electron microscopes are often coupled with x-ray analyzers. The interactions
between high energy electron beam and sample generated x-rays are characteristic of
the elements present in the sample. Placing a suitable detector (Energy Dispersive
X-ray detector, EDX) near the specimen allows for the determination of the sample
composition as well as distribution of elements throughout the surface. Quantities
down to one thousandth of a picogram or less can thus be detected.
Figure 3.5: Schematic representation of Scanning and Transmission Electron Microscopy.
When using a Scanning Electron Microscope (SEM), insulating or poorly
conductive samples are first coated with a metal that readily reflects electrons. This
coating also provides a conducting surface for electrons to avoid charging of the

Chapter 3. Techniques and Methodologies 80
sample. The incoming electron beam is condensed into a small beam which is scanned
over the object. An image is formed by the electrons that bounce off the surface of
the specimen and are then collected onto the imaging screen. The observer therefore
sees a picture of the surface of the sample, without any internal information.
The primary imaging method used in SEM (Figure 3.5) is by collecting secondary
electrons that are released by the sample. The secondary electrons are detected by
a scintillation material that produces flashes of light from the electrons. The light
flashes are then detected and amplified by a photomultiplier tube. By correlating the
sample scan position with the resulting signal, an image strikingly similar to what
would be seen through an optical microscope forms, with quite natural looking surface
topography. Another imaging mode uses the intensity of the electrical current induced
in the specimen by the illuminating electron beam to produce an image, often used to
show subsurface defects. A third option is the analysis of backscattered high energy
electrons that emerge nearly 180 degrees from the illuminating beam direction. The
backscatter electron yield is a function of the average atomic number of each point
on the sample, and thus can give compositional information.
In Transmission Electron Microscopy (TEM, Figure 3.5) the image formed is a
projection of the entire object under investigation, including the surface and internal
structures. An electron beam is focused onto a thin sample and magnetic lenses
focus the image onto a fluorescent screen, a film plate or a video camera. With
samples of 200 nm thickness, scattering from the interaction with matter are limited

Chapter 3. Techniques and Methodologies 81
and beam coherence is maintained. In the presence of crystalline phases, a diffracted
beam also originates from the sample. Two imaging modes are defined in TEM,
namely Bright Field (when the aperture is positioned to pass only the transmitted
electrons) and Dark Field (when the aperture is positioned to pass only specific
diffracted electrons). Contrast images can be originated by transmission, showing
inhomogeneities in thickness or composition (with light and heavy atoms unevenly
distributed), or by diffraction. In the vicinity of a lattice defect, a diffraction
inhomogeneity may occur, which corresponds to a local variation of the diffracted
vs. transmitted intensity. In high-resolution mode at high magnification, periodic
fringes may be visible representing a direct resolution of Bragg diffraction planes. The
observed contrast is then referred to as a phase contrast. In addition to the direct
image, a diffraction pattern of a selected area of the specimen can me generated by
positioning an intermediate aperture in the image plane of the objective lens. The
image formed by Selected Area Electron Diffraction (SAED) is a series of spots or
rings which reflect the reciprocal space of the crystal lattice. The distance r between
the spots is related to d, the interplanary spacings of the crystals, by the “camera
equation”:
rd = λ L (3.17)
where the camera-length, L, is characteristic of the microscope.
Chapter 3. Techniques and Methodologies 82
3.3.1 Experimental
SEM
SEM analysis of pristine and cycled samples were performed using a LEO Gemini 1530
microscope with Field Emission Gun XL-30 using both secondary and backscattered
electrons for imaging and an EDX detector for compositional evaluation. Small
amounts of samples were loaded on a holder previously covered with carbon tape. To
prevent charging, all samples were coated with a thin layer of gold using a sputtering
device. Air sensitive cycled samples were assembled inside an argon filled glove-box
and transfered to individual air-tight vials and from these to the coating chamber
under nitrogen flow.
TEM
TEM analysis of pristine and cycled samples was performed using a Phillips CM12
microscope equipped with an EDX detector. Both bright and dark field images were
obtained as well as selected area diffraction patterns of crystalline samples. The
specimens were prepared by immersing a carbon grid in a suspension of the sample
in dry hexane. Air sensitive samples were mounted on the sample holder inside an
argon filled glove-box, enclosed in an air-tight plastic bag and then quickly transfered
to the vacuum chamber to avoid contact with air.

Chapter 3. Techniques and Methodologies 83
3.4 X-ray Photoelectron Spectroscopy
3.4.1 Principles
The principle of photo-emission was first explained by Einstein in 1905, in the frame
of his theory on light quanta.14 Photons can interact and transfer energy to electrons,
exciting them from an occupied to a higher unoccupied state. If the excitation energy
hν is larger than the binding energy W of the electrons to a system, the electron will
escape the system with a kinetic energy Ek (Figure 3.6). According to the energy
conservation principle:
Ek = hν − W (3.18)
A solid sample irradiated with x-rays in vacuum emit electrons that can be counted
Figure 3.6: Schematic representation of the photo-emission process (EB refers to the
binding energy).15

Chapter 3. Techniques and Methodologies 84
within a selected energy range to obtain the energy distribution curve, a plot of the
number of electrons collected as a function of their kinetic energy. The number of
collected electrons corresponds in a first approximation to the density of (occupied)
electronic states (DOS). For convention, W is split into two terms, the binding energy
BE and the work function Φ, so that the energy distance of the emitting electronic
state from the sample Fermi level (EF ) is BE, which is the typical value used to
represent the energy scale. Equation 3.18 can then be written as
Ek = hν − (BE + Φ) (3.19)
Sample and spectrometer are kept in electrical contact to achieve a common Fermi
level; however, the analyzer work function ΦS is generally different from that of the
sample. The kinetic energy ESk measured by the analyzer differs from Ek because
of the acceleration (or retardation) due to the electrical field between sample and
analyzer. The measured kinetic energy is thus
ESkin = hν − (BE + ΦS) (3.20)
If a metallic sample is used, ESk measured for the Fermi edge (BE = 0) can be readily
identified as the largest kinetic energy where signal is detected. Given the photon
energy, the ΦS plus BE scale is obtained:
ES(EF )k − ES
k = BE (3.21)
Photoelectron spectroscopy is based on photonic excitation from a monochromatic
source.15 Two adequate light sources and therefore two different techniques are

Chapter 3. Techniques and Methodologies 85
known, namely XPS and UPS (X-ray and Ultraviolet Photoelectron Spectroscopy,
respectively) as summarized in Table 3.1. Because electrons must travel from the
sample to the analyzer, a vacuum of at least 10−6 mbar is required. Owing to
the technique’s surface sensitivity, any adsorbate present (chemical or physical)
significantly alters the spectra. With a partial pressure of 10−10 mbar, one mono-layer
of species with unity stacking probability would deposit in 3 hours; practically, a total
pressure 10−10 mbar generally prevents contamination for a period much longer than
the time required for the measurement. These vacuum levels can be achieved with
standard UHV (Ultra High Vacuum) equipment based on turbo molecular pumps
connected to rotary vane or membrane rough pumps – typically able to reach a
pre-vacuum of 4.10−2 mbar. In the absence of leaks, after venting, pressures of the
order of 10−10 mbar are promptly reached by baking the system for at least 8 hours
at 130 − 180 ◦C, depending on the chamber size. Each element has a characteristic
disposition of electronic states that can be easily recognized in a spectrum which
extends between 1000 and 0 eV. With the exception of H and He, each element can
be detected down to a sensitivity of the order of 0.1 atom percent. The peak position
can vary within several eV , depending on the element’s chemical environment, which
can be used for chemical identification. Usually, the larger the electron density at
an atom, the lower the BE of the corresponding core levels. As a consequence,
the oxidation state of the species controls the chemical shift (electrons from a more
reduced atom have a lower binding energy) and the differences can reach some units

Chapter 3. Techniques and Methodologies 86
Table 3.1: Types of photoelectron spectroscopy according to photon source.
Spectroscopy Photon Type Source Application
XPS X-raysAl and Mg Kα Core Level Orbitals
Synchroton Adsorbates and
Surface States
UPS UV He Iα and IIα Valence Shells
Molecular Orbitals
Energy Bands
of eV. Characteristic binding energies for many compounds are given in several
literature surveys.15 The peak positions may also change due to sample charging
after the ionization process. For conducting specimens this is avoided because emitted
electrons are replaced with an electron flow from the spectrometer in electric contact
with the sample. In insulators a static charge (usually positive) builds up, changing
the observed binding energies by up to several eV. This change can be minimized
using a low energy flood gun or ion neutralizers.
3.4.2 Experimental
XPS analysis was performed using a VG Scientific XPS Microprobe ESCALab 250
(with focused monochromatic Al Kα radiation of energy 1486.6 eV, with a chamber
pressure <10−10 mbar) on an irradiated area of 0.4 x 1mm2. The cycled samples

Chapter 3. Techniques and Methodologies 87
were opened in the dry-box, washed with acetonitrile and transferred to the XPS
analysis chamber through a sample load-lock system to prevent air exposure. Charge
compensation was employed during data collection using a combination of a low
energy flood gun and low energy ions. The electron binding energies were calibrated
setting the positions of Cu 3p at 75.14 eV.16 Throughout this text (Chapter 6), the
binding energies are given as the difference from the Fermi level. Thus, a lower
kinetic energy corresponds to a higher BE. The peaks corresponding to the core levels
are indicated with the main quantum number and the orbital angular momentum
(s, p, d, f) of the hole left in the final state.
3.5 X-ray Absorption Spectroscopy
The intensity of an X-ray beam is attenuated after passing through a medium
according to
I = I0e−µ t (3.22)
where I0 and I are the intensities of incident and transmitted beams and µ and t the
linear absorption coefficient and thickness of the absorber. EXAFS (Extended X-ray
Fine Structure) and XANES (X-ray Absorption Near Edge Structure) spectroscopies
are based on the measurement of the absorption coefficient µ as a function of the
photon energy E above the threshold of an absorption edge. A photoelectron ejected
from X-ray absorption by an isolated atom travels as a spherical wave. In the presence

Chapter 3. Techniques and Methodologies 88
of neighbouring atoms, however, the outgoing photoelectron can be backscattered.
The outgoing and incoming wave can interfere either constructively or destructively
causing an oscillatory behaviour of the absorption rate. The amplitude and frequency
of the sinusoidal modulation of µ vs. E depend on the number, type, and bonding
of the neighbouring atoms and their distances away from the absorber.17 Figure 3.7
illustrates this process qualitatively.
(a) (b)
Figure 3.7: Schematic representation of (a) electron backscattering process and (b)
resulting spectrum in XAS experiment.
In XANES analysis, the region of the absorption edge is under scrutiny. The exact
position of the edge depends upon the oxidation state, site symmetry, surrounding
ligands, and nature of bonding.18 On the other hand, in EXAFS a wider energy
range is examined (up to 1 keV above the absorption edge). Fourier transform can
be employed in the analysis of the ripple pattern present in this region, providing

Chapter 3. Techniques and Methodologies 89
information on local structure and bond distances. Because in EXAFS the absorption
edge of each element present in a sample can be monitored, the local structure of
each element may be determined. As a result, EXAFS constitutes a valuable tool for
studying disordered materials.
3.5.1 Experimental
XAS analysis of pristine and cycled FeP2 samples (Chapter 5) was performed at LURE
(Orsay, France) using X-ray synchrotron radiation emitted by the DCI storage ring
(1.85 GeV, average intensity 250 mA). Data were collected in the transmission mode
at the FeK edge on XAS 4 spectrometer, using a double-crystal monochromator
Si(111) for EXAFS analysis and Si(311) for XANES analysis. XANES spectra were
recorded by steps of 2 eV with 1 second of accumulating time per point within the
7060–7090 and 7140–7310 eV energy range and 0.25 eV with an accumulating time
of 1 second between 7090 and 7140 eV. For each sample, three EXAFS spectra were
recorded between 7000 and 8100 eV, with an accumulating time of 2 seconds for each
point, split by 2 eV steps. The analysis of the data was performed in a classical way
using the WINXAS code.19 The amplitude and phase functions were extracted from
the Feff tables.

Chapter 3. Techniques and Methodologies 90
3.6 Magnetic Measurements
Materials may be classified by their response to externally applied magnetic fields
as diamagnetic, paramagnetic, or ferromagnetic, which differ greatly in strength.
Diamagnetism is a property of all materials and opposes applied magnetic fields,
but is very weak. Paramagnetism, when present, is stronger than diamagnetism
and produces magnetization proportional to and in the direction of the applied field.
Ferromagnetic effects produce magnetizations sometimes orders of magnitude greater
than the applied field and as such are much stronger than either diamagnetic or
paramagnetic effects. The magnetization of a material is expressed in terms of density
of net magnetic dipole moments m in the volume V of material. The magnetization
M is defined by M = mtotal/V so the total magnetic field B in the material is given
by
B = B0 + m0M (3.23)
where m0 is the magnetic permeability of space and B0 is the externally applied
magnetic field. When magnetic fields inside of materials are calculated using Ampere’s
law or the Biot-Savart law, then the m0 in those equations is replaced by just m which
is defined as
m = Km m0 (3.24)
where Km is the relative permeability. If the material does not respond to the external
magnetic field by producing any magnetization, then Km = 1. For diamagnetic

Chapter 3. Techniques and Methodologies 91
materials the relative permeability is very close to 1 and the magnetic susceptibility
very close to zero. Paramagnets, on the other hand, exhibit mass susceptibilities in
the range 10 − 300 m3/kg, whereas for ferro-, ferri-, and antiferromagnetic materials,
these quantities can reach values in the order of 100000 m3/kg. Another way to deal
with the magnetic fields which arise from magnetization of materials is to introduce
a quantity called magnetic field strength H , defined by the relationship
H =B0
m0=
B
m0− M (3.25)
The magnetic field strength unambiguously differentiates the magnetic influence from
external currents in a material, independent of the material’s magnetic response. The
relationship for B above can be written in the equivalent form
B = m0 (H + M) (3.26)
The ratio of the magnetization M to the applied field H is defined as the magnetic
susceptibility :
χ =M
H(3.27)
3.6.1 SQUID
A SQUID (Superconducting Quantum Interference Device) consists of a closed
superconducting loop. If a sample is moved through the superconducting coils, it
induces an electric current in the detection coils that is proportional to the change

Chapter 3. Techniques and Methodologies 92
in magnetic flux. Hence, the SQUID functions as a highly linear current-to-voltage
convertor, so the variations in the voltage output are proportional to the magnetic
moment of the sample.
3.6.2 Mossbauer Spectroscopy
The recoil-free absorption of γ-ray photons by nuclei in a crystalline solid is known
as the Mossbauer effect. One of the few isotopes which exhibits the Mossbauer effect
is 57Fe which is naturally occurring in iron. The Mossbauer effect is used in the
corresponding spectroscopy in which a radioactive element is mechanically vibrated
back and forth to Doppler shift the energy of the emitted gamma radiation. The
source is moved relative to the sample and the intensity of the beam after it has
passed through the sample is monitored (Figure 3.8). The shift of the energy levels
Vibrator
ElectronicControl
DataAcquisition
DetectorRadioactiveSource
Sample
Figure 3.8: Schematic representation of Mossbauer effect and spectroscopy.
of the target nuclei, due to a variation in atomic environment, is measured in the

Chapter 3. Techniques and Methodologies 93
absorption spectrum as a function of velocity. If the sample nuclear levels are not
split and the I = 3/2 to I = 1/2 transition energy equals that of the source, then the
effective cross-section for absorption is a function of gamma energy as given by20
seff = [(2I ∗ +1)/(2I + 1)][l2/2p][f ′/2(1 + a)]G2nat/[(E − Eg)
2 + G2nat] (3.28)
where I = 1/2 and I∗ = 3/2 are the ground and excited nuclear spins, a = 9.0 is
the internal conversion coefficient (ratio of betas to gammas in the 14.4 keV decay),
l = 8.61 × 10⁻⁹ cm is the wavelength of the radiation, E − Eg is the difference
between mean incident and resonant gamma energy, G2nat is the energy width of the
excited nucleus, and f ′ is the probability of recoilless absorption. The spectrum
will be a single Lorentzian centered at v = 0 with a line-width (FWHM) of 2Gnat=
0.19 mm/sec. Hyperfine interactions will split the nuclear levels of the sample and
complicate the Mossbauer spectrum.
Isomer Shift
The nucleus and its electrons interact in several ways, the most obvious being the
electrostatic attraction. In fact the excited Fe57 nucleus is 0.1% smaller in radius than
the ground state nucleus, which causes the Mossbauer transition energy to depend
on the electron density at the nucleus. This effect produces the so-called isomer shift
of the Mossbauer spectrum, which may be written as
δ = KSs|y0|2 − Sa|y0|
2 (3.29)

Chapter 3. Techniques and Methodologies 94
where d is the isomer shift, K is a positive constant depending on the change in the
nuclear radius, Ss|y0|2 is the electron density at the source nucleus, and Sa|y0|
2 is the
electron density at the absorber nucleus. The isomer shift provides information on the
valence state of the absorber. To allow isomer shifts to be measured independently of
the nature of the source, the centroid of the room temperature spectrum of metallic
iron has been adopted as the zero of energy level and all shifts are measured relative
to it. This convention yields
δn = K0 − KSa|y0|2 (3.30)
where K0 is a constant. The 1s and 2s electron density at the nucleus is independent
of the chemical environment of the Fe ion. However, the 3d electrons shield the
3s electrons and cause a decrease in the electron density at the Fe57 nucleus. The
more delocalized the 3d electrons, the smaller the isomer shift.21 The electronic
contribution to the isomer shift is essentially temperature-independent but a decrease
at high temperatures occurs due to the relativistic second order Doppler shift.
Electric Quadrupole Interaction
The excited state of the Fe57 nucleus possesses an electric quadrupole moment, and
the presence of a low symmetry electric field will tend to orient the nuclear spin. The
interaction may be written as
HQ = −(Q/6) I V (3.31)

Chapter 3. Techniques and Methodologies 95
where Q is the nuclear quadrupole moment, I is the nuclear spin, and V is the electric
field gradient (efg) tensor. Reversal of the sign of the nuclear spin does not change
the nuclear charge distribution. Therefore, the efg incompletely lifts the fourfold
degeneracy of the I = 3/2 states; the quartet is split into two doublets, while the
I = 1/2 states remain degenerate. Since two transition energies are now possible, two
absorption peaks will appear in the Mossbauer spectrum. If the recoil-free fraction
does not depend on the orientation of the γ-beam relative to the Fe site, a sample
with randomly oriented sites in zero applied field will produce a symmetric quadrupole
pair.21
Magnetic Hyperfine Interaction
The Fe57 nucleus possesses a magnetic moment and its energy levels will be perturbed
by the local magnetic field. Depending on the magnetic properties of the sample, the
internal field may or may not equal zero in the absence of the applied field. The
magnetic interaction is given by the sum of:21 (i) the field at the nucleus due to
the orbital motion of the electrons, (ii) the field due to the dipole moment of the
electrons, (iii) a Fermi contact term which accounts for any net polarization of the
electronic spin at the nucleus.

Chapter 3. Techniques and Methodologies 96
3.6.3 Experimental
Magnetic susceptibility and hysteresis loop measurements of pristine and cycled FeP2
samples (Chapter 5) were obtained with a SQUID MPMS 9T magnetometer. The
magnetic susceptibility χ(T) was measured in zero-field cooling (ZFC) and field
cooling (FC) modes in the temperature range 2 – 350 K and with an applied field
of 500G. The magnetization curves M(H) were obtained after cooling the sample to
the measurement temperature in zero field and then increasing the field from 0 to 5G.
In all cases, the powders were compacted into quartz sampling tubes; cycled samples
were prepared inside an argon filled glove-box.
The 57Fe Mossbauer spectra of pristine and cycled FeP2 samples (Chapter 5) were
recorded using a 57Co/Rh γ-ray source mounted on an electromagnetic drive and using
a triangular velocity form. Spectra were obtained in zero magnetic field at 78K. The
Mossbauer spectra were analyzed by least-squares fitting to a Lorentzian function.
The isomer shifts (IS) were referenced α-Fe at 300K. The sample (area=3 cm2) was
prepared by dispersion of the material (100 – 140 mg) in a specific resin.

References
[1] Weppner, W.; Huggins, R. J. Electrochem. Soc. 1977, 124, 1569.
[2] Weppner, W.; Huggins, R. Ann. Rev. Mater. Sci. 1978, 8, 269.
[3] Thompson, A. Phys. Rev. Lett. 1978, 40, 1511.
[4] Thompson, A. J. Electrochem. Soc. 1979, 126, 603.
[5] Chabre, Y. J. Electrochem. Soc. 1991, 128, 329.
[6] Chabre, Y. NATO ASI Series 1992, B305, 181.
[7] Southampton Electrochemistry Group, Instrumental Methods in
Electrochemistry; Ellis Horwood Series in Physical Chemistry John Wiley
& Sons: Chichester, 1985.
[8] Hanawalt, J.; Rinn, H.; Frevel, L. Ind. Eng. Chem. Anal. Ed. 1938, 10, 457.
[9] Klug, H.; Alexander, L. ”X-Ray Diffraction Procedures for Polycrystalline and
Amorphous Materials; John Wiley & Sons: New York, 2nd ed.; 1974.
97

References 98
[10] International Union of Crystallography, International Tables of Crystallography;
volume I-IV D. Riedel: Holland/Boston, 1983.
[11] Scherer, P. Zsigmondy’s Kolloidchemie; Verlag: Berlin, 3rd. ed.; 1920.
[12] Rietveld, A. Acta Cryst. 1967, 22, 151.
[13] LeBail, A.; Duroy, H.; Fourquet, J. Mater. Res. Bull. 1988, 23, 447.
[14] Einstein, A. Ann. Phys. 1905, 17, 132.
[15] Chastain, J., Ed.; Handbook of X-ray Photoelectron Spectroscopy; Perkin Elmer
Corporation: Eden Prairie, 1992.
[16] Seah, M. Surf. Interf. Anal. 1989, 14, 488.
[17] Teo, B. Extended x-ray absorption fine structure (EXAFS) spectroscopy:
techniques and applications. In EXAFS Spectroscopy Techniques and
Applications ; Teo, B.; Joy, D., Eds.; Plenum Press: New York, 1979.
[18] West, A., Ed.; Basic Solid State Chemistry; John Wiley & Sons, Ltd: Sussex,
1999.
[19] Ressler, T. J. Phys IV 1997, C2, 269.
[20] Fraunfelder, H. The Mossbauer Effect; W.A. Benjamin: New York, 1963.
[21] Greenwood, N.; Gibb, T., Eds.; Mossbauer Spectroscopy; Chapman and Hall:
London, 1971.

Chapter 4
Manganese Phosphide System
4.1 Introduction
The desirable candidate for an anode material in lithium-ion batteries should present
low formula weight, high lithium content variation, low redox potential relative to the
pair Li/Li+, and highly reversible lithium uptake/extraction reactions. Following this
rationale, new materials have been investigated as substitutes for graphitic carbon.
Many transition metal pnictides have been known for years but none was evaluated
for such applications until our seminal work,1 although many subsequent publications
have appeared since then (see Section 2.2.3, page 38).
99

Chapter 4. Manganese Phosphide System 100
4.1.1 Structure of MnP4 and Li7MnP4
The phase diagram for the system Mn–P shows three metal rich (Mn3P, Mn2P, and
Mn3P2), MnP, and one phosphorus rich (MnP4) compound.2 The first variant of
manganese tetraphosphide was synthesized in 1975 and five years later two other
variants were obtained, all with structure related to that of CrP4.3 The structure can
be viewed as a stacking of puckered networks of manganese and phosphorus atoms.
Bonding within and between the layers are of the same kind but the orientation
and connectivity of the layers vary. Depending on the number of subsequent layers
necessary for the formation a unit cell the three different manganese tetraphosphide
phases are formed, namely 2 -MnP4, 6 -MnP4, and 8 -MnP4. Manganese is in distorted
octahedral coordination with six P in all structures; however, the octahedra are
connected by edge or corner sharing depending on the stacking order of the structure.
Figure 4.1 shows the polyhedral representation for the three structures.
Li7MnP4 crystallizes with the antifluorite-type structure in the space group Fm3m
(Figure 4.2).4 Phosphorus atoms form a face-centered cubic (fcc) lattice, with
parameter of about 5.977 A and the tetrahedral sites are randomly occupied by
lithium and manganese in a 7:1 ratio. Additionally, Juza and Bohmann reported
the existence of thirteen other phases of general stoichiometry Li8−xMnxP4, where
0.67 6 x 6 4.0; compounds with higher manganese contents (x > 1.4) crystallize
in tetragonal symmetry.

Chapter 4. Manganese Phosphide System 101
a
bc
(a) 2 -MnP4
a
bc
(b) 6 -MnP4
ab
c
(c) 8 -MnP4
Figure 4.1: Polyhedral representation of the MnP4 structures.
a b
c
Figure 4.2: Polyhedral representation of the antifluorite-type Li7MnP4 structure.

Chapter 4. Manganese Phosphide System 102
The existence of thermodynamically stable lithiated and non-lithiated manganese
phosphide phases with the same Mn:P ratio raises some questions: (i) can lithium ions
be electrochemically added to the binary matrix? (ii) if so, is the process reversible?
(iii) what is the structure of the lithiated phase obtained? (iv) what is the mechanism
involved? Contemplation of these matters must not disregard the marked difference
between the structures of Li7MnP4 and MnP4. Transformation between the two
structures demands substantial rearrangement of the atoms within the lattice as well
as bond breaking and reforming. These aspects were investigated and are reported
herein.
4.2 Experimental
4.2.1 Synthesis of MnP4
Appropriate amounts of manganese, red phosphorous, and tin were mixed inside an
argon filled glove-box with the aid of a mortar and pestle and transfered to a quartz
tube (18mm OD x16mm ID). The tube was evacuated, sealed (final length ≈20mm),
transfered to a tube furnace and then heated to a specific temperature range for two
weeks. After this period, the quartz tube was quenched to room temperature in a
water bath. Table 4.1 summarizes the synthesis parameters employed in each reaction
variant. The resulting solid material was treated with at least three portions of 1:1
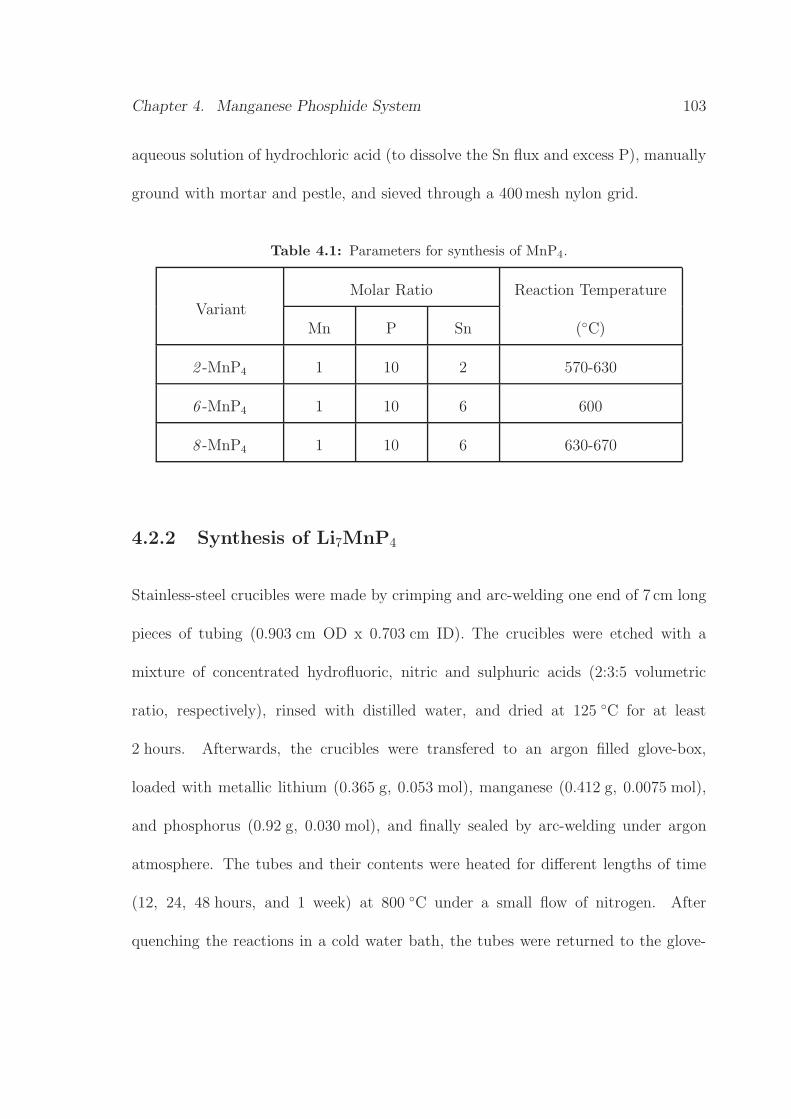
Chapter 4. Manganese Phosphide System 103
aqueous solution of hydrochloric acid (to dissolve the Sn flux and excess P), manually
ground with mortar and pestle, and sieved through a 400mesh nylon grid.
Table 4.1: Parameters for synthesis of MnP4.
VariantMolar Ratio Reaction Temperature
Mn P Sn (◦C)
2 -MnP4 1 10 2 570-630
6 -MnP4 1 10 6 600
8 -MnP4 1 10 6 630-670
4.2.2 Synthesis of Li7MnP4
Stainless-steel crucibles were made by crimping and arc-welding one end of 7 cm long
pieces of tubing (0.903 cm OD x 0.703 cm ID). The crucibles were etched with a
mixture of concentrated hydrofluoric, nitric and sulphuric acids (2:3:5 volumetric
ratio, respectively), rinsed with distilled water, and dried at 125 ◦C for at least
2 hours. Afterwards, the crucibles were transfered to an argon filled glove-box,
loaded with metallic lithium (0.365 g, 0.053 mol), manganese (0.412 g, 0.0075 mol),
and phosphorus (0.92 g, 0.030 mol), and finally sealed by arc-welding under argon
atmosphere. The tubes and their contents were heated for different lengths of time
(12, 24, 48 hours, and 1 week) at 800 ◦C under a small flow of nitrogen. After
quenching the reactions in a cold water bath, the tubes were returned to the glove-
Chapter 4. Manganese Phosphide System 104
box and cut open. Samples with different particle sizes were obtained by either
hand-grinding, using a mortar and pestle and sieving through a 200mesh nylon grid,
or by ball milling. In the second case, a silicon nitride crucible was loaded with
zirconia balls (7.5 mm in diameter) and 2 g of material inside an argon filled glove
box and mounted onto a high energy planetary mill (PulverisetteR© 6). The samples
were milled at 500 rpm for different periods of time (15, 30, and 60 min) and using
two different ball-to-powder mass ratios (1:9 and 1:15).
4.3 Characterization and Properties of MnP4 and
Li7MnP4
4.3.1 Structure and Composition of the Materials
The binary manganese phosphides were obtained as small black crystals. Figure 4.3
shows the diffraction patterns of the three variants, which match those reported in
the literature.3,5,6 Similarly to the early findings, the products always contain very
small amounts of another MnP4 variant or, to a lesser extent, of a lower phosphide.
The methodology described in the scientific literature for the synthesis of Li7MnP4
consists of a multi-step procedure: (i) preparation of LiP by melting lithium in a
tantalum open crucible (200 ◦C) and slowly adding small portions of phosphorus,
taking care that the reaction temperature does not raise above 400 ◦C. After 2 to

Chapter 4. Manganese Phosphide System 105
3 hours at this temperature, the material is cooled to room temperature, ground,
sealed inside a Ta tube and reheated at 600◦C for 4 hours, (ii) preparation of Li3P
by reaction of LiP with lithium using exactly the same procedure and temperarurs as
for LiP, and (iii) reaction of Li3P with manganese and phosphorus, first grinding the
starting materials, pressing a pellet, sealing it in a stainless-steel tube, that in turn is
sealed inside a quartz tube, annealing at 800 ◦C for 4-6 hours, and finally quenching
in cold water and grinding.4
Figure 4.3: XRD patterns of the variants (a) 8 -MnP4, (b) 6 -MnP4, and (c) 2 -MnP4
prepared by the Sn flux technique.
Undoubtedly, this is an intricate and time consuming procedure; however, it

Chapter 4. Manganese Phosphide System 106
did indicate that stainless-steel was not attacked by the Li3P, MnP, or Li7MnP4
phases. Based on this information, stainless-steel AISI-304 tubes were used to make
the reaction crucibles. This is a much cheaper alternative than the commonly used
noble metals (niobium, tantalum, and molybdenum). Although the melting point
of the AISI-304 stainless-steel is in the range of 1400-1420 ◦C, the tube contents are
very reactive and despite all manipulations being done under inert atmosphere, when
transferred to the welding chamber the tubes were briefly exposed to air. In case a
tube was not properly sealed, air could eventually penetrate the tube and reactions
of the elements with oxygen and/or water could result in explosion. Additionally,
oxidation of the crucible outer walls at high temperatures, thereby exposing the tube
contents, would also promote fire and/or explosive reactions. For these reasons, the
reactions were carried out under a small flow of nitrogen in order to reduce risk of
accidents. All in all, the developed procedure, i.e. through direct reaction of the
elements, constituted a much cheaper and safer route to obtain the desired ternary
phosphide.
XRD results (Figure 4.4) show that reactions stopped before 24 hours produced
materials contaminated with various amounts of LiP. The material obtained after
24 hours consisted of pure Li7MnP4 and, althoug above this time threshold one can
see a slight improvement on the phase crystallinity, heating for 1week promoted
some decomposition of into LiP. The XRD analysis shows no evidence of sample
contamination with by-products or decomposition of the crucible.

Chapter 4. Manganese Phosphide System 107
* *
*
*
*
*
Figure 4.4: XRD patterns of Li7MnP4 samples obtained at 800 ◦C after different reaction
times; * depicts lines relative to LiP contamination.

Chapter 4. Manganese Phosphide System 108
High energy mechanical ball milling under inert atmosphere (N2) was established
as a safe and efficient process for reducing the particle size of Li7MnP4 samples.
Elemental analysis of the milled samples based on SEM/EDAX confirmed the
presence of manganese and phosphorus, and the X-ray patterns solely display
broadened lines assigned to Li7MnP4 (Figure 4.5).
Using Scherer’s equation (see Chapter 3 Section 3.2, page 75), the average
coherence length (which can be roughly approximated to the average size of
crystallites) of the ball-milled samples was determined and compared to the material
before milling. The results obtained are presented in Table 4.2.
Table 4.2: Crystallite size of ball-milled Li7MnP4 samples determined by Scherer equation.
Sample Crystallite Size (nm)
Li7B 27
Li7C 82
Li7D 27
Li7E 68
No decomposition of the Li7MnP4 phase upon ball milling can be observed by
XRD, as shown in Figure 4.5; however, the particle size is noticeably reduced and,
generally, their coherent path length decreases from 72 nm in the pristine material
down to 27 nm in the ball-milled samples.

Chapter 4. Manganese Phosphide System 109
Li MnP A: t=0min; P/B=07 4
Li MnP B: t=30min; P/B=1/97 4
Li MnP : t= 0 ; P/B=7 4C 6 min 1/9
Li MnP D: t=30min; P/B=1/157 4
Li MnP E: t=15min; P/B=1/97 4
3 mm
300nm
200nm
200nm
300nm
Figure 4.5: XRD and SEM of Li7MnP4 samples ball-milled under inert atmosphere for
various length of time (t) using different powder to ball weight ratios (P/B).

Chapter 4. Manganese Phosphide System 110
4.3.2 Electrochemical Properties of Manganese Phosphide
Systems
Figure 4.6(a) shows the performance of 8 -MnP4 during the first cycle between
0.57 V and 1.7 V at different galvanic rates. Little or no lithium uptake was
observed at a rate of C/2 and up to seven Li+ (corresponding to a specific capacity
of 1050 mAh/g) were progressively inserted when the galvanic rate decreased to C/5
and C/10.
0.5
1.0
1.5
2.0
2.5
3.0
0 1 2 3 4 5 6 7 8
C/2
C/5
C/10
0 150 300 450 599 749 899 1049 1199
Uw
/V
x in LixMnP
4
Specific Capacity (mAh/g)
(a)
0.5
1.0
1.5
2.0
2.5
0 1 2 3 4 5 6 7 8
0 150 300 450 600 750 900 1050 1200
Uw
/V
x in LixMnP
4
Specific Capacity (mAh/g)
— 2-MnP4
— 6-MnP4
— 8-MnP4
(b)
Figure 4.6: Galvanostatic voltage-composition profiles for (a) 8 -MnP4 at different rates
and (b) different variants of MnP4 at C/10.
Figure 4.6(b) reveals that the electrochemical profiles for different variants are
quite similar both in terms of “intercalation” voltage and amount of lithium uptake.
This suggests that the stacking fault does not interfere with the intercalation

Chapter 4. Manganese Phosphide System 111
mechanism. Therefore, since a larger amount of the 8 -MnP4 variant was obtained,
the investigations proceeded using mainly this sample. All variants present a large
polarization between discharge and charge voltages at any rate of intercalation. The
equilibrium voltage for both processes was determined using GITT at very low rate
(C/50). As Figure 4.7 reveals, the difference in the equilibrium voltages is only
30 mV indicating that the reduction and oxidation processes are indeed the same.
The hysteresis observed in the voltage composition curves in Figure 4.6 result from
the over-potential needed for the transport of the phase-boundary in the phase
transformation process (see page 113).
The voltage-composition profile obtained for Li7MnP4 is very similar to that of
the non-lithiated material (Figure 4.8) with up to 7 lithium ions being removed
and re-inserted in the structure on the first cycle at equivalent voltages. Again, a
large polarization between the charge and discharge segments is observed and the
curves are also similar regarding the presence of plateaus at 0.64 V and 1.1 V on
the discharge and charge sweeps, respectively, evidencing the occurrence of a binary
(phase transformation or/and decomposition) process. From this result one can infer
that the electrochemical behaviour of the electrodes does not depend on the starting
material (lithiated or non-lithiated). In good agreement with the GITT data obtained
for MnP4, the PITT curves (Figure 4.8(b)) show that the equilibrium voltages for
oxidation and reduction are 1.07 and 1.02 V, respectively. Gillot and co-workers
calculated the density of states diagram for Li7MnP4 indicating the presence of a

Chapter 4. Manganese Phosphide System 112
Figure 4.7: GITT profiles during charge and discharge for 8 -MnP4 at C/50.

Chapter 4. Manganese Phosphide System 113
strongly correlated system, with the Fermi level lying in the Mn-P anti-bonding e-
type orbital.7 This suggests that a lithium removal from the this ternary phosphide
most likely involves a two phase reaction, in accordance with the electrochemical
results.
0.0
0.5
1.0
1.5
2.0
1 2 3 4 5 6 7 8
C/2C/10
150 300 450 600 750 900 1050 1200
Uw
/V
x in LixMnP
4
Specific Capacity (mAh/g)
(a)
30 40 50 600.5
1.0
1.5
2.0
Time (h)
Vol
ts vs.
Li/L
i+
Charge: UEq= 1.07 V
Discharge: VEq= 1.02 V
-100
-80
-60
-40
-20
0
20
40
60
80
100
Current D
ensity (mA
/g)
0 5 10 15 20 25 30 Time (h)
(b)
Figure 4.8: (a) Galvanostatic voltage-composition at different rates and (b) PITT profiles
for Li7MnP4.
Chronoamperometric Studies
The variation of the intercalation potential and the current response with time for
the cycle of binary and ternary phases is shown on Figure 4.9. A bell-shaped
current vs time curve is observed for the corresponding intercalation plateau at
0.62 V during the first discharge of MnP4 but not in the subsequent cycle; Li7MnP4
exhibits the same behaviour under similar conditions. These results indicate the

Chapter 4. Manganese Phosphide System 114
occurrence of a phase transformation or decomposition process during the first cycle;
in the subsequent cycles, the pattern is that of a monophasic process controlled by
the diffusion of the Li+ ions in and out the particles.8,9,9–11 Considering the large
difference between the structures of the non-lithiated and lithiated forms of manganese
phosphide, a phase transformation step upon cycling is in fact expected. It is not
obvious, however, whether this phase process occurs only during the first discharge
step, with partial reduction of manganese to form of a new structure, or by complete
reduction to Mn0 and LixPy followed by a simple intercalation/de-intercalation
process on subsequent cycles. Another possibility is that binary and ternary phases
completely inter-convert upon cycling and, in this case, the transformation process
could involve an intermediate phase. To investigate these hypotheses, the structure
and morphology of cycled samples were analyzed (Section 4.3.3).
0.50
0.75
1.00
1.25
1.50
1.75
-0.3
-0.2
-0.1
0.1
0.2
0.3
0 1 2 3 4 5 6
Vo
lts
vs
Li/
Li+
Cu
rren
t(m
A)
x in LixMnP
4
(a)
0.0
0.5
1.0
1.5
2.0
2.5
-0.7
-0.5
-0.3
-0.1
0.1
0.3
0.5
0.7
1.0 2.0 3.0 4.0 5.0 6.0 7.0 8.0
Vo
lts
vs.
Li/
Li+ C
urren
t(m
A)
x i nLixMnP
4
(b)
Figure 4.9: Chronoamperometric curves of (a) 8 -MnP4 and (b) Li7MnP4A.

Chapter 4. Manganese Phosphide System 115
Electrode Cycleability
Although full capacity can be achieved in the first cycle for both lithiated and
non-lithiated forms of manganese phosphides, the electrodes exhibited poor cycling
performance even at low galvanic rates (Figure 4.10). For MnP4, Figure 4.10(a), the
already small initial capacity was totally lost after 3 cycles at C/5. At C/10 the
reversible capacity started at 720 mAh/g, equivalent to almost 70 % reversibility; it
diminished to 350 mAh/g after 5 cycles and stayed at this level for up to 40 cycles.
Although not extremely high, this reversible capacity is better than that observed for
commercial carbon anodes and alternative materials such as alloys and oxides.12
0
100
200
300
400
500
600
700
800
0
1
2
3
4
5
0 10 20 30 40 50
Q mAh/g
Rev
ersi
ble
Ca
pa
cit
y(m
Ah
/g)
Cycle Number
xin
Lix M
nP
4
C/5C/10
(a)
0
200
400
600
800
1000
1200
0 5 10 15 20 25
Li7A@C/2
Li7A@C/10
Li7E@C/10
0
1
2
3
4
5
6
7
Rev
ersi
ble
Ca
pa
cit
y(m
Ah
/g)
Cycle Number
xin
Lix M
nP
4
(b)
Figure 4.10: Cycling performance of 8 -MnP4 and Li7MnP4 (samples A and E) electrodes
at different rates.
The rate dependence of cycling performance was also observed when starting with
Li7MnP4. The material showed some capacity at the C/2 fast rate and about the
same initial capacity as the non lithiated sample at C/10. Nevertheless, an even more

Chapter 4. Manganese Phosphide System 116
dramatic capacity fading is observed at C/10 rate, as depicted in Figure 4.10(b).
In an attempt to improve the electrochemical performance, samples of Li7MnP4
were ball-milled under different conditions (see page 108). Figure 4.11 shows that
the reduction of particle size and introduction of defects in the structure causes a
significant reduction in the length of the intercalation plateau. Although not direct
correlation can be made between the estimated particle sizes and the electrochemical
behaviour, it is clear that smaller particle sizes leads to an increase in the amount
of lithium extracted and uptaken on the first cycle, especially for sample Li7D
(Figure 4.11(c)), due to the reduction in the diffusion path length, which in turn
facilitates the phase transformation process. Moreover, Li7E exhibited very good
cycling performance maintaining 70 % of its initial reversible capacity after 23 cycles
(Figure 4.10(b)).
4.3.3 Ex-situ Analysis of Cycled MnP4 and Li7MnP4
X-Ray Diffraction
Figure 4.12(top) shows the ex-situ XRD patterns of the samples obtained at different
stages of cycling. For the cells assembled with the non-lithiated phase the patterns
reveal the formation of Li7MnP4 at the end of discharge and total disappearance of
the lines relative to the MnP4 phase. On the other hand, MnP4 is totally recovered
after recharging to 1.7 V and no Li7MnP4 is detected at this point. The same results

Chapter 4. Manganese Phosphide System 117
0.40
0.60
0.80
1.00
1.20
1.40
1.60
1.80
0 2 4 6 8 10
0 200 400 600 800 1000
Volt
svs
.L
i/L
i+
x in LixMnP
4
Specific Capacity (mAh/g)
(a) Li7B
0.40
0.60
0.80
1.00
1.20
1.40
1.60
1.80
0 2 4 6 8 10
0 200 400 600 800 1000
Volt
svs
.L
i/L
i+
x in LixMnP
4
Specific Capacity (mAh/g)
(b) Li7C
0.40
0.60
0.80
1.00
1.20
1.40
1.60
1.80
0 2 4 6 8 10
0 200 400 600 800 1000
Volt
svs
.L
i/L
i+
x in LixMnP
4
Specific Capacity (mAh/g)
(c) Li7D
0.40
0.60
0.80
1.00
1.20
1.40
1.60
1.80
0 2 4 6 8 10
0 200 400 600 800 1000
Volt
svs
.L
i/L
i+
x in LixMnP
4
Specific Capacity (mAh/g)
(d) Li7E
Figure 4.11: Cycling performance of Li7MnP4 samples at C/10.

Chapter 4. Manganese Phosphide System 118
are obtained after 5 and 10 cycles even though there is no evidence of a biphasic
process in the chronoamperometric diagram.
The XRD pattern of charged Li7MnP4 electrodes displays significant loss of
crystallinity (Figure 4.12(bottom)). The features that appear at 2θ= 22.5, 24.0 and
26.5 ◦ could not be indexed to lines belonging to any binary or ternary phase of the Li-
Mn-P diagram. We suspect that they are related to some electrolyte decomposition
material. More importantly, the lines relative to Li7MnP4 re-appear in the pattern
of the discharged material, indicating reconstruction of the antifluorite phase. This
type of reconstruction has been reported for the Li2CuP13 and LixMP4 (M=Ti, V)14,15
systems. For Li2CuP, the structure disorder upon oxidation was credited to the effect
of electron density extraction from the uppermost band (which includes Cu and P
bonding states) on the hexagonal Cu-P framework. In the titanium and vanadium
system, the entropy gain associated with the formation of a Li- and P-disordered
phase was put as the driving force for the reconstruction process. Based on theoretical
calculations, Gillot et.al.7 suggested that the electrochemical extraction of lithium
from Li7MnP4 yields a cubic phase of stoichiometry Li5MnP4 with smaller lattice
parameter (acalcLi5
= 5.778 A vs. aexpLi7
= 5.874 A). Contrary to their results, we did not
detect lines relative to Li3P (2θ= 31.0◦and 51.0◦) in the XRD patterns obtained at
any stage of cycling. Their results, however, were obtained at a deeper discharge stage
(Vwindow = 0.01 − 2 V ); at this level of discharge, they suggested, the decomposition
of the material into inactive Li3P and Mn0 disfavours reversibility.

Chapter 4. Manganese Phosphide System 119
20 30 40 50 60
* Aluminum• Nickel
2 (degree)q
*
•*
•
1cycle-0.64V
1cycle-0.57V
1cycle-1.1V
1cycle-1.7V
Before cycling
5cycles-0.57V
5cycles-1.7V
10cycles-1.7V
10cycles-0.57V
0.4
0.6
0.8
1.0
1.2
1.4
1.6
1.8
2.0
Vo
lts
vs.
Li/
Li+
x in LixMnP
4
Co
un
ts (
a.u
.)
0.5
0.8
1.0
1.3
1.5
1.8
2.0
Vo
lts
vs.
Li/
Li+
xinLixMnP
4
20 30 40 50 60 70 80
* *
*
*
* * Aluminum or Nickel...Li MnP7 4
2 (degree)q
Cou
nts
(a.u
.)
Figure 4.12: Ex-situ XRD patterns of (top) MnP4 and (bottom) Li7MnP4 electrodes at
different cycling stages.

Chapter 4. Manganese Phosphide System 120
Microscopy
The SEM micrographs of electrodes before and after cycling (Figure 4.13) confirm
the pulverization of the particles upon lithium uptake and extraction. This can be
attributed to the successive expansion and contraction of the unit cells of lithiated
(VLi7MnP4 = 213.5 A) and non-lithiated (V8−MnP4 = 1163.8 A) phases, which provokes
the formation of cracks in the particles.16 Although the material is still available
for phase transformation, the loss of physical contact between particles hinders the
electron transport required for the redox process. Hence, part of the material becomes
dormant and the obtained capacity is averaged over the total mass initially loaded
in the cell. The global effect is a progressive decrease of the cell overall reversible
capacity.
When the lithiated phase is initially loaded in the cell, the XRD pattern of
the cycled electrodes becomes completely featureless upon charge (Figure 4.12),
indicating amorphization of the phase. On subsequent discharge, the ternary phase
re-crystallizes. Contrary to the electrochemical data, these results suggest that the
mechanism for lithium uptake and/or extraction depends on the structure of the
starting material. The magnitude of X-ray diffraction depends on long-range ordering
of the atoms and the particle size limit is in the order of 100 nm.17 A comparison of the
starting materials particle size reveals that the lithiated phase, even non-ball-milled,
has smaller particles than the binary counterpart, in agreement with the duration

Chapter 4. Manganese Phosphide System 121
1 µm
(a)
1 µm
(b)
1 µm
(c)
1 µm
(d)
Figure 4.13: Ex-situ SEM micrographies of (a) pristine and (b) cycled MnP4 and of (c)
pristine and (d) cycled Li7MnP4 electrodes.

Chapter 4. Manganese Phosphide System 122
of heating, much shorter for the Li7MnP4 sample; crystal size of samples obtained
by crystallization from the melt is directly proportional to the reaction duration.18,19
Additionally, manganese is randomly distributed in the antifluorite but not in the
monoclinic structure; it is reasonable to expect that long-range order re-arrangement
upon cycling is more feasible when starting with the non-lithiated phase. This is
substantiated by TEM microscopy and SAED of the cycled electrodes (Figure 4.14)
which reveal the formation of nano-crystallites upon cycling, even though the particles
retain their global shape. A survey of the samples discharged to different stages
displayed the presence of neither Mn0 nor lithium phosphides (LiP or Li3P). The
SAED of the electrode material discharged up to 4Li+ (Figure 4.14(b)) shows that
the [400] planes of 8 -MnP4 have the same d -spacing as the [422] planes in Li7MnP4,
suggesting that a phase transformation process may take place along these planes
(see planes indicated by dotted lines in Figures 4.15(b) and 4.15(c)).
4.3.4 Proposed Mechanism for Phase Transformation
Based on the results discussed in the previous sections, a mechanism is proposed for
this transformation which involves the breakage and reformation of P–P and Mn–P
bonds (Figure 4.15).1 Comparing the two structures, one can see that the Mn atom
is regularly distributed in the MnP4 structure, whereas in Li7MnP4 it statistically
shares the tetrahedral sites with Li. Upon lithium uptake, in addition to P–P and
Mn–P bonds being broken, manganese atoms must randomly shift from octahedral

Chapter 4. Manganese Phosphide System 123
(a)
(b)
(c)
Figure 4.14: Ex-situ TEM images and respective SAED 8 -MnP4 electrodes at different
cycling stages: (a) pristine, (b) reduced to Li4MnP4, and (c) fully
discharged.

Chapter 4. Manganese Phosphide System 124
to tetrahedral sites. On oxidation, lithium is removed from the structure and the
octahedral sites are re-occupied by manganese; however, a certain degree of site
disorder is now introduced in the MnP4 structure. This accounts for the increasing
broadening of the XRD lines upon cycling observed for MnP4 and explains the loss
of capacity due to particle crumbling caused by the structural breakdown.
The proposed mechanism also provides an explanation for the disappearance of the
features in the XRD patterns of lithiated samples upon oxidation. Given the random
character of site occupancy in the antifluorite structure, it is reasonable to think
that the formation of MnP4 during the first oxidation of Li7MnP4 is a more difficult
process compared to the reverse one, required for lithium uptake by MnP4. In the
first case, the Li/Mn site ordering in the starting material is completely randomized
and delithiation leads to the proper stoichiometric ratio of manganese and phosphorus
but no long range ordering of the MnP6 octahedra. This lack of periodicity does not
favour the formation MnP4 seeds necessary for the growth of the binary phase, so
the resulting material is essentially amorphous. Subsequent reduction of the charged
material reforms the antifluorite structure in which occupation of tetrahedral sites is
disordered.

Chapter 4. Manganese Phosphide System 125
(a)
(b)
(c)
Figure 4.15: Schematic of the mechanism for phase transformation between MnP4 and
Li7MnP4 during electrochemical cycling: (a) structure of 8 -MnP4, (b) zoom
of portion indicated by the dotted circle in a, and (c) structure of Li7MnP4.
Yellow, red, and blue spheres correspond to P, Mn, and Mn/Li atoms,
respectively.

Chapter 4. Manganese Phosphide System 126
4.4 Conclusions
This study shows that MnP4 and Li7MnP4 have a similar behaviour toward
electrochemical reaction with lithium. Whether starting with the lithiated or the
non-lithiated phase, up to 3 Li+ are reversibly uptaken/extracted yielding a specific
capacity of 350 mAh/g during 40 charge/discharge cycles.
Despite the differences in the XRD patterns of the cycled electrodes prepared with
lithiated and non-lithiated phases, the similar reaction potentials, voltage variation
with compositional change, and current response to the application of potential steps
in first sweep are evidence that the electrochemical reactions involve the same binary
phase interconversion process mechanism.
The electrochemical data indicate that high intercalation rates contribute to the
kinetics of the phase transformation. Furthermore, ball milling of the lithiated phase
prior to preparation of the battery composite markedly improves the reversibility
(Figure 4.11(d)) due to reduction of the path-length for diffusion of lithium ions.
4.4.1 Comparison of Results
Part of the results described here were published in Science Magazine.1 It constituted
the first report on the study of transition metal phosphides as anode material for Li-
ion batteries. Since then, our research group and others have investigated different
transition metal phosphides. Among these, Gillot and co-workers reported their

Chapter 4. Manganese Phosphide System 127
results on manganese phosphide systems.7,20 Their electrochemical data are very
similar to ours, although their interpretation of the results differs sometimes:
• The in-situ XRD of the material discharged to 0.01 V revealed the presence of
lines assigned to Li3P, whereas metallic manganese nano-particles were detected
by HRTEM, although the micrograhies display strong contamination by the
laser beam. These results imply that Li7MnP4 decomposes into Li3P and Mn0
at low potential. By avoiding this decomposition reaction (upon proper selection
of the voltage window), however, better cycling performance was obtained.
Nevertheless, the authors indicated that the redox mechanism for the remaining
steps does not depend on this decomposition reaction but, although not showing
any experimental data (XRD or TEM for example) after the first cycle, they
claimed that “the ternary phase is not reformed from Li3P and Mn0 electrodes”.
• In agreement with our data and proposed mechanism, Gillot et al. identified the
reversible reaction between Li7MnP4 and MnP4. Nonetheless, based on first-
principles electronic structure calculations, the authors suggested that lithium
removal occurs via a two-step reaction between Li7MnP4 and Li5MnP4. The
XRD results, however, gives no clear evidence of the formation of the Li5MnP4
phase other than an extremely slight shift of the Bragg angles of some lines.
• Based solely on values of incremental capacity at relatively high galvanic rates
(1 Li/15 h), the authors suggested that “discharge and charge reactions involve

Chapter 4. Manganese Phosphide System 128
different mechanisms”. The authors neglected, however, to determine the
equilibrium values of voltage for the referred processes, which is shown here
to be approximately the same whether starting the electrochemical process on
charge or discharge (see Figure 4.7 on page 112, and Figure 4.8(b) on page 113).
Despite of some differences in interpretation, using molecular electronic structure
calculations based on the extended Huckel tight-binding method (EHTB) Gillot and
co-workers showed that, similar to other phosphides,13,21,22 the redox center involved
in the MnP4 + 7 Li reaction is primarily the phosphorus atoms.

References
[1] Souza, D.; Pralong, V.; Jacobson, A.; Nazar, L. Science 2002, 296, 2012.
[2] Massalski, T.; Okamoto, H.; Subramanian, P.; Kacprazak, L., Eds.; Binary
Alloy Phase Diagrams; volume 1-3 Plenum Press: New York, 2nd ed.; 1990.
[3] Jeitschko, W.; Donohue, P. Acta Cryst. 1975, B31, 574-580.
[4] Juza, R.; Bohmann, T. Z. Anorg. Allg. Chem. 1961, 308, 159-178.
[5] Jeitschko, W.; Ruhl, R.; Krieger, U.; Heiden, C. Mater. Res. Bull. 1980, 15,
1755-1762.
[6] Ruhl, R.; Jeitschko, W. Acta Cryst. 1981, B37, 39-44.
[7] Gillot, F.; Monconduit, L.; Doublet, M.-L. Chem. Mat. 2005, 17, 5817.
[8] Weppner, W.; Huggins, R. J. Electrochem. Soc. 1977, 124, 1569.
[9] Weppner, W.; Huggins, R. J. Electrochem. Soc. 1978, 125, 7.
[10] Ho, C.; Raistrick, I.; Huggins, R. J. Electrochem. Soc. 1980, 127, 343.
129

References 130
[11] Huggins, R. Mat. Res. Soc. Symp. Proc.. In Solid States Ionics IV, Vol. 369; MRS:
Boston, 1995; Chapter Pulse Applications of Electrochemical Cells Containing
Insertion Reacton Electrodes, page 3.
[12] Tirado, J. L. Mater. Sci. Eng. R: Reports 2003, 40, 103-136.
[13] Crosnier, O.; Mounsey, C.; Herle, P. S.; Taylor, N.; Nazar, L. F. Chem. Mat.
2003, 15, 4890.
[14] Doublet, M.-L.; Lemoigno, F.; Gillot, F.; Monconduit, L. Chem. Mat. 2002,
14, 4126.
[15] Bichatt, M.-P.; Politova, T.; Pfeiffer, H.; Tancret, F.; Monconduit, L.;
Pascal, J.; Brousse, T.; Favier, F. J. Power Sources 2004, 136, 80.
[16] Winter, M.; Besenhard, J. O.; Spahr, M.; Novak, P. Adv. Mater. 1998, 10,
725.
[17] Klug, H.; Alexander, L. ”X-Ray Diffraction Procedures for Polycrystalline and
Amorphous Materials; John Wiley & Sons: New York, 2nd ed.; 1974.
[18] Schafer, H. Chemical Transport Reactions; Academic Press: New York, 1964
transl. by H. Frankfort.
[19] Hagenmuller, P., Ed.; Preparative Methods in Solid State Chemistry; Academic
Press: New York, 1972.

References 131
[20] Gillot, F.; Monconduit, L.; Morcrette, M.; Doublet, M.-L.; Dupont, L.;
Tarrascon, J.-M. Chem. Mat. 2005, 17, 3627.
[21] Pralong, V.; Souza, D.; Leung, K.; Nazar, L. F. Electrochem. Comm. 2002, 4,
516.
[22] Crosnier, O.; Souza, D. C. S.; Greedan, J. E.; Nazar, L. F. Reversible Lithium
Uptake by FeP2. In Material Research Society Symposium; MRS: Boston, 2002.

Chapter 5
Iron Phosphide System
5.1 Introduction
Continuing the study of the electrochemical properties of transition metal phosphides
in lithium-ion batteries, other 4th row elements were contemplated. Once again, the
strategy adopted was to look for binary phosphides with somewhat open structures,
but this time with focus on systems in which tertiary highly lithiated phases were
unknown. Vanadium and chromium form phosphides with structures similar to
that of manganese; the high phosphorus content binary phases exhibit the same
stacking faulted structures and the ternary lithiated compounds tend to crystallize
with the antiflurite-type structure or in the tetragonal system.1–3 Thus they were
expected to present equivalent electrochemical properties. Indeed, VP4 and Li7VP4
132

Chapter 5. Iron Phosphide System 133
were extensively studied following our initial report on the manganese system and
they show comparable electrochemical behaviour.4,5 Chromium phosphides are high
pressure phases and even though the lithiated form can be easily prepared, assembly
of a battery using charged material in the anode terminal is time consuming and
detrimental for the shelf-life of the system, and therefore of little practical application.
The initial evaluation mapping was thus directed towards the opposite side of
the periodic table. Nickel, copper and zinc are inert towards reaction with lithium
and indeed, these metals are usually used as anode current collectors in lithium
batteries. Based on the inertness criterion of the transition metal in the case
of structure decomposition upon lithiation, phosphides of these metals would be
excellent candidates. Indeed, CuP2,6 Cu3P,7,8 Li2CuP,9 NiP2,
10 and Zn3P2,11 have
been recently investigated. Additionally, ternary zinc and nickel phosphides have
been studied as anode or cathode materials, depending on the composition of the
ternary phase, in both lithium-ion batteries and fuel cells.12–15
The immediate candidates, iron and cobalt phosphides, form open structures with
two and three dimensional channels respectively.16,17 Lithiated ternary phosphide
phases of cobalt are unknown and although LiFeP has already been synthesized, it is
lithium poor, which does not seem to favour a phase transformation reaction like that
observed in the manganese phosphide system.18 Furthermore, the metal-phosphorus
bonds in the binary compounds exhibit a higher degree of covalency than the metal-
oxygen linkage in the respective oxides. These facts allude to the possibility of lithium

Chapter 5. Iron Phosphide System 134
uptake without much perturbation of the structure, perhaps via formation of a solid
solution rather than through a binary phase transformation process.
Iron diphosphide crystallizes with a marcasite-type structure in the orthorhombic
system, space group Pmnn (Figure 5.1).19,20 Each Fe atom is surrounded by 6
phosphorus, forming corner-sharing octahedra. The atoms’ arrangement allows for
the formation of two dimensional channels along the c direction. A study of the
electrochemical properties of FeP2 as anode material for lithium-ion batteries and
of the mechanism involved in the process is presented herein. The results on the
synthesis, electrochemical performance, and structural changes are reported.
Figure 5.1: Polyhedral representation of the FeP2 structure.

Chapter 5. Iron Phosphide System 135
5.2 Experimental
5.2.1 Synthesis of FeP2 Using a Flux of Tin
Iron, red phosphorus, and tin, in molar ratio of 1:10:40, were mixed inside an argon
filled glove-box with the aid of a mortar and pestle and transferred to a quartz tube
(18 mm OD x 16 mm D). The tube was evacuated, sealed (final length 200 mm), and
then heated in a tube furnace at 700◦C for one week. The reaction was quenched
to room temperature and the resulting solid material was treated with at least three
portions of 1:1 aqueous solution of hydrochloric acid. The black powder was manually
crushed with the aid of mortar and pestle and sieved through a 400 mesh nylon grid.
5.2.2 Synthesis of FeP2 Using Iodine Vapour Transport
Stoichiometric amounts of iron and red phosphorus were mixed with iodine with
the aid of mortar and pestle inside an argon filled glove-box and transferred to a
quartz tube (18 mm OD x 16 mm ID). The tube was evacuated, sealed (final length
200 mm), and heated at variable temperature and time; the reaction parameters are
summarized in Table 5.1. At the end of the heating time, the tubes were quenched to
room temperature and cut open. After thoroughly washing the product with acetone
the resulting dark grey powder was manually ground with the aid of a mortar and
pestle and sieved through a 400 mesh nylon grid. The purity of the final products

Chapter 5. Iron Phosphide System 136
was estimated by XRD analysis.
Table 5.1: Reaction parameters for the preparation of FeP2 by I2 vapor transport.
Run Amount of I2 (wt/wt%) Temperature (◦C) Reaction Duration (h)
1 3 400 72
2 15 700 24
3 3 700 72
4 10 700 24
5 10 800 24
5.3 Characterization and Properties of FeP2
5.3.1 Structure and Composition of the Materials
The slow diffusion of phosphorus inside the iron particles leads to a concentration
gradient between the bulk and the surface. Consequently, direct synthesis of
homogeneous FeP2 from the pure elements demands a long reaction time and high
temperatures. Based on the results with the manganese phosphide system, a flux of
tin was used to obtain crystalline FeP2 at lower temperature and shorter reaction
times than previously reported.20 The dark grey product was stable in air and its X-
ray diffraction pattern is consistent with that expected for FeP2. Accordingly, a molar

Chapter 5. Iron Phosphide System 137
ratio P:Fe of 1.9, very close to the theoretical stoichiometric value 2.0, was obtained
by chemical analysis of the material by ICP (Inductively Coupled Plasma). The
XRD pattern (5.2) also shows no lines relative to metallic iron or other phosphides
but the line at 2θ = 31.5◦ indicates the presence of Sn; elemental analysis revealed
less than 0.5 % of the contaminant. Efforts to remove the residual tin by acid wash
were unsuccessful, suggesting that it may be incorporated in the FeP2 matrix.
Figure 5.2: LeBail refinement of XRD pattern of FeP2/Sn.
Although the desired iron phosphide phase was obtained using the tin flux
technique, the method presented major drawbacks: (i) long time for reaction
completion (at least 1 week), (ii) large amounts of tin required, (iii) difficulty to
remove all the tin after the reaction, (iv) only small amounts of FeP2 obtained.
Vapour phase transport, on the other hand, proved to be a more efficient procedure.

Chapter 5. Iron Phosphide System 138
The reaction mechanism21 proceeds by iron first reacting with iodine to produce
a very volatile compound (FeI3). The latter then reacts with phosphorus to form
the iron phosphide. Compared to the tin flux process, in which the system is in
the liquid state at the reaction temperature, here the reaction is carried out in the
vapour phase, favoring its kinetics. Furthermore, the required amount of iodine is
only 10 wt% of the total mass of FeP2, allowing the preparation of larger amounts of
the desired product. The diffractograms of the products (Figure 5.3) reveal that pure
FeP2 is obtained under the conditions of Run 5 (Table 5.1); small amounts of two
contaminants, namely FeP and FeP4, were present in the other samples. Hereafter,
the two phases are labelledd FeP2/Sn and FeP2/I2 to denote the respective methods
of preparation.
XRD data collected between 20◦< 2θ <60◦, in steps of 0.01◦ during 10 s for
FeP2/I2 and 0.05◦ for 10 s for FeP2/Sn, were refined with GSAS22,23 in the tetragonal
space group Pmnn using the Rietveld method.24 The refined variables were the scale
factor, background polynomial coefficients, unit cell parameters, atomic positions, and
pseudo-Voigt peak shape (using the type 2 profile function for constant wavelength
diffraction data).25 Figures 5.2 and 5.4 show the obtained full pattern match of the
pure FeP2 phases and the refined and calculated parameters for both samples along
with the single crystal reference data are summarized in Table 5.2.

Chapter 5. Iron Phosphide System 139
Figure 5.3: Ex-situ XRD patterns of FeP2/I2 samples obtained different reaction
conditions: (a) Calculated theoretical pattern; (b) Run 1; (c) Run 2;
(d) Run 3; (e) Run 4; (f) Run 5.

Chapter 5. Iron Phosphide System 140
Table 5.2: Results of the LeBail fit for FeP2 XRD data in the space group Pmnn.
Sample FeP2/Sn FeP2/I2 FeP220
Unit Cell
Dimensions (A)
a 4.9693±0.0030 4.9703±0.0005 4.9729±0.0007
b 5.6532±0.0034 5.6538±0.0006 5.6568±0.0008
c 2.7220±0.0016 2.7220±0.0003 2.7230±0.0004
Cell Volume (A3) 77.23 76.49 n.r.a.
Formula Weight 235.59 242.34 n.r.
Density (g/cm3) 5.12 5.26 n.r.
Rpb (%) 18.81 8.29 n.r.
Rwpc (%) 27.00 11.54 n.a.
χ2 1.45 2.71 n.r.
Number of Refined Variables 16 16 n.r.
a n.r.= not reported
b Rp =P
||Iexp|−|Icalc||P
Fexp
c Rwp =√
MpP
wI2
calc
, where Mp =∑
w(Iobs − Icalc)2 is the powder data contribution for the general
least squares minimization function.
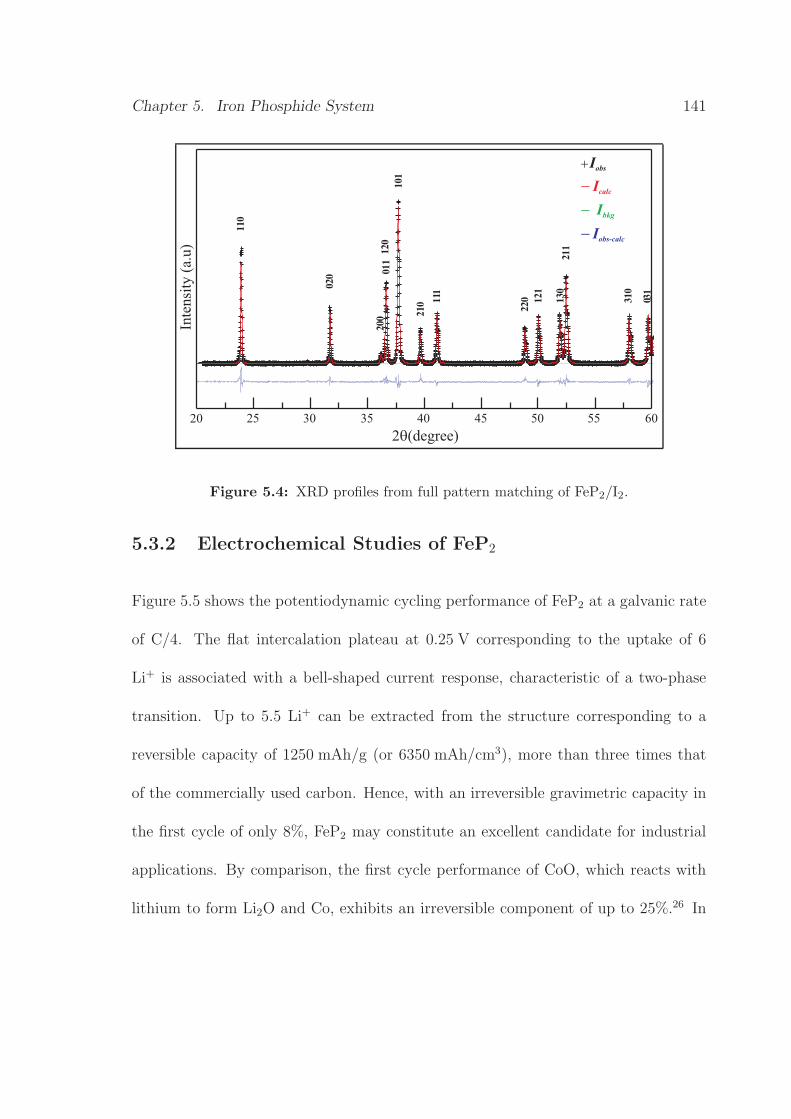
Chapter 5. Iron Phosphide System 141
Figure 5.4: XRD profiles from full pattern matching of FeP2/I2.
5.3.2 Electrochemical Studies of FeP2
Figure 5.5 shows the potentiodynamic cycling performance of FeP2 at a galvanic rate
of C/4. The flat intercalation plateau at 0.25 V corresponding to the uptake of 6
Li+ is associated with a bell-shaped current response, characteristic of a two-phase
transition. Up to 5.5 Li+ can be extracted from the structure corresponding to a
reversible capacity of 1250 mAh/g (or 6350 mAh/cm3), more than three times that
of the commercially used carbon. Hence, with an irreversible gravimetric capacity in
the first cycle of only 8%, FeP2 may constitute an excellent candidate for industrial
applications. By comparison, the first cycle performance of CoO, which reacts with
lithium to form Li2O and Co, exhibits an irreversible component of up to 25%.26 In

Chapter 5. Iron Phosphide System 142
the same way, intermetallic compounds exemplified by FeSn2 uptake lithium with
the dissociation of the starting material into metallic Fe and Li/Sn alloys; partial
reformation of FeSn2 occurs on charge, leading to a specific capacity of 800 mAh/g
and 20% irreversibility during the first cycle.27
Long-term cycling of FeP2, however, causes a gradual loss of reversible capacity
(Figure 5.5, inset). This may be caused by side reactions with the electrolyte at
the low potentials employed, and/or structural changes within the material. Indeed,
while the capacity of a cell is related to the structural or electronic behaviour of
its electrodes, poor cell lifetimes are rooted mainly in side reactions occurring at
the electrode-electrolyte interface and in the structural stability of the electrode
materials.28 Despite many years of research devoted to the mechanism by which
the SEI forms on Li or carbonaceous materials, its composition and nature are still
the subject of much controversy. The situation is even worse in the case of phosphide
materials, since very few data are available. Preliminary tests with FeP2 indicated
that the electrochemical performance depends on the electrolyte composition and rate
used. Therefore, investigation was needed about the effect of different electrolyte
salts and solvents, and of the intercalation rate on the capacity loss, along with the
mechanism for lithium uptake by the phosphide.

Chapter 5. Iron Phosphide System 143
0 1 2 3 4 5 60.0
0.5
1.0
1.5
2.0
2.5
3.0
0 50 100 150 200 2500
1
2
3
Vol
tage
vs.
Li/L
i+
x in LixFeP2
Vol
tage
vs.
Li/L
i+
Time (h)
Figure 5.5: Voltage vs composition profile for first potentiodynamic cycle of FeP2 at
equivalent galvanic rate of C/4. Inset shows the efficiency performance for
first 10 cycles.

Chapter 5. Iron Phosphide System 144
Influence of the Electrolyte Composition and Cycling Rate
A two-levels/three-factors full factorial design of experiments (23 DOE) with one
replicate per run was used to assess the effect of the electrolyte composition and
cycling rate on the electrochemical performance of FeP2.29,30 The electrolytes used
were 1 M solutions of the lithium salt, LiPF6 (Hashimoto, 99.995 %) or LiBF4
(Tommyama, 99.999 %), in a 1:1 mixture of battery grade (SelectipurTM , Merck)
ethylene carbonate (EC) with either dimethylcarbonate (DMC) or diethylcarbonate
(DEC). The applied galvanic rates were C/10 and 2C. Table 5.3 shows the runs of
the experimental matrix (the variables with their normalized levels are presented in
the bottom part). The properties (responses) selected from the electrochemical data
were the amount of lithium uptaken in the first discharge (D1) and the reversible
capacity of the first cycle (RC1).
The summary of the responses obtained for each run is presented in Table 5.4.
Using standard least-squares parameter estimation procedures and statistical analysis,
empirical models were built and parameter values and covariances were computed. All
parameters were calculated based on a 95 % confidence level. The empirical models
were developed sequentially starting with the main sources of variations, including
the interaction factors when necessary, and only retaining the significant effects. The

Chapter 5. Iron Phosphide System 145
Table 5.3: Matrix for the Factorial Design of Experiments.
Run Salt Solvent Rate
1 -1 -1 -1
2 1 -1 -1
3 -1 1 -1
4 1 1 -1
5 -1 -1 1
6 1 -1 1
7 -1 1 1
8 1 1 1
Factor Level
Normalized Level -1 +1
Salt (Sa) LiPF6 LiBF4
Solvent (So) EC:DMC EC:DEC
Rate (R) C/10 2C

Chapter 5. Iron Phosphide System 146
models may be generically described by the equation:
P = (A1 ± 2sA1) + (A2 ± 2sA2)Sa + (A3 ± 2sA3)So + (A4 ± 2sA4)R
+ (A5 ± 2sA5)Sa ∗ So + (A6 ± 2sA6)Sa ∗ R + (A7 ± 2sA7)So ∗ R
(5.1)
where P = measured property, A = parameter that correlates a property with
a variable or interaction between two variables and sAn= standard deviation of
parameter An. Experimental and predicted data were compared through the F test
and by analysis of the residuals.29 The normal probability plots of the residuals as
well as the plots of observed vs predicted values (Figure 5.6) confirm that the models
provide an adequate description of the main sources of variation of the measured
properties.
Table 5.4: Responses of the DOE for electrochemical performance of FeP2.
Run D1 RC1
1 4.6 5.6 796 705
2 6.0 6.5 842 910
3 5.2 5.1 569 455
4 5.4 6.0 1001 1047
5 5.6 5.9 523 501
6 4.5 4.5 410 410
7 4.6 4.5 182 114
8 4.4 3.7 592 660

Chapter 5. Iron Phosphide System 147
-1.0 -0.5 0.0 0.5 1.0-3
-2
-1
0
1
2
3
(d)(c)
(b)
Exp
ecte
d N
orm
al R
esid
uals
D1 Residuals
(a)
-150 -100 -50 0 50 100 150-3
-2
-1
0
1
2
3
Exp
ecte
d N
orm
al R
esid
uals
RC1 Residuals
3.5 4.0 4.5 5.0 5.5 6.0 6.5 7.03.5
4.0
4.5
5.0
5.5
6.0
6.5
7.0
D1
Pred
icte
d V
alue
s (#
Li+ )
D1 Observed Values (# Li+)
0 200 400 600 800 1000 12000
200
400
600
800
1000
1200
RC
1 Pr
edic
ted
Val
ues (
mA
h/g)
RC1 Observed Values (mAh/g)
Figure 5.6: Adequacy of models obtained for the electrochemical performance of FeP2
during the first cycle: (a-b) observed vs. predicted values and (c-d) normal
probability distribution of the residuals.

Chapter 5. Iron Phosphide System 148
Table 5.5 presents the models obtained for D1 and RC1 and the results of analysis
of variance. The models account for 73 % and 93 % of the variability in the results of
D1 and RC1, respectively. The analysis of variance shows that solvent, rate, and the
interaction between salt and rate have significant effects on the amount of lithium
uptake in the first discharge. According to the models, the combination of LiBF4 in
EC:DMC and lower galvanic rates favour both lithium uptake and reversible capacity
during the first cycle.
5.3.3 Ex-situ Analysis of Cycled FeP2
X-Ray Diffraction
Ex-situ XRD analysis of the cycled material revealed substantial loss of crystallinity
after the two-phase transition. Compared to the crystalline pattern of FeP2 (Figure
5.7a), only two very broad features appear in the XRD pattern of the discharged
material (Figure 5.7b), along with small peaks ascribed to traces (< 5%) of residual
FeP2 that did not fully react.
Considering that the only ternary phase existent in the Li-Fe-P phase diagram
is the lithium-poor LiFeP, a lithium intercalation reaction like that exhibited by
MnP418 (which possesses many thermodynamically stable lithium rich ternary phases,
including Li7MnP4) was not expected. In fact, not only does the amount of lithium
electrochemically uptaken by FeP2 not correspond to the stoichiometric ratio of

Chapter 5. Iron Phosphide System 149
Table 5.5: Multiple regression and analysis of variance results for D1 and RC1.
D1 = (5.13 ± 0.10) − (0.37 ± 0.10)So − (0.42 ± 0.10)R − (0.43 ± 0.10)Sa.R
r2= 0.7852 Adjusted r2= 0.7315
Analysis of Variance
Source Variance Fo Fc
Model 2.31 14.42 3.49
So 1.16 7.31 4.75
R 2.81 17.74 4.75
Sa ∗ R 2.98 18.82 4.75
Residuals 0.1 - -
RC1 = (607 ± 17) + (127 ± 17)Sa − (183 ± 17)R − (121 ± 17)Sa.So
r2= 0.9445 Adjusted r2= 0.9306
Analysis of Variance
Source Variance Fo Fc
Model 342841 68 3.49
Sa 256298 51 4.75
R 538448 107 4.75
Sa ∗ So 233777 46 4.75
Residuals 5037 - -

Chapter 5. Iron Phosphide System 150
Figure 5.7: Ex-situ XRD patterns of FeP2 electrodes at different cycling stages: (a)
pristine material, (b) at 0.2 V on first discharge, and (c) at 1.1 V and on
first charge.
Chapter 5. Iron Phosphide System 151
the elements in LiFeP, but also the broad features present in XRD patterns of the
discharged material do not match the d -spacing for the lines of the ternary phase.
The positions of the reflections are closer to those exhibited by Li3P and LiP,31 but
the correspondence is poor, as many characteristic intense peaks of these phases
are also missing. Additionally, no features relative to metallic iron are observed in
the diffraction pattern, suggesting that simple decomposition of FeP2 into Li3P and
bulk Fe particles does not explain the discharge process. The XRD pattern becomes
completely featureless upon oxidation (Figure 5.7c) on subsequent cycling. Since
XRD depends on the long range ordering of atoms, it does not constitute a useful
tool for the study of the transformations occurring upon lithium uptake/extraction
in the iron phosphide matrix. To further characterize this complex Li uptake process,
XAS and Magnetic measurements were employed.
X-Ray Absorption Spectroscopy
The XANES spectra of the material before and after cycling are presented in
Figure 5.8. Consistent with the loss of crystallinity observed in the XRD pattern,
the intensity of the oscillations in the XAS spectra of the cycled materials were
significantly reduced compared to those of FeP2. The XANES portion of the spectra
shows that the band edge of the FeP2 (7118.2 eV) shifts by only 0.5–1 eV to lower
energy after Li uptake. The edge energy is conversely raised on oxidation by only
0.2 eV. These are small changes compared to shifts higher than 4 eV observed in

Chapter 5. Iron Phosphide System 152
the reduction of MoO3 and other oxides upon Li uptake.32,33 Since the position of
the absorption edge is correlated to the oxidation state of the element,34,35 it can be
inferred that the “formal” oxidation state of iron in FeP2 does not change appreciably
on cycling. The general shape of the absorption edges in the spectra of the cycled
FeP2 samples, especially the discharged material, also differs strongly from that of
bulk metallic iron, ruling out its formation upon lithiation.
7100 7110 7120 7130 7140 7150 71600.0
0.2
0.4
0.6
0.8
1.0
1.2
1.4
7100 7150 7200 7250 7300
0.0
0.2
0.4
0.6
0.8
1.0
1.2
(E)
Energy(eV)
(E)
Energy (eV)
Figure 5.8: Ex-situ Fe K-edge XANES and inset EXAFS regions of the XAS spectra of
FeP2 samples: pristine ( ), fully discharged ( ), and fully charged ( );
metallic Fe was used as reference ( ).
The EXAFS area of the XAS experiment (Figure 5.8, inset) provides information

Chapter 5. Iron Phosphide System 153
on the changes in the local coordination environment. The pseudo-radial distribution
functions obtained from Fourier transformation of the EXAFS signals are shown
in Figure 5.9. The RDFs of pristine and cycled FeP2 show interesting differences.
In pure FeP2, the fittings of the EXAFS spectra for the 1st and 2nd coordination
shells of iron yield 6 P atoms at 2.25 A and 1.6 Fe at 2.71 A (Table 5.6). These
values fully agree with the average values of the distances Fe-P (2.26 A) and Fe-Fe
(2.72 A) obtained from crystallography data. After the uptake of 6 Li, the intensity of
these Fe-P interactions suffers significant reduction but does not disappear completely.
The number of phosphorus neighbours (4.6) is maintained in the first Fe-P shell at
about the same distance (2.29 A) relative to the starting material. The rather low
coordination number for an expected octahedral environment is probably due to a
significant distribution in the Fe–P distances. Long range order, however, is destroyed
by Li uptake. The lack of features at higher distances also proves that the existing
Fe–P interactions cannot result from traces of residual unreacted FeP2, for in that
case the intensity of the entire RDF would be attenuated. In addition, the first or
second shells cannot be fit with Fe–Fe interactions, which indicates once again that
bulk metallic iron is not formed.
The pseudo-RDF of the charged material shows that changes occur in the local
environment vis-a-vis the reduced sample. It shows a modest increase in the
number of Fe-P nearest neighbours, although the inaccuracy of the EXAFS method
in determining coordination numbers in disordered materials makes it difficult to

Chapter 5. Iron Phosphide System 154
0 1 2 3 4 5 6
Fe-FeF(R
) (Å
-4)
Distance (Å)
Fe-P
Figure 5.9: Pseudo-radial distribution functions derived from the ex-situ EXAFS signals)
of FeP2 samples: pristine ( ), fully discharged ( ), and fully charged ( );
metallic Fe was used as reference ( ).

Chapter 5. Iron Phosphide System 155
precisely quantify the changes. More importantly, some of the long-range features
that occur at distances >4 A in FeP2 reappears in the spectrum of the charged
material. An increase in both the Fe-Fe and the long-range interactions at 4.5 A
and 6.1 A shows that a more ordered environment is reassembled, despite the overall
long-range amorphous character of the structure.
Table 5.6: Summary of EXAFS data at the Fe K-edge for the first shell of FeP2.
Material Neighbour Na R(A)a σ2(A2)a ∆Eo(eV)a Re(%)b
FeP2 P 6 2.26 - - -
Crystal Fe 2 2.72 - - -
FeP2 P 6.0 2.25 0.0032 1.34 7.00
Pristine Fe 1.6 2.71 0.0023 - -
FeP2 P 4.6 2.29 0.0080 2.13 16.44
Discharged Fe 0 - - - -
FeP2 P 4.7 2.25 0.0064 0.41 12.73
Charged Fe 2.0 2.68 0.01 - -
a N, R, σ2, and ∆Eo are the fitted values of the number of surrounding atoms, their distance
from absorbing Fe, the Debye-Waller factor and the energy shift, respectively.
b Re =
NP
i=1
|yexp(i)−ytheo(i)|
NP
i=1
|yexp(i)|

Chapter 5. Iron Phosphide System 156
Magnetic Measurements
Magnetization
The magnetic properties of the newly formed particles were investigated to provide
some insight on the nature and structure of the phases formed by the electrochemical
lithiation/delithiation processes. The data sets obtained for pristine and cycled
materials were analyzed using Curie-Weiss (χ vs. T ) and Langevin (M vs. M)
type functions,36 corrected for temperature-independent magnetic susceptibility and
paramagnetic contributions respectively:
Curie-Weiss Equation for Magnetic Susceptibility
χexp =C
T − θ+ χT (5.2)
where χexp is the experimental mass magnetic susceptibility (=M/H), C and θ
are the Curie and Weiss constants respectively, χT is the temperature independent
susceptibility (=χDiamagnetic + χPauli), and T is the absolute temperature.
Langevin Equation for Magnetization
M = Ms
(
cothµH
kT+
kT
µH
)
+ χPH (5.3)
where M is the experimental mass magnetization, Ms the saturation magnetization,
µ the magnetic moment, k the Boltzman constant, T the absolute temperature, χP
the mass paramagnetic susceptibility, and H the applied field.
Pristine FeP2 exhibited mostly diamagnetic behaviour with a small, weakly
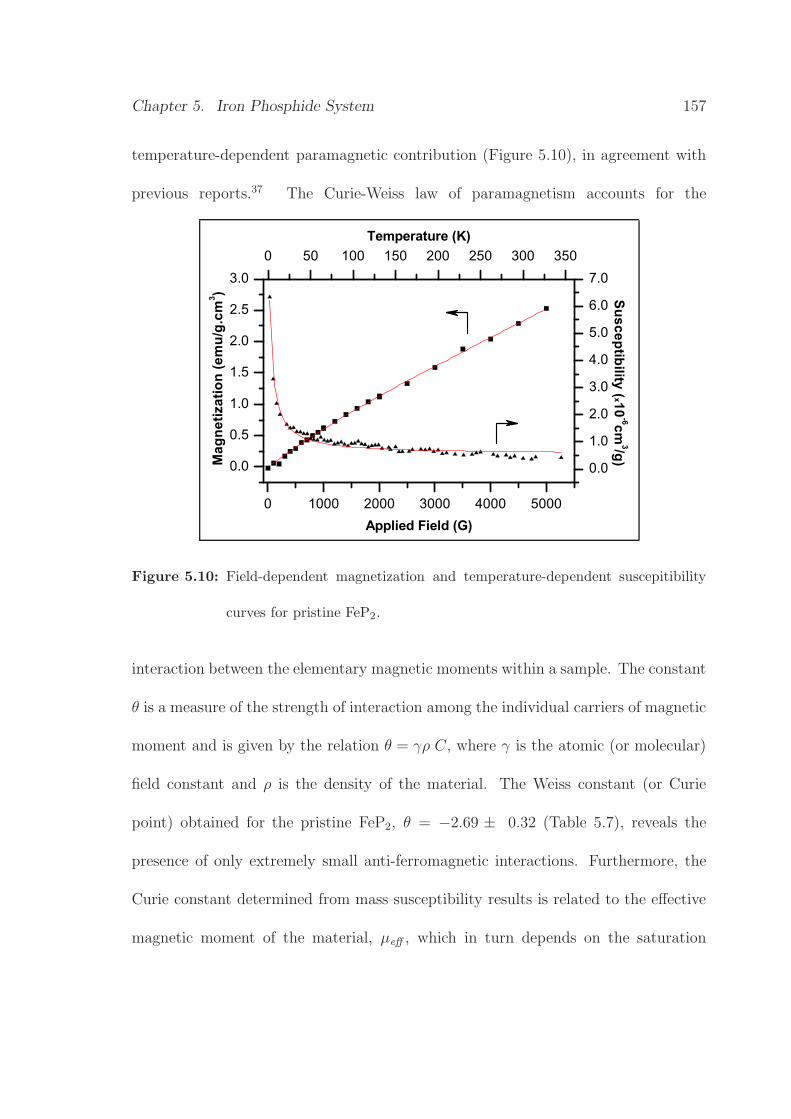
Chapter 5. Iron Phosphide System 157
temperature-dependent paramagnetic contribution (Figure 5.10), in agreement with
previous reports.37 The Curie-Weiss law of paramagnetism accounts for the
0 1000 2000 3000 4000 5000
0.0
0.5
1.0
1.5
2.0
2.5
3.00 50 100 150 200 250 300 350
0.0
1.0
2.0
3.0
4.0
5.0
6.0
7.0
Mag
netiz
atio
n (e
mu/
g.cm
3 )
Applied Field (G)
Susceptibility (x10-6cm
3/g)
Temperature (K)
Figure 5.10: Field-dependent magnetization and temperature-dependent suscepitibility
curves for pristine FeP2.
interaction between the elementary magnetic moments within a sample. The constant
θ is a measure of the strength of interaction among the individual carriers of magnetic
moment and is given by the relation θ = γρ C, where γ is the atomic (or molecular)
field constant and ρ is the density of the material. The Weiss constant (or Curie
point) obtained for the pristine FeP2, θ = −2.69 ± 0.32 (Table 5.7), reveals the
presence of only extremely small anti-ferromagnetic interactions. Furthermore, the
Curie constant determined from mass susceptibility results is related to the effective
magnetic moment of the material, µeff , which in turn depends on the saturation

Chapter 5. Iron Phosphide System 158
magnetization and the total angular momentum related to the quantum number
J = L + S. In the case of crystalline materials, there is no significant contribution
of the orbital momentum (L); therefore, only the spin contributes to the resulting
magnetic moment of the specimen, and J = S = 1/2.36 The Curie constant is given
by:
C =NAµ2
eff
3Mwk(5.4)
=µHMs(S + 1)
3kS(5.4′)
=NAg2S(S + 1)µ2
B
3Mwk(5.4′)
with NA the Avogadro number, Mw the molecular (or formula) weight, µB the Bohr
magneton, k the Boltzman constant, and g the spectroscopic splitting factor which
has a value of 1 for orbital and 2 for each spin motion. The Curie constant calculated
for each spin is then Cspin = 0.375 cm3 K/mol. Considering the experimental value
of Cexp obtained for the starting material, the total number of spins present can be
determined as Cexp/Cspin = 0.9% per unit formula of FeP2. This result, together with
the small value of θ, attests for the quality of synthesis of polycrystalline sample of
FeP2 since the Curie-Weiss paramagnetic component is essentially negligible.
The ZFC-FC magnetization profiles for pristine and cycled materials (Figure
5.11) show a significant increase in magnetization upon lithiation. After Li uptake,
the magnetic susceptibility increases by a factor of ≈ 102 over the temperature
range of 2 K to 350 K and a strong temperature dependence develops (Figure 5.12).

Chapter 5. Iron Phosphide System 159
0 50 100 150 200 250 300 350
0.0
0.1
0.2
0.3
0.4
0.5/ Pristine/ Charge/ Discharge
Mag
netiz
atio
n (e
mu/
g)
Temperature (K)
Figure 5.11: Temperature dependence of magnetization in the ZFC and FC modes (black
and red symbols respectively) of FeP2 before and after cycling.
This behaviour is consistent with magnetism due to the presence of very small
ferromagnetic particles, i.e. super-paramagnetism.38 If a material composed of
very small crystallites (1 - 10 nm) is at temperatures below the Curie temperature,
although the thermal energy is not sufficient to overcome the coupling forces
between neighbouring atoms, it can change the direction of magnetization of the
entire crystallite.The resulting fluctuations in the direction of magnetization cause
the magnetic field to average to zero. The material thus behaves similarly to
a paramagnet, except that instead of each individual atom being independently
influenced by an external magnetic field, the magnetic moment of the entire crystallite
tends to align with the magnetic field.

Chapter 5. Iron Phosphide System 160
No obvious blocking temperature was detected over the range of temperature
studied, which suggests that the lithiated material may have a high blocking
temperature and/or that there is a wide size distribution of magnetic domains.39,40
Nevertheless, treatment of the M vs. H data with a Langevin-type function (valid
for super-paramagnetic particles when the magnetic assembly is formed by small
particles of the same size and with no anisotropy)39 leads to excellent correlation
coefficient (Table 5.7). Hence, the material formed upon lithiation must have a
blocking temperature above 350 K.
On charge, the super-paramagnetic component of the magnetization curve is
strongly reduced. Since the electrochemical lithium uptake process is not completely
reversible, the remaining paramagnetic signal is most likely due to a small inactive
fraction of the material that has irreversibly reacted during lithium insertion. The
magnetization vs. field data presented in Figure 5.13 shows that data collected at
350 K and 100 K is still typical of super-paramagnetic behaviour with no hysteresis;
a very weak remanent moment (7.9x10⁻³ emu/g) appears at 2 K. For both discharged
and charged states it is impossible, however, to distinguish between the formation of
nanoscopic Fe, or FexP (x= 1, 2, 3) as these are all magnetic materials that would
exhibit properties different from their bulk behaviour.41
The magnetic moment is related to the size of the magnetic domains by the

Chapter 5. Iron Phosphide System 161
0 50 100 150 200 250 300 350
0.0
0.2
0.4
0.6
0.8
1.0
-6 -5 -4 -3 -2 -1 0 1 2 3 4 5 6-1.2
-0.8
-0.4
0.0
0.4
0.8
1.2
Susc
eptib
ility
(x10
-3 c
m3 /g
)
Temperature (K)
2K 150K 350K
Mom
ent (
emu/
g)
Applied Field (kG)
(a)
0 1000 2000 3000 4000 5000
0.0
0.2
0.4
0.6
0.8
1.0
2K 350K
Mom
ent (
emu/
g)
Applied Field (G)
(b)
Figure 5.12: Magnetization curves of discharged FeP2: (a) temperature dependence of
mass susceptibility at H= 500 G (inset: hysteresis loops at 2 K, 100 K, and
350 K) and (b) Langevin fit of M vs. H curves at 2 and 350 K.

Chapter 5. Iron Phosphide System 162
Table 5.7: Results of Curie-Weiss and Langevin fitting of FeP2 magnetization data.
Function Parameters Pristine Discharge Charge
Curi
e-W
eiss
Ha, G 1000 500 500
C, cm3 K/g (3.02±0.16)x10−5 (2.14±0.01)x10−2 (3.24±0.38)x10−3
θ, K -2.69±0.32 -20.25±0.19 -19.19±1.68
χT , cm3/g (5.50±0.25)x10−7 (4.98±0.95)x10−6 (5.00±0.25)x10−5
R2 0.9752 0.9995 0.9646
Lan
geve
inT
=35
0KT
=2K
Ms , emu/g (3.30±0.83)x10−3 (6.01±0.16)x10−1 (1.22±0.03)x10−1
µ,
emu/g cm3
(4.89±1.19)x10−19 (1.02±0.05)x10−18 (4.42±0.12)x10−19
χP , cm3/g (4.45±0.16)x10−6 (9.36±0.38)x10−5 (3.00±0.06)x10−5
R2 0.9989 0.9984 0.9998
Ms , emu/g - (4.69±0.16)x10−2 (2.32±0.03)x10−2
µ,
emu/g cm3
- (1.49±0.07)x10−16 (8.68±0.19)x10−19
χP , cm3/g - (4.38±0.36)x10−6 (1.97±0.07)x10−6
R2 - 0.9975 0.9995

Chapter 5. Iron Phosphide System 163
0 50 100 150 200 250 300
0.5
1.0
1.5
2.0
2.5
3.0
-5 -4 -3 -2 -1 0 1 2 3 4 5-0.3
-0.2
-0.1
0.0
0.1
0.2
0.3
Susc
eptib
ility
(x10
-4 c
m3 /g
)
Temperature (K)
2K100K350K
Mag
netiz
atio
n (e
mu/
g)Applied Field (kG)
(a)
0 1000 2000 3000 4000 5000
0.00
0.05
0.10
0.15
0.20
0.25
0.30 2K 350K
Mom
ent (
emu/
g)
Applied Field (G)
(b)
Figure 5.13: Magnetization curves of charged FeP2: (a) temperature dependence of mass
susceptibility at H= 500 G (inset: hysteresis loops at 2 K, 100 K, and 350 K)
and (b) Langevin fit of M vs. H curves at 2 and 350 K.

Chapter 5. Iron Phosphide System 164
equation:
µ =πMsD
3p
6(5.5)
where Dp is the diameter of the magnetic domain.38,42 The size of the magnetic
domains calculated for pristine, discharged, and charged FeP2 are given in Table 5.8.
At 2 K the thermal effects which tend to randomize the direction of magnetic moment
Table 5.8: Magnetic particle diameter calculated for FeP2 samples.
Sample Pristine Discharge Charge
Particle
Diameter, nm
T=2 K 66 15 19
T=350 K - 182 232
vectors, and consequently interactions among the domains, are minimized. The
calculated domain sizes for the cycled materials are therefore very close to the particle
sizes of the newly formed phases.43 Upon lithiation, a four-fold decrease in particle
size is observed, consistent with the strong amorphization effect observed in the XRD
patterns. The small increase in the magnetic domain size after lithium removal is
probably due to the short-range reorganization of the FeP2 structure that has been
observed in the EXAFS study.
Mossbauer Spectroscopy
The spectrum of pure FeP2 (Figure 5.14) displays a doublet with signals positioned
at -0.905 and 1.081 mm/s. After lithiation, the contribution of this doublet is reduced

Chapter 5. Iron Phosphide System 165
to less than 10 % of the total area under the curve; yet, two other signals appear at
-0.016 and 0.657 mm/s. On charge, the two external peaks vanish completely and the
internal peaks are slightly shifted to -0.014 and 0.626 mm/s.
To determine the exact parameters of the peaks present in the spectra, the
experimental data sets were analyzed by least-squares fitting to the Lorentzian-
Parabola44 type function:
Y =
n∑
i=1
Ai
1 + x−pi
Bi
2 + [E + Fx + Gx2] (5.6)
where the first bracketed term is the sum of the n Lorentzians and the second term
is the parabola. In the equation, Ai, pi =, and Bi = are the amplitude, position,
and half-width of the ith peak (Lorentzian) and E, F , and G, are the conventional
parameters of the parabola.
From the values obtained in the curve fitting for each n pair of peaks, the chemical
shift (δn) and quadrupole splitting (∆n) parameters were determined using Equations
5.7 and 5.8. Table 5.9 present the summary of the results.
δn =(pn1 + pn2)
2(5.7)
∆n = pn2 − pn1 (5.8)
The isomer shift and quadrupole splitting obtained for FeP2 agree nicely with the
literature values (δ = 0.09 ± 0.03 mm/s and ∆ = 2.08 ± 0.02 mm/s),45 and are
consistent with iron in pure 3d4 configuration. This result attests to the purity of the
starting material. In accordance with EXAFS analysis, the Mossbauer spectroscopy

Chapter 5. Iron Phosphide System 166
-4 -3 -2 -1 0 1 2 3 40.920
0.940
0.960
0.980
1.000
0.988
0.992
0.996
1.000
0.980
0.985
0.990
0.995
1.000
S1
S2
FeP2 charged
FeP2 pristine
Velocity (mm/s)
FeP2 discharged
Rel
ativ
e Tr
ansm
issi
on
Figure 5.14: Mossbauer spectra for FeP2 samples obtained at room temperature and
referenced to α-Fe. The dotted lines depict the deconvoluted signals.

Chapter 5. Iron Phosphide System 167
Table 5.9: Mossbauer parameters calculated for FeP2 samples.
Sample Signalδ Error δ ∆ Error ∆ Contribution
mm/s mm/s mm/s mm/s %
Pristine S1 0.080 0.001 2.002 0.002 100.0
DischargeS1 0.080 0.007 2.008 0.015 9.7
S2 0.320 0.005 0.674 0.009 90.3
data on the cycled material suggest that Fe stays in a coordination environment
depicting close contact with phosphorus. Upon discharge, there is a significant
reduction of the FeP2 signal (S1), indicating incomplete reduction of the composite
anode, which completely disappears after charge. Additionally, a new doublet (S2)
appears in the spectrum upon discharge. The increase in isomer shift upon cycling
indicates stronger interaction between the Fe-3d and filled P-3p orbitals;46 according
to the model proposed by Danon,47 it corresponds to iron in 3d54s0.32. The values of
isomer and quadrupole shift for S2 are comparable to that of Fe in FeP (δ = 0.375
and ∆ = 0.750)45 suggesting that Fe is in close contact with phosphorus atoms in
the electrochemically formed phase “Li6FeP2”. Moreover, no magnetic splitting was
observed even at 4 K, which rules out the formation of Fe0, Fe3P, or iron carbides by
the absence of hyperfine interactions.48–50 Unfortunately, the sample obtained at the
end of charge was contaminated during its transport to France, compromising the
Mossbauer data obtained for it.

Chapter 5. Iron Phosphide System 168
5.4 Conclusions
The behaviour in the FeP2 system upon electrochemical lithium uptake can be nicely
contrasted to MnP4, where the existence of a crystalline ternary phase (Li7MnP4),
allows for reversible structural crystalline transformation between the two phases on
electrochemical Li uptake and extraction. A phase transition of this nature is not
possible for FeP2 due to the lack of thermodynamic stability of the Li-Fe-P phase
of the corresponding stoichiometry. From a thermodynamic point of view, only two
events can occur on Li uptake at room temperature: either phase separation into
Li3P + Fe or the formation of a metastable ternary phase. Our results show that
the latter takes place. The sum of the XAS, magnetization and Mossbauer data
unequivocally demonstrate formation of a metastable Li-Fe-P phase which displays
a high level of disorder. This nanostructured material contains FexP-rich magnetic
domains and Li-P rich regions in which the iron atoms retain coordination to P:
Li + FeP2discharge−−−−−→ Fex · · ·P · · ·LiyP
charge−−−−→ “FePq” + Li (5.9)
The formation of a metastable disordered ternary phase can be ascribed to the
similarity of the phosphorus atom arrangement in FeP2 and Li3P, as depicted by the
scheme in Figure 5.15. In the figure, both structures are oriented perpendicularly
to two close-packed (cp) phosphorus layers. In Li3P the phosphorus atoms form an
hexagonal close-packed arrangement, whereas the structure of FeP2 shows a small

Chapter 5. Iron Phosphide System 169
distortion from ideal cp. To illustrate the topographical correspondence in the two
structures, the three atoms that form the upper trigonal cp surface are highlighted
in different colors (purple, green, and cyan), and the three atoms that span the lower
trigonal plane are in black. The major differences between the two structures lie in:
(a) The occupation of the additional cation sites in Li3P and (b) An increase in the
P–P distances from 2.7/3.1 A in FeP2 to 4.27 A in Li3P .
(a) (b)
Figure 5.15: Comparison between the (a) Li3P and (b) FeP2 structures. P atoms: large
spheres (yellow, black, purple, green, and cyan); Li atoms: small blue
spheres; Fe atoms: medium red spheres.
The electrochemical formation of metastable ternary phases has been very recently
suggested in the transformation of LiMnSb into Li3Sb via a metastable solid solution
Li1+2xMn1−xSb.51 In oxides, owing to the strong ionic character of the compounds,
the reduction to the metallic state is driven by a large free energy of reaction.
Comparatively, in phosphides the high degree of covalent bonding and low valence of
the metal induces a transformation more akin to “intercalation” — either a structural

Chapter 5. Iron Phosphide System 170
rearrangement (MnP4–Li7MnP4) or the transformation to a semi-disordered state
observed here. This behaviour contrasts with that of the lower members of Group 15
elements (i.e. antimonides), as these materials are characterized by complete phase
separation into the lithium antimonide and the metal, as occurs for FeSb2.52
Considering the two structures and the results previously discussed, the following
mechanism is proposed to explain Li uptake by FeP2:
1. First, expansion of the phosphorus lattice, and incorporation of the additional
lithium to form a disordered, stuffed metastable “Li3Fe0.5P” lattice that still
maintains Fe within the structure. This process would disrupt the P–P bonding
by the occupancy of antibonding P–P levels by the first extra electron — as
observed in the Mossbauer data.
2. Second, the FeP6 octahedra would be isolated from each other by an expansion
of the P-P distance. Such a transformation would suppress Fe-Fe interactions
but maintain Fe–P bonding—consistent with the observed EXAFS data.
3. Last, on charge, Li is extracted from the disordered phase to yield a material
that, although amorphous, contains some of the local coordination between
FeP6 octahedra.

References
[1] Monconduit, L.; ”Tillard-Charbonnel”, M.; Belin, C. J. Solid State Chem. 2001,
156, 37.
[2] Jeitschko, W.; Donohue, P. Acta Cryst. 1972, B28, 1893.
[3] Jeitschko, W.; Donohue, P. Acta Cryst. 1973, B29, 783.
[4] Doublet, M.-L.; Lemoigno, F.; Gillot, F.; Monconduit, L. Chem. Mat. 2002,
14, 1983.
[5] Kim, Y.-U.; Sohn, H. “Novel vanadium monophosphide (VP) insertion anode
material for lithium secondary batteries”. In Proceedings of the 207 ECS Meeting ;
Electrochemical Society: QC-Canada, 2005.
[6] Wang, K.; Yang, J.; Xie, J.; Wang, B.; Wen, Z. Electrochem. Comm. 2003,
5, 480.
[7] Crosnier, O.; Nazar, L. F. Electrochem. Solid State Lett. 2004, 7, A187.
171

References 172
[8] Pfeiffer, H.; Tancret, F.; Brousse, T. Electrochim. Acta 2004, 50, 4763.
[9] Crosnier, O.; Mounsey, C.; Herle, P. S.; Taylor, N.; Nazar, L. F. Chem. Mat.
2003, 15, 4890.
[10] Gillot, F.; Monconduit, L.; Morcrette, M.; Doublet, M.-L.; Dupont, L.;
Tarrascon, J.-M. Chem. Mat. 2005, 17, 3627.
[11] Bichatt, M.-P.; Pascal, J.; Gillot, F.; Favier, F. Chem. Mat. 2005, 17, 6761.
[12] Schmidt, D. G. U.S. Pat. 2002037452, 2002.
[13] Honbo, H.; Yamagata, T.; Muranaka, K. Jpn. Pat. 10199527, 1998.
[14] Inagaki, H.; Takami, N. Eur. Pat. Appl. 1134824, 2001.
[15] Thompson, A. H.; Whittingham, M. S. Mater. Res. Bull. 1977, 12, 741.
[16] Klutz, H.; Schneider, G.; Kliche, G. Phys. Chem. Min. 1983, 9, 109.
[17] Lefebvre-Devos, M. L.; X. Wallart, J. Olivier-Fourcade, L. M.; Jumas, .-C.
Phys. Rev. B: Condens. Matter 2001, 63, 125110.
[18] Souza, D.; Pralong, V.; Jacobson, A.; Nazar, L. Science 2002, 296, 2012.
[19] Meisel, V.-K. Z. Anorg. Allg. Chem. 1934, B218, 360.
[20] Dahl, E. Acta Chem. Scand. 1969, 23, 2677.
[21] Florke, V. U. Z. Anorg. Allg. Chem. 1983, 502, 218-224.

References 173
[22] Larson, A.; Dreele, R. V. “General Structure Analysis System (GSAS)”,
Technical Report LAUR 86-748, Los Alamos National Laboratory, 2000.
[23] Toby, B. J. Appl. Crystall. 2001, 34, 210.
[24] Rietveld, A. Acta Cryst. 1967, 22, 151.
[25] Howard, C. J. Appl. Crystall. 1982, 15, 615.
[26] Poizot, P.; Baudrin, E.; Laruelle, S.; Dupont, L.; Touboul, M.; Tarascon, J.-M.
Solid State Ionics 2000, 138, 31.
[27] Mao, O.; Turner, R. L.; Courtney, I. A.; Fredericksen, B. D.; Buckett, M. I.;
Krause, L. J.; Dahn, J. R. Electrochem. Solid State Lett. 1999, 2, 3.
[28] Winter, M.; Besenhard, J. O.; Spahr, M.; Novak, P. Adv. Mater. 1998, 10,
725.
[29] Box, G. Statistic for Experimenters; John-Wiley & Sons: New York, 1978.
[30] Montgomery, D. Design and Analysis of Experiments; John-Wiley & Sons: New
York, 1995.
[31] Brauer, G.; Zintl, E. Z. Phys. Chem. Ab. B 1937, 37, 323.
[32] Leroux, F.; Goward, G.; Power, W.; Nazar, L. Electrochem. Solid State Lett.
1998, 1, 255.
[33] Rossignol, C.; Ouvrard, G. J. Power Sources 2001, 97-8, 491-493.

References 174
[34] Mansour, A.; Yang, X.; Sun, X.; McBreen, J.; Croguennec, L.; Delmas, C.
J. Electrochem. Soc. 2000, 147, 2104.
[35] Giorgetti, M.; Passerini, S.; Smyrl, W.; Mukerjee, S.; Yang, X.; McBreen, J.
J. Electrochem. Soc. 1999, 146, 2387.
[36] Cullity, B. Introduction to Magnetic Materials; Addison-Wesley: Philipines,
1972.
[37] Boda, G.; Stenstrddoto, B.; Sagredo, V.; Beckman, O.; Carlsson, B.;
Rundqvist, S. Physica Scripta 1971, 4, 132.
[38] Selwood, P. Chemisorption ad Magnetization; Academic Press Inc.: New York,
1975.
[39] Morrish, A. H. The Physical Principles of Magnetism; John-Wiley & Sons: New
York, 1965.
[40] Zhang, S. J.; Tsuboi, A.; Nakata, H.; Ishikawa, T. J. Power Sources 2001,
97-8, 584.
[41] Ibusuki, T.; Kojima, S.; Kitakami, O.; Shimada, Y. IEEE Trans. Mag. 2001,
37, 2223.
[42] Kim, J.; Amine, K. Electrochem. Comm. 2001, 3, 52-55.

References 175
[43] Jiles, D. Introduction to Magnetism and Magnetic Materials; Chapman & Hall:
London, 1st ed.; 1991.
[44] Rhodes, E.; Polinger, A.; Spijkerman, J.; Christ, B. Trans. Met. Soc. AIME
1968, 242, 1922.
[45] Wappling, R.; Haggstrom, L.; Rundqvist, S.; Karlsson, E. J. Solid State Chem.
1971, 3, 276.
[46] Walker, L.; Wertheim, G.; Jaccarino, V. Phys. Rev. Lett. 1961, 6, 98.
[47] Danon, J. Tech. Rep. Ser., Int. At. Energy Ag. 1966, 50, 89.
[48] Petrov, Y.; Shafranovsky, E.; Krupyanskii, Y.; Essine, S. J. Appl. Phys. 2002,
91, 352.
[49] Bailey, R.; Duncan, J. Inorg. Chem. 1967, 6, 1444.
[50] Bi, X.-X.; Ganguly, B.; Huffman, G.; Huggins, F.; Endo, M.; Eklund, P.
J. Mater. Res. 1993, 8, 1666.
[51] Fransson, L. M. L.; Vaughey, J. T.; Edstrom, K.; Thackeray, M. M.
J. Electrochem. Soc. 2003, 150, A86.
[52] Crosnier, O.; Silva, D. C. C.; Ouvrard, G.; Danot, M.; Nazar, L. F. in
preparation, .

Chapter 6
Cobalt Phosphide System
6.1 Introduction
Investigations of transition metal oxides as anode materials, first reported by Idota et
al., Nazar and co-workers, and Tarascon and co-workers,1–4 developed new concepts
concerning the mechanism of Li “insertion”. In bulk MoO3, Li uptake drives the
reduction of the metal to form a nanophase matrix of Li2O, and metal sub-oxide
particles; on charge, Mo-oxide is regenerated although a “crystalline” MoO3 phase is
not fully achieved. Similarly, reduction of nanophase CoO produces Co nano-particles
in a matrix of Li2O but in this case nano-CoO is regenerated on charge. Subsequently,
Obrovac et al. showed that the latter reaction can be thought of as a displacement
reaction of the Co2+ by Li+ ions within the oxide matrix on discharge, the reverse
176

Chapter 6. Cobalt Phosphide System 177
occurring on charge.5 In these relatively “ionic” systems, reduction is driven by the
difference in thermodynamic free energy between the oxidized and reduced states of
the metal.
The quest for alternative anode materials for lithium ion batteries turned towards
one more phosphide with an open structure, but this time with no known ternary
lithiated phase. CoP3 crystallizes in the skutterudite-type structure with 3D channels
of average dimensions 5.38 A x 2.33 A.6,7 The structure, which resembles that of the
marcasite-type FeP2 (see Chapter 5), may be described as a cubic sub-lattice of
cobalt atoms, with cell dimension a/2 in which six four-membered phosphorus rings
are inserted in the cubes along the axial directions (Figure 6.1(a)).8 Alternatively, it
may be viewed as consisting of corner-shared CoP6 octahedra that are tilted to form
P4 rings (Figure 6.1(b)).
To the best of our knowledge, the electrochemical reactions of CoP3 toward lithium
had not been investigated before we started our studies. In 2002, however, Alcantara
and co-workers9 published results on the cobalt phosphide system contemporaneous
with our communication in the same year.10 In 2005, Zhang et al.11 reported on
electrochemical results of a CoP and CoP3 mixture prepared by mechanical milling.
A comparison between these and our results is presented here.

Chapter 6. Cobalt Phosphide System 178
(a) (b)
Figure 6.1: (a) Geometrical and and (b) polyhedral representations of the CoP3
structure.
6.2 Experimental
6.2.1 Synthesis of CoP3
Stoichiometric amounts of cobalt and red phosphorus were mixed inside an argon
filled glove-box with the aid of a mortar and pestle and transfered to a stainless-steel
crucible (see description in Section 5.2.1) which was then arc-welded under an argon
atmosphere. The reaction was carried out for 24 hours at 800 ◦C. After quenching
the reactions in a cold water bath, the tubes were cut open and the obtained product
ground manually with a mortar and pestle and sieved through a 400 mesh nylon grid.

Chapter 6. Cobalt Phosphide System 179
6.2.2 Synthesis of LiP
Stoichiometric amounts of metallic lithium and red phosphorus were mixed inside
an argon filled glove-box with the aid of a mortar and pestle and transfered to a
stainless-steel crucible (see description in Section 5.2.1) which was then arc-welded
under an argon atmosphere. The reaction was carried out for 24 hours at 600 ◦C then
quenched in a cold water bath. The tubes were opened and the obtained materials
were stored under argon atmosphere.
6.3 Characterization and Properties CoP3
6.3.1 Structure and Composition of the Materials
The synthetic methods described to obtain CoP3 reported in the early literature
use either stoichiometric amounts of the pure elements at high temperatures or the
Jolibois flux technique (heating of an alloy of Co-Sn with excess phosphorus followed
by dissolution of the tin phosphide matrix with HCl) at lower temperatures.6,7,12
The stoichiometric approach is done by heating the mixture in sealed silica tubes
at temperatures between 950 − 1400 ◦C over several days followed by slow cooling
to room temperature.7 These earlier reports suggest that medium pressures (at
1000 ◦C the vapour pressure of phosphorus over the reacting mixture is around
400 Torr and decreases rapidly at lower temperatures) and slow cooling are essential

Chapter 6. Cobalt Phosphide System 180
for the formation of the desired phase – otherwise some phosphorus is left unreacted.
Recently, niobium tubes were used as crucibles and the reaction was carried out for
1 week at 800 ◦C followed by quenching to room temperature.9 Additionally, high
energy ball-milling of stoichiometric amounts of phosphorus and cobalt for less than
11 hours forms a mixture of CoP3 and small amounts of CoP.11
In this work, the methodology used to prepare CoP3 was straightforward. Differing
from the aforementioned reports, the reaction crucibles were made of stainless-steel
tubes instead of quartz or niobium, and much shorter reaction times were employed.
In addition, slow cooling of the reaction led to the formation of CoP instead of the
desired triphosphide (see Figures 6.2(a) and 6.2(b)), which formed upon quenching.
The products structure and purity were confirmed by XRD analysis. The data was
collected between 20◦< 2θ <70◦, in steps of 0.01◦ during 20 s and refined in the cubic
space group Im3 with GSAS,13,14 using the Rietveld method for full pattern match.15
The refined variables were the scale factor, background polynomial coefficients, unit
cell parameters, atomic positions, and pseudo-Voigt peak shape (using of the type
2 profile function for constant wavelength diffraction data).16 As shown in Figure
6.2(a) and Table 6.1, the refinement of the XRD pattern yielded structure and atom
parameters complying with those previously reported.17

Chapter 6. Cobalt Phosphide System 181
514
523
/611
512
211
200
220
300
/311
222
311
/322
400
330
/41
1
420
/402
332
422
413
/510
440
442
/600
503 602
622
613 44
4
2 (degree)q
100
Inte
nsi
ty(a
.u.)
IobsIcalc
Ibgk
Iobs-calc
10 20 30 40 50 60 70 80 90
(a)
10 20 30 40 50 60 70
2 (degree)q
Inte
nsity
(a.u
.)
(b)
Figure 6.2: Powder XRD patterns of Co + 3P reaction products obtained after (a)
quenching (CoP3, Rietveld refinement) and (b) slow cooling to room
temperature (CoP).

Chapter 6. Cobalt Phosphide System 182
Table 6.1: Results of the CoP3 XRD pattern Rietveld refinement in the space
group Im3.
Sample CoP3 Reference17
Unit Cell Parameter (A) 7.7073±0.0005 7.7027
Cell Volume (A3) 457.02±0.09 457.01
Formula Weight 1214.84 1214.84
Density (g/cm3) 4.41 4.42
Rpa (%) 5.48 n.a.
Rwpb (%) 7.06 n.a.
χ2 1.97 n.a.
Number of Refined Variables 12 n.a.
a Rp =P
||Iexp|−|Icalc||P
Fexp
b Rwp =√
MpP
wI2
calc
, where Mp =∑
w(Iobs − Icalc)2 is the powder data contribution for the
general least squares minimization function

Chapter 6. Cobalt Phosphide System 183
6.3.2 Electrochemical Studies of CoP3
Figure 6.3 shows the electrochemical behaviour of CoP3 under galvanostatic
conditions at C/10. The first discharge process (Figure 6.3(a)) is characterized
by a flat plateau corresponding to the uptake of ≈9 Li (after correction for the
carbon contribution). On charge, 6 lithium ions are extracted leading to a reversible
capacity of 1000 mAh/g, which fades and stabilizes at 300 mAh/g after 10 cycles
(Figure 6.3(b)). This result differs from the data presented by Alcantara who
reported a maximum of 1090 mAh/g and 375 mAh/g in the first discharge and charge,
respectively, at a rate of C/20 and smaller voltage window (1.2-0.45 V); reduction of
the lower voltage limit to 0.1 V markedly diminished the reversible capacity without
increasing the initial amount of lithium uptake.9 Considering the much longer reaction
times employed in their synthetic procedure (1 week vs. 1 day), the CoP3 phase they
prepared probably had a larger particle size than ours. Hence, the lower capacity
values observed by them was probably due to the increased path-length for lithium
diffusion, which hinders the kinetics.
By means of potentiostatic intermittent titration technique, a bell shaped current
response associated with a constant voltage during the first cycles (Figure 6.4)
confirmed the occurrence of a two-phase decomposition process.18 The equilibrium
voltage obtained for the first discharge (0.35 V) is much lower than the values for the
subsequent sweeps (VEq1stcharge= 0.385 V and VEq
2nddischarge= 0.99 V). This difference

Chapter 6. Cobalt Phosphide System 184
0.0
0.5
1.0
1.5
2.0
2.5
0 1 2 3 4 5 6 7 8 9 10
0 354 708 1062 1416 1770
Vo
lts
vs.
Li/
Li+
x in LixMnP
4
Specific Capacity (mAh/g)
(a)
0
100
200
300
400
500
0 2 4 6 8 10 12 14 16
Rev
ersi
ble
Cap
acit
y(m
Ah
/g)
Cycle Number
(b)
Figure 6.3: Galvanostatic voltage-composition profile of CoP3 at C/10 rate.
indicates that the decomposition reaction in the first discharge is irreversible in nature
and generates the active material for the two-phase reversible process in subsequent
cycles. The difference in the potential of lithium in the structure of charged and
discharged phases can account for the large difference in equilibrium voltage.
The possible reaction of CoP3 with Li+ in the first discharge according to the
equation
CoP3 + 9Li + +9e−discharge−−−−−→ 3Li3P + Co (6.1)
compares to the behaviour reported for CoSb3 by Tirado et al. who proposed a
transformation into (Li3Sb + Co0) on Li uptake.19 In order to investigate the
mechanism of electrochemical uptake of lithium by the analogous but more ionic
phosphide, structural and chemical analysis were carried out on electrodes cycled to

Chapter 6. Cobalt Phosphide System 185
0.00
0.25
0.50
0.75
1.00
1.25
1.50
1.75
-40
-20
0
20
40
40 45 50 55 60 65 70 75 80
80 85 90 95 100 105 110
Volt
svs
.L
i/L
i+
Cu
rrent
Den
sity(m
A/g
)
Elapsed time during 1st charge (h)
Elapsed time during 2nd discharge (h)
UEq
= 0.85V
UEq
= 0.99V
Figure 6.4: First cycle PITT profile of CoP3 at C/5.

Chapter 6. Cobalt Phosphide System 186
different redox states.
6.3.3 Ex-situ Analysis of Cycled CoP3
Ex-situ and In-situ XRD
The XRD pattern of the CoP3 electrode at the end of the first discharge (Figure 6.5)
clearly shows, along with partial amorphization of the electrode material, reflections of
the Li3P phase as well as lines assigned to unreacted CoP3; the lines corresponding to
metallic cobalt, however, are absent. Upon oxidation corresponding to the extraction
of 6 Li, the material becomes completely amorphous.
The XRD data of the cycled material, both ex-situ and in-situ, suggest that in
the phosphide system, cobalt is either extruded from the structure as nanoparticles
and/or remains in a partially covalently bonded environment. Furthermore, it raises
an important question: does oxidation result in re-formation of highly dispersed CoP3
(as in the case of the oxide, CoO) or is the process more complex? In an attempt
to investigate the lithium-driven structural and morphological changes, the CoP3
electrode was examined at various stages of reduction and oxidation by means of
transmission electron microscopy.

Chapter 6. Cobalt Phosphide System 187
2 (degree)q
Inte
nsi
ty (
a.u
.)
15 20 30 40 50 60 6525 35 45 55
Pristine
Discharged
Charged *
*
*Al| LiP
*Al| Li P3
| CoP3
* *
(a)
20 25 30 35
Disch. 0.34V
Disch. 0.15V
Char. 1.70V
Disch. 0.27V
2 (degree)q
Disch. 0.40V
Inte
nsi
ty (
a.u
)
Li P3
LiP
CoP3
(b)
Figure 6.5: XRD patterns of cycled CoP3: (a) Ex-situ profiles before cycling and at the
end of first discharge and charge (* Al from cell hardware); (b) In-situ profiles
in a narrower 2θ range (LiP/Li3P region) at various stages of the first cycle.

Chapter 6. Cobalt Phosphide System 188
Ex-situ TEM
The TEM micrograph of the starting material (Figure 6.6(a)) shows that it comprises
particles with dimensions ranging from 200 to 100 nm. As expected, the SAED
pattern taken down the [111]* zone axis (Figure 6.6(d)) is consistent with the presence
of well-crystallized particles, in accord with the XRD results. The bright field image
of the particles after full reduction, Figure 6.6(b), reveals significant changes in
the material texture. Particles with dimensions of 10–20A are detected embedded
in the crystallites which retain their initial shape. The reaction forms a partially
amorphous material as confirmed by the broad, weak rings observed in the SAED
pattern. Indexing of the pattern (Figure 6.6(e)) to the reflections of Li3P gave
excellent agreement, confirming the formation of lithium phosphide upon lithiation.
Additionally, analysis of the broad ring pattern did not reveal any inter-planar
spacings assigned to cobalt metal; even the 111 reflection, which should be particularly
strong, is completely absent. As there is also no evidence for the presence of CoO
nanoparticles, the cobalt must remain “partially coordinated” to the Li3P matrix,
giving rise to the extremely high degree of dispersion. These particles, of dimensions
approaching that of metal clusters (15A), are not observable by SAED due to extreme
broadening.20
On charge, Figures 6.6(c) and 6.6(f), both the nanoscopic size and pseudo-
amorphous character of the active material are preserved. The SAED pattern clearly

Chapter 6. Cobalt Phosphide System 189
shows the replacement of the Li3P reflections by those of LiP∗, but there is no evidence
of CoP3 regeneration. Hence, the electrochemical process seems best characterized as
a redox reaction between Li3P and LiP, in agreement with the findings of Alcantara
and co-workers, based on XRD data and thermodynamic considerations.9 Table 6.2
summarizes the indexing results.
Ex-situ XPS
An important question remains: whether the cationic or the anionic network plays the
major role in the electrochemical redox process of CoP3. The reversibility and nature
of the intriguing process involved in the electrochemical uptake of lithium by CoP3
was addressed with ex-situ XPS analysis of the cycled material. Since the binding
energy is characteristic of the elements present and their chemical states, the x-ray
photoelectron spectra provide direct “fingerprint” of the samples.
Figure 6.7 shows the spectra of the fully discharged and charged electrodes after
ion sputtering to clean the surface. Unfortunately, the resolvable Co 2p region cannot
be used to elucidate the exact role of the cobalt because the 2p 1/2,3/2 states of both
metallic and covalent species are almost at the same energy level and the thresholds
do not change significantly upon cycling (measured thresholds of Co 2p states in
pristine CoP3, discharged, and charged materials were, respectively, 793.5/778.4 eV,
∗ The diffraction diaphragm opening was increased 10x, in order to enlarge the data samplingarea; this explains the brightness of the SAED pattern obtained for a quasi-amorphous phasewith relatively featureless XRD pattern. This technique is commonly used in samples containing
nano-sized particles that do not show discrete features in their XRD pattern.21,22

Chapter 6. Cobalt Phosphide System 190
2 µm
(a)
2 µm
(b)
2 µm
(c)
000
110
101
211
220
312
422
(d)
100200*211
21-2121
22-1
130
(e)
100200*211
21-2121
22-1
130
(f)
Figure 6.6: Ex-situ TEM micrographs (a, b, c) and SAED patterns (d, e, f) of pristine,
discharged, and charged CoP3 respectively.
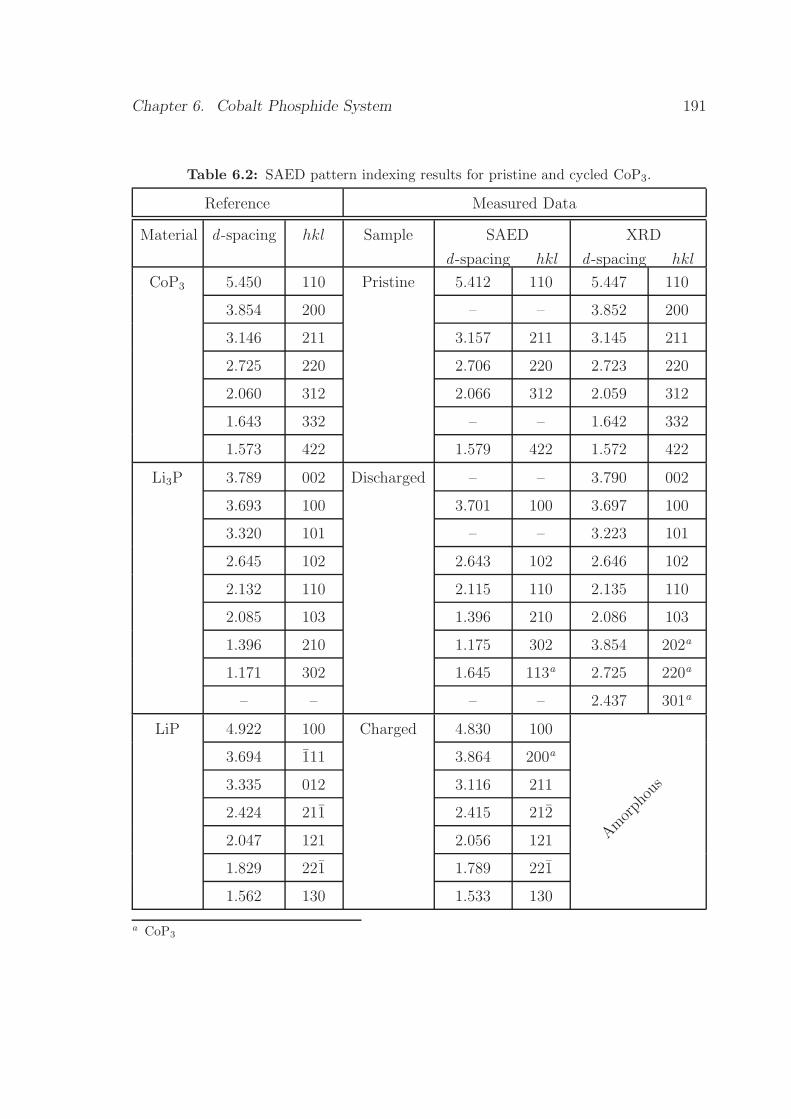
Chapter 6. Cobalt Phosphide System 191
Table 6.2: SAED pattern indexing results for pristine and cycled CoP3.
Reference Measured Data
Material d -spacing hkl Sample SAED
d -spacing hkl
XRD
d -spacing hkl
CoP3 5.450 110 Pristine 5.412 110 5.447 110
3.854 200 – – 3.852 200
3.146 211 3.157 211 3.145 211
2.725 220 2.706 220 2.723 220
2.060 312 2.066 312 2.059 312
1.643 332 – – 1.642 332
1.573 422 1.579 422 1.572 422
Li3P 3.789 002 Discharged – – 3.790 002
3.693 100 3.701 100 3.697 100
3.320 101 – – 3.223 101
2.645 102 2.643 102 2.646 102
2.132 110 2.115 110 2.135 110
2.085 103 1.396 210 2.086 103
1.396 210 1.175 302 3.854 202a
1.171 302 1.645 113a 2.725 220a
– – – – 2.437 301a
LiP 4.922 100 Charged 4.830 100
Amorph
ous
3.694 111 3.864 200a
3.335 012 3.116 211
2.424 211 2.415 212
2.047 121 2.056 121
1.829 221 1.789 221
1.562 130 1.533 130
a CoP3

Chapter 6. Cobalt Phosphide System 192
794.0/779.0 eV, and 793.7/778.7 eV). Data collected in the overlapping regions of the
Co 3p and Li 1s states, however, is quite revealing. In both spectra, the broad features
at 60 eV (P1) can be assigned to the Co 3p (1/2, 3/2) states, by comparison with
reference data.23 Since this peak position should remain unchanged in accordance
with the invariance of the Co 3p states, changes in the spectra must thus be rooted
in the Li 1s states.
The Li 1s region in the spectra of both cycled materials depicts the signature
peak at 56 eV (P2) which corresponds to Li+ from residual electrolyte (LiPF6). In
the spectrum of the discharged sample, P2 overlaps with another peak P3 at 56.87 V
which, by curve deconvolution and comparison with the literature value of 56.9 eV, is
assigned to the Li 1s state in Li3P.23 On charge, P3 shifts to a higher binding energy
(59 eV) indicating a reduction in the phosphorus oxidation state. Comparison with
the spectrum of synthesized LiP reference material provides unequivocal assignment
of the peak to Li 1s state in LiP (binding energy 59.03 eV).
These results, along with the electron diffraction data, confirm the formation of
LiP on charge. Moreover, the XPS data suggest that cobalt does not play a major
role in the redox process, since its binding energy does not change upon reduction or
oxidation.

Chapter 6. Cobalt Phosphide System 193
5055606570
Binding Energy (eV)
P1
P3
P2
(b)
P1
P2
P3
P1
P3
P2
P1
P2
P3
(a)
Figure 6.7: Ex-situ XPS spectra of cycled CoP3: (a) discharged (Li9CoP3) and (b)
charged (Li3CoP3).

Chapter 6. Cobalt Phosphide System 194
6.3.4 Proposed Mechanism
Based on the results presented here, a simplified mechanism accounting for the initial
reversible capacity of 6 Li can be written:
CoP3 + 9Li+ + 9e−F irst Discharge−−−−−−−−−→ 3Li3P + “Co” (6.2)
3Li3PSubsequent Cycling−−−−−−−−−−−→ 3LiP + 6Li+ + 6e− (6.3)
6.4 Conclusions
In this system, the relatively high electronic conductivity of CoP3 enhances initial
electronic transport within the electrode material and facilitates the decomposition
process. After discharge, the high ionic conductivity of Li3P of 10−3 S/cm, a property
that has spurred its investigation as a solid electrolyte,24 promotes Li+ ion transfer
within the composite matrix. The X-ray and electron diffraction data clearly show
that cobalt is in a highly dispersed state in both the discharged and charged materials.
This morphological disorder precludes the investigation of its role (if any) in the redox
process. It apparently acts as an “active spectator” after initial discharge since bulk
metallic cobalt does not form. The high degree of Co dispersion and bonding to the
Li-P matrix may nonetheless enhance Li transport by grain boundary effects.
The fact that neither CoP3 nor amorphous forms of cobalt phosphide are

Chapter 6. Cobalt Phosphide System 195
regenerated on charge sets this mechanism apart from transition metal oxides, where
partial or complete recuperation of the oxide structure occurs.2,25 This can be
rationalized from a thermodynamic point of view. Formation of LiP, which has a
higher lattice energy, hinders the restoration of the starting material CoP3 upon
charge, even as nano-crystallites. On the other hand, highly lithiated ternary phases,
i.e. LixCoPy with x and y larger than one, are not expected to be present in the
discharged material given that these do not exist in the Li-Co-P phase diagram.
Notwithstanding, based on the absence of metallic cobalt in the fully reduced material,
the system can be regarded as a highly dispersed, phase-separated metastable analog
of the transition metal oxides.
The suggested reaction mechanism for electrochemical lithium uptake/extraction
by CoP3 is exactly the same proposed by Alcantara et al. This corroborates the
validity of the results since the two research groups independently reached the same
conclusions.

References
[1] Idota, Y. US Patent, 548671, 1995.
[2] Leroux, F.; Goward, G.; Power, W.; Nazar, L. Electrochem. Solid State Lett.
1998, 1, 255.
[3] Leroux, F.; Nazar, L. Materials for Batteries and Fuel Cells. In , Vol. 575;
Doughty, D.; Nazar, L.; Arakawa, M.; Brack, H.-P.; Naoi, K., Eds.; MRS:
Pennsylvania, 2000.
[4] Denis, S.; Baudrin, E.; Orsini, F.; Ouvrard, G.; Touboul, M.; Tarascon, J.-M.
J. Power Sources 1999, 81, 79.
[5] Obrovac, M.; Dunlap, R. A.; Sanderson, R.; Dahn, J. R. J. Electrochem. Soc.
2001, 148, A576.
[6] Biltz, W.; Heimbrecht, M. Z. Anorg. Allg. Chem. 1939, 241, 238.
[7] Rundqvist, S.; Ersson, N.-O. Arkiv for Kemi 1968, Bd.30, 103.
196

References 197
[8] Lefebvre-Devos, I.; Lassalle, M.; Wallart, X.; Olivier-Fourcade, J.; anJ.C.
Jumas, L. M. Phys. Rev. B: Condens. Matter 2001, 63, 125110.
[9] Alcantara, R.; Tirado, J.; Jumas, J.; Monconduit, L.; Oliier-Fourcade, J.
J. Power Sources 2002, 109, 308.
[10] Pralong, V.; Souza, D.; Leung, K.; Nazar, L. F. Electrochem. Comm. 2002, 4,
516.
[11] Zhang, Z.; Yang, J.; Nuli, Y.; Wang, B.; Xu, J. Solid State Ionics 2005, 176,
693.
[12] Jolibois, Electrochem. Solid State Lett. 1900, 2, A21.
[13] Larson, A.; Dreele, R. V. “General Structure Analysis System (GSAS)”,
Technical Report LAUR 86-748, Los Alamos National Laboratory, 2000.
[14] Toby, B. J. Appl. Crystall. 2001, 34, 210.
[15] Rietveld, A. Acta Cryst. 1967, 22, 151.
[16] Howard, C. J. Appl. Crystall. 1982, 15, 615.
[17] “JCPDS file number 29-496”, .
[18] Weppner, W.; Huggins, R. Ann. Rev. Mater. Sci. 1978, 8, 269.
[19] Alcantara, R.; Fernandez-Madrigal, F.; P. Lavela, J. T.; Jumas, J.-C.; Olivier-
Fourcade, J. J. Chem. Mat. 1999, 9, 2517.

References 198
[20] Fultz, B.; Howe, J. Transmission Electron Microscopy and Diffractometry of
Materials; Springer-Verlag: Berlin, 2001.
[21] Treacy, M. NEC, Princeton Labs, Private Communication, 2002.
[22] Imamura, S.; Ishida, S.; Tarumoto, H.; Saito, Y.; Ito, T. J. Chem. Soc.,
Faraday Trans. 1993, 89, 757.
[23] Chastain, J., Ed.; Handbook of X-ray Photoelectron Spectroscopy; Perkin Elmer
Corporation: Eden Prairie, 1992.
[24] Nazri, G. Solid State Ionics 1989, 34, 97.
[25] Poizot, P.; Laruelle, S.; Grugeon, S.; Dupont, L.; Tarascon, J.-M. Nature
2000, 407, 496.

Chapter 7
Conclusions
7.1 Summary
This thesis highlights the importance of the anion in the electrochemical uptake of
lithium by metal phosphides. Data from a variety of in-situ and ex-situ analytical
techniques prove that the redox active centers in three different systems (MnP4, FeP2,
and CoP3) are not necessarily cationic but can be based almost entirely on the anionic
network.
The electrochemical processes responsible for reversible Li uptake/extraction in
transition metal phosphides depends on the transition metal, and as to whether binary
and lithiated ternary phases with the same M:P stoichiometry exist in the phase
diagram. The reaction mechanism also depends on the structure of the starting
199

Chapter 7. Conclusions 200
phase.
According to the results presented in the previous chapters, the behaviour of
transition metal phosphides towards Li intake can be classified as:
A. Both binary and lithiated ternary phases of the transition metal exist. In this
case a topotactic phase transformation between binary and ternary phases occurs
upon lithium uptake and removal:
MnP4 ↔ Li7MnP4
B. Only the binary phase exists. In this case two different behaviours are observed:
Type I: Lithium uptake leads to the formation of an amorphous material in
which short-range order is maintained:
FeP2discharge−−−−−→ Fex · · ·P · · ·LiyP
charge−−−−→ “FePq” + Li
Type II: Lithium uptake causes phase decomposition of the transition metal
phosphide forming lithium phosphide which becomes the active
material:
CoP31st discharge−−−−−−−→ Co + Li3P
Li3PSubsequent Cycling−−−−−−−−−−−→ LiP + 2Li+
Of the results presented here, some comprise major scientific contributions. First,
the electrochemically induced reversible crystalline phase transformation outlined

Chapter 7. Conclusions 201
in Chapter 4 represents an exciting finding. With the exception of intercalation
reactions, crystalline transformations in the solid state are kinetically hindered and
typically occur on geological time scales without the benefit of high temperature,
owing to the difficulty of transport within the bulk. Cobalt phosphide displays
electrochemical activity towards lithium via a disproportionation reaction (see above);
in FeP2 discharge generates an amorphous matrix in which iron is in close contact
with phosphorus. These results are of both fundamental and technological interest
since they depart from the intercalation or alloying reactions normally observed in
lithium-ion battery chemistry.
Secondly, unlike most intercalation compounds that accommodate guest species
by redox chemistry at the cationic centers, in metal phosphides it is primarily the
anion that undergoes the redox reaction. The cleavage of the covalent P–P bonds
is undoubtedly a consequence of the strong anion character of the uppermost filled
electronic band.
Third, the three systems studied exhibit very high initial capacities, up to 3 times
the specific capacity of carbon, constituting excellent alternative anode materials for
carbon in lithium ion batteries. This fact alone has triggered many research groups
to investigate other transition metal phosphides, although the cycleability of the
electrodes needs improvement.

Chapter 7. Conclusions 202
7.2 Future Work
As stated before, many transition metal phosphides have been examined after we first
published our initial results. Nevertheless, the surveys published so far are just the
tip of the iceberg. From a technological point of view, transition metal phosphides
are attractive materials, but their electrochemical performance needs improvement.
For this purpose, some key aspects need further investigation:
• Side reactions between electrode and electrolyte components;
• Effect of additives on the stability window of electrolytes during electrochemical
reaction and on mechanism for lithium uptake/extraction;
• Nature of the solid electrolyte interface formed, if any.
• Effect of particle micro-structure control on structural interconversion.