Study of the state of implementation of logistics trends...
12
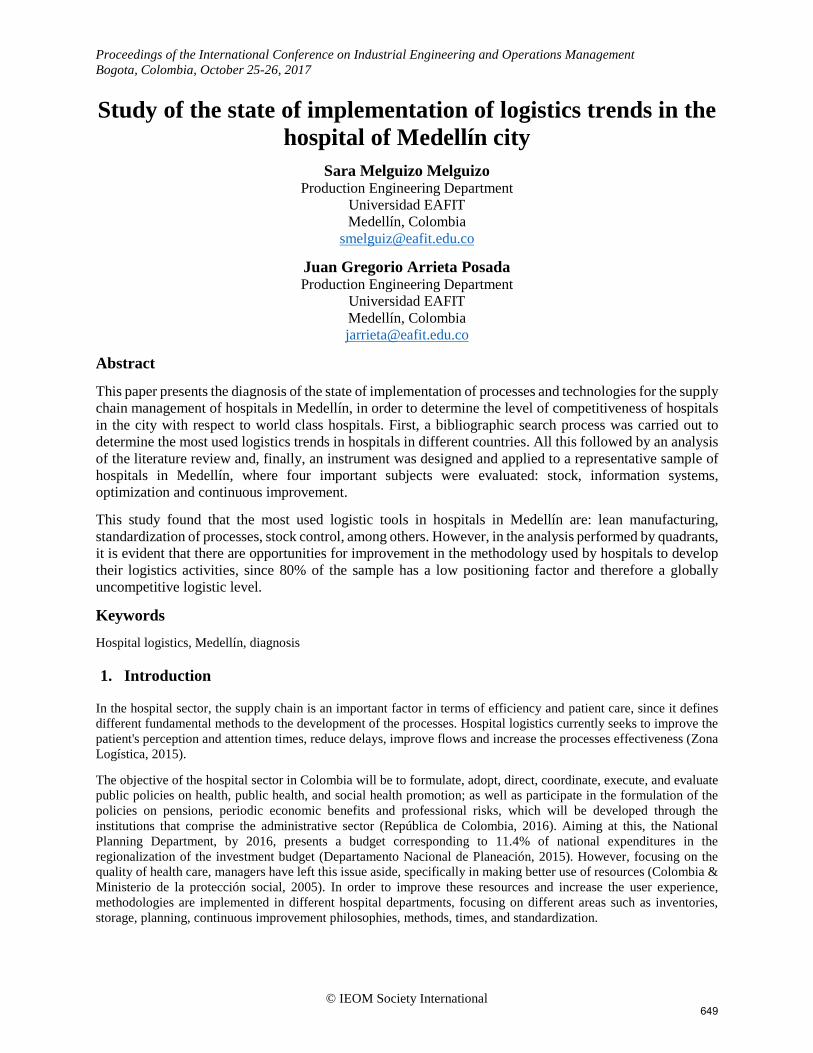
Proceedings of the International Conference on Industrial Engineering and Operations Management Bogota, Colombia, October 25-26, 2017 Study of the state of implementation of logistics trends in the hospital of Medellín city Sara Melguizo Melguizo Production Engineering Department Universidad EAFIT Medellín, Colombia [email protected] Juan Gregorio Arrieta Posada Production Engineering Department Universidad EAFIT Medellín, Colombia [email protected] Abstract This paper presents the diagnosis of the state of implementation of processes and technologies for the supply chain management of hospitals in Medellín, in order to determine the level of competitiveness of hospitals in the city with respect to world class hospitals. First, a bibliographic search process was carried out to determine the most used logistics trends in hospitals in different countries. All this followed by an analysis of the literature review and, finally, an instrument was designed and applied to a representative sample of hospitals in Medellín, where four important subjects were evaluated: stock, information systems, optimization and continuous improvement. This study found that the most used logistic tools in hospitals in Medellín are: lean manufacturing, standardization of processes, stock control, among others. However, in the analysis performed by quadrants, it is evident that there are opportunities for improvement in the methodology used by hospitals to develop their logistics activities, since 80% of the sample has a low positioning factor and therefore a globally uncompetitive logistic level. Keywords Hospital logistics, Medellín, diagnosis 1. Introduction In the hospital sector, the supply chain is an important factor in terms of efficiency and patient care, since it defines different fundamental methods to the development of the processes. Hospital logistics currently seeks to improve the patient's perception and attention times, reduce delays, improve flows and increase the processes effectiveness (Zona Logística, 2015). The objective of the hospital sector in Colombia will be to formulate, adopt, direct, coordinate, execute, and evaluate public policies on health, public health, and social health promotion; as well as participate in the formulation of the policies on pensions, periodic economic benefits and professional risks, which will be developed through the institutions that comprise the administrative sector (República de Colombia, 2016). Aiming at this, the National Planning Department, by 2016, presents a budget corresponding to 11.4% of national expenditures in the regionalization of the investment budget (Departamento Nacional de Planeación, 2015). However, focusing on the quality of health care, managers have left this issue aside, specifically in making better use of resources (Colombia & Ministerio de la protección social, 2005). In order to improve these resources and increase the user experience, methodologies are implemented in different hospital departments, focusing on different areas such as inventories, storage, planning, continuous improvement philosophies, methods, times, and standardization. © IEOM Society International 649
Transcript of Study of the state of implementation of logistics trends...
Proceedings of the International Conference on Industrial Engineering and Operations Management Bogota, Colombia, October 25-26, 2017
Study of the state of implementation of logistics trends in the hospital of Medellín city
Sara Melguizo Melguizo Production Engineering Department
Universidad EAFIT Medellín, Colombia
Juan Gregorio Arrieta Posada Production Engineering Department
Universidad EAFIT Medellín, Colombia [email protected]
Abstract
This paper presents the diagnosis of the state of implementation of processes and technologies for the supply chain management of hospitals in Medellín, in order to determine the level of competitiveness of hospitals in the city with respect to world class hospitals. First, a bibliographic search process was carried out to determine the most used logistics trends in hospitals in different countries. All this followed by an analysis of the literature review and, finally, an instrument was designed and applied to a representative sample of hospitals in Medellín, where four important subjects were evaluated: stock, information systems, optimization and continuous improvement.
This study found that the most used logistic tools in hospitals in Medellín are: lean manufacturing, standardization of processes, stock control, among others. However, in the analysis performed by quadrants, it is evident that there are opportunities for improvement in the methodology used by hospitals to develop their logistics activities, since 80% of the sample has a low positioning factor and therefore a globally uncompetitive logistic level.
Keywords Hospital logistics, Medellín, diagnosis
1. Introduction
In the hospital sector, the supply chain is an important factor in terms of efficiency and patient care, since it defines different fundamental methods to the development of the processes. Hospital logistics currently seeks to improve the patient's perception and attention times, reduce delays, improve flows and increase the processes effectiveness (Zona Logística, 2015).
The objective of the hospital sector in Colombia will be to formulate, adopt, direct, coordinate, execute, and evaluate public policies on health, public health, and social health promotion; as well as participate in the formulation of the policies on pensions, periodic economic benefits and professional risks, which will be developed through the institutions that comprise the administrative sector (República de Colombia, 2016). Aiming at this, the National Planning Department, by 2016, presents a budget corresponding to 11.4% of national expenditures in the regionalization of the investment budget (Departamento Nacional de Planeación, 2015). However, focusing on the quality of health care, managers have left this issue aside, specifically in making better use of resources (Colombia & Ministerio de la protección social, 2005). In order to improve these resources and increase the user experience, methodologies are implemented in different hospital departments, focusing on different areas such as inventories, storage, planning, continuous improvement philosophies, methods, times, and standardization.
© IEOM Society International 649

Proceedings of the International Conference on Industrial Engineering and Operations Management Bogota, Colombia, October 25-26, 2017
(1)
For all the aforementioned, there is a need study the logistics trends in the hospital sector worldwide, analyzing the variables that are taken into account for the management of processes and comparing the hospitals in Medellín with the world references.
2. Methodology
The research was completed in different stages: first, a literature review was carried out in order to determine the most used logistic tendencies in the world. Second, an evaluation instrument was designed to make a diagnosis in the city of Medellín, taking into account the important aspects verified in the literature review. Finally, the information was collected and analyzed.
2.1. Literature review
A bibliographic search process was carried out in order to build the literature review of global logistics trends, taking into account the meaning of hospital logistics and its flow of information, such as entries, processes and departures. 84 publications were consulted, among them, degree projects, journal articles and case studies, which allowed the construction of antecedents and references.
2.2. Design of the evaluation instrument
For the development of the survey, four important themes were defined from the literature review:
• Inventory: this section intends to evaluate how activities related to the control of stock, storage and their policies are carried out to comply with the activities established by the institution.
• Information systems: it seeks to know the level of implementation of information systems in the hospital, their real-time reliability and their treatment with different providers.
• Optimization: this section will allow to know the level of implementation of computational tools to improve the attention and quality of the services provided by the hospital.
• Continuous improvement methodologies: it is sought to know at what level the methodologies of continuous improvement are applied within the areas of the hospital, as well as the standardization of its processes and certifications with which the institution has.
Overall, there are 43 questions that some hospitals of Medellín had to answer to make a diagnosis of their supply chain management.
2.3. Definition of the sample
Initially, a classification was made of the hospitals that provide health services in Medellín (complexity two, three and four). These were obtained from the list of institutions providing health services of the Ministry of Health and Social Protection, with a total of 21 institutions.
Knowing the population, the sample was calculated for finite populations with (1), its formula is:
𝑛𝑛 = 𝑁𝑁𝑍𝑍𝛼𝛼2𝑝𝑝𝑝𝑝𝑑𝑑2(𝑁𝑁−1)+𝑍𝑍𝛼𝛼2𝑝𝑝𝑝𝑝
Where:
N= Total population Zα= Calculated for a given confidence level p= Expected proportion q= 1-p d= Precision level
The parameters used for this research are: N= 21
© IEOM Society International 650
Proceedings of the International Conference on Industrial Engineering and Operations Management Bogota, Colombia, October 25-26, 2017
Zα= 1,645 for a confidence level of 90% p= 2% q= 95% d= 6%
This calculation suggests that the sample has a size of 9 hospitals. A level of proportion of 2% is considered adequate because of the homogeneity in the characteristics of the population, because it is located in the same city and under the same health policies.
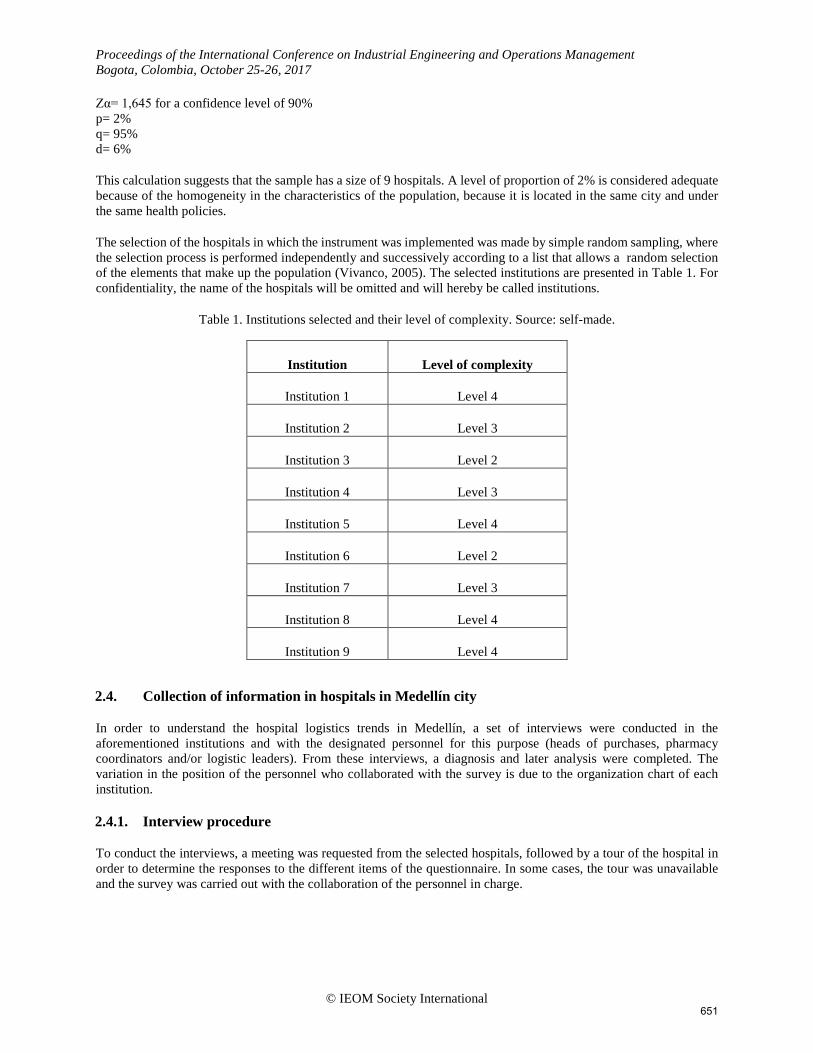
The selection of the hospitals in which the instrument was implemented was made by simple random sampling, where the selection process is performed independently and successively according to a list that allows a random selection of the elements that make up the population (Vivanco, 2005). The selected institutions are presented in Table 1. For confidentiality, the name of the hospitals will be omitted and will hereby be called institutions.
Table 1. Institutions selected and their level of complexity. Source: self-made.
Institution Level of complexity
Institution 1 Level 4
Institution 2 Level 3
Institution 3 Level 2
Institution 4 Level 3
Institution 5 Level 4
Institution 6 Level 2
Institution 7 Level 3
Institution 8 Level 4
Institution 9 Level 4
2.4. Collection of information in hospitals in Medellín city
In order to understand the hospital logistics trends in Medellín, a set of interviews were conducted in the aforementioned institutions and with the designated personnel for this purpose (heads of purchases, pharmacy coordinators and/or logistic leaders). From these interviews, a diagnosis and later analysis were completed. The variation in the position of the personnel who collaborated with the survey is due to the organization chart of each institution.
2.4.1. Interview procedure
To conduct the interviews, a meeting was requested from the selected hospitals, followed by a tour of the hospital in order to determine the responses to the different items of the questionnaire. In some cases, the tour was unavailable and the survey was carried out with the collaboration of the personnel in charge.
© IEOM Society International 651

Proceedings of the International Conference on Industrial Engineering and Operations Management Bogota, Colombia, October 25-26, 2017
2.5. Analysis of the information collected
In the qualification of the instrument the same weights are established for each one of the items, for which the rating is done in a percentage way and converted to a score of 1 to 5, where 5 means a high degree of implementation of the global logistics trends resulting in a high level of competitiveness at an international level. At this stage, a quadrants analysis was made to identify the degree of compliance of global trends in terms of the positioning factor.
3. Literature review
Corporate logistics include the planning, organization and control of all activities related to the obtaining, transfer and storage of materials and products, from acquisition to consumption, through the organization, and as an integrated system, including everything related to the information flows involved (Cuatrecasas Arbós, 2000). The supply chain is a set of functional activities (transport, stock control, etc.) that are repeated many times along the flow channel, through which the raw material becomes finished products and value for the consumer is added (Ballou, 2004). The components of a typical logistics system are customer services, demand forecasting, distribution communications, inventory control, material handling, order processing, parts and service support, factory location selection and storage (layout analysis), purchasing, packaging, handling of returned goods, removal of salvaged goods (rubbish) and waste, traffic and transportation, storage and provision (Oak book iL Council of Logistics Management, n.d.). It is important to emphasize that each industry shapes its supply chain according to its needs and implements various strategies in order to achieve its proposed objectives.
Not far from corporate logistics, the hospital supply chain shares many of its characteristics. The Canadian Logistics Association defines it as the process of planning, executing and controlling efficient, cost-effective flow and storage of raw materials, stock in process, finished products and related information from the point of origin to the point of consumption, in order to meet the needs of customers (Bernal & Latorre Castro, 2012). The main purpose of hospital logistics is to dispatch products in a given time, to meet the needs of those who provide the service (Callender, 2007). It is composed of an internal and an external chain, where it is suggested that hospitals should focus on both: the external supply chain to minimize costs, and the internal chain to maximize service levels (Pan & Pokharel, 2007).
Although the interest in hospital logistics research increases with time, the level of implementation of different logistic methodologies in hospitals is not very high. This can be evidenced by the number of case studies found in the literature review, only 6% of the publications found in this research refer to specific hospitals.
Figure 1 depicts the number of publications per country, showing that the United States and the United Kingdom have made more publications on these subjects. However, it was found that other countries have only one publication, therefore, they are not presented in the graph.
© IEOM Society International 652

Proceedings of the International Conference on Industrial Engineering and Operations Management Bogota, Colombia, October 25-26, 2017
Figure 1. Number of publications per country from 1995 to 2015, Source: Self-made.
Table 2 shows some of the methodologies with which the hospital sector has sought to optimize its supply chain from 1995 to 2015. These include lean manufacturing and mathematical modeling with 17 publications followed by process standardization with nine and Process outsourcing and Just in Time with eight publications.
Table 2. Trends in hospital logistics found in the study. Source: self-made.
Used trend Number of publications (1995-2015)
Mathematical modeling 17 Lean manufacturing 17
Process standardization 9 Outsourcing 8
JIT (Just in time) 8 RFID (Radio frequency identification) 7
2bin system 6 AGV (Automatic Guided Vehicle) 5
ERP (Enterprise Resource Planning) 5 Automation of supply 5
Simulation 5 Six sigma 5
EDI (Electronic Data Interchange) 5 Benchmarking 4
Integrated information system 4 Centralization of supply 4
VMI (vendor managed inventory) 4 Kaizen 3
0
5
10
15
20
25
30
Uni
ted
stat
esU
nite
d K
ingd
omSp
ain
Italy
Col
ombi
aC
anad
aFr
ance
Net
herla
nds
Swen
den
Chi
naB
razi
lG
erm
any
Sing
apor
eC
hile
Bel
gium
Den
mar
kPo
rtuga
lSw
itzer
land
Leba
non
Mex
ico
Taiw
anJa
pan
Aus
tria
Pola
ndIn
dia
Publ
icat
ions
Country
© IEOM Society International 653

Proceedings of the International Conference on Industrial Engineering and Operations Management Bogota, Colombia, October 25-26, 2017
Used trend Number of publications (1995-2015)
Barcode 3 Forecast 2
TOC (Theory of constraints) 2 5S 2
Internet of things 2 Kanban 2
Computer tools 1 EMRs (Electronic medical records) 1
RFCD (Radio frequency data capture) 1 Innovation 1 Stockless 1
Built-in-quality 1 Cross-docking 1 stock control 1
Consolidated transportation rutes 1 Cooperation between hospitals 1
SPD (Supply, Processing and Distribution) 1 VSM (Value stream mapping) 1
ABM (Activity based management) 1 Modular storage 1
Mobile platforms (Automation) 1 CPI (Continuous process improvement) 1
Enviromental legislation 1 Interchangeable cars 1
LMIS (Logistic management and information system) 1
Carousel 1 Capacity increase 1 Strategic alliances 1
SRC (Continuous replenishment system) 1 Capacity maturity model 1
Technology 1 stock models 1
Hospital accreditation 1 Multi-criteria analysis 1
PDA (Personal digital assistant) 1 Layout 1
© IEOM Society International 654

Proceedings of the International Conference on Industrial Engineering and Operations Management Bogota, Colombia, October 25-26, 2017
After knowing the most common trends, a categorization was made by the same subgroups named in the methodology, in order to determine the area of application of the tendencies.
4. Results
The positioning factor of the institutions allows to determine percentage of the degree of implementation of the global logistics trends in Medellín. It is considered that a score higher than 3.5 and a positioning factor higher than 70% are sufficient to determine if institutions satisfactorily comply with the implementation of logistics trends. Table 3 presents a summary of the positioning factor, the score in each of the categories and the overall rating. The positioning factor was found by converting the overall score to percentage.
Table 3. Summary of the global positioning factor and qualification of institutions. Source: Self-made.
Institution Complexity FP Inventory Information system Optimization Continuous improvement
Overall score
1 4 74,60% 3,18 4,14 4,00 4,08 3,73
2 3 60,40% 2,29 3,00 3,43 3,77 3,02
3 2 62,20% 2,65 2,29 2,86 4,31 3,11
4 3 54,00% 2,53 2,00 3,57 2,85 2,7
5 4 66,00% 2,76 2,71 3,14 4,38 3,3
6 2 63,20% 2,71 2,43 3,86 3,77 3,16
7 3 65,40% 2,88 3,00 3,14 4,00 3,27
8 4 64,00% 2,65 2,86 3,14 4,15 3,2
9 4 63,20% 3,12 3,00 3,00 3,38 3,16
In addition, a subgroup scatter chart was used to classify the institutions into different quadrants according to their rating and positioning factor:
• Quadrant I: Scatter chart area where institutions with a score higher than 3.5 and a positioning factor greater than 70% are located. Being positioned in this quadrant determines that the institution meets a satisfactory level of implementation of worldwide logistic trends.
• Quadrant II: Scatter plot area where institutions with a score lower than 3.5 and positioning factor greater than 70% are located. The institutions that are in this quadrant require some improvement implementations regarding the implementation of global logistics trends.
• Quadrant III: Scatter chart area where institutions with a score lower than 3.5 and a positioning factor lower than 70% are located. Being positioned in this quadrant determines that the institution has a low degree of compliance with the implementation of worldwide logistics trends.
• Quadrant IV: Scatter plot area where institutions with a score higher than 3.5 and a positioning factor lower than 70% are located. The institutions that are in this quadrant require some improvement implementations regarding the implementation of global logistics trends.
Figure 2 shows the quadrants according to the previously established numbering.
© IEOM Society International 655

Proceedings of the International Conference on Industrial Engineering and Operations Management Bogota, Colombia, October 25-26, 2017
Figure 2. Scatter plot per quadrants. Source: Self-made.
4.1. Inventory
Figure 3 shows the scatter plot by quadrants for this subgroup. It can be evidenced that one of the hospitals of complexity 4 is in the second quadrant, meaning that this institution could implement some improvements to rise its score. On the other side, the other institutions are located in the third quadrant, this allows to conclude that in the subgroup of inventories they comply with low level of implementation of global logistics trends.
Figure 3. Scatter plot subgroups inventories according to qualification and positioning factor. Source: self-made.
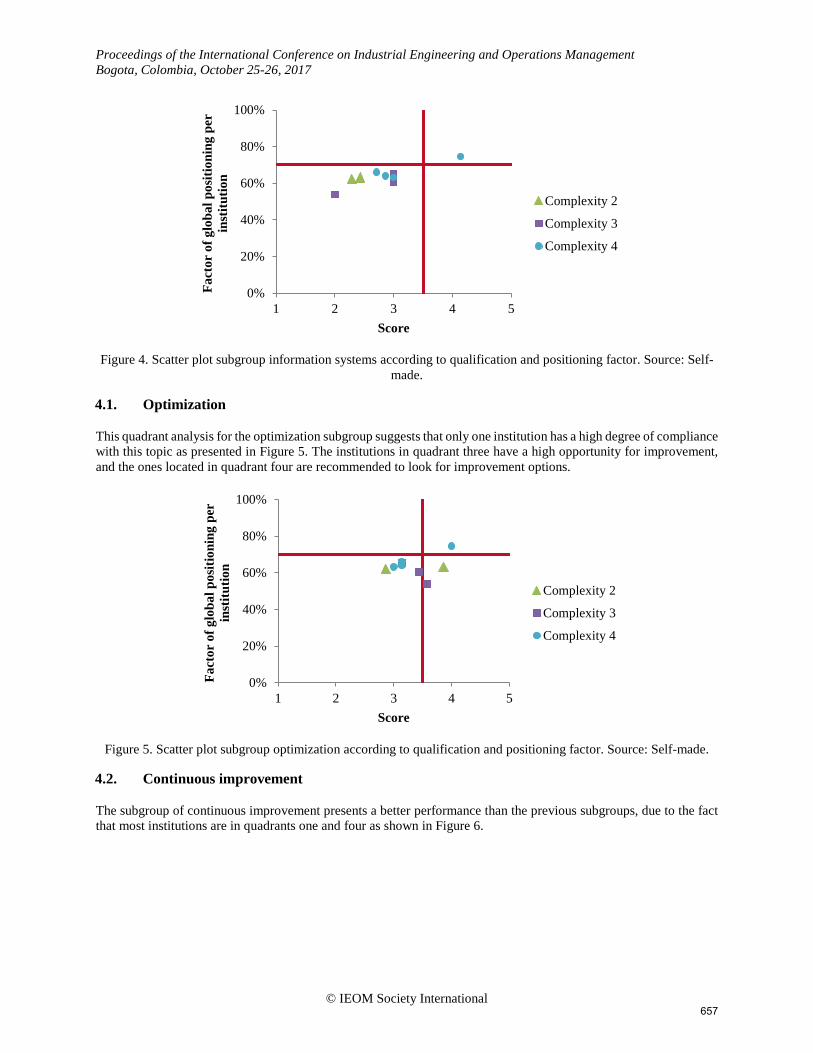
4.2. Information systems
The scatter plot for this subgroup is presented in Figure 4, where it is observed that only one institution presents a satisfactory implementation of logistic tendencies in information systems, while the other institutions have a greater opportunity for improvement.
0%
20%
40%
60%
80%
100%
1 2 3 4 5
Fact
or o
f glo
bal p
ositi
onin
g pe
r in
stitu
tion
Score
Complexity 2
Complexity 3
Complexity 4
© IEOM Society International 656
Proceedings of the International Conference on Industrial Engineering and Operations Management Bogota, Colombia, October 25-26, 2017
Figure 4. Scatter plot subgroup information systems according to qualification and positioning factor. Source: Self-
made.
4.1. Optimization
This quadrant analysis for the optimization subgroup suggests that only one institution has a high degree of compliance with this topic as presented in Figure 5. The institutions in quadrant three have a high opportunity for improvement, and the ones located in quadrant four are recommended to look for improvement options.
Figure 5. Scatter plot subgroup optimization according to qualification and positioning factor. Source: Self-made.
4.2. Continuous improvement
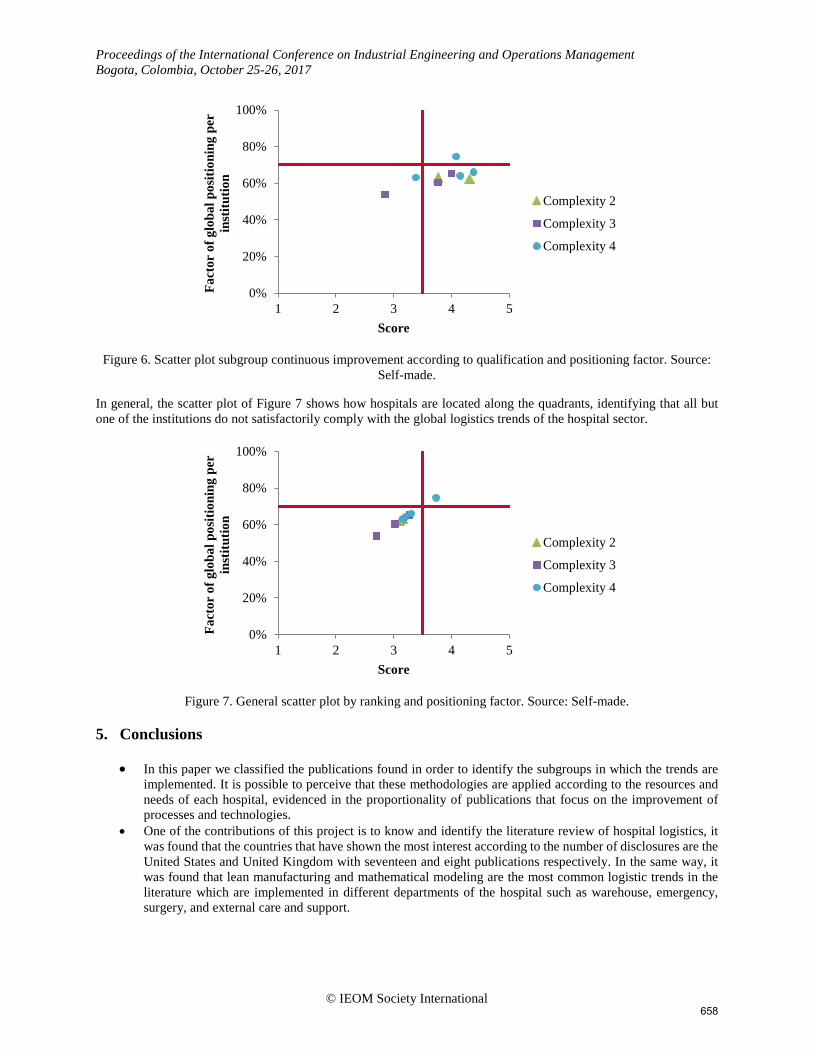
The subgroup of continuous improvement presents a better performance than the previous subgroups, due to the fact that most institutions are in quadrants one and four as shown in Figure 6.
0%
20%
40%
60%
80%
100%
1 2 3 4 5
Fact
or o
f glo
bal p
ositi
onin
g pe
r in
stitu
tion
Score
Complexity 2
Complexity 3
Complexity 4
0%
20%
40%
60%
80%
100%
1 2 3 4 5
Fact
or o
f glo
bal p
ositi
onin
g pe
r in
stitu
tion
Score
Complexity 2
Complexity 3
Complexity 4
© IEOM Society International 657
Proceedings of the International Conference on Industrial Engineering and Operations Management Bogota, Colombia, October 25-26, 2017
Figure 6. Scatter plot subgroup continuous improvement according to qualification and positioning factor. Source:
Self-made.
In general, the scatter plot of Figure 7 shows how hospitals are located along the quadrants, identifying that all but one of the institutions do not satisfactorily comply with the global logistics trends of the hospital sector.
Figure 7. General scatter plot by ranking and positioning factor. Source: Self-made.
5. Conclusions
• In this paper we classified the publications found in order to identify the subgroups in which the trends are implemented. It is possible to perceive that these methodologies are applied according to the resources and needs of each hospital, evidenced in the proportionality of publications that focus on the improvement of processes and technologies.
• One of the contributions of this project is to know and identify the literature review of hospital logistics, it was found that the countries that have shown the most interest according to the number of disclosures are the United States and United Kingdom with seventeen and eight publications respectively. In the same way, it was found that lean manufacturing and mathematical modeling are the most common logistic trends in the literature which are implemented in different departments of the hospital such as warehouse, emergency, surgery, and external care and support.
0%
20%
40%
60%
80%
100%
1 2 3 4 5
Fact
or o
f glo
bal p
ositi
onin
g pe
r in
stitu
tion
Score
Complexity 2
Complexity 3
Complexity 4
0%
20%
40%
60%
80%
100%
1 2 3 4 5
Fact
or o
f glo
bal p
ositi
onin
g pe
r in
stitu
tion
Score
Complexity 2
Complexity 3
Complexity 4
© IEOM Society International 658

Proceedings of the International Conference on Industrial Engineering and Operations Management Bogota, Colombia, October 25-26, 2017
• According to the results obtained in the analysis by quadrants, it is concluded that hospitals in Medellín still have to improve in many aspects to be competitive worldwide, since all the institutions of the sample -except for a complexity 4 hospital- are found located in the third quadrant.
• The continuous improvement subgroup is the one that presents a better rating, this can be due to the ISO 9001 quality accreditation system, which requires within its standards to have a continuous improvement system to be followed up.
• The optimization subgroup presents satisfactory scores, however, they fail to meet the international positioning factor. This can be due to the lack of resources for the implementation of technologies that support the optimization of processes.
• The subgroup of information systems and inventories are the ones that present greater opportunities for improvement. Despite finding some publications that deal with this issue, they have not been implemented in hospitals in Medellín.
• After the analysis of the results of the survey by quadrants, it was found that the IPS with level of complexity 4 are those that have a higher average positioning factor (66.95%). However, this value places these institutions in quadrants III and IV, demonstrating that they do not comply with the implementation of global logistics trends in general.
6. Future projects
It is expected that the analysis of the results of this research will be expanded by analyzing the behavior of data with a box and whisker plot, in addition to an analysis of the categorization of hospitals and finally an analysis by institution including recommendations to each one of them.
References Ballou, R. H. (2004). Logística: administración de la cadena de suministro. México: Pearson Educación. Bernal, Ó., & Latorre Castro, M. L. (Eds.). (2012). Logística hospitalaria: Lecciones y retos para Colombia. In La
salud en Colombia: logros, retos y recomendaciones (Primera edición, p. 309). Bogotá, D.C., Colombia: Universidad de los Andes.
Callender, C. (2007). Barriers and best practices for material management in the health care sector. Missouri university of science and technology.
Colombia, & Ministerio de la protección social. (2005). Política nacional de prestación de servicios de salud. Bogotá: Ministerio de la protección social.
Cuatrecasas Arbós, L. (2000). Logística gestión de la cadena de suministros. Ediciones Díaz de Santos. Retrieved from http://public.eblib.com/choice/publicfullrecord.aspx?p=3229529
Departamento Nacional de Planeación. (2015, August). Regionalización presupuesto de inversión vigencia 2016. Retrieved from https://colaboracion.dnp.gov.co/CDT/Inversiones%20y%20finanzas%20pblicas/(2)DtoRegPC2016-POAI%20Anexo%20Ajustado%20Def.pdf
Oak book iL Council of Logistics Management. (n.d.). Careers In Logistics. Retrieved from http://academic.rcc.edu/logisticsmanagement/PDF/Careers%20In%20Logistics%20by%20CSCMP.pdf
Pan, Z. X. (Thomas), & Pokharel, S. (2007). Logistics in hospitals: a case study of some Singapore hospitals. Leadership in Health Services, 20(3), 195–207. https://doi.org/10.1108/17511870710764041
República de Colombia. (2016, February). República de Colombia, Ministerio de salud y protección social. [gubernamental]. Retrieved from https://www.minsalud.gov.co/Ministerio/DSector/Paginas/proyectos-inversion.aspx
Vivanco, M. (2005). Muestreo Estadístico. Diseño Y Aplicaciones. Chile: Editorial Universitaria. Zona Logística. (2015, March). La salud en Colombia, una mirada logística, 83, 28–33.
Biography
Sara Melguizo Melguizo EAFIT University Master of Engineering degree student, with emphasis in operations and logistics management. Production Engineer graduated from EAFIT University. Interested in Hospital Logistics, Process Improvement and Management supply chain.
© IEOM Society International 659

Proceedings of the International Conference on Industrial Engineering and Operations Management Bogota, Colombia, October 25-26, 2017
Juan Gregorio Arrieta Posada Professor, Department of Production Engineering, EAFIT University, and member of the research group in Production and Logistics Management, with approximately 20 years of teaching experience. Production Engineer graduated from EAFIT University, Specialist in operations management, University of Ibagué and Catholic University of Louvain, and Master in Engineering of the ITESM Monterrey Institute of Technology and Higher Studies, where he was honored with excellence. Interested in the improvement of production processes, storage, supply chain management and production planning.
© IEOM Society International 660